


Languages
Pages
Legal


IER Universität Stuttgart
Institut für Energiewirtschaft und Rationelle Energieanwendung
Estimating Health Risks
caused by Emissions of
Air Pollutants from
Coal Fired Power Plants
in Europe -
Documentation of
Methods and Results
Philipp PREISS
Joachim ROOS
Prof. Rainer FRIEDRICH
.
.
.
.
.
.
.
.
.
.
.
.
.
.
.
.
.
.
.
.
.
.
.
.
.
.
.
.
.
.
.
.
.
.
.
.
.
.
.
.
.
.
.
.

1
Stuttgart, April 17th, 2013,
Authors: Philipp PREISS, Joachim ROOS, Rainer FRIEDRICH
Institute for Energy Economics and the Rational Use of Energy (IER)
Department for Technology Assessment and Environment (TFU)
Universität Stuttgart.
Hessbruehlstr. 49a
70565 Stuttgart, Germany
http://www.ier.uni-stuttgart.de

2
Table of Content Abstract .................................................................................................................................................. 3
1 Methodology .................................................................................................................................. 4
2 Example of the spatial distribution of potential health impacts ..................................................... 9
3 Results .......................................................................................................................................... 12
3.1 Results based on EcoSenseWeb for selected sites ............................................................... 12
3.2 Results for the major public coal fired power plants in Europe - based on the simplified
approach .......................................................................................................................................... 40
3.3 Results – Summarized for Europe ......................................................................................... 61
4 Summary and Conclusions ........................................................................................................... 63
5 References .................................................................................................................................... 64

3
Abstract
In this report, methods and results of estimating the most important health risks caused by emissions
of air pollutants from coal fired power plants in Europe are described. Based on data about emissions
of air pollutants from coal fired power plants provided by GREENPEACE (Myllyvirta 2013), the
resulting health risks are estimated. The air pollutants causing by far the highest health risks and thus
considered in this analysis are fine dust (PM10, PM2.5) and the gaseous pollutants SO2, NOx, and
NMVOC. The latter species SO2, NOx and NMVOC are transformed in the atmosphere into secondary
inorganic aerosols and ozone. The method used to estimate the health risks, i.e. the impact pathway
approach, has been developed by IER in cooperation with other European partners during a series of
projects (the ExternE projects) funded by the European Union (European Commission 2005),
(Friedrich and Preiss 2012), see also www.ExternE.info. This method is widely applied by the
European Commission for carrying out integrated assessments for supporting environmental
legislation and for transport project appraisal.
For each of the chosen coal fired power plants, which encompass as well plants in operation as in
planning or under construction, the reduction in life expectancy caused by the annual emissions of
the above mentioned pollutants is calculated and expressed as ‘years of life lost (YOLL)’ in the
European population. Secondly the ‘working days lost’ due to morbidity caused by these emissions
are estimated.

4
1 Methodology
The aim of this analysis is to estimate important health risks caused by the direct emissions of coal
fired power plants in Europe. The environmental stressor causing the highest burden of disease, i.e.
impact to human health in Europe is clearly fine particulate matter (HEIMTSA 2007-2011); (Hänninen,
Knol, 2011); (Friedrich et al. 2011). If we then only consider outdoor air pollution, then the second
largest health impact comes from ozone (HEIMTSA 2007-2011), however the burden of disease from
ozone is about 50 times smaller than that of fine particles.
Thus, in this study, we concentrate the analysis on emissions of
primary fine particles, distinguishing between primary particulate matter with a
diameter < 2.5µm (PM2.5) and primary particulate matter with a diameter <10 µm (PM10),
where PM2.5 is a part of PM10,
and on the emissions of precursors, that are converted in the atmosphere to secondary fine
particles and ozone. For coal fired plants, the following precursors are relevant:
Nitrogen dioxides - NOx
Sulfur dioxide - SO2.
For coal fired plants, the emissions of precursors are more important for health effects than
emissions of primary particles. The coal fired power plants in Europe (EU-27) in operation considered
for this study emitted 3% of PM10 emissions, 2% of PM2.5 emissions, 11% of NOx emissions and 38%
of the SO2 emissions in Europe (EU-27) in 2010 (emissions of power plants taken from (Myllyvirta
2013), overall emissions from (EEA 2012)).
Annual emissions of the analysed power plants have been provided by GREENPEACE (Myllyvirta
2013). For 311 plants in operation, reported data corresponding to the year 2010 have been derived
by GREENPEACE from the “European Pollutant Release and Transfer Register” (E-PRTR) database of
the European Environmental Agency (http://prtr.ec.europa.eu). Moreover, GREENPEACE estimated
emission data for 111 sites in Europe where power plants are under construction, approved, applying
for approval or were connected to grid 2012 or later. The reported emissions for these plants occur
after starting operation, i.e. in future years.
To calculate the health risks stemming from these emissions, the ‘impact pathway approach’ (Figure
1) was used, which was developed in a series of research projects funded by the European
Commission, the ‘ExternE project series (see www.ExternE.info).

5
Figure 1: The impact pathway approach
Starting with the emissions of the power plant, the transport and the chemical transformation of the
pollutants in the atmosphere are calculated using a set of atmospheric models. For the local
modelling the ISC (Industrial Source Complex) dispersion model of the US Environmental Protection
Agency is used together with a pre-processor for providing meteorological data for the site (Douros,
Tsegas and Naneris 2007). For the regional modelling, a parametrized version of a European-wide
Eulerian model, the (Unified EMEP Model 2003) is applied. For the calculation of the chemical
transformation of the gaseous substances into fine particles and ozone the concentration of all
reagents of the chemical process has to be known, so all emissions of all sources, not only those of
the analysed power plant, are needed as input. In fact, the calculation is made twice, first without
and then with the emissions of the analysed power plant and the difference in the average annual
concentration of fine particles and ozone is then used to estimate the additional health effect caused
by the power plant.
This is done using concentration-response functions (CRFs) in Table 1 that relate changes in the
annual average concentration of PM10, PM2.5 or ozone to changes in health risks. These
relationships are derived from analysing the results of epidemiological studies. Most morbidity risks
occur shortly after inhalation. However, for chronic diseases, especially reduction of life expectancy
and the occurrence of chronic bronchitis, this is different. After an exposure to fine particles for
many years, a few of the exposed persons start to develop respiratory diseases and subsequently
cardiovascular diseases that get chronic and - at the end of the life of the exposed person - lead to a
premature death. Thus it is the life-long exposure to fine particles from many sources that at the end
causes the reduction in life time.

6
Table 1: Overview of the concnetration-response-functions (CRF) for particulate matter (PM) and ozone
based on (Torfs et al. 2007)
Pollutant and corresponding endpoint Health risk per person
per µg per m³ and year
[x/(µg/(m³ *a)]
Unit
Particulate Matter < 2.5µm, i.e. PM2.5
Life expectancy reduction – years of life lost 6.51*10-04 years
net restricted activity days (NetRAD) 9.59*10-03 days
Work loss days (WLD) 1.39*10-02 days
Minor restricted activity days (MRAD) 3.69*10-02 days
Particulate Matter < 10 µm, i.e. PM10
Increased mortality risk (infants) 6.84*10-08 cases
New cases of chronic bronchitis 1.86*10-05 cases
Respiratory hospital admissions (RHA) 7.03*10-06 cases
Cardiac hospital admissions (CHA) 4.34*10-06 cases
Medication use / bronchodilator use (child) 4.03*10-04 cases
Medication use / bronchodilator use (adult) 3.27*10-03 cases
Lower respiratory symptoms (adult) 3.24*10-02 days
Lower respiratory symptoms (child) 2.08*10-02 days
Average daily SOMO35: Indicator for ozone
Life expectancy reduction - years of life lost 2.23*10-06 years
Respiratory hospital admissions (RHA) 1.98*10-06 cases
Minor restricted activity days (MRAD) 7.36*10-03 days
Medication use / bronchodilator use 2.62*10-03 cases
Lower resp. symptoms (LRS) excluding cough 1.79*10-03 days
Cough days 1.04*10-02 days
Whereas:
CRF: concentration-response function
YOLL: years of life lost
RAD: Restricted activity days
NetRAD: To avoid double counting, RAD is corrected according to (Torfs et al. 2007). “Since Work Loss
Days (WLD), Minor Restricted Activity Days (MRAD and days in hospital because of cardiac hospital
admissions CHA and Respiratory Hospital Admissions (RHA) are also RADs the net RADs are calculated
as:
NetRAD (per μg/m³ PM2.5) = RAD – WLD – MRAD – (RHA and CHA due to PM10) * 10 days”
WLD: Work loss days

7
MRAD: Minor restricted activity days
LRS: lower respiratory symptoms
Average daily SOMO35: for each day of the year, the maximum ozone concentration during any 8h-
period of the day is determined. If this maximum exceeds 35 ppb (parts per billion), then the
difference between the concentration and 35 ppb is determined. For each day with an exceedance
these differences are added. The result is the indicator for ozone exposure SOMO35 (sum of means
over 35 ppb). Dividing this value by 365 gives the average daily SOMO35 value.
------------------------------------
(Torfs et al. 2007) provide the recommended state of the art set of concentration-response-functions
regarding ambient air pollution of the air pollutants particulate matter and ozone in Europe (i.e. in
the EU-27), that is used here. A detailed literature review, and the associated recommendations for
CRFs and for background rates is also reported in (European Commission - CAFE 2005).
The toxicity of different kinds of particles may vary per unit mass PM2.5 taken in (due to difference in
shape, composition, etc.). However, the World Health Organisation states that based on current
evidence, it is not possible to quantify reliably this difference, e.g. between secondary inorganic
aerosols (sulfates and nitrates) and primary particulate matter (black carbon or ash). Hence, the only
distinction made here is between very fine particulate PM2.5 and PMcoarse (i.e. the fraction
particles with a size between 2.5µm and 10µm aerodynamic diameter), as there is proof, that the
finer particles (<2.5) are the main cause of chronic mortality. However, if at some time in the future
evidence emerges that the toxicity of secondary particles is different from those of primary particles,
this would change the results of this analysis.
The CRFs are based on epidemiological studies, i.e. on studies finding a statistically significant
relation between concentrations of pollutants and health effects. Most important is chronic mortality
from particulates. This is derived from the so called In the “ACS study” (Pope et al. 2002). Here PM10
was measured in different metropolitan areas across the US, with varying PM10 concentrations and
composition, and a sound linear correlation with life expectancy was found. According to the
hypothesis, that PM2.5 (and not the coarser part of PM10) is responsible for the health damage, the
concentration-response function for PM10 is converted into a function for PM2.5. The resulting
concentration-response function “chronic mortality life expectancy reduction” due to PM2.5 applied
to the age group of people 30 years and above results in 651 (95% confidence interval 127 – 1194)
YOLL per 10 μg/m³ per 100,000 people (Torfs et al. 2007).
An uncertainty estimation that includes all parts of the impact pathway (Spadaro and Rabl 2007);
(Spadaro and Rabl 2008) came to the conclusion, that the geometric deviation of damage estimates
per emitted kg (62.5 Cl) is approximately σ ≈ 3, i.e. the 62.5% interval lies between three times and
one third of the reported value.
The actual application of the impact pathway approach is carried out using a web-based computer
tool called ECOSENSE (www.ExternE.info). This tool exists in two versions. The more complex version
‘EcoSenseWeb’ takes the concrete location of the power plant into account when applying the local
atmospheric model. However, this version needs a certain amount of effort for preparation and
computer time for running the model. Thus, to limit the effort, this model was not used for all power
plants, but only for 80 plants, mostly newly planned plants chosen by GREENPEACE. For the other
344 power plants, a simplified version of the model called ECOSENSELE (www.ExternE.info) is used.

8
This model only distinguishes between the region, where the power plant is located, but not the
exact site. The difference between the estimations of the simplified and the complex model lies in
most cases below 10%, which is small compared to the uncertainties mentioned above. Only for sites
located directly at the coast, the difference might be larger.

9
2 Example of the spatial distribution of potential health impacts
In Table 2, detailed results for a power plant in the approval process located in Datteln, Germany
(reference number “GPDE0010” in Chapter 3.1) are shown.
Table 2: Detailed results of the calculation of morbidity and mortality for the power plant in construction
located in Datteln, Germany (“GPDE0010”)
Pollutant and corresponding endpoint Unit
health risks caused by particulate matter (PM2.5 and PM10)
Life expectancy reduction – years of life lost (chronic) 895 years/a
net restricted activity days 13 185 days/a
Work loss days 19 136 days/a
Increased mortality risk (infants) 0.1 cases/a
New cases of chronic bronchitis 28 cases/a
Cardiac hospital admissions 7 cases/a
Lower respiratory symptoms 82 150 days/a
health risks caused by ozone Life expectancy reduction -1.8 years/a
Lower respiratory symptoms, excluding cough -1 429 days/a
Cough days -8 307 days/a
health risks caused by particulate matter and ozone Respiratory hospital admissions 9 cases/a
Minor restricted activity days 44 931 days/a
Medication use / bronchodilator use 3 547 cases/a
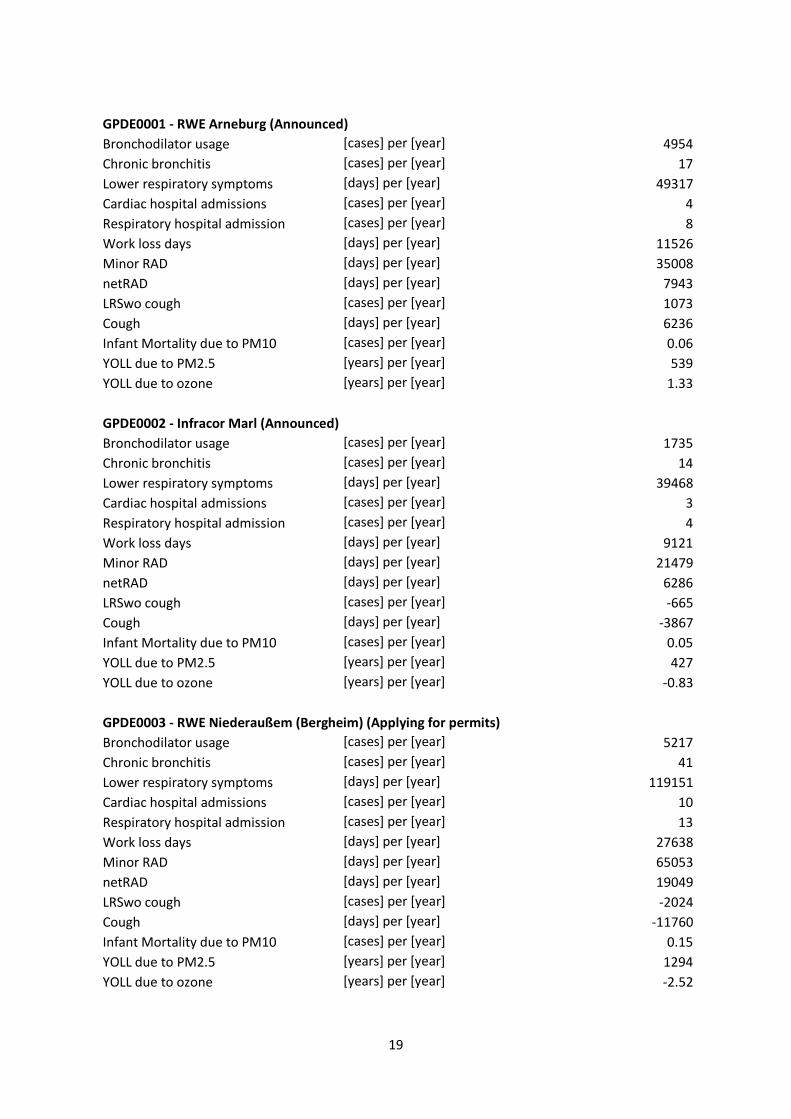
The health risks caused by ozone are negative; this indicates a (small) reduction of health risks. As
emitted NO (nitrogen monoxide) reduces ozone (O3) to oxygen (O2), the ozone concentration – and
thus the health impacts caused by ozone - near the power plant are decreasing, although farer away
from the power plant an increase of ozone concentration might occur. It depends on the population
distribution and the background concentrations of pollutants, whether the positive or the negative
effect dominates. However, NO emissions have a much larger negative health impact due to the
formation of secondary aerosols, thus overall the negative impacts of NO emissions prevail.
Figure 2 shows the cumulative fraction of total YOLL as a function of the radius around the source of
emissions. As can be seen, only a relatively small share of the total YOLL occurs close to the power
plant. 80 % of the YOLL occur within a distance of ca. 700 km. There are two reasons for the spatial
distribution of impacts. The first reason is that most of the YOLL are caused by secondary aerosols.
The formation of these secondary aerosols takes place in the atmosphere; the chemical reactions
need ammonia as a reaction partner and they take some time. The pollutants are meanwhile
transported with the wind away from the site. Secondly, the high stacks of the power plant causes
the pollutants to reach the ground only some kilometers away from the site of the plant. So the
highest health risks do occur in a distance between ca. 50 and 150 km away from the power plant
site and not directly around the plant. The highest individual risk to lose a life year at the end of the

10
life amounts is around 2*10-5 YOLL/a or 10.5 minutes of life time per year of exposure. This is an
average figure, i.e. it means, that a very small part of the population experiences a considerable loss
of life time, e.g. of several years, whereas the vast majority of the exposed persons does not show
any effect.
Figure 2: Cumulative fraction of the total mortality risk, which occurs within a circle around the plant site
caused by the power plant GPDE0010 (Datteln) depending on the radius of the circle, i.e. within a circle with
x km radius around the plant y % of the health risks are occurring.

11
Figure 3 shows the spatially distribution of the estimated mortality. The years of life lost per grid cell
(ca. 50 km * 50 km) are shown. The outer circle indicates the 700 km range. The high values in grid
cells further away from the source indicate areas with a high population density such as the London
or Paris region. Hence, although the concentration increment is lower in areas further away from the
source, the product of the concentration increment times the number of people exposed can be
relatively high.
The health risks caused by the power plant on a certain location are so small, that they cannot be
observed or measured; the statistical variance of health impacts on any location is much higher than
the additional health risks. However, epidemiological studies show, that an increase in PM2.5
concentrations cause an increase in life years lost, and that this relationship is linear. Thus this
relationship can be used to estimate the health risks even caused by small increases in the
concentration of fine dust. The overall health impacts of fine particles can be measured, and it is
legitimate to allocate these risks to the sources according to their share on the exposure of the
population, as the concentration-response relationship is linear.
Figure 3: Spatial distribution of health risks (years of life lost) per grid cell of 50*50 km2

12
3 Results In the following the results of health risk estimation for the different power plants are presented.
In Chapter 3.1 the results for the 80 power plants are shown which were calculated with
EcoSenseWeb (http://ecosenseweb.ier.uni-stuttgart.de/). Following the name of the power plant or
the location there is an indication whether the status of the location is either
in operation or
not in operation, but e.g. in planning phase, applying for permission, announced to be build
In Chapter 3.2 the results of using the simplified approach are shown. Annual emissions of the
analysed power plants have been provided by GREENPEACE (Myllyvirta 2013). For 311 plants in
operation, reported data corresponding to the year 2010 has been derived by GREENPEACE from the
“European Pollutant Release and Transfer Register” (E-PRTR) database of the European
Environmental Agency (http://prtr.ec.europa.eu). Moreover, GREENPEACE estimated emission data
for 111 sites in Europe where power plants are under construction, approved or applying for
approval. The emission data corresponds to the assumed year of starting operation, i.e. 2012 and
later.
The estimation of mortality (years of life lost -YOLL), based on damage factors per unit of emission of
classical pollutants are shown. The impacts are expressed as years of life lost. The estimation is based
on country average damage factors for the classical air pollutants.
Finally, in Chapter 3.3 the mortality impacts and the WLD for the assessed power plants are summed
up for each country. The results are separated into coal fired power plants in operation and in the
once in planning and construction phase.
3.1 Results based on EcoSenseWeb for selected sites
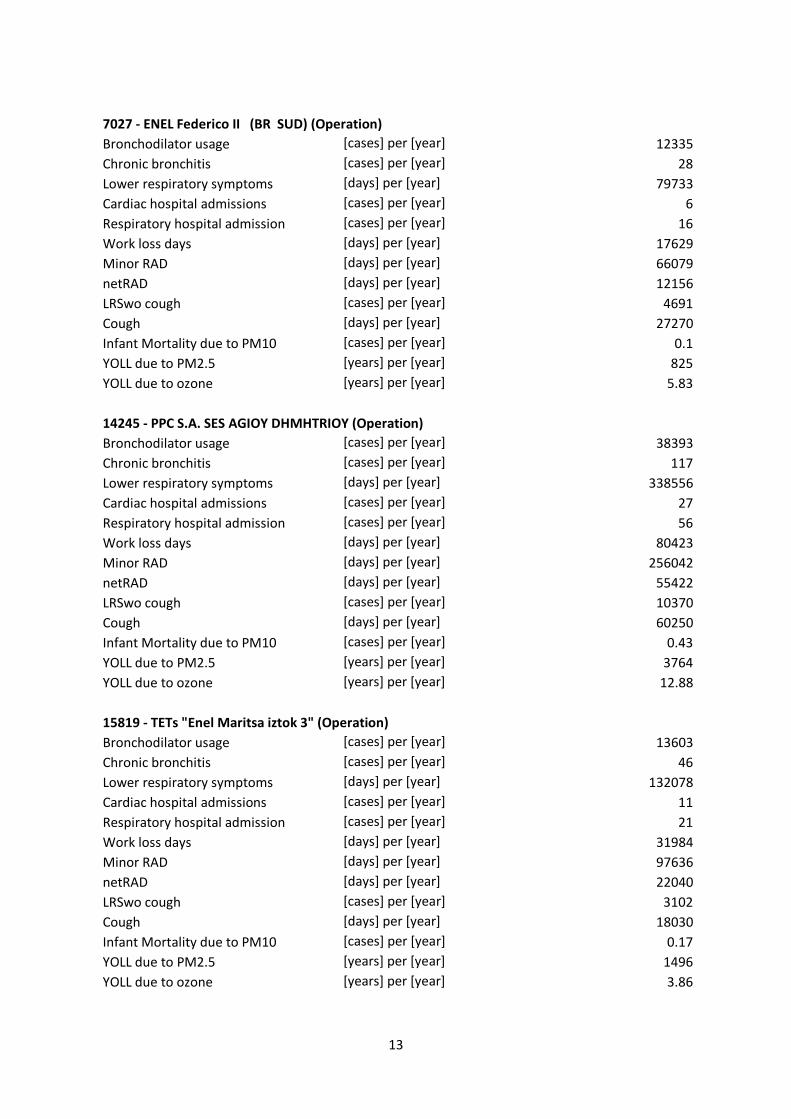
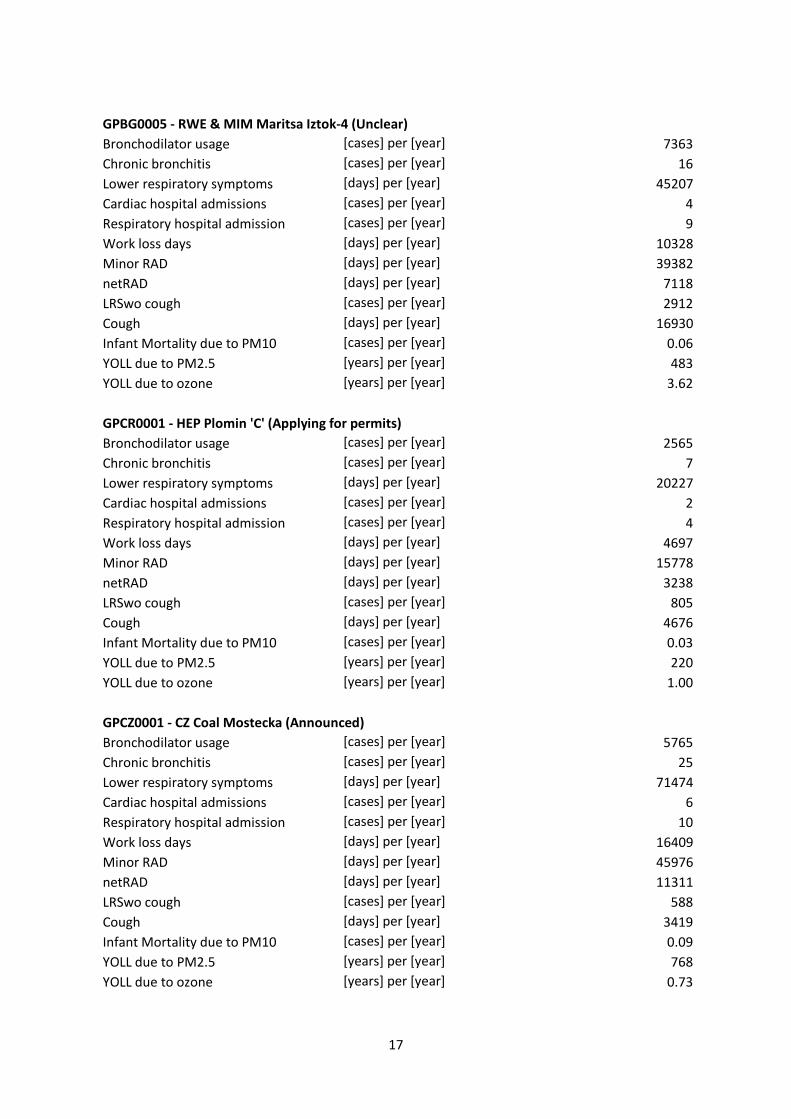
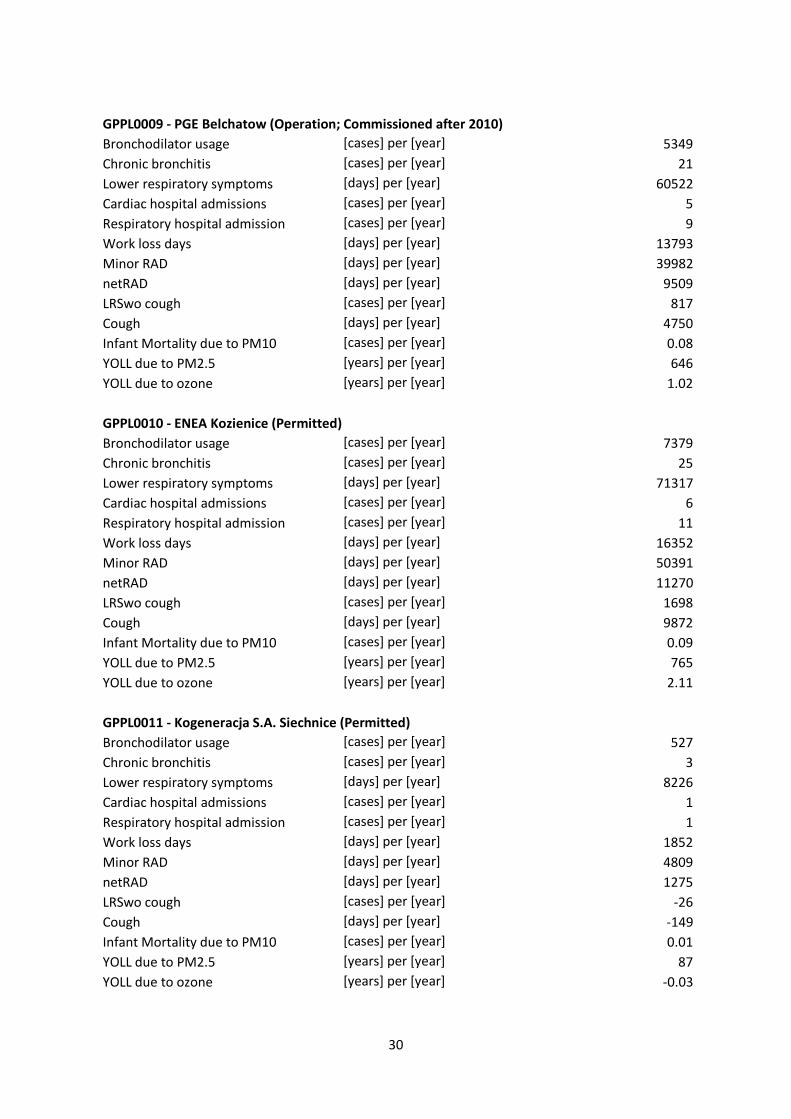
In the following for each of the power plants that have been selected by GREENPEACE for the more
detailed analysis with EcoSenseWeb, the resulting health risks are presented. The occurrence of
negative values for health risks caused by ozone for some of the plants is explained in Chapter 2.
1298 - PGE Bełchatów (Operation) Bronchodilator usage [cases] per [year] 78117
Chronic bronchitis [cases] per [year] 336
Lower respiratory symptoms [days] per [year] 970082
Cardiac hospital admissions [cases] per [year] 79
Respiratory hospital admission [cases] per [year] 136
Work loss days [days] per [year] 227901
Minor RAD [days] per [year] 637566
netRAD [days] per [year] 157068
LRSwo cough [cases] per [year] 7889
Cough [days] per [year] 45860
Infant Mortality due to PM10 [cases] per [year] 1.24
YOLL due to PM2.5 [years] per [year] 10670
YOLL due to ozone [years] per [year] 9.81
13
7027 - ENEL Federico II (BR SUD) (Operation) Bronchodilator usage [cases] per [year] 12335
Chronic bronchitis [cases] per [year] 28
Lower respiratory symptoms [days] per [year] 79733
Cardiac hospital admissions [cases] per [year] 6
Respiratory hospital admission [cases] per [year] 16
Work loss days [days] per [year] 17629
Minor RAD [days] per [year] 66079
netRAD [days] per [year] 12156
LRSwo cough [cases] per [year] 4691
Cough [days] per [year] 27270
Infant Mortality due to PM10 [cases] per [year] 0.1
YOLL due to PM2.5 [years] per [year] 825
YOLL due to ozone [years] per [year] 5.83
14245 - PPC S.A. SES AGIOY DHMHTRIOY (Operation) Bronchodilator usage [cases] per [year] 38393
Chronic bronchitis [cases] per [year] 117
Lower respiratory symptoms [days] per [year] 338556
Cardiac hospital admissions [cases] per [year] 27
Respiratory hospital admission [cases] per [year] 56
Work loss days [days] per [year] 80423
Minor RAD [days] per [year] 256042
netRAD [days] per [year] 55422
LRSwo cough [cases] per [year] 10370
Cough [days] per [year] 60250
Infant Mortality due to PM10 [cases] per [year] 0.43
YOLL due to PM2.5 [years] per [year] 3764
YOLL due to ozone [years] per [year] 12.88
15819 - TETs "Enel Maritsa iztok 3" (Operation) Bronchodilator usage [cases] per [year] 13603
Chronic bronchitis [cases] per [year] 46
Lower respiratory symptoms [days] per [year] 132078
Cardiac hospital admissions [cases] per [year] 11
Respiratory hospital admission [cases] per [year] 21
Work loss days [days] per [year] 31984
Minor RAD [days] per [year] 97636
netRAD [days] per [year] 22040
LRSwo cough [cases] per [year] 3102
Cough [days] per [year] 18030
Infant Mortality due to PM10 [cases] per [year] 0.17
YOLL due to PM2.5 [years] per [year] 1496
YOLL due to ozone [years] per [year] 3.86

14
15875 - TETs Maritsa iztok 2 EAD (Operation) Bronchodilator usage [cases] per [year] 79695
Chronic bronchitis [cases] per [year] 345
Lower respiratory symptoms [days] per [year] 995440
Cardiac hospital admissions [cases] per [year] 81
Respiratory hospital admission [cases] per [year] 139
Work loss days [days] per [year] 248157
Minor RAD [days] per [year] 690660
netRAD [days] per [year] 171018
LRSwo cough [cases] per [year] 7779
Cough [days] per [year] 45220
Infant Mortality due to PM10 [cases] per [year] 1.27
YOLL due to PM2.5 [years] per [year] 11613
YOLL due to ozone [years] per [year] 9.67
46361 - Vattenfall Europe Generation AG Kraftwerk Jänschwalde (Operation)
Bronchodilator usage [cases] per [year] 34765
Chronic bronchitis [cases] per [year] 124
Lower respiratory symptoms [days] per [year] 357370
Cardiac hospital admissions [cases] per [year] 29
Respiratory hospital admission [cases] per [year] 55
Work loss days [days] per [year] 84196
Minor RAD [days] per [year] 252211
netRAD [days] per [year] 58019
LRSwo cough [cases] per [year] 7000
Cough [days] per [year] 40690
Infant Mortality due to PM10 [cases] per [year] 0.46
YOLL due to PM2.5 [years] per [year] 3940
YOLL due to ozone [years] per [year] 8.7
157215 - SUCURSALA ELECTROCENTRALE ISALNITA (Operation)
Bronchodilator usage [cases] per [year] 12584
Chronic bronchitis [cases] per [year] 62
Lower respiratory symptoms [days] per [year] 178418
Cardiac hospital admissions [cases] per [year] 14
Respiratory hospital admission [cases] per [year] 24
Work loss days [days] per [year] 44489
Minor RAD [days] per [year] 119062
netRAD [days] per [year] 30657
LRSwo cough [cases] per [year] 236
Cough [days] per [year] 1371
Infant Mortality due to PM10 [cases] per [year] 0.23
YOLL due to PM2.5 [years] per [year] 2082
YOLL due to ozone [years] per [year] 0.29

15
157216 - SUCURSALA ELECTROCENTRALE CRAIOVA II (Operation)
Bronchodilator usage [cases] per [year] 13524
Chronic bronchitis [cases] per [year] 56
Lower respiratory symptoms [days] per [year] 161953
Cardiac hospital admissions [cases] per [year] 13
Respiratory hospital admission [cases] per [year] 23
Work loss days [days] per [year] 39852
Minor RAD [days] per [year] 112522
netRAD [days] per [year] 27463
LRSwo cough [cases] per [year] 1646
Cough [days] per [year] 9569
Infant Mortality due to PM10 [cases] per [year] 0.21
YOLL due to PM2.5 [years] per [year] 1865
YOLL due to ozone [years] per [year] 2.05
157218 - COMPLEXUL ENERGETIC TURCENI (Operation) Bronchodilator usage [cases] per [year] 61390
Chronic bronchitis [cases] per [year] 258
Lower respiratory symptoms [days] per [year] 744303
Cardiac hospital admissions [cases] per [year] 60
Respiratory hospital admission [cases] per [year] 105
Work loss days [days] per [year] 183452
Minor RAD [days] per [year] 515854
netRAD [days] per [year] 126421
LRSwo cough [cases] per [year] 7039
Cough [days] per [year] 40920
Infant Mortality due to PM10 [cases] per [year] 0.95
YOLL due to PM2.5 [years] per [year] 8584
YOLL due to ozone [years] per [year] 8.75
157219 - COMPLEXUL ENERGETIC ROVINARI (Operation) Bronchodilator usage [cases] per [year] 44556
Chronic bronchitis [cases] per [year] 182
Lower respiratory symptoms [days] per [year] 524315
Cardiac hospital admissions [cases] per [year] 42
Respiratory hospital admission [cases] per [year] 75
Work loss days [days] per [year] 128201
Minor RAD [days] per [year] 364424
netRAD [days] per [year] 88365
LRSwo cough [cases] per [year] 5858
Cough [days] per [year] 34050
Infant Mortality due to PM10 [cases] per [year] 0.67
YOLL due to PM2.5 [years] per [year] 6001
YOLL due to ozone [years] per [year] 7.28

16
GPBG0001 - Enemona Lom (Announced) Bronchodilator usage [cases] per [year] 4605
Chronic bronchitis [cases] per [year] 10
Lower respiratory symptoms [days] per [year] 28306
Cardiac hospital admissions [cases] per [year] 2
Respiratory hospital admission [cases] per [year] 6
Work loss days [days] per [year] 6461
Minor RAD [days] per [year] 24629
netRAD [days] per [year] 4453
LRSwo cough [cases] per [year] 1820
Cough [days] per [year] 10580
Infant Mortality due to PM10 [cases] per [year] 0.04
YOLL due to PM2.5 [years] per [year] 302
YOLL due to ozone [years] per [year] 2.26
GPBG0002 - Energia MK Bobov Dol (Announced) Bronchodilator usage [cases] per [year] 3450
Chronic bronchitis [cases] per [year] 7
Lower respiratory symptoms [days] per [year] 21256
Cardiac hospital admissions [cases] per [year] 2
Respiratory hospital admission [cases] per [year] 4
Work loss days [days] per [year] 4842
Minor RAD [days] per [year] 18444
netRAD [days] per [year] 3337
LRSwo cough [cases] per [year] 1361
Cough [days] per [year] 7912
Infant Mortality due to PM10 [cases] per [year] 0.03
YOLL due to PM2.5 [years] per [year] 227
YOLL due to ozone [years] per [year] 1.69
GPBG0003 - BEH Maritsa-Iztok-2 (Applying for permits) Bronchodilator usage [cases] per [year] 4143
Chronic bronchitis [cases] per [year] 9
Lower respiratory symptoms [days] per [year] 25445
Cardiac hospital admissions [cases] per [year] 2
Respiratory hospital admission [cases] per [year] 5
Work loss days [days] per [year] 5812
Minor RAD [days] per [year] 22156
netRAD [days] per [year] 4006
LRSwo cough [cases] per [year] 1638
Cough [days] per [year] 9522
Infant Mortality due to PM10 [cases] per [year] 0.03
YOLL due to PM2.5 [years] per [year] 272
YOLL due to ozone [years] per [year] 2.04
17
GPBG0005 - RWE & MIM Maritsa Iztok-4 (Unclear) Bronchodilator usage [cases] per [year] 7363
Chronic bronchitis [cases] per [year] 16
Lower respiratory symptoms [days] per [year] 45207
Cardiac hospital admissions [cases] per [year] 4
Respiratory hospital admission [cases] per [year] 9
Work loss days [days] per [year] 10328
Minor RAD [days] per [year] 39382
netRAD [days] per [year] 7118
LRSwo cough [cases] per [year] 2912
Cough [days] per [year] 16930
Infant Mortality due to PM10 [cases] per [year] 0.06
YOLL due to PM2.5 [years] per [year] 483
YOLL due to ozone [years] per [year] 3.62
GPCR0001 - HEP Plomin 'C' (Applying for permits) Bronchodilator usage [cases] per [year] 2565
Chronic bronchitis [cases] per [year] 7
Lower respiratory symptoms [days] per [year] 20227
Cardiac hospital admissions [cases] per [year] 2
Respiratory hospital admission [cases] per [year] 4
Work loss days [days] per [year] 4697
Minor RAD [days] per [year] 15778
netRAD [days] per [year] 3238
LRSwo cough [cases] per [year] 805
Cough [days] per [year] 4676
Infant Mortality due to PM10 [cases] per [year] 0.03
YOLL due to PM2.5 [years] per [year] 220
YOLL due to ozone [years] per [year] 1.00
GPCZ0001 - CZ Coal Mostecka (Announced) Bronchodilator usage [cases] per [year] 5765
Chronic bronchitis [cases] per [year] 25
Lower respiratory symptoms [days] per [year] 71474
Cardiac hospital admissions [cases] per [year] 6
Respiratory hospital admission [cases] per [year] 10
Work loss days [days] per [year] 16409
Minor RAD [days] per [year] 45976
netRAD [days] per [year] 11311
LRSwo cough [cases] per [year] 588
Cough [days] per [year] 3419
Infant Mortality due to PM10 [cases] per [year] 0.09
YOLL due to PM2.5 [years] per [year] 768
YOLL due to ozone [years] per [year] 0.73

18
GPCZ0003 - CEZ Prunerov (Permitted) Bronchodilator usage [cases] per [year] 5562
Chronic bronchitis [cases] per [year] 24
Lower respiratory symptoms [days] per [year] 68961
Cardiac hospital admissions [cases] per [year] 6
Respiratory hospital admission [cases] per [year] 10
Work loss days [days] per [year] 15826
Minor RAD [days] per [year] 44348
netRAD [days] per [year] 10908
LRSwo cough [cases] per [year] 567
Cough [days] per [year] 3296
Infant Mortality due to PM10 [cases] per [year] 0.09
YOLL due to PM2.5 [years] per [year] 741
YOLL due to ozone [years] per [year] 0.70
GPCZ0004 - CEZ Ledvice (Under construction) Bronchodilator usage [cases] per [year] 4531
Chronic bronchitis [cases] per [year] 19
Lower respiratory symptoms [days] per [year] 56177
Cardiac hospital admissions [cases] per [year] 5
Respiratory hospital admission [cases] per [year] 8
Work loss days [days] per [year] 12880
Minor RAD [days] per [year] 36102
netRAD [days] per [year] 8880
LRSwo cough [cases] per [year] 461
Cough [days] per [year] 2682
Infant Mortality due to PM10 [cases] per [year] 0.07
YOLL due to PM2.5 [years] per [year] 603
YOLL due to ozone [years] per [year] 0.57
GPCZ0005 - Alpiq Kladno (Under construction) Bronchodilator usage [cases] per [year] 1125
Chronic bronchitis [cases] per [year] 5
Lower respiratory symptoms [days] per [year] 13960
Cardiac hospital admissions [cases] per [year] 1
Respiratory hospital admission [cases] per [year] 2
Work loss days [days] per [year] 3197
Minor RAD [days] per [year] 8957
netRAD [days] per [year] 2204
LRSwo cough [cases] per [year] 114
Cough [days] per [year] 665
Infant Mortality due to PM10 [cases] per [year] 0.02
YOLL due to PM2.5 [years] per [year] 150
YOLL due to ozone [years] per [year] 0.14
19
GPDE0001 - RWE Arneburg (Announced) Bronchodilator usage [cases] per [year] 4954
Chronic bronchitis [cases] per [year] 17
Lower respiratory symptoms [days] per [year] 49317
Cardiac hospital admissions [cases] per [year] 4
Respiratory hospital admission [cases] per [year] 8
Work loss days [days] per [year] 11526
Minor RAD [days] per [year] 35008
netRAD [days] per [year] 7943
LRSwo cough [cases] per [year] 1073
Cough [days] per [year] 6236
Infant Mortality due to PM10 [cases] per [year] 0.06
YOLL due to PM2.5 [years] per [year] 539
YOLL due to ozone [years] per [year] 1.33
GPDE0002 - Infracor Marl (Announced) Bronchodilator usage [cases] per [year] 1735
Chronic bronchitis [cases] per [year] 14
Lower respiratory symptoms [days] per [year] 39468
Cardiac hospital admissions [cases] per [year] 3
Respiratory hospital admission [cases] per [year] 4
Work loss days [days] per [year] 9121
Minor RAD [days] per [year] 21479
netRAD [days] per [year] 6286
LRSwo cough [cases] per [year] -665
Cough [days] per [year] -3867
Infant Mortality due to PM10 [cases] per [year] 0.05
YOLL due to PM2.5 [years] per [year] 427
YOLL due to ozone [years] per [year] -0.83
GPDE0003 - RWE Niederaußem (Bergheim) (Applying for permits)
Bronchodilator usage [cases] per [year] 5217
Chronic bronchitis [cases] per [year] 41
Lower respiratory symptoms [days] per [year] 119151
Cardiac hospital admissions [cases] per [year] 10
Respiratory hospital admission [cases] per [year] 13
Work loss days [days] per [year] 27638
Minor RAD [days] per [year] 65053
netRAD [days] per [year] 19049
LRSwo cough [cases] per [year] -2024
Cough [days] per [year] -11760
Infant Mortality due to PM10 [cases] per [year] 0.15
YOLL due to PM2.5 [years] per [year] 1294
YOLL due to ozone [years] per [year] -2.52

20
GPDE0004 - Mibrag Profen (Applying for permits) Bronchodilator usage [cases] per [year] 1986
Chronic bronchitis [cases] per [year] 7
Lower respiratory symptoms [days] per [year] 19789
Cardiac hospital admissions [cases] per [year] 2
Respiratory hospital admission [cases] per [year] 3
Work loss days [days] per [year] 4616
Minor RAD [days] per [year] 14021
netRAD [days] per [year] 3181
LRSwo cough [cases] per [year] 429
Cough [days] per [year] 2493
Infant Mortality due to PM10 [cases] per [year] 0.03
YOLL due to PM2.5 [years] per [year] 216
YOLL due to ozone [years] per [year] 0.53
GPDE0005 - Dow Chemical Stade (Applying for permits) Bronchodilator usage [cases] per [year] 5979
Chronic bronchitis [cases] per [year] 28
Lower respiratory symptoms [days] per [year] 81287
Cardiac hospital admissions [cases] per [year] 7
Respiratory hospital admission [cases] per [year] 11
Work loss days [days] per [year] 19021
Minor RAD [days] per [year] 51623
netRAD [days] per [year] 13112
LRSwo cough [cases] per [year] 273
Cough [days] per [year] 1588
Infant Mortality due to PM10 [cases] per [year] 0.1
YOLL due to PM2.5 [years] per [year] 890
YOLL due to ozone [years] per [year] 0.34
GPDE0006 - E.ON Staudinger (Cancelled) Bronchodilator usage [cases] per [year] 4444
Chronic bronchitis [cases] per [year] 16
Lower respiratory symptoms [days] per [year] 44858
Cardiac hospital admissions [cases] per [year] 4
Respiratory hospital admission [cases] per [year] 7
Work loss days [days] per [year] 10485
Minor RAD [days] per [year] 31661
netRAD [days] per [year] 7223
LRSwo cough [cases] per [year] 933
Cough [days] per [year] 5424
Infant Mortality due to PM10 [cases] per [year] 0.06
YOLL due to PM2.5 [years] per [year] 491
YOLL due to ozone [years] per [year] 1.16

21
GPDE0010 - E.ON Datteln (Under construction) Bronchodilator usage [cases] per [year] 3547
Chronic bronchitis [cases] per [year] 28
Lower respiratory symptoms [days] per [year] 82150
Cardiac hospital admissions [cases] per [year] 7
Respiratory hospital admission [cases] per [year] 9
Work loss days [days] per [year] 19136
Minor RAD [days] per [year] 44931
netRAD [days] per [year] 13185
LRSwo cough [cases] per [year] -1429
Cough [days] per [year] -8307
Infant Mortality due to PM10 [cases] per [year] 0.1
YOLL due to PM2.5 [years] per [year] 895
YOLL due to ozone [years] per [year] -1.78
GPDE0011 - Trianel Power Lünen (Under construction) Bronchodilator usage [cases] per [year] 3137
Chronic bronchitis [cases] per [year] 25
Lower respiratory symptoms [days] per [year] 71297
Cardiac hospital admissions [cases] per [year] 6
Respiratory hospital admission [cases] per [year] 8
Work loss days [days] per [year] 16472
Minor RAD [days] per [year] 38795
netRAD [days] per [year] 11352
LRSwo cough [cases] per [year] -1201
Cough [days] per [year] -6982
Infant Mortality due to PM10 [cases] per [year] 0.09
YOLL due to PM2.5 [years] per [year] 771
YOLL due to ozone [years] per [year] -1.49
GPDE0012 - EnBW Karlsruhe-Rheinhafen (Under construction)
Bronchodilator usage [cases] per [year] 4058
Chronic bronchitis [cases] per [year] 16
Lower respiratory symptoms [days] per [year] 44794
Cardiac hospital admissions [cases] per [year] 4
Respiratory hospital admission [cases] per [year] 7
Work loss days [days] per [year] 10565
Minor RAD [days] per [year] 30812
netRAD [days] per [year] 7284
LRSwo cough [cases] per [year] 672
Cough [days] per [year] 3905
Infant Mortality due to PM10 [cases] per [year] 0.06
YOLL due to PM2.5 [years] per [year] 495
YOLL due to ozone [years] per [year] 0.84

22
GPDE0013 - GDF Suez & BKW Energie Wilhelmshaven (Under construction)
Bronchodilator usage [cases] per [year] 1595
Chronic bronchitis [cases] per [year] 7
Lower respiratory symptoms [days] per [year] 21198
Cardiac hospital admissions [cases] per [year] 2
Respiratory hospital admission [cases] per [year] 3
Work loss days [days] per [year] 4931
Minor RAD [days] per [year] 13485
netRAD [days] per [year] 3398
LRSwo cough [cases] per [year] 96
Cough [days] per [year] 556
Infant Mortality due to PM10 [cases] per [year] 0.03
YOLL due to PM2.5 [years] per [year] 231
YOLL due to ozone [years] per [year] 0.12
GPDE0014 - RWE Hamm-Uentrop (Under construction) Bronchodilator usage [cases] per [year] 5743
Chronic bronchitis [cases] per [year] 45
Lower respiratory symptoms [days] per [year] 130760
Cardiac hospital admissions [cases] per [year] 11
Respiratory hospital admission [cases] per [year] 15
Work loss days [days] per [year] 30270
Minor RAD [days] per [year] 71293
netRAD [days] per [year] 20865
LRSwo cough [cases] per [year] -2209
Cough [days] per [year] -12840
Infant Mortality due to PM10 [cases] per [year] 0.17
YOLL due to PM2.5 [years] per [year] 1417
YOLL due to ozone [years] per [year] -2.75
GPDE0015 - GKM AG Mannheim, Neckarau Block 9 (Under construction)
Bronchodilator usage [cases] per [year] 3986
Chronic bronchitis [cases] per [year] 15
Lower respiratory symptoms [days] per [year] 43021
Cardiac hospital admissions [cases] per [year] 3
Respiratory hospital admission [cases] per [year] 6
Work loss days [days] per [year] 10125
Minor RAD [days] per [year] 29776
netRAD [days] per [year] 6978
LRSwo cough [cases] per [year] 706
Cough [days] per [year] 4103
Infant Mortality due to PM10 [cases] per [year] 0.05
YOLL due to PM2.5 [years] per [year] 474
YOLL due to ozone [years] per [year] 0.88

23
GPDE0016 - Vattenfall Europe AG, Berlin Hamburg-Moorburg (Under construction)
Bronchodilator usage [cases] per [year] 1649
Chronic bronchitis [cases] per [year] 8
Lower respiratory symptoms [days] per [year] 23922
Cardiac hospital admissions [cases] per [year] 2
Respiratory hospital admission [cases] per [year] 3
Work loss days [days] per [year] 5618
Minor RAD [days] per [year] 14937
netRAD [days] per [year] 3872
LRSwo cough [cases] per [year] 5
Cough [days] per [year] 27
Infant Mortality due to PM10 [cases] per [year] 0.03
YOLL due to PM2.5 [years] per [year] 263
YOLL due to ozone [years] per [year] 0.01
GPGR0001 - PPC Agios Dimitrios 6/Ptolemais (Announced) Bronchodilator usage [cases] per [year] 10604
Chronic bronchitis [cases] per [year] 30
Lower respiratory symptoms [days] per [year] 86769
Cardiac hospital admissions [cases] per [year] 7
Respiratory hospital admission [cases] per [year] 15
Work loss days [days] per [year] 20285
Minor RAD [days] per [year] 66888
netRAD [days] per [year] 13982
LRSwo cough [cases] per [year] 3178
Cough [days] per [year] 18470
Infant Mortality due to PM10 [cases] per [year] 0.11
YOLL due to PM2.5 [years] per [year] 949
YOLL due to ozone [years] per [year] 3.95
GPGR0002 - PPC Meliti II, Florina (Applying for permits) Bronchodilator usage [cases] per [year] 8520
Chronic bronchitis [cases] per [year] 24
Lower respiratory symptoms [days] per [year] 69895
Cardiac hospital admissions [cases] per [year] 6
Respiratory hospital admission [cases] per [year] 12
Work loss days [days] per [year] 16340
Minor RAD [days] per [year] 53840
netRAD [days] per [year] 11261
LRSwo cough [cases] per [year] 2545
Cough [days] per [year] 14790
Infant Mortality due to PM10 [cases] per [year] 0.09
YOLL due to PM2.5 [years] per [year] 765
YOLL due to ozone [years] per [year] 3.16

24
GPGR0003 - PPC Ptolemaida V (Permitted) Bronchodilator usage [cases] per [year] 11399
Chronic bronchitis [cases] per [year] 32
Lower respiratory symptoms [days] per [year] 93266
Cardiac hospital admissions [cases] per [year] 8
Respiratory hospital admission [cases] per [year] 16
Work loss days [days] per [year] 21803
Minor RAD [days] per [year] 71903
netRAD [days] per [year] 15022
LRSwo cough [cases] per [year] 3417
Cough [days] per [year] 19860
Infant Mortality due to PM10 [cases] per [year] 0.12
YOLL due to PM2.5 [years] per [year] 1020
YOLL due to ozone [years] per [year] 4.25
GPHU0001 - Wildhorse Energy Mecsek Hills UCG (Applying for permits)
Bronchodilator usage [cases] per [year] 3235
Chronic bronchitis [cases] per [year] 9
Lower respiratory symptoms [days] per [year] 25055
Cardiac hospital admissions [cases] per [year] 2
Respiratory hospital admission [cases] per [year] 4
Work loss days [days] per [year] 5732
Minor RAD [days] per [year] 19469
netRAD [days] per [year] 3950
LRSwo cough [cases] per [year] 1036
Cough [days] per [year] 6020
Infant Mortality due to PM10 [cases] per [year] 0.03
YOLL due to PM2.5 [years] per [year] 268
YOLL due to ozone [years] per [year] 1.29
GPIT0001 - Enel Porto Tolle (Applying for permits) Bronchodilator usage [cases] per [year] 7357
Chronic bronchitis [cases] per [year] 30
Lower respiratory symptoms [days] per [year] 86999
Cardiac hospital admissions [cases] per [year] 7
Respiratory hospital admission [cases] per [year] 12
Work loss days [days] per [year] 20684
Minor RAD [days] per [year] 58801
netRAD [days] per [year] 14252
LRSwo cough [cases] per [year] 947
Cough [days] per [year] 5506
Infant Mortality due to PM10 [cases] per [year] 0.11
YOLL due to PM2.5 [years] per [year] 968
YOLL due to ozone [years] per [year] 1.18

25
GPIT0002 - Tirreno Power Vado Ligure (Applying for permits) Bronchodilator usage [cases] per [year] 3322
Chronic bronchitis [cases] per [year] 14
Lower respiratory symptoms [days] per [year] 39198
Cardiac hospital admissions [cases] per [year] 3
Respiratory hospital admission [cases] per [year] 6
Work loss days [days] per [year] 9316
Minor RAD [days] per [year] 26501
netRAD [days] per [year] 6419
LRSwo cough [cases] per [year] 432
Cough [days] per [year] 2510
Infant Mortality due to PM10 [cases] per [year] 0.05
YOLL due to PM2.5 [years] per [year] 436
YOLL due to ozone [years] per [year] 0.54
GPIT0003 - Repower & Hera Saline Joniche (Applying for permits)
Bronchodilator usage [cases] per [year] 4237
Chronic bronchitis [cases] per [year] 9
Lower respiratory symptoms [days] per [year] 26735
Cardiac hospital admissions [cases] per [year] 2
Respiratory hospital admission [cases] per [year] 5
Work loss days [days] per [year] 5858
Minor RAD [days] per [year] 22299
netRAD [days] per [year] 4037
LRSwo cough [cases] per [year] 1642
Cough [days] per [year] 9545
Infant Mortality due to PM10 [cases] per [year] 0.03
YOLL due to PM2.5 [years] per [year] 274
YOLL due to ozone [years] per [year] 2.04
GPIT0004 - E.ON Fiume Santo (Permitted) Bronchodilator usage [cases] per [year] 2085
Chronic bronchitis [cases] per [year] 5
Lower respiratory symptoms [days] per [year] 13796
Cardiac hospital admissions [cases] per [year] 1
Respiratory hospital admission [cases] per [year] 3
Work loss days [days] per [year] 3064
Minor RAD [days] per [year] 11331
netRAD [days] per [year] 2112
LRSwo cough [cases] per [year] 778
Cough [days] per [year] 4522
Infant Mortality due to PM10 [cases] per [year] 0.02
YOLL due to PM2.5 [years] per [year] 143
YOLL due to ozone [years] per [year] 0.97

26
GPKO0001 - KEK Kosovo C (Announced) Bronchodilator usage [cases] per [year] 4320
Chronic bronchitis [cases] per [year] 12
Lower respiratory symptoms [days] per [year] 34680
Cardiac hospital admissions [cases] per [year] 3
Respiratory hospital admission [cases] per [year] 6
Work loss days [days] per [year] 7858
Minor RAD [days] per [year] 26304
netRAD [days] per [year] 5415
LRSwo cough [cases] per [year] 1325
Cough [days] per [year] 7703
Infant Mortality due to PM10 [cases] per [year] 0.04
YOLL due to PM2.5 [years] per [year] 368
YOLL due to ozone [years] per [year] 1.65
GPNL0001 - E.ON & GDF Suez Maasvlakte Port (Under construction)
Bronchodilator usage [cases] per [year] 565
Chronic bronchitis [cases] per [year] 9
Lower respiratory symptoms [days] per [year] 27369
Cardiac hospital admissions [cases] per [year] 2
Respiratory hospital admission [cases] per [year] 3
Work loss days [days] per [year] 6203
Minor RAD [days] per [year] 12782
netRAD [days] per [year] 4274
LRSwo cough [cases] per [year] -897
Cough [days] per [year] -5216
Infant Mortality due to PM10 [cases] per [year] 0.03
YOLL due to PM2.5 [years] per [year] 290
YOLL due to ozone [years] per [year] -1.12
GPNL0002 - GDF Suez Maasvlakte Port (Under construction) Bronchodilator usage [cases] per [year] 403
Chronic bronchitis [cases] per [year] 5
Lower respiratory symptoms [days] per [year] 15703
Cardiac hospital admissions [cases] per [year] 1
Respiratory hospital admission [cases] per [year] 2
Work loss days [days] per [year] 3570
Minor RAD [days] per [year] 7583
netRAD [days] per [year] 2460
LRSwo cough [cases] per [year] -461
Cough [days] per [year] -2680
Infant Mortality due to PM10 [cases] per [year] 0.02
YOLL due to PM2.5 [years] per [year] 167
YOLL due to ozone [years] per [year] -0.57

27
GPNL0003 - RWE & Essent Eemshaven (Under construction) Bronchodilator usage [cases] per [year] 922
Chronic bronchitis [cases] per [year] 14
Lower respiratory symptoms [days] per [year] 39733
Cardiac hospital admissions [cases] per [year] 3
Respiratory hospital admission [cases] per [year] 4
Work loss days [days] per [year] 9046
Minor RAD [days] per [year] 18948
netRAD [days] per [year] 6234
LRSwo cough [cases] per [year] -1234
Cough [days] per [year] -7171
Infant Mortality due to PM10 [cases] per [year] 0.05
YOLL due to PM2.5 [years] per [year] 423
YOLL due to ozone [years] per [year] -1.53
GPPL0001 - RWE & Kompania Weglowa Wola (Silesia) (Announced)
Bronchodilator usage [cases] per [year] 2926
Chronic bronchitis [cases] per [year] 16
Lower respiratory symptoms [days] per [year] 45704
Cardiac hospital admissions [cases] per [year] 4
Respiratory hospital admission [cases] per [year] 6
Work loss days [days] per [year] 10329
Minor RAD [days] per [year] 26817
netRAD [days] per [year] 7116
LRSwo cough [cases] per [year] -144
Cough [days] per [year] -839
Infant Mortality due to PM10 [cases] per [year] 0.06
YOLL due to PM2.5 [years] per [year] 483
YOLL due to ozone [years] per [year] -0.18
GPPL0002 - PGE Gubin (Announced) Bronchodilator usage [cases] per [year] 12613
Chronic bronchitis [cases] per [year] 49
Lower respiratory symptoms [days] per [year] 142639
Cardiac hospital admissions [cases] per [year] 12
Respiratory hospital admission [cases] per [year] 21
Work loss days [days] per [year] 32557
Minor RAD [days] per [year] 94344
netRAD [days] per [year] 22441
LRSwo cough [cases] per [year] 1928
Cough [days] per [year] 11213
Infant Mortality due to PM10 [cases] per [year] 0.18
YOLL due to PM2.5 [years] per [year] 1523
YOLL due to ozone [years] per [year] 2.40

28
GPPL0003 - Fortum Zabrze CHP (Announced) Bronchodilator usage [cases] per [year] 1522
Chronic bronchitis [cases] per [year] 8
Lower respiratory symptoms [days] per [year] 23781
Cardiac hospital admissions [cases] per [year] 2
Respiratory hospital admission [cases] per [year] 3
Work loss days [days] per [year] 5368
Minor RAD [days] per [year] 13943
netRAD [days] per [year] 3700
LRSwo cough [cases] per [year] -75
Cough [days] per [year] -435
Infant Mortality due to PM10 [cases] per [year] 0.03
YOLL due to PM2.5 [years] per [year] 251
YOLL due to ozone [years] per [year] -0.09
GPPL0004 - PGE Opole 5 & 6 (Applying for permits) Bronchodilator usage [cases] per [year] 4135
Chronic bronchitis [cases] per [year] 22
Lower respiratory symptoms [days] per [year] 64602
Cardiac hospital admissions [cases] per [year] 5
Respiratory hospital admission [cases] per [year] 8
Work loss days [days] per [year] 14631
Minor RAD [days] per [year] 38006
netRAD [days] per [year] 10084
LRSwo cough [cases] per [year] -204
Cough [days] per [year] -1186
Infant Mortality due to PM10 [cases] per [year] 0.08
YOLL due to PM2.5 [years] per [year] 685
YOLL due to ozone [years] per [year] -0.25
GPPL0005 - PGE Turow (Applying for permits) Bronchodilator usage [cases] per [year] 1611
Chronic bronchitis [cases] per [year] 9
Lower respiratory symptoms [days] per [year] 25158
Cardiac hospital admissions [cases] per [year] 2
Respiratory hospital admission [cases] per [year] 3
Work loss days [days] per [year] 5615
Minor RAD [days] per [year] 14581
netRAD [days] per [year] 3869
LRSwo cough [cases] per [year] -79
Cough [days] per [year] -458
Infant Mortality due to PM10 [cases] per [year] 0.03
YOLL due to PM2.5 [years] per [year] 263
YOLL due to ozone [years] per [year] -0.10

29
GPPL0006 - Tauron Tychy (Applying for permits) Bronchodilator usage [cases] per [year] 401
Chronic bronchitis [cases] per [year] 2
Lower respiratory symptoms [days] per [year] 6254
Cardiac hospital admissions [cases] per [year] 1
Respiratory hospital admission [cases] per [year] 1
Work loss days [days] per [year] 1396
Minor RAD [days] per [year] 3626
netRAD [days] per [year] 962
LRSwo cough [cases] per [year] -19
Cough [days] per [year] -112
Infant Mortality due to PM10 [cases] per [year] 0.01
YOLL due to PM2.5 [years] per [year] 65
YOLL due to ozone [years] per [year] -0.02
GPPL0007 - GDF Suez Łęczna (Stara Wieś-Stasin) (Applying for permits)
Bronchodilator usage [cases] per [year] 5580
Chronic bronchitis [cases] per [year] 19
Lower respiratory symptoms [days] per [year] 53932
Cardiac hospital admissions [cases] per [year] 4
Respiratory hospital admission [cases] per [year] 8
Work loss days [days] per [year] 12368
Minor RAD [days] per [year] 38107
netRAD [days] per [year] 8525
LRSwo cough [cases] per [year] 1284
Cough [days] per [year] 7462
Infant Mortality due to PM10 [cases] per [year] 0.07
YOLL due to PM2.5 [years] per [year] 579
YOLL due to ozone [years] per [year] 1.60
GPPL0008 - Kulczyk Investments Polnoc (Applying for permits)
Bronchodilator usage [cases] per [year] 5320
Chronic bronchitis [cases] per [year] 18
Lower respiratory symptoms [days] per [year] 51067
Cardiac hospital admissions [cases] per [year] 4
Respiratory hospital admission [cases] per [year] 8
Work loss days [days] per [year] 11741
Minor RAD [days] per [year] 36265
netRAD [days] per [year] 8094
LRSwo cough [cases] per [year] 1240
Cough [days] per [year] 7208
Infant Mortality due to PM10 [cases] per [year] 0.07
YOLL due to PM2.5 [years] per [year] 549
YOLL due to ozone [years] per [year] 1.54
30
GPPL0009 - PGE Belchatow (Operation; Commissioned after 2010)
Bronchodilator usage [cases] per [year] 5349
Chronic bronchitis [cases] per [year] 21
Lower respiratory symptoms [days] per [year] 60522
Cardiac hospital admissions [cases] per [year] 5
Respiratory hospital admission [cases] per [year] 9
Work loss days [days] per [year] 13793
Minor RAD [days] per [year] 39982
netRAD [days] per [year] 9509
LRSwo cough [cases] per [year] 817
Cough [days] per [year] 4750
Infant Mortality due to PM10 [cases] per [year] 0.08
YOLL due to PM2.5 [years] per [year] 646
YOLL due to ozone [years] per [year] 1.02
GPPL0010 - ENEA Kozienice (Permitted) Bronchodilator usage [cases] per [year] 7379
Chronic bronchitis [cases] per [year] 25
Lower respiratory symptoms [days] per [year] 71317
Cardiac hospital admissions [cases] per [year] 6
Respiratory hospital admission [cases] per [year] 11
Work loss days [days] per [year] 16352
Minor RAD [days] per [year] 50391
netRAD [days] per [year] 11270
LRSwo cough [cases] per [year] 1698
Cough [days] per [year] 9872
Infant Mortality due to PM10 [cases] per [year] 0.09
YOLL due to PM2.5 [years] per [year] 765
YOLL due to ozone [years] per [year] 2.11
GPPL0011 - Kogeneracja S.A. Siechnice (Permitted) Bronchodilator usage [cases] per [year] 527
Chronic bronchitis [cases] per [year] 3
Lower respiratory symptoms [days] per [year] 8226
Cardiac hospital admissions [cases] per [year] 1
Respiratory hospital admission [cases] per [year] 1
Work loss days [days] per [year] 1852
Minor RAD [days] per [year] 4809
netRAD [days] per [year] 1275
LRSwo cough [cases] per [year] -26
Cough [days] per [year] -149
Infant Mortality due to PM10 [cases] per [year] 0.01
YOLL due to PM2.5 [years] per [year] 87
YOLL due to ozone [years] per [year] -0.03

31
GPPL0012 - Energa Ostroleka Ostroleka (Permitted) Bronchodilator usage [cases] per [year] 6883
Chronic bronchitis [cases] per [year] 24
Lower respiratory symptoms [days] per [year] 68044
Cardiac hospital admissions [cases] per [year] 6
Respiratory hospital admission [cases] per [year] 11
Work loss days [days] per [year] 15648
Minor RAD [days] per [year] 47769
netRAD [days] per [year] 10788
LRSwo cough [cases] per [year] 1513
Cough [days] per [year] 8794
Infant Mortality due to PM10 [cases] per [year] 0.09
YOLL due to PM2.5 [years] per [year] 733
YOLL due to ozone [years] per [year] 1.88
GPPL0013 - Tauron Jaworzno 3 (Permitted) Bronchodilator usage [cases] per [year] 3187
Chronic bronchitis [cases] per [year] 17
Lower respiratory symptoms [days] per [year] 49852
Cardiac hospital admissions [cases] per [year] 4
Respiratory hospital admission [cases] per [year] 6
Work loss days [days] per [year] 11302
Minor RAD [days] per [year] 29355
netRAD [days] per [year] 7790
LRSwo cough [cases] per [year] -160
Cough [days] per [year] -931
Infant Mortality due to PM10 [cases] per [year] 0.06
YOLL due to PM2.5 [years] per [year] 529
YOLL due to ozone [years] per [year] -0.20
GPPL0014 - EDF Rybnik (Under construction) Bronchodilator usage [cases] per [year] 5458
Chronic bronchitis [cases] per [year] 29
Lower respiratory symptoms [days] per [year] 85119
Cardiac hospital admissions [cases] per [year] 7
Respiratory hospital admission [cases] per [year] 11
Work loss days [days] per [year] 19193
Minor RAD [days] per [year] 49868
netRAD [days] per [year] 13225
LRSwo cough [cases] per [year] -262
Cough [days] per [year] -1524
Infant Mortality due to PM10 [cases] per [year] 0.11
YOLL due to PM2.5 [years] per [year] 898
YOLL due to ozone [years] per [year] -0.33

32
GPRO0001 - SC Electrocentrale DEVA SA Electrocentrale Deva (Announced)
Bronchodilator usage [cases] per [year] 3637
Chronic bronchitis [cases] per [year] 10
Lower respiratory symptoms [days] per [year] 28668
Cardiac hospital admissions [cases] per [year] 2
Respiratory hospital admission [cases] per [year] 5
Work loss days [days] per [year] 6616
Minor RAD [days] per [year] 22251
netRAD [days] per [year] 4559
LRSwo cough [cases] per [year] 1142
Cough [days] per [year] 6637
Infant Mortality due to PM10 [cases] per [year] 0.04
YOLL due to PM2.5 [years] per [year] 310
YOLL due to ozone [years] per [year] 1.42
GPRO0002 - SC Doicesti & China Huadian Engineering Co. Doicesti (Announced)
Bronchodilator usage [cases] per [year] 4323
Chronic bronchitis [cases] per [year] 12
Lower respiratory symptoms [days] per [year] 34077
Cardiac hospital admissions [cases] per [year] 3
Respiratory hospital admission [cases] per [year] 6
Work loss days [days] per [year] 7861
Minor RAD [days] per [year] 26442
netRAD [days] per [year] 5418
LRSwo cough [cases] per [year] 1357
Cough [days] per [year] 7889
Infant Mortality due to PM10 [cases] per [year] 0.04
YOLL due to PM2.5 [years] per [year] 368
YOLL due to ozone [years] per [year] 1.69
GPRO0003 - Braila Power (Announced) Bronchodilator usage [cases] per [year] 6466
Chronic bronchitis [cases] per [year] 18
Lower respiratory symptoms [days] per [year] 50941
Cardiac hospital admissions [cases] per [year] 4
Respiratory hospital admission [cases] per [year] 9
Work loss days [days] per [year] 11764
Minor RAD [days] per [year] 39555
netRAD [days] per [year] 8105
LRSwo cough [cases] per [year] 2030
Cough [days] per [year] 11800
Infant Mortality due to PM10 [cases] per [year] 0.07
YOLL due to PM2.5 [years] per [year] 550
YOLL due to ozone [years] per [year] 2.52

33
GPRO0004 - Rovinari (Announced) Bronchodilator usage [cases] per [year] 4323
Chronic bronchitis [cases] per [year] 12
Lower respiratory symptoms [days] per [year] 34069
Cardiac hospital admissions [cases] per [year] 3
Respiratory hospital admission [cases] per [year] 6
Work loss days [days] per [year] 7862
Minor RAD [days] per [year] 26446
netRAD [days] per [year] 5419
LRSwo cough [cases] per [year] 1357
Cough [days] per [year] 7889
Infant Mortality due to PM10 [cases] per [year] 0.04
YOLL due to PM2.5 [years] per [year] 368
YOLL due to ozone [years] per [year] 1.69
GPRO0005 - Craiova II/Isalnita (Announced) Bronchodilator usage [cases] per [year] 4322
Chronic bronchitis [cases] per [year] 12
Lower respiratory symptoms [days] per [year] 34055
Cardiac hospital admissions [cases] per [year] 3
Respiratory hospital admission [cases] per [year] 6
Work loss days [days] per [year] 7860
Minor RAD [days] per [year] 26441
netRAD [days] per [year] 5418
LRSwo cough [cases] per [year] 1357
Cough [days] per [year] 7889
Infant Mortality due to PM10 [cases] per [year] 0.04
YOLL due to PM2.5 [years] per [year] 368
YOLL due to ozone [years] per [year] 1.69
GPRO0006 - RAAN Halanga, Dr. Turnu Severin (Announced) Bronchodilator usage [cases] per [year] 3457
Chronic bronchitis [cases] per [year] 9
Lower respiratory symptoms [days] per [year] 27241
Cardiac hospital admissions [cases] per [year] 2
Respiratory hospital admission [cases] per [year] 5
Work loss days [days] per [year] 6290
Minor RAD [days] per [year] 21158
netRAD [days] per [year] 4334
LRSwo cough [cases] per [year] 1086
Cough [days] per [year] 6311
Infant Mortality due to PM10 [cases] per [year] 0.03
YOLL due to PM2.5 [years] per [year] 294
YOLL due to ozone [years] per [year] 1.35
34
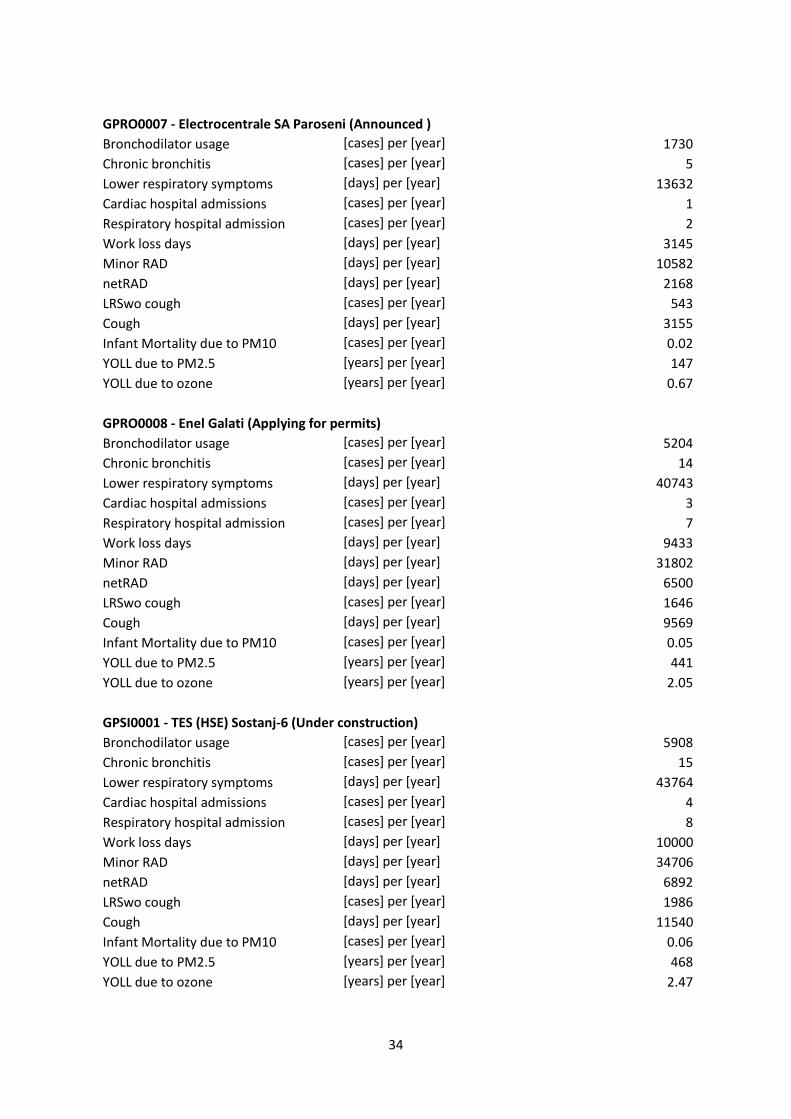
GPRO0007 - Electrocentrale SA Paroseni (Announced ) Bronchodilator usage [cases] per [year] 1730
Chronic bronchitis [cases] per [year] 5
Lower respiratory symptoms [days] per [year] 13632
Cardiac hospital admissions [cases] per [year] 1
Respiratory hospital admission [cases] per [year] 2
Work loss days [days] per [year] 3145
Minor RAD [days] per [year] 10582
netRAD [days] per [year] 2168
LRSwo cough [cases] per [year] 543
Cough [days] per [year] 3155
Infant Mortality due to PM10 [cases] per [year] 0.02
YOLL due to PM2.5 [years] per [year] 147
YOLL due to ozone [years] per [year] 0.67
GPRO0008 - Enel Galati (Applying for permits) Bronchodilator usage [cases] per [year] 5204
Chronic bronchitis [cases] per [year] 14
Lower respiratory symptoms [days] per [year] 40743
Cardiac hospital admissions [cases] per [year] 3
Respiratory hospital admission [cases] per [year] 7
Work loss days [days] per [year] 9433
Minor RAD [days] per [year] 31802
netRAD [days] per [year] 6500
LRSwo cough [cases] per [year] 1646
Cough [days] per [year] 9569
Infant Mortality due to PM10 [cases] per [year] 0.05
YOLL due to PM2.5 [years] per [year] 441
YOLL due to ozone [years] per [year] 2.05
GPSI0001 - TES (HSE) Sostanj-6 (Under construction) Bronchodilator usage [cases] per [year] 5908
Chronic bronchitis [cases] per [year] 15
Lower respiratory symptoms [days] per [year] 43764
Cardiac hospital admissions [cases] per [year] 4
Respiratory hospital admission [cases] per [year] 8
Work loss days [days] per [year] 10000
Minor RAD [days] per [year] 34706
netRAD [days] per [year] 6892
LRSwo cough [cases] per [year] 1986
Cough [days] per [year] 11540
Infant Mortality due to PM10 [cases] per [year] 0.06
YOLL due to PM2.5 [years] per [year] 468
YOLL due to ozone [years] per [year] 2.47

35
GPTR0005 - EÜAŞ 'AFSIN-ELBISTAN-C' (Announced) Bronchodilator usage [cases] per [year] 20245
Chronic bronchitis [cases] per [year] 45
Lower respiratory symptoms [days] per [year] 129743
Cardiac hospital admissions [cases] per [year] 11
Respiratory hospital admission [cases] per [year] 26
Work loss days [days] per [year] 30107
Minor RAD [days] per [year] 111757
netRAD [days] per [year] 20744
LRSwo cough [cases] per [year] 7751
Cough [days] per [year] 45060
Infant Mortality due to PM10 [cases] per [year] 0.17
YOLL due to PM2.5 [years] per [year] 1409
YOLL due to ozone [years] per [year] 9.64
GPTR0006 - EÜAŞ 'AFSIN-ELBISTAN-D' (Announced) Bronchodilator usage [cases] per [year] 17353
Chronic bronchitis [cases] per [year] 39
Lower respiratory symptoms [days] per [year] 111228
Cardiac hospital admissions [cases] per [year] 9
Respiratory hospital admission [cases] per [year] 22
Work loss days [days] per [year] 25802
Minor RAD [days] per [year] 95800
netRAD [days] per [year] 17781
LRSwo cough [cases] per [year] 6644
Cough [days] per [year] 38620
Infant Mortality due to PM10 [cases] per [year] 0.14
YOLL due to PM2.5 [years] per [year] 1208
YOLL due to ozone [years] per [year] 8.26
GPTR0007 - HEMA Elektrik AŞ (Applying for permits) Bronchodilator usage [cases] per [year] 17846
Chronic bronchitis [cases] per [year] 40
Lower respiratory symptoms [days] per [year] 114395
Cardiac hospital admissions [cases] per [year] 9
Respiratory hospital admission [cases] per [year] 23
Work loss days [days] per [year] 26542
Minor RAD [days] per [year] 98520
netRAD [days] per [year] 18291
LRSwo cough [cases] per [year] 6833
Cough [days] per [year] 39710
Infant Mortality due to PM10 [cases] per [year] 0.15
YOLL due to PM2.5 [years] per [year] 1242
YOLL due to ozone [years] per [year] 8.49

36
GPTR0009 - Anadolu Termik Santralleri A.Ş. (Applying for permits)
Bronchodilator usage [cases] per [year] 4921
Chronic bronchitis [cases] per [year] 9
Lower respiratory symptoms [days] per [year] 26744
Cardiac hospital admissions [cases] per [year] 2
Respiratory hospital admission [cases] per [year] 6
Work loss days [days] per [year] 5957
Minor RAD [days] per [year] 24473
netRAD [days] per [year] 4106
LRSwo cough [cases] per [year] 2109
Cough [days] per [year] 12260
Infant Mortality due to PM10 [cases] per [year] 0.03
YOLL due to PM2.5 [years] per [year] 279
YOLL due to ozone [years] per [year] 2.62
GPTR0011 - Tabiat Enerji 'Yeşilovacık Termik Santralı' (Applying for permits)
Bronchodilator usage [cases] per [year] 17849
Chronic bronchitis [cases] per [year] 40
Lower respiratory symptoms [days] per [year] 114435
Cardiac hospital admissions [cases] per [year] 9
Respiratory hospital admission [cases] per [year] 23
Work loss days [days] per [year] 26546
Minor RAD [days] per [year] 98530
netRAD [days] per [year] 18294
LRSwo cough [cases] per [year] 6833
Cough [days] per [year] 39710
Infant Mortality due to PM10 [cases] per [year] 0.15
YOLL due to PM2.5 [years] per [year] 1242
YOLL due to ozone [years] per [year] 8.49
GPTR0027 - Batı Karadeniz Elektrik 'Kireçlik Termik Santralı' (Applying for permits)
Bronchodilator usage [cases] per [year] 16248
Chronic bronchitis [cases] per [year] 36
Lower respiratory symptoms [days] per [year] 104358
Cardiac hospital admissions [cases] per [year] 8
Respiratory hospital admission [cases] per [year] 21
Work loss days [days] per [year] 24167
Minor RAD [days] per [year] 89663
netRAD [days] per [year] 16653
LRSwo cough [cases] per [year] 6211
Cough [days] per [year] 36100
Infant Mortality due to PM10 [cases] per [year] 0.13
YOLL due to PM2.5 [years] per [year] 1131
YOLL due to ozone [years] per [year] 7.72

37
GPTR0047 - Eren Enerji (Operation) Bronchodilator usage [cases] per [year] 36418
Chronic bronchitis [cases] per [year] 64
Lower respiratory symptoms [days] per [year] 186050
Cardiac hospital admissions [cases] per [year] 15
Respiratory hospital admission [cases] per [year] 42
Work loss days [days] per [year] 39671
Minor RAD [days] per [year] 171720
netRAD [days] per [year] 27340
LRSwo cough [cases] per [year] 16170
Cough [days] per [year] 93990
Infant Mortality due to PM10 [cases] per [year] 0.24
YOLL due to PM2.5 [years] per [year] 1857
YOLL due to ozone [years] per [year] 20.10
GPTR0049 - EÜAŞ 'Afşin-Elbistan-A' (Operation) Bronchodilator usage [cases] per [year] 133668
Chronic bronchitis [cases] per [year] 604
Lower respiratory symptoms [days] per [year] 1745030
Cardiac hospital admissions [cases] per [year] 141
Respiratory hospital admission [cases] per [year] 239
Work loss days [days] per [year] 431270
Minor RAD [days] per [year] 1184280
netRAD [days] per [year] 297250
LRSwo cough [cases] per [year] 9502
Cough [days] per [year] 55230
Infant Mortality due to PM10 [cases] per [year] 2.23
YOLL due to PM2.5 [years] per [year] 20188
YOLL due to ozone [years] per [year] 11.81
GPTR0053 - EÜAŞ (Operation) Bronchodilator usage [cases] per [year] 41596
Chronic bronchitis [cases] per [year] 74
Lower respiratory symptoms [days] per [year] 214628
Cardiac hospital admissions [cases] per [year] 17
Respiratory hospital admission [cases] per [year] 48
Work loss days [days] per [year] 46836
Minor RAD [days] per [year] 199790
netRAD [days] per [year] 32276
LRSwo cough [cases] per [year] 18370
Cough [days] per [year] 106800
Infant Mortality due to PM10 [cases] per [year] 0.27
YOLL due to PM2.5 [years] per [year] 2192
YOLL due to ozone [years] per [year] 22.83

38
GPTR0058 - İçdaş Çelik Enerji & Ulaşım Sanayi (Operation) Bronchodilator usage [cases] per [year] 7942
Chronic bronchitis [cases] per [year] 22
Lower respiratory symptoms [days] per [year] 62946
Cardiac hospital admissions [cases] per [year] 5
Respiratory hospital admission [cases] per [year] 11
Work loss days [days] per [year] 15069
Minor RAD [days] per [year] 50185
netRAD [days] per [year] 10384
LRSwo cough [cases] per [year] 2476
Cough [days] per [year] 14390
Infant Mortality due to PM10 [cases] per [year] 0.08
YOLL due to PM2.5 [years] per [year] 705
YOLL due to ozone [years] per [year] 3.08
GPTR0059 - İsken Enerji (Operation) Bronchodilator usage [cases] per [year] 52432
Chronic bronchitis [cases] per [year] 70
Lower respiratory symptoms [days] per [year] 203498
Cardiac hospital admissions [cases] per [year] 16
Respiratory hospital admission [cases] per [year] 56
Work loss days [days] per [year] 41799
Minor RAD [days] per [year] 218949
netRAD [days] per [year] 28812
LRSwo cough [cases] per [year] 26290
Cough [days] per [year] 152800
Infant Mortality due to PM10 [cases] per [year] 0.26
YOLL due to PM2.5 [years] per [year] 1957
YOLL due to ozone [years] per [year] 32.68
GPTR0063 - Enka Enerji (Permitted) Bronchodilator usage [cases] per [year] 11593
Chronic bronchitis [cases] per [year] 26
Lower respiratory symptoms [days] per [year] 74493
Cardiac hospital admissions [cases] per [year] 6
Respiratory hospital admission [cases] per [year] 15
Work loss days [days] per [year] 17246
Minor RAD [days] per [year] 63964
netRAD [days] per [year] 11887
LRSwo cough [cases] per [year] 4429
Cough [days] per [year] 25750
Infant Mortality due to PM10 [cases] per [year] 0.1
YOLL due to PM2.5 [years] per [year] 807
YOLL due to ozone [years] per [year] 5.51

39
GPTR0073 - Enerjisa (Under construction) Bronchodilator usage [cases] per [year] 17658
Chronic bronchitis [cases] per [year] 33
Lower respiratory symptoms [days] per [year] 95262
Cardiac hospital admissions [cases] per [year] 8
Respiratory hospital admission [cases] per [year] 21
Work loss days [days] per [year] 21244
Minor RAD [days] per [year] 87635
netRAD [days] per [year] 14641
LRSwo cough [cases] per [year] 7605
Cough [days] per [year] 44200
Infant Mortality due to PM10 [cases] per [year] 0.12
YOLL due to PM2.5 [years] per [year] 994
YOLL due to ozone [years] per [year] 9.45
GPTR-N01 - Turkey coal - national total Bronchodilator usage [cases] per [year] 165262
Chronic bronchitis [cases] per [year] 310
Lower respiratory symptoms [days] per [year] 894107
Cardiac hospital admissions [cases] per [year] 72
Respiratory hospital admission [cases] per [year] 196
Work loss days [days] per [year] 202760
Minor RAD [days] per [year] 829940
netRAD [days] per [year] 139773
LRSwo cough [cases] per [year] 71010
Cough [days] per [year] 412700
Infant Mortality due to PM10 [cases] per [year] 1.14
YOLL due to PM2.5 [years] per [year] 9490
YOLL due to ozone [years] per [year] 88.26
GPTR-N02 - Turkey lignite - national total Bronchodilator usage [cases] per [year] 624565
Chronic bronchitis [cases] per [year] 2132
Lower respiratory symptoms [days] per [year] 6158300
Cardiac hospital admissions [cases] per [year] 499
Respiratory hospital admission [cases] per [year] 960
Work loss days [days] per [year] 1492680
Minor RAD [days] per [year] 4530000
netRAD [days] per [year] 1028820
LRSwo cough [cases] per [year] 138000
Cough [days] per [year] 802100
Infant Mortality due to PM10 [cases] per [year] 7.86
YOLL due to PM2.5 [years] per [year] 69862
YOLL due to ozone [years] per [year] 171.50

40
3.2 Results for the major public coal fired power plants in Europe -
based on the simplified approach
The following results have been calculated using country specific “YOLL per tonne” and “WLD per
tonne” of emission values, for each of the considered pollutants and the corresponding source
region.
Annual emissions of the analysed power plants have been provided by GREENPEACE (Myllyvirta
2013). For 311 plants in operation, reported data corresponding to the year 2010 has been derived
by GREENPEACE from the “European Pollutant Release and Transfer Register” (E-PRTR) database of
the European Environmental Agency (http://prtr.ec.europa.eu). Moreover, GREENPEACE estimated
emission data for 111 sites in Europe where power plants are under construction, approved, applying
for approval or were connected to grid 2012 or later. The emission data corresponds to the expected
year of starting operation, i.e. 2013 and later.
The 80 power plants locations which have been assessed with the EcoSenseWeb model are part of
the above mentioned 422 sites and they have also been assessed by this approach. Since the generic
approach is less site specific the results differ slightly. For most of the 80 locations the difference is
below ca. +/- 10%. For a few locations the difference is higher, e.g. for
“GPDE0016 Hamburg - Vattenfall Europe AG, Berlin Hamburg-Moorburg” where the actual location is
close to the sea and therefore, a large share of emissions will increase pollutant concentration in
areas where there is actually no population. In this specific case the generic approach leads to a
ca. 2 times higher result regarding the YOLL. For those plants, where the risks have been calculated
with the detailed approach, the YOLL resulting from applying the detailed approach are shown in the
following in parenthesis, to be able to compare the results.
The “status” indicates again, whether the power plant is actually in operation or not.

41
Name of plant Status Country Municipality YOLL WLD
ELECTRABEL - CENTRALE RUIEN Operation Belgium Kluisbergen 218 4634
ELECTRABEL CENTRALE MOL Operation Belgium Mol 128 2716
E.ON Genk Operation Belgium Genk 227 4819
RWE & MIM Maritsa Iztok-4 Unclear Bulgaria 492 (487) 10319 (10328)
TETs Varna Operation Bulgaria Ezerovo 3404 71684
TETs "Maritsa" AD Dimitrovgrad Operation Bulgaria Dimitrovgrad 1635 34616
TETs "Bobov dol" Operation Bulgaria Golemo selo 3571 75504
TETs "Enel Maritsa iztok 3" Operation Bulgaria Mednikarovo 1515 (1500) 31982 (31984)
TETS SVILOZA Operation Bulgaria Svishtov 1328 28043
TOPLOFIKATSIA-PERNIK "Republika" Operation Bulgaria Pernik 1001 21176
BRIKEL Galabovo Operation Bulgaria Galabovo 4535 96013
TETs Maritsa iztok 2 EAD Operation Bulgaria Kovachevo 11733 (11622) 248116 (248157)
AES Maritsa Iztok-1 Operation; Commissioned after 2010
Bulgaria 412 8642
BEH Maritsa-Iztok-2 Applying for permits Bulgaria 277 (274) 5805 (5812)
Energia MK Bobov Dol Announced Bulgaria 230 (228) 4823 (4842)
Enemona Lom Announced Bulgaria 307 (305) 6450 (6461)
HEP Plomin 'C' Applying for permits Croatia 209 (221) 4409 (4697)
CEZ Ledvice Under construction Czech Republic 609 (604) 12866 (12880)
Alpiq Kladno Under construction Czech Republic 151 (150) 3189 (3197)
CEZ Prunerov Permitted Czech Republic 674 (741) 14231 (15826)
Elektrárna Opatovice Operation Czech Republic Opatovice nad Labem 820 17349
ČEZ Poříčí Operation Czech Republic Trutnov 220 4648

42
Name of plant Status Country Municipality YOLL WLD
ČEZ Mělník Operation Czech Republic Horní Počaply 960 20263
ČEZ Vítkovice Operation Czech Republic Ostrava 218 4614
Alpiq Kladno Operation Czech Republic Kladno 531 11221
Elektrárna Třebovice Operation Czech Republic Ostrava 716 15128
ACTHERM, spol. s r.o., odštěpný závod Chomutov Operation Czech Republic Chomutov 132 2789
ČEZ Tisová Operation Czech Republic Březová 657 13899
Teplárna Trmice Operation Czech Republic Trmice 346 7311
Elektrárna Mělník I - EMĚ I Operation Czech Republic Horní Počaply 499 10548
ČEZ Tušimice Operation Czech Republic Kadaň 200 4225
Elektrárna Chvaletice Operation Czech Republic Chvaletice 862 18210
ČEZ Dětmarovice Operation Czech Republic Dětmarovice 550 11615
ČEZ Dvůr Králové Operation Czech Republic Dvůr Králové nad Labem
49 1038
Mondi Štětí Operation Czech Republic Štětí 108 2285
Sokolovská uhelná,právní nástupce,a.s. Operation Czech Republic Chodov u Karlových Var
816 17234
ČEZ Ledvice Operation Czech Republic Bílina 1510 31942
Teplárna Komořany Operation Czech Republic Most 547 11585
ČEZ Prunéřov Operation Czech Republic Kadaň 3659 77317
ČEZ Hodonín Operation Czech Republic Hodonín 207 4372
ČEZ Počerady Operation Czech Republic Počerady 2189 46221
Plzeňská teplárenská, a.s. Operation Czech Republic Plzeň 490 10367
ENERGETIKA TŘINEC, a.s. Operation Czech Republic Třinec 256 5414
AES Bohemia Operation Czech Republic Planá Nad Lužnicí 310 6549
ArcelorMittal Energy Ostrava s.r.o. Operation Czech Republic Ostrava-Kunčice 674 14239
CEZ Tusimice II Operation; Commissioned after 2010
Czech Republic 562 11869
CZ Coal Mostecka Announced Czech Republic 776 (769) 16401 (16409)

43
Name of plant Status Country Municipality YOLL WLD
DONG Energy A/S - Enstedværket Operation Denmark Aabenraa 56 1176
DONG ENERGY POWER A/S, Avedøreværket Operation Denmark Hvidovre 68 1430
Nordjyllandsværket Operation Denmark Vodskov 46 981
VATTENFALL A/S, Amagerværket Operation Denmark København S 20 421
Helsingin Energia, Salmisaaren voimalaitokset Operation Finland HELEN 61 1292
Helsingin Energia, Hanasaari B -voimalaitos Operation Finland HELSINKI 83 1744
FORTUM POWER AND HEAT OY, INKOON VOIMALAITOS
Operation Finland INKOO 86 1810
KAINUUN VOIMA OY, Kajaanin Höyryvoimalaitos Operation Finland KAJAANI 7 151
Vapo Oy, Salon voimalaitos Operation Finland SALO 15 321
PVO-Lämpövoima Oy, Kristiinan voimalaitos Operation Finland KRISTIINANKAUPUNKI 39 822
Fortum Power and Heat Oy, JOENSUUN VOIMALAITOS
Operation Finland JOENSUU 38 800
Jyväskylän Energiantuotanto Oy, Rauhalahden voimalaitos
Operation Finland JYVÄSKYLÄ 49 1044
KANTELEEN VOIMA OY, Haapaveden voimalaitos Operation Finland HAAPAVESI 80 1694
Fortum Power and Heat Oy, Naantalin voimalaitos
Operation Finland NAANTALI 138 2896
OULUN ENERGIA, Toppilan voimalaitokset, Oulu Operation Finland OULU 53 1125
PVO Lämpövoima Oy, Tahkoluodon voimalaitos Operation Finland PORI 42 889
Pori Energia Oy, Aittaluodon voimalaitos Operation Finland PORI 16 328
Fortum Power and Heat Oy, Meri-Porin voimalaitos
Operation Finland PORI 72 1511
Vaskiluodon Voima Oy, Seinäjoen turvevoimalaitos
Operation Finland SEINÄJOKI 48 1018
Oy Alholmens Kraft Ab Operation Finland PIETARSAARI 41 872
Vaskiluodon Voima Oy Operation Finland VAASA 45 934

44
Name of plant Status Country Municipality YOLL WLD
LAHTI ENERGIA OY, KYMIJÄRVEN VOIMALAITOS Operation Finland LAHTI 81 1705
Mäntän Energia Oy, Voimalaitos Operation Finland MÄNTTÄ 11 234
Stora Enso Oyj, Veitsiluodon voimalaitos Operation Finland KEMI 34 713
KUOPION ENERGIA OY HAAPANIEMEN VOIMALAITOS
Operation Finland KUOPIO 85 1804
Porin Prosessivoima Oy Operation Finland PORI 24 513
LAANILAN VOIMA OY, Kemiran tehtaiden voimalaitos
Operation Finland OULU 12 261
Jyväskylän Voima Oy, Keljonlahden voimalaitos Operation Finland JYVÄSKYLÄ 25 518
EDF BOUCHAIN Operation France BOUCHAIN 472 9984
E.ON - Centrale d'HORNAING Operation France HORNAING 195 4124
EDF BLENOD Operation France PONT-A-MOUSSON 2668 56429
E.ON Emile HUCHET Operation France SAINT-AVOLD 744 15720
EdF VITRY-SUR-SEINE Operation France VITRY-SUR-SEINE 633 13402
E.ON - Centrale de LUCY Operation France MONTCEAU-LES-MINES
184 3894
EDF LE HAVRE Operation France HAVRE 1919 40612
E.ON MEYREUIL Operation France MEYREUIL 518 10908
EDF LA MAXE Operation France WOIPPY 1320 27925
EdF Cordemais Operation France CORDEMAIS 1265 26729
BAYER AG Lanxess AG Operation Germany Krefeld 146 3100
Braunschweiger Versorgungs AG, Heizkraftwerk Mitte
Operation Germany Braunschweig 81 1713
CURRENTA GmbH & Co. OHG (CHEMPARK) Operation Germany Leverkusen 223 4723
E.ON KRAFTWERK SCHOLVEN Operation Germany Gelsenkirchen 1378 29202
E.ON Kraftwerk Staudinger Operation Germany Großkrotzenburg 511 10766

45
Name of plant Status Country Municipality YOLL WLD
E.ON Kraftwerke GmbH Operation Germany Wilhelmshaven 365 7706
E.ON Kraftwerke GmbH Operation Germany Datteln 267 5656
E.ON Kraftwerke GmbH - Kraftwerk Schkopau Operation Germany Korbetha 817 17253
E.ON Kraftwerke GmbH Kraftwerk Buschhaus Operation Germany Helmstedt 313 6616
E.ON Kraftwerke GmbH Kraftwerk Heyden Operation Germany Petershagen 432 9120
E.ON Kraftwerke GmbH Kraftwerk Knepper Operation Germany Dortmund 150 3181
EnBW Altbach Operation Germany Altbach 330 6963
EnBW Bexbach Operation Germany Bexbach 242 5119
EnBW Heilbronn Operation Germany Heilbronn 559 11802
EnBW Karlsruhe Operation Germany Karlsruhe 325 6870
EnBW Walheim Operation Germany Walheim 58 1232
EVO-Heizkraftwerk, Offenbach Operation Germany Offenbach a. M., St. 44 924
Evonik Fenne Operation Germany Völklingen 447 9425
Evonik Steag AG Kraftwerk West Operation Germany Voerde 310 6562
Evonik Steag GmbH Heizkraftwerk Herne Operation Germany Herne 366 7755
Evonik Steag GmbH Heizkraftwerk Walsum Operation Germany Duisburg 312 6622
Evonik Steag GmbH KW Lünen Operation Germany Lünen 250 5302
Evonik Weiher Operation Germany Quierschied 260 5492
GDF SUEZ Kraftwerk Farge GmbH Operation Germany Bremen 113 2397
GDF SUEZ Kraftwerk Zolling GmbH Operation Germany Zolling 292 6157
Gemeinschaftskraftwerk Kiel GmbH GKK Operation Germany Kiel 158 3333
Gemeinschaftskraftwerk Veltheim GmbH Operation Germany Porta Westfalica 171 3611
GKH Gemeinschaftskraftwerk Hannover Operation Germany Hannover 215 4544
Großkraftwerk Mannheim AG / Elektrizitätswerk Operation Germany Mannheim 759 15996
Heizkraftwerk Nord II Operation Germany Chemnitz 166 3513
Infracor GmbH Operation Germany Marl 304 6453
KNG Kraftwerks- und Netzgesellschaft mbH Kraftwerk Rostock
Operation Germany Rostock 210 4410
Kraftwerk Boxberg Operation Germany Boxberg/O.L. 1756 37018

46
Name of plant Status Country Municipality YOLL WLD
Kraftwerk Mehrum GmbH Operation Germany Hohenhameln 372 7861
Kraftwerk Schwarze Pumpe Operation Germany Spremberg 1175 24817
Mainova, HKW West Operation Germany Frankfurt am Main, St.
182 3837
Mark-E Aktiengesellschaft Operation Germany Werdohl 283 5993
MIBRAG Deuben Operation Germany Deuben 239 5053
MIBRAG Mumsdorf Operation Germany Elsteraue 227 4802
MIBRAG Wählitz Operation Germany Wählitz 43 906
RWE Power AG Kraftwerk Frimmersdorf Operation Germany Grevenbroich 1754 37182
RWE Power AG Kraftwerk Goldenberg Operation Germany Hürth 188 3982
RWE Power AG Kraftwerk Ibbenbüren Operation Germany Ibbenbüren 442 9340
RWE Power AG Kraftwerk Neurath Operation Germany Grevenbroich 1712 36291
RWE Power AG Kraftwerk Niederaußem Operation Germany Bergheim 2881 61075
RWE Power AG Kraftwerk Weisweiler Operation Germany Eschweiler 1844 39091
RWE Power AG Kraftwerk Werne Operation Germany Werne 355 7528
RWE Power AG Kraftwerk Westfalen Operation Germany Hamm 281 5957
RWE Power AG Kraftwerke Region West Operation Germany Duisburg 147 3115
RWE Power AG Kraftwerke Region West Operation Germany Duisburg 171 3620
Stadtwerke Duisburg AG Heizkraftwerk I Operation Germany Duisburg 40 856
Stadtwerke Flensburg GmbH Operation Germany Flensburg 68 1440
STEAG und RWE Power GKW Bergkamen A oHG Operation Germany Bergkamen 491 10402
swb Erzeugung GmbH & Co KG / Heizkraftwerk Hafen
Operation Germany Bremen 229 4834
swb Erzeugung GmbH & Co KG / Heizkraftwerk Hastedt
Operation Germany Bremen 76 1612
SWM Heizkraftwerk Nord Operation Germany Unterföhring 266 5607
TWK Technische Werke Kaiserslautern Versorgungs-AG
Operation Germany Kaiserslautern 60 1263
Vattenfall Europe Generation AG Kraftwerk Jänschwalde
Operation Germany Peitz 3986 (3949) 84149 (84196)

47
Name of plant Status Country Municipality YOLL WLD
Vattenfall Europe Generation AG Kraftwerk Lippendorf
Operation Germany Böhlen 2272 47995
Vattenfall Europe Wärme HKW Klingenberg Operation Germany Berlin 176 3711
Vattenfall Europe Wärme AG Kraftwerk Tiefstack Operation Germany Hamburg 99 2089
Vattenfall Europe Wärme HKW Moabit Operation Germany Berlin 60 1270
Vattenfall Europe Wärme HKW Reuter-West Operation Germany Berlin 302 6347
Vattenfall Wedel Operation Germany Wedel 138 2913
Volkswagen AG Operation Germany Wolfsburg 344 7241
VSE Kraftwerk Ensdorf Operation Germany Ensdorf 179 3788
Wuppertaler Stadtwerke AG - HKW Elberfeld Operation Germany Wuppertal 61 1300
E.ON Datteln Construction Germany Datteln 989 (894) 20965 (19136)
EnBW Karlsruhe-Rheinhafen Construction Germany Karlsruhe 536 (495) 11322 (10565)
Evonik STEAG GmbH Duisburg-Walsum (Block 10)
Construction Germany Duisburg 752 15929
GDF Suez & BKW Energie Wilhelmshaven Construction Germany Wilhelmshaven 251 (231) 5305 (4931)
GKM AG Mannheim, Neckarau Block 9 Construction Germany Mannheim 512 (475) 10817 (10125)
RWE Hamm-Uentrop Construction Germany Hamm 1527 (1414) 32349 (30270)
Trianel Power Lünen Construction Germany Lünen 771 (769) 16332 (16472)
Vattenfall Europe AG, Berlin Hamburg-Moorburg Construction Germany Hamburg 583 (263) 12324 (5618)
RWE Neurath Connected to grid Germany 2290 48531
Vattenfall Boxberg Connected to grid Germany Boxberg/Oberlausitz 565 11922
Dow Chemical Stade Applying for permission Germany Stade 798 (891) 16880 (19021)
Mibrag Profen Applying for permission Germany Elsteraue 279 (217) 5894 (4616)
RWE Niederaußem (Bergheim) Applying for permission Germany Bergheim 996 (1291) 21100 (27638)
Infracor Marl Announced Germany Marl 419 (426) 8876 (9121)
RWE Arneburg Announced Germany Arneburg 592 (541) 12485 (11526)
PPC Ptolemaida V Permitted Greece 1149 (1024) 24213 (21803)

48
Name of plant Status Country Municipality YOLL WLD
PPC S.A. SES PTOLEMAIDAS Operation Greece PTOLEMAIDA 713 15004
PPC S.A. SES KARDIAS Operation Greece KARDIA, YPSILANTIS 850 17731
PPC S.A. SES LIPTOL Operation Greece PTOLEMAIDA 23 489
PPC S.A. SES AMYNTAIOY Operation Greece AMYNTAIO 2887 61093
PPC S.A. SES MELITIS Operation Greece FLORINA 173 3649
PPC S.A. SES MEGALOPOLIS B’ Operation Greece MEGALOPOLIS 210 4420
PPC S.A. SES MEGALOPOLIS A’ Operation Greece MEGALOPOLI 3627 76803
PPC S.A. SES AGIOY DHMHTRIOY Operation Greece AGIOS DIMITRIOS, ELLISPONTOS
3812 (3777) 80372 (80423)
PPC Meliti II, Florina Applying for permits Greece 862 (768) 18150 (16340)
PPC Agios Dimitrios 6/Ptolemais Announced Greece 1149 (953) 24213 (20285)
Vértesi Erőmű Zrt. Oroszlány Operation Hungary Oroszlány 280 5899
RWE AG Mátrai Erőmű Zrt. Operation Hungary Visonta 1232 25901
Wildhorse Energy Mecsek Hills UCG Applying for permits Hungary 272 (270) 5723 (5732)
Electricity Supply Board (Moneypoint) Operation Ireland County Clare 680 14339
Edenderry Power Limited Operation Ireland County Offaly 122 2582
E.ON Fiume Santo Permitted Italy 146 (144) 3059 (3064)
A2A S.p.A. MONFALCONE Operation Italy MONFALCONE 490 10330
Tirreno Vado Ligure Operation Italy QUILIANO 1304 27585
ENEL Genova Operation Italy GENOVA 316 6678
ENEL LA SPEZIA Operation Italy LA SPEZIA 785 16585
Unità di Bussines Bastardo - Centrale Pietro Vannucci
Operation Italy GUALDO CATTANEO 80 1684
Enel Produzione SpA - Centrale di Torrevaldaliga Operation Italy CIVITAVECCHIA 154 3218

49
Name of plant Status Country Municipality YOLL WLD
Nord
ENEL Federico II (BR SUD) Operation Italy BRINDISI 839 (831) 17624 (17629)
EDIPOWER Brindisi Operation Italy BRINDISI 107 2259
E.ON FIUME SANTO Operation Italy SASSARI 510 10745
Enel Produzione SpA – Centrale Sulcis (Grazia Deledda)
Operation Italy PORTOSCUSO 277 5850
A2A CTEC LAMARMORA Operation Italy BRESCIA 92 1953
ENEL Fusina Operation Italy VENEZIA 416 8777
Enel Porto Tolle Applying for permits Italy 908 (969) 19181 (20684)
Tirreno Power Vado Ligure Applying for permits Italy 440 (436) 9305 (9316)
Repower & Hera Saline Joniche Applying for permits Italy 289 (276) 6066 (5858)
KEK Kosovo C Announced Kosovo 372 (369) 7838 (7858)
EPCG Pljevlja II Unclear Montenegro 160 3371
“Maoce Announced Montenegro 348 7328
E.ON & GDF Suez Maasvlakte Port Under construction Netherlands 268 (289) 5682 (6203)
GDF Suez Maasvlakte Port Under construction Netherlands 147 (167) 3129 (3570)
RWE & Essent Eemshaven Under construction Netherlands 388 (422) 8244 (9046)
Essent Energie Productie BV (Amer) Operation Netherlands Geertruidenberg 453 9629
EPZ NV Borssele Operation Netherlands Borssele 201 4263
Nuon Power Generation BV (Buggenum) Operation Netherlands Haelen 47 1008
Electrabel Nederland NV (Gelderland) Operation Netherlands Nijmegen 243 5154
E.On Benelux NV (Maasvlakte) Operation Netherlands Maasvlakte Rotterdam
419 8892
Nuon Power Generation BV (Hemweg) Operation Netherlands Amsterdam 113 2391

50
Name of plant Status Country Municipality YOLL WLD
EDF Rybnik Under construction Poland 854 (898) 18057 (19193)
ENEA Kozienice Permitted Poland 754 (768) 15906 (16352)
Kogeneracja S.A. Siechnice Permitted Poland 87 (87) 1837 (1852)
Energa Ostroleka Ostroleka Permitted Poland 799 (734) 16849 (15648)
Tauron Jaworzno 3 Permitted Poland 501 (529) 10593 (11302)
PGE Turow Operation Poland Bogatynia 5899 124837
Zespół Wrocław Operation Poland Wrocław 605 12787
PGE Wrotków Operation Poland Lublin 84 1775
PGE Bełchatów Operation Poland Rogowiec 10782 (10680) 227881 (227901)
SFW Energia Sp. z o.o Zduńska Wola Operation Poland Zduńska Wola 47 990
Dalkia Łódź S.A. Elektrociepłownia nr 3 Operation Poland Łódź 590 12470
Dalkia Łódź S.A. Elektrociepłownia nr 2 Operation Poland Łódź 312 6589
Dalkia Łódź S.A. Elektrociepłownia nr 4 Operation Poland Łódź 578 12218
Elektrociepłownia "KRAKÓW" S.A. Operation Poland Kraków 970 20516
Elektrownia Skawina S.A. Operation Poland Skawina 689 14572
Południowy Koncern Energetyczny S.A., Elektrownia Siersza w Trzebini
Operation Poland Trzebinia 1023 21657
Elektrownia "KOZIENICE" S.A. Operation Poland Świerże Górne 5178 109326
Vattenfall Siekierki Operation Poland Warszawa 2208 46649
Vattenfall Żerań Operation Poland Warszawa 940 19844
ENERGA Elektrownie Ostrołęka S.A. Operation Poland Ostrołęka 1371 28964
PGE Elektrownia Opole S.A. Operation Poland Brzezie 1175 24844
Elektrociepłownia Mielec Sp. z o.o. Operation Poland Mielec 113 2394
Elektrownia "Stalowa Wola" S.A. Operation Poland Stalowa Wola 727 15364
Elektrociepłownia Białystok S.A., Elektrociepłownia
Operation Poland Białystok 240 5069
Elektrociepłownia "Będzin" S.A. Operation Poland Będzin 397 8391

51
Name of plant Status Country Municipality YOLL WLD
Elektrociepłownia Chorzów "ELCHO" Sp. z o.o. Operation Poland Chorzów 207 4375
Elektrownia "RYBNIK" S.A. Operation Poland Rybnik 3882 82137
TAURON Halemba Operation Poland Ruda Śląska 271 5727
TAURON Łagisza Będzin Operation Poland Będzin 1463 30941
TAURON Jaworzno III - Elektrownia II Operation Poland Jaworzno 310 6569
TAURON Łaziska Górne Operation Poland Łaziska Górne 1453 30732
TAURON Bielsko-Biała EC1 Operation Poland Bielsko-Biała 223 4725
TAURON Bielsko-Północ EC2 Operation Poland Czechowice-Dziedzice 163 3447
TAURON Elektrownia Jaworzno III - Elektrownia III
Operation Poland Jaworzno 1454 30758
TAURON Katowice Operation Poland Katowice 264 5580
Przedsiebiorstwo Energetyczne "Megawat" Sp. z o.o., Zakład Z-2 "Knurów"
Operation Poland Knurów 76 1618
Spółka Energetyczna "Jastrzębie" S.A., Elektrociepłownia "Zofiówka"
Operation Poland Jastrzębie Zdrój 202 4271
Spółka Energetyczna "Jastrzębie" S.A., Elektrociepłownia "Moszczenica"
Operation Poland Jastrzębie Zdrój 95 2006
Zakład Elektroenergetyczny H.CZ. "ELSEN" S.A. Operation Poland Częstochowa 74 1559
Zakłady Energetyki Cieplnej S.A., Wydział 5 "Wieczorek"
Operation Poland Katowice 52 1107
Fortum Bytom S..A., Elektrociepłownia Miechowice
Operation Poland Bytom 272 5757
Elektrownia Połaniec Spółka Akcyjna - Grupa GDF SUEZ Energia Polska
Operation Poland Zawada 1959 41307
Dalkia Poznań Zespół Elektrociepłowni S.A., Elektrociepłownia EC II Karolin
Operation Poland Poznań 582 12290
Zespól Adamów Operation Poland Turek 1950 41205
Zespół Konin Operation Poland Konin 272 5756
Miejska Energetyka Cieplna Spółka z o.o., Ciepłownia DPM
Operation Poland Koszalin 33 701
Miejska Energetyka Cieplna Spółka z o.o., Operation Poland Koszalin 18 391
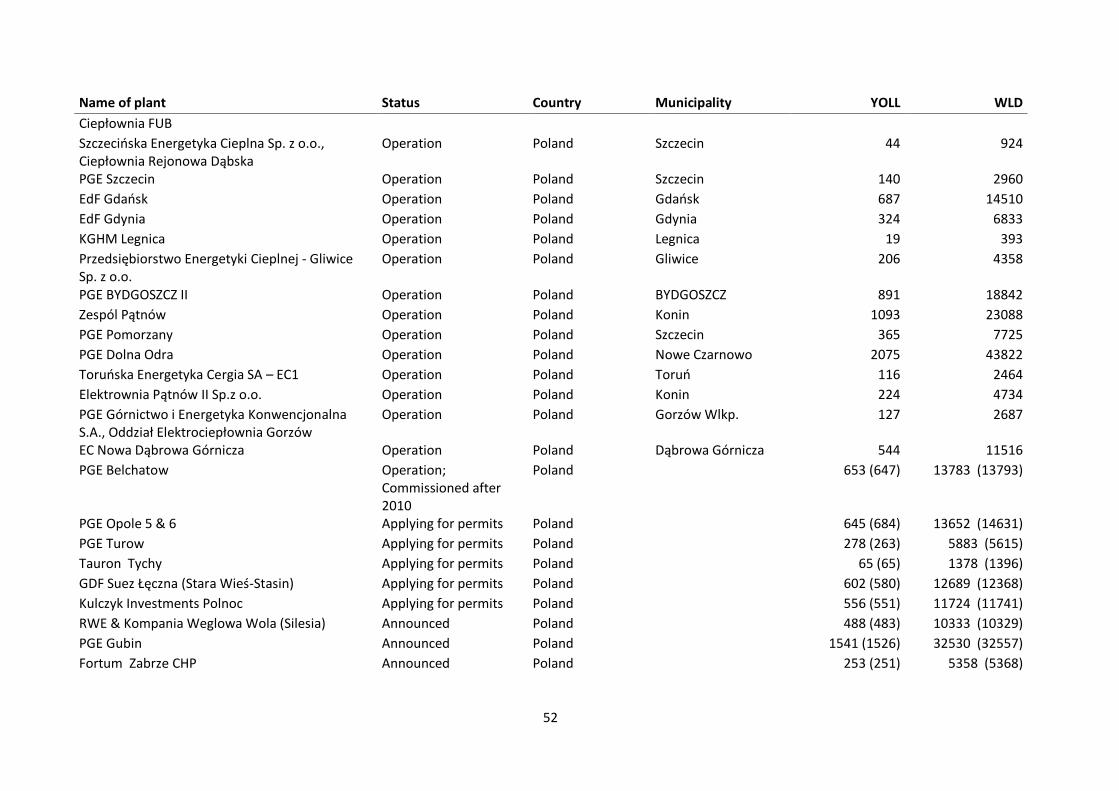
52
Name of plant Status Country Municipality YOLL WLD
Ciepłownia FUB
Szczecińska Energetyka Cieplna Sp. z o.o., Ciepłownia Rejonowa Dąbska
Operation Poland Szczecin 44 924
PGE Szczecin Operation Poland Szczecin 140 2960
EdF Gdańsk Operation Poland Gdańsk 687 14510
EdF Gdynia Operation Poland Gdynia 324 6833
KGHM Legnica Operation Poland Legnica 19 393
Przedsiębiorstwo Energetyki Cieplnej - Gliwice Sp. z o.o.
Operation Poland Gliwice 206 4358
PGE BYDGOSZCZ II Operation Poland BYDGOSZCZ 891 18842
Zespól Pątnów Operation Poland Konin 1093 23088
PGE Pomorzany Operation Poland Szczecin 365 7725
PGE Dolna Odra Operation Poland Nowe Czarnowo 2075 43822
Toruńska Energetyka Cergia SA – EC1 Operation Poland Toruń 116 2464
Elektrownia Pątnów II Sp.z o.o. Operation Poland Konin 224 4734
PGE Górnictwo i Energetyka Konwencjonalna S.A., Oddział Elektrociepłownia Gorzów
Operation Poland Gorzów Wlkp. 127 2687
EC Nowa Dąbrowa Górnicza Operation Poland Dąbrowa Górnicza 544 11516
PGE Belchatow Operation; Commissioned after 2010
Poland 653 (647) 13783 (13793)
PGE Opole 5 & 6 Applying for permits Poland 645 (684) 13652 (14631)
PGE Turow Applying for permits Poland 278 (263) 5883 (5615)
Tauron Tychy Applying for permits Poland 65 (65) 1378 (1396)
GDF Suez Łęczna (Stara Wieś-Stasin) Applying for permits Poland 602 (580) 12689 (12368)
Kulczyk Investments Polnoc Applying for permits Poland 556 (551) 11724 (11741)
RWE & Kompania Weglowa Wola (Silesia) Announced Poland 488 (483) 10333 (10329)
PGE Gubin Announced Poland 1541 (1526) 32530 (32557)
Fortum Zabrze CHP Announced Poland 253 (251) 5358 (5368)

53
Name of plant Status Country Municipality YOLL WLD
Central Termoeléctrica Sines Operation Portugal SINES 169 3525
Central Termoeléctrica do Pego Operation Portugal ABRANTES 38 796
SC CET ARAD SA Operation Romania ARAD 817 17289
SC CET GOVORA SA Operation Romania RAMNICU VALCEA 2420 51169
Sucursala Romag Termo Operation Romania DROBETA TURNU SEVERIN
3397 71877
COMPLEXUL ENERGETIC TURCENI Operation Romania TURCENI 8670 (8593) 183310 (183452)
COMPLEXUL ENERGETIC ROVINARI Operation Romania ROVINARI 6063 (6008) 128157 (128201)
SC ELECTROCENTRALE DEVA SA Mintia Operation Romania MINTIA 2436 51412
S.C. LUKOIL ENERGY&GAS ROMANIA S.R.L. Operation Romania PLOIESTI 65 1367
SC ELECTROCENTRALE ORADEA SA Operation Romania ORADEA 2186 46232
SC CET SA BACAU I Operation Romania BACAU 290 6122
CET TIMISOARA SUD Operation Romania TIMISOARA 166 3507
PAROSENI Operation Romania VULCAN 1131 23932
SC TERMICA SA SUCEAVA Operation Romania SUCEAVA 105 2214
SC CET IASI SA CET 2 HOLBOCA Operation Romania HOLBOCA 139 2938
SUCURSALA ELECTROCENTRALE ISALNITA Operation Romania ISALNITA 2101 (2082) 44465 (44489)
SUCURSALA ELECTROCENTRALE CRAIOVA II Operation Romania CRAIOVA 1884 (1867) 39828 (39852)
Enel Galati Applying for permits Romania 439 (443) 9251 (9433)
Electrocentrale SA Paroseni Announced Romania 149 (148) 3140 (3145)
RAAN Halanga, Dr. Turnu Severin Announced Romania 298 (296) 6280 (6290)
SC Doicesti & China Huadian Engineering Co. Doicesti
Announced Romania 373 (370) 7850 (7861)
Braila Power Announced Romania 558 (553) 11742 (11764)
Rovinari Announced Romania 373 (370) 7850 (7862)
Craiova II/Isalnita Announced Romania 373 (370) 7850 (7860)
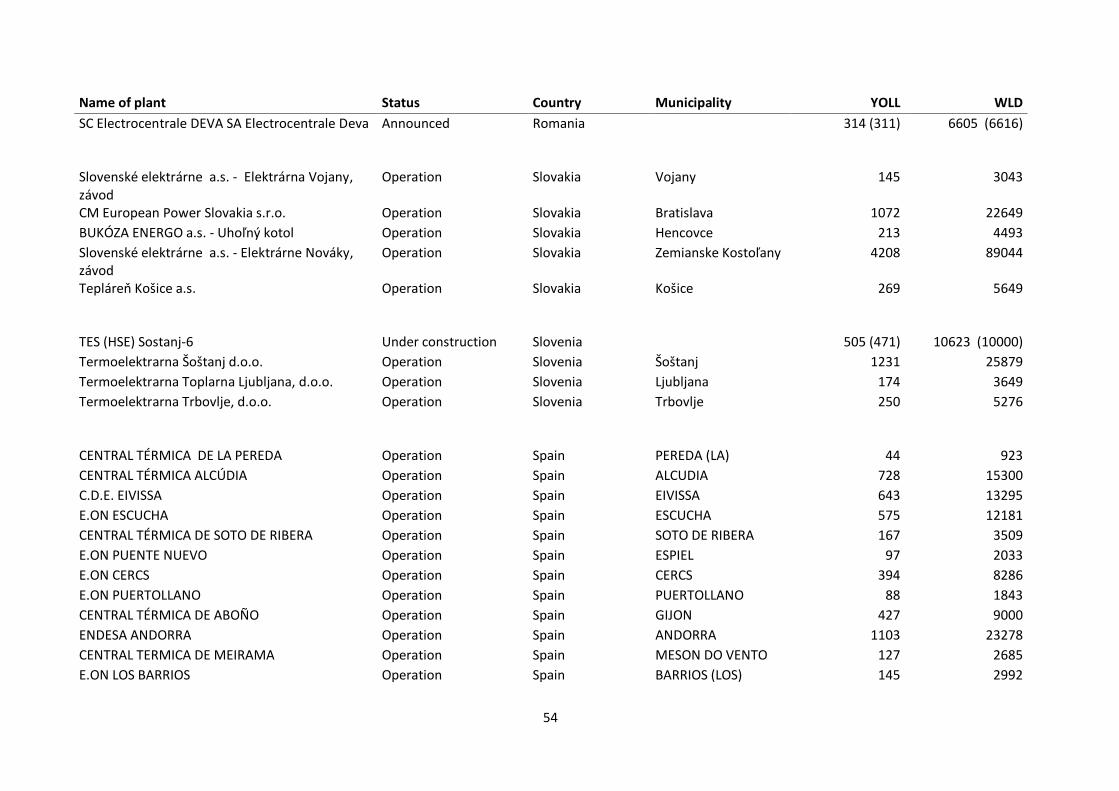
54
Name of plant Status Country Municipality YOLL WLD
SC Electrocentrale DEVA SA Electrocentrale Deva Announced Romania 314 (311) 6605 (6616)
Slovenské elektrárne a.s. - Elektrárna Vojany, závod
Operation Slovakia Vojany 145 3043
CM European Power Slovakia s.r.o. Operation Slovakia Bratislava 1072 22649
BUKÓZA ENERGO a.s. - Uhoľný kotol Operation Slovakia Hencovce 213 4493
Slovenské elektrárne a.s. - Elektrárne Nováky, závod
Operation Slovakia Zemianske Kostoľany 4208 89044
Tepláreň Košice a.s. Operation Slovakia Košice 269 5649
TES (HSE) Sostanj-6 Under construction Slovenia 505 (471) 10623 (10000)
Termoelektrarna Šoštanj d.o.o. Operation Slovenia Šoštanj 1231 25879
Termoelektrarna Toplarna Ljubljana, d.o.o. Operation Slovenia Ljubljana 174 3649
Termoelektrarna Trbovlje, d.o.o. Operation Slovenia Trbovlje 250 5276
CENTRAL TÉRMICA DE LA PEREDA Operation Spain PEREDA (LA) 44 923
CENTRAL TÉRMICA ALCÚDIA Operation Spain ALCUDIA 728 15300
C.D.E. EIVISSA Operation Spain EIVISSA 643 13295
E.ON ESCUCHA Operation Spain ESCUCHA 575 12181
CENTRAL TÉRMICA DE SOTO DE RIBERA Operation Spain SOTO DE RIBERA 167 3509
E.ON PUENTE NUEVO Operation Spain ESPIEL 97 2033
E.ON CERCS Operation Spain CERCS 394 8286
E.ON PUERTOLLANO Operation Spain PUERTOLLANO 88 1843
CENTRAL TÉRMICA DE ABOÑO Operation Spain GIJON 427 9000
ENDESA ANDORRA Operation Spain ANDORRA 1103 23278
CENTRAL TERMICA DE MEIRAMA Operation Spain MESON DO VENTO 127 2685
E.ON LOS BARRIOS Operation Spain BARRIOS (LOS) 145 2992

55
Name of plant Status Country Municipality YOLL WLD
ENDESA COMPOSTILLA Operation Spain CUBILLOS DEL SIL 470 9850
ENDESA AS PONTES Operation Spain PONTES DE GARCIA RODRIGUEZ (AS)
415 8710
ENDESA LITORAL DE ALMERÍA Operation Spain CARBONERAS 776 16298
IBERDROLA DE LADA Operation Spain LANGREO/LLANGRÉU 69 1446
IBERDROLA PASAIA Operation Spain PASAIA 113 2372
Fortum VÄRTAVERKET Operation Sweden STOCKHOLM 32 679
Vattenfall Uppsala Operation Sweden UPPSALA 27 582
Kraftvärmeverket i Linköping Operation Sweden LINKÖPING 21 449
Ayas & Ticaret Under construction Turkey Adana İli, Yumurtalık İlçesi
607 12752
Enerjisa Under construction Turkey Tufanbeyli-Adana 1012 (1004) 21198 (21244)
3S & Maden 'Yıldızlar Termik Santrali' Under construction Turkey Çankırı/Yıldızlar Termik Santrali
389 8163
Atlas Enerji Under construction Turkey Hatay ili, İskenderun ilçesi
1227 25779
Aksa Göynük Enerji Permitted Turkey Bolu ili, Göynük ilçesi 281 5908
Hema Elektrik Permitted Turkey Amasra, Bartin 1062 22312
Çalık NTF Elektrik Permitted Turkey Çankırı 174 3652
Enka Enerji Permitted Turkey İzmir İli, Aliağa İlçesi 818 (812) 17186 (17246)
Adalurya Elektrik 'Yunus Emre Termik Santrali' Permitted Turkey Koyunağılı Milhalıççık Eskişehir/ Yunus Emre Termik Santrali
307 6445
Tam Enerji Permitted Turkey Sivas ili, Kangal ilçesi, Etyemez Köyü Mevkii
102 2148
Galata Enerji & Ticaret Permitted Turkey Şırnak ili, Toptepe köyü, Avgamasya
281 5908
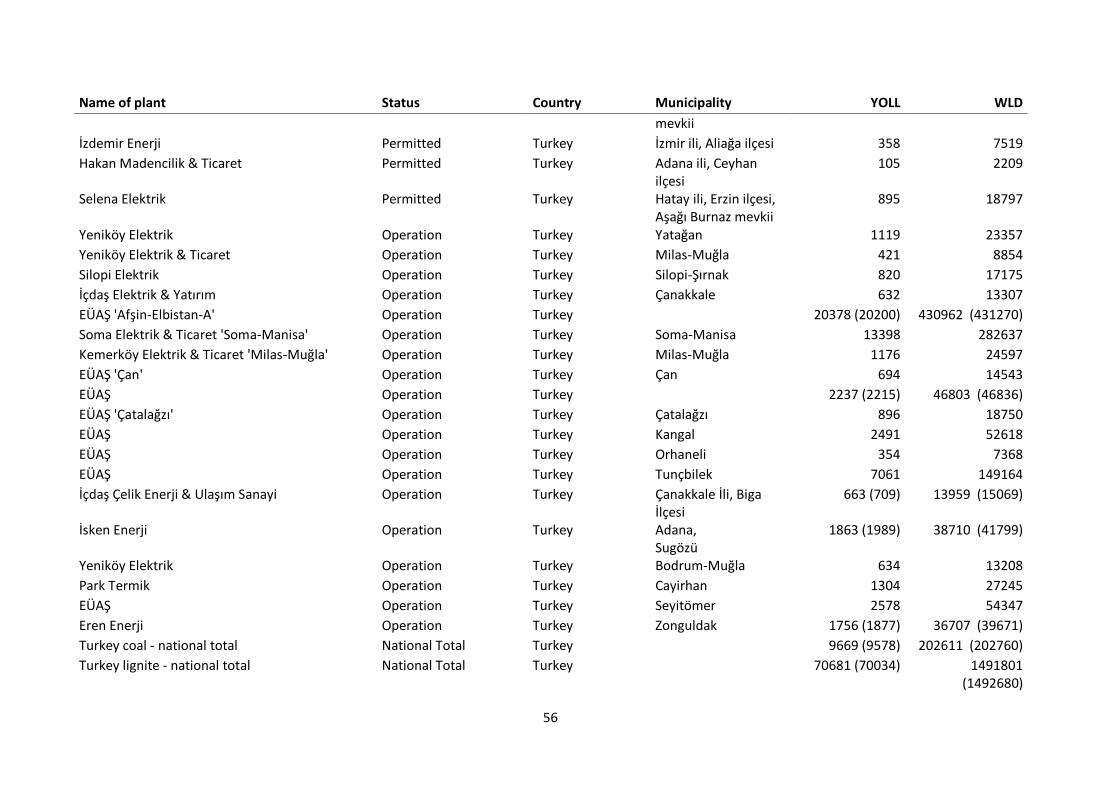
56
Name of plant Status Country Municipality YOLL WLD
mevkii
İzdemir Enerji Permitted Turkey İzmir ili, Aliağa ilçesi 358 7519
Hakan Madencilik & Ticaret Permitted Turkey Adana ili, Ceyhan ilçesi
105 2209
Selena Elektrik Permitted Turkey Hatay ili, Erzin ilçesi, Aşağı Burnaz mevkii
895 18797
Yeniköy Elektrik Operation Turkey Yatağan 1119 23357
Yeniköy Elektrik & Ticaret Operation Turkey Milas-Muğla 421 8854
Silopi Elektrik Operation Turkey Silopi-Şırnak 820 17175
İçdaş Elektrik & Yatırım Operation Turkey Çanakkale 632 13307
EÜAŞ 'Afşin-Elbistan-A' Operation Turkey 20378 (20200) 430962 (431270)
Soma Elektrik & Ticaret 'Soma-Manisa' Operation Turkey Soma-Manisa 13398 282637
Kemerköy Elektrik & Ticaret 'Milas-Muğla' Operation Turkey Milas-Muğla 1176 24597
EÜAŞ 'Çan' Operation Turkey Çan 694 14543
EÜAŞ Operation Turkey 2237 (2215) 46803 (46836)
EÜAŞ 'Çatalağzı' Operation Turkey Çatalağzı 896 18750
EÜAŞ Operation Turkey Kangal 2491 52618
EÜAŞ Operation Turkey Orhaneli 354 7368
EÜAŞ Operation Turkey Tunçbilek 7061 149164
İçdaş Çelik Enerji & Ulaşım Sanayi Operation Turkey Çanakkale İli, Biga İlçesi
663 (709) 13959 (15069)
İsken Enerji Operation Turkey Adana, Sugözü
1863 (1989) 38710 (41799)
Yeniköy Elektrik Operation Turkey Bodrum-Muğla 634 13208
Park Termik Operation Turkey Cayirhan 1304 27245
EÜAŞ Operation Turkey Seyitömer 2578 54347
Eren Enerji Operation Turkey Zonguldak 1756 (1877) 36707 (39671)
Turkey coal - national total National Total Turkey 9669 (9578) 202611 (202760)
Turkey lignite - national total National Total Turkey 70681 (70034) 1491801 (1492680)

57
Name of plant Status Country Municipality YOLL WLD
Suez Güney Enerji 'Ada Enerji Santralı' Applying for permits Turkey Adana ili, Yumurtalık İlçesi, Gölovası, Ada Enerji Santralı
1281 26910
Batı Karadeniz Elektrik 'Kireçlik Termik Santralı' Applying for permits Turkey Zonguldak ili, Ereğli ilçesi, Kireçli koyu mevkii /Kireçlik Termik Santralı
1147 (1138) 24099 (24167)
Batı Karadeniz Elektrik Applying for permits Turkey Bartın ili, Amasra ilçesi, Gömü köyü mevkii /Bartın Termik Santralı
1147 24099
Buğra Enerji Applying for permits Turkey Mersin ili, Gülnar ilçesi
357 7491
Kamertan Madencilik & EÜAŞ Applying for permits Turkey Hatay ili, Dörtyol ilçesi, Yeniyurt mevkii
315 6627
İçtaş Elektrik Applying for permits Turkey Adana ili, Yumurtalık ilçesi
574 12049
Modern Enerji Applying for permits Turkey Zonguldak ili, Çatalağzı beldesi
306 6426
Karat Elektrik & Ticaret Applying for permits Turkey Balıkesir İli, Bandırma İlçesi
1147 24099
Diler Elektrik Applying for permits Turkey Adana ili, Yumurtalık ilçesi
574 12049
Bereket Enerji 'Orta Anadolu Termik Santralı' Applying for permits Turkey Çankırı ili, Orta ilçesi / Orta Anadolu Termik Santralı
131 2751
Şırnak Elektrik 'Silopi Elektrik Santralı' Applying for permits Turkey Şırnak ili, Silopi ilçesi, Sereder Sırtı Mevkii / Silopi Elektrik Santralı
131 2751
Yıldırım Enerji & SHENHUA GUOHUA Applying for permits Turkey İskenderun 1912 40165
Teyo yatırım & Weiqu Energy Investment Applying for permits Turkey Tufanbeyli 574 12049
Emba Elektrik Applying for permits Turkey Kırklareli ili, 1178 24742

58
Name of plant Status Country Municipality YOLL WLD
demirköy ilçesi, begendik köyü
Emba Elektrik Applying for permits Turkey Adana ili, yumurtalık ilçesi, Sugözü köyü
1178 24742
Tosyalı Elektrik Applying for permits Turkey Hatay İskenderun
1182 24822
HEMA Elektrik AŞ Applying for permits Turkey Amasra, Bartin 1262 (1251) 26509 (26542)
HEMA Elektrik AŞ Applying for permits Turkey Zonguldak, Kandilli 749 15656
Anadolu Termik Santralleri A.Ş. Applying for permits Turkey Sinop ili, Gerze ilçesi 284 (281) 5950 (5957)
TGR Enerji & Inter Rao Applying for permits Turkey Balıkesir İli, Gönen İlçesi
307 6445
Tabiat Enerji 'Yeşilovacık Termik Santralı' Applying for permits Turkey Mersin ili, Silifke ilçesi, Yeşilovacık beldesi / Yeşilovacık Termik Santralı
1262 (1251) 26509 (26546)
Socar Power Enerji 'Socar Termik Santralı' Applying for permits Turkey İzmir ili, Aliağa mevkii 600 Mw Socar Power Termik Santralı
583 12250
İpekyolu Enerji & Ticaret Applying for permits Turkey Adana ili, Yumurtalık ilçesi
588 12351
Atagür Enerji & Ticaret Applying for permits Turkey Adana ili, Yumurtalık ilçesi
1415 29722
Yıldırım Enerji Yatırımları Applying for permits Turkey Elazığ ili, Kovancılar ilçesi, Yarımca beldesi
191 4016
Cenal Elektrik Applying for permits Turkey Çanakkale ili, Biga ilçesi, Karabiga beldesi
1319 27714
Enyat Enerji & Ticaret Applying for permits Turkey Samsun ili, Havza ilçesi, Kalete Tepe mevkii
143 3012
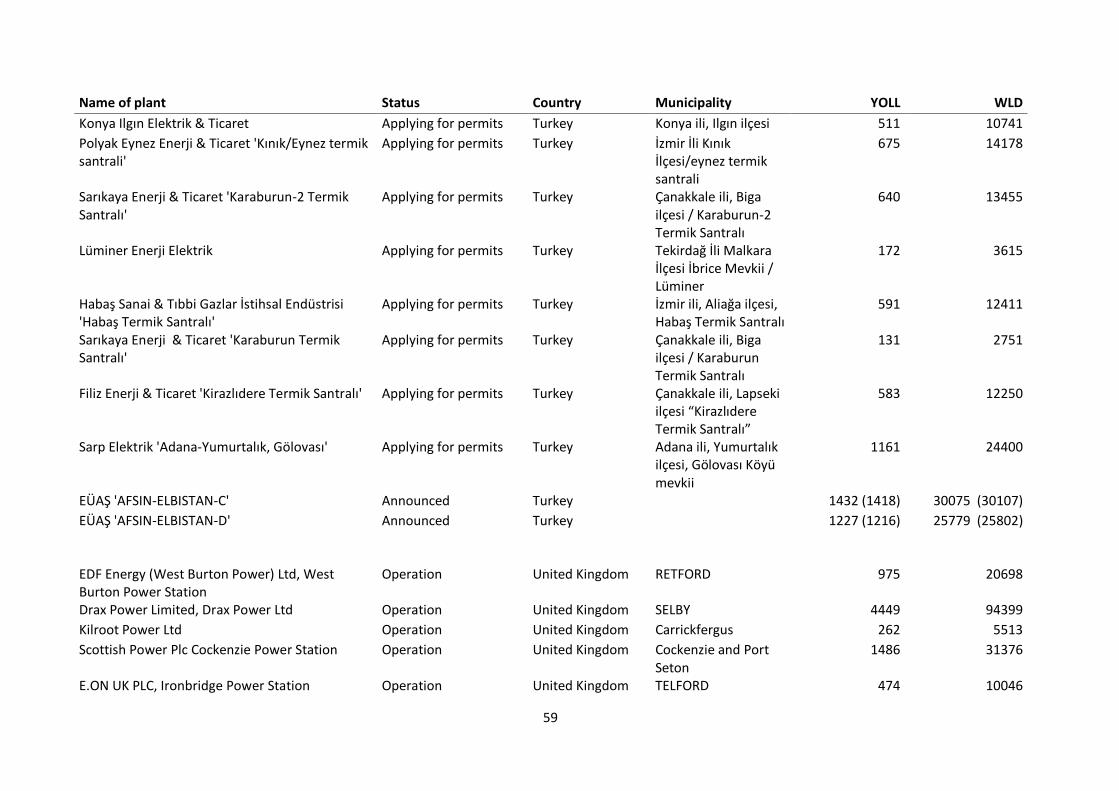
59
Name of plant Status Country Municipality YOLL WLD
Konya Ilgın Elektrik & Ticaret Applying for permits Turkey Konya ili, Ilgın ilçesi 511 10741
Polyak Eynez Enerji & Ticaret 'Kınık/Eynez termik santrali'
Applying for permits Turkey İzmir İli Kınık İlçesi/eynez termik santrali
675 14178
Sarıkaya Enerji & Ticaret 'Karaburun-2 Termik Santralı'
Applying for permits Turkey Çanakkale ili, Biga ilçesi / Karaburun-2 Termik Santralı
640 13455
Lüminer Enerji Elektrik Applying for permits Turkey Tekirdağ İli Malkara İlçesi İbrice Mevkii / Lüminer
172 3615
Habaş Sanai & Tıbbi Gazlar İstihsal Endüstrisi 'Habaş Termik Santralı'
Applying for permits Turkey İzmir ili, Aliağa ilçesi, Habaş Termik Santralı
591 12411
Sarıkaya Enerji & Ticaret 'Karaburun Termik Santralı'
Applying for permits Turkey Çanakkale ili, Biga ilçesi / Karaburun Termik Santralı
131 2751
Filiz Enerji & Ticaret 'Kirazlıdere Termik Santralı' Applying for permits Turkey Çanakkale ili, Lapseki ilçesi “Kirazlıdere Termik Santralı”
583 12250
Sarp Elektrik 'Adana-Yumurtalık, Gölovası' Applying for permits Turkey Adana ili, Yumurtalık ilçesi, Gölovası Köyü mevkii
1161 24400
EÜAŞ 'AFSIN-ELBISTAN-C' Announced Turkey 1432 (1418) 30075 (30107)
EÜAŞ 'AFSIN-ELBISTAN-D' Announced Turkey 1227 (1216) 25779 (25802)
EDF Energy (West Burton Power) Ltd, West Burton Power Station
Operation United Kingdom RETFORD 975 20698
Drax Power Limited, Drax Power Ltd Operation United Kingdom SELBY 4449 94399
Kilroot Power Ltd Operation United Kingdom Carrickfergus 262 5513
Scottish Power Plc Cockenzie Power Station Operation United Kingdom Cockenzie and Port Seton
1486 31376
E.ON UK PLC, Ironbridge Power Station Operation United Kingdom TELFORD 474 10046

60
Name of plant Status Country Municipality YOLL WLD
E.ON UK plc, Ratcliffe-on-Soar Power Station Operation United Kingdom NOTTINGHAM 1552 32940
EDF Energy (Cottam Power) Ltd, Cottam Power Station
Operation United Kingdom Retford 1570 33319
Keadby Generations LTD, FIDDLERS FERRY POWER STATION
Operation United Kingdom WARRINGTON 1361 28868
Rugeley Power Limited, Rugeley Power Station Operation United Kingdom Rugeley 510 10833
RWE Aberthaw Power Station Operation United Kingdom Barry 1412 29990
RWE npower plc, Didcot A Power Station Operation United Kingdom DIDCOT 1110 23538
RWE npower plc, TILBURY POWER STATION Operation United Kingdom TILBURY 1047 22193
Sembcorp Utilities (UK) Ltd, Wilton 10 Power Station
Operation United Kingdom Redcar 80 1693
Uskmouth Power Co Ltd, Uskmouth Power Plant Operation United Kingdom Newport 89 1885
Scottish Power Generation Ltd Longannet Power Station
Operation United Kingdom Kincardine 4210 89109
Eggborough Power Ltd, Eggborough Power Station
Operation United Kingdom Goole 930 19734
E.On UK Plc, Kingsnorth Power Station Operation United Kingdom ROCHESTER 1118 23710

3.3 Results – Summarized for Europe In the following the mortality risks and the work loss days estimated in chapter 3.2 are summed up.
The annual emissions of the analysed power plants have been provided by GREENPEACE (Myllyvirta
2013). For 311 plants in operation, reported data corresponding to the year 2010 has been derived
by GREENPEACE from the “European Pollutant Release and Transfer Register” (E-PRTR) database of
the European Environmental Agency (http://prtr.ec.europa.eu). Moreover, GREENPEACE estimated
emission data for 111 sites in Europe where power plants are under construction, approved, applying
for approval or were connected to grid 2012 or later. The emission data corresponds to the assumed
year of starting operation, i.e. 2013 and later.
The following table shows the results for EU-27 countries. The values in parenthesis describe the
results that occur, if for those power plants, where the detailed methodology has been applied, the
data resulting from the simpler approach is replaced by the result for the detailed approach.
Belgium YOLL WLD
Operation 574 12169
Bulgaria Operation 29134 (29008) 615777 (615819)
Under construction & planned 1305 (1294) 27397 (27443)
Czech Republic Operation 18087 382254
Under construction & planned 2210 (2263) 46688 (48312)
Denmark Operation 190 4008
Finland Operation 1187 24998
France Operation 9918 209726
Germany Operation 33471 (33434) 707801 (707848)
Under construction & planned 11859 (11513) 251032 (245422)
Greece Operation 12296 (12261) 259561 (259612)
Under construction & planned 3160 (2745) 66576 (58428)
Hungary Operation 1512 31800
Under construction & planned 272 5723
Ireland Operation 802 16921
Italy Operation 5371 (5362) 113288 (113293)
Under construction & planned 1783 (1826) 37611 (38922)
Netherlands Operation 1476 31337
Under construction & planned 804 (877) 17055 (18819)
Poland Operation 56711 (56604) 1198739 (1198769)

62
Under construction & planned 7423 (7419) 156789 (158350) Portugal
Operation 207 4321
Romania Operation 31870 (31701) 673819 (674053)
Under construction & planned 2877 (2860) 60570 (60831)
Slovakia Operation 5907 124877
Slovenia Operation 1655 34804
Under construction & planned 505 (471) 10623 (10000)
Spain Operation 6382 133998
Sweden Operation 81 1711
United Kingdom Operation 22635 479842
Sum for EU-27 by power plant status
Status YOLL WLD
Operation 239467 (238984) 5061751 (5062161)
Under construction & planned 32197 (31538) 680063 (672258)
The results for Non-EU countries are shown in the table below.
Croatia YOLL WLD
Under construction & planned 209 (221) 4409 (4679)
Kosovo Under construction & planned 372 (369) 7838 (7858)
Montenegro Under construction & planned 508 10698
Turkey Operation 60473 (60565) 1274311 (1281814)
Under construction & planned 35977 (35905) 755637 (755943)
Additional information for Turkey.
National totals by fuel type YOLL WLD
Coal 9669 (9578) 202611 (202760)
Lignite 70681 (70034) 1491801 (1492680)

63
4 Summary and Conclusions
The coal fired power plants in Europe provide ca. 20 % of the yearly electricity production in Europe
but they also cause a considerable amount of health impacts. The results of this report show a
quantitative estimate of these health impacts with regard to reduced life time expectancy of the
population in Europe caused by the emission of air pollutants (mainly SO2, NOx, and fine particles, i.e.
PM2.5 and PM10) by coal fired power plants in Europe. These health risks should be taken into
account when making decisions about the electricity generating system. Such decisions should
consider as well the impacts to human health estimated here as other criteria like greenhouse gas
emissions, resource costs and availability, supply security, technological development and the
current and future electricity generation cost.

64
5 References
Douros, I., G. Tsegas & C. Naneris. 2007. Report on Sub-grid atmospheric dispersion models. In NEEDS project, FP6, Rs1b_TP1.3 - Project no: 502687.
EEA. 2012. European Union emission inventory report 1990–2010 under the UNECE Convention on Long-range Transboundary Air Pollution (LRTAP), EEA Technical report No 8/2012.
European Commission - CAFE. 2005. Methodology for the Cost-Benefit Analysis for CAFE: Volume 2: Health Impact Assessment. eds. F. Hurley, A. Hunt, H. Cowie, M. Holland, B. Miller, S. Pye & P. Watkiss.
European Commission. 2005. ExternE - Externalities of Energy: Methodology 2005 Update. Institut für Energiewirtschaft und Rationelle Energieanwendung (IER), Universität Stuttgart, Germany. EUR 21951, Office for Official Publications of the European Communities, Luxembourg, 2005. ISBN 92-79-00423-9, ExternE Methodolody 2005 Update, http://www.externe.info/brussels/methup05a.pdf.
Friedrich, R., A. Kuhn, B. Bessagnet, M. Blesl, D. Bruchof, H. Cowie, P. Fantke, L. Gerharz, J. Grellier, A. Gusev, U. Haverinen-Shaughnessy, D. v. d. Hout, F. Hurley, M. Huynen, T. Kampffmeyer, A. Karabelas, S. Karakitsios, A. Knol, T. Kober, V. Kollanus, P. Kontoroupis, R. Kuder, U. Kugler, M. Loh, F. Meleux, B. Miller, W. Müller, S. Nikolaki, D. Panasiuk, P. Preiss, T. Rintala, J. Roos, Y. Roustan, E. Salomons, A. Sánchez Jiménez, D. Sarigiannis, K. Schenk, A. Shafrir, V. Shatalov, E. Solomou, J. Theloke, B. Thiruchittampalam, S. Torras Ortiz, O. Travnikov, S. Tsyro, J. Tuomisto, D. Vinneau, S. Wagner & A. Yang. 2011. D 5.3.1/2 Methods and results of the HEIMTSA/INTARESE Common Case Study, http://www.integrated-assessment.eu/sites/default/files/CCS_FINAL_REPORT_final.pdf.
Friedrich, R. & P. Preiss (2012) "Vergleichende Bewertung von Stromerzeugungssystemen". Energiewirtschaftliche Tagesfragen (et) 62.
Hänninen, O.; A. Knol (Eds.) 2011: European Perspectives on Environmental Burden of Disease; National Institute for Health and Welfare, report 1/2011, Helsinki
HEIMTSA. 2007-2011. "Health and Environment Integrated Methodology and Toolbox for Scenario Assessment", EU FP6, Contract number: GOCE-CT-2006-036913-2, http://www.heimtsa.eu/.
Markandya, A. & P. Wilkinson (2007) Electricity generation and health. Lancet 2007; 370: 979–90.
Myllyvirta, L. (2013) Air pollutant and CO2 emission inventory for operating coal-fired power plants and new projects in Europe. Greenpeace International, Amsterdam. http://www.greenpeace.org/europe-coal-emission-inventory.
Pope, C. A., R. T. Burnett, M. J. Thun, E. F. Calle, D. Krewski, K. Ito & G. D. Thurston (2002) Lung Cancer, Cardiopulmonary Mortality, and Long-term Exposure to Fine Particulate Air Pollution. The Journal of the American Medical Association, 287, 1132-1141.
Spadaro, J. & A. Rabl. 2007. Report on the methodology for the consideration of uncertainties. In NEEDS project, FP6, Rs1b_D7.2 - Project no: 502687. ARMINES/Ecole des Mines, 60 boul. St.-Michel, 75272 Paris 06, Joseph V. Spadaro, [email protected] and Ari Rabl, [email protected].

65
Spadaro, J. V. & A. Rabl. 2008. Final report on the Uncertainty of the Transfer/Generalization of ExternE Results. In NEEDS project, FP6, Rs3a_D3.2 - Project no: 502687. ARMINES/Ecole des Mines, 60 boul. St.-Michel, 75272 Paris 06, Joseph V. Spadaro, [email protected] and Ari Rabl, [email protected].
Torfs, R., F. Hurley, B. Miller & A. Rabl. 2007. A set of concentration-response functions, NEEDS project, FP6, Rs1b_D3.7 - Project no: 502687. In NEEDS project, FP6, Rs1b_D3.7 - Project no: 502687.
Unified EMEP Model (2003) Unified EMEP Model Description, http://www.emep.int/index_model.html.
Top Related