


Languages
Pages
Legal


SARA TATIANA MOREIRA
INFLUÊNCIA DE POLIMORFISMOS EM GENES DE CITOCINAS E DE RECEPTORES DE CITOCINAS NA RESPOSTA AO TRATAMENTO E NO GRAU DO DANO HEPÁTICO EM
PACIENTES PORTADORES DE HEPATITE C CRÔNICA
Influence of cytokine and cytokine receptor gene polymorphisms in response to treatment and on the degree of liver damage in patients with chronic hepatitis C
Curitiba
2012

SARA TATIANA MOREIRA
INFLUÊNCIA DE POLIMORFISMOS EM GENES DE CITOCINAS E DE RECEPTORES DE CITOCINAS NA RESPOSTA AO TRATAMENTO E NO GRAU DO DANO HEPÁTICO EM
PACIENTES PORTADORES DE HEPATITE C CRÔNICA
Tese apresentada ao Programa de Pós-Graduação em Genética, Setor de Ciências Biológicas, Universidade Federal do Paraná, como requisito parcial à obtenção do título de Doutor em Ciências Biológicas, Área de Concentração Genética. Orientadora: Profa. Dra. Maria da Graça Bicalho Co-orientador: Prof. Dr. Ricardo Alberto Moliterno
Curitiba
2012


Dedico este trabalho às futuras gerações de
pesquisadores que desejam fazer ciência com
honestidade e perseverança.

AGRADECIMENTOS
A meus pais Maria e Antonio pelo incentivo e carinho, mas principalmente por me apoiarem
em todos os momentos, não me deixando desistir.
Ao meu namorado Ricardo pela sua compreensão e por torcer sempre pelo meu sucesso.
A Profa. Dra. Maria da Graça Bicalho pela orientação e confiança, mas acima de tudo, pelo
senso de humanidade.
Ao Prof. Dr. Ricardo Alberto Moliterno, pela co-orientação, paciência, compreensão, apoio
em todos os momentos e principalmente pela amizade que desenvolvemos ao longo de
sete anos.
Aos professores, técnicos e colegas do laboratório de Imunogenética da UEM, pelo auxilio e
prestatividade em todas as circunstâncias que necessitei.
Ao pessoal do LIGH pela colaboração e companheirismo, por baixarem artigos para mim,
pelas caronas e tudo mais.
Aos professores do departamento de genética da UFPR por me auxiliarem na construção de
meus conhecimentos.
Ao Laboratório de Imunogenética da UEM pelo apoio financeiro e físico para a realização
deste trabalho.
A divisão de gastroenterologia e ao laboratório de biologia molecular do hemocentro da
Faculdade de Medicina de Botucatu, UNESP, pela parceria no desenvolvimento deste
trabalho através da coleta e fornecimento do material biológico.
Aos doadores das amostras de sangue. Que nossos resultados somem-se a outros e
reverta-se em benefícios a vocês e outros portadores de hepatite C crônica.
As demais pessoas que contribuíram direta ou indiretamente para a realização deste
trabalho.
Às agências financiadoras.

“Deus é o autor da ciência. As pesquisas científicas abrem
vasto campo de idéias e informações, habilitando-nos a ver
Deus em Suas obras criadas....A verdadeira ciência
contribui com novas provas da sabedoria e do poder de
Deus. Devidamente compreendidas, a ciência e a Palavra
escrita concordam entre si, lançando luz uma sobre a
outra. Juntas, conduzem-nos para Deus, ensinando-nos
algo das sábias e benéficas leis por que Ele opera.”
Ellen Gold White

RESUMO
O vírus da hepatite C (HCV) é um patógeno capaz de causar infecção crônica em cerca de
dois terços dos indivíduos infectados, conseqüência de suas habilidades em driblar tanto a
imunidade inata quanto a adquirida. A fibrose é resultado de injúrias repetitivas causadas
aos hepatócitos decorrente da infecção pelo HCV e da ação da resposta imunológica, que
levam a uma falha no processo regenerativo e deposição de uma quantidade abundante de
matriz extracelular. Citocinas regulam a resposta inflamatória à injúria interferindo também
na fibrogênese. O protocolo padrão de tratamento para hepatite C crônica é baseado na
combinação de interferon-alfa convencional ou peguilado e ribavirina, administrados por 24
ou 48 semanas, respectivamente. Polimorfismos de um único nucleotídeo (SNPs)
localizados em regiões reguladoras/codificadoras de genes de citocinas poderiam contribuir
para a fibrogênese hepática, bem como influenciar a resposta ao tratamento, pois interferem
na expressão e secreção de citocinas, importantes proteínas que participam da resposta
imunológica contra o HCV. Portanto, o objetivo do presente trabalho foi tipar 22 SNPs
localizados em 13 genes de citocinas/receptores de citocinas visando avaliar a influência
das variantes polimórficas no grau de dano hepático e na resposta ao tratamento em
pacientes brasileiros cronicamente infectados apenas pelo genótipo 1 do HCV. Variantes
polimórficas para as posições TNFA-308, IL6-174, IL6nt565 e IL4RA+1902 estão associadas
ao grau de dano hepático. Variantes polimórficas para as posições IL10-819, IL10-592,
IL1A-889, IL1B+3962, IL1R1 pst1 1970 e IL4RA+1902 estão associadas à resposta ao
tratamento. Concluímos que polimorfismos em genes de citocinas/receptores de citocinas
parecem estar influenciando o dano hepático, bem como a resposta ao tratamento nos
pacientes estudados.

ABSTRACT
The hepatitis C virus (HCV) is a pathogen responsible for chronic infection in around
two thirds of infected individuals, due to its ability to evade both innate as well as acquired
immunity. Hepatic fibrosis may be the result of repetitive injury to the hepatocytes caused by
HCV infection and the immune response to it, leading to a failure in the regenerative process
and deposition of an abundant amount of extracellular matrix. Cytokines regulate the
inflammatory response to injury also interfering in fibrogenesis. The current standard-of-care
(SOC) treatment for chronic hepatitis C is based on a combination of conventional or
pegylated interferon alpha (pegIFN-alpha) and ribavirin administered for 24 or 48 weeks,
respectively. Single nucleotide polymorphisms (SNPs) located in regulatory/encoding regions
of cytokine genes could influence hepatic fibrogenesis and treatment response, since they
interfere with the expression and secretion of cytokines, which are important factors
participating in the immune response against HCV. Therefore, the aim of this study was to
determine the genotype of 22 SNPs found in 13 genes of cytokines/cytokine receptors to
assess the influence of polymorphic variants in the degree of liver damage and in treatment
response in Brazilian patients chronically infected with HCV genotype 1 only. Polymorphic
variants for TNFA-308, IL6-174, IL6nt565 and IL4RA+1902 positions were associated with
the degree of liver damage. Polymorphic variants for IL10-819, IL10-592, IL1A-889,
IL1B+3962, IL1R1 pst1 1970 and IL4RA+1902 positions were associated with treatment
response. We conclude that gene variants of cytokines/receptors may influence liver damage
and treatment response in studied patients.

LISTA DE FIGURAS
Figura 1 – Organização do genoma do vírus da hepatite C (HCV).................................. 15
Figura 2 – Estrutura do vírus da hepatite C (HCV)........................................................... 15
Figura 3 – Árvore filogenética dos genótipos do vírus da hepatite C (HCV).....................
16
Figura 4 – Ciclo replicativo hipotético do vírus da hepatite C (HCV)................................ 17

LISTA DE QUADROS
Quadro 1 – Programa para termociclador para amplificação pelo Cytokine
Genotyping kit (Invitrogen®)..........................................................................
101
Quadro 2 – Valores para cálculo de Odds Ratio............................................................. 102

LISTA DE TABELAS Tabela 1 – Lista de SNPs................................................................................................ 37
Tabela 2 – Lista de SNPs e funcionalidade..................................................................... 38

SUMÁRIO 1. INTRODUÇÃO................................................................................................................ 13
1.1 HISTÓRICO............................................................................................................ 13
1.2 EPIDEMIOLOGIA E TRANSMISSÃO..................................................................... 13
1.3 ETIOLOGIA............................................................................................................. 14
1.4 PATOGÊNESE....................................................................................................... 17
1.5 TRATAMENTO....................................................................................................... 18
1.6 IMUNOGENÉTICA DO HOSPEDEIRO.................................................................. 20
1.7 GENES DE CITOCINAS......................................................................................... 25
1.7.1 INTERLEUCINA-1α (IL-1α) E O GENE IL1A................................................. 26
1.7.2 INTERLEUCINA-1β (IL-1β) E O GENE IL1B................................................. 27
1.7.3 ANTAGONISTA DO RECEPTOR DA INTERLEUCINA-1 (IL-1Ra) E O
GENE IL1RN.................................................................................................
28
1.7.4 RECEPTOR TIPO I DA INTERLEUCINA-1 (IL-1R1) E O GENE IL1R1........ 28
1.7.5 INTERLEUCINA-2 (IL-2) E O GENE IL2....................................................... 29
1.7.6 INTERLEUCINA-4 (IL-4) E O GENE IL4....................................................... 30
1.7.7 CADEIA ALFA DO RECEPTOR DA INTERLEUCINA-4 (IL-4Ra) E O
GENE IL4RA.................................................................................................
31
1.7.8 INTERLEUCINA-6 (IL-6) E O GENE IL6....................................................... 31
1.7.9 INTERLEUCINA-10 (IL-10) E O GENE IL10................................................. 32
1.7.10 CADEIA BETA DA INTERLEUCINA-12 (IL-12b) E O GENE IL12B............ 33
1.7.11 FATOR DE NECROSE TUMORAL-α (TNF-α) E O GENE TNFA................ 34
1.7.12 FATOR TRANSFORMANTE DE CRESCIMENTO-β1 (TGF-β1) E O
GENE TGFB..................................................................................................
35
1.7.13 INTERFERON-γ (IFN-γ) E O GENE IFNG................................................... 35
2. JUSTIFICATIVA.............................................................................................................. 40
3. OBJETIVOS.................................................................................................................... 42
3.1 OBJETIVO GERAL................................................................................................. 42
3.2 OBJETIVOS ESPECÍFICOS................................................................................... 42
4. CAPÍTULO I.................................................................................................................... 43
5. CAPÍTULO II................................................................................................................... 68
6. DISCUSSÃO................................................................................................................... 94
7. CONCLUSÕES............................................................................................................... 96
APÊNDICE.......................................................................................................................... 97
REFERÊNCIAS................................................................................................................... 105
ANEXO................................................................................................................................ 119

13
INTRODUÇÃO
1.1. HISTÓRICO
A hepatite C é uma inflamação hepática decorrente da infecção pelo vírus da
hepatite C (HCV) que pode progredir para uma lesão necroinflamatória dos hepatócitos, de
gravidade variável. As hepatites são infecções antigas. Os primeiros relatos sobre uma icterícia
epidêmica foram descritos por Hipócrates, no século V a.C.. Lurman, na Alemanha, em
1883, documentou o primeiro surto de uma forma de hepatite, posteriormente reconhecida
como hepatite B. Inicialmente, um surto de varíola ocorreu em Bremen, acometendo
trabalhadores de um estaleiro, que foram imunizados para varíola com vacina preparada a
partir de linfa humana. Após semanas ou meses, alguns desses indivíduos apresentaram
icterícia e foram diagnosticados como manifestando a hepatite do soro; aqueles que não
manifestaram haviam sido inoculados com vacina proveniente de outro lote. No início do
século XX, quando foi introduzido o uso de agulhas e seringas, também foram relatados
outros casos, devido à esterilização inadequada das mesmas (MAHONEY, 1999).
Nas décadas de 30 e 40 também foram relatados casos de icterícia após imunização
contra febre amarela, decorrente do uso de vacinas produzidas a partir de plasma humano.
Durante a Segunda Guerra Mundial também houve diversos relatos, devido à intensa prática
de transfusões sanguíneas (MS).
As infecções por HCV representaram um sério problema aos bancos de sangue e
receptores na década de 1980, pois 2 a 10% das unidades de sangue transmitiam o vírus
em países desenvolvidos (PRATI, 2006). A introdução de testes anti-HCV para doadores de
sangue em meados de 1990 diminuiu drasticamente a transmissão do vírus por transfusão
sanguínea nestes países (GONZALEZ et al., 1995). A partir de então, a transfusão de
sangue passou a ser mais segura, porém ainda hoje existem indivíduos com hepatite C que
adquiriram o vírus antes de 1992, por meio de transfusão sanguínea e/ou de hemoderivados
(CDC, 2002).
1.2. EPIDEMIOLOGIA E TRANSMISSÃO
Antes da introdução de testes anti-HCV para doadores de sangue, em meados de
1990, a hepatite C representava a maior causa de hepatites associadas à transfusão (VAN
DER POEL, 1999). Atualmente, devido a sua ampla distribuição mundial, a hepatite C
representa um dos maiores problemas de saúde pública, resultando em altas taxas de
morbidade e mortalidade (PAPATHEODORIDIS e PARASKEVIS, 2008).

14
A incidência mundial do HCV não é conhecida, pois a infecção aguda geralmente é
assintomática, entretanto, estima-se que atualmente 3% da população mundial tenha sido
infectada pelo HCV, que existam mais de 170 milhões de indivíduos infectados
cronicamente com risco de desenvolver cirrose e carcinoma hepatocelular (CHC) e ainda
que ocorram de 3 a 4 milhões de novos casos ao ano (NIH, 1997; EASL, 1999). No Brasil,
entre os anos de 1999 e 2010, foram registrados no Sistema de Informação de Agravos de
Notificação (Sinan) 69.952 casos confirmados de hepatite C, destes, 47.830 provêm da
região sudeste e 15.095 da região sul, que juntas concentram 90% dos casos confirmados
no país (BRASIL, 2011a). A prevalência da doença é de 1,5% considerando-se todas as
idades (6 meses a 98 anos) e 2,5% entre adultos (ZARIFE et al., 2006), classificando o país
como de baixa endemicidade, apesar da OMS considerá-lo um país de endemicidade
intermediária, com prevalência da infecção situada entre 2,5% e 10% (BRASIL, 2011b). Em
outros países estima-se que a prevalência da doença seja de aproximadamente 0,3% no
Canadá, 1,4 % nos Estados Unidos, 1,9% na Grécia, 3,0% na França, e 30,0% no Egito e
África do Sul (MANESIS et al., 2009).
A transmissão da hepatite C ocorre predominantemente por via parenteral.
Atualmente pertencem ao grupo de risco usuários de drogas injetáveis, indivíduos que se
submetem a procedimentos que reutilizam materiais perfurocortantes (tatuagens, manicuros
e piercings), alcoólatras, portadores do HIV, transplantados, hemodialisados, hemofílicos e
presidiários. Dentre os casos notificados entre 1999 e 2009 no Brasil, observa-se que a
maioria está relacionada ao uso de drogas (14,8%), à transfusão de sangue e/ou
hemoderivados (14,9%) e à transmissão sexual (9%), com elevado percentual de ignorados
(43%) (BRASIL, 2011a).
Desde a introdução de testes anti-HCV em bancos de sangue, a transmissão
transfusional tornou-se praticamente ausente. A transmissão sexual também é pouco
freqüente, sendo prevalente entre indivíduos sexualmente promíscuos. A transmissão
vertical ocorre apenas quando a mãe apresenta altos níveis de RNA viral no soro, porém é
rara quando comparada a hepatite B, sendo estimada em 2%, mas alcançando 20% em
casos de co-infecção com HIV (FERREIRA e SILVEIRA, 2004; HUARTE e CASI, 2004).
1.3. ETIOLOGIA
O HCV foi identificado pela primeira vez em 1989, por Choo et al. (CHOO et al.,
1989). É classificado como RNA-vírus, pertencente ao gênero Hepacivirus e à família
Flaviviridae. É um vírus esférico, de aproximadamente 50 nm de diâmetro, com um RNA
genômico formado por cerca de 9600 nucleotídeos organizados em fita única de sentido
positivo (SIMMONDS et al., 2005).

15
O RNA codifica três proteínas estruturais (C - nucleocapsídeo, E1 e E2) e sete
proteínas não estruturais (p7, NS2, NS3, NS4A, NS4B, NS5A, NS5B) (Figura 1). Ele está
localizado dentro de um nucleocapsídeo icosaédrico protéico, envelopado por uma
bicamada lipídica na qual um ou dois tipos de proteínas do envelope (E1 e E2) são
ancoradas (Figura 2) (SIMMONDS et al., 2005; CHEVALIEZ e PAWLOTSKY, 2006).
Figura 1 – Organização do genoma do vírus da hepatite C (HCV). NS: não estrutural
Fonte: Chevaliez e Pawlotsky, 2006
Figura 2 – Estrutura do vírus da hepatite C (HCV)
Fonte: Modificado de Chevaliez e Pawlotsky, 2006
Existem seis genótipos virais (denominados HCV 1 a 6) (Figura 3) e mais de 100
subtipos fortemente relacionados (FISHMAN e BRANCH, 2009). A classificação em
genótipos e subtipos ocorreu com base nas diferenças entre suas seqüências nucleotídicas,
sendo que os genomas diferem de 30 a 35% entre os genótipos e de 20 a 25% entre os
subtipos (SIMMONDS, 2004; SIMMONDS et al., 2005). Os genótipos possuem distribuição
geográfica distinta, sendo que os genótipos 1, 2 e 3 apresentam distribuição global enquanto
os demais são encontrados somente em regiões específicas como África e Ásia
(SIMMONDS et al., 1996; SIMMONDS, 1999; FARCI e PURCELL, 2000). No Brasil, o
Membrana lipídica
Nucleocapsídeo (core)

16
genótipo 1 é o mais prevalente, seguido pelos genótipos 2 e 3 (SILVA et al., 2007; FREITAS
et al., 2008).
Figura 3 – Árvore filogenética dos genótipos do vírus da hepatite C (HCV)
Fonte: Modificado de Simmonds et al., 2005. UDIs: Usuários de drogas intravenosas.
O HCV está em constante diversificação devido à rápida replicação viral, amplo
tamanho das populações virais e altas taxas de mutação decorrentes da baixa fidelidade de
sua RNA polimerase (DUARTE et al., 1994), permitindo assim a seleção ambiental dos
exemplares melhor adaptados (PAWLOTSKY, 2006).
A determinação do genótipo viral previamente ao tratamento é uma importante
ferramenta para o prognóstico e acompanhamento dos pacientes infectados, pois os
genótipos virais comportam-se diferentemente durante o curso da infecção e a além de
responderem de forma distinta ao tratamento antiviral (SIMMONDS et al., 1994).

17
1.4. PATOGÊNESE
A patogenia decorrente da infecção pelo HCV permanece não completamente
esclarecida. A compreensão dos mecanismos através dos quais o HCV induz a resposta
viral pelo hospedeiro, favorecendo na maior parte das vezes a persistência viral, além de
esclarecer a patogenia da doença, permitiria o desenvolvimento de novas terapias
imunomodulatórias para prevenir ou limitar as complicações decorrentes da infecção, o que
inclui o transplante de fígado, um significativo problema de saúde pública (CHANDER et al.,
2002; SHEPARD et al., 2005).
O HCV apresenta tropismo por células hepáticas. Ocorre a ligação a um ou mais
receptores de membrana celular e internalização através de endocitose mediada por
receptor. A fusão do envelope viral com a membrana plasmática permite a liberação do
nucleocapsídeo no citoplasma. Após a decapsidação ocorre a tradução, em nível
citoplasmático, assim como a replicação. Posteriormente, novas estruturas virais são
montadas e vírus maduros são liberados para o meio extracelular através de exocitose. As
informações a respeito do ciclo de vida viral são limitadas em decorrência da incapacidade
de cultivá-lo e da ausência de modelos animais (Figura 4) (CHEVALIEZ e PAWLOTSKY,
2006).
Figura 4 – Ciclo replicativo hipotético do vírus da hepatite C (HCV)
Fonte: Modificado de Chevaliez e Pawlotsky, 2006
Ligação
Entrada
Decapsidação
Replicação
Montagem
Liberação
Tradução
Mecanismo de replicação do RNA

18
Embora a célula alvo para o HCV sejam os hepatócitos, o vírus também apresenta
linfotropismo, pois fragmentos do genoma viral foram detectados em linfócitos B e T
circulantes, bem como em células apresentadoras de antígenos, além do cérebro (MYRMEL
et al., 2009).
A detecção viral pode ocorrer de uma a duas semanas após a infecção, pela
presença de RNA viral no soro dos pacientes (HOOFNAGLE, 2002). O período de
incubação é de aproximadamente sete semanas, porém a maioria dos indivíduos com
infecção aguda não apresentam sintomas; por essa razão, a maioria das infecções é
diagnosticada ao acaso em decorrência da elevação de transaminases ou em estágio
avançado da doença quando as complicações já ocorrem (HOOFNAGLE, 2002; BLACKARD
et al., 2008).
A infecção pode resultar em uma doença assintomática, culminando com a
eliminação viral espontânea ou progredir para uma infecção crônica, que pode levar a
cirrose, falha hepática ou carcinoma hepatocelular (SEEFF, 2002). Estima-se que em 20 a
50% dos infectados a resolução seja espontânea (BLACKARD et al., 2008). Pacientes com
doença aguda sintomática e mulheres jovens têm uma taxa maior de resolução espontânea
da infecção que outros grupos, e tendem a eliminar o RNA viral em até 12 semanas após
início dos sintomas (BIALEK e TERRAULT, 2006; BRASIL, 2011b).
Na grande maioria dos casos, porém, não há eliminação viral espontânea, e o vírus
persiste progredindo para infecção crônica. Aproximadamente 50 a 85% dos indivíduos
infectados com o HCV irão desenvolver doença crônica (KENNY-WALSH, 1999; VILLANO
et al., 1999). A doença crônica pode ser evidenciada por alterações histopatológicas, as
quais iniciam com uma inflamação no fígado, que freqüentemente pode ser associada à
fibrose, podendo evoluir em alguns casos para o hepatocarcinoma. (THOMAS e SEEFF,
2005). É estimado que 20% dos doentes crônicos evoluam para cirrose, principalmente em
20 anos após infecção, dentre os quais cerca de 3% desenvolverão hepatocarcinoma (NIH
Consensus Statement on Management of Hepatitis C: 2002, 2002). O grau de dano é
tradicionalmente verificado através da análise do tecido hepático obtido por biópsia, de
acordo com escalas de graduação. Uma delas é a Metavir (BEDOSSA e POYNARD, 1996),
que classifica o dano hepático em F0, F1, F2, F3 ou F4, sendo F0 correspondente a
ausência de fibrose e F4 o grau mais avançado, ou seja, cirrose).
1.5. TRATAMENTO
O objetivo do tratamento é controlar a progressão da doença hepática por meio da
inibição da replicação viral, sendo que a redução da atividade inflamatória impede a
evolução para cirrose e carcinoma hepatocelular (CHC) (REDDY et al., 2001). Antes de ser

19
iniciado o tratamento deve-se considerar o risco de progressão da doença, a probabilidade
de resposta terapêutica, efeitos colaterais e a presença de comorbidades. No Brasil, o
tratamento da hepatite C é realizado com interferon (IFN-alfa) ou peginterferon (pegIFN-alfa)
associado à ribavirina, por 24 ou 48 semanas, respectivamente (GOTTO e DUSHEIKO,
2004; HADZIYANNIS et al., 2004; GHANY et al., 2009; BRASIL, 2011b). O IFN-alfa,
administrado por via subcutânea, é uma citocina que faz parte da resposta inata do
hospedeiro humano; a adição de uma molécula de polietilenoglicol a esta molécula prolonga
sua ação, eleva a velocidade de absorção e aumenta sua meia-vida. Já a ribavirina é um
análogo de nucleosídeo sintético administrado por via oral que apresenta ação antiviral e
imunomodulatória (TSUBOTA et al., 2011).
Os interferons, além de exercerem um efeito antiviral, induzem uma resposta Th1 por
parte do hospedeiro, sendo essa ação potencializada pelo uso combinado com a ribavirina
(FANG et al., 2000; STITES et al., 2000). O tratamento com peginterferon e ribavirina
desencadeia a mesma cascata de sinalizações que os IFNI endógenos. Entretanto, apenas
55% dos indivíduos tratados apresentam resposta virológica sustentada (RVS), que indica
sucesso no tratamento (MANNS et al., 2001; FRIED et al., 2002). A RVS é obtida quando o
RNA viral se torna indetectável no soro do paciente seis meses após o término do
tratamento e é influenciada por fatores do hospedeiro, como etnia, idade, obesidade,
resistência a insulina e variabilidade genética, assim como por mecanismos virais, como o
genótipo e a carga viral previa ao tratamento e por fatores relacionados ao tratamento, como
a dose do medicamento administrado (TAI e CHUNG, 2009; TSUBOTA et al., 2011).
A resposta ao tratamento pode ser classificada nas seguintes categorias: a)
Resposta virológica rápida (RVR): quando o RNA viral se torna indetectável após 4 semanas
de tratamento. Uma resposta rápida é um forte indicativo da ocorrência de RVS 24 semanas
após o término do tratamento (TAI e CHUNG, 2009); b) Resposta virológica precoce (RVP):
queda de ao menos duas escalas logarítmicas (2 Log) ou 100 vezes o valor do RNA viral
pré-tratamento ou quando o mesmo se torna indetectável na 12ª semana de tratamento; c)
Resposta virológica lenta: quando ocorre a diminuição do título de RNA viral para ao menos
2 log10 após 12 semanas de tratamento, porém com eliminação viral até a 24ª semana; d)
Resposta virológica sustentada (RVS): quando o RNA viral é indetectável na 24ª semana
após o término do tratamento; e) Recidiva virológica (REC): quando o RNA viral é
indetectável ao final do tratamento (48a semana de tratamento), porém detectável na 12ª ou
24ª semana após o término do tratamento; f) Resposta nula (NR): quando o RNA viral é
detectável na 48a semana de tratamento (BRASIL, 2011b; JANG e CHUNG, 2011).
Avanços recentes na compreensão da estrutura e mecanismo de replicação viral
permitiram o desenvolvimento de agentes que atuam diretamente nas enzimas envolvidas
no ciclo de vida do HCV, denominados antivirais de ação direta (DAA). Estes se diferenciam

20
do IFN-alfa ou pegIFN-alfa associado à ribavirina, pois possuem ação direta enquanto os
últimos apresentam ação antiviral inespecífica. Dois inibidores de proteases foram
recentemente aprovados pelo “Food and Drug administration” (FDA), o Telaprevir e o
Boceprevir, ambos indicados para o tratamento de hepatite C crônica decorrente da infecção
pelo genótipo 1 do HCV. Eles devem ser administrados em combinação com o pegIFN-alfa.
Ambos os medicamentos estão disponíveis na forma de comprimidos orais que devem ser
ingeridos três vezes ao dia. A adição destes inibidores de proteases à terapia padrão
aumentou intensamente as taxas de RVS em pacientes sem tratamento prévio, em
recidivantes e em não respondedores. Outras drogas estão sendo testadas, como inibidores
de polimerase viral, inibidores de NS5A e inibidores de fatores do hospedeiro, como a
ciclofilina. A promessa é aumentar as taxas de RVS e diminuir a duração do tratamento
(JESUDIAN et al., 2012).
1.6. IMUNOGENÉTICA DO HOSPEDEIRO
O HCV apresenta tropismo por hepatócitos, ocasionando sua infecção. A primeira via
de defesa do hospedeiro consiste na imunidade inata, que é ativada por padrões
moleculares associados ao patógeno (PAMPs), reconhecidos por receptores Toll-like tipo 3
(TLR3) e gene indutível por ácido retinóico tipo I (RIG-I) das células infectadas, que
reconhecem, respectivamente, RNAs fita dupla e RNAs fita dupla ou fita simples virais. Uma
cascata de sinalizações é desencadeada, resultando na ativação e transcrição do gene
IFNB. IFN-β age de modo autócrino e parácrino, estimulando receptores IFN-α e IFN-β, que
induzem uma nova cascata de sinalização, que amplifica a transcrição dos genes IFNA e
IFNB, gerando uma alça de retroalimentação positiva. Conseqüentemente, ocorre um
aumento na expressão de interferons tipo I (IFNI), que agem diretamente no vírus, ou ativam
de diversas maneiras a resposta imunológica adaptativa (WATHELET et al., 1998). IFNI
estimula o processamento antigênico, a proliferação de linfócitos T de memória, a
diferenciação de células dendríticas e o aumento na expressão de moléculas HLA classe I
nos hepatócitos (TAI e CHUNG, 2009), além de inibir a replicação viral, induzir a apoptose
de hepatócitos infectados (BIGGER et al., 2001), induzir a geração de proteossomos e
conseqüente aumento da expressão de antígenos virais em hepatócitos infectados (SHIN et
al., 2006).
Células dendríticas (CD) também participam da resposta imunológica frente ao HCV.
A diferenciação das CDs é intensamente influenciada por proteínas estruturais e não
estruturais do HCV in vitro (SZABO e DOLGANIUC, 2005). CDs plasmocitóides secretam
altos níveis de IFN-α (assim como hepatócitos infectados), direcionando a diferenciação dos
linfócitos TCD4+ para o fenótipo Th2, além de ativar macrófagos, linfócitos T CD8+ e células

21
natural killer (NK). O dano hepático causado pela destruição dos hepatócitos por células da
imunidade inata/adquirida estimulam as CDs mielóides. CDs mielóides secretam
principalmente IL-12 e TNF-α direcionando a diferenciação dos linfócitos TCD4+ para o
fenótipo Th1 e promovendo a ativação de NKs e sua secreção de IFN-γ. IFN-γ ativa
macrófagos hepáticos, aumentando a inflamação local (LIU, 2001; HIROISHI et al., 2008).
Como mencionado, NKs participam ativamente da resposta frente à infecção viral.
Elas são necessárias para uma ação citolítica efetiva por parte dos linfócitos T citotóxicos,
através da liberação de IFN-γ, além de induzir a apoptose de hepatócitos infectados
(ocasionando a hepatite) e ativar células dendríticas (KAKIMI et al., 2000; LIU et al., 2000).
Embora sejam abundantes no tecido hepático de indivíduos acometidos por hepatite C
aguda, estudos demonstram uma diminuição da freqüência de NKs no sangue periférico
(MEIER et al., 2005; MORISHIMA et al., 2006) e fígado de pacientes com hepatite C crônica
(DEIGNAN et al., 2002), talvez parcialmente associada a uma inibição funcional das NKs,
observada in vitro, após a ligação da proteína viral E2 à molécula CD81 na NK (TSENG e
KLIMPEL, 2002). Assim, uma resposta ineficiente das células NK poderia ocasionar a
persistência viral (CORADO et al., 1997). Polimorfismos em genes codificadores de
receptores das NKs (KIR) têm sido observados em pacientes infectados que manifestaram
diferentes cursos da doença (KHAKOO et al., 2004; IVIC et al., 2007; PALADINO et al.,
2007; MARANGON et al., 2011).
A conexão entre a imunidade inata e adaptativa é realizada pelas CDs. Observa-se
que tanto a imunidade humoral quanto a celular participam da resposta imunológica, sendo
esta última a que exerce maior participação. CDs apresentam epítopos virais, através de
suas moléculas HLA classe II aos linfócitos T CD4+. Linfócitos T CD8+ reconhecem epítopos
apresentados por moléculas HLA classe I na superfície de células infectadas
(ACCAPEZZATO et al., 2005; BARTH et al., 2005). Através da secreção de citotoxinas,
elimina células alvo infectadas, e por meio da secreção de citocinas Th1, como IFN-γ e TNF-
α, inibe a replicação viral sem morte celular (GUIDOTTI e CHISARI, 2001). Respostas de
linfócitos T têm sido amplamente estudadas e são criticas para uma resposta imunológica
efetiva. Estudos envolvendo infecções por HCV em humanos sugerem que respostas
vigorosas de linfócitos T CD4+ e CD8+ favorecem a eliminação viral espontânea
(REHERMANN et al., 1996), entretanto, ainda permanece não completamente definido o
mecanismo através do qual isso ocorre.
A participação da imunidade humoral é, entretanto, menos preponderante.
Anticorpos específicos são normalmente detectados de sete e oito semanas após a infecção
por HCV, entretanto, a ação dos mesmos é muito questionável, uma vez que não previnem
reinfecção (LAI et al., 1994) e não estão associados à resolução da infecção (CHEN et al.,
1999). Kaplan et al. (KAPLAN et al., 2003) não identificaram respostas humorais específicas

22
em pacientes expostos ao HCV. Um estudo realizado com um grupo de mulheres
acidentalmente expostas ao HCV revelou a presença de linfócitos T CD4+ e CD8+ HCV-
específicos circulantes, mesmo duas décadas após a infecção, enquanto anticorpos HCV-
específicos permaneceram indetectáveis após o mesmo período (TAKAKI et al., 2000).
Estudos demonstram que, na maior parte das infecções crônicas, o HCV não é
capaz de induzir uma resposta imunológica eficiente pelo hospedeiro ou é altamente capaz
de driblar o sistema imunológico (VALIANTE et al., 2000), condizendo com a estimativa de
que em 50 a 80% dos infectados progridam para a cronicidade (BLACKARD et al., 2008).
O HCV desenvolveu mecanismos sofisticados de evasão do sistema imunológico do
hospedeiro. Após a infecção, o HCV produz proteínas estruturais ou não estruturais que
suprimem a resposta imunológica inata. Através de suas proteínas não estruturais NS3-4A,
o HCV bloqueia os TLR3 e os RIG-I das células infectadas, impedindo a ligação das
moléculas de RNA e conseqüente produção e secreção de interferons. A proteína do
nucleocapsídeo inibe a ativação da STAT1, além de promover a degradação deste
transdutor de sinal. As proteínas E2 e NS5 inibem a atividade da proteína quinase R (PKR)
(GALE e FOY, 2005; BODE et al., 2007; TAI e CHUNG, 2009).
Diversas observações têm sido feitas quanto ao mecanismo de escape frente à
imunidade adaptativa. Em indivíduos acometidos por hepatite crônica, observam-se CDs
imaturas (AUFFERMANN-GRETZINGER et al., 2001) e com capacidade estimulatória
reduzida (KANTO et al., 1999). A proteína do nucleocapsídeo inibe a proliferação de
linfócitos T in vitro (KITTLESEN et al., 2000) que, conseqüentemente, têm sua produção e
secreção de IFN-γ comprometida. São observadas taxas de replicação viral que excedem a
capacidade do sistema de defesa (FULLER et al., 2005), além de falhas na manutenção de
níveis iniciais suficientes de linfócitos T CD4+ para o direcionamento adequado da resposta
(GERLACH et al., 1999).
Outro importante mecanismo de escape viral consiste na intensa taxa de mutações
em seu genoma. O HCV replica a uma taxa de 1010 a 1012 novos vírus ao dia durante o
período de infecção crônica (NEUMANN et al., 1998), o que somado à baixa fidelidade da
RNA polimerase viral e ausência de mecanismos de reparo, resulta em freqüentes
substituições de bases no genoma viral. Isso permite o surgimento de novas cepas, capazes
inclusive de se evadir do sistema imunológico (BUKH et al., 1995). Mutações em epítopos
apresentados por moléculas HLA classe I comprometem o processamento via proteossoma
(SEIFERT et al., 2004), além de reduzir a afinidade pelas próprias moléculas HLA, o que,
conseqüentemente, compromete o reconhecimento pelos linfócitos T CD8+ (TESTER et al.,
2005).
Fatores como genótipo viral, idade e sexo do hospedeiro, obesidade, alcoolismo,
assim como co-infecções, podem influenciar o curso da hepatite C, porém não explicam por

23
si mesmos a variabilidade das respostas à infecção desenvolvidas por diferentes indivíduos
(SEEFF, 2002). Como observado, a resposta imunológica do hospedeiro envolve uma
complexa interação entre o sistema imune inato e adaptativo que determinam os resultados
da infecção por organismos patogênicos. Nesse contexto, a diversidade dos genes
envolvidos na resposta imune pode explicar, em parte, a variabilidade da resposta às
infecções (MARTIN e CARRINGTON, 2005).
Muitos estudos recentes têm investigado polimorfismos do gene HLA de classe II em
relação à infecção pelo HCV, uma vez que a natureza e magnitude da resposta imunológica
podem ser influenciadas pelo genótipo HLA. Da mesma forma, como os linfócitos T
citotóxicos exercem papel crucial no controle da replicação viral e podem ser diretamente
responsáveis pela lesão histológica na infecção crônica, também têm sido realizados
estudos que investigam polimorfismos dos genes HLA de classe I em relação à infecção
pelo HCV, resposta ao tratamento e grau de dano hepático (ROMERO-GOMEZ et al., 2011;
MARANGON et al., 2012).
Linfócitos T, células natural killer e outras células da resposta imune secretam
citocinas, contribuindo de forma eficaz para as diferenças entre subtipos de células T.
Assim, a regulação da resposta humoral e celular pode ser explicada em parte, pela
regulação cruzada da diferenciação e ativação das células Th1 e Th2 no decorrer de uma
resposta imune. Dessa forma, as citocinas secretadas em resposta à lesão celular tem papel
crucial na patogênese da fibrose hepática (DUSTIN e RICE, 2007).
A fibrose hepática é resultado de injúrias repetitivas causadas aos hepatócitos devido
à infecção pelo HCV e à ação da resposta imunológica. Em casos de injúrias hepáticas
agudas, o tecido necrótico é removido e substituído por novos hepatócitos, processo
associado à resposta pró inflamatória e deposição limitada de matriz extracelular. Caso a
injúria persista, o processo regenerativo falha e ocorre deposição de uma quantidade
abundante de matriz extracelular, constituindo a fibrose. Esse processo é denominado
fibrogênese, ao contrário da degradação da matriz extracelular, denominada fibrólise. A
reincidência das injúrias induz diferentes graus de fibrose, que são classificadas em iniciais,
F0, F1 e F2 e avançados, F3 e F4 (BATALLER e BRENNER, 2005).
TGF-β1 exerce um papel chave dentre as citocinas no processo de fibrogênese,
pois estimula a síntese de matriz extracelular e inibe a fibrólise, além de induzir a infiltração
de neutrófilos no tecido hepático e promover a apoptose através de um estímulo
mitocondrial. TNF-α também tem sido observado participando, porém menos intensamente,
do processo de fibrogênese e seus níveis intra-hepáticos estão aumentados em indivíduos
acometidos por hepatite C crônica (LIMA-CABELLO et al., 2011). Em contrapartida, IFN-α,
IFN-γ e IL-10 têm sido observados desempenhando um efeito antifibrótico em casos de
hepatite causadas por HCV (BATALLER e BRENNER, 2005). Há indícios de que os níveis

24
de RNAm para IL-8, IL-2, IL-1α, IL-1β, IL-15 e TNF-α aumentam com o estágio de fibrose
hepática (MAHMOOD et al., 2002).
Além da participação das citocinas no processo de fibrogênese, elas também atuam
em outros âmbitos da resposta ao HCV. Níveis elevados de IL-6, tanto plasmáticos como
intra-hepáticos, têm sido observados em indivíduos acometidos por hepatite C (FELDMANN
et al., 2006; LIMA-CABELLO et al., 2011), assim como no sobrenadante de células
estimuladas in vitro pela proteína do nucleocapsídeo viral, possivelmente via TLR2
(FELDMANN et al., 2006). Grungreiff et al. observaram a normalização da concentração
sérica de IL-6 após a eliminação viral através do tratamento com interferon (GRUNGREIFF
et al., 1999).
Genes de citocinas podem apresentar variações nucleotídicas em sítios específicos,
denominadas polimorfismos de único nucleotídeo ou SNPs do inglês “single nucleotide
polymorphisms”, que resultam em diferentes alelos para cada locus polimórfico. SNPs
localizados em regiões reguladoras têm sido demonstrados como influenciando a expressão
e secreção de citocinas, resultando em diferentes fenótipos de produção que podem ser
classificados como alto, intermediários ou baixos produtores. A produção inapropriada dos
níveis de citocinas parece contribuir para a persistência viral, fibrogênese hepática e até
afetar a resposta à terapia na infecção pelo HCV (ROMERO-GOMEZ et al., 2011).
Neste sentido, alguns autores têm verificado a presença ou ausência de associações
entre polimorfismos em genes de citocinas e dano hepático, bem como com a resposta ao
tratamento (ROMERO-GOMEZ et al., 2011). Dai et al. (DAI et al., 2006) estudando
indivíduos chineses acometidos por hepatite C crônica (diversos genótipos virais)
observaram associação entre o alelo TNFA-308/A e estágios severos de fibrose hepática. Já
Falletti et al. (FALLETI et al., 2010), estudando pacientes italianos, observaram associação
entre o alelo IL6-174/G e a intensidade do dano hepático. Yee et al. ao estudar uma
população inglesa, observaram os alelos IL10-592/A e -819/T, assim como os genótipos -
819/T:T e -592/A:A e o haplótipo ATA (-1082; -819; -592) associados a SVR (YEE et al.,
2000).
Em 2009, foram publicados três amplos estudos demonstrando que alguns SNPs
próximos ao gene IL28B, que codifica o IFN-ɣ3, estão fortemente associados à resolução
espontânea da infecção pelo HCV e à RVS pós-tratamento com peginterferon-α e ribavirina
(GE et al., 2009; SUPPIAH et al., 2009; TANAKA et al., 2009). Dentre eles, o SNP
rs12979860 foi observado como o melhor na predição da resposta ao tratamento; o genótipo
C:C está associado a maiores taxas de RVS em indivíduos infectados pelos genótipos 1 ou
4 do HCV, bem como à resolução espontânea da infecção pelo HCV. O SNP rs12979860
parece não interferir na expressão intra-hepática do gene IL28B, mas provavelmente
interfere na expressão intra-hepática dos genes estimulados por interferon (ISGs) ou

25
modifica a interação protéica com outras moléculas na via do IFN-α (MACIAS et al., 2011). A
determinação do genótipo dos pacientes portadores de hepatite C crônica permitirá a
personalização do tratamento no contexto da escolha das drogas.
1.7. CITOCINAS: papel biológico, genes e polimorfismos genéticos
Citocinas são proteínas solúveis produzidas e secretadas por células do sistema
imunológico, assim como outras células do organismo humano, em resposta a estímulos
diferenciados. Agem mediante ligação a receptores específicos presentes na superfície de
células alvo, que podem estar localizados na própria célula secretora (atuação autócrina),
em uma célula próxima à secretora (atuação parácrina) ou em células alvo distantes da
secretora, alcançadas via corrente sanguínea (atuação endócrina) (MIYAJIMA et al., 1992;
KISHIMOTO et al., 1994).
De acordo com sua estrutura, as citocinas são agrupadas em famílias
(hematopoietinas, interferons e TNF) e de acordo com sua similaridade funcional e genética
são redistribuídas em subfamílias. Seus receptores também seguem uma classificação
similar (JANEWAY et al., 2001).
A ação das citocinas inicia-se pela ligação a seu receptor específico de membrana,
desencadeando uma via de transdução de sinais que culmina com uma alteração da
expressão gênica da célula alvo, influenciando seu crescimento, motilidade, diferenciação,
função, secreção de outras citocinas, entre outros. De forma simplificada, as citocinas agem
em uma rede complexa, na qual a produção de uma citocina influencia a síntese e ação de
outras através de estímulos regulatórios promotores ou inibitórios. Assim, através de ações
pleiotrópicas, redundantes, sinérgicas ou antagônicas elas participam de um sistema de
indução em cascata (JANEWAY et al., 2001).
Atuando como agentes imunomodulatórios, as citocinas apresentam efeitos pró-
inflamatórios (quando secretadas por linfócitos T CD4+ helper 1) ou antiinflamatórios
(quando secretadas por linfócitos T CD4+ helper 2) (HAUSER, 1995). De acordo com perfis
de estímulos ainda não totalmente elucidados, linfócitos T CD4+ naive podem se diferenciar
nos subtipos. A produção seletiva do primeiro grupo (Th1) induz, predominantemente, uma
resposta imunológica mediada por células, particularmente apropriada para destruir células
infectadas por patógenos intracelulares. Também é responsável pela hipersensibilidade
tardia e ativação das células T citotóxicas, e ainda pela produção de anticorpos
opsonizantes (STITES et al., 2000). Quando ativadas por antígenos/células apresentadoras
de antígenos (APC), as células Th1 produzem interleucina-2 (IL-2), interferon-gama (IFN-g)
e linfotoxina (LT) (MOSMANN et al., 1986; CHERWINSKI et al., 1987; COFFMAN et al.,
1988). A produção seletiva do segundo grupo (Th2), induz uma resposta imunológica

26
humoral preponderante, promovendo a produção de quantidades relativamente elevadas de
anticorpos IgM, IgE, e isótipos IgG não ativadores do complemento; também estimulam a
ativação e diferenciação de eosinófilos e atuam nas reações alérgicas (STITES et al., 2000).
Células Th2 produzem IL-4, IL-5, IL-6, IL-9, IL-10 e IL-13 (CHERWINSKI et al., 1987;
BROWN et al., 1989).
1.7.1. INTERLEUCINA-1α (IL-1α) E O GENE IL1A A interleucina IL-1α pertence à família de citocinas IL-1, juntamente com IL-1β, o
antagonista do receptor IL-1Ra, IL-18, IL-36Ra, IL-36α, IL-37, IL-36β, IL-36γ, IL-38, IL-33 e
os receptores para IL-1, IL-1R1 e IL-1R2 e mais sete co-receptores, proteínas de ligação e
receptores inibitórios. A maioria dos genes codificadores dos membros da família de
citocinas IL-1 está localizada no cromossomo 2, divididos em dois clusters: a) IL1A, IL1B,
IL1RN, IL-36RA, IL-36A, IL-37, IL-36B, IL-36G, IL-38 e b) IL-1R1 e IL-1R2 e mais sete co-
receptores, proteínas de ligação e receptores inibitórios (SMITH e HUMPHRIES, 2009;
DINARELLO, 2011).
O gene IL1A (3552) localiza-se na região 2q14, possui uma extensão de 10,5kb e é
composto por sete éxons e seis íntrons. Seu RNAm possui 2943pb e origina um precursor
de 33kDa, formado por 271 aminoácidos e sem peptídeo sinal, denominado pré-interleucina-
1α, que posteriormente é clivado por calpaína, resultando na interleucina-1α de 17kDa e 159
aminoácidos (DINARELLO, 1991; WATANABE e KOBAYASHI, 1994).
O gene IL1A apresenta uma homologia de aproximadamente 45% com IL1B. O
principal local ausente de homologia está dentro da região promotora, indicando que os
altos níveis plasmáticos de IL-1β quando comparado aos níveis de IL-1α poderia ser devido
a diferenças transcricionais (SMITH e HUMPHRIES, 2009). Dentre os polimorfismos em
IL1A, foi descrito um na posição -889C>T (rs1800587) (TSENG e KLIMPEL, 2002). Um
estudo em população italiana demonstrou que o alelo -889/T aumenta a taxa de transcrição
do gene e conseqüentemente aumenta os níveis plasmáticos da IL-1α (DOMINICI et al.,
2002) e também da IL-1β (KILPINEN et al., 2001), pois há evidências de um desequilíbrio de
ligação entre os SNPs de IL1A e IL1B (GORE et al., 1998). O genótipo -889/T:T seria
responsável por níveis de mRNA ligeiramente mais elevados em comparação com o
genótipo CC ou CT (DOMINICI et al., 2002). Entretanto, recentemente outro estudo
realizado em população japonesa, demonstrou que não existem diferenças estatisticamente
significativas quanto à expressão gênica possivelmente induzida por este SNP. Parece que -
889C>T seria apenas um marcador para o SNP +4845G>T (rs17561), pois estão em forte
desequilíbrio de ligação, e indivíduos portadores do alelo +4845/T são mais eficientes no
processamento da pré interleucina-1α (KAWAGUCHI et al., 2007) (Tabelas 1 e 2).

27
A maior parte da IL-1 plasmática é IL-1β, de modo que a IL-1α é normalmente
encontrada em baixíssimas concentrações na corrente sanguínea. A atividade biológica
destas duas citocinas é indistinguível (DINARELLO, 1997). A IL-1 é secretada por
monócitos, macrófagos ativados de diversos tecidos, queratinócitos, neutrófilos, células
endoteliais, fibroblastos, fibras musculares lisas, células de Langerhans, osteoclastos,
linfócitos T e B e células natural killer. Apesar de ser uma citocina pró-inflamatória, seus
efeitos não são limitados à inflamação, pois também atuam como imunoadjuvantes, são
indutoras da febre, participam do processo de formação e remodelação óssea, dentre outras
funções (DINARELLO, 1997; , 2011).
1.7.2. INTERLEUCINA-1β (IL-1β) E O GENE IL1B
O gene IL1B (3553) localiza-se na região 2q14, possui uma extensão de 7,8kb e é
composto por sete éxons e seis íntrons. Seu RNAm possui 1498pb e origina um precursor
de 31kDa, formado por 269 aminoácidos e sem peptídeo sinal, denominado pré-interleucina-
1β, que posteriormente é clivado pela caspase-1, resultando na interleucina-1β de 17kDa e
153 aminoácidos (MARCH et al., 1985; DINARELLO, 1991).
No gene IL1B existem ao menos três polimorfismos, um na posição -511C>T
(rs16944), outro na posição -31T>C (rs1143627) e outro na posição +3962C>T (rs1143634)
(WILSON et al., 1993; TSENG e KLIMPEL, 2002). A nomenclatura dos polimorfismos pode
diferir amplamente entre os autores; é o caso do SNP IL1B+3962, também denominado
+3953 (CONSTANTINI et al., 2002) ou +3954 (KSIAA CHEIKHROUHOU et al., 2011) por
alguns autores, mas em todos os casos o dbSNP number dos mesmos é rs1143634 (SMITH
e HUMPHRIES, 2009).
Os SNPs -511C>T e -31T>C apresentam forte desequilíbrio de ligação e estudos de
associação envolvendo ambos tendem a apresentar resultados similares (SMITH e
HUMPHRIES, 2009). A funcionalidade de ambos sempre foi um assunto controverso, mas
um estudo de expressão gênica confirmou que o SNP -31T>C, ou outro em forte
desequilíbrio de ligação com o mesmo (por exemplo -511C>T), é o mais funcional (DIXON et
al., 2007). O alelo -31/T parece induzir uma maior expressão do gene IL-1β em populações
americanas, porém mais estudos são necessários (EL-OMAR et al., 2000). Existe pouca
evidência de funcionalidade para o SNP +3962C>T e possivelmente o mesmo atue como
marcador para um SNP funcional, como o -31T>C (SMITH e HUMPHRIES, 2009).
Entretanto, foi evidenciado em algumas populações que indivíduos homozigotos para o alelo
T produzem quatro vezes mais IL-1β que indivíduos portadores de outros genótipos (HALL
et al., 2000; BERGHOLDT et al., 2004) (Tabelas 1 e 2).

28
Como já mencionado, a atividade biológica das citocinas IL-1α e IL-1β é indistinguível
(DINARELLO, 1997).
1.7.3. ANTAGONISTA DO RECEPTOR DA INTERLEUCINA-1 (IL-1Ra) E O GENE
IL1RN O gene IL1RN (3557) localiza-se na região 2q14.2 e é composto por quatro éxons,
embora já tenham sido identificadas variantes com cinco ou seis éxons (STEINKASSERER
et al., 1992). Existem três variantes estruturais de IL-1Ra produzidas a partir deste gene: a)
sIL-1Ra, uma molécula secretada, traduzida com peptídeo sinal e subseqüentemente
processada, originando um peptídeo de 17kDa, glicosilada e secretada com 22kDa por
monócitos, macrófagos, neutrófilos e fibroblastos; b) icIL-1RaI, uma molécula intracelular de
18kDa, traduzida sem peptídeo sinal, não glicosilada e produzida por queratinócitos e outras
células epiteliais, macrófagos e fibroblastos; c) icIL-1RaII, uma molécula intracelular de
16kDa, produzida por queratinócitos, neutrófilos, monócitos dentre outras (AREND, 1993;
MALYAK et al., 1998). A sIL-1Ra liga-se ao receptor IL-1R1 ou IL-1R2, mas não induz uma
transdução de sinal, e competitivamente inibe a ligação da IL-1α e da IL-1β. É necessário
cerca de cem vezes mais sIL-1Ra que IL-1α ou IL-1β para inibir a resposta biológica
(AREND, 1993).
Níveis elevados de IL-1Ra estão associados a marcadores de inflamação aguda,
como fibrinogênio e proteína C-reativa (CRP) (MCDERMOTT et al., 2005). O fato da IL-1Ra
inibir a transcrição do fator NF-kB12 dá suporte ao seu papel no controle da produção de
uma série de marcadores inflamatórios e mediadores, incluindo a CRP, IL-6, TNF-α e IL-1β
(CAI et al., 2005).
Dentre os polimorfismos encontrados no gene IL1RN existe o mspa1 11100C>T
(rs315952) que origina uma mutação sinônima (TSENG e KLIMPEL, 2002). Parece não
existir relação entre as variantes polimórficas deste SNP e nível de IL-1Ra, entretanto,
haplótipos de SNPs para o gene IL1RN apresentaram relação com o nível de IL-1Ra
(RAFIQ et al., 2007) (Tabelas 1 e 2).
1.7.4. RECEPTOR TIPO I DA INTERLEUCINA-1 (IL-1R1) E O GENE IL1R1
O gene IL1R1 (3554) localiza-se na região 2q12, apresenta 25933pb e 74kb. Possui
14 éxons, sendo, portanto um gene longo e complexo, além de três promotores distintos, o
que gera três transcritos que diferem entre si por suas regiões 5’UTR (untranslated region)
derivadas dos éxons 1A, 1B e 1C (YE et al., 1996). A glicoproteína transmembrana
originada possui 80kDa e 552 aminoácidos, sendo que 213 destes pertencem ao domínio

29
intracitoplasmático (SIMS et al., 1989). A sinalização gerada após a ligação do ligante não é
gerada pela molécula IL-1R1, mas por uma proteína acessória denominada IL-1RAcP que
interage com o receptor (HUANG et al., 1997).
Em IL1R1, dentre outros, há o polimorfismo pst1 1970C>T (rs2234650)
(BERGHOLDT et al., 2004). Há indícios que este SNP não afeta nenhuma seqüência de
reconhecimento de fatores transcricionais conhecida ou a estrutura secundária do RNAm,
permanecendo incerta a existência de funcionalidade (BERGHOLDT et al., 2004) (Tabelas 1
e 2).
O receptor tipo I da IL-1 é expresso por diversos tipos celulares, incluindo linfócitos T,
astrócitos, condrócitos, células endoteliais, fibroblastos, queratinócitos, neurônios, células
beta pancreáticas e fibras musculares lisas e atua como receptor para IL-1α, IL-1β e IL1-Ra
(DINARELLO, 1991; YE et al., 1996).
1.7.5. INTERLEUCINA-2 (IL-2) E O GENE IL2 O gene IL2 (3558) está localizado no cromossomo 4, na região q26-q27. Contém
quatro éxons separados por três íntrons, ocupando uma extensão total de aproximadamente
5kb (FUJITA et al., 1983). Seu RNA mensageiro maduro apresenta 1033pb e depois de
traduzido, origina um polipeptídeo precursor de 153 aminoácidos, cujo peptídeo sinal é
posteriormente removido, resultando na secreção de uma proteína madura globular com 133
resíduos de aminoácidos e massa molecular de 15,5kDa (JU et al., 1987).
Vários polimorfismos podem ser evidenciados no gene IL2, dentre os quais se
destaca o IL2-330T>G (rs2069762) (JOHN et al., 1998). Parece não estar bem esclarecida a
relação entre este polimorfismo e produção de IL-2. Estudos em população inglesa e
americana demonstram que o genótipo GG seria responsável por uma produção aumentada
de IL-2 quando comparados aos genótipos GT ou TT (JOHN et al., 1998; HOFFMANN et al.,
2001). Entretanto, também foi observado em outro estudo em uma população espanhola,
que o alelo G estaria relacionado à baixa expressão de IL2 (MATESANZ et al., 2004),
sugerindo a existência de outros polimorfismos que afetariam a regulação gênica. Todavia,
parece ainda não ter sido verificado se o verdadeiro responsável pela alteração na
expressão gênica é realmente este SNP ou outro em forte desequilíbrio de ligação com o
mesmo (SMITH e HUMPHRIES, 2009) (Tabelas 1 e 2).
Outro polimorfismo presente no gene IL2 é o IL2+166G>T (rs2069763), responsável
por uma mudança que ocorre dentro do peptídeo sinal e, portanto não afeta seqüência de
aminoácidos da IL-2 (JOHN et al., 1998) (Tabelas 1 e 2).
A IL-2 é uma citocina que participa no controle da proliferação e diferenciação de
células do sistema imunológico. É produzida principalmente por linfócitos T CD4+ ativados e

30
induz o crescimento de linfócitos T in vitro, enquanto seu papel in vivo é controverso. A IL-2
também é produzida por linfócitos T CD8+, células dendríticas e linfócitos T regulatórios. É
sintetizada após estimulação celular por antígenos, IL-1, aloantígenos ou mitógenos. A
expressão do receptor de IL-2 em linfócitos T é estritamente dependente da ativação do
receptor de linfócito T (TCR). A IL-2 afeta o desenvolvimento de linfócitos T citotóxicos e
supressores, estimula a diferenciação e aumenta a atividade de células natural killer, e
promove o crescimento e diferenciação de linfócitos B. Talvez o principal papel da IL-2
esteja relacionado a auto tolerância, uma vez que promove a homeostase e funcionamento
de linfócitos T regulatórios (OLEJNICZAK e KASPRZAK, 2008).
1.7.6. INTERLEUCINA-4 (IL-4) E O GENE IL4 O gene IL4 (3565) está localizado no cromossomo 5, em q31.1. Possui quatro éxons
e três íntrons, abrangendo aproximadamente 10kb. IL4 codifica um RNAm de 921 pb, que
por sua vez traduz uma proteína de 153 aminoácidos, sendo que os primeiros 24
correspondem ao peptídeo sinal. A glicoproteína secretada possui 129 aminoácidos e peso
molecular entre 15 e 19kDa. Há registros da ocorrência de um RNAm adicional que não
possui 48pb que codifica os resíduos de aminoácidos de 22 a 37, originado através do
splicing alternativo do éxon 2. Este RNAm origina a IL-4 delta 2, cuja expressão é tecido
específica (CHOMARAT e BANCHEREAU, 1997).
Algumas variações polimórficas são observadas no gene IL4, incluindo -1098T>G
(rs2243248), -590C>T (rs2243250) e -33C>T (rs2070874) (KABESCH et al., 2003). Há
evidências em população americana e austríaca de que o alelo -590/T (ROSENWASSER e
BORISH, 1997) bem como os haplótipos -590; -33/TT e -590; -33/TC estão associados a
altos níveis de IL-4, enquanto os haplótipos -590; -33/CC e -590; -33/CT estão associados a
baixos níveis de IL-4 (KLEINRATH et al., 2007), sugerindo que o SNP -590C>T seja o mais
funcional. O SNP -1098T>G está em desequilíbrio de ligação com -590C>T e a
funcionalidade do mesmo parece ainda não estar esclarecida (BRENNER et al., 2007)
(Tabelas 1 e 2).
A IL-4 é produzida predominantemente por linfócitos Th2. Ela promove a proliferação
e diferenciação de linfócitos B, a expressão de moléculas HLA classe II em linfócitos B com
conseqüente apresentação antigênica para linfócitos T, regulando assim a expressão das
classes de imunoglobulinas. Além disso, estimula a proliferação de timócitos e linfócitos T
(PAUL, 1991).

31
1.7.7. CADEIA ALFA DO RECEPTOR DA INTERLEUCINA-4 (IL-4Ra) E O GENE IL4RA
O gene IL4RA (3566) localiza-se no cromossomo 16, em p12.1–p11.2 e abrange
aproximadamente 3,6kb. Origina um precursor de 825 aminoácidos, que após processado,
resulta em uma proteína madura de 800 aminoácidos e peso molecular entre 140kDa
(CHOMARAT e BANCHEREAU, 1997).
Dentre os polimorfismos descritos para este gene está o -1902G>A (rs1801275)
(CAGGANA et al., 1999), que resulta na mudança de glutamina para arginina na posição
576 do peptídeo (muitas vezes referido como posição 551 se o peptídeo sinal não for
incluído na contagem). Apesar de um estudo recente em população holandesa envolvendo
esclerose sistêmica mostrar que este polimorfismo não influencia a expressão gênica
(BROEN et al., 2012), outros estudos demonstraram que devido a sua localização no
domínio intracelular do peptídeo, essa alteração interfere na sinalização intracelular
(MITSUYASU et al., 1998; NELMS et al., 1999), sendo o alelo IL4RA+1902/G associado a
um aumento na sinalização do receptor (HERSHEY et al., 1997) e conseqüente aumento da
expressão dos genes regulados por IL-4 e IL-13, uma vez que apresenta estas citocinas
como ligantes (KELLY-WELCH et al., 2003) (Tabelas 1 e 2).
O receptor da IL-4 (IL-4RA) é formado por duas subunidades, a α que se liga com
alta afinidade ao ligante e a γτ, comum a outros receptores de citocinas, que amplifica o
sinal da subunidade α (IZUHARA e SHIRAKAWA, 1999; NELMS et al., 1999). A subunidade
α também faz parte do receptor da IL-13, juntamente com a proteína de ligação IL13Rα1
(SMITH e HUMPHRIES, 2009).
1.7.8. INTERLEUCINA-6 (IL-6) E O GENE IL6
O gene IL6 (3569) está localizado no cromossomo 7, em p21. Possui cinco éxons e
quatro íntrons distribuídos em uma região de aproximadamente 5kb (YASUKAWA et al.,
1987; TANABE et al., 1988). IL6 codifica um RNA mensageiro de 1,3kb que traduz um
polipeptídeo precursor de 212 aminoácidos. Após processamento para remoção do peptídeo
sinal, é produzida uma proteína de 186 aminoácidos, que sofre alterações pós
transcricionais, originando cinco isoformas de massas moleculares variando entre 21 e
28kDa (MAY et al., 1988).
Algumas variações polimórficas são observadas no gene IL6, incluindo os SNPs IL6-
174G>C (rs1800795) (FISHMAN et al., 1998) e IL6nt565 (rs1800797) (TERRY et al., 2000).
Existe pouco consenso quanto à relação polimorfismo e produção de IL-6 (ENDLER et al.,
2004; HEGEDUS et al., 2007). Kilpinen et al. (KILPINEN et al., 2001) estudando a

32
população da Finlândia, observaram associação entre este polimorfismo e a produção in
vivo ou in vitro de IL-6 apenas em neonatos verdadeiramente “naive”, enquanto nos adultos
o contato prévio com antígenos exógenos modificaria sua resposta. Entretanto, um estudo
em americanos demonstrou o envolvimento do polimorfismo IL6-174G>C na transcrição do
gene IL6. O alelo -174/G induz a expressão de IL-6 em níveis 60% maiores que os induzidos
pelo alelo -174/C. Indivíduos homozigotos para o alelo G ou heterozigotos são
caracterizados como alto produtores de IL-6 e apresentam altos níveis plasmáticos desta
citocina. Já indivíduos homozigotos para o alelo C são baixos produtores de IL-6 (FISHMAN
e BRANCH, 2009). Em dois estudos recentes realizados em população húngara e alemã
não foram observadas associações entre o polimorfismo IL6-174 e níveis de IL-6 (KISZEL et
al., 2007; HUTH et al., 2009), indicando que talvez exista outro loci polimórfico que esteja
afetando a expressão de IL-6 (SMITH e HUMPHRIES, 2009). Outros autores sugerem que
para o gene IL6 sítios polimórficos distintos não interferem na produção de IL-6
independentemente um do outro, e um polimorfismo influencia o efeito funcional de outros
(TERRY et al., 2000). O genótipo nt565/A:A apresenta evidencias em população romena de
estar associado a alta produção de IL-6, enquanto os genótipos nt565/G:A e G:G parecem
estar associados a produção intermediária e baixa, respectivamente (STOICA et al., 2010)
(Tabelas 1 e 2).
IL-6 é uma citocina pleiotrópica, produzida por células da resposta imune inata e
adaptativa como linfócitos T e B, macrófagos, monócitos, fibroblastos e células endoteliais,
além de algumas células tumorais (MATSUDA e HIRANO, 1990; VAN SNICK, 1990). Não é
constitutivamente expressa, mas indutível em resposta a estímulos inflamatórios diversos
como IL-1, TNF-α e infecções virais (TERRY et al., 2000). Suas atividades biológicas
incluem a participação nas respostas imunológicas, hematopoiese e reações de fase aguda.
IL-6 é geralmente considerada uma citocina pró inflamatória, mas estudos como o de XING
et al. (XING et al., 1998) evidenciam sua propriedade antiinflamatória. A expressão
desregulada de IL-6 tem sido associada a enfermidades como plasmocitoma, mieloma e
doenças inflamatórias crônicas proliferativas (NAKA et al., 2002).
1.7.9. INTERLEUCINA-10 (IL-10) E O GENE IL10
O gene IL10 (3586) está localizado no cromossomo 1, em q31-32. Possui cinco
éxons separados por quarto íntrons, dispostos ao longo de 4,7kb. Encontra-se situado
próximo aos genes IL-19 e IL-20 (ESKDALE et al., 1997). O gene IL10 codifica inicialmente
um polipeptídeo de 178 aminoácidos, sendo dezoito destes constituintes do peptídeo sinal.
Após processamento, a proteína madura apresenta 160 aminoácidos e um peso molecular

33
de aproximadamente 18kDa, organizada na forma de um homodímero (VIEIRA et al., 1991;
WINDSOR et al., 1993).
Vários polimorfismos têm sido observados no gene IL10, incluindo os SNPs -
1082G>A (rs1800896), -819C>T (rs1800871) e -592C>A (rs1800872) (ESKDALE et al.,
1997; TURNER et al., 1997) localizados na região promotora. Eles parecem estar
associados a diferentes níveis de expressão gênica, pois possivelmente alteram sítios
específicos de reconhecimento de fatores transcricionais, afetando assim os níveis de
produção da citocina (JOHN et al., 1998; POWELL et al., 2000). Em indivíduos americanos e
ingleses, os alelos −1082/G, −819/C e −592/C estariam associados à alta produção de IL-
10, enquanto seus respectivos alelos estariam relacionados à baixa produção
(ROSENWASSER e BORISH, 1997; JOHN et al., 1998). Baixos níveis de IL-10 foram
observados em indivíduos brasileiros portadores dos genótipos −592/C:A ou −592/A:A
(CLAUDINO et al., 2008) (Tabelas 1 e 2).
IL-10 é expressa por linfócitos T e B, células NK, monócitos, assim como por
diversas outras células do sistema imunológico ou não e age em células alvo
hematopoiéticas ou de outra natureza. Apresenta importante função regulatória, pois sua
expressão afeta as respostas imunológica e inflamatória. Suprime a produção de citocinas
pro inflamatórias por monócitos e neutrófilos e age como fator desativador de macrófagos.
Estimula a proliferação de linfócitos B e mastócitos e pode estimular ou inibir linfócitos T,
dependendo do subgrupo em questão (MOORE et al., 2001).
1.7.10. CADEIA BETA DA INTERLEUCINA-12 (IL-12b) E O GENE IL12B O gene IL12B (3593) está localizado no cromossomo 5, na região q31.1-q33.1
ocupando uma extensão de 15,7kb. Origina a subunidade β da interleucina-12 e da
interleucina-23, também denominada p40, que possui 40kDa e é composta por 306
aminoácidos (BRUNDA, 1994). p40 forma heterodímeros com p35 (originada pelo gene
IL12A) para formar a IL-12 e com p19 (originada pelo gene IL23A) para formar a IL-23
(TRINCHIERI et al., 2003).
Dentre os polimorfismos presentes no gene IL12B está o -1188C>A (rs3212227)
(HALL et al., 2000). Embora este polimorfismo esteja localizado na região 3’UTR e não
altere a seqüência de aminoácidos da proteína originada, é útil como marcador genético
para o gene em questão, cujo produto é um dos maiores reguladores da direção da resposta
imunológica (Th1/Th2) em humanos (GATELY et al., 1998). Em algumas populações,
incluindo a americana, indivíduos -1188/A:A são considerados baixo produtores de IL-12,
enquanto heterozigotos são produtores intermediários e indivíduos -1188/C:C são alto
produtores de IL-12 (SEEGERS et al., 2002; BERGHOLDT et al., 2004) (Tabelas 1 e 2).

34
1.7.11. FATOR DE NECROSE TUMORAL-α (TNF-α) E O GENE TNFA
O gene TNFA (7124) está localizado no cromossomo 6 humano, em p21.3. Possui
quatro éxons e três íntrons dispostos em um segmento de 3,6kb. Encontra-se na região
classe III do MHC, 210kb a montante do lócus HLA-B, além de ser flanqueado pelos genes
LTB e LTA, codificadores da linfotoxina-β e linfotoxina-α, respectivamente (NEDWIN et al.,
1985; RINK e KIRCHNER, 1996). O RNA mensageiro codifica inicialmente um polipeptídeo
de 26kDa com 233 aminoácidos, sendo que os primeiros 76 aminoácidos correspondem a
um peptídeo sinal envolvido na secreção da proteína. Este peptídeo é clivado por enzimas
específicas após ser ancorado na membrana celular, resultando em uma proteína madura
de 157 aminoácidos, com 17kDa, que pode então ser secretada. Em condições biológicas,
TNF-α apresenta-se como um homotrímero, de peso molecular aproximado de 50kDa,
(PENNICA et al., 1984; AGGARWAL et al., 1985; NEDWIN et al., 1985).
Dentre os SNPs observados no gene TNFA existem o -238G>A (rs361525) e o -
308G>A (rs1800629) (KIM et al., 2003; LU et al., 2005). Alguns estudos demonstram o alelo
-238/A associado à baixa secreção de TNF-α, enquanto outros não verificaram relação entre
este polimorfismo e o nível de citocina secretado (SMITH e HUMPHRIES, 2009). Já o alelo
TNFA-308/A tem sido demonstrado em indivíduos australianos e do Reino Unido,
aumentando cerca de duas vezes a expressão do gene TNFA e, conseqüentemente, os
níveis plasmáticos da citocina TNF-α, possivelmente por originar um sitio de ligação
diferente para proteínas nucleares (KROEGER et al., 1997; WILSON et al., 1997). O número
de alelos -308/A que um indivíduo possui também influência os níveis plasmáticos de TNF-
α, estando os genótipos -308/A:A e -308/G:A associados à alta produção da citocina e o
genótipo -308/G:G associado à baixa produção da mesma, em indivíduos americanos e do
Reino Unido (WILSON et al., 1997; PERREY et al., 1998; TAMBUR et al., 2001) (Tabelas 1
e 2).
TNF é uma citocina pró inflamatória, com efeitos quimiotáticos para neutrófilos e
monócitos. As principais células produtoras de TNF são os monócitos e os macrófagos
ativados, mas também pode ser sintetizado por mastócitos, basófilos, eosinófilos, células
NK, linfócitos T e B. Há indícios de que exerça proteção contra infecções bacterianas,
fungícas, parasíticas e virais ou outros estímulos (MCDERMOTT, 2001). A deleção do gene
TNF em camundongos não interfere no desenvolvimento destes animais, exceto pelo
comprometimento da arquitetura do baço (MARINO et al., 1997). Talvez esse fato esteja
relacionado com a participação do TNF na organização e organogênese de tecidos linfóides
secundários, tais como o baço e placas de Peyer (GUO et al., 1999).

35
1.7.12. FATOR TRANSFORMANTE DE CRESCIMENTO-β1 (TGF-β1) E O GENE TGFB1
TGF-β1, juntamente com outras 40 proteínas, faz parte da superfamília TNF-β. Em
humanos são expressas três isoformas, TGF-β1, TGF-β2 e TGF-β3, codificadas por genes
únicos localizados em diferentes cromossomos (KINGSLEY, 1994). O gene TGFB1 (7040)
está localizado no cromossomo 19 humano, na região q13.1. Possui sete éxons distribuídos
em uma extensão de 100kb (ROBERTS e SPORN, 1992). TGF-β1 é inicialmente traduzido
como um polipeptídeo de 390 resíduos de aminoácidos, que apresenta uma seqüência sinal,
e é processada por uma endoprotease que a converte na forma biologicamente ativa, de
112 aminoácidos (BLANCHETTE et al., 1997).
Dentre os SNPs identificados no gene TGFB1 encontram-se dois localizados no
primeiro éxon, +869T>C (rs1800470), +915G>C (rs1800471) (CAMBIEN et al., 1996). Estes
polimorfismos resultam na mudança do aminoácido leucina para prolina e do aminoácido
arginina para prolina, nos respectivos produtos protéicos. A combinação genotípica das
posições +869T>C e +915G>C permite classificar os indivíduos em baixo (CG/CC, CC/CC,
TC/TC, TC/CC), médio (TG/CC, CG/CG, TG/TC) ou alto (TG/TG, TG/CG) produtores de
TGF-β1, conforme estudo realizado em indivíduos do Reino Unido (PERREY et al., 1998)
(Tabelas 1 e 2).
TGF-β1 é produzida e secretada por diversas células, como plaquetas, macrófagos,
fibroblastos, linfócitos T e B, em resposta a estresse, injuria e ação viral, além de participar
da resposta imunológica durante a carcinogênese (MASSAGUE, 1990; ROBERTS e
SPORN, 1992). TGF-β1 também estimula a resposta inflamatória localizada através do
aumento da capacidade de adesão leucocitária ao endotélio vascular e à matriz extracelular
(WAHL, 1992), assim como através da quimiotaxia de neutrófilos, monócitos, linfócitos e
mastócitos e indução destas células a secretar citocinas inflamatórias, como IL-1, TNF e IL-
6. Dentre os tecidos e órgãos do corpo é expressa em níveis mais elevados por células da
medula óssea e do baço, além de apresentar níveis plasmáticos consideráveis (5ng\ml),
indicando sua possível ação endócrina (REIBMAN et al., 1991).
1.7.13. INTERFERON-γ (IFN-γ) E O GENE IFNG
O gene IFNG (3458) está localizado no cromossomo 12, em q14. Ocupa uma região
de 5961pb e é composto por quatro éxons e três íntrons (GRAY e GOEDDEL, 1982). O RNA
mensageiro transcrito pelo gene traduz um polipeptídeo de 166 aminoácidos, que após
processamento para remoção do peptídeo sinal, passa a apresentar 143 aminoácidos. A

36
forma biologicamente ativa do IFN-γ consiste em um homodímero de 34kDa (GRIGGS et
al., 1992).
Vários SNPs são encontrados no gene IFNG, dentre os quais está o +874A>T
(rs2430561), sendo os genótipos T/T, T/A e A/A associados à alta, intermediária e baixa
produção de IFN-γ, respectivamente, conforme estudo realizado em indivíduos do Reino
Unido (PERREY et al., 1998) (Tabelas 1 e 2).
IFN-γ é produzido e secretado principalmente por linfócitos T e células NK. É
constitutivamente expresso em baixas quantidades. Diante de estímulos como trauma,
infecções virais, câncer e manifestações auto-imunes, maiores quantidades são produzidas.
Alterações no mecanismo de ação do IFN-γ diminuem a resistência contra infecções virais e
bacterianas, principalmente quando estas são eliminadas por macrófagos ativados. Apesar
de ser considerada uma citocina pró inflamatória, em algumas circunstâncias pode exercer
papel antinflamatório (MUHL e PFEILSCHIFTER, 2003; BILLIAU e MATTHYS, 2009).

37
Tabela 1. Lista de SNPs.
Gene de citocina
Localização gênica no cromossomo
Número de identificação do SNP
Posição cromossômica do SNP (referência)
Referência Localização
IL1A 2q14 rs1800587 113259431 (TSENG e KLIMPEL, 2002)
5’-UTR
IL1B 2q14 rs16944 113311338 (DI GIOVINE et al., 1992)
Promoter
rs1143634 113306861 (TSENG e KLIMPEL, 2002)
Coding/ synonymous
IL1R1 2q12 rs2234650 102124759 (BERGHOLDT et al., 2004)
Distal promoter
IL1RN 2q14.2 rs315952 113606775 (TSENG e KLIMPEL, 2002)
Coding/ synonymous
IL4RA 16p12.1–p11.2 rs1801275 27281901 (CAGGANA et al., 1999)
Coding/ missense
IL12B 5q31.1–33.1 rs3212227 158675528 (HALL et al., 2000)
3’-UTR
IFNG 12q14 rs2430561 66838787 (PERREY et al., 1998)
Intron
TGFB1 19q13.1 rs1800470 46550761 (CAMBIEN et al., 1996)
Coding/ missense
rs1800471 46550716 (CAMBIEN et al., 1996)
Coding/ missense
TNF 6p21.3 rs1800629 31651010 (LU et al., 2005)
Promoter
rs361525 31651080 (YEE et al., 2001)
Promoter
IL2 4q26-27 rs2069762 123597430 (JOHN et al., 1998)
Promoter
rs2069763 123596932 (JOHN et al., 1998)
Coding/ synonymous
IL4 5q31.1 rs2243248 132036543 (KABESCH et al., 2003)
Promoter
rs2243250 132037053 (KABESCH et al., 2003)
Promoter
rs2070874 132037609 (KABESCH et al., 2003)
5’-UTR
IL6 7p21 rs1800795 22733170 (FISHMAN et al., 1998)
Promoter
rs1800797 22732746 (TERRY et al., 2000)
Promoter
IL10 1q31–q32 rs1800896 205013520 (TURNER et al., 1997)
Promoter
rs1800871 205013257 (TURNER et al., 1997)
Promoter
rs1800872 205013030 (ESKDALE et al., 1997)
Promoter

38
Fonte: A autora, baseando-se em dados do Cytokine Genotyping kit (Dynal Biotech, Invitrogen® Corporation, Brown Deer, WI, USA) e http://www.ncbi.nlm.nih.gov. Tabela 2. Lista de SNPs e funcionalidade.
Gene de citocina
SNP Número de identificação do SNP
Alelo, genótipo ou haplótipo
Expressão gênica Referência
IL1A -889C>T rs1800587 T:T Aumentada (DOMINICI et al., 2002)
IL1B -511T>C rs16944 - Sem efeito (DIXON et al., 2007)
+3962C>T rs1143634 T:T Aumentada (HALL et al., 2000) (BERGHOLDT et al., 2004)
IL1R1 pst1 1970C>T rs2234650 - Sem efeito (BERGHOLDT et al., 2004)
IL1RN mspa1 11100C>T
rs315952 - Sem efeito (TSENG e KLIMPEL, 2002)
IL4RA +1902G>A rs1801275 G Aumento na sinalização do receptor
(HERSHEY et al., 1997)
IL12B -1188A>C rs3212227 C:C Produção de IL-12 aumentada
(SEEGERS et al., 2002) (BERGHOLDT et al., 2004)
IFNG +874T>A rs2430561 T:T T:A A:A
Aumentada Intermediária Baixa
(PERREY et al., 1998)
TGFB1 codon 10C>T rs1800470 T:T/G:G T:C/G:G T:C/G:C C:C/G:G T:T/G:C
Aumentada Intermediária
(PERREY et al., 1998) codon 25G>C rs1800471
TNF -308G>A rs1800629 A:A G:A
Aumentada (PERREY et al., 1998)
-238G>A rs361525 A Diminuída (SMITH e HUMPHRIES, 2009)
IL2 -330T>G rs2069762 G:G Aumentada (JOHN et al., 1998)
+166G>T rs2069763 - Sem efeito (JOHN et al., 1998)
IL4 -1098T>G rs2243248 - Sem efeito (BRENNER et al., 2007)
-590C>T rs2243250 -590; -33/TT -590; -33/TC -590; -33/CC -590; -33/CT
Aumentada Diminuída
(KLEINRATH et al., 2007)
-33T>C rs2070874
IL6 -174G>C
rs1800795 G:G G:C
Aumentada (FISHMAN e BRANCH, 2009)
nt565G>A rs1800797 A:A G:A G:G
Aumentada Intermediária Baixa
(STOICA et al., 2010)

39
IL10 -1082A>G rs1800896 G Aumentada (ROSENWASSER e BORISH, 1997)
-819C>T rs1800871 C Aumentada (ROSENWASSER e BORISH, 1997)
-592C>A rs1800872 C Aumentada (ROSENWASSER e BORISH, 1997)
Fonte: A autora.

40
JUSTIFICATIVA
Suscetibilidade ou resistência a diversas doenças infecciosas envolvem mecanismos
complexos, nos quais genes polimórficos da resposta imunológica estão envolvidos
(MARTIN e CARRINGTON, 2005). No caso da hepatite C, há indícios de que a genética do
hospedeiro pode afetar não apenas a taxa de progressão da doença, como também a
resposta ao tratamento e o dano hepático (PAPATHEODORIDIS e PARASKEVIS, 2008).
A infecção crônica pelo HCV tornou-se um problema tanto em nível global como em
nível individual, devido, em parte, ao alto custo do tratamento padrão com pegIFN-alfa e
ribavirina, aos efeitos colaterais e à baixa taxa de RVS, observada principalmente em
pacientes infectados pelo genótipo viral 1 (40–50%). Dentre os pacientes, muitos não serão
curados por meio de tratamento, principalmente aqueles de ascendência africana quando
comparados aos de ascendência européia, que possuem probabilidade significativamente
maior de serem curados. Além disso, o tratamento é muitas vezes mal tolerado por causa
dos efeitos colaterais, que incluem anemia, leucopenia, trombocitopenia e sintomas
neuropsiquiátricos, o que impede alguns pacientes de completarem o tratamento. Por estas
razões, a identificação dos determinantes genéticos da resposta ao tratamento possui alta
prioridade (ASSELAH, 2010). O único SNP cuja genotipagem é aceita até o presente
momento como preditora de resposta ao tratamento é o IL28B rs12979860; seu genótipo
C:C apresenta associação bem estabelicada com maiores taxas (duas vezes maior) de RVS
em indivíduos infectados pelos genótipos 1 ou 4 do HCV, bem como à resolução
espontânea da infecção pelo HCV (MACIAS et al., 2011). Atualmente, existem testes
comerciais disponíveis para a determinação do genótipo, que já começa a ser incorporada
na discussão informada sobre o tratamento com os pacientes.
Entretanto, a determinação de outros marcadores poderá oferecer alternativas para
predição da resposta ao tratamento. A caracterização de variantes polimórficas em genes de
citocinas de uma população com hepatite C crônica tratada com pegIFN-alfa e ribavirina
permitirá avaliar quais estão associadas à resposta positiva ou neutra ao tratamento, uma
vez que pouco se sabe quanto aos fatores que contribuem para a resposta do paciente
frente ao tratamento.
Prever o grau de dano hepático que o paciente desenvolverá também é uma
ferramenta eficaz nas mãos do clínico, porém atualmente não existem mecanismos
suficientemente eficazes para fazer essa predição. O conhecimento dos marcadores em
genes de citocinas associados ao grau de dano hepático apresenta uma significância
prognóstica em pacientes cronicamente infectados pelo HCV, permitindo dirigir a terapia de
forma mais agressiva para aqueles com aumento do risco de progressão da doença.

41
Embora existam estudos que relacionem variantes polimórficas em genes de
citocinas e intensidade do dano hepático ou resposta ao tratamento na hepatite C crônica
(ROMERO-GOMEZ et al., 2011), alguns trabalhos têm apresentado resultados
contraditórios, devido ao mau delineamento do estudo. A maioria dos estudos utiliza
amostras heterogêneas quanto ao genótipo do HCV, com ou sem infecção concomitante
pelo vírus da hepatite B (HBV) e vírus da imunodeficiência humana (HIV). Portanto, mais
pesquisas são necessárias para esclarecer o real papel de variantes genéticas no processo
de fibrose hepática, bem como na resposta ao tratamento (BATALLER e BRENNER, 2005).
Além disto, não foram encontrados estudos com este enfoque realizados na população
brasileira, limitando-se apenas a estudos caso-controle que envolve apenas pacientes com
hepatite crônica e/ou pacientes com eliminação viral espontânea. Portanto, o presente
trabalho apresenta informações inéditas sobre a relação entre variantes polimórficas em
genes de citocinas IL1A, IL1B, IL1R1, IL1RN, IL4RA, IL12B, IFNG, TGFB, TNFA, IL2, IL4,
IL6, IL10 e dano hepático/resposta ao tratamento da hepatite C na população brasileira, uma
vez que esses genes participam ativamente da resposta imunológica frente ao HCV.

42
OBJETIVOS
1.8. OBJETIVO GERAL
Investigar a existência de associações entre variantes polimórficas em genes de
citocinas e de receptores de citocinas na resposta ao tratamento de pacientes infectados
com o HCV, assim como no grau do dano hepático.
1.9. OBJETIVOS ESPECÌFICOS
Caracterizar os genótipos e estimar as freqüências alélicas, genotípicas e haplotípicas
(quando possível) de variantes polimórficas em genes de citocinas para as posições -
889C>T (rs1800587) do gene IL1A, -511T>C (rs16944) e +3962C>T (rs1143634) do
gene IL1B, pst1 1970C>T (rs2234650) do gene IL1R1, mspa1 11100C>T (rs315952) do
gene IL1RN, +1902G>A (rs1801275) do gene IL4RA, -1188A>C (rs3212227) do gene
IL12B, +874T>A (rs2430561) do gene IFNG, códon 10C>T (rs1800470) e códon 25G>C
(rs1800471) do gene TGFB, -308G>A (rs1800629) e -238G>A (rs361525) do gene
TNFA, +166G>T (rs2069763) e -330T>G (rs2069762) do gene IL2, -1098T>G
(rs2243248), -590C>T (rs2243250) e -33T>C (rs2070874) do gene IL4, -174G>C
(rs1800795) e nt565G>A (rs1800797) do gene IL6, -1082A>G (rs1800896), -819C>T
(rs1800871) e -592C>A (rs1800872) do gene IL10 em uma amostra de indivíduos com
hepatite C crônica, através da técnica de PCR-SSP;
Verificar estatisticamente a existência de possíveis associações entre as variantes
polimórficas em genes de citocinas com a resposta ao tratamento e grau de dano
hepático.

43
4. CAPÍTULO I

44
Influence of cytokine and cytokine receptor gene polymorphisms on the degree of liver damage in patients with chronic hepatitis C
Sara Tatiana Moreira1, Giovanni Faria Silva2, Camila Fernanda Verdichio de Moraes3, Rejane Maria
Tomasini Grotto3, Maria Inês de Moura Campos Pardini3, Ricardo Alberto Moliterno1, Maria da Graça
Bicalho4
1Immunogenetics Laboratory, Basic Sciences of Healthy Department, Maringá State University, UEM,
Maringá, Paraná, Brazil. 2Gastroenterology Division, Internal Medicine Department, Botucatu Medical School, São Paulo State
University, UNESP, Botucatu, São Paulo, Brazil. 3Molecular Biology Laboratory of Blood Transfusion Center, Botucatu Medical School, São Paulo
State University, UNESP, Botucatu, São Paulo, Brazil. 4Immunogenetics and Histocompatibility Laboratory, Genetics Department, Paraná Federal University,
UFPR, Curitiba, Paraná, Brazil
Correspondence to:
Dr. Ricardo Alberto Moliterno
Laboratório de Imunogenética, Departamento de Ciências Básicas e da Saúde, Universidade
Estadual de Maringá, Av. Colombo, 5790, 87020-900, Maringá, PR, Brasil
Tel: v 3011 4864
Fax: (+55 44) 3011 4931
e-mail: [email protected]

45
ABSTRACT
Hepatic fibrosis may be the result of repetitive injury to the hepatocytes caused by HCV
infection and the immune response to it, leading to a failure in the regenerative process and deposition
of an abundant amount of extracellular matrix. Cytokines regulating the inflammatory response to
injury modulate hepatic fibrogenesis in vivo and in vitro. Single nucleotide polymorphisms located in
the regulating/encoding regions of cytokines genes may influence both the expression and secretion
of cytokines, resulting in different phenotypes of production, which may contribute to hepatic
fibrogenesis in HCV infection. Therefore, the aim of this study was to determine the genotype of 22
SNPs found in 13 genes of cytokines/cytokine receptors to assess the influence of polymorphic
variants in the degree of liver damage in Brazilian patients chronically infected with HCV genotype 1
only. Polymorphic variants for TNFA-308, IL6-174, IL6nt565 and IL4RA+1902 were associated with
the degree of liver damage. We conclude that gene variants of cytokines/receptors may influence liver
damage in patients chronically infected by HCV genotype 1.
Keywords: hepatitis C, liver fibrosis, hepatic cirrhosis, cytokine, polymorphism

46
INTRODUCTION
The hepatitis C virus (HCV) is a pathogen responsible for the chronic infection in around two
thirds of infected individuals, due to its ability to evade both the innate as well as acquired immunity
[1]. Chronic infection may be evidenced by the liver histopathological changes, which begin with an
inflammatory process often associated with fibrosis, may progress to cirrhosis and, in some cases, to
hepatocellular carcinoma [2]. Fibrosis is the result of repetitive injuries caused to the hepatocytes by
HCV infection and the immune response to it, leading to a failure in the regenerative process and
deposition of an abundant amount of extracellular matrix. The progressive accumulation of matrix
originates nodules, causing injury and hepatic cirrhosis, which are responsible for a high rate of
morbidity and mortality worldwide [3, 4]. Although an inflammatory process precedes fibrogenesis,
studies have shown that it is not always characterized by a persistent inflammation. Therefore, the
mechanisms controlling fibrogenesis are partially different from those regulating inflammation [5].
There is strong evidence that cytokines regulate the inflammatory response to injury and modulate
hepatic fibrogenesis both in vivo and in vitro [4, 6, 7].
The intensity of liver damage is highly variable among individuals and may be influenced by
viral, environmental and host-related factors [8]. The diversity of genes involved in the immune
response could partly explain the variability in the response to infection by the same etiological agent
[9]. Single nucleotide polymorphisms (SNPs), located in regulatory/coding regions of cytokine genes,
might influence the expression and secretion of cytokines, resulting in the production of different
phenotypes [10, 11]. Furthermore, changes in the levels of different cytokines seem to contribute to
hepatic fibrogenesis in HCV infection [12-14].
Although there are studies relating polymorphic variants in cytokine genes to the severity of
liver damage in chronic hepatitis C [15], some studies have yielded contradictory results due to poor
study design. Most studies apply heterogeneous HCV genotype samples, with or without concurrent
hepatitis B virus (HBV) and human immunodeficiency virus (HIV) viral infections. So, further research
is required to clarify the current role of genetic variants in liver fibrosis [16]. Moreover, no studies using
this approach were carried out in Brazil yet. Therefore, the objective of this study was to evaluate the
influence of polymorphic variants in cytokine genes and cytokine receptor genes in the degrees of liver
damage in Brazilian patients chronically infected with HCV genotype 1 only.
METHODOLOGY
Casuistry
Seven hundred and sixty one patients were seen at the Division of Gastroenterology,
University Hospital at Botucatu’s Medicine School, Brazil and diagnosed as infected with HCV,
between September 2004 and January 2009. Of these, 141 unrelated patients were included in this
study, according to the following criteria: infection only by HCV genotype 1, diagnosis based on the
presence of viral RNA confirmed by molecular tests, chronicity characterized by liver biopsy and
persistence of viral RNA in serum, liver biopsy performed prior to the beginning of antiviral treatment,

47
and signing the consent form. Individuals with risk factors such as alcohol or drug users during
treatment, patients with positive serology for hepatitis B and/or human immunodeficiency virus, or
hemophiliac patients with other liver diseases were excluded since they could compromise the course
of hepatitis C and lead to wrong conclusions. Clinical data were obtained from medical records.
Patients were regarded as a mixed ethnic group (excluding Oriental and African ancestry), given that
phenotypic evaluations based on physical characteristics such as skin color are not good predictors of
genomic African ancestry in Brazilian populations [17]. The study protocol was approved by the Ethics
Committee in Human Research, Botucatu’s Medicine School, Universidade Estadual Paulista.
Liver biopsy
The degree of fibrosis was determined by histological liver assessment. Percutaneous
biopsies were performed by a pathologist with the use of Tru Cut or Menghini needles. The fragment
analysis was only performed when at least eight portal areas could be seen. Tissues were stained with
hematoxylin-eosin, Masson's trichrome and reticulin stain and analyzed by the Metavir scale system
[18], which classifies the liver sample from zero to four (F0 - no fibrosis, F1 - portal fibrosis without
septa, F2 - portal fibrosis with few septa, F3 - portal fibrosis with many septa, F4 – cirrhosis).
Patients were grouped according to their degree of fibrosis: the absence of fibrosis or patients
with initial degrees of fibrosis (F0-F2, n=84), patients with advanced degrees of fibrosis or cirrhosis
(F3-F4, n=57), without cirrhosis (F0-F3, n=103), and cirrhosis (F4, n=38).
Viral genotyping
HCV genotyping was defined through reverse line probe assay technique (INNOLIPA® v.1.0,
Innogenetics, Ghent, Belgium), according to the manufacturer’s instructions. This genotyping was
preceded by the extraction of total RNA present in patient's plasma, followed by reverse-transcription-
polymerase chain reaction (RT-PCR), using the Amplicor HCV test version 2.0 kit (Roche Diagnostic
System, Branchburg, NJ, USA).
Genomic DNA extraction
Genomic DNA was extracted from whole blood obtained from an initial volume of 10 mL,
collected into tubes containing EDTA. The extraction was performed through Salting-out technique
[19] or BioPur commercial kit (Biometrix Diagnóstica, Curitiba, Pr, Brasil).
Genotyping of polymorphic variants in cytokine genes
The genotyping of the polymorphic variants of cytokine genes was performed with 75-125
ng/μl of DNA, by PCR-SSP (polymerase chain reaction with sequence-specific primers) using the
Cytokine Genotyping kit (Dynal Biotech, Invitrogen® Corporation, Brown Deer, WI, USA) according to
manufacturer’s instructions. It were determined the alleles, genotypes and haplotypes for 22 SNPs
located in 13 cytokine genes (Table 01). The amplified fragments were separated on 2% agarose gel
in a horizontal electrophoresis system. The results interpretation was performed according to standard
forms provided by the manufacturer of the Cytokine Genotyping kit.

48
Statistical analysis
The allelic and genotypic frequencies were obtained by direct counting. Haplotype frequencies
were estimated based on the genotype frequencies observed, through the likelihood method using the
EM algorithm (expectation maximization), which is part of an integrated software package available in
the Arlequin version 3.5 [20]. Convert software was used to prepare the input file for the Arlequin
package [21].
The comparison of frequencies in each sub-sample was performed by 2x2 contingency tables
using the chi-square or Fisher's exact test, when n≤5 in any cell. Differences were considered
statistically significant when P≤0.05. The association strength was assessed by Odds Ratio (OR)
obtained with a confidence interval (CI) of 95% [22]. Haldane correction was employed when n≤5 in
any cell [23]. Statistical analyzes were performed using the Vassar Stats software
(http://faculty.vassar.edu/lowry/VassarStats.html). The parameters of linkage disequilibrium D', r2 and
p were performed using the Arlequin 3.5 software package [20]. Stepwise logistic regression was used
to assess associations between cirrhosis or fibrosis and categorical explanatory variables, such as
gender, age and estimated duration of HCV infection. Analysis was conducted using the SPSS 20.0
statistical package (SPSS, Inc., Chicago, IL, USA).
RESULTS
Demographic and clinical information of patients
Demographic and clinical information of patients are shown in Table 02. According to Metavir
score, 59.6% of patients presented no or mild fibrosis (F0-F2) and 73.1% presented no cirrhosis (F0-
F3) (5.0% were F0, 31.2% F1, 23.4% F2, 13.5% F3 and 26.9% F4). The mean age and duration of
infection of patients with advanced fibrosis or cirrhosis (F3-F4) was higher than for the patients with no
or mild fibrosis (F0-F2) (49.0±9.2 years vs 40.1±9.6 years, P<0.05 and 26.0±9.0 years vs 19.0±6.9
years, P<0.05, respectively). The same trend was observed for patients with cirrhosis (F4), when
compared to non-cirrhosis patients (F0-F3) (50.1±9.5 years vs 41.3±9.7 years, P<0.05 and 27.9±9.7
years vs 19.8±7.1 years, P<0.05, respectively). Multivariate logistic regression adjusting for the
simultaneous contributions of independent variables (gender, age and estimated duration of HCV
infection) indicated that age (P=0.010; P=0.047) and duration of infection (P=0.023; P=0.016)
conferred increased risk of fibrosis and cirrhosis (Table 03).
Allele frequencies
Allele frequencies of polymorphic variants in the assessed cytokine genes are shown in Table
04. For technical reasons, some patients did not have all their SNPs typed. The frequency of
IL4RA+1902/A allele was higher in patients with advanced degrees of hepatic fibrosis (80.7% vs
69.6%, P= 0.0374; OR= 1.8228; IC= 1.0312 – 3.2222). The TNFA-308/A allele was also more frequent
in patients with advanced degrees of hepatic fibrosis (20.0% vs 10.1% P= 0.0203; OR= 2.2206; IC=
1.1190 – 4.4066), as well as in patients with cirrhosis (22.2% vs 11.2% P= 0.0200; OR= 2.2733; IC=

49
1.1235 – 4.5998). Accordingly, reciprocal association (protection) was also observed for the TNFA-
308/G allele.
Genotype frequencies
The genotype frequencies of polymorphic variants in cytokine genes are shown in Table 05.
The following genotypes were more frequent in patients with less severe degrees of fibrosis (F0-F2):
TNFA-308/G:G (82.1% vs 60.0%; P= 0.0038; OR=0.326; IC=0.15 – 0.7088) and IL6-174/G:G (58.0%
vs 40.4%; P= 0.0409; OR= 0.489; IC=0.2457 – 0.9747). Genotypes TNFA-308/G:A (15.5% vs 40.0%;
P= 0.0011; OR=3.641; IC=1.6354 – 8.1065), IL6-174/G:C (33.3% vs 52.6%; P= 0.0233; OR=2.222;
IC=1.1085 – 4.455) and IL6nt565/G:A (30.9% vs 50.9%; P= 0.0176; OR=2.32; IC=1.1505 – 4.6784)
were more frequent in patients with more severe degrees of liver fibrosis (F3-F4).
Genotypes IL4RA+1902/G:G (15.5% vs 2.6%; P= 0.0414; OR=0.147; IC= 0.0188 – 1.1491)
and TNFA-308/G:G (79.7% vs 55.6%; P= 0.0049; OR=0.3201; IC= 0.1419 – 0.7222) were more
frequent in patients without liver cirrhosis (F0-F3), while genotype TNFA-308/G:A (18.4% vs 44.4%;
P= 0.0019; OR= 3.5368; IC= 1.5505 – 8.0681) was more frequent in the cirrhosis patients (F4).
Haplotype frequencies
The haplotype frequency of polymorphic variants in cytokine genes are shown in Table 06.
The haplotype TNFA-308; -238/GG was more frequent in patients with less severe degrees of liver
fibrosis as well as in the no cirrhosis group (F0-F2 vs F3-F4: 85.1% vs 74.5%; P= 0.0281; OR=0.512;
IC=0.2799 – 0.9365 and F0-F3 vs F4: 84.5% vs 70.8%; P= 0.0112; OR=0.4466; IC=0.2372 – 0.8409,
respectively). The haplotype TNFA-308; -238/AG was more frequent in patients with a more severe
degree of fibrosis, as well as in the group with cirrhosis (F0-F2 vs F3-F4: 10.1% vs 20.0%; P= 0.0203;
OR= 2.2206; IC= 1.119 – 4.4066 and F0-F3 vs F4: 11.1% vs 22.2%; P= 0.0200; OR=2.2733;
IC=1.1235 – 4.5998).
The summary of all positive (susceptible) and negative (protective) polymorphic variants are
presented on Table 07.
DISCUSSION
The genotype frequencies for the all analyzed SNPs but IL4RA+1902 position (P= 0.0017) are
as expected for a population in Hardy-Weinberg equilibrium. Is not uncommon to find SNP frequencies
not in Hardy-Weinberg equilibrium in patient samples (control free). Esser e Tomluk (2005) comment
that if the deviation from Hardy-Weinberg equilibrium occurs only in the group of patients, this provides
further evidence of the real existence of possible associations with disease observed for the marker in
question [24].
The influence of genetic factors in the natural history of HCV infection has been demonstrated
in the last years. Polymorphisms in genes encoding immunoregulatory proteins, proinflammatory
cytokines, and fibrogenic factors may affect the production of these factors and influence disease

50
progression in patients with chronic liver disease such as hepatitis C [16]. Several allelic variants of
SNPs located in cytokine genes have been associated with the degree of liver damage [15]. However,
some studies have yielded contradictory results due to poor study design [3]. Seeking to contribute to
the clarification of inconsistent results, this study carefully selected patients in order to form a
homogeneous sample group regarding the HCV genotype and the absence of viral co-infections; they
were also evaluated for the influence of polymorphic variants in cytokine genes and cytokine receptors
genes regarding the degree of liver damage during chronic infection by HCV genotype 1 only. An association between the TNFA-308/A allele and more severe degrees of liver
fibrosis/cirrhosis has been observed; individuals carrying this allele are about twice as likely to develop
more advanced degrees of liver fibrosis/cirrhosis than non-carriers. Our results are in agreement with
the literature. Dai et al. [25] noticed an association between the TNFA-308/A allele and severe stages
of liver fibrosis when studying Chinese individuals suffering from chronic hepatitis C (different viral
genotypes). Yu et al. [26], despite not obtaining a significant difference, observed a higher frequency
of TNFA-308/A allele in Chinese patients suffering from chronic hepatitis C with a high degree of
hepatic fibrosis. Yee et al. [27] and Hohler et al. [28] found an association between the TNFA-308/A
allele and liver cirrhosis in an American and German population with chronic hepatitis C, respectively.
Jeng et al. [29], studying a Chinese population with hepatocellular carcinoma, found that the greater
the degree of hepatic fibrosis, the higher the frequency of TNFA-308/A allele. Kusumoto et al. [30]
found an association between the TNFA-308/A allele and high levels of serum markers of hepatic
fibrosis in Japanese patients.
Nevertheless, other authors did not observe this association, or observed an inverse one.
Goyal et al. [31], when studying an Indian population chronically infected by HCV of different
genotypes, found no association between the polymorphic variants of SNP TNFA-308 and the degree
of liver damage. Bouzgarrou et al. [32], Barret et al. [33] and Powell et al. [34] also found no
association between alleles, genotypes and phenotypes of cytokine production and fibrosis when
studying a population of Tunisia, Ireland and Australia, respectively. Similarly, Bahr et al. [35] found no
association between alleles and genotypes and liver cirrhosis in a German population. Goncharova et
al. [36] on the other hand, reported a higher frequency of the TNFA-308/A allele in Russian patients
with a lower degree of liver fibrosis/cirrhosis.
We also found TNFA-308G>A genotypic associations, which were not found by any of the
mentioned authors. The TNFA-308/G:G genotype showed a negative association with liver damage,
while the TNFA-308/G:A genotype was positively associated, increasing by 3.6 times the susceptibility
to liver damage. The conflict between the results could be partially explained by ethnic differences
among patients. Furthermore, most studies show heterogeneity of the sample groups, which are
formed, for example, by individuals infected with different viral genotypes, and in some cases, with
unrepresentative sample size.
A possible biological explanation for the associations found in this study is the influence of the
TNFA-308/A allele in gene transcription. Despite some controversy [37], there is evidence that the
TNF transcription is highly influenced by polymorphism -308G>A. In the promoter region at position -
308, are described a guanine (TNF-308/G allele or TNF*1) to adenine (TNF-308/A allele or TNF*2)

51
substitution. The TNFA-308/A allele has been shown to almost double the TNFA gene expression and,
thus, the plasma levels of the TNF-α cytokine, possibly due to originating a different binding site for
nuclear proteins [38, 39]. The number of -308/A alleles that an individual possess also plays a role in
the plasma levels of TNF-α with genotypes -308/A:A and -308/G:A being associated with high
production of the cytokine [10, 11, 39]. Although we did not measure the plasma levels of TNF-α, it
would be plausible to assume that the high plasma [12, 40-42] and intrahepatic levels [43] of this
cytokine seen in patients with high degrees of fibrosis or cirrhosis, could be the result of a higher expression of the TNFA-308/A allele in these patients. The high plasma levels of TNF-α would be
likely to intensify its pro-inflammatory action in the fibrotic process and would increase its stimulus on
Ito cells, protagonists of the fibrogenesis process [44, 45]. Connolly et al. [46], using mouse models,
investigated the contribution of dendritic cells in the fibrotic environment and reported that the TNF-α
would be the means by which dendritic cells control liver inflammation and fibrogenesis. It has been
found that dendritic cells doubled the production of TNF-α and IL-6 after the induction of hepatic
fibrosis, and the secretion of TNF-α allowed them to stimulate natural killer cells, T lymphocytes and
Ito cells.
Our results showed that the haplotype GG (TNFA-308G/-238G) was negatively associated
with liver damage. However, haplotype AG (TNFA-308A/-238G) was positively associated with it,
increasing by 2.3 times the chance of developing more advanced degrees of liver fibrosis/cirrhosis.
Since there was no change of allele to the -238 position in both haplotypes, these haplotype
associations were influenced by allelic variants of the -308 position and they can be explained by
taking into consideration the influence of alleles of this position in gene expression.
Another hypothesis to explain the association obtained by the -308/A allele would be that it
was in linkage disequilibrium with the real susceptibility allele. Since it is located in the region of the
MHC class III, nearby HLA-B and DR regions, this allele has strong linkage disequilibrium with HLA
alleles, being part of the HLA-A1,-B8 -DR3 -DQ2 haplotype [39, 47]. However, Marangon et al.
studying class I and II HLA alleles in the same population of this study, found no association between
the severity of liver damage with either the above haplotype or any of the haplotype alleles [48].
Studies assessing IL6-174 polymorphisms in chronically infected HCV patients according to
the severity of liver fibrosis/cirrhosis are extremely scarce. Barrett et al. [33] found no association
between the production of genotypes and phenotypes and the severity of fibrosis in an Irish
population. However, Falletti et al. [49], when studying Italian patients, found an association between
the IL6-174/G allele and the intensity of liver damage and Cussigh et al. [50] found an association
between the GG haplotype (IL6-597G/-174G) and liver damage. In this study, the IL6-174/G allele was
not associated with liver damage, but the IL6-174/G:G genotype was negatively associated with the
degree of hepatic fibrosis, while the IL6-174/G:C genotype was positively associated with it, increasing
about 2.2 times the chance of developing higher degrees of liver fibrosis.
The IL-6 is a pleiotropic cytokine that stimulates several cell types, including hepatocytes [51,
52]. The pathophysiological role of IL-6 in acute or chronic liver disease has been intensively studied
[53], however both its clinical relevance and molecular function in the pathogenesis of liver disease are
not fully understood [54]. It is known, however, that it plays an important role in the development of

52
fibrosis, for besides its pro-inflammatory nature, IL-6 deficient mice develop attenuated liver fibrosis
[55]. Moreover, IL-6 is expressed along with TNF-α by dendritic cells, modulating the hepatic cytokine
and chemokine milieu in fibrosis [46]. In the liver, IL-6 is upregulated in human cirrhosis [56]. High
plasma levels of IL-6 have been observed in individuals affected by chronic hepatitis C and these
levels tend to increase proportionally to the degree of liver fibrosis as well as in the presence of
cirrhosis [54, 57-59].
IL-6 serum levels are regulated at the level of gene expression, since they remain in plasma
for a short period [60]. Gene transfection studies showed that the -174/G allele is expressed at
approximately 60% higher levels than the -174/C allele. Homozygous individuals for the G allele or
heterozygous were characterized as high producers of IL-6 and have high plasma levels of this
cytokine. On the other hand, homozygous individuals for the C allele would be low producers of IL-6
[61]. Nonetheless, in the present work both protection against liver damage and enhancing liver
damage were observed in high IL-6-producer genotype patients (protection IL6-174/G:G and
susceptibility IL6-174/G:A). Nevertheless, IL6 gene expression may not only dependent on the -174
genotype, but also on the cell that produces IL-6; different genotypes may influence differently the
cytokine level depending on the type of the cell that produces it [62].
Moreover, there seems to be no consensus on the functionality of polymorphisms at IL6 gene.
Two recent studies did not observe any association between the IL6-174 polymorphism and IL-6 levels
[63, 64], indicating that there may be other polymorphic loci affecting the IL-6 expression [37]. It seems
that IL6 gene regulation is also controlled by an element present between positions -5307 and -5202,
at the distal portion of the promoter region [65], which has no polymorphisms, but is close to a
polymorphic region. A study evaluating the functionality of positions IL6-174G>C and IL6-6331T>C
observed that the -6331/T allele increased the IL-6 expression regardless the -174 allele. The -6331/T
allele (but not the -6331/C allele) creates an Oct-1 binding site that probably alters the chromatin
structure, bringing the distal regulatory element in close proximity to the transcription start site [66].
Polymorphisms may also directly or indirectly affect the binding of transcriptional limiting
factors, consequently increasing or decreasing the production of mRNA, thus regulating cytokine
production. Polymorphism at IL6-174 could affect the IL6 gene transcription rate, and therefore, also
IL-6 inflammatory diseases such as hepatitis C, by the action of the glucocorticoid receptor, a
transcription factor involved in regulation of this gene. When the glucocorticoid and its receptor bind to
the promoter region of the IL6 gene, they down regulate IL-6 expression [67]. Experiments suggest
that the region between positions -180 and -123 in the promoter region of the IL6 gene is crucial for
the transcription induction [68, 69] and that the gene repression promoted by steroid hormones, such
as glucococorticoid, apparently does not involve a high affinity binding to DNA [67, 70, 71]. Since the
IL6-174 polymorphism is located near the binding site of the glucocorticoid receptor to DNA, a
nucleotide substitution could cause a potential binding site for the NF-1 transcription factor [33, 62].
No studies in the literature about the IL6nt565 polymorphism and the severity of
fibrosis/cirrhosis were found. In this study, the IL6nt565/G:A genotype was associated positively to the
degree of hepatic fibrosis, while genotype IL6nt565/G:G showed a tendency to negative association
(60.5% vs 43.9%; P= 0.0537). The nt565/A:A genotype presents evidence of being associated to the

53
high production of IL-6, while nt565/G:A and G:G genotypes seem to be associated with medium and
low production, respectively [72]. In this context, the positive association of the genotype GA with a
high degree of fibrosis could be related to the IL-6 plasma levels induced by it, a fact consistent with
the evidence of higher plasma levels of IL-6 in individuals infected with hepatitis C [54, 57, 58]. Since
the nt565 SNP is in strong linkage disequilibrium with the -174 SNP, and their nt565/G and -174/G
alleles tend to be found together, as well as nt565/A and -174/C alleles (supplementary material),
perhaps the associations found solely for the position -174 are due to this linkage disequilibrium, for no other possible coherently biological explanation was found for the results of SNP IL6-174.
Other authors suggest that distinct polymorphic sites do not act independently of one another
for the IL6 gene, and one polymorphism influences the functional effect of variation at other
polymorphic sites [62]. Therefore, further investigations involving several SNPs within the IL6 gene
besides IL6-174 and nt565 are necessary.
The IL-4 receptor (IL4R) is composed of two subunits, the α, which binds with high affinity to
the ligand, and the γτ, common to other cytokine receptors, which amplifies the signal from the α-
subunit [73, 74]. The α-subunit is also part of the receptor of IL-13 together with the IL-13 binding
protein, IL13Rα1 [37]. The α subunit is encoded by the IL4RA gene, located in 16p12.1. Among the
polymorphisms described for this gene is the -1902G>A [75], resulting in change of glutamine for
arginine at position 576 of the peptide (often referred to as position 551 if the signal peptide is not
included in counting). Although a recent study of systemic sclerosis showed that this polymorphism
does not influence gene expression [76], other studies have demonstrated that this change interferes
with intracellular signaling [74, 77], due to its location in the peptide intracellular domain, and that the
IL4RA+1902/G allele is associated with enhanced signaling of the receptor [78] and, consequently,
enhance expression of IL4 and IL13 regulated genes, since it presents IL-4 and IL-13 as ligand [79].
The present work showed that the IL4RA+1902/A allele was positively associated to the
degree of hepatic fibrosis, while the G allele and the IL4RA+1902/G:G genotype are associated
negatively to development of fibrosis and cirrhosis, respectively. Avdoshina et al. [80] observed a
higher frequency of the +1902/G:G genotype in patients infected with HCV compared to healthy
volunteers. Vasakova et al. [81], observed an association between the +1902/A:G and idiopathic lung
fibrosis when studying a population in the Czech Republic. However, there appear to have been no
previous studies assessing the relationship between position +1902 and liver damage.
The presence of the IL4RA+1902/G:G genotype enhance signaling of both IL4R and IL13R
and, consequently, increases the action of IL-4 and IL-13 [79]. As IL-4 and IL-13 are anti-inflammatory
cytokines, which would block the effect of pro-inflammatory cytokines, such as TNF-α and IL-6, which
seems to be involved in the development of fibrosis and cirrhosis in the present work. Thus, patients
with the G:G genotype would be protected against the development of cirrhosis by its anti-
inflammatory activity.
CONCLUSION
Our results show that polymorphic variants for the TNFA-308, IL6-174, IL6nt565 and
IL4RA+1902 positions are associated with the degree of liver damage during chronic infection with

54
HCV genotype 1. Some of our data confirmed the results of previous studies conducted in other
populations, while others were novel and require replication to confirm. In this study, patients were
thoroughly characterized with respect to the degree of liver damage, time of infection, among other
possible non-genetic interfering factors, forming a homogeneous group. These efforts may have more
clearly characterized the host's genetic interfering factors leading to liver damage of chronically HCV-1
infected patients. We are aware, however, that polymorphisms in cytokines genes and cytokine
receptors are obviously not the only factors that influence the degree of liver damage and that
polymorphisms in other genes certainly contribute to the process. Therefore, the conclusion is that the
hepatic damage in chronically HCV 1 infected patients seems to be under the influence of
polymorphisms of genes for both cytokine and cytokine receptors; the knowledge of these markers
may have prognostic significance in patients chronically infected with HCV, allowing a more
aggressive therapy for those with increased risk of evolving to more severe forms of the disease.
ACKNOWLEDGEMENTS
The authors wish to thank the individuals who donated blood samples and made this work
possible. We would also like to thank our lab and PhD colleagues for their help in several tasks. This
work was supported by grants from the Conselho Nacional de Desenvolvimento Científico e
Tecnológico (CNPq) and Coordenação de Aperfeiçoamento de Pessoal de Nível Superior (CAPES).
ROLE OF THE FUNDING SOURCE
The funding sources had no role in the study design, collection, analysis and interpretation of
the data, in the writing or decision to submit the paper for publication.
CONFLICT OF INTEREST
The authors declare they have no conflict of interest.
REFERENCES
1. Dustin, L.B. and C.M. Rice, Flying under the radar: the immunobiology of hepatitis C. Annu Rev Immunol, 2007. 25: p. 71-99.
2. Thomas, D.L. and L.B. Seeff, Natural history of hepatitis C. Clin Liver Dis, 2005. 9(3): p. 383-98, vi.
3. Bataller, R. and D.A. Brenner, Liver fibrosis. J Clin Invest, 2005. 115(2): p. 209-18. 4. Zimmer, V. and F. Lammert, Genetics and epigenetics in the fibrogenic evolution of chronic
liver diseases. Best Pract Res Clin Gastroenterol, 2011. 25(2): p. 269-80. 5. Wynn, T.A., Fibrotic disease and the T(H)1/T(H)2 paradigm. Nat Rev Immunol, 2004. 4(8): p.
583-94. 6. Marra, F., Chemokines in liver inflammation and fibrosis. Front Biosci, 2002. 7: p. d1899-914. 7. Wynn, T.A., Cellular and molecular mechanisms of fibrosis. J Pathol, 2008. 214(2): p. 199-
210. 8. Ghany, M.G., et al., Diagnosis, management, and treatment of hepatitis C: an update.
Hepatology, 2009. 49(4): p. 1335-74. 9. Martin, M.P. and M. Carrington, Immunogenetics of viral infections. Curr Opin Immunol, 2005.
17(5): p. 510-6. 10. Perrey, C., et al., Genotyping for polymorphisms in interferon-gamma, interleukin-10,
transforming growth factor-beta 1 and tumour necrosis factor-alpha genes: a technical report. Transpl Immunol, 1998. 6(3): p. 193-7.

55
11. Tambur, A.R., et al., Role of cytokine gene polymorphism in hepatitis C recurrence and allograft rejection among liver transplant recipients. Transplantation, 2001. 71(10): p. 1475-80.
12. Andersen, E.S., et al., Twelve potential fibrosis markers to differentiate mild liver fibrosis from cirrhosis in patients infected with chronic hepatitis C genotype 1. Eur J Clin Microbiol Infect Dis, 2011. 30(6): p. 761-6.
13. Morgan, T.R., et al., DNA polymorphisms and response to treatment in patients with chronic hepatitis C: results from the HALT-C trial. J Hepatol, 2008. 49(4): p. 548-56.
14. Guo, W., et al., Ligation of MHC class II molecules differentially upregulates TNF beta gene expression in B cell lines of different MHC class II haplotypes. Hum Immunol, 1999. 60(4): p. 312-22.
15. Romero-Gomez, M., et al., Genes and hepatitis C: susceptibility, fibrosis progression and response to treatment. Liver Int, 2011. 31(4): p. 443-60.
16. Bataller, R., K.E. North, and D.A. Brenner, Genetic polymorphisms and the progression of liver fibrosis: a critical appraisal. Hepatology, 2003. 37(3): p. 493-503.
17. Parra, F.C., et al., Color and genomic ancestry in Brazilians. Proc Natl Acad Sci U S A, 2003. 100(1): p. 177-82.
18. Asselah, T., et al., Gene expression and hepatitis C virus infection. Gut, 2009. 58(6): p. 846-58.
19. Lahiri, D.K. and J.I. Nurnberger, Jr., A rapid non-enzymatic method for the preparation of HMW DNA from blood for RFLP studies. Nucleic Acids Res, 1991. 19(19): p. 5444.
20. Excoffier, L., G. Laval, and S. Schneider, Arlequin (version 3.0): an integrated software package for population genetics data analysis. Evol Bioinform Online, 2005. 1: p. 47-50.
21. Glaubitz, J.C., CONVERT: a user friendly program to reformat diploid genotypic data for commonly used population genetic software packages. Molecular Ecology Notes, 2004(4): p. 309-310.
22. Woolf, B., On estimating the relation between blood group and disease. Ann Hum Genet, 1955. 19(4): p. 251-3.
23. Svejgaard, A. and L.P. Ryder, HLA and disease associations: detecting the strongest association. Tissue Antigens, 1994. 43(1): p. 18-27.
24. Esser, C. and J. Tomluk, Reporting Hardy-Weinberg tests in case-control studies: reasons for caution but not for panic reactions. J Invest Dermatol, 2005. 124(5): p. 1082-3.
25. Dai, C.Y., et al., Associations of tumour necrosis factor alpha promoter polymorphisms at position -308 and -238 with clinical characteristics of chronic hepatitis C. J Viral Hepat, 2006. 13(11): p. 770-4.
26. Yu, M.L., et al., Tumor necrosis factor alpha promoter polymorphisms at position -308 in Taiwanese chronic hepatitis C patients treated with interferon-alpha. Antiviral Res, 2003. 59(1): p. 35-40.
27. Yee, L.J., et al., Tumor necrosis factor gene polymorphisms in patients with cirrhosis from chronic hepatitis C virus infection. Genes Immun, 2000. 1(6): p. 386-90.
28. Hohler, T., et al., Tumor necrosis factor alpha promoter polymorphism at position -238 is associated with chronic active hepatitis C infection. J Med Virol, 1998. 54(3): p. 173-7.
29. Jeng, J.E., et al., Tumor necrosis factor-alpha 308.2 polymorphism is associated with advanced hepatic fibrosis and higher risk for hepatocellular carcinoma. Neoplasia, 2007. 9(11): p. 987-92.
30. Kusumoto, K., et al., Interleukin-10 or tumor necrosis factor-alpha polymorphisms and the natural course of hepatitis C virus infection in a hyperendemic area of Japan. Cytokine, 2006. 34(1-2): p. 24-31.
31. Goyal, A., et al., Association of TNF-beta polymorphism with disease severity among patients infected with hepatitis C virus. J Med Virol, 2004. 72(1): p. 60-5.
32. Bouzgarrou, N., et al., Lack of effect of tumor necrosis factor-alpha -308 G/A polymorphism on severity of liver fibrosis in Tunisian hepatitis C virus (HCV)-infected patients. Gastroenterol Clin Biol, 2010. 34(4-5): p. 297-304.
33. Barrett, S., et al., Polymorphisms in tumour necrosis factor-alpha, transforming growth factor-beta, interleukin-10, interleukin-6, interferon-gamma, and outcome of hepatitis C virus infection. J Med Virol, 2003. 71(2): p. 212-8.
34. Suppiah, V., et al., IL28B is associated with response to chronic hepatitis C interferon-alpha and ribavirin therapy. Nat Genet, 2009. 41(10): p. 1100-4.
35. Bahr, M.J., et al., Cytokine gene polymorphisms and the susceptibility to liver cirrhosis in patients with chronic hepatitis C. Liver Int, 2003. 23(6): p. 420-5.

56
36. Goncharova, I.A., et al., Genetics factors determining predisposition to chronic course of virus hepatitis and fibrosis in liver. Mol Biol (Mosk), 2008. 42(2): p. 238-41.
37. Smith, A.J. and S.E. Humphries, Cytokine and cytokine receptor gene polymorphisms and their functionality. Cytokine Growth Factor Rev, 2009. 20(1): p. 43-59.
38. Kroeger, K.M., K.S. Carville, and L.J. Abraham, The -308 tumor necrosis factor-alpha promoter polymorphism effects transcription. Mol Immunol, 1997. 34(5): p. 391-9.
39. Minton, E.J., et al., Clearance of hepatitis C virus is not associated with single nucleotide polymorphisms in the IL-1, -6, or -10 genes. Hum Immunol, 2005. 66(2): p. 127-32.
40. Neuman, M.G., et al., Kinetics of serum cytokines reflect changes in the severity of chronic hepatitis C presenting minimal fibrosis. J Viral Hepat, 2002. 9(2): p. 134-40.
41. Zylberberg, H., et al., Soluble tumor necrosis factor receptors in chronic hepatitis C: a correlation with histological fibrosis and activity. J Hepatol, 1999. 30(2): p. 185-91.
42. Crespo, J., et al., Plasma leptin and TNF-alpha levels in chronic hepatitis C patients and their relationship to hepatic fibrosis. Dig Dis Sci, 2002. 47(7): p. 1604-10.
43. Mahmood, S., et al., Clinical significance of intrahepatic interleukin-8 in chronic hepatitis C patients. Hepatol Res, 2002. 24(4): p. 413-419.
44. Ruuls, S.R. and J.D. Sedgwick, Unlinking tumor necrosis factor biology from the major histocompatibility complex: lessons from human genetics and animal models. Am J Hum Genet, 1999. 65(2): p. 294-301.
45. Albanis, E. and S.L. Friedman, Hepatic fibrosis. Pathogenesis and principles of therapy. Clin Liver Dis, 2001. 5(2): p. 315-34, v-vi.
46. Connolly, M.K., et al., In liver fibrosis, dendritic cells govern hepatic inflammation in mice via TNF-alpha. J Clin Invest, 2009. 119(11): p. 3213-25.
47. Nedwin, G.E., et al., Human lymphotoxin and tumor necrosis factor genes: structure, homology and chromosomal localization. Nucleic Acids Res, 1985. 13(17): p. 6361-73.
48. Marangon, A.V., et al., Influence of HLA alleles in response to treatment with pegylated interferon-alpha and ribavirin in patients with chronic hepatitis C. Int J Immunogenet, 2012.
49. Falleti, E., et al., Genetic polymorphisms of interleukin-6 modulate fibrosis progression in mild chronic hepatitis C. Hum Immunol, 2010. 71(10): p. 999-1004.
50. Cussigh, A., et al., Interleukin 6 promoter polymorphisms influence the outcome of chronic hepatitis C. Immunogenetics, 2011. 63(1): p. 33-41.
51. Hirano, T., Interleukin 6 and its receptor: ten years later. Int Rev Immunol, 1998. 16(3-4): p. 249-84.
52. Barton, B.E., IL-6: insights into novel biological activities. Clin Immunol Immunopathol, 1997. 85(1): p. 16-20.
53. Galun, E. and J.H. Axelrod, The role of cytokines in liver failure and regeneration: potential new molecular therapies. Biochim Biophys Acta, 2002. 1592(3): p. 345-58.
54. Migita, K., et al., Serum levels of interleukin-6 and its soluble receptors in patients with hepatitis C virus infection. Hum Immunol, 2006. 67(1-2): p. 27-32.
55. Natsume, M., et al., Attenuated liver fibrosis and depressed serum albumin levels in carbon tetrachloride-treated IL-6-deficient mice. J Leukoc Biol, 1999. 66(4): p. 601-8.
56. Napoli, J., G.A. Bishop, and G.W. McCaughan, Increased intrahepatic messenger RNA expression of interleukins 2, 6, and 8 in human cirrhosis. Gastroenterology, 1994. 107(3): p. 789-98.
57. Malaguarnera, M., et al., Elevation of interleukin 6 levels in patients with chronic hepatitis due to hepatitis C virus. J Gastroenterol, 1997. 32(2): p. 211-5.
58. Malaguarnera, M., et al., Interleukin-6 in hepatitis C cirrhosis. Panminerva Med, 1996. 38(4): p. 207-10.
59. Gonzalez, A., et al., Efficacy of screening donors for antibodies to the hepatitis C virus to prevent transfusion-associated hepatitis: final report of a prospective trial. Hepatology, 1995. 22(2): p. 439-45.
60. Castell, J.V., et al., Plasma clearance, organ distribution and target cells of interleukin-6/hepatocyte-stimulating factor in the rat. Eur J Biochem, 1988. 177(2): p. 357-61.
61. Fishman, S.L. and A.D. Branch, The quasispecies nature and biological implications of the hepatitis C virus. Infect Genet Evol, 2009. 9(6): p. 1158-67.
62. Terry, C.F., V. Loukaci, and F.R. Green, Cooperative influence of genetic polymorphisms on interleukin 6 transcriptional regulation. J Biol Chem, 2000. 275(24): p. 18138-44.
63. Kiszel, P., et al., Interleukin-6 -174 promoter polymorphism does not influence IL-6 production after LPS and IL-1 beta stimulation in human umbilical cord vein endothelial cells. Cytokine, 2007. 40(1): p. 17-22.

57
64. Huth, C., et al., Joint analysis of individual participants' data from 17 studies on the association of the IL6 variant -174G>C with circulating glucose levels, interleukin-6 levels, and body mass index. Ann Med, 2009. 41(2): p. 128-38.
65. Samuel, J.M., et al., Identification of a novel regulatory region in the interleukin-6 gene promoter. Cytokine, 2008. 42(2): p. 256-64.
66. Smith, A.J., et al., Association of serum interleukin-6 concentration with a functional IL6 -6331T>C polymorphism. Clin Chem, 2008. 54(5): p. 841-50.
67. Ray, A., K.S. LaForge, and P.B. Sehgal, On the mechanism for efficient repression of the interleukin-6 promoter by glucocorticoids: enhancer, TATA box, and RNA start site (Inr motif) occlusion. Mol Cell Biol, 1990. 10(11): p. 5736-46.
68. May, L.T., et al., Synthesis and secretion of multiple forms of beta 2-interferon/B-cell differentiation factor 2/hepatocyte-stimulating factor by human fibroblasts and monocytes. J Biol Chem, 1988. 263(16): p. 7760-6.
69. Isshiki, H., et al., Constitutive and interleukin-1 (IL-1)-inducible factors interact with the IL-1-responsive element in the IL-6 gene. Mol Cell Biol, 1990. 10(6): p. 2757-64.
70. Ray, A., K.S. LaForge, and P.B. Sehgal, Repressor to activator switch by mutations in the first Zn finger of the glucocorticoid receptor: is direct DNA binding necessary? Proc Natl Acad Sci U S A, 1991. 88(16): p. 7086-90.
71. Ray, A., K.E. Prefontaine, and P. Ray, Down-modulation of interleukin-6 gene expression by 17 beta-estradiol in the absence of high affinity DNA binding by the estrogen receptor. J Biol Chem, 1994. 269(17): p. 12940-6.
72. Stoica, A.L., et al., Interleukin-6 and interleukin-10 gene polymorphism, endothelial dysfunction, and postoperative prognosis in patients with peripheral arterial disease. J Vasc Surg, 2010. 52(1): p. 103-9.
73. Izuhara, K. and T. Shirakawa, Signal transduction via the interleukin-4 receptor and its correlation with atopy. Int J Mol Med, 1999. 3(1): p. 3-10.
74. Nelms, K., et al., The IL-4 receptor: signaling mechanisms and biologic functions. Annu Rev Immunol, 1999. 17: p. 701-38.
75. Caggana, M., et al., Population-based studies reveal differences in the allelic frequencies of two functionally significant human interleukin-4 receptor polymorphisms in several ethnic groups. Genet Med, 1999. 1(6): p. 267-71.
76. Broen, J.C., et al., Polymorphisms in the interleukin 4, interleukin 13, and corresponding receptor genes are not associated with systemic sclerosis and do not influence gene expression. J Rheumatol, 2012. 39(1): p. 112-8.
77. Mitsuyasu, H., et al., Ile50Val variant of IL4R alpha upregulates IgE synthesis and associates with atopic asthma. Nat Genet, 1998. 19(2): p. 119-20.
78. Hershey, G.K., et al., The association of atopy with a gain-of-function mutation in the alpha subunit of the interleukin-4 receptor. N Engl J Med, 1997. 337(24): p. 1720-5.
79. Kelly-Welch, A.E., et al., Interleukin-4 and interleukin-13 signaling connections maps. Science, 2003. 300(5625): p. 1527-8.
80. Avdoshina, V.V., et al., [Alleles distribution of polymorphic promoter region C-590T in interleukin-4 genes and Q-576r and Ile-50Val regions in IL-4 receptor gene IL-4RA in patients with HCV-infection]. Zh Mikrobiol Epidemiol Immunobiol, 2007(1): p. 43-6.
81. Vasakova, M., et al., Cytokine gene polymorphisms and high-resolution-computed tomography score in idiopathic pulmonary fibrosis. Respir Med, 2007. 101(5): p. 944-50.

58
Table 01. List of the investigated cytokine SNPs.
Cytokine gene
Gene chromosome location
SNP designation in the kit dbSNP-ID
SNP chromosome position (reference)
Location
IL1A 2q14 -889C>T rs1800587 113259431 5’-UTR
IL1B 2q14 -511T>C rs16944 113311338 Promoter
+3962C>T rs1143634 113306861 Coding/synonymous
IL1R1 2q12 pst1 1970C>T rs2234650 102124759 Distal promoter
IL1RN 2q14.2 mspa1 11100C>T rs315952 113606775 Coding/synonymous
IL4RA 16p12.1–p11.2 +1902G>A rs1801275 27281901 Coding/missense
IL12B 5q31.1–33.1 -1188A>C rs3212227 158675528 3’-UTR
IFNG 12q14 +874T>A rs2430561 66838787 Intron
TGFB1 19q13.1 codon 10C>T rs1800470 46550761 Coding/missense
codon 25G>C rs1800471 46550716 Coding/missense
TNF 6p21.3 -308G>A rs1800629 31651010 Promoter
-238G>A rs361525 31651080 Promoter
IL2 4q26-27 -330T>G rs2069762 123597430 Promoter
+166G>T rs2069763 123596932 Coding/synonymous
IL4 5q31.1 -1098T>G rs2243248 132036543 Promoter
-590C>T rs2243250 132037053 Promoter
-33T>C rs2070874 132037609 5’-UTR
IL6 7p21 -174G>C
rs1800795 22733170 Promoter
nt565G>A rs1800797 22732746 Promoter
IL10 1q31–q32 -1082A>G rs1800896 205013520 Promoter
-819C>T rs1800871 205013257 Promoter
-592C>A rs1800872 205013030 Promoter

59
Table 02. Demographic and clinical information of patients of a Brazilian population with chronic hepatitis C classified according to the degree of fibrosis by the Metavir scale.
Characteristics Patients F0-F2 F3-F4 F0-F3 F4 (n=141) (n=84) (n=57) (n=103) (n=38)
Age (years, mean ± 43.7 ±10.4 40.1 ±9.6 49.0 ±9.2 41.3 ±9.7 50.1 ±9.5 Gender n (%)
Male 108 (76.6) 65 (77.4) 43 (75.4) 81 (78.6) 27 (71.0) Female 33 (23.4) 19 (22.6) 14 (24.6) 22 (21.4) 11 (28.0)
Duration of infection (years, mean ± SD)* †
21.8 ±8.5 19.0 ±6.9 26.0 ±9.0 19.8 ±7.1 27.9 ±9.7
METAVIR Stage n (%)** F0 7 (5.0) 7 (8.3) - - 7 (6.8) - - F1 44 (31.2) 44 (52.4) - - 44 (42.7) - - F2 33 (23.4) 33 (39.3) - - 33 (32.0) - - F3 19 (13.5) - - 19 (33.3) 19 (18.5) - - F4 38 (26.9) - - 38 (66.7) - - 38 (100.0
*P< 0,05 when comparing F0-F2 vs F3-F4 and F0-F3 vs F4. †Duration of infection was calculated only for 87 patients (F0=4, F1=25, F2=23, F3=14, F4=21). The duration of infection for 54 patients is unknown. **METAVIR score: F0 – no fibrosis, F1 – portal fibrosis without septa, F2 – portal fibrosis and few septa, F3 – numerous septa without cirrhosis, F4 – cirrhosis.

60
Table 03. Multivariate analysis of predictors of fibrosis or cirrhosis among patients of a Brazilian population with chronic hepatitis C classified according to the degree of fibrosis by the Metavir scale.
Response variable Independent variable Coefficient P OR
Degree of fibrosis (F0-F2 and F3-F4) Gender (M/F) -0.393 0.545 0.675 Age (years) 0.083 0.010 1.087 Duration of infection (years) 0.087 0.023 1.091
Presence or absence of cirrhosis Gender (M/F) -0.457 0.532 0.633 Age (years) 0.069 0.047 1.072 Duration of infection (years) 0.095 0.016 1.100
METAVIR score: F0 – no fibrosis, F1 – portal fibrosis without septa, F2 – portal fibrosis and few septa, F3 – numerous septa without cirrhosis, F4 – cirrhosis.

61
Table 04. Distribution of allele frequencies of polymorphisms in cytokine genes in patients of a Brazilian population with chronic hepatitis C, classified according to their degree of fibrosis by the Metavir scale.
Polymorphism Alleles F0-F2 (n=84) F3-F4 (n=57) F0-F3 (n=103) F4 (n=38) n (F%) n (F%) n (F%) n (F%)
IL1A-889 C 123 (74.1) 79 (74.5) 151 (74.0) 51 (75.0) T 43 (25.9) 27 (25.5) 53 (26.0) 17 (25.0)
IL1B-511
C 99 (61.1) 74 (64.9) 123 (61.5) 50 (65.8) T 63 (38.9) 40 (35.1) 77 (38.5) 26 (34.2)
IL1B+3962
C 131 (79.9) 88 (77.2) 160 (79.2) 59 (77.6) T 33 (20.1) 26 (22.8) 42 (20.8) 17 (22.4)
IL1R1 pst1 1970
T 57 (34.3) 28 (24.6) 64 (31.4) 21 (27.6) C 109 (65.7) 86 (75.4) 140 (68.6) 55 (72.4)
IL1RA mspa1 11100
T 121 (72.0) 87 (76.3) 150 (72.8) 58 (76.3) C 47 (28.0) 27 (23.7) 56 (27.2) 18 (23.7)
IL4RA+1902 Aa 117 (69.6) 92 (80.7) 147 (71.4) 62 (81.6) G 51 (30.4) 22 (19.3) 59 (28.6) 14 (18.4)
IL12B-1188 A 120 (75.0) 76 (70.4) 146 (73.7) 50 (71.4) C 40 (25.0) 32 (29.6) 52 (26.3) 20 (28.6)
IFNG+874 A 91 (54.2) 56 (50.9) 109 (52.9) 38 (52.8) T 77 (45.8) 54 (49.1) 97 (47.1) 34 (47.2)
TGFB1 cdn10 C 80 (47.6) 51 (45.5) 96 (46.6) 35 (47.3) T 88 (52.4) 61 (54.5) 110 (53.4) 39 (52.7)
TGFB1 cdn25 C 9 (5.4) 8 (7.1) 12 (5.8) 5 (6.7) G 159 (94.6) 104 (92.9) 194 (94.2) 69 (93.3)
TNFA-308 G 151 (89.9) 88 (80.0) 183 (88.8) 56 (77.8) Ab 17 (10.1) 22 (20.0) 23 (11.2) 16 (22.2)
TNFA-238 G 160 (95.2) 104 (94.6) 197 (95.6) 67 (93.0) A 8 (4.8) 6 (5.5) 9 (4.4) 5 (7.0)
IL2-330 G 51 (31.1) 30 (26.8) 62 (30.7) 19 (25.7) T 113 (68.9) 82 (73.2) 140 (69.3) 55 (74.3)
IL2+166 G 110 (67.1) 72 (64.3) 134 (66.3) 48 (64.9) T 54 (32.9) 40 (35.7) 68 (33.7) 26 (35.1)
IL4-1098 T 121 (76.6) 86 (79.6) 152 (78.4) 55 (76.4) G 37 (23.4) 22 (20.4) 42 (21.6) 17 (23.6)
IL4-590 C 120 (76.0) 87 (80.5) 148 (76.3) 59 (81.9) T 38 (24.0) 21 (19.5) 46 (23.7) 13 (18.1)
IL4-33 T 35 (22.2) 18 (16.7) 41 (21.1) 12 (16.7) C 123 (77.8) 90 (83.3) 153 (78.9) 60 (83.3)
IL6-174 G 121 (74.7) 76 (66.7) 146 (73.0) 51 (67.1) C 41 (25.3) 38 (33.3) 54 (27.0) 25 (32.9)
IL6nt565 G 123 (75.9) 79 (69.3) 149 (74.5) 53 (69.7) A 39 (24.1) 35 (30.7) 51 (25.5) 23 (30.3)
IL10-1082 G 67 (39.9) 41 (37.3) 81 (39.7) 27 (36.5) A 101 (60.1) 69 (62.7) 123 (60.3) 47 (63.5)
IL10-819 C 114 (67.9) 79 (71.8) 143 (70.1) 50 (67.6) T 54 (32.1) 31 (28.2) 61 (29.9) 24 (32.4)
IL10-592 C 114 (67.9) 79 (71.8) 143 (70.1) 50 (67.6) A 54 (32.1) 31 (28.2) 61 (29.9) 24 (32.4)
For technical reasons, some patients did not have all their SNPs typed, so N is variable depending on the SNP. P obtained through Chi-square test or Fisher’s test. n= number of alleles; F%= allele relative frequency.

62
F0-F2, early degree of liver fibrosis; F3-F4, advanced degrees of liver fibrosis or cirrhosis; F0-F3, no cirrhosis; F4, cirrhosis. a F3-F4 vs F0-F2: 92 (80.7%) vs 117 (69.6%). P= 0.0374; OR= 1.8228; IC= 1.0312 – 3.2222 b F3-F4 vs F0-F2: 22 (20.0%) vs 17 (10.1%) P= 0.0203; OR= 2.2206; IC= 1.1190 – 4.4066 b F4 vs F0-F3: 16 (22.2%) vs 23 (11.2%) P= 0.0200; OR= 2.2733; IC= 1.1235 – 4.5998

63
Table 05. Distribution of genotype frequencies of polymorphisms in cytokine genes in patients of a Brazilian population with chronic hepatitis C, classified according with the fibrosis degree by the Metavir scale. Polymorphism Genotypes
F0-F2 (n=84) F3-F4 (n=57) F0-F3 (n=103) F4 (n=38) n (F%) n (F%) n (F%) n (F%)
IL1A-889 C:C 45 (54.2) 31 (58.5) 56 (54.9) 20 (58.8) C:T 33 (39.8) 17 (32.1) 39 (38.2) 11 (32.4) T:T 5 (6.0) 5 (9.4) 7 (6.9) 3 (8.8)
IL1B-511 C:C 32 (39.5) 23 (40.4) 41 (41.0) 14 (36.8) C:T 35 (43.2) 28 (49.1) 41 (41.0) 22 (57.9) T:T 14 (17.3) 6 (10.5) 18 (18.0) 2 (5.3)
IL1B+3962 C:C 52 (63.4) 34 (59.7) 63 (62.3) 23 (60.5) T:C 27 (32.9) 20 (35.1) 34 (33.7) 13 (34.2) T:T 3 (3.7) 3 (5.3) 4 (4.0) 2 (5.3)
IL1R1 pst1
1970
T:T 8 (9.6) 3 (5.3) 8 (7.8) 3 (7.9) C:T 41 (49.4) 22 (38.6) 48 (47.1) 15 (39.5) C:C 34 (41.0) 32 (56.1) 46 (45.1) 20 (52.6)
IL1RA mspa1
11100
T:T 44 (52.4) 33 (57.9) 56 (54.4) 21 (55.3) T:C 33 (39.3) 21 (36.8) 38 (36.9) 16 (42.1) C:C 7 (8.3) 3 (5.3) 9 (8.7) 1 (2.6)
IL4RA+1902 A:A 46 (54.8) 39 (68.4) 60 (58.3) 25 (65.8) G:A 25 (29.8) 14 (24.6) 27 (26.2) 12 (31.6) G:Ga 13 (15.4) 4 (7.0) 16 (15.5) 1 (2.6)
IL12B-1188 A:A 44 (55.0) 26 (48.2) 53 (53.5) 17 (48.6) C:A 32 (40.0) 24 (44.4) 40 (40.4) 16 (45.7) C:C 4 (5.0) 4 (7.4) 6 (6.1) 2 (5.7)
IFNG+874 A:A 22 (26.2) 17 (30.9) 28 (27.2) 11 (30.6) A:T 47 (56.0) 22 (40.0) 53 (51.5) 16 (44.4) T:T 15 (17.8) 16 (29.1) 22 (21.3) 9 (25.0)
TGFB1 cdn10 C:C 22 (26.1) 11 (19.6) 25 (24.3) 8 (21.6) C:T 36 (42.9) 29 (51.8) 46 (44.7) 19 (51.4) T:T 26 (31.0) 16 (28.6) 32 (31.0) 10 (27.0)
TGFB1 cdn25 C:C 0 (0.0) 0 (0.0) 0 (0.0) 0 (0.0) C:G 9 (10.7) 8 (14.3) 12 (11.7) 5 (13.5) G:G 75 (89.3) 48 (85.7) 91 (88.3) 32 (86.5)
TNFA-308 G:Gbc 69 (82.1) 33 (60.0) 82 (79.7) 20 (55.6) G:Ade 13 (15.5) 22 (40.0) 19 (18.4) 16 (44.4) A:A 2 (2.4) 0 (0.0) 2 (1.9) 0 (0.0)
TNFA-238 G:G 76 (90.5) 49 (89.1) 94 (91.3) 31 (86.1) G:A 8 (9.5) 6 (10.9) 9 (8.7) 5 (13.9) A:A 0 (0.0) 0 (0.0) 0 (0.0) 0 (0.0)
IL2-330 G:G 9 (11.0) 4 (7.1) 11 (10.9) 2 (5.4) G:T 33 (40.2) 22 (39.3) 40 (39.6) 15 (40.5) T:T 40 (48.8) 30 (53.6) 50 (49.5) 20 (54.1)
IL2+166 G:G 38 (46.3) 24 (42.9) 46 (45.5) 16 (43.2) G:T 34 (41.5) 24 (42.9) 42 (41.6) 16 (43.2) T:T 10 (12.2) 8 (14.2) 13 (12.9) 5 (13.6)
IL4-1098 T:T 44 (55.7) 34 (63.0) 58 (59.8) 20 (55.5) T:G 33 (41.8) 18 (33.3) 36 (37.1) 15 (41.7) G:G 2 (2.5) 2 (3.7) 3 (3.1) 1 (2.8)
IL4-590 C:C 46 (58.2) 36 (66.7) 56 (57.7) 26 (72.3) C:T 28 (35.4) 15 (27.8) 36 (37.1) 7 (19.4) T:T 5 (6.4) 3 (5.5) 5 (5.2) 3 (8.3)

64
IL4-33 T:T 4 (5.1) 2 (3.7) 4 (4.1) 2 (5.6) T:C 27 (34.2) 14 (26.0) 33 (34.0) 8 (22.2) C:C 48 (60.7) 38 (70.3) 60 (61.9) 26 (72.2)
IL6-174 G:Gf 47 (58.0) 23 (40.4) 54 (54.0) 16 (42.1) G:Cg 27 (33.3) 30 (52.6) 38 (38.0) 19 (50.0) C:C 7 (8.7) 4 (7.0) 8 (8.0) 3 (7.9)
IL6nt565 G:G 49 (60.5) 25 (43.9) 56 (56.0) 18 (47.4) G:Ah 25 (30.9) 29 (50.9) 37 (37.0) 17 (44.7) A:A 7 (8.6) 3 (5.2) 7 (7.0) 3 (7.9)
IL10-1082 G:G 14 (16.7) 9 (16.4) 16 (15.7) 7 (18.9) G:A 39 (46.4) 23 (41.8) 49 (48.0) 13 (35.2) A:A 31 (36.9) 23 (41.8) 37 (36.3) 17 (45.9)
IL10-819 C:C 36 (42.9) 30 (54.6) 48 (47.0) 18 (48.7) C:T 42 (50.0) 19 (34.5) 47 (46.1) 14 (37.8) T:T 6 (7.1) 6 (10.9) 7 (6.9) 5 (13.5)
IL10-592 C:C 36 (42.9) 30 (54.6) 48 (47.0) 18 (48.7) C:A 42 (50.0) 19 (34.5) 47 (46.1) 14 (37.8) A:A 6 (7.1) 6 (10.9) 7 (6.9) 5 (13.5)
For technical reasons, some patients did not have all their SNPs typed, so N is variable depending on the SNP. P obtained through the Chi-square test or Fisher’s test. n= number of genotype; F%= relative frequency of genotypes. F0-F2: early stages of liver fibrosis; F3-F4, advanced stages of liver fibrosis or cirrhosis; F0-F3, no cirrhosis; F4, cirrhosis. a F0-F3 vs F4: 16 (15.5%) vs 1 (2.6%) P=0.0414; OR=0.147; IC=0.0188 – 1.1491 b F0-F2 vs F3-F4: 69 (82.1%) vs 33 (60.0%) P= 0.0038; OR=0.326; IC=0.15 - 0.7088 c F0-F3 vs F4: 82 (79.7%) vs 20 (55.6%) P= 0.0049; OR=0.3201; IC=0.1419 – 0.7222 d F0-F2 vs F3-F4: 13 (15.5%) vs 22 (40.0%) P= 0.0011; OR=3.641; IC=1.6354 - 8.1065 e F0-F3 vs F4: 19 (18.4%) vs 16 (44.4%) P= 0.0019; OR=3.5368; IC=1.5505 – 8.0681 f F0-F2 vs F3-F4: 47 (58.0%) vs 23 (40.4%) P= 0.0409; OR=0.489; IC=0.2457 - 0.9747 g F0-F2 vs F3-F4: 27 (33.3%) vs 30 (52.6%) P= 0.0233; OR=2.222; IC=1.1085 - 4.455 h F0-F2 vs F3-F4: 25 (30.9%) vs 29 (50.9%) P= 0.0176; OR=2.32; IC=1.1505 - 4.6784

65
Table 06. Distribution of haplotype frequencies of polymorphisms in cytokine genes in patients of a Brazilian population with chronic hepatitis C, classified according with the fibrosis degree by the Metavir scale.
Polymorphism Haplotypes F0-F2 (n=84) F3-F4 (n=57) F0-F3 (n=103) F4 (n=38)
n (F%) n (F%) n (F%) n (F%) TGFBβ1 (cdn10; cdn25)
CG 71 (42.2) 43 (38.3) 84 (40.8) 30 (40.5) TG 88 (52.4) 61 (54.5) 110 (53.4) 39 (52.7) CC 9 (5.4) 8 (7.2) 12 (5.8) 5 (6.8)
TNFA (-308; -238)
GGab 143 (85.1) 82 (74.5) 174 (84.5) 51 (70.8) GA 8 (4.8) 6 (5.5) 9 (4.4) 5 (6.9)
AGcd 17 (10.1) 22 (20.0) 23 (11.1) 16 (22.2) IL2 (-330; +166) TG 59 (36.0) 42 (37.5) 72 (35.6) 29 (39.2)
GG 51 (31.1) 30 (26.8) 62 (30.7) 19 (25.7) TT 54 (32.9) 40 (35.7) 68 (33.7) 26 (35.1)
IL4 (-1098; -590; -33)
GCC 35 (22.2) 21 (19.4) 40 (20.6) 16 (22.2) TCC 85 (53.8) 66 (61.1) 108 (55.7) 43 (59.7) TTT 34 (21.5) 18 (16.7) 40 (20.6) 12 (16.7) TTC 2 (1.3) 2 (1.9) 4 (2.1) 0 (0.0) GTT 1 (0.6) 0 (0.0) 1 (0.5) 0 (0.0) GTC 1 (0.6) 1 (0.9) 1 (0.5) 1 (1.4)
IL6 (-174; nt565)
GG 121 (74.7) 76 (66.7) 146 (73.0) 51 (67.1) CA 39 (24.1) 35 (30.7) 51 (25.5) 23 (30.3) CG 2 (1.2) 3 (2.6) 3 (1.5) 2 (2.6)
IL10 (-1082; -819; -592)
ATA 54 (32.1) 31 (27.7) 61 (29.6) 24 (32.4) ACC 47 (28.0) 39 (34.8) 63 (30.6) 23 (31.1) GCC 67 (39.9) 42 (37.5) 82 (39.8) 27 (36.5)
For technical reasons, some patients did not have all their SNPs typed, so N is variable depending on the SNP. P obtained through the Chi-square test or Fisher’s test. n= number of haplotype; F%= relative frequency of haplotype. F0-F2: early stages of liver fibrosis; F3-F4, advanced stages of liver fibrosis or cirrhosis; F0-F3, no cirrhosis; F4, cirrhosis. a F0-F2 vs F3-F4: 143 (85.1%) vs 82 (74.5%) P= 0.0281; OR=0.512; IC=0.2799 – 0.9365 b F0-F3 vs F4: 174 (84.5%) vs 51 (70.8%) P= 0.0112; OR=0.4466; IC=0.2372 – 0.8409 c F0-F2 vs F3-F4: 17 (10.1%) vs 22 (20.0%) P= 0.0203; OR=2.2206; IC=1.119 - 4.4066 d F0-F3 vs F4: 23 (11.1%) vs 16 (22.2%) P= 0.0200; OR=2.2733; IC=1.1235 – 4.5998

66
Table 07. Summary of all positive (susceptible) and negative (protective) polymorphisms in cytokine genes in patients of a Brazilian population with chronic hepatitis C, classified according with the fibrosis degree by the Metavir scale.
Polymorphisms Positive Association with hepatic damage
Negative Association with hepatic damage
TNFA-308 A F3-F4 and F4 G:G F0-F2 and F0-F3
G:A F3-F4 and F4
TNFA (-308; -238) GG F0-F2 and F0-F3
AG F3-F4 and F4
IL6-174 G:G F0-F2
G:A F3-F4 IL6nt565 G:A F3-F4 IL4RA+1902 A F3-F4
G:G F0-F3 *P< 0.05 when comparing F0-F2 vs F3-F4 and F0-F3 vs F4.

67
Supplementary material
Values of p, D’ and r2 for linkage disequilibrium between pairs of cytokine gene SNPs in patients of a Brazilian population with chronic hepatitis C.
Polimorphisms Variants Pairs p D’ r2
TGFB1 (cdn10; cdn25) TG CC
0.0000 1.0000 0.0735
TNFA (-308; -238) GG AA
0.1209 1.0000 0.0087
IL2 (-330; +166) TT GG
0.0000 1.0000 0.2145
IL4 (-1098; -590) GC TT
0.0003 0.7708 0.0483
IL4 (-1098 -33) GC TT
0.0001 0.9149 0.0594
IL4 (-590; -33) CC TT
0.0000 1.0000 0.8730
IL6 (-174; nt565) GG CA
0.0000 1.0000 0.9135
IL10 (-1082; -819) AT GC
0.0000 1.0000 0.2779
IL10 (-1082; -592) AA GC
0.0000 1.0000 0.2779
IL10 (-819; -592) TA CC
0.0000 1.0000 1.0000

68
5. CAPÍTULO II

69
Cytokine and cytokine receptor gene polymorphisms in response to treatment with pegylated interferon-alpha and ribavirin in patients with chronic hepatitis C
Sara Tatiana Moreira1, Giovanni Faria Silva2, Camila Fernanda Verdichio de Moraes3, Rejane Maria
Tomasini Grotto3, Maria Inês de Moura Campos Pardini3, Ricardo Alberto Moliterno1, Maria da Graça
Bicalho4
1Immunogenetics Laboratory, Basic Sciences of Healthy Department, Maringá State University, UEM,
Maringá, Paraná, Brazil. 2Gastroenterology Division, Internal Medicine Department, Botucatu Medical School, São Paulo State
University, UNESP, Botucatu, São Paulo, Brazil. 3Molecular Biology Laboratory of Blood Transfusion Center, Botucatu Medical School, São Paulo
State University, UNESP, Botucatu, São Paulo, Brazil. 4Immunogenetics and Histocompatibility Laboratory, Genetics Department, Paraná Federal University,
UFPR, Curitiba, Paraná, Brazil
Correspondence to:
Dr. Ricardo Alberto Moliterno
Laboratório de Imunogenética, Departamento de Ciências Básicas e da Saúde, Universidade
Estadual de Maringá, Av. Colombo, 5790, 87020-900, Maringá, PR, Brasil
Tel: 011 4864
Fax: (+55 44) 3011 4931
e-mail: [email protected]

70
ABSTRACT
The current standard-of-care (SOC) treatment for chronic hepatitis C is based on a
combination of conventional or pegylated interferon alpha (pegIFN-alpha) and ribavirin administered
for 24 or 48 weeks, respectively. Single nucleotide polymorphisms (SNPs) located in
regulatory/encoding regions of cytokine genes could influence the treatment response, since they
interfere with the expression and secretion of cytokine, which are important factors participating in the
immune response against HCV. Therefore, the aim of this study was to determine the genotype of 22
SNPs found in 13 genes for both cytokines and cytokine receptors to assess the influence of
polymorphic variants in response to treatment in Brazilian patients chronically infected only with HCV
genotype 1. Polymorphic variants at positions IL10-819, IL10-592, IL1A-889, IL1B+3962, IL1R1 pst1
1970 and IL4RA+1902 showed association with the treatment response. It was concluded that
cytokine and cytokine receptor genes seem to influence the treatment response of chronically infected
HCV 1 patients.
Keywords: hepatitis C, interferon-alpha, ribavirin, cytokine, polymorphism

71
INTRODUCTION
Hepatitis C virus (HCV), a hepatropic positive-strand RNA virus that belongs to the
Flaviviridade family, has become the major cause of liver disease worldwide and a potential cause of
substantial morbidity and mortality in the future [1]. Nearly 80% of the infected patients fail to
spontaneously clear the virus and progress to chronic hepatitis, a major public health concern
worldwide [2]. Chronic HCV disease may cause liver histopathological changes, beginning with an
inflammation often associated with fibrosis, which may progress to cirrhosis and, in some cases, to
hepatocellular carcinoma [3].
The current standard-of-care (SOC) treatment for chronic hepatitis C is based on a
combination of conventional or pegylated interferon alpha (pegIFN-alpha) plus ribavirin given for 24 or
48 weeks, respectively [4-6]. However, the rate of treatment response varies widely among individuals.
Efficacy of therapy has been shown to be at least partly related to virological and host genetic
determinants. Among virus-related factors, viral genotype seems to be the most important and a
predictor of response [7]. In patients infected with HCV genotype 1, the most frequent HCV genotype
worldwide, treatment is successful in only 40-50% of cases, versus approximately 80% in patients
infected with HCV genotypes 2 and 3 [8]. Among host genetic factors, single nucleotide
polymorphisms (SNPs), located in regulatory and encoding regions of cytokine genes could influence
the treatment response by interfering with expression and secretion of cytokines, important factors that
participate in the immune response against HCV [8-10].
Some allelic variants of SNPs from cytokine genes have been associated with HCV treatment
response [11]. Among them, the IL28B rs12979860 C:C genotype is associated with a two-fold
increase in the sustained virological response (SVR) rate in patients with chronic infection by HCV
genotype 1 or 4. This SNP has been recommended as single predictor of treatment response [12, 13].
However, some other studies have yielded contradictory results due to poor study design. Most
studies apply heterogeneous HCV genotype samples, with or without concurrent hepatitis B virus
(HBV) and human immunodeficiency virus (HIV) infections as well as various treatment protocols. So,
further research is required to clarify the current role of cytokine genetic variants in the treatment
outcome response. Moreover, we found that no studies with this approach were carried out in Brazil.
In this context, the objective of this study was to assess the influence of polymorphic variants in
cytokine genes and cytokine receptor genes in the treatment response with pegIFN-alpha and ribavirin
combined therapy in Brazilian patients chronically infected only with HCV genotype 1. The results may
lead to refinements in the pharmacogenomic prediction of antiviral response and will provide
alternatives to the use of IL28B rs12979860 SNP for predicting response to treatment.
METHODOLOGY
Casuistry
Seven hundred and sixty-one patients infected with HCV were seen and assisted monthly,
between September 2004 and January 2009, by a multidisciplinary team at the Gastroenterology

72
Division of the University Hospital, Botucatu’s Medicine School, SP, Brazil. Of these, 136 unrelated
patients were carefully selected and included in this study, according to the following criteria: infection
only by HCV genotype 1, diagnosis based on the presence of viral RNA confirmed by molecular tests,
chronicity characterized by liver biopsy and persistence of viral RNA in serum, liver biopsy performed
prior to initiation of antiviral treatment, signing of the consent form. The study excluded patients with
factors that compromise the course of hepatitis C and could lead to wrong conclusions: alcohol or drug
users during treatment, patients with positive serology for HBV and/or HIV, hemophiliacs or patients
with other liver diseases, patients infected on the other viral genotype, patients who did not adhere to
treatment protocol. Clinical data were obtained from medical records. The patients were regarded as a
mixed ethnic group (excluding Oriental and African ancestry), given that phenotypic evaluations based
on physical characteristics such as skin color are not good predictors of genomic African ancestry in
Brazilian populations [14]. The study protocol was approved by the Ethics Committee in Human
Research of the Medicine School of Botucatu, Universidade Estadual Paulista.
Treatment protocol
Patients were treated with 1.5 μg/kg/week of pegIFN-alpha along with 1000 mg (if the patient’s
weight is less than 75kg) or 1250mg (if the patient's weight is more than 75kg) of ribavirin for 48
weeks. Patients were followed for more 24 weeks after the end of treatment to confirm the elimination
of the virus [15]. Adherence to treatment protocol was monitored by medical records. HCV RNA was
performed in the 12th, 24th and 48th week of treatment and later in the 12th and 24th week after the end
of treatment. The patients were grouped according to treatment outcome: SVR - patients with
sustained virological response (with undetectable viral RNA 24 weeks after the end of treatment); NRS
- non-responsive patients (with detectable viral RNA on the 48th week of treatment), REL - so-called
relapser patients (with undetectable viral RNA on the 48th week of treatment, but who showed viral
RNA in serum on the 12th or 24th week post-treatment).
Viral genotyping
HCV genotyping was defined through reverse line probe assay technique (INNOLIPA® v.1.0,
Innogenetics, Ghent, Belgium), according to manufacturer instructions. This genotyping was preceded
by the extraction of total RNA present in patient's plasma, followed by reverse-transcription
polymerase chain reaction (RT-PCR), using the amplicor HCV test version 2.0 kit (Roche Diagnostic
System, Branchburg, NJ, USA).
Genomic DNA extraction
Genomic DNA was extracted from whole blood obtained from an initial volume of 10 mL,
collected into tubes containing EDTA. The extraction was performed either through the Salting-out
technique [16] or BioPur commercial kit (Diagnostic Biometrix, Curitiba, PR, Brazil).

73
Genotyping of polymorphic variants in cytokine genes
The genotyping of polymorphic variants of cytokine genes was performed with 75-125 ng/μl of
DNA, by PCR-SSP (polymerase chain reaction with sequence-specific primers) using the Cytokine
Genotyping kit (Dynal Biotech, Invitrogen® Corporation, Brown Deer, WI, USA) according to
manufacturer’s instructions. It were determined the alleles, genotypes and haplotypes for 22 SNPs
located in 13 cytokine genes (Table 01). The amplified fragments were separated on 2% agarose gel
in a horizontal electrophoresis system. The results interpretation was performed according to standard
forms provided by the manufacturer of the Cytokine Genotyping kit.
Statistical analysis
The allelic and genotypic frequencies were obtained by direct counting. Haplotype frequencies
were estimated based on the genotype frequencies observed, through the likelihood method using the
EM algorithm (expectation maximization), which is part of an integrated software package available in
the Arlequin version 3.5 [17]. Convert software was used to prepare the input file for the Arlequin
package [18].
The comparison of frequencies in each sub-sample was performed by 2x2 contingency tables
using the chi-square or Fisher's exact test, when n≤5 in any cell. Differences were considered
statistically significant when P≤0.05. The association strength was assessed by Odds Ratio (OR)
obtained with a confidence interval (CI) of 95% [19]. Haldane correction was employed when n≤5 in
any cell [20]. Statistical analyzes were performed using the Vassar Stats software
(http://faculty.vassar.edu/lowry/VassarStats.html). The parameters of linkage disequilibrium D' and r2
were performed using the Haploview 4.2 software [21]. Stepwise logistic regression was used to
assess associations between treatment response and categorical explanatory variables, such as
gender, age and estimated duration of HCV infection. Analysis was conducted using the SPSS 20.0
statistical package (SPSS, Inc., Chicago, IL, USA).
RESULTS
Firstly, non-responsive and relapsers patients were analyzed as a single group (NRS+REL=84
patients) and compared to SVR group (n=52). Later on, the three groups were compared separated
(NRS vs SVR, REL vs SVR and NRS vs REL), since genetic factors could influence differently the
NRS and REL groups. For technical reasons, a few patients had not all their SNPs genotyped.
Demographic and clinical information of patients
Demographic and clinical information of patients are presented in Table 02. According to the
treatment outcome, 52 (38.2%) patients presented SVR (with undetectable viral RNA 24 weeks after
the end of treatment), 59 (43.4%) were NRS (with detectable viral RNA on the 48th week of treatment)
and 25 (18.4%) were REL (with undetectable viral RNA on the 48th week of treatment, but who
showed viral RNA in serum on the 12th or 24th week post-treatment). These percentages are
consistent with the epidemiological data, where 40-50% of patients infected with HCV genotype 1 had

74
SVR [8]. The mean age of the NRS group was higher than for the SVR and REL groups. When the
groups were compared to one another, NRS vs SVR (46.2±10.0 years vs 40.6±10.3 years, P<0.05)
and NRS+REL vs SVR (45.1±10.0 years vs 40.6±10.3 years, P<0.05) presented a statistically
significant difference. The same trend was observed for the mean duration of infection (NRS vs SVR:
24.7±9.4 years vs 18.9±7.9 years, P<0.05 and NRS+REL vs SVR: 23.7±8.4 years vs 18.9±7.9 years,
P<0.05, respectively). Multivariate logistic regression adjusting for the simultaneous contributions of
independent variables (gender, age and estimated duration of HCV infection) indicated that none of
them interferes with response to treatment (Table 03).
Allele frequencies
Table 04 shows the polymorphic allelic variants in the assessed cytokine and cytokine
receptor genes. When comparing NRS vs REL, it was seen in the REL group a higher frequency of
both the IL1R1/T allele (25.9% vs 44.0%; P= 0.0208; OR= 2.2524; IC= 1.1229 – 4.5180) and the
IL4RA+1902/G allele (21.2% vs 36.0%; P= 0.0441; OR= 2.0925; IC= 1.0115 – 4.3288). There were no
statistically significant differences between alleles for the other cytokines or groups.
Genotype frequencies
Genotype frequencies are shown in Table 05. When comparing groups NRS+REL vs SVR, we
observed a higher frequency of the IL1B+3962/T:C genotype in the SVR group (26.5% vs 45.1%; P=
0.0268; OR= 2.2776; IC= 1.0909 – 4.755). When comparing REL vs SVR, the genotypes IL1A-
889/C:C (76.0% vs 50.0%; P= 0.0310; OR= 0.3158; IC= 0.1081 – 0.9227) and IL1R1/C:T (72.0% vs
40.4%; P= 0.0093; OR= 0.2634; IC= 0.0937 – 0.7408) were more frequent in REL group. In contrast,
genotypes IL1A-889/C:T (20.0% vs 44.0%; P= 0.0461; OR= 3.1429; IC= 1.0174 – 9.7091) and
IL1R1/C:C (20.0% vs 50.0%; P= 0.0140; OR= 4; IC= 1.3042 – 12.2677) were more frequent in the
SVR group. Comparisons between NRS vs SVR showed a higher frequency of the genotypes IL10-
819/C:T and IL10-592/C:A in the SVR group (32.8% vs 52.9%; P= 0.0333; OR= 2.3092; IC= 1.0622 –
5.0202; identical values for both genotypes). As for the NRS vs REL, genotypes IL4RA+1902/G:G
(5.1% vs 20.0%; P= 0.0472; OR= 4.6667; IC= 1.0209 – 21.331) and IL1R1/C:T (37.9% vs 72.0%; P=
0.0043; OR= 4.2078; IC= 1.515 – 11.6871) were more frequent in the REL group, while genotype
IL1R1/C:C had a higher frequency in the NRS group (55.2% vs 20.0%; P= 0.0038; OR= 0.2031; IC=
0.0671 – 0.6153).
Haplotype frequencies
Haplotype frequencies are shown in Table 06. There were no statistically significant
differences when comparing groups.
The summary of all positive (susceptible) and negative (protective) polymorphic variants are
presented on Table 07.

75
DISCUSSION
The prediction of response to treatment is very useful. Predictors of response include host
factors such as gender, age and degree of fibrosis and viral factors such as viral genotypes, viral load
and early disappearance of HCV RNA after initiation of therapy [22, 23]. Recently, much research has
been directed to the study of genetic polymorphisms and their relationship with different outcomes
after the treatment with pegIFN-alpha and ribavirin. Several SNPs allelic variants from cytokine genes
have been associated with treatment response [11]. Most studies apply heterogeneous HCV genotype
samples, with or without concurrent hepatitis B virus (HBV) and human immunodeficiency virus (HIV)
infections, and also various treatment protocols. Therefore, further research is required to clarify the
current role of genetic variants in the treatment response. The aim of this study was to assess the
influence of polymorphic variants in cytokine genes and cytokine receptor genes in the treatment
response with pegIFN-alpha and ribavirin combined therapy in Brazilian patients chronically infected
only with HCV genotype 1.
The current hepatitis C SOC treatment is based on a combination of conventional or pegylated
interferon alpha (pegIFN-alpha) and ribavirin administered for 24 or 48 weeks, respectively [4-6]. Soon
after its subcutaneous administration, the alpha-pegIFN binds to receptors present on the surface of
various cells, including hepatocytes, activating the transcription factor ISGF3 (IFN-stimulated gene
factor 3), which in turn induces the expression of various IFN-stimulated genes (ISG), whose products
are responsible for antiviral and immunomodulatory effects of pegIFN-alpha. Besides acting in the
ISGs [24], ribavirin is believed to act increasing the rate of viral mutation and/or playing an
immunomodulatory role, also preventing relapses in the combined treatment [8, 25].
Considering that the medication interferes directly in gene regulation, a differentiated gene
expression between patient groups could explain the variation in the treatment response. However, it
seems that nonresponders and sustained virological responders have different gene expression
profiles prior to treatment. A higher expression of ISGs by endogenous IFN has been reported in non-
responders (nonresponders + relapsers) before the start of induced-treatment [25-27]. Maybe ISGs
are already maximally induced in nonresponders, thus, pre-activation of the IFN system in these
patients appears to limit the antiviral effect of IFN therapy. It is important to note that pre-activation of
ISGs was not observed in the PBMCs from patients, indicating that baseline ISG preactivation in
nonresponders is specific to the liver [24], although some authors have not confirmed this observation
[28, 29]. Many of the genes found to be upregulated differentially between non-responders and
responders encode cytokines [26, 30] and are excellent candidate genes in search of genetic markers
as predictors of response to treatment. The literature presents conflicting results regarding the association between polymorphic
variants of IL10 and response to treatment. Yee et al., when studying a British population, observed
the alleles IL10-592/A and -819/T, the genotypes -819/T:T and -592/A:A and the ATA haplotype (-
1082; -819; -592) associated to SVR [31]. The same association was observed by Edward-Smith et al.
for alleles and haplotype in an Australian population [32]. Knapp et al., when studying an european
population infected by various viral genotypes [33] observed an association between the genotype -

76
1082/G:G and the haplotype GCC and SVR. Morgan et al. found an association between the diplotype
ACC/ACC and SVR in a North-American population infected with HCV genotype 1 [34]. However,
other authors found no associations when studying different populations [35-39]. The present study
found an association between the genotypes IL10-819/C:T and IL10-592/C:A with SVR. The conflict
between the results may be a reflection of several factors such as sample size, sample heterogeneity,
differences between the parameters of analysis, genetic heterogeneity due to population mixing,
different gene-gene and gene-environment interaction. The small sample size can be found in the
study of Edward-Smith et al. [32]. The grouping of NRS with REL in a same group was reported in all
the above mentioned studies but Knapp et al. [33], which in turn worked with patients infected by
different viral genotypes.
Three SNPs located in the promoter region of the IL10 gene, -1082G>A, -819C>T and -
592C>A [40, 41] seem to be associated to different levels of gene expression, since they possibly alter
specific recognition sites for transcription factors, thus affecting the levels of cytokine production [32,
42]. The alleles −1082/G, −819/C and −592/C could be associated with high production of IL-10, while
their respective alleles would be related to the low production [42, 43]. Lower levels of IL-10 were
observed in individuals with the −592/C:A or −592/A:A genotype [44]. Although the present study
shows a higher frequency of the genotypes -819/C:T and -592/C:A for the SVR group, both positions
are in absolute linkage disequilibrium (supplementary material) and there is more evidence of
functionality to the IL10-592 position [44, 45]. Therefore, we believe that the SVR would be associated
to the low levels of IL-10 produced by patients with the genotype −592/C:A.
As a potent immune modulator, interleukin-10 may exert a profound impact on the overall
therapeutic outcome. IL-10 is a potent anti-inflammatory Th2 cytokine mainly produced by monocytes,
macrophages and T cells, that down-regulates the expression of the major histocompatibility complex
(MHC) class I and class II molecules as well as the production of Th1 cytokines [46] and consequently
leads to a weaker T CD8 response [47]. High plasma and liver levels of this cytokine have been
observed in individuals chronically infected with HCV, being a negative prognostic marker of response
to hepatitis C treatment [48-51]. Patients with high levels of IL-10 are less favorable to develop SVR
after treatment [49, 52-54], whereas low levels are associated with SVR [55]. Also, non-responder
individuals have high production of IL-10 by their peripheral blood dendritic cells [56]. The mechanism
by which IL-10 limits the IFN effects are likely to involve the inhibition of IFN-activated STAT1 in the
liver [57]. Evidence suggests that ribavirin itself decreases the IL-10 levels, polarizing the immune
response to Th1, allowing the action of IFN and the consequent attainment of an SVR [10, 53, 58].
The presence of genotypes related to poor production of IL-10 possibly results in an
insufficient liver concentration of this cytokine to polarize the immune response towards Th2, thus
resulting in viral clearance due to a Th1 response [59, 60]. Generally, patients who successfully clear
the virus (either spontaneously or after treatment) also express strong Th1 responses and increased
IFN-ɣ production in response to HCV antigens [61, 62]. Although not all studies favor such effects of
IL10 polymorphisms, it is worth noticing that many of them present heterogeneous sample of patients.
This is the case of Knapp et al. [33], who observed an association between SVR and the genotype -

77
1082/G:G and haplotype GCC, which might be expected to have the highest production of IL-10, when
working with a sample of individuals infected with different viral genotypes.
Interleukin-1 is an important cytokine for the generation of an inflammatory response and,
therefore, of interest in studies on hepatitis C. The IL-1 gene family consists of, among others, the
following members: IL1A e IL1B genes, which encode two antagonists of interleukin-1, IL-1α and IL-
1β; the IL1RN gene, which encodes the receptor antagonist to IL-1 (IL-1Ra) and the IL1R1 gene,
which encodes the receptor type I of IL-1 (IL-1R1). IL-1α and IL-1β are important inducers of
inflammation, whereas the binding of IL-1Ra to the IL-1R1 receptor does not induce the target cell
activation, thus acting as an antagonist [63]. There are several functional polymorphisms in these
genes: there are at least three polymorphisms in the IL1B gene, one at position -511C>T, the other at
-31T>C and another at +3962C>T [64, 65]; the polymorphism at -889C>T [65] was described in the
IL1A; the polymorphism mspa1 11100C>T [65] was described in IL1RN gene; and the polymorphism
pst1 1970C>T [66] in IL1R1. The often confusing polymorphism nomenclature can differ widely
between authors; this is the case of the SNP IL1B+3962, also known as +3953 [35] or +3954 [67] by
some authors, but in all cases the dbSNP number is rs1143634 [68].
It seems that the relationship between polymorphisms of the IL-1 gene family and
hepatocellular carcinoma in Japanese patients chronically infected with HCV is becoming well
established. In this population, genotypes IL1B-31/T:T and -511/T:T and the haplotype -511;-31/CT
were associated to the progression of chronic hepatitis C into hepatocellular carcinoma [69-71]. On the
other hand, the relationship between polymorphisms of the IL-1 gene family and spontaneous viral
clearance does not seem to be well established so far, although there are a few studies addressing
this topic. Minton et al. [72] found no association between the SNPs IL1B-511 and +3954 and
spontaneous viral clearance. Ksiaa Cheikhrouhou et al. [67] also found no association between the
IL1A-889, IL1B-511, +3954 SNPs and spontaneous viral clearance. In contrast, the genotype IL1B-
511/T:T was associated with a higher susceptibility to the development of chronic hepatitis C in a
German population [73].
Only two studies examined the relationship between the IL1 genetic polymorphisms and
response to treatment. Constantini et al. [35], studying the frequency of SNPs IL1A-889 and
IL1B+3953 in Polish patients, and Abbas et al. [37] , studying the SNP IL1B-511 in Pakistan, found no
association between allelic variants and response to treatment. However, it is worth mentioning that
the patients enrolled in the study by Constantini et al. [35] were infected with different viral genotypes,
while those who participated in the study of Abbas et al. [37] were infected with viral genotype 3; also,
in both cases the patients were stratified into two groups only, responders and non-responders. This
study enrolled only individuals infected with HCV genotype 1 virus, who were stratified into three
groups, since there are not only responders and non-responders individuals, but also the relapsers.
Also, we observed that there are differences between these groups.
We observed that the genotype IL1A-889/C:C is associated with relapse after treatment with
pegIFN-alpha and ribavirin, since it was more frequent in the REL group when compared to SVR and
NRS, the latter with P value near of significance. The genotype IL1A-889/C:T was more frequent in the
SVR group, being associated with a good response to treatment. When comparing allele frequencies

78
between REL vs SVR and REL vs NRS it was also observed a higher frequency of the allele IL1A-
889/C in the REL group and of the allele IL1A-889/T in the SVR and NRS groups, with P close to
significance. Studies have shown that the allele -889/T up-regulates transcription of the gene and
therefore increases plasma levels of IL-1α [74] and also IL-1β [75], once IL1A and IL1B
polymorphisms may be in linkage disequilibrium [76]. The -889/T:T genotype would be responsible for
slightly higher mRNA levels compared to the CC or CT genotype [74]. Both genotypes, the one
associated to REL (IL1A-889/C:C) and the one associated with SVR (IL1A-889/C:T) would cause
higher production of IL-1α, which would not explain the different outcomes. However, Kawaguchi et al.
[77] recently observed that there were no statistically significant differences in expression resulting
from this SNP. They demonstrated that -889C>T is acting as a marker for +4845G>T, because they
are in strong linkage disequilibrium in all the examined populations (except African-Americans) where
carriers of the +4845/T allele exhibit high efficiency processing pre-IL-1α, facilitating the cellular
release of IL-1α.
We also found a statistically higher frequency of the IL1B+3962/T:C genotype in the SVR
group when compared to NRS+REL. The same trend was observed when comparing SVR with NRS
and REL separately, with P value close to significance in both cases. Despite innumerous association
studies, many implicating this SNP with disease, there has been little evidence of functionality. It is
possible that this SNP is simply acting as a marker for a functional SNP [68]. On the other hand, it has
being shown that homozygous individual for the T allele produce a fourfold higher amount of IL-1β
compared to individuals displaying the C:C genotype. The genotype +3962/T:C, associated to the
SVR in this study, is related to low production of IL-1β [64, 78]. There is evidence that IL-1β inhibits
the IFN-αβ antiviral activity in liver cells both, in vitro and in vivo. Attenuation of IFN-αβ signaling in the
liver by IL-1β could be one of the mechanisms underlying the resistance to IFN therapy [79]. Thus,
high levels of IL-1β would be associated to the resistance to treatment, while lower levels would be
associated to a good response.
The expression of IL-1R was shown to be increased in inflamed tissue in vitro [80] and the
IL1R1 pst1 1970/C allele was demonstrated to be associated with inflammatory diseases [81, 82].
However, no studies were found assessing the relationship between this polymorphism and treatment
response in hepatitis C. In this study, the IL1R1 pst1 1970/T allele was more frequent in the REL
group when comparing REL vs NRS. The same trend was observed when comparing REL vs. SVR,
but with no statistical significance. The genotype IL1R1 pst1 1970/C:T was more frequent in the REL
group when comparing REL vs SVR and REL vs NRS. The genotype IL1R1 pst1 1970/C:C was less
frequent in the REL group when comparing these groups. There are indications that this SNP did not
affect any known transcription factor recognition sequence or the predicted secondary mRNA structure
[66], therefore, the biological role for the associations obtained remained unknown.
The IL-4 receptor (IL4R) is composed of two subunits, the α, which binds with high affinity to
the ligand, and the γτ, common to other cytokine receptors, which amplifies the signal from the α-
subunit [83, 84]. The α-subunit is also part of the receptor of IL-13 together with the IL-13 binding
protein, IL13Rα1 [68]. The α subunit is encoded by the IL4RA gene, located in 16p12.1. Among the
polymorphisms described for this gene is the -1902G>A [85], resulting in change of glutamine for

79
arginine at position 576 of the peptide (often referred to as position 551 if the signal peptide is not
included in counting). Although a recent study of systemic sclerosis showed that this polymorphism
does not influence gene expression [86], other studies have demonstrated that this change interferes
with intracellular signaling [84, 87], due to its location in the peptide intracellular domain, and that the
IL4RA+1902/G allele is associated with enhanced signaling of the receptor [88] and, consequently,
enhance expression of IL4 and IL13 regulated genes, since it presents IL-4 and IL-13 as ligand [89].
This study observed that the allele IL4RA+1902/G was more frequent in the REL group when
comparing to NRS and SVR, but without statistical significance in the second case. Similarly, the
IL4RA+1902/G:G genotype is more frequent in the REL compared NRS. Avdoshina et al. [90]
observed a higher frequency of the +1902/G:G genotype in patients infected with HCV compared to
healthy volunteers. However, there seems to have been no previous studies assessing the
relationship between the position +1902 and the treatment response in individuals chronically infected
with HCV. We believe that the +1902/G allele as well as the +1902/G:G genotype are relapse markers
after treatment with pegIFNα and ribavirin, possibly because it increases the signaling of IL-4R or IL-
13R receptors, leading to the activation of an anti-inflammatory response. This anti-inflammatory
response could inhibit the action of IFN-α treatment. However, the biological mechanism triggered by
this process and its relation to relapse remains unknown. Moreover, considering that the +1902 is in
linkage disequilibrium with the positions 375, 406, 478 (E375A, C406R, S478P) [91] further
investigations are necessary.
CONCLUSION
This paper presents as a peculiar characteristic the careful selection of patients, to form a
homogeneous sample group in terms of HCV genotype and absence of viral co-infections.
Furthermore, the individuals were followed-up during and after treatment. These efforts may have
more clearly characterized the host's genetic interfering factors in therapeutic response outcome. Our
results showed that polymorphic variants for positions IL10-819, IL10-592, IL1A-889, IL1B+3962,
IL1R1 pst1 1970 and IL4RA+1902 are associated with response to treatment with pegIFNα and
ribavirin in patients chronically infected with HCV genotype 1. Some of our data confirmed the results
of previous studies conducted in other populations, while others were novel and require replication to
confirm. The results may contribute to the future establishment of genetic markers of treatment
response beyond the current gold standard IL28B rs12979860, which will help guide therapeutic
decisions in patients with chronic hepatitis C infected with HCV genotype 1. Considering side effects
and treatment cost [92], prediction of treatment response before therapy is desirable.
ACKNOWLEDGEMENTS
The authors wish to thank the individuals who donated blood samples and made this work
possible. We would also like to thank our lab and PhD colleagues for their help in several tasks. This
work was supported by grants from the Conselho Nacional de Desenvolvimento Científico e
Tecnológico (CNPq) and Coordenação de Aperfeiçoamento de Pessoal de Nível Superior (CAPES).

80
ROLE OF THE FUNDING SOURCE
The funding sources had no role in the study design, collection, analysis and interpretation of
the data, in the writing or decision to submit the paper for publication.
CONFLICT OF INTEREST
The authors declare they have no conflict of interest.
REFERENCES
1. Shepard, C.W., L. Finelli, and M.J. Alter, Global epidemiology of hepatitis C virus infection. Lancet Infect Dis, 2005. 5(9): p. 558-67.
2. Lauer, G.M. and B.D. Walker, Hepatitis C virus infection. N Engl J Med, 2001. 345(1): p. 41-52.
3. Thomas, D.L. and L.B. Seeff, Natural history of hepatitis C. Clin Liver Dis, 2005. 9(3): p. 383-98, vi.
4. Ghany, M.G., et al., Diagnosis, management, and treatment of hepatitis C: an update. Hepatology, 2009. 49(4): p. 1335-74.
5. Gotto, J. and G.M. Dusheiko, Hepatitis C and treatment with pegylated interferon and ribavirin. Int J Biochem Cell Biol, 2004. 36(10): p. 1874-7.
6. Hadziyannis, S.J., et al., Peginterferon-alpha2a and ribavirin combination therapy in chronic hepatitis C: a randomized study of treatment duration and ribavirin dose. Ann Intern Med, 2004. 140(5): p. 346-55.
7. Alberti, A. and L. Benvegnu, Management of hepatitis C. J Hepatol, 2003. 38 Suppl 1: p. S104-18.
8. Chevaliez, S. and T. Asselah, Mechanisms of non-response to antiviral treatment in chronic hepatitis C. Clin Res Hepatol Gastroenterol, 2011. 35 Suppl 1: p. S31-41.
9. Perrey, C., et al., Genotyping for polymorphisms in interferon-gamma, interleukin-10, transforming growth factor-beta 1 and tumour necrosis factor-alpha genes: a technical report. Transpl Immunol, 1998. 6(3): p. 193-7.
10. Tambur, A.R., et al., Role of cytokine gene polymorphism in hepatitis C recurrence and allograft rejection among liver transplant recipients. Transplantation, 2001. 71(10): p. 1475-80.
11. Romero-Gomez, M., et al., Genes and hepatitis C: susceptibility, fibrosis progression and response to treatment. Liver Int, 2011. 31(4): p. 443-60.
12. Suppiah, V., et al., IL28B is associated with response to chronic hepatitis C interferon-alpha and ribavirin therapy. Nat Genet, 2009. 41(10): p. 1100-4.
13. Tanaka, Y., et al., Genome-wide association of IL28B with response to pegylated interferon-alpha and ribavirin therapy for chronic hepatitis C. Nat Genet, 2009. 41(10): p. 1105-9.
14. Parra, F.C., et al., Color and genomic ancestry in Brazilians. Proc Natl Acad Sci U S A, 2003. 100(1): p. 177-82.
15. de Araujo, E.S., et al., Consensus of the Brazilian Society of Infectious Diseases on the management and treatment of hepatitis C. Braz J Infect Dis, 2007. 11(5): p. 446-50.
16. Lahiri, D.K. and J.I. Nurnberger, Jr., A rapid non-enzymatic method for the preparation of HMW DNA from blood for RFLP studies. Nucleic Acids Res, 1991. 19(19): p. 5444.
17. Excoffier, L., G. Laval, and S. Schneider, Arlequin (version 3.0): an integrated software package for population genetics data analysis. Evol Bioinform Online, 2005. 1: p. 47-50.
18. Glaubitz, J.C., CONVERT: a user friendly program to reformat diploid genotypic data for commonly used population genetic software packages. Molecular Ecology Notes, 2004(4): p. 309-310.
19. Woolf, B., On estimating the relation between blood group and disease. Ann Hum Genet, 1955. 19(4): p. 251-3.
20. Svejgaard, A. and L.P. Ryder, HLA and disease associations: detecting the strongest association. Tissue Antigens, 1994. 43(1): p. 18-27.
21. Barrett, J.C., et al., Haploview: analysis and visualization of LD and haplotype maps. Bioinformatics, 2005. 21(2): p. 263-5.
22. Poynard, T., et al., Randomised trial of interferon alpha2b plus ribavirin for 48 weeks or for 24 weeks versus interferon alpha2b plus placebo for 48 weeks for treatment of chronic infection

81
with hepatitis C virus. International Hepatitis Interventional Therapy Group (IHIT). Lancet, 1998. 352(9138): p. 1426-32.
23. Brouwer, J.T., et al., Early prediction of response in interferon monotherapy and in interferon-ribavirin combination therapy for chronic hepatitis C: HCV RNA at 4 weeks versus ALT. J Hepatol, 1999. 30(2): p. 192-8.
24. Tokumoto, Y., et al., Ribavirin regulates hepatitis C virus replication through enhancing interferon-stimulated genes and interleukin 8. J Infect Dis, 2012. 205(7): p. 1121-30.
25. Tai, A.W. and R.T. Chung, Treatment failure in hepatitis C: mechanisms of non-response. J Hepatol, 2009. 50(2): p. 412-20.
26. Neuman, M.G., et al., Kinetics of serum cytokines reflect changes in the severity of chronic hepatitis C presenting minimal fibrosis. J Viral Hepat, 2002. 9(2): p. 134-40.
27. Younossi, Z.M., et al., Early gene expression profiles of patients with chronic hepatitis C treated with pegylated interferon-alfa and ribavirin. Hepatology, 2009. 49(3): p. 763-74.
28. Gerotto, M., et al., PKR gene expression and response to pegylated interferon plus ribavirin therapy in chronic hepatitis C. Antivir Ther, 2004. 9(5): p. 763-70.
29. Taylor, M.W., et al., Changes in gene expression during pegylated interferon and ribavirin therapy of chronic hepatitis C virus distinguish responders from nonresponders to antiviral therapy. J Virol, 2007. 81(7): p. 3391-401.
30. Ji, X., et al., Interferon alfa regulated gene expression in patients initiating interferon treatment for chronic hepatitis C. Hepatology, 2003. 37(3): p. 610-21.
31. Yee, L.J., et al., Tumor necrosis factor gene polymorphisms in patients with cirrhosis from chronic hepatitis C virus infection. Genes Immun, 2000. 1(6): p. 386-90.
32. Powell, E.E., et al., Host genetic factors influence disease progression in chronic hepatitis C. Hepatology, 2000. 31(4): p. 828-33.
33. Knapp, S., et al., Interleukin-10 promoter polymorphisms and the outcome of hepatitis C virus infection. Immunogenetics, 2003. 55(6): p. 362-9.
34. Morgan, T.R., et al., DNA polymorphisms and response to treatment in patients with chronic hepatitis C: results from the HALT-C trial. J Hepatol, 2008. 49(4): p. 548-56.
35. Constantini, P.K., et al., Interleukin-1, interleukin-10 and tumour necrosis factor-alpha gene polymorphisms in hepatitis C virus infection: an investigation of the relationships with spontaneous viral clearance and response to alpha-interferon therapy. Liver, 2002. 22(5): p. 404-12.
36. Vidigal, P.G., J.J. Germer, and N.N. Zein, Polymorphisms in the interleukin-10, tumor necrosis factor-alpha, and transforming growth factor-beta1 genes in chronic hepatitis C patients treated with interferon and ribavirin. J Hepatol, 2002. 36(2): p. 271-7.
37. Abbas, Z., et al., Effect of cytokine gene polymorphism on histological activity index, viral load and response to treatment in patients with chronic hepatitis C genotype 3. World J Gastroenterol, 2005. 11(42): p. 6656-61.
38. Chuang, J.Y., et al., IL-10 promoter gene polymorphisms and sustained response to combination therapy in Taiwanese chronic hepatitis C patients. Dig Liver Dis, 2009. 41(6): p. 424-30.
39. Abbas, O.M., et al., Interleukin-10 promoter polymorphisms in hepatitis C patients with and without Schistosoma mansoni co-infection. Liver Int, 2009. 29(9): p. 1422-30.
40. Shin, H.D., et al., Genetic restriction of HIV-1 pathogenesis to AIDS by promoter alleles of IL10. Proc Natl Acad Sci U S A, 2000. 97(26): p. 14467-72.
41. Alamartine, E., et al., Interleukin-10 promoter polymorphisms and susceptibility to skin squamous cell carcinoma after renal transplantation. J Invest Dermatol, 2003. 120(1): p. 99-103.
42. Turner, D.M., et al., An investigation of polymorphism in the interleukin-10 gene promoter. Eur J Immunogenet, 1997. 24(1): p. 1-8.
43. Rosenwasser, L.J. and L. Borish, Genetics of atopy and asthma: the rationale behind promoter-based candidate gene studies (IL-4 and IL-10). Am J Respir Crit Care Med, 1997. 156(4 Pt 2): p. S152-5.
44. Claudino, M., et al., The broad effects of the functional IL-10 promoter-592 polymorphism: modulation of IL-10, TIMP-3, and OPG expression and their association with periodontal disease outcome. J Leukoc Biol, 2008. 84(6): p. 1565-73.
45. Steinke, J.W., et al., Functional analysis of -571 IL-10 promoter polymorphism reveals a repressor element controlled by sp1. J Immunol, 2004. 173(5): p. 3215-22.
46. Moore, K.W., et al., Interleukin-10 and the interleukin-10 receptor. Annu Rev Immunol, 2001. 19: p. 683-765.

82
47. Thursz, M., L. Yee, and S. Khakoo, Understanding the host genetics of chronic hepatitis B and C. Semin Liver Dis, 2011. 31(2): p. 115-27.
48. Cacciarelli, T.V., et al., Immunoregulatory cytokines in chronic hepatitis C virus infection: pre- and posttreatment with interferon alfa. Hepatology, 1996. 24(1): p. 6-9.
49. Marin-Serrano, E., et al., Modulation of the anti-inflammatory interleukin 10 and of proapoptotic IL-18 in patients with chronic hepatitis C treated with interferon alpha and ribavirin. J Viral Hepat, 2006. 13(4): p. 230-4.
50. Kakumu, S., et al., Production of interleukins 10 and 12 by peripheral blood mononuclear cells (PBMC) in chronic hepatitis C virus (HCV) infection. Clin Exp Immunol, 1997. 108(1): p. 138-43.
51. Piazzolla, G., et al., Relationship between interferon-gamma, interleukin-10, and interleukin-12 production in chronic hepatitis C and in vitro effects of interferon-alpha. J Clin Immunol, 2000. 20(1): p. 54-61.
52. Kuzushita, N., et al., High levels of serum interleukin-10 are associated with a poor response to interferon treatment in patients with chronic hepatitis C. Scand J Gastroenterol, 1997. 32(2): p. 169-74.
53. Cramp, M.E., et al., Hepatitis C virus-specific T-cell reactivity during interferon and ribavirin treatment in chronic hepatitis C. Gastroenterology, 2000. 118(2): p. 346-55.
54. Wan, L., et al., Th1 and Th2 cytokines are elevated in HCV-infected SVR(-) patients treated with interferon-alpha. Biochem Biophys Res Commun, 2009. 379(4): p. 855-60.
55. Mirodzhov, G.K., R.I. Odinaev, and M.I. Sattarova, [Cytokines in chronic hepatitis C]. Klin Med (Mosk), 2009. 87(2): p. 13-7.
56. Liang, C.C., et al., Functional impairment of dendritic cells in patients infected with hepatitis C virus genotype 1 who failed peginterferon plus ribavirin therapy. J Med Virol, 2011. 83(7): p. 1212-20.
57. Shen, X., et al., IL-10 attenuates IFN-alpha-activated STAT1 in the liver: involvement of SOCS2 and SOCS3. FEBS Lett, 2000. 480(2-3): p. 132-6.
58. Rigopoulou, E.I., et al., Direct evidence for immunomodulatory properties of ribavirin on T-cell reactivity to hepatitis C virus. Antiviral Res, 2007. 75(1): p. 36-42.
59. Oriss, T.B., et al., Crossregulation between T helper cell (Th)1 and Th2: inhibition of Th2 proliferation by IFN-gamma involves interference with IL-1. J Immunol, 1997. 158(8): p. 3666-72.
60. Bertoletti, A., et al., Different cytokine profiles of intraphepatic T cells in chronic hepatitis B and hepatitis C virus infections. Gastroenterology, 1997. 112(1): p. 193-9.
61. Lasarte, J.J., et al., Cellular immunity to hepatitis C virus core protein and the response to interferon in patients with chronic hepatitis C. Hepatology, 1998. 28(3): p. 815-22.
62. Ferrari, C., et al., T-cell response to structural and nonstructural hepatitis C virus antigens in persistent and self-limited hepatitis C virus infections. Hepatology, 1994. 19(2): p. 286-95.
63. Dinarello, C.A., Biologic basis for interleukin-1 in disease. Blood, 1996. 87(6): p. 2095-147. 64. Wilson, A.G., et al., An allelic polymorphism within the human tumor necrosis factor alpha
promoter region is strongly associated with HLA A1, B8, and DR3 alleles. J Exp Med, 1993. 177(2): p. 557-60.
65. Tseng, L.H., et al., Simultaneous genotyping of single nucleotide polymorphisms in the IL-1 gene complex by multiplex polymerase chain reaction-restriction fragment length polymorphism. J Immunol Methods, 2002. 267(2): p. 151-6.
66. Bergholdt, R., et al., Characterization of polymorphisms of an interleukin 1 receptor type 1 gene (IL1RI) promotor region (P2) and their relation to insulin-dependent diabetes mellitus (IDDM). The Danish Study Group of Diabetes in Childhood. Cytokine, 1995. 7(7): p. 727-33.
67. Ksiaa Cheikhrouhou, L., et al., Cytokine and apoptosis gene polymorphisms influence the outcome of hepatitis C virus infection. Hepatobiliary Pancreat Dis Int, 2011. 10(3): p. 280-8.
68. Smith, A.J. and S.E. Humphries, Cytokine and cytokine receptor gene polymorphisms and their functionality. Cytokine Growth Factor Rev, 2009. 20(1): p. 43-59.
69. Tanaka, Y., et al., Impact of interleukin-1beta genetic polymorphisms on the development of hepatitis C virus-related hepatocellular carcinoma in Japan. J Infect Dis, 2003. 187(11): p. 1822-5.
70. Yu, M.L., et al., Tumor necrosis factor alpha promoter polymorphisms at position -308 in Taiwanese chronic hepatitis C patients treated with interferon-alpha. Antiviral Res, 2003. 59(1): p. 35-40.
71. Okamoto, K., et al., The genotypes of IL-1 beta and MMP-3 are associated with the prognosis of HCV-related hepatocellular carcinoma. Intern Med, 2010. 49(10): p. 887-95.

83
72. Minton, E.J., et al., Clearance of hepatitis C virus is not associated with single nucleotide polymorphisms in the IL-1, -6, or -10 genes. Hum Immunol, 2005. 66(2): p. 127-32.
73. Bahr, M.J., et al., Cytokine gene polymorphisms and the susceptibility to liver cirrhosis in patients with chronic hepatitis C. Liver Int, 2003. 23(6): p. 420-5.
74. Dominici, R., et al., Cloning and functional analysis of the allelic polymorphism in the transcription regulatory region of interleukin-1 alpha. Immunogenetics, 2002. 54(2): p. 82-6.
75. Hulkkonen, J., P. Laippala, and M. Hurme, A rare allele combination of the interleukin-1 gene complex is associated with high interleukin-1 beta plasma levels in healthy individuals. Eur Cytokine Netw, 2000. 11(2): p. 251-5.
76. Gore, E.A., et al., Interleukin-1beta+3953 allele 2: association with disease status in adult periodontitis. J Clin Periodontol, 1998. 25(10): p. 781-5.
77. Kawaguchi, Y., et al., Contribution of single nucleotide polymorphisms of the IL1A gene to the cleavage of precursor IL-1alpha and its transcription activity. Immunogenetics, 2007. 59(6): p. 441-8.
78. Hall, S.K., et al., Correlation of polymorphic variation in the promoter region of the interleukin-1 beta gene with secretion of interleukin-1 beta protein. Arthritis Rheum, 2004. 50(6): p. 1976-83.
79. Tian, Z., et al., IL-1 beta attenuates IFN-alpha beta-induced antiviral activity and STAT1 activation in the liver: involvement of proteasome-dependent pathway. J Immunol, 2000. 165(7): p. 3959-65.
80. Kanda-Nakamura, C., Y. Izumi, and T. Sueda, Increased expression of interleukin-1 receptors on fibroblasts derived from inflamed gingiva. J Periodontol, 1996. 67(12): p. 1267-73.
81. Sarial, S., et al., IL-1, IL-1R and TNFalpha gene polymorphisms in Iranian patients with multiple sclerosis. Iran J Allergy Asthma Immunol, 2008. 7(1): p. 37-40.
82. Barkhordari, E., et al., Proinflammatory cytokine gene polymorphisms in irritable bowel syndrome. J Clin Immunol, 2010. 30(1): p. 74-9.
83. Izuhara, K. and T. Shirakawa, Signal transduction via the interleukin-4 receptor and its correlation with atopy. Int J Mol Med, 1999. 3(1): p. 3-10.
84. Nelms, K., et al., The IL-4 receptor: signaling mechanisms and biologic functions. Annu Rev Immunol, 1999. 17: p. 701-38.
85. Caggana, M., et al., Population-based studies reveal differences in the allelic frequencies of two functionally significant human interleukin-4 receptor polymorphisms in several ethnic groups. Genet Med, 1999. 1(6): p. 267-71.
86. Broen, J.C., et al., Polymorphisms in the interleukin 4, interleukin 13, and corresponding receptor genes are not associated with systemic sclerosis and do not influence gene expression. J Rheumatol, 2012. 39(1): p. 112-8.
87. Mitsuyasu, H., et al., Ile50Val variant of IL4R alpha upregulates IgE synthesis and associates with atopic asthma. Nat Genet, 1998. 19(2): p. 119-20.
88. Hershey, G.K., et al., The association of atopy with a gain-of-function mutation in the alpha subunit of the interleukin-4 receptor. N Engl J Med, 1997. 337(24): p. 1720-5.
89. Kelly-Welch, A.E., et al., Interleukin-4 and interleukin-13 signaling connections maps. Science, 2003. 300(5625): p. 1527-8.
90. Avdoshina, V.V., et al., [Alleles distribution of polymorphic promoter region C-590T in interleukin-4 genes and Q-576r and Ile-50Val regions in IL-4 receptor gene IL-4RA in patients with HCV-infection]. Zh Mikrobiol Epidemiol Immunobiol, 2007(1): p. 43-6.
91. Migliaccio, C., et al., No linkage or association of five polymorphisms in the interleukin-4 receptor alpha gene with atopic asthma in Italian families. Eur J Immunogenet, 2003. 30(5): p. 349-53.
92. Ferguson, M.C., Current therapies for chronic hepatitis C. Pharmacotherapy, 2011. 31(1): p. 92-111.

84
Table 01. List of the investigated cytokine SNPs.
Cytokine gene
Gene chromosome location
SNP designation in the kit dbSNP-ID
SNP chromosome position (reference)
Location
IL1A 2q14 -889C>T rs1800587 113259431 5’-UTR
IL1B 2q14 -511T>C rs16944 113311338 Promoter
+3962C>T rs1143634 113306861 Coding/synonymous
IL1R1 2q12 pst1 1970C>T rs2234650 102124759 Distal promoter
IL1RN 2q14.2 mspa1 11100C>T rs315952 113606775 Coding/synonymous
IL4RA 16p12.1–p11.2 +1902G>A rs1801275 27281901 Coding/missense
IL12B 5q31.1–33.1 -1188A>C rs3212227 158675528 3’-UTR
IFNG 12q14 +874T>A rs2430561 66838787 Intron
TGFB1 19q13.1 codon 10C>T rs1800470 46550761 Coding/missense
codon 25G>C rs1800471 46550716 Coding/missense
TNF 6p21.3 -308G>A rs1800629 31651010 Promoter
-238G>A rs361525 31651080 Promoter
IL2 4q26-27 -330T>G rs2069762 123597430 Promoter
+166G>T rs2069763 123596932 Coding/synonymous
IL4 5q31.1 -1098T>G rs2243248 132036543 Promoter
-590C>T rs2243250 132037053 Promoter
-33T>C rs2070874 132037609 5’-UTR
IL6 7p21 -174G>C
rs1800795 22733170 Promoter
nt565G>A rs1800797 22732746 Promoter
IL10 1q31–q32 -1082A>G rs1800896 205013520 Promoter
-819C>T rs1800871 205013257 Promoter
-592C>A rs1800872 205013030 Promoter

85
Table 02. Demographic and clinical information of patients of a Brazilian population with chronic hepatitis C classified according their response to treatment with pegIFNα and ribavirin.
Characteristics Patients SVR NRS REL (n=136) (n=52) (n=59) (n=25)
Age (years, mean ± SD)* 43.4 ±10.3 40.6 ±10.3 46.2 ±10.0 42.7 ±9.7 Gender n (%)
Male 105 (77.2 39 (75.0 46 (78.0)
20 (80.0) Female 31 (22.8 13 (25.0 13 (22.0
) 5 (20.0)
Duration of infection (years, mean ± SD)*† 21.8 ±8.5 18.9 ±7.9 24.7 ±9.4 21.6 ±5.5 *P<0,05 when comparing NRS vs SVR and NRS+REL vs SVR. †Duration of infection was calculated only for 85 patients (SVR=34, NRS=34, REL=17). The duration of infection for 51 patients is unknown. SVR: patients with undetectable viral RNA 24 weeks after the end of treatment; NRS: patients with detectable viral RNA on the 48th week of treatment; REL: patients with undetectable viral RNA on the 48th week of treatment, but who showed viral RNA in serum on the 12th or 24th week post-treatment.

86
Table 03. Multivariate analysis of predictors of response to treatment among patients of a Brazilian population with chronic hepatitis C classified according their response to treatment with pegIFNα and ribavirin.
Response variable Independent variable Coefficient P OR
NRS and SVR Gender 1.315 0.065 3.724 Age -0.034 0.263 0.966 Duration of infection -0.078 0.056 0.925
REC and SVR Gender 0.685 0.375 1.984 Age -0.039 0.311 0.962 Duration of infection -0.04 0.411 0.961
NRS and REC Gender 0.589 0.491 1.803 Age -0.015 0.685 0.985 Duration of infection -0.049 0.276 0.952
NRS+REL and SVR
Gender 1.108 0.068 3.027 Age -0.042 0.137 0.958 Duration of infection -0.069 0.065 0.933
Gender: male/female, Age: years, Duration of infection: years. SVR: patients with undetectable viral RNA 24 weeks after the end of treatment; NRS: patients with detectable viral RNA on the 48th week of treatment; REL: patients with undetectable viral RNA on the 48th week of treatment, but who showed viral RNA in serum on the 12th or 24th week post-treatment.

87
Table 04. Distribution of allelic frequencies of polymorphisms in cytokines genes in patients of a Brazilian population with chronic hepatitis C, classified according to their response to treatment with pegIFN and ribavirin.
Polymorphism Alleles SVR (n=52) NRS (n= 59) REL (n= 25)
n (F%) n (F%) n (F%) IL1A-889 C 72 (72.0) 81 (72.3) 43
7 (86.0) (14.0) T 28 (28.0) 31 (27.7)
IL1B-511
C 68 (68.0) 73 (62.9) 26 24
(52.0) (48.0) T 32 (32.0) 43 (37.1)
IL1B+3962
C 77 (75.5) 94 (81.0) 42 8
(84.0) (16.0) T 25 (24.5) 22 (19.0)
IL1R1 pst1 1970
Ta 31 (29.8) 30 (25.9) 22 28
(44.0) (56.0) C 73 (70.2) 86 (74.1)
IL1RA mspa1 11100
T 75 (72.1) 88 (74.6) 39 11
(78.0) (22.0) C 29 (27.3) 30 (25.4)
IL4RA+1902 A 77 (74.0) 93 (78.8) 32 18
(64.0) (36.0) Gb 27 (26.0) 25 (21.2)
IL12B-1188 A 78 (78.0) 79 (69.3) 34 12
(73.9) (26.1) C 22 (22.0) 35 (30.7)
IFNG+874 A 53 (53.0) 62 (52.5) 28 22
(56.0) (44.0) T 47 (47.0) 56 (47.5)
TGFB1 cdn10 C 47 (46.1) 52 (44.1) 29 21
(58.0) (42.0) T 55 (53.9) 66 (55.9)
TGFB1 cdn25 C 8 (7.8) 5 (4.2) 4 46
(8.0) (92.0) G 94 (92.2) 113 (95.8)
TNFA-308 G 90 (88.2) 98 (84.5) 44 6
(88.0) (12.0) A 12 (11.8) 18 (15.5)
TNFA-238 G 99 (97.1) 109 (94.0) 46 4
(92.0) (8.0) A 3 (2.9) 7 (6.0)
IL2-330 G 29 (27.9) 35 (29.7) 16 30
(34.8) (65.2) T 75 (72.1) 83 (70.3)
IL2+166 G 69 (66.4) 75 (63.6) 33 13
(71.7) (28.3) T 35 (33.7) 43 (36.4)
IL4-1098 T 75 (73.5) 91 (81.3) 35 9
(79.6) (20.5) G 27 (26.5) 21 (18.7)
IL4-590 C 79 (77.5) 83 (74.1) 39 5
(88.6) (11.4) T 23 (22.5) 29 (25.9)
IL4-33 T 22 (21.6) 25 (22.3) 4 40
(9.1) (90.9) C 80 (78.4) 87 (77.7)
IL6-174 G 75 (73.5) 77 (66.4) 37 11
(77.1) (22.9) C 27 (26.5) 39 (33.6)
IL6nt565 G 77 (75.5) 80 (69.0) 37 11
(77.1) (22.9) A 25 (24.5) 36 (31.0)
IL10-1082 G 42 (41.2) 44 (37.9) 20 30
(40.0) (60.0) A 60 (58.8) 72 (62.1)
IL10-819 C 71 (69.6) 81 (69.8) 35 15
(70.0) (30.0) T 31 (30.4) 35 (30.2)
IL10-592 C 71 (69.6) 81 (69.8) 35 15
(70.0) (30.0) A 31 (30.4) 35 (30.2)
For technical reasons, some patients did not have all their SNPs typed. So N is variable depending on the SNP. P obtained through Chi-square test or Fisher’s test. n= number of occurrences o allele; F%= relative frequency of the alleles.

88
SVR: patients with undetectable viral RNA 24 weeks after the end of treatment; NRS: patients with detectable viral RNA on the 48th week of treatment; REL: patients with undetectable viral RNA on the 48th week of treatment, but who showed viral RNA in serum on the 12th or 24th week post-treatment. a NRS vs REL: 30 (25.9%) vs 22 (44.0%) P= 0.0208 OR= 2.2524 IC= 1.1229 – 4.5180 b NRS vs REL: 25 (21.2%) vs 18 (36.0%) P= 0.0441 OR= 2.0925 IC= 1.0115 – 4.3288

89
Table 05. Distribution of genotype frequencies of polymorphisms in cytokine genes in patients of a Brazilian population with chronic hepatitis C, classified according their response to treatment with pegIFN and ribavirin.
Polymorphism Genotypes SVR (n=52) NRS (n= 59) REL (n= 25)
n (F%) n (F%) n (F%) IL1A-889 C:C a 25 (50.0) 30 (53.6) 19
5 1
(76.0) (20.0) (4.0)
C:T b 22 (44.0) 21 (37.5) T:T 3 (6.0) 5 (8.9)
IL1B-511 C:C 23 (46.0) 25 (43.1) 6 14
5
(24.0) (56.0) (20.0)
C:T 22 (44.0) 23 (39.7) T:T 5 (10.0) 10 (17.2)
IL1B+3962 C:C 27 (52.9) 39 (67.2) 18 6 1
(72.0) (24.0) (4.0)
T:C c 23 (45.1) 16 (27.6) T:T 1 (2.0) 3 (5.2)
IL1R1 pst1 1970 T:T 5 (9.6) 4 (6.9) 2 18
5
(8.0) (72.0) (20.0)
C:T d 21 (40.4) 22 (37.9) C:C e 26 (50.0) 32 (55.2)
IL1RA mspa1 11100 T:T 27 (51.9) 33 (55.9) 15 9 1
(60.0) (36.0) (4.0)
T:C 21 (40.4) 22 (37.3) C:C 4 (7.7) 4 (6.8)
IL4RA+1902 A:A 33 (63.5) 37 (62.7) 12 8 5
(48.0) (32.0) (20.0)
G:A 11 (21.2) 19 (32.2) G:Gf 8 (15.4) 3 (5.1)
IL12B-1188 A:A 29 (58.0) 29 (50.9) 11 12
0
(47.8) (52.2) (0.0)
C:A 20 (40.0) 21 (36.8) C:C 1 (2.0) 7 (12.3)
IFNG+874 A:A 13 (26.0) 16 (27.1) 9 10
6
(36.0) (40.0) (24.0)
A:T 27 (54.0) 30 (50.9) T:T 10 (20.0) 13 (22.0)
TGFB1 cdn10 C:C 12 (23.5) 11 (18.6) 9 11
5
(36.0) (44.0) (20.0)
C:T 23 (45.1) 30 (50.9) T:T 16 (31.4) 18 (30.5)
TGFB1 cdn25 C:C 0 (0.0) 0 (0.0) 0 4
21
(0.0) (16.0) (84.0)
C:G 8 (15.7) 5 (8.5) G:G 43 (84.3) 54 (91.5)
TNFA-308 G:G 39 (76.5) 41 (70.7) 20 4 1
(80.0) (16.0) (4.0)
G:A 12 (23.5) 16 (27.6) A:A 0 (0.0) 1 (1.7)
TNFA-238 G:G 48 (94.1) 51 (87.9) 21 4 0
(84.0) (16.0) (0.0)
G:A 3 (5.9) 7 (12.1) A:A 0 (0.0) 0 (0.0)
IL2-330 G:G 4 (7.7) 7 (11.9) 2 12
9
(8.7) (52.2) (39.1)
G:T 21 (40.4) 21 (35.6) T:T 27 (51.9) 31 (52.5)
IL2+166 G:G 23 (44.2) 26 (44.1) 11 11
1
(47.8) (47.8) (4.4)
G:T 23 (44.2) 23 (39.0) T:T 6 (11.5) 10 (17.0)
IL4-1098 T:T 26 (50.1) 35 (62.5) 14 7 1
963.6) (31.8) (4.6)
T:G 23 (45.1) 21 (37.5) G:G 2 (4.8) 0 (0.0)
IL4-590 C:C 31 (60.8) 31 (55.4) 17 5 0
(77.3) (22.7) (0.0)
C:T 17 (33.3) 21 (37.5) T:T 3 (5.9) 4 (7.1)

90
IL4-33 T:T 3 (59.9) 2 (3.6) 0 4
18
(0.0) (18.2) (81.8)
T:C 16 (31.4) 21 (37.5) C:C 32 (62.7) 33 (58.9)
IL6-174 G:G 28 (54.9) 25 (43.1) 14 9 1
(58.3) (37.5) (4.2)
G:C 19 (37.3) 27 (46.6) C:C 4 (7.8) 6 (10.3)
IL6nt565 G:G 30 (58.8) 27 (46.6) 14 9 1
(58.3) (37.5) (4.2)
G:A 17 (33.3) 26 (44.8) A:A 4 (7.8) 5 (8.6)
IL10-1082 G:G 8 (15.7) 9 (15.5) 6 8
11
(24.0) (32.0) (44.0)
G:A 26 (51.0) 26 (44.8) A:A 17 (33.3) 23 (39.7)
IL10-819 C:C 22 (43.1) 31 (53.5) 11 13
1
(44.0) (52.0) (4.0)
C:T g 27 (52.9) 19 (32.8) T:T 2 (3.9) 8 (13.8)
IL10-592 C:C 22 (43.1) 31 (53.4) 11 13
1
(44.0) (52.0) (4.0)
C:A h 27 (52.9) 19 (32.8) A:A 2 (3.9) 8 (13.8)
For technical reasons, some patients did not have all their SNPs typed. So N is variable depending on the SNP. P obtained trough Chi-square test or Fisher’s test. n= number of occurrences of genotype; F%= genotype relative frequency. SVR: patients with undetectable viral RNA 24 weeks after the end of treatment; NRS: patients with detectable viral RNA on the 48th week of treatment; REL: patients with undetectable viral RNA on the 48th week of treatment, but who showed viral RNA in serum on the 12th or 24th week post-treatment. a REL vs SVR: 19 (76.0%) vs 25 (50.0%) P= 0.0310 OR= 0.3158 IC= 0.1081 – 0.9227 b REL vs SVR: 5 (20.0%) vs 22 (44.0%) P= 0.0461 OR= 3.1429 IC= 1.0174 – 9.7091 c NRS+REL vs SVR: 22 (26.5%) vs 23 (45.1%) P= 0.0268 OR= 2.2776 IC= 1.0909 – 4.755 d REL vs SVR: 18 (72.0%) vs 21 (40.4%) P= 0.0093 OR= 0.2634 IC= 0.0937 – 0.7408 d NRS vs REL: 22 (37.9%) vs 18 (72.0%) P= 0.0043 OR= 4.2078 IC= 1.515 – 11.6871 e REL vs SVR: 5 (20.0%) vs 26 (50.0%) P= 0.0140 OR= 4 IC= 1.3042 – 12.2677 e NRS vs REL: 32 (55.2%) vs 5 (20.0%) P= 0.0038 OR= 0.2031 IC= 0.0671 – 0.6153 f NRS vs REL: 3 (5.1%) vs 5 (20.0%) P= 0.0472 OR= 4.6667 IC= 1.0209 – 21.331 g NRS vs SVR: 19 (32.8%) vs 27 (52.9%) P= 0.0333 OR= 2.3092 IC= 1.0622 – 5.0202 h NRS vs SVR: 19 (32.8%) vs 27 (52.9%) P= 0.0333 OR= 2.3092 IC= 1.0622 – 5.0202

91
Table 06. Distribution of haplotypes frequencies of polymorphisms in cytokine genes in patients of a Brazilian population with chronic hepatitis C, classified according to their response with pegIFN and ribavirin.
Polymorphisms Haplotypes SVR (n=52) NRS (n= 59) REL (n= 25)
n (F%) n (F%) n (F%) TGFBβ1 (cdn10; cdn25) CG 39 (38.3) 47 (39.8) 25 (50.0)
TG 55 (53.9) 66 (55.9) 21 (42.0) CC 8 (7.8) 5 (4.3) 4 (8.00)
TNFA (-308; -238) GG 87 (85.3) 91 (78.5) 40 4 6
(80.0) (8.0) (12.0)
GA 3 (2.9) 7 (6.0) AG 12 (11.8) 18 (15.5)
IL2 (-330; +166) TG 40 (38.5) 40 (33.9) 17 16 13
(37.0) (34.8) (28.2)
GG 29 (27.9) 35 (29.7) TT 35 (33.7) 43 (36.4)
IL4 (-1098; -590; -33) GCC 26 (25.5) 19 (17.0) 9 30 4 1 0 0
(20.5) (68.2) (9.1) (2.2) (0.0) (0.0)
TCC 53 (52.0) 64 (57.1) TTT 21 (20.6) 25 (22.3) TTC 1 (1.0) 2 (1.8) GTT 1 (1.0) 0 (0.0) GTC 0 (0.0) 2 (1.8)
IL6 (-174; nt565) GG 75 (73.5) 77 (66.4) 37 11 0
(77.1) (22.9) (0.0)
CA 25 (24.5) 36 (31.0) CG 2 (2.0) 3 (2.6)
IL10 (-1082; -819; -592) ATA 31 (30.4) 35 (29.7) 15 15 20
(30.0) (30.0) (40.0)
ACC 29 (28.4) 38 (32.2) GCC 42 (41.2) 45 (38.1)
For technical reasons, some patients did not have all their SNPs typed. So N is variable depending on the SNP. P obtained through the Chi-square test or Fisher’s test. All comparisons showed no significant P at 0.05. n= number of occurrence of haplotypes; F%= relative frequency of haplotypes. SVR: patients with undetectable viral RNA 24 weeks after the end of treatment; NRS: patients with detectable viral RNA on the 48th week of treatment; REL: patients with undetectable viral RNA on the 48th week of treatment, but who showed viral RNA in serum on the 12th or 24th week post-treatment.

92
Table 07. Summary of al positive (susceptible) and negative (protective) polymorphisms in cytokine genes in patients of a Brazilian population with chronic hepatitis C, classified according to their response with pegIFN and ribavirin.
Polymorphisms Positive Association Negative Association
IL1R1 pst11970
T REL C:T REL C:C REL
IL1A-889 C:C REL C:T SVR
IL1B+3962 T:C SVR IL4RA+1902 G REL
G:G REL IL10-819 C:T SVR IL10-592 C:A SVR

93
Supplementary material Schematic representation of linkage disequilibrium between pairs of cytokine gene SNPs in patients of a Brazilian population with chronic hepatitis C. D’ for linkage disequilibrium between each marker is reported. Colors expressing the strength of the linkage disequilibrium: white indicates D’<1 and LOD<2, shades of pink/red indicates D’<1 and LOD≥2, blue indicates D’=1 and LOD<2, bright red indicates D’=1 and LOD≥2. The SNP designation in the kit for each dbSNP-ID can be checked in Table 01.

94
6. DISCUSSÃO
No presente trabalho foram identificadas variantes polimórficas em genes de
citocinas e em genes de receptores de citocinas e avaliadas suas possíveis associações
com o grau de dano hepático e com a resposta ao tratamento combinado com pegIFN-alfa e
ribavirina em pacientes brasileiros cronicamente infectados apenas pelo genótipo 1 do HCV.
As freqüências genotípicas para os SNPs analisados foram observadas conforme o
esperado para uma população em equilíbrio de Hardy-Weinberg, exceto para a posição
IL4RA+1902 (P= 0,0017), cujas variantes polimórficas mostraram-se de alguma forma
associadas tanto ao dano hepático quanto a resposta ao tratamento. A averiguação se as
freqüências genotípicas obtidas encontram-se dentro do esperado para uma população em
equilíbrio de Hardy-Weinber é tradicionalmente realizada em estudos caso-controle e mais
raramente aplicada em estudos control-free, por se tratar de uma amostra composta apenas
por pacientes, portanto naturalmente enviesada. Existe muita discussão sobre esse assunto;
Esser e Tomluk (2005) comentam que se o desvio do equilíbrio de Hardy-Weinberg ocorre
apenas no grupo de pacientes, isso provê uma evidência adicional da real existência de
possíveis associações com a doença observadas para o marcador em questão (ESSER e
TOMLUK, 2005). Por este motivo, muitos grupos de pesquisa (YEE et al., 2000; DAI et al.,
2006) optam por não verificar se a freqüências das variantes polimórficas com as quais
trabalham estão ou não conforme o esperado para uma população em equilíbrio de Hardy-
Weinberg.
Nossos resultados demonstram que variantes polimórficas que aumentam a
expressão de genes de citocinas pró-inflamatórias (TNFA-308, IL6-174, IL6nt565) e
variantes que aumentam a sinalização de receptores de citocinas antiinflamatórias
(IL4RA+1902) parecem interferir no grau de dano hepático em pacientes portadores de
hepatite C crônica infectados pelo genótipo 1 do HCV. Já as variantes polimórficas que
diminuem a expressão de genes de citocinas que polarizam a resposta imunológica para
Th2 (IL10-819, IL10-592) parecem influenciar a resposta ao tratamento combinado com
pegIFN-alfa e ribavirina. Há indícios também de que variantes que aumentam a sinalização
de receptores de citocinas antiinflamatórias (IL4RA+1902), assim como variantes de genes
da família IL-1 (IL1A-889, IL1B+3962, IL1R1 pst1 1970) também influenciam a resposta ao
tratamento. Para a grande maioria das associações observadas, a explicação biológica mais
plausível é a relação entre as variantes e o nível de produção de citocinas.
Alguns estudos de associação descrevem a aplicação da correção de Bonferroni
para ajustar testes múltiplos (CONSTANTINI et al., 2002), sendo ela recomendada para
evitar a rejeição errônea da hipótese nula. No entanto, a redução do erro tipo I aumenta o
erro tipo II, pois o mesmo não pode ser controlado. Portanto, peritos em estatística tem

95
abordado esta questão e a maioria concorda que a correção de Bonferroni é muito
conservadora para estudos de associação com doença (ROTHMAN, 1990; SAVITZ e
OLSHAN, 1995; PERNEGER, 1998). A base teórica para defender um ajuste para
comparações múltiplas é a hipótese de que o acaso seria a primeira explicação para os
fenômenos observados. Entretanto, essa hipótese compromete as premissas básicas da
pesquisa empírica, a qual sustenta que a natureza segue leis regulares que podem ser
estudadas através de observações. A opção por não realizar ajustes é preferível, pois levará
a menos erros de interpretação, uma vez que os dados avaliados não são números
aleatórios, mas observações atuais sobre a natureza. Além disso, os cientistas não devem
ser tão relutantes em explorar pistas que podem revelar-se erradas, do que penalizar-se
pela falta de resultados possivelmente importantes (ROTHMAN, 1990). Portanto, devido ao
caráter exploratório do presente estudo, optamos por não aplicá-la em nossos dados. Uma
abordagem alternativa para a correção de Bonferroni seria a replicação de resultados em
uma coorte independente. Alguns de nossos dados confirmaram os resultados de estudos
prévios, realizados em outras populações, enquanto outros foram inéditos e necessitam
replicação para confirmação. Vale salientar, entretanto, que utilizamos um número maior de
pacientes em comparação com alguns outros estudos e que nossa amostra foi composta de
modo homogêneo para diversos fatores já citados.
O Cytokine Genotyping kit (Dynal Biotech, Invitrogen® Corporation, Brown Deer, WI,
USA), utilizado para a determinação das tipagens das variantes polimórficas no presente
estudo, foi desenvolvido pela Universidade de Heidelberg para o 13º Workshop Internacional
de Histocompatibilidade (Seattle, USA, 2002) e é utilizado por alguns grupos de pesquisa
(KLEINRATH et al., 2007; ATANASOVSKA-STOJANOVSKA et al., 2012). Previamente ao
inicio do uso do kit para o desenvolvimento do presente trabalho, foi realizada uma
validação do mesmo, comparando as tipagens para as posições TNFA-308G>A,
TGFB1+869T>C, TGFB1+915C>G, IL10-1082A>G, IL10-819T>C, IL10-592A>C, IL6-
174G>C e IFNG+874T>A com as obtidas pelo uso do Cytokine Genotyping Tray (One-
Lambda, Inc, Canoga Park, CA), um outro kit mais antigo que o da Invitrogen, bastante
aceito pelo meio científico e já utilizado por nosso grupo de pesquisa. As tipagens foram
realizadas com ambos os kit em cinco amostras de DNA de diferentes individuos e
mostraram-se 100% idênticas.

96
7. CONCLUSÕES
O grau de dano hepático em pacientes portadores de hepatite C crônica infectados
pelo genótipo 1 do HCV parece estar sob a influência de variantes polimórficas que
aumentam a expressão de genes de citocinas pró-inflamatórias (TNFA-308, IL6-174,
IL6nt565) e sob a influência de variantes que aumentam a sinalização de receptores de
citocinas antiinflamatórias (IL4RA+1902). O conhecimento destes marcadores apresenta
uma significância prognóstica em pacientes cronicamente infectados pelo HCV, permitindo
dirigir a terapia de forma mais agressiva para aqueles com aumento do risco de progressão
da doença.
A resposta ao tratamento combinado com pegIFN-alfa e ribavirina também parece
estar sob a influência de variantes polimórficas que diminuem a expressão de genes de
citocinas que polarizam a resposta imunológica para Th2, resultando assim na eliminação
viral decorrente de uma resposta Th1 (IL10-819, IL10-592). Há indícios também de que
variantes que aumentam a sinalização de receptores de citocinas antiinflamatórias
(IL4RA+1902), assim como variantes de genes da família IL-1 (IL1A-889, IL1B+3962, IL1R1
pst1 1970) também influenciam a resposta ao tratamento. Os resultados contribuirão para o
estabelecimento de novos marcadores genéticos de resposta ao tratamento além do IL28B
rs12979860, o único SNP cuja genotipagem é aceita até o presente momento como
preditora de resposta ao tratamento. A determinação de novos marcadores de resposta ao
tratamento ajudará a orientar as decisões terapêuticas em pacientes com hepatite crônica C
infectados com o genótipo 1 do HCV. Considerando os efeitos colaterais e o custo do
tratamento, a previsão da resposta ao tratamento previamente ao inicio da terapia é
importante.

97
APÊNDICE: DETALHAMENTO DA METODOLOGIA
CASUÍSTICA – Ver páginas 46, 47, 71 e 72
BIÓPSIA HEPÁTICA – Ver página 47 PROTOCOLO DE TRATAMENTO – Ver página 72 GENOTIPAGEM VIRAL – Ver páginas 47 e 72
COLETA DAS AMOSTRAS DE SANGUE
Foram coletadas amostras de sangue de indivíduos diagnosticados com hepatite C.
Após esclarecimentos sobre o projeto, assinatura do termo de consentimento livre e
esclarecido e preenchimento de uma ficha cadastral, foi coletada uma amostra de 10 mL de
sangue por punção da veia mediana, em tubos estéreis contendo EDTA, utilizando agulhas
e seringas descartáveis. O sangue total foi congelado em tubos de criopreservação até o
momento da extração do DNA.
EXTRAÇÃO DO DNA GENÔMICO
Após o descongelamento das amostras de sangue total, o DNA foi extraído através
da técnica Salting-out (LAHIRI e NURNBERGER, 1991) ou através da utilização do kit
comercial BioPur (Biometrix Diagnóstica, Curitiba, Pr, Brasil). Em ambas as técnicas os
reagentes lisam as células nucleadas e a carioteca, removem enzimas, precipitam
proteínas, lavam o DNA e ao final, reidratam-no, conforme protocolo descrito abaixo.
Algumas amostras que apresentaram resíduos de hemoglobina ao final do processo de
extração foram purificadas através do uso do kit comercial PurelinkTM Genomic DNA
purification (Invitrogen®, Carlsbad, CA, USA), conforme protocolo descrito abaixo.
A concentração do DNA foi determinada utilizando o Fluorômetro QubitTM
(Invitrogen®, Carlsbad, CA, USA) ou através da visualização da intensidade das bandas
após eletroforese em gel de agarose, tendo um controle como padrão de comparação.
PROTOCOLO DE EXTRAÇÃO DE DNA PELA TÉCNICA SALTING-OUT
1. Identificar tubos de 1,5mL
2. Transferir 500L de sangue total
3. Acrescentar 800L de RCLB (red blood cell lysis - composta por sacarose, triton X, MgCl2
6H2O 1M, Tris pH 7,5 1M e água ultrapura) (1x) gelado

98
Vórtex
Centrifugar a 13000 rpm por 2 minutos a 20oC
Desprezar o sobrenadante
4. Acrescentar 1mL de RCLB (1x) gelado
Vórtex
Centrifugar a 13000 rpm por 2 minutos a 20oC
Desprezar o sobrenadante
5. Repetir o passo 4 até obter-se um pelet limpo
6. Desprezar o sobrenadante
Adicionar 80L de tampão de proteinase K® (Invitrogen, Carlsbad, CA, USA) +
40L de proteinase K (ou 40L do preparado)
20L de SDS® (sulfato dodecil de sódio, Sigma Chemical CO, Steinheim,
Germany) (20%) temperatura ambiente
240L de água de injeção
7. Vórtex
Incubar em banho-maria a 55oC por 20mim
Agitar manualmente
Incubar em banho-maria a 55oC por 20mim
8. Deixar atingir a temperatura ambiente antes de prosseguir
9. Adicionar 100L de NaCl (6M) temperatura ambiente
10. Vórtex
11. Centrifugar a 13000 rpm por 5 minutos a 20oC
12. Transferir o SOBRENADANTE para um novo tubo de 1,5mL com 100mL de NaCl (6M)
13. Centrifugar a 13000 rpm por 5 minutos a 20oC
14. Transferir o SOBRENADANTE para um novo tubo de 1,5mL
15. Acrescentar 800L de ETHO absoluto gelado
16. Inverter gentilmente os tubos várias vezes para precipitar o DNA
17. Centrifugar a 13000 rpm por 2 minutos a 20oC
18. Desprezar o sobrenadante
19. Adicionar 1mL de Etanol 70%
20. Centrifugar a 13000 rpm por 2 minutos a 20oC
21. Desprezar o sobrenadante
22. Deixar secar a temperatura ambiente
23. Ressuspender o DNA em 50L de água de injeção
24. Deixar em geladeira por ao menos 24hs para reidratar o DNA
25. Deixar em banho-maria a 37º por 30 min para dissolver bem

99
26. Homogeneizar
27. Verificar a Densidade Ótica
28. Armazenar a -20oC
PROTOCOLO DE EXTRAÇÃO DE DNA – KIT COMERCIAL BioPur
1. Identificar tubos de 1,5mL (não fornecido)
2. Transferir 200L de sangue total
3. Caso a amostra seja velha ou esteja coagulada - Acrescentar 1000L de RCLB (1x)
gelado
Vórtex
Centrifugar a 9000 rpm por 3 minutos a 20oC
Desprezar o sobrenadante
Completar com 200L de PBS
4. 200L de tampão A de lise + 20L de proteinase K
Vórtex 5 segundos
5. Incubar os tubos por 15 minutos a 56oC em um termomixer (ou agitar as amostras em
vórtex a cada 3 minutos)
6. 400L de tampão B6 de ligação
Vórtex
7. Coloque um tubo spin em um tubo de ração 2mL
8. Transfira a mistura para o tubo spin
9. Feche e incube por 1 minuto
Centrifugue por 2 minutos a 13000g
Descarte o filtrado
10. Coloque o tubo spin em um novo tubo de ração 2mL
11. Adicione 500L de tampão I de lavagem
Centrifugue por 1 minuto a 13000g
Descarte o filtrado
12. Adicione 800L de tampão II de lavagem
Centrifugue por 1 minuto a 13000g
Descarte o filtrado
13. Recoloque o tubo spin no mesmo tubo de reação 2mL
Centrifugue por 4 minutos na velocidade máxima para eliminar o etanol
14. Coloque o tubo spin em um novo tubo de ração 1,5mL
15. Adicione 120L de tampão de eluição pré-aquecido a 56oC

100
Incubar a temperatura ambiente por 1 minuto
Centrifugar por 1 minuto a 8000g
Descartar o tubo spin
16. Verificar a concentração do DNA
17. Armazenar a amostra a -20ºC.
GENOTIPAGEM DAS VARIANTES POLIMÓRFICAS EM GENES DE CITOCINAS As tipagens das variantes polimórficas em genes de citocinas foram realizadas pela
técnica PCR-SSP (“polymerase chain reaction-sequence specific primers”), usando o
Cytokine Genotyping kit (Dynal Biotech, Invitrogen® Corporation, Brown Deer, WI, USA).
Cada amostra de DNA, ajustada em 25 a 200 g/L, foi adicionada a uma solução de
amplificação fornecida pelo kit, juntamente com a enzima Taq DNA polimerase (5u/L;
Invitrogen®, Carlsbad, CA, USA) e água de injeção, de acordo com os volumes
recomendados pelo protocolo abaixo. Após a homogeneização desta solução, alíquotas
foram dispensadas em placas de 96 poços, contendo os iniciadores específicos para os
alelos de citocinas (anexo III). As placas foram transferidas para o termociclador (Pelkin-
Elmer® 9600 ou GeneAmp® PCR System 9700), para a amplificação, conforme
recomendações do fabricante.
Os fragmentos amplificados foram separados por eletroforese, em cuba micro SSP gel
System (MGS-B, One Lambda, CA, USA), em gel de agarose a 2,5%, a 150 volts por 8
minutos. A visualização das bandas de DNA, quando expostas à luz ultravioleta, pode ser
realizada devido à adição do corante SYBR Green ao gel de agarose antes da
solidificação. A interpretação dos resultados foi baseada na presença ou ausência do
fragmento específico de DNA amplificado, conforme as fichas-padrão fornecidas pelo
fabricante do Cytokine Genotyping kit (Dynal Biotech, Invitrogen® Corporation, Brown Deer,
WI, USA). Para verificar a integridade da reação de PCR, foi utilizado um par de iniciadores
como controle interno. Todas as reações foram fotodocumentadas (Transiluminador e
fotodocumentador L-PIX Loccus biotecnologia). As fotodocumentações foram salvas em
arquivos digitais e impressas, sendo nesse último caso, afixadas à ficha-padrão de cada
paciente.
PROTOCOLO DE AMPLIFICAÇÃO PELA TÉCNICA PCR-SSP
Cytokine Genotyping kit (Invitrogen®)
1) Adicionar ao mix (140 μl-fornecido pelo kit):
329 μl de água

101
3,3 μl de Taq Polymerase
Vortex
50 μl de DNA (75 a 125 ng/μl)
Vortex
Volume final = 379 μl
2) Dispensar 10 μl da mistura em cada poço da placa (fornecida pelo kit)
3) Tapar
4) Levar imediatamente ao termociclador para amplificar conforme o programa descrito no
Quadro 1
5) Submeter a eletroforese.
Quadro 1 – Programa para termociclador para amplificação pelo Cytokine Genotyping kit
(Invitrogen®)
FONTE: Manual de instruções do Cytokine
Genotyping kit (Invitrogen®)
ANÁLISES ESTATÍSTICAS Freqüências alélicas, genotípicas e haplotípicas
As freqüências alélicas e genotípicas foram obtidas por contagem direta através das
fórmulas:
Fal = n/2N Fgen = nx100/N
Onde:
Fal: freqüência alélica
Fgen: freqüência genotípica
n: freqüência absoluta de um alelo na amostra
N: número de indivíduos na amostra.
Ciclos Tempo Temperatura
1 ciclo 2 min 94ºC
10 ciclos 15 seg 94ºC
60 seg 65ºC
20 ciclos 15 seg 94ºC
50 seg 61ºC
30 seg 72ºC
Manutenção indeterminado 4ºC
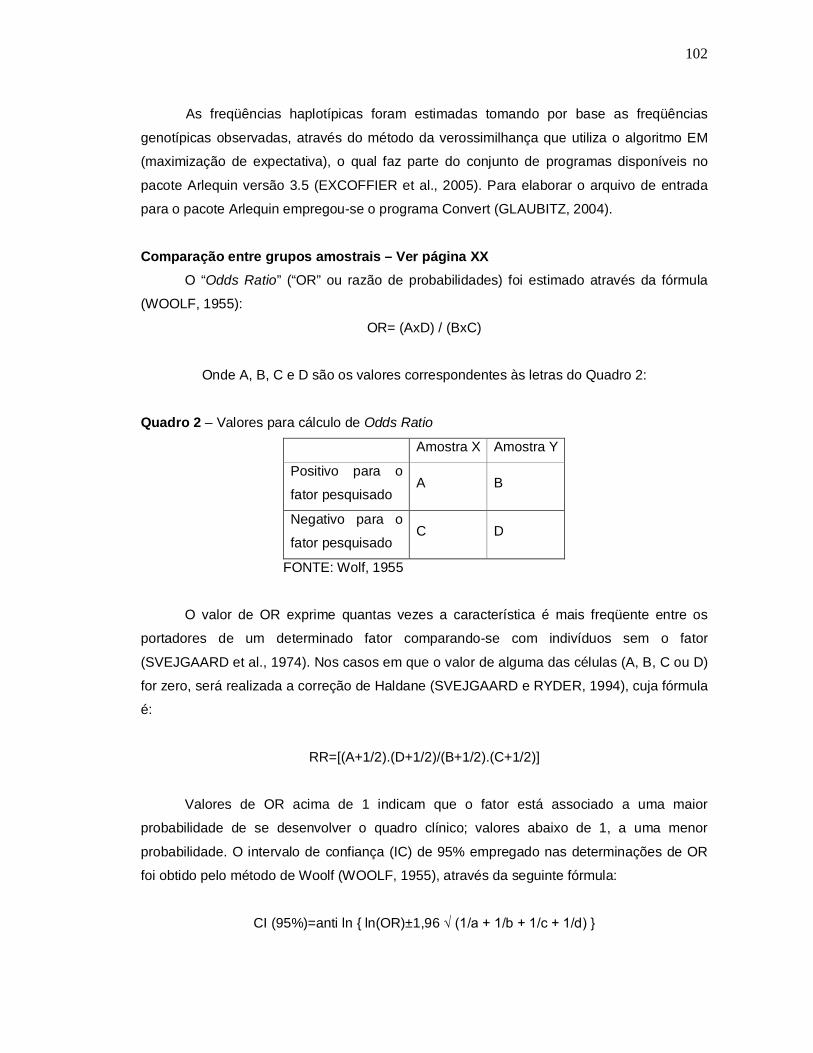
102
As freqüências haplotípicas foram estimadas tomando por base as freqüências
genotípicas observadas, através do método da verossimilhança que utiliza o algoritmo EM
(maximização de expectativa), o qual faz parte do conjunto de programas disponíveis no
pacote Arlequin versão 3.5 (EXCOFFIER et al., 2005). Para elaborar o arquivo de entrada
para o pacote Arlequin empregou-se o programa Convert (GLAUBITZ, 2004).
Comparação entre grupos amostrais – Ver página XX O “Odds Ratio” (“OR” ou razão de probabilidades) foi estimado através da fórmula
(WOOLF, 1955):
OR= (AxD) / (BxC)
Onde A, B, C e D são os valores correspondentes às letras do Quadro 2:
Quadro 2 – Valores para cálculo de Odds Ratio
Amostra X Amostra Y
Positivo para o
fator pesquisado A B
Negativo para o
fator pesquisado C D
FONTE: Wolf, 1955
O valor de OR exprime quantas vezes a característica é mais freqüente entre os
portadores de um determinado fator comparando-se com indivíduos sem o fator
(SVEJGAARD et al., 1974). Nos casos em que o valor de alguma das células (A, B, C ou D)
for zero, será realizada a correção de Haldane (SVEJGAARD e RYDER, 1994), cuja fórmula
é:
RR=[(A+1/2).(D+1/2)/(B+1/2).(C+1/2)]
Valores de OR acima de 1 indicam que o fator está associado a uma maior
probabilidade de se desenvolver o quadro clínico; valores abaixo de 1, a uma menor
probabilidade. O intervalo de confiança (IC) de 95% empregado nas determinações de OR
foi obtido pelo método de Woolf (WOOLF, 1955), através da seguinte fórmula:
CI (95%)=anti ln { ln(OR)±1,96 √ (1/a + 1/b + 1/c + 1/d) }

103
Análise do desequilíbrio de ligação entre os SNPs estudados
A partir das freqüências obtidas, foram estimados os valores de desequilíbrio de
ligação para os locos estudados. A verificação da ocorrência não aleatória de certas
combinações alélicas foi realizada como proposto por Lewontin (LEWONTIN, 1964), pela
fórmula:
Δab
= pab
– pap
b
Onde:
• Δab
: valor do desequilíbrio de ligação
• pab
: freqüência observada de um haplótipo
• pa: freqüência observada do alelo (a) de um dado locus
• pb: freqüência observada do alelo (b) de um outro locus
• pap
b: freqüência esperada de um haplótipo (ab)
No entanto, um valor relativo do desequilíbrio de ligação (Δ’ab
) é mais informativo do
que o obtido pela fórmula descrita acima, pois o Δ’ab
traz informação a respeito da magnitude
do desequilíbrio de ligação em relação ao maior valor que ele poderia assumir, dadas as
freqüências dos alelos em questão (LEWONTIN, 1964). Este valor relativo foi calculado pelo
programa ARLEQUIN versão 3.5 (EXCOFFIER et al., 2005) através da fórmula:
Δ’ab
= Δab
/ Δab, máx
onde o valor de Δab, máx
pode ter um dos dois valores:
• o maior de (pap
b , (1 – p
a)(1 – p
b)), se Δ
ab < 0
ou
• o menor de ((1 – pa)p
b , p
a (1 – p
b)), se Δ
ab ≥ 0
O Δ’ab
pode assim assumir valores no intervalo de -1,0 a +1,0, sendo que os valores
negativos indicam repulsão entre os alelos em questão e os positivos indicam acoplamento.
O valor zero indica ausência de desequilíbrio de ligação, ou a situação denominada por
alguns autores como “equilíbrio de ligação”. O grau de significância do desequilíbrio de
ligação foi avaliado através do teste exato de Fisher, em tabelas de contingência 2x2.

104
O desequilíbrio também pode levar à correlação entre dois SNPs, que é estimada por
r. O valor de r2, que também foi calculado pelo programa Arlequin versão 3.5 (EXCOFFIER
et al., 2005), é correlato ao valor de D e é calculado da seguinte maneira:
r2= D2/[pa (1-pa) pb (1-pb)]
Assim, o valor de χ2 também pode ser calculado por: χ2 = 2nr2 de maneira que o
resultado final é aplicado tanto ao valor de D como de r2.

105
REFERÊNCIAS
ACCAPEZZATO, D. et al. Chloroquine enhances human CD8+ T cell responses against soluble antigens in vivo. J Exp Med, v. 202, n. 6, p. 817-28, 2005. AGGARWAL, B. B. et al. Human tumor necrosis factor. Production, purification, and characterization. J Biol Chem, v. 260, n. 4, p. 2345-54, 1985. AREND, W. P. Interleukin-1 receptor antagonist. Adv Immunol, v. 54, p. 167-227, 1993. ASSELAH, T. Genetic polymorphism and response to treatment in chronic hepatitis C: the future of personalized medicine. J Hepatol, v. 52, n. 3, p. 452-4, 2010. ATANASOVSKA-STOJANOVSKA, A. et al. IL10 -1082, IL10 -819 and IL10 -592 polymorphisms are associated with chronic periodontitis in a Macedonian population. Hum Immunol, v. 73, n. 7, p. 753-8, 2012. AUFFERMANN-GRETZINGER, S.; KEEFFE, E. B.; LEVY, S. Impaired dendritic cell maturation in patients with chronic, but not resolved, hepatitis C virus infection. Blood, v. 97, n. 10, p. 3171-6, 2001. BARTH, H. et al. Uptake and presentation of hepatitis C virus-like particles by human dendritic cells. Blood, v. 105, n. 9, p. 3605-14, 2005. BATALLER, R.; BRENNER, D. A. Liver fibrosis. J Clin Invest, v. 115, n. 2, p. 209-18, 2005. BEDOSSA, P.; POYNARD, T. An algorithm for the grading of activity in chronic hepatitis C. The METAVIR Cooperative Study Group. Hepatology, v. 24, n. 2, p. 289-93, 1996. BERGHOLDT, R. et al. Genetic and functional evaluation of an interleukin-12 polymorphism (IDDM18) in families with type 1 diabetes. J Med Genet, v. 41, n. 4, p. e39, 2004. BIALEK, S. R.; TERRAULT, N. A. The changing epidemiology and natural history of hepatitis C virus infection. Clin Liver Dis, v. 10, n. 4, p. 697-715, 2006. BIGGER, C. B.; BRASKY, K. M.; LANFORD, R. E. DNA microarray analysis of chimpanzee liver during acute resolving hepatitis C virus infection. J Virol, v. 75, n. 15, p. 7059-66, 2001. BILLIAU, A.; MATTHYS, P. Interferon-gamma: a historical perspective. Cytokine Growth Factor Rev, v. 20, n. 2, p. 97-113, 2009. BLACKARD, J. T. et al. Acute hepatitis C virus infection: a chronic problem. Hepatology, v. 47, n. 1, p. 321-31, 2008. BLANCHETTE, F. et al. TGFbeta1 regulates gene expression of its own converting enzyme furin. J Clin Invest, v. 99, n. 8, p. 1974-83, 1997. BODE, J. G.; BRENNDORFER, E. D.; HAUSSINGER, D. Subversion of innate host antiviral strategies by the hepatitis C virus. Arch Biochem Biophys, v. 462, n. 2, p. 254-65, 2007. BRASIL. Boletim Epidemiológico Hepatites Virais 2011. DEPARTAMENTO DE AIDS, D. E. H. V., SECRETARIA DE VIGILÂNCIA EM SAÚDE: Ministério da Saúde 2011a.

106
______. Protocolo clínico e diretrizes terapêuticas para hepatite viral c e coinfecções DEPARTAMENTO DE DST, A. E. H. V., SECRETARIA DE VIGILÂNCIA EM SAÚDE: Ministério da Saúde 2011b. BRENNER, A. V. et al. Single-nucleotide polymorphisms in selected cytokine genes and risk of adult glioma. Carcinogenesis, v. 28, n. 12, p. 2543-7, 2007. BROEN, J. C. et al. Polymorphisms in the interleukin 4, interleukin 13, and corresponding receptor genes are not associated with systemic sclerosis and do not influence gene expression. J Rheumatol, v. 39, n. 1, p. 112-8, 2012. BROWN, K. D. et al. A family of small inducible proteins secreted by leukocytes are members of a new superfamily that includes leukocyte and fibroblast-derived inflammatory agents, growth factors, and indicators of various activation processes. J Immunol, v. 142, n. 2, p. 679-87, 1989. BRUNDA, M. J. Interleukin-12. J Leukoc Biol, v. 55, n. 2, p. 280-8, 1994. BUKH, J.; MILLER, R. H.; PURCELL, R. H. Genetic heterogeneity of hepatitis C virus: quasispecies and genotypes. Semin Liver Dis, v. 15, n. 1, p. 41-63, 1995. CAGGANA, M. et al. Population-based studies reveal differences in the allelic frequencies of two functionally significant human interleukin-4 receptor polymorphisms in several ethnic groups. Genet Med, v. 1, n. 6, p. 267-71, 1999. CAI, D. et al. Local and systemic insulin resistance resulting from hepatic activation of IKK-beta and NF-kappaB. Nat Med, v. 11, n. 2, p. 183-90, 2005. CAMBIEN, F. et al. Polymorphisms of the transforming growth factor-beta 1 gene in relation to myocardial infarction and blood pressure. The Etude Cas-Temoin de l'Infarctus du Myocarde (ECTIM) Study. Hypertension, v. 28, n. 5, p. 881-7, 1996. CDC. Guidelines for Viral Hepatitis Surveillance and Case Management. Morbidity and Mortality Weekly Report. Recommendations and Reports. 2002. Disponível em: < www.cdc.gov/Ncidod/diseases/hepatitis/resource/surveillance.htm >. Acesso em: 03 fev 2008. CHANDER, G. et al. Treatment of chronic hepatitis C: a systematic review. Hepatology, v. 36, n. 5 Suppl 1, p. S135-44, 2002. CHEN, M. et al. Limited humoral immunity in hepatitis C virus infection. Gastroenterology, v. 116, n. 1, p. 135-43, 1999. CHERWINSKI, H. M. et al. Two types of mouse helper T cell clone. III. Further differences in lymphokine synthesis between Th1 and Th2 clones revealed by RNA hybridization, functionally monospecific bioassays, and monoclonal antibodies. J Exp Med, v. 166, n. 5, p. 1229-44, 1987. CHEVALIEZ, S.; PAWLOTSKY, J. M. HCV Genome and Life Cycle. 2006. CHOMARAT, P.; BANCHEREAU, J. An update on interleukin-4 and its receptor. Eur Cytokine Netw, v. 8, n. 4, p. 333-44, 1997. CHOO, Q. L. et al. Isolation of a cDNA clone derived from a blood-borne non-A, non-B viral hepatitis genome. Science, v. 244, n. 4902, p. 359-62, 1989.

107
CLAUDINO, M. et al. The broad effects of the functional IL-10 promoter-592 polymorphism: modulation of IL-10, TIMP-3, and OPG expression and their association with periodontal disease outcome. J Leukoc Biol, v. 84, n. 6, p. 1565-73, 2008. COFFMAN, R. L. et al. The role of helper T cell products in mouse B cell differentiation and isotype regulation. Immunol Rev, v. 102, p. 5-28, 1988. CONSTANTINI, P. K. et al. Interleukin-1, interleukin-10 and tumour necrosis factor-alpha gene polymorphisms in hepatitis C virus infection: an investigation of the relationships with spontaneous viral clearance and response to alpha-interferon therapy. Liver, v. 22, n. 5, p. 404-12, 2002. CORADO, J. et al. Impairment of natural killer (NK) cytotoxic activity in hepatitis C virus (HCV) infection. Clin Exp Immunol, v. 109, n. 3, p. 451-7, 1997. DAI, C. Y. et al. Associations of tumour necrosis factor alpha promoter polymorphisms at position -308 and -238 with clinical characteristics of chronic hepatitis C. J Viral Hepat, v. 13, n. 11, p. 770-4, 2006. DEIGNAN, T. et al. Decrease in hepatic CD56(+) T cells and V alpha 24(+) natural killer T cells in chronic hepatitis C viral infection. J Hepatol, v. 37, n. 1, p. 101-8, 2002. DI GIOVINE, F. S. et al. Single base polymorphism at -511 in the human interleukin-1 beta gene (IL1 beta). Hum Mol Genet, v. 1, n. 6, p. 450, 1992. DINARELLO, C. A. Interleukin-1 and interleukin-1 antagonism. Blood, v. 77, n. 8, p. 1627-52, 1991. ______. Interleukin-1. Cytokine Growth Factor Rev, v. 8, n. 4, p. 253-65, 1997. ______. Interleukin-1 in the pathogenesis and treatment of inflammatory diseases. Blood, v. 117, n. 14, p. 3720-32, 2011. DIXON, A. L. et al. A genome-wide association study of global gene expression. Nat Genet, v. 39, n. 10, p. 1202-7, 2007. DOMINICI, R. et al. Cloning and functional analysis of the allelic polymorphism in the transcription regulatory region of interleukin-1 alpha. Immunogenetics, v. 54, n. 2, p. 82-6, 2002. DUARTE, E. A. et al. RNA virus quasispecies: significance for viral disease and epidemiology. Infect Agents Dis, v. 3, n. 4, p. 201-14, 1994. DUSTIN, L. B.; RICE, C. M. Flying under the radar: the immunobiology of hepatitis C. Annu Rev Immunol, v. 25, p. 71-99, 2007. EASL. EASL International Consensus Conference on hepatitis C. Paris, 26-27 February 1999. Consensus statement. J Hepatol, v. 31 Suppl 1, p. 3-8, 1999. EL-OMAR, E. M. et al. Interleukin-1 polymorphisms associated with increased risk of gastric cancer. Nature, v. 404, n. 6776, p. 398-402, 2000.

108
ENDLER, G. et al. The interleukin-6 G(-174)C promoter polymorphism does not determine plasma interleukin-6 concentrations in experimental endotoxemia in humans. Clin Chem, v. 50, n. 1, p. 195-200, 2004. ESKDALE, J. et al. Mapping of the human IL10 gene and further characterization of the 5' flanking sequence. Immunogenetics, v. 46, n. 2, p. 120-8, 1997. ESSER, C.; TOMLUK, J. Reporting Hardy-Weinberg tests in case-control studies: reasons for caution but not for panic reactions. J Invest Dermatol, v. 124, n. 5, p. 1082-3, 2005. EXCOFFIER, L.; LAVAL, G.; SCHNEIDER, S. Arlequin (version 3.0): an integrated software package for population genetics data analysis. Evol Bioinform Online, v. 1, p. 47-50, 2005. FALLETI, E. et al. Genetic polymorphisms of interleukin-6 modulate fibrosis progression in mild chronic hepatitis C. Hum Immunol, v. 71, n. 10, p. 999-1004, 2010. FANG, S. H. et al. Ribavirin enhancement of hepatitis C virus core antigen-specific type 1 T helper cell response correlates with the increased IL-12 level. J Hepatol, v. 33, n. 5, p. 791-8, 2000. FARCI, P.; PURCELL, R. H. Clinical significance of hepatitis C virus genotypes and quasispecies. Semin Liver Dis, v. 20, n. 1, p. 103-26, 2000. FELDMANN, G. et al. Induction of interleukin-6 by hepatitis C virus core protein in hepatitis C-associated mixed cryoglobulinemia and B-cell non-Hodgkin's lymphoma. Clin Cancer Res, v. 12, n. 15, p. 4491-8, 2006. FERREIRA, C. T.; SILVEIRA, T. R. Hepatites virais: aspectos da epidemiologia e prevenção. Revista brasileira de Epidemiologia, n. 7, p. 473-87, 2004. FISHMAN, D. et al. The effect of novel polymorphisms in the interleukin-6 (IL-6) gene on IL-6 transcription and plasma IL-6 levels, and an association with systemic-onset juvenile chronic arthritis. J Clin Invest, v. 102, n. 7, p. 1369-76, 1998. FISHMAN, S. L.; BRANCH, A. D. The quasispecies nature and biological implications of the hepatitis C virus. Infect Genet Evol, v. 9, n. 6, p. 1158-67, 2009. FREITAS, S. Z. et al. Prevalence, genotypes and risk factors associated with hepatitis C virus infection in hemodialysis patients in Campo Grande, MS, Brazil. Mem Inst Oswaldo Cruz, v. 103, n. 4, p. 405-8, 2008. FRIED, M. W. et al. Peginterferon alfa-2a plus ribavirin for chronic hepatitis C virus infection. N Engl J Med, v. 347, n. 13, p. 975-82, 2002. FUJITA, T. et al. Structure of the human interleukin 2 gene. Proc Natl Acad Sci U S A, v. 80, n. 24, p. 7437-41, 1983. FULLER, M. J. et al. Cutting edge: emergence of CD127high functionally competent memory T cells is compromised by high viral loads and inadequate T cell help. J Immunol, v. 174, n. 10, p. 5926-30, 2005. GALE, M., JR.; FOY, E. M. Evasion of intracellular host defence by hepatitis C virus. Nature, v. 436, n. 7053, p. 939-45, 2005.

109
GATELY, M. K. et al. The interleukin-12/interleukin-12-receptor system: role in normal and pathologic immune responses. Annu Rev Immunol, v. 16, p. 495-521, 1998. GE, D. et al. Genetic variation in IL28B predicts hepatitis C treatment-induced viral clearance. Nature, v. 461, n. 7262, p. 399-401, 2009. GERLACH, J. T. et al. Recurrence of hepatitis C virus after loss of virus-specific CD4(+) T-cell response in acute hepatitis C. Gastroenterology, v. 117, n. 4, p. 933-41, 1999. GHANY, M. G. et al. Diagnosis, management, and treatment of hepatitis C: an update. Hepatology, v. 49, n. 4, p. 1335-74, 2009. GLAUBITZ, J. C. CONVERT: a user friendly program to reformat diploid genotypic data for commonly used population genetic software packages. Molecular Ecology Notes, n. 4, p. 309-310, 2004. GONZALEZ, A. et al. Efficacy of screening donors for antibodies to the hepatitis C virus to prevent transfusion-associated hepatitis: final report of a prospective trial. Hepatology, v. 22, n. 2, p. 439-45, 1995. GORE, E. A. et al. Interleukin-1beta+3953 allele 2: association with disease status in adult periodontitis. J Clin Periodontol, v. 25, n. 10, p. 781-5, 1998. GOTTO, J.; DUSHEIKO, G. M. Hepatitis C and treatment with pegylated interferon and ribavirin. Int J Biochem Cell Biol, v. 36, n. 10, p. 1874-7, 2004. GRAY, P. W.; GOEDDEL, D. V. Structure of the human immune interferon gene. Nature, v. 298, n. 5877, p. 859-63, 1982. GRIGGS, N. D. et al. The N-terminus and C-terminus of IFN-gamma are binding domains for cloned soluble IFN-gamma receptor. J Immunol, v. 149, n. 2, p. 517-20, 1992. GRUNGREIFF, K.; REINHOLD, D.; ANSORGE, S. Serum concentrations of sIL-2R, IL-6, TGF-beta1, neopterin, and zinc in chronic hepatitis C patients treated with interferon-alpha. Cytokine, v. 11, n. 12, p. 1076-80, 1999. GUIDOTTI, L. G.; CHISARI, F. V. Noncytolytic control of viral infections by the innate and adaptive immune response. Annu Rev Immunol, v. 19, p. 65-91, 2001. GUO, W. et al. Ligation of MHC class II molecules differentially upregulates TNF beta gene expression in B cell lines of different MHC class II haplotypes. Hum Immunol, v. 60, n. 4, p. 312-22, 1999. HADZIYANNIS, S. J. et al. Peginterferon-alpha2a and ribavirin combination therapy in chronic hepatitis C: a randomized study of treatment duration and ribavirin dose. Ann Intern Med, v. 140, n. 5, p. 346-55, 2004. HALL, M. A. et al. Genetic polymorphism of IL-12 p40 gene in immune-mediated disease. Genes Immun, v. 1, n. 3, p. 219-24, 2000. HAUSER, S. L. Tumor necrosis factor: immunogenetics and disease. Ann Neurol, v. 38, n. 5, p. 702-4, 1995.

110
HEGEDUS, C. M. et al. Screening the human serum proteome for genotype-phenotype associations: an analysis of the IL6 -174G>C polymorphism. Proteomics, v. 7, n. 4, p. 548-57, 2007. HERSHEY, G. K. et al. The association of atopy with a gain-of-function mutation in the alpha subunit of the interleukin-4 receptor. N Engl J Med, v. 337, n. 24, p. 1720-5, 1997. HIROISHI, K.; ITO, T.; IMAWARI, M. Immune responses in hepatitis C virus infection and mechanisms of hepatitis C virus persistence. J Gastroenterol Hepatol, v. 23, n. 10, p. 1473-82, 2008. HOFFMANN, S. C. et al. Association of cytokine polymorphic inheritance and in vitro cytokine production in anti-CD3/CD28-stimulated peripheral blood lymphocytes. Transplantation, v. 72, n. 8, p. 1444-50, 2001. HOOFNAGLE, J. H. Course and outcome of hepatitis C. Hepatology, v. 36, n. 5 Suppl 1, p. S21-9, 2002. HUANG, J. et al. Recruitment of IRAK to the interleukin 1 receptor complex requires interleukin 1 receptor accessory protein. Proc Natl Acad Sci U S A, v. 94, n. 24, p. 12829-32, 1997. HUARTE, M. P.; CASI, M. A. [Virology, diagnostic tests, epidemiology and transmission mechanisms of hepatitis C virus infection]. An Sist Sanit Navar, v. 27 Suppl 2, p. 41-9, 2004. HUTH, C. et al. Joint analysis of individual participants' data from 17 studies on the association of the IL6 variant -174G>C with circulating glucose levels, interleukin-6 levels, and body mass index. Ann Med, v. 41, n. 2, p. 128-38, 2009. IVIC, I. et al. Hla-Cw7 allele as predictor of favorable therapeutic response to interferon-alpha in patients with chronic hepatitis C. Croat Med J, v. 48, n. 6, p. 807-13, 2007. IZUHARA, K.; SHIRAKAWA, T. Signal transduction via the interleukin-4 receptor and its correlation with atopy. Int J Mol Med, v. 3, n. 1, p. 3-10, 1999. JANEWAY, C. A. et al. Immunobiology: The Immune System in Health and Disease. 5th. New York and London: Garland Science, 2001. ISBN 0-8153-3642-X. JANG, J. Y.; CHUNG, R. T. Chronic hepatitis C. Gut Liver, v. 5, n. 2, p. 117-32, 2011. JESUDIAN, A. B.; GAMBARIN-GELWAN, M.; JACOBSON, I. M. Advances in the treatment of hepatitis C virus infection. Gastroenterol Hepatol (N Y), v. 8, n. 2, p. 91-101, 2012. JOHN, S. et al. Two novel biallelic polymorphisms in the IL-2 gene. Eur J Immunogenet, v. 25, n. 6, p. 419-20, 1998. JU, G. et al. Structure-function analysis of human interleukin-2. Identification of amino acid residues required for biological activity. J Biol Chem, v. 262, n. 12, p. 5723-31, 1987. KABESCH, M. et al. A complete screening of the IL4 gene: novel polymorphisms and their association with asthma and IgE in childhood. J Allergy Clin Immunol, v. 112, n. 5, p. 893-8, 2003.

111
KAKIMI, K. et al. Natural killer T cell activation inhibits hepatitis B virus replication in vivo. J Exp Med, v. 192, n. 7, p. 921-30, 2000. KANTO, T. et al. Impaired allostimulatory capacity of peripheral blood dendritic cells recovered from hepatitis C virus-infected individuals. J Immunol, v. 162, n. 9, p. 5584-91, 1999. KAPLAN, M. et al. Neutralizing antibodies in hepatitis C virus infection: a review of immunological and clinical characteristics. Gastroenterology, v. 125, n. 2, p. 597-604, 2003. KAWAGUCHI, Y. et al. Contribution of single nucleotide polymorphisms of the IL1A gene to the cleavage of precursor IL-1alpha and its transcription activity. Immunogenetics, v. 59, n. 6, p. 441-8, 2007. KELLY-WELCH, A. E. et al. Interleukin-4 and interleukin-13 signaling connections maps. Science, v. 300, n. 5625, p. 1527-8, 2003. KENNY-WALSH, E. Clinical outcomes after hepatitis C infection from contaminated anti-D immune globulin. Irish Hepatology Research Group. N Engl J Med, v. 340, n. 16, p. 1228-33, 1999. KHAKOO, S. I. et al. HLA and NK cell inhibitory receptor genes in resolving hepatitis C virus infection. Science, v. 305, n. 5685, p. 872-4, 2004. KILPINEN, S. et al. The promoter polymorphism of the interleukin-6 gene regulates interleukin-6 production in neonates but not in adults. Eur Cytokine Netw, v. 12, n. 1, p. 62-8, 2001. KIM, Y. J. et al. Association of TNF-alpha promoter polymorphisms with the clearance of hepatitis B virus infection. Hum Mol Genet, v. 12, n. 19, p. 2541-6, 2003. KINGSLEY, D. M. The TGF-beta superfamily: new members, new receptors, and new genetic tests of function in different organisms. Genes Dev, v. 8, n. 2, p. 133-46, 1994. KISHIMOTO, T.; TAGA, T.; AKIRA, S. Cytokine signal transduction. Cell, v. 76, n. 2, p. 253-62, 1994. KISZEL, P. et al. Interleukin-6 -174 promoter polymorphism does not influence IL-6 production after LPS and IL-1 beta stimulation in human umbilical cord vein endothelial cells. Cytokine, v. 40, n. 1, p. 17-22, 2007. KITTLESEN, D. J. et al. Interaction between complement receptor gC1qR and hepatitis C virus core protein inhibits T-lymphocyte proliferation. J Clin Invest, v. 106, n. 10, p. 1239-49, 2000. KLEINRATH, T. et al. Interleukin-4 promoter polymorphisms: a genetic prognostic factor for survival in metastatic renal cell carcinoma. J Clin Oncol, v. 25, n. 7, p. 845-51, 2007. KROEGER, K. M.; CARVILLE, K. S.; ABRAHAM, L. J. The -308 tumor necrosis factor-alpha promoter polymorphism effects transcription. Mol Immunol, v. 34, n. 5, p. 391-9, 1997. KSIAA CHEIKHROUHOU, L. et al. Cytokine and apoptosis gene polymorphisms influence the outcome of hepatitis C virus infection. Hepatobiliary Pancreat Dis Int, v. 10, n. 3, p. 280-8, 2011.

112
LAHIRI, D. K.; NURNBERGER, J. I., JR. A rapid non-enzymatic method for the preparation of HMW DNA from blood for RFLP studies. Nucleic Acids Res, v. 19, n. 19, p. 5444, 1991. LAI, M. E. et al. Hepatitis C virus in multiple episodes of acute hepatitis in polytransfused thalassaemic children. Lancet, v. 343, n. 8894, p. 388-90, 1994. LEWONTIN, R. C. The Interaction of Selection and Linkage. I. General Considerations; Heterotic Models. Genetics, v. 49, n. 1, p. 49-67, 1964. LIMA-CABELLO, E. et al. Enhanced expression of pro-inflammatory mediators and liver X-receptor-regulated lipogenic genes in non-alcoholic fatty liver disease and hepatitis C. Clin Sci (Lond), v. 120, n. 6, p. 239-50, 2011. LIU, Y. J. Dendritic cell subsets and lineages, and their functions in innate and adaptive immunity. Cell, v. 106, n. 3, p. 259-62, 2001. LIU, Z. X. et al. NK cells cause liver injury and facilitate the induction of T cell-mediated immunity to a viral liver infection. J Immunol, v. 164, n. 12, p. 6480-6, 2000. LU, C. C. et al. Host TNF-alpha-1031 and -863 promoter single nucleotide polymorphisms determine the risk of benign ulceration after H. pylori infection. Am J Gastroenterol, v. 100, n. 6, p. 1274-82, 2005. MACIAS, J. et al. Host genetics. Curr Opin HIV AIDS, v. 6, n. 6, p. 491-500, 2011. MAHMOOD, S. et al. Clinical significance of intrahepatic interleukin-8 in chronic hepatitis C patients. Hepatol Res, v. 24, n. 4, p. 413-419, 2002. MAHONEY, F. J. Update on diagnosis, management, and prevention of hepatitis B virus infection. Clin Microbiol Rev, v. 12, n. 2, p. 351-66, 1999. MALYAK, M. et al. Characterization of a low molecular weight isoform of IL-1 receptor antagonist. J Immunol, v. 161, n. 4, p. 1997-2003, 1998. MANESIS, E. K. et al. Natural course of treated and untreated chronic HCV infection: results of the nationwide Hepnet.Greece cohort study. Aliment Pharmacol Ther, v. 29, n. 10, p. 1121-30, 2009. MANNS, M. P. et al. Peginterferon alfa-2b plus ribavirin compared with interferon alfa-2b plus ribavirin for initial treatment of chronic hepatitis C: a randomised trial. Lancet, v. 358, n. 9286, p. 958-65, 2001. MARANGON, A. V. et al. Influence of HLA alleles in response to treatment with pegylated interferon-alpha and ribavirin in patients with chronic hepatitis C. Int J Immunogenet, 2012. ______. KIR genes and their human leukocyte antigen ligands in the progression to cirrhosis in patients with chronic hepatitis C. Hum Immunol, v. 72, n. 11, p. 1074-8, 2011. MARCH, C. J. et al. Cloning, sequence and expression of two distinct human interleukin-1 complementary DNAs. Nature, v. 315, n. 6021, p. 641-7, 1985. MARINO, M. W. et al. Characterization of tumor necrosis factor-deficient mice. Proc Natl Acad Sci U S A, v. 94, n. 15, p. 8093-8, 1997.

113
MARTIN, M. P.; CARRINGTON, M. Immunogenetics of viral infections. Curr Opin Immunol, v. 17, n. 5, p. 510-6, 2005. MASSAGUE, J. The transforming growth factor-beta family. Annu Rev Cell Biol, v. 6, p. 597-641, 1990. MATESANZ, F. et al. Effects of the multiple sclerosis associated -330 promoter polymorphism in IL2 allelic expression. J Neuroimmunol, v. 148, n. 1-2, p. 212-7, 2004. MATSUDA, T.; HIRANO, T. Interleukin 6 (IL-6). Biotherapy, v. 2, n. 4, p. 363-73, 1990. MAY, L. T. et al. Synthesis and secretion of multiple forms of beta 2-interferon/B-cell differentiation factor 2/hepatocyte-stimulating factor by human fibroblasts and monocytes. J Biol Chem, v. 263, n. 16, p. 7760-6, 1988. MCDERMOTT, M. F. TNF and TNFR biology in health and disease. Cell Mol Biol (Noisy-le-grand), v. 47, n. 4, p. 619-35, 2001. MCDERMOTT, M. M. et al. Patterns of inflammation associated with peripheral arterial disease: the InCHIANTI study. Am Heart J, v. 150, n. 2, p. 276-81, 2005. MEIER, U. C. et al. Shared alterations in NK cell frequency, phenotype, and function in chronic human immunodeficiency virus and hepatitis C virus infections. J Virol, v. 79, n. 19, p. 12365-74, 2005. MITSUYASU, H. et al. Ile50Val variant of IL4R alpha upregulates IgE synthesis and associates with atopic asthma. Nat Genet, v. 19, n. 2, p. 119-20, 1998. MIYAJIMA, A. et al. Cytokine receptors and signal transduction. Annu Rev Immunol, v. 10, p. 295-331, 1992. MOORE, K. W. et al. Interleukin-10 and the interleukin-10 receptor. Annu Rev Immunol, v. 19, p. 683-765, 2001. MORISHIMA, C. et al. Decreased NK cell frequency in chronic hepatitis C does not affect ex vivo cytolytic killing. Hepatology, v. 43, n. 3, p. 573-80, 2006. MOSMANN, T. R. et al. Two types of murine helper T cell clone. I. Definition according to profiles of lymphokine activities and secreted proteins. J Immunol, v. 136, n. 7, p. 2348-57, 1986. MS. Hepatite C: Descrição da doença. Disponível em: < http://portal.saude.gov.br/portal/saude/Gestor/visualizar_texto.cfm?idtxt=27218 >. Acesso em: 05 jun 2012. MUHL, H.; PFEILSCHIFTER, J. Anti-inflammatory properties of pro-inflammatory interferon-gamma. Int Immunopharmacol, v. 3, n. 9, p. 1247-55, 2003. MYRMEL, H.; ULVESTAD, E.; ASJO, B. The hepatitis C virus enigma. Apmis, v. 117, n. 5-6, p. 427-39, 2009. NAKA, T.; NISHIMOTO, N.; KISHIMOTO, T. The paradigm of IL-6: from basic science to medicine. Arthritis Res, v. 4 Suppl 3, p. S233-42, 2002.

114
NEDWIN, G. E. et al. Human lymphotoxin and tumor necrosis factor genes: structure, homology and chromosomal localization. Nucleic Acids Res, v. 13, n. 17, p. 6361-73, 1985. NELMS, K. et al. The IL-4 receptor: signaling mechanisms and biologic functions. Annu Rev Immunol, v. 17, p. 701-38, 1999. NEUMANN, A. U. et al. Hepatitis C viral dynamics in vivo and the antiviral efficacy of interferon-alpha therapy. Science, v. 282, n. 5386, p. 103-7, 1998. NIH. Hepatitis C. Wkly Epidemiol Rec, v. 72, n. 10, p. 65-9, 1997. NIH Consensus Statement on Management of Hepatitis C: 2002. NIH Consens State Sci Statements, v. 19, n. 3, p. 1-46, 2002. OLEJNICZAK, K.; KASPRZAK, A. Biological properties of interleukin 2 and its role in pathogenesis of selected diseases--a review. Med Sci Monit, v. 14, n. 10, p. RA179-89, 2008. PALADINO, N. et al. Increased frequencies of activating natural killer receptors are associated with liver injury in individuals who do not eliminate hepatitis C virus. Tissue Antigens, v. 69 Suppl 1, p. 109-11, 2007. PAPATHEODORIDIS, G. V.; PARASKEVIS, D. Role of genetic polymorphisms in the progression of liver fibrosis in chronic hepatitis C virus infection. Liver Int, v. 28, n. 6, p. 764-6, 2008. PAUL, W. E. Interleukin-4: a prototypic immunoregulatory lymphokine. Blood, v. 77, n. 9, p. 1859-70, 1991. PAWLOTSKY, J. M. Hepatitis C virus population dynamics during infection. Curr Top Microbiol Immunol, v. 299, p. 261-84, 2006. PENNICA, D. et al. Human tumour necrosis factor: precursor structure, expression and homology to lymphotoxin. Nature, v. 312, n. 5996, p. 724-9, 1984. PERNEGER, T. V. What's wrong with Bonferroni adjustments. Bmj, v. 316, n. 7139, p. 1236-8, 1998. PERREY, C. et al. Genotyping for polymorphisms in interferon-gamma, interleukin-10, transforming growth factor-beta 1 and tumour necrosis factor-alpha genes: a technical report. Transpl Immunol, v. 6, n. 3, p. 193-7, 1998. POWELL, E. E. et al. Host genetic factors influence disease progression in chronic hepatitis C. Hepatology, v. 31, n. 4, p. 828-33, 2000. PRATI, D. Transmission of hepatitis C virus by blood transfusions and other medical procedures: a global review. J Hepatol, v. 45, n. 4, p. 607-16, 2006. RAFIQ, S. et al. Common genetic variation in the gene encoding interleukin-1-receptor antagonist (IL-1RA) is associated with altered circulating IL-1RA levels. Genes Immun, v. 8, n. 4, p. 344-51, 2007. REDDY, K. R. et al. Efficacy and safety of pegylated (40-kd) interferon alpha-2a compared with interferon alpha-2a in noncirrhotic patients with chronic hepatitis C. Hepatology, v. 33, n. 2, p. 433-8, 2001.

115
REHERMANN, B. et al. Differential cytotoxic T-lymphocyte responsiveness to the hepatitis B and C viruses in chronically infected patients. J Virol, v. 70, n. 10, p. 7092-102, 1996. REIBMAN, J. et al. Transforming growth factor beta 1, a potent chemoattractant for human neutrophils, bypasses classic signal-transduction pathways. Proc Natl Acad Sci U S A, v. 88, n. 15, p. 6805-9, 1991. RINK, L.; KIRCHNER, H. Recent progress in the tumor necrosis factor-alpha field. Int Arch Allergy Immunol, v. 111, n. 3, p. 199-209, 1996. ROBERTS, A. B.; SPORN, M. B. Differential expression of the TGF-beta isoforms in embryogenesis suggests specific roles in developing and adult tissues. Mol Reprod Dev, v. 32, n. 2, p. 91-8, 1992. ROMERO-GOMEZ, M. et al. Genes and hepatitis C: susceptibility, fibrosis progression and response to treatment. Liver Int, v. 31, n. 4, p. 443-60, 2011. ROSENWASSER, L. J.; BORISH, L. Genetics of atopy and asthma: the rationale behind promoter-based candidate gene studies (IL-4 and IL-10). Am J Respir Crit Care Med, v. 156, n. 4 Pt 2, p. S152-5, 1997. ROTHMAN, K. J. No adjustments are needed for multiple comparisons. Epidemiology, v. 1, n. 1, p. 43-6, 1990. SAVITZ, D. A.; OLSHAN, A. F. Multiple comparisons and related issues in the interpretation of epidemiologic data. Am J Epidemiol, v. 142, n. 9, p. 904-8, 1995. SEEFF, L. B. Natural history of chronic hepatitis C. Hepatology, v. 36, n. 5 Suppl 1, p. S35-46, 2002. SEEGERS, D. et al. A TaqI polymorphism in the 3'UTR of the IL-12 p40 gene correlates with increased IL-12 secretion. Genes Immun, v. 3, n. 7, p. 419-23, 2002. SEIFERT, U. et al. Hepatitis C virus mutation affects proteasomal epitope processing. J Clin Invest, v. 114, n. 2, p. 250-9, 2004. SHEPARD, C. W.; FINELLI, L.; ALTER, M. J. Global epidemiology of hepatitis C virus infection. Lancet Infect Dis, v. 5, n. 9, p. 558-67, 2005. SHIN, E. C. et al. Virus-induced type I IFN stimulates generation of immunoproteasomes at the site of infection. J Clin Invest, v. 116, n. 11, p. 3006-14, 2006. SILVA, C. M. et al. High proportion of hepatitis C virus genotypes 1 and 3 in a large cohort of patients from Southern Brazil. Mem Inst Oswaldo Cruz, v. 102, n. 7, p. 867-70, 2007. SIMMONDS, P. Viral heterogeneity of the hepatitis C virus. J Hepatol, v. 31 Suppl 1, p. 54-60, 1999. ______. Genetic diversity and evolution of hepatitis C virus--15 years on. J Gen Virol, v. 85, n. Pt 11, p. 3173-88, 2004. SIMMONDS, P. et al. A proposed system for the nomenclature of hepatitis C viral genotypes. Hepatology, v. 19, n. 5, p. 1321-4, 1994.

116
______. Consensus proposals for a unified system of nomenclature of hepatitis C virus genotypes. Hepatology, v. 42, n. 4, p. 962-73, 2005. ______. Evolutionary analysis of variants of hepatitis C virus found in South-East Asia: comparison with classifications based upon sequence similarity. J Gen Virol, v. 77 ( Pt 12), p. 3013-24, 1996. SIMS, J. E. et al. Cloning the interleukin 1 receptor from human T cells. Proc Natl Acad Sci U S A, v. 86, n. 22, p. 8946-50, 1989. SMITH, A. J.; HUMPHRIES, S. E. Cytokine and cytokine receptor gene polymorphisms and their functionality. Cytokine Growth Factor Rev, v. 20, n. 1, p. 43-59, 2009. STEINKASSERER, A. et al. The human IL-1 receptor antagonist gene (IL1RN) maps to chromosome 2q14-q21, in the region of the IL-1 alpha and IL-1 beta loci. Genomics, v. 13, n. 3, p. 654-7, 1992. STITES, D. P.; TERR, A. I.; PARSLOW, T. G. Imunologia Médica. 9th. Rio de Janeiro: Guanabara-Koogan, 2000. STOICA, A. L. et al. Interleukin-6 and interleukin-10 gene polymorphism, endothelial dysfunction, and postoperative prognosis in patients with peripheral arterial disease. J Vasc Surg, v. 52, n. 1, p. 103-9, 2010. SUPPIAH, V. et al. IL28B is associated with response to chronic hepatitis C interferon-alpha and ribavirin therapy. Nat Genet, v. 41, n. 10, p. 1100-4, 2009. SVEJGAARD, A. et al. HL-A antigens and disease. Statistical and genetical considerations. Tissue Antigens, v. 4, n. 2, p. 95-105, 1974. SVEJGAARD, A.; RYDER, L. P. HLA and disease associations: detecting the strongest association. Tissue Antigens, v. 43, n. 1, p. 18-27, 1994. SZABO, G.; DOLGANIUC, A. Subversion of plasmacytoid and myeloid dendritic cell functions in chronic HCV infection. Immunobiology, v. 210, n. 2-4, p. 237-47, 2005. TAI, A. W.; CHUNG, R. T. Treatment failure in hepatitis C: mechanisms of non-response. J Hepatol, v. 50, n. 2, p. 412-20, 2009. TAKAKI, A. et al. Cellular immune responses persist and humoral responses decrease two decades after recovery from a single-source outbreak of hepatitis C. Nat Med, v. 6, n. 5, p. 578-82, 2000. TAMBUR, A. R. et al. Role of cytokine gene polymorphism in hepatitis C recurrence and allograft rejection among liver transplant recipients. Transplantation, v. 71, n. 10, p. 1475-80, 2001. TANABE, O. et al. Genomic structure of the murine IL-6 gene. High degree conservation of potential regulatory sequences between mouse and human. J Immunol, v. 141, n. 11, p. 3875-81, 1988. TANAKA, Y. et al. Genome-wide association of IL28B with response to pegylated interferon-alpha and ribavirin therapy for chronic hepatitis C. Nat Genet, v. 41, n. 10, p. 1105-9, 2009.

117
TERRY, C. F.; LOUKACI, V.; GREEN, F. R. Cooperative influence of genetic polymorphisms on interleukin 6 transcriptional regulation. J Biol Chem, v. 275, n. 24, p. 18138-44, 2000. TESTER, I. et al. Immune evasion versus recovery after acute hepatitis C virus infection from a shared source. J Exp Med, v. 201, n. 11, p. 1725-31, 2005. THOMAS, D. L.; SEEFF, L. B. Natural history of hepatitis C. Clin Liver Dis, v. 9, n. 3, p. 383-98, vi, 2005. TRINCHIERI, G.; PFLANZ, S.; KASTELEIN, R. A. The IL-12 family of heterodimeric cytokines: new players in the regulation of T cell responses. Immunity, v. 19, n. 5, p. 641-4, 2003. TSENG, C. T.; KLIMPEL, G. R. Binding of the hepatitis C virus envelope protein E2 to CD81 inhibits natural killer cell functions. J Exp Med, v. 195, n. 1, p. 43-9, 2002. TSUBOTA, A. et al. Peginterferon and ribavirin treatment for hepatitis C virus infection. World J Gastroenterol, v. 17, n. 4, p. 419-32, 2011. TURNER, D. M. et al. An investigation of polymorphism in the interleukin-10 gene promoter. Eur J Immunogenet, v. 24, n. 1, p. 1-8, 1997. VALIANTE, N. M. et al. Life, activation and death of intrahepatic lymphocytes in chronic hepatitis C. Immunol Rev, v. 174, p. 77-89, 2000. VAN DER POEL, C. L. Hepatitis C virus and blood transfusion: past and present risks. J Hepatol, v. 31 Suppl 1, p. 101-6, 1999. VAN SNICK, J. Interleukin-6: an overview. Annu Rev Immunol, v. 8, p. 253-78, 1990. VIEIRA, P. et al. Isolation and expression of human cytokine synthesis inhibitory factor cDNA clones: homology to Epstein-Barr virus open reading frame BCRFI. Proc Natl Acad Sci U S A, v. 88, n. 4, p. 1172-6, 1991. VILLANO, S. A. et al. Persistence of viremia and the importance of long-term follow-up after acute hepatitis C infection. Hepatology, v. 29, n. 3, p. 908-14, 1999. WAHL, S. M. Transforming growth factor beta (TGF-beta) in inflammation: a cause and a cure. J Clin Immunol, v. 12, n. 2, p. 61-74, 1992. WATANABE, N.; KOBAYASHI, Y. Selective release of a processed form of interleukin 1 alpha. Cytokine, v. 6, n. 6, p. 597-601, 1994. WATHELET, M. G. et al. Virus infection induces the assembly of coordinately activated transcription factors on the IFN-beta enhancer in vivo. Mol Cell, v. 1, n. 4, p. 507-18, 1998. WILSON, A. G. et al. An allelic polymorphism within the human tumor necrosis factor alpha promoter region is strongly associated with HLA A1, B8, and DR3 alleles. J Exp Med, v. 177, n. 2, p. 557-60, 1993. ______. Effects of a polymorphism in the human tumor necrosis factor alpha promoter on transcriptional activation. Proc Natl Acad Sci U S A, v. 94, n. 7, p. 3195-9, 1997. WINDSOR, W. T. et al. Disulfide bond assignments and secondary structure analysis of human and murine interleukin 10. Biochemistry, v. 32, n. 34, p. 8807-15, 1993.

118
WOOLF, B. On estimating the relation between blood group and disease. Ann Hum Genet, v. 19, n. 4, p. 251-3, 1955. XING, Z. et al. IL-6 is an antiinflammatory cytokine required for controlling local or systemic acute inflammatory responses. J Clin Invest, v. 101, n. 2, p. 311-20, 1998. YASUKAWA, K. et al. Structure and expression of human B cell stimulatory factor-2 (BSF-2/IL-6) gene. Embo J, v. 6, n. 10, p. 2939-45, 1987. YE, K. et al. Three distinct promoters direct transcription of different 5' untranslated regions of the human interleukin 1 type I receptor: a possible mechanism for control of translation. Cytokine, v. 8, n. 6, p. 421-9, 1996. YEE, L. J. et al. Interleukin 10 polymorphisms as predictors of sustained response in antiviral therapy for chronic hepatitis C infection. Hepatology, v. 33, n. 3, p. 708-12, 2001. ______. Tumor necrosis factor gene polymorphisms in patients with cirrhosis from chronic hepatitis C virus infection. Genes Immun, v. 1, n. 6, p. 386-90, 2000. ZARIFE, M. A. et al. Prevalence of hepatitis C virus infection in north-eastern Brazil: a population-based study. Trans R Soc Trop Med Hyg, v. 100, n. 7, p. 663-8, 2006.

119
ANEXO
Top Related