


Languages
Pages
Legal


RESEARCH ARTICLE
Influenza A viruses use multivalent sialic acid
clusters for cell binding and receptor
activation
Christian SiebenID1*, Erdinc SezginID
2¤, Christian EggelingID2¤, Suliana ManleyID
1*
1 Laboratory of Experimental Biophysics, Institute of Physics, Ecole Polytechnique Federale de Lausanne
(EPFL), Route Cantonale, Lausanne, Switzerland, 2 MRC Human Immunology Unit, University of Oxford,
MRC Weatherall Institute of Molecular Medicine, Headley Way, Oxford, United Kingdom
¤ Current address: Erdinc Sezgin, Science for Life Laboratory, Department of Women’s and Children’s
Health, Karolinska Institutet, Stockholm, Sweden; Christian Eggeling, Institut fur Angewandte Optik,
Frobelstieg, Jena, Germany
* [email protected] (CS); [email protected] (SM)
Abstract
Influenza A virus (IAV) binds its host cell using the major viral surface protein hemagglutinin
(HA). HA recognizes sialic acid, a plasma membrane glycan that functions as the specific
primary attachment factor (AF). Since sialic acid alone cannot fulfill a signaling function, the
virus needs to activate downstream factors to trigger endocytic uptake. Recently, the epider-
mal growth factor receptor (EGFR), a member of the receptor-tyrosine kinase family, was
shown to be activated by IAV and transmit cell entry signals. However, how IAV’s binding to
sialic acid leads to engagement and activation of EGFR remains largely unclear. We used
multicolor super-resolution microscopy to study the lateral organization of both IAV’s AFs
and its functional receptor EGFR at the scale of the IAV particle. Intriguingly, quantitative
cluster analysis revealed that AFs and EGFR are organized in partially overlapping submic-
rometer clusters in the plasma membrane of A549 cells. Within AF domains, the local AF
concentration reaches on average 10-fold the background concentration and tends to
increase towards the cluster center, thereby representing a multivalent virus-binding plat-
form. Using our experimentally measured cluster characteristics, we simulated virus diffu-
sion on a flat membrane. The results predict that the local AF concentration strongly
influences the distinct mobility pattern of IAVs, in a manner consistent with live-cell single-
virus tracking data. In contrast to AFs, EGFR resides in smaller clusters. Virus binding acti-
vates EGFR, but interestingly, this process occurs without a major lateral EGFR redistribu-
tion, indicating the activation of pre-formed clusters, which we show are long-lived. Taken
together, our results provide a quantitative understanding of the initial steps of influenza
virus infection. Co-clustering of AF and EGFR permit a cooperative effect of binding and sig-
naling at specific platforms, thus linking their spatial organization to their functional role dur-
ing virus-cell binding and receptor activation.
PLOS PATHOGENS
PLOS Pathogens | https://doi.org/10.1371/journal.ppat.1008656 July 8, 2020 1 / 27
a1111111111
a1111111111
a1111111111
a1111111111
a1111111111
OPEN ACCESS
Citation: Sieben C, Sezgin E, Eggeling C, Manley S
(2020) Influenza A viruses use multivalent sialic
acid clusters for cell binding and receptor
activation. PLoS Pathog 16(7): e1008656. https://
doi.org/10.1371/journal.ppat.1008656
Editor: Yoshihiro Kawaoka, University of
Wisconsin-Madison, UNITED STATES
Received: April 24, 2020
Accepted: May 27, 2020
Published: July 8, 2020
Copyright: © 2020 Sieben et al. This is an open
access article distributed under the terms of the
Creative Commons Attribution License, which
permits unrestricted use, distribution, and
reproduction in any medium, provided the original
author and source are credited.
Data Availability Statement: The data underlying
the results presented in the study are available at
https://doi.org/10.5281/zenodo.3897432.
Funding: Research in S.M’s lab is supported by the
National Centre for Competence in Research
(NCCR) Chemical Biology. E.S. is supported by
EMBO long term (ALTF 636-2013) and Marie
Skłodowska-Curie Intra-European Fellowships
(MEMBRANE DYNAMICS 627088). This work is
supported by the Wolfson Foundation (ref. 18272),
the Medical Research Council (MRC, grant number
MC_UU_12010/unit programes G0902418 and

Author summary
The plasma membrane is the major interface between a cell and its environment. This
complex and dynamic organelle needs to protect, as a barrier, but also transmit subtle sig-
nals into and out of the cell. For the enveloped virus IAV, the plasma membrane repre-
sents both a major obstacle to overcome during infection, and the site for the assembly of
progeny virus particles. However, the organisation of the plasma membrane–a key to
understanding how viral entry works—at the scale of an infecting particle (length scales<
100 nm) remains largely unknown. Sialylated glycans serve as IAV attachment factors but
are not able to transmit signals across the plasma membrane. Receptor tyrosine kinases
were identified to be activated upon virus binding and serve as functional receptors. How
IAV engages and activates its functional receptors while initially binding glycans still
remains speculative. Here, we use super resolution microscopy to study the lateral organi-
zation of plasma membrane-bound molecules involved in IAV infection, as well as their
functional relationship. We find that molecules are organized in submicrometer nanodo-
mains and, in combination with virus diffusion simulations, present a mechanistic model
for how IAV first engages with AFs in the plasma membrane to subsequently engage and
trigger entry-associated membrane receptors.
Introduction
Influenza A viruses (IAV) cause severe respiratory tract infections in humans, often leading to
seasonal local epidemics as well as periodic global pandemics [1]. During cell binding, IAV
engages with low affinity attachment factors (AFs) as well as functional receptors to trigger cell
entry by endocytosis. However, little is known about the lateral co-organization of both at the
scale of an infecting virus, and how their organization relates to their functional role during
virus infection.
The viral hemagglutinin (HA), a trimeric glycoprotein that covers ~ 90% of the viral sur-
face, mediates the initial IAV-cell contact (Fig 1A) [2]. The most common AF for IAV is N-
acetylneuraminic, or sialic, acid (SA), a highly abundant cell-surface glycan that within its
glyosidic linkage encodes IAV species specificity. Human-pathogenic IAV strains preferen-
tially bind α-2,6-linked SA, while avian-pathogenic viruses prefer to bind α-2,3-linked SA.
This specificity can be attributed to the topology of the glycans, which more readily form con-
tacts with receptor-binding domains of complementary HAs [3]. A common feature of glycan-
protein interactions is their low affinity, which for HA-sialic acid lies in the millimolar range
[4] and should make it challenging for the virus to form stable interactions with cells. Although
AFs are highly abundant, which could lead to stable adhesion, single-virus tracking showed
that IAVs have some freedom to explore the cell surface [5–7]. Indeed, it remains largely
unclear how an initial low-affinity interaction leads to a stable and specific but also dynamic
virus-cell contact enabling a successful infection.
After binding, IAVs enter cells by receptor-mediated endocytosis, where clathrin-mediated
endocytosis was shown to constitute the major [7], albeit not the only route [8]. Since AFs can-
not trigger endocytosis, an active signal-processing receptor must be engaged to allow viral
entry. Receptor-tyrosine kinases were shown to be able to fulfill this function [9]. Specifically,
it was shown that, among other receptor-tyrosine kinases, epidermal growth factor receptor
(EGFR) was activated during and required for efficient IAV cell entry. However, how IAV
finds and activates EGFR has remained speculative. While molecular and structural informa-
tion is available for both HA-SA [3] and EGFR-EGF interactions [10], much less is known
PLOS PATHOGENS Plasma membrane nanodomains facilitate influenza virus cell infection
PLOS Pathogens | https://doi.org/10.1371/journal.ppat.1008656 July 8, 2020 2 / 27
MC_UU_12025), MRC/BBSRC/ESPRC (grant
number MR/K01577X/1), and the Wellcome Trust
(grant ref. 104924/14/Z/14). The funders had no
role in study design, data collection and analysis,
decision to publish, or preparation of the
manuscript.
Competing interests: The authors have declared
that no competing interests exist.

about their spatial co-organization within the plasma membrane, and how it could enable
EGFR activation during IAV cell infection.
Over the last decades, electron microscopy has provided a detailed structural picture of iso-
lated influenza virus particles [2] as well as their individual proteins [11]. However, imaging
Fig 1. Sialylated IAV attachment factors are organized in nanodomains on A549 cells. (A) Influenza virus is an
enveloped particle that encapsulates its segmented (-)vRNA genome built of 8 viral ribonucleoprotein complexes
(vRNPs). The viral membrane harbors the two glycoproteins hemagglutinin (HA) and neuraminidase (NA). HA is
responsible for binding sialic acid (SA) containing attachment factors on the host cell plasma membrane. Upon cell-
binding, the virus needs to activate functional receptors to trigger endocytosis. (B) Confocal imaging of live A549 cells
labelled with SNA (conjugated to JF549). The cells feature a non-uniform SNA distribution across the plasma
membrane. Large finger-like protrusions can be observed on the dorsal side of the cell. (C) Confocal and STED live-
cell imaging of A549 cells labelled with SNA (conjugated to StarRed) confirms the existence of finger-like protrusions
as well as a population of smaller nanodomains with diameter of ~100 nm (C, right, inset). (D) To increase the
resolution and focus on the small nanodomain we performed STORM imaging of A549 cells labelled with SNA
(conjugated to Alexa647). Reconstructed STORM images confirm two major structural features (1) finger-like
protrusions as well as (2) small nanodomains. Cell treatment with neuraminidase (NA, 0.01 U/ml for 2h) led to a
strong reduction of the localization density due to the cleavage and hence decrease local concentration of SA (D, right,
inset).
https://doi.org/10.1371/journal.ppat.1008656.g001
PLOS PATHOGENS Plasma membrane nanodomains facilitate influenza virus cell infection
PLOS Pathogens | https://doi.org/10.1371/journal.ppat.1008656 July 8, 2020 3 / 27

and quantitative analysis of heterogeneous cellular structures and their dynamics at the nano-
scale remains challenging. Super-resolution microscopy represents an excellent tool to study
cellular organization at the scale of an infecting viral particle (<100 nm) [12]. Here, we com-
bined two complementary approaches, which together provide a versatile toolbox to meet this
challenge [12,13]. We used single molecule localization microscopy (SMLM) techniques
known as stochastic optical reconstruction microscopy (STORM) and (fluorescence) photoac-
tivated localization microscopy ((f)PALM) together with live-cell stimulated emission deple-
tion (STED) [14] microscopy to image molecular organization and track single molecules
within the plasma membrane of IAV host cells [15–17].
We quantitatively analyzed the spatial organization of IAV AFs as well as EGFR on the sur-
face of human alveolar epithelial cells. We found that AFs are organized in virus-sized clusters
featuring a density gradient that decreases from a dense central core to the periphery. Using
their experimentally-determined characteristics, we used simulations to investigate their role
in virus-cell interactions. These simulations are in good agreement with live-cell virus tracking
experiments, and together, they suggest that the spatial organization of AFs largely influences
virus-cell interactions during the early phase of virus infection. We further show that AF nano-
domains overlap nonrandomly with EGFR clusters thereby promoting AF-mediated EGFR
activation. Interestingly, our results further suggest that pre-existing EGFR clusters are respon-
sible for IAV-mediated receptor activation. We provide a novel view on the initial events of
influenza virus infection and offer new insights into the functional role of the spatial organiza-
tion of cell surface AFs and receptors.
Results
Sialic acid-containing IAV attachment factors are organized in
nanodomains on the plasma membrane of A549 cells
To examine the spatial organization of IAV AFs within the plasma membrane of permissive
epithelial cells, we sought to selectively label sialic acid moieties which are preferably recog-
nized by human-pathogenic IAVs, such as H3N2/X31 [4] used here. For this purpose, we used
the plant lectin Sambuccus nigra agglutinin (SNA), which labels α-2,6-linked SA, to serve as a
primary IAV AF label (S1 Text, S1 Fig). Using confocal microscopy, we found that SNA
strongly labelled the plasma membrane of live A549 cells (Fig 1B), showing inhomogeneous
staining and enrichment in finger-like protrusions that morphologically appeared to be micro-
villi. We then used STED microscopy to more carefully study the smoother regions of the
plasma membrane between the microvilli. On live A549 cells, we detected a strong heterogene-
ity of SNA cell surface labelling including small clusters at the scale of 100–200 nm (Fig 1C,
right panel, inset).
Our next goal was to investigate the lateral organization of IAV AFs at the scale of the
virus-cell interface, in fixed cells to avoid motion blurring. We initially confirmed that our cell
fixation protocol successfully immobilized plasma membrane molecules (S2 Fig), then per-
formed STORM and STED in parallel to image the plasma membrane at the scale of small
spherical H3N2/X31 virions (average diameter of 120 nm [2]). STORM (Fig 1D) and STED
(S3A Fig) imaging of fixed A549 cells supported our observations made on live cells that SNA
stains a variety of small nanostructures on the flat parts of the plasma membrane. We also
found a similar distribution on MDCK cells, which are highly susceptible for IAV (S3B Fig).
As an SNA-independent control, we used wheat germ agglutinin (WGA), a general SA-bind-
ing lectin. WGA labelled A549 cells at higher density, while again highlighting microvilli and
nanoscale clusters (S3C Fig). Finally, we labeled cells using antibodies against ezrin, an actin-
binding protein. Ezrin is highly enriched in microvilli [18], and confirmed that the large
PLOS PATHOGENS Plasma membrane nanodomains facilitate influenza virus cell infection
PLOS Pathogens | https://doi.org/10.1371/journal.ppat.1008656 July 8, 2020 4 / 27

finger-like structures are indeed microvilli (S4A Fig). Since microvilli are not actively involved
in endocytosis [19,20], we focused on the population of smaller AF clusters.
Quantitative analysis of SNA nanodomains
To quantify the lateral organization of AFs from our STORM localization data, we used an
algorithm based on the detection of local density differences. To facilitate the analysis, we
developed a workflow (see Methods) that allowed us to extract geometrical properties of the
clusters as well as an estimate of the number of AF molecules (Fig 2A–2C). To identify and
exclude the large microvilli cluster population, we first performed cluster identification on the
ezrin localization maps (S4B Fig). We found that the large ezrin clusters had dimensions of
10–50 nm across the short and 0.5–2 μm along the long axis (S4B Fig). These parameters were
then used to filter out the large cluster population corresponding to microvilli identified in
SNA localization maps (Fig 2C). After filtering, we identified a heterogeneous population of
small clusters with a mean area of 0.016 μm2 (Fig 2D). Since the cluster area was at the same
scale as the projected two-dimensional area of a spherical IAV (0.0079 μm2 for r = 50 nm), we
Fig 2. Density-based localization analysis reveals small SA clusters between microvilli. (A) Spatial distribution of STORM localizations from SNA-A647 on A549
cells showing the coexistence of two structural features, (1) large microvilli as well as (2) small nanodomains. The inset in A shows a pixel image reconstruction (10
nm/pxl) of the localization map in A. (B) Density distribution of localizations shown in A within a search radius of 50 nm. Color scale according to number of
neighbor localizations. (C) Final clustering result with identified clusters allows quantification of the cluster area. After all identified clusters were filtered according to
their size to selectively analyze non-microvilli structures, we found clusters with an area between 0.005–0.04 μm2 (D). The large cluster labelled by the red dashed line
was filtered out (see also S4 Fig). Distribution of the number of molecules per cluster as estimated according to the number of localizations (D, inset). The inner
structure of non-microvilli clusters was analyzed according to their local localization density (B). (E) Representative example of two identified clusters showing their
inner density gradient. The color code represents the number of nearest neighbor localizations within a radius of 30 nm (i.e. the local localization density). The
localization density is plotted on the vertical axis. Distribution of the density difference between background and the cluster center over all identified cluster (F).
https://doi.org/10.1371/journal.ppat.1008656.g002
PLOS PATHOGENS Plasma membrane nanodomains facilitate influenza virus cell infection
PLOS Pathogens | https://doi.org/10.1371/journal.ppat.1008656 July 8, 2020 5 / 27

took a closer look at the density of molecules within each cluster. To define a local density, we
counted the number of nearest neighbor localizations within a distance of three times the
localization precision (3σ ~ 30 nm) (S5 Fig). Interestingly, we found that AF clusters have an
average 10-fold enrichment compared to the local background while some reach an even
20-fold increase (Fig 2E and 2F). As a control, we used simulations to test the effect of localiza-
tion precision on local concentration; however, this accounts at most for an enrichment
of< 8-fold (S6D Fig).
Following the identification of AF domains, we wanted to understand whether their
observed organization would have an impact on virus binding compared to a homogeneous
distribution. We constructed a virus binding simulation in which we gradually redistribute AF
molecules from a random into a clustered organization, keeping the total number of molecules
constant. In parallel, we simulated a stable population of clusters within a background of free
individual molecules and vary the number of molecules per cluster. In both cases, we simulate
a spherical virus particle and project its size as a landing spot on the simulated molecule sur-
face. Binding is counted as successful if the virus contacts at least 10 AF molecules. As shown
in S7 Fig, we find a positive correlation between AF clustering and virus binding indicating
that nanoclustering enhances the probability of efficient virus adhesion.
Single-IAV tracking indicates exploratory motion affected by the local AF
concentration
We wondered how IAV motion on the cell membrane is affected by AF clustering. To develop a
hypothesis and custom analysis, we first established a simple diffusion model to simulate the
behavior of individual viruses on a flat part of the cell surface. The model assumes a two-dimen-
sional random walk [21] where the virus undergoes periods of free diffusion (with diffusion co-
efficient Dfree) until it encounters a region of high AF concentration and becomes transiently
confined (with diffusion coefficient Dconf). The time a simulated particle stays confined will
depend on Dconf and the size of the confined region (i.e. the AF cluster size as measured using
STORM). To identify and quantify confined regions, we used a previously published confinement
probability Iconf denoting the probability for the particle to be confined at time t [22]. Although
even simulations of free diffusion displayed periods of apparent confinement, due to the stochastic
nature of thermal motion (S8A Fig), the simulations revealed different characteristic Iconf signa-
tures for free (Fig 3A and 3D) versus confined diffusion (Fig 3B and 3E, S8 Fig and S1 Movie).
Finally, we defined a threshold level of confinement, Ithresh = 5, to exclude these random fluctua-
tions and identify confined areas and confinement dwell times (Fig 3A and 3D; S8 Fig).
To test whether our model is consistent with the motion of IAV, we performed single-virus
tracking on live A549 cells. We considered physiological conditions (37˚C) as well as condi-
tions that suppress virus endocytosis (4˚C, dynasore treatment) to prolong the particles’ resi-
dence time on the cell surface. The trajectory analysis revealed different modes of movement,
which we classified into four types: (1) confined, (2) ballistic, (3) drifting and (4) mixed (S8
Fig). The ballistic movement is directional, at speeds up to 1–2 μm/sec; thus, we assigned it to
microtubule-associated transport as previously described [6,7]. Since this type of movement
follows a successful virus internalization, we expected to see it decrease in frequency after
blocking endocytosis. Indeed, the fraction of ballistic trajectories dropped from 30% to below
5% when we imaged at low temperature or in the presence of 40 μM dynasore [23]. Interest-
ingly, we observed a marked increase of the other three motion classes, suggesting that they
take place at the plasma membrane (S9 Fig). When we then took a closer look at the mixed
class of trajectories, we found regions of extended IAV residence time indicating spatial con-
finement alternating with free diffusion (Fig 3C). Consequently, we applied our confinement
PLOS PATHOGENS Plasma membrane nanodomains facilitate influenza virus cell infection
PLOS Pathogens | https://doi.org/10.1371/journal.ppat.1008656 July 8, 2020 6 / 27

analysis to the mixed IAV trajectory class, which revealed areas of pronounced confinement
that did indeed alternate with regions of free diffusion (Fig 3F).
If AF domains of different lateral concentrations coexist in the plasma membrane, as
observed using STORM, these regions could serve as binding platforms for diffusing viruses.
According to our simple diffusion model, the local AF concentration dominates Dconf (see
Methods), which in turn determines the particles dwell time inside the confined regions. To
test in experiments whether Dconf does negatively correlate with the dwell time, we performed
a subtrajectory analysis where each trajectory was screened for confinement according to Iconf.For each confined region, we then extracted the dwell time as well as Dconf (see Methods), find-
ing that they are indeed inversely related as predicted by our diffusion model (Fig 3H). Subtra-
jectory analysis further allowed us to estimate the spatial dimensions of the confined regions
(Fig 3G). We found an average radius of 104 nm corresponding to a median area of 0.057 μm2,
which is only slightly larger than the SNA cluster size found using STORM (Fig 2D). In sum-
mary, the lateral organization of AFs, characterized using STORM, has a predicted effect on
virus mobility, consistent with live-cell IAV tracking data.
EGFR is organized in nanoclusters that non-randomly overlap with SNA
domains
How does IAV-glycan binding translate into cell entry? To study the nanoscale spatial relation-
ship between AFs and functional receptors, we focused on the previously identified IAV
Fig 3. IAV performs a receptor concentration-driven random walk on the plasma membrane. Based on our quantitative analysis of the AF distribution on A549 cells,
we hypothesize a motion behavior that is driven by the local AF concentration. We simulate this behavior initially as a 2D random walk with free diffusion coefficient
Dfree (A). (B) Next, we simulate AF clusters (red circles, r = 100 nm), which would, due to the increased SA concentration, lead to a temporal confinement (Dconf <
Dfree). To identify confined regions within the simulated virus trajectories, we establish a confinement probability Iconf. Accordingly, a free diffusing particle shows only
fluctuation in of Iconf (D), while the addition of temporal confinement leads to a clear increase that overlaps with stationary phases of the particle as visible in the XY
displacement plot (E). We used the confinement probability to analyze experimental virus trajectories in particular the mixed type of trajectories (C) (see also S8 Fig) (C).
Iconf shows a clear signature of temporal confinement (F) similar to the model prediction (E). As a further challenge for our model, we performed a subtrajectory
analysis, thereby extracting the dwell time, Dconf as well as the area of the respective temporal confinement in our virus trajectories. (G) shows an overlay of the
perimeters of the extracted confined regions as well as the average radius (R). From our simulated data, correlation of Dconf with the dwell time shows that a local
increase in AF concentration (i.e. decreased diffusion) due to the encounter of an SA nanodomain leads to an increased local dwell time (H, red markers). We observed a
similar behavior, when we tested the confinement dwell time in experimental virus trajectories (H, black markers).
https://doi.org/10.1371/journal.ppat.1008656.g003
PLOS PATHOGENS Plasma membrane nanodomains facilitate influenza virus cell infection
PLOS Pathogens | https://doi.org/10.1371/journal.ppat.1008656 July 8, 2020 7 / 27

receptor EGFR [9,24]. Initially, we verified that our IAV strain (H3N2/X31) binds to and
depends on EGFR for cell infection in our experimental system. We found that about 20% of
IAVs colocalized with EGFR (S10 Fig), and that efficient infection depended on available
plasma membrane EGFR and could be inhibited by EGFR-specific kinase inhibitors (S1 Fig,
S11 Fig). We then investigated the lateral organization of EGFR in A549 cells using fluores-
cently labelled anti-EGFR antibodies. In our infection experiments, the cells were pre-incu-
bated with serum-free infection medium (30 min) before viruses were added, a common
procedure for influenza virus infection. To reproduce these conditions, we also performed a
serum-free pre-incubation before the cells were fixed and immunolabelled for EGFR.
Using STORM imaging, we found that EGFR is present at much lower concentrations on
the cell surface compared to SA-conjugated AFs, but interestingly, also localized in nanodo-
mains (Fig 4A). Because of the sparsity of EGFR labeling, which might lead to false appearance
of protein clusters due to fluorophore blinking [25], we established an adapted analysis scheme
based on the photophysical characterization of the fluorescent probe used in our experiments
(S12 Fig).
After blink correction and cluster identification, we found that in the absence of EGF stim-
ulation 30–60% of EGFR molecules reside in clusters, which were sensitive to actin- and lipid
raft destabilizing drugs (S11E Fig). The EGFR clusters had an average diameter of 29 nm and
were composed of 6 molecules (Fig 4B), consistent with previous estimates using electron
microcopy [26] and FRET [27]. Since IAVs bind to AFs on the cell surface, we hypothesized
that SNA and EGFR should occupy the same regions on the plasma membrane to enable
IAV-EGFR interactions. To test this hypothesis, we performed two-color STORM imaging
(Fig 4C) using A549 cells co-labeled with SNA and anti-EGFR antibodies. Indeed, we found
that EGFR clusters overlap with SNA-labeled membrane domains. However, since sialylated
AFs are much more abundant than EGFRs, their colocalization could occur simply by chance.
To examine this possibility, we analyzed our data using coordinate-based colocalization (CBC)
[28], which estimates the spatial correlation of two localization datasets (i.e. co-clustering),
reflected in the colocalization parameter CA. To contextualize the extent of colocalization in
our SNA/EGFR dataset, we performed a positive control experiment using SNA conjugated
with two different fluorophores (denoted SNA/SNA). As a negative control and to take differ-
ences in molecule density into account, for each two-color field of view in SNA/EGFR, we sim-
ulated a random dataset at the same density (denoted SNA/random). Finally, we define
localizations with CA>0.3 as colocalized (annotated CA>0.3 below) (S13 Fig). As shown in Fig
4D, the negative control SNA/random reaches CA>0.3 = 0.035, a baseline level only accounting
for random colocalization, while the experimental positive control SNA/SNA reaches a much
higher value, CA>0.3 = 0.27. CBC analysis of SNA/EGFR colocalization reached an intermedi-
ate value, CA>0.3 = 0.17. These analyses reveal that the spatial overlap between EGFR and SNA
is not complete and yet also not random, indicating that both molecules share a common pop-
ulation of membrane compartments.
When an infecting IAV encounters an EGFR cluster, we would expect EGFR to become
activated. Thus, we wanted to measure the cell’s EGFR response to IAV stimulation. Notably,
in order to keep the signal at the plasma membrane, endocytosis was slowed down by stimulat-
ing the cells on ice. We used an antibody that recognizes a phosphorylated tyrosine (Y1068,
pEGFR) previously shown to be involved in IAV-induced EGFR activation [9]. Interestingly,
we found a fraction of pEGFR in nanodomains even under unstimulated conditions indicating
pre- and/or self-activation. Following stimulation with either EGF or IAV, we observed an
increased number of pEGFR clusters per area on the plasma membrane (Fig 5E). Similar to
IAV-induced EGFR stimulation, the increase in local cluster density was sensitive to EGFR
kinase inhibition (S14A and S14B Fig).
PLOS PATHOGENS Plasma membrane nanodomains facilitate influenza virus cell infection
PLOS Pathogens | https://doi.org/10.1371/journal.ppat.1008656 July 8, 2020 8 / 27

To better understand how IAV binding leads to EGFR activation, we examined the proper-
ties of individual EGFR clusters. It was previously hypothesized that IAV binding leads to a
local concentration increase in EGFR proteins within plasma membrane clusters eventually
Fig 4. EGFR is organized in nanodomains that overlap with SNA domains. (A) A549 cells were labelled with
antibodies against EGFR. STORM imaging revealed a clustered organization of EGFR. The clusters have an average
diameter of 60 nm and contain about 5–10 molecules (B). Scale bar 1 μm. Inset: 100 nm. (C) Two-color STORM
imaging of A549 cells labelled with SNA and anti-EGFR antibodies. The two panels on the right show larger
magnification of the boxed areas in the left panel. Scale bars: 500 nm (left panel), 200 nm (right panel). The degree of
colocalization was quantified using coordinate-based colocalization, where each localization is associated with a
colocalization value CA. (D) Box plots of CA distribution of SNA localizations when colocalized with (1) SNA, (2) a
random distribution of localizations at equal density as EGFR and (3) EGFR. After IAV-stimulation (MOI~100), we
found that phosphorylated EGFR (Y1068) is also localized in nanodomains. Although a small population of clusters
seems to be phosphorylated without stimulus, we observed an increase in the activated cluster population after
stimulation with IAV (MOI~100) or EGF (100 ng/ml) (E, lower panel). To test for a potential redistribution of EGFR,
we looked at the entire population after stimulation. While after EGF stimulation, we could observe a reduction of the
clustered protein fraction as well as the cluster density per area, we could not detect such a protein redistribution after
IAV stimulation (F).
https://doi.org/10.1371/journal.ppat.1008656.g004
PLOS PATHOGENS Plasma membrane nanodomains facilitate influenza virus cell infection
PLOS Pathogens | https://doi.org/10.1371/journal.ppat.1008656 July 8, 2020 9 / 27

leading to signal activation [9], an effect that was also observed before in BHK cells upon EGF
stimulation [29]. To test this hypothesis, we labeled unstimulated, EGF- or IAV-stimulated
cells using anti-EGFR antibodies. After EGF stimulation, we observed a decrease in the clus-
tered molecule population as well as the number of clusters per area (both by on average 20%)
(Fig 4F). Surprisingly, we did not find evidence for a significant redistribution of EGFR after
IAV stimulation (Fig 4F). In addition, although we observed IAV colocalized with EGFR and
pEGFR (S10 Fig), we could not detect an effect on the cluster size or the number of molecules
per EGFR cluster (S14C Fig).
EGFR forms long-lived nanodomains in living cells
Since IAV stimulation did not affect EGFR organization, we hypothesized that pre-formed
nanoclusters might be involved in IAV-induced EGFR activation. While IAV engagement of
pre-formed EGFR clusters was previously hypothesized [30], it remained unclear whether
EGFR cluster lifetimes in the plasma membrane would be long enough to allow this type of
interaction. To estimate the lifetime of EGFR clusters, we turned to live-cell microscopy exper-
iments using A549 cells expressing EGFR tagged with the photo-convertible protein mEos3.2
[31]. We used an EGFR variant that was previously shown to be fully functional in a mamma-
lian cell expression system [32]. Photoactivation of only a small subset of EGFR-mEos3.2 mol-
ecules allowed us to localize individual molecules which can then be tracked over consecutive
frames, and renewed by further photoactivation (single-particle tracking, sptPALM) [33]. We
performed sptPALM on the dorsal as well as the ventral plasma membrane of live A549 cells in
the absence of EGF, resulting in high-density protein diffusion mapping (Fig 5). Calculation of
the mean-squared displacement (MSD) as a function of the lag time Δt allowed us to deter-
mine the instantaneous diffusion coefficient D along the trajectory. We found a broad range of
diffusion coefficients ranging between 1 and 10−3 μm2/sec (S15 Fig), indicating that mobile
and immobile protein fractions coexist in the plasma membrane. Indeed, after classifying tra-
jectories based on their diffusion coefficient D, MSD vs. Δt plots revealed a rather linear rela-
tionship for trajectories with D> 0.05 μm2/sec, while for trajectories with D< 0.05 μm2/sec
the curve approached a maximum at large Δt values (S15 Fig). This characteristic time depen-
dence of the MSD vs. Δt curve also indicates mobile freely diffusing proteins co-existing with
confined or immobile EGFR proteins in the plasma membrane.
The same data was then used to construct a map of all detected localizations, which revealed
a non-homogeneous distribution with proteins clustered into nanodomains (Fig 5A). Using
our custom cluster identification analysis (as shown in Fig 2A–2C), we found EGFR clusters
with diameters ranging between 30 and 300 nm, confirming the organization of EGFR
observed in fixed cells (Fig 4A). In addition, and because the cells were alive, we could use the
time-resolved single molecule detection to quantify the temporal stability of EGFR clusters
(Fig 5B). Such an approach was used previously to quantify polymerase 2 clustering in live
cells and is referred to as time-correlated PALM (tcPALM) [34]. We selected regions identified
by density-based clustering to perform tcPALM (Fig 5B and 5C), and obtained a distribution
of EGFR cluster lifetimes with an average of 140 seconds (Fig 5D, dorsal). Notably, this lifetime
only provides a lower estimate since the cluster might have existed before starting the acquisi-
tion and might also be present after the last cluster molecule was photobleached.
Discussion
Understanding the initial phase of virus infection is crucial for the development of effective
countermeasures such as adhesion inhibitors that catch viral particles before they can engage
in the first virus-cell contact [35,36]. After binding sialylated AFs on the cell surface, IAV must
PLOS PATHOGENS Plasma membrane nanodomains facilitate influenza virus cell infection
PLOS Pathogens | https://doi.org/10.1371/journal.ppat.1008656 July 8, 2020 10 / 27

find and activate a functional receptor to enter and infect its target cell. While these two steps
are crucial for IAV infection, it remained largely speculative how the virus manages to form a
multivalent cell contact while retaining flexibility to explore the plasma membrane and engage
with a functional receptor. Here we used super-resolution microscopy to study the organiza-
tion of virus-interacting molecules at the scale of the virus-cell interface. We found that glycan
AFs and receptors are organized in nanoscale domains and provide a model for how cell bind-
ing can translate into receptor engagement and activation. Our findings are summarized sche-
matically in Fig 6.
From the illustration it becomes clear that microvilli are a dominant topographical feature
of the dorsal side of the cell. However, due to their diameter, they are not involved in virus
endocytosis. We thus concentrated our efforts on analyzing the area between the microvilli
and could identify a population of differently sized AF nanodomains. Our virus-binding simu-
lations indicated that such a clustered organization of AFs is advantageous and positively cor-
relates with the efficiency of virus binding (S7 Fig). A heterogeneous cluster organization
might thereby broaden the binding capability of the cell surface and effectively provide the
virus particle with a range of binding times to explore the cell surface as it was suggested before
for Dendritic Cell-Specific Intercellular adhesion molecule-3-Grabbing Non-integrin
Fig 5. Live-cell super-resolution imaging reveals long-lived EGFR clusters in A549 cells. EGFR coupled to the
photo-convertible protein mEos3 was expressed in A549 cells. Subsequent PALM imaging allows to study EGFR
distribution in live cells at the single protein level. In the absence of any stimulus, we could detect nanodomains of
EGFR within the dorsal and also the ventral plasma membrane (A). Scale bar: left panel, 1 μm. The image in A shows a
maximum projected map of single molecule localizations recorded over a period of 10 min. B shows two cluster
examples as a cumulative density distribution (upper panel) as well as XY scatter with the colorscale according to time
at which the localization was detected (lower panel). While the projection of all localization allows to identify protein
clusters, we can use the time information to further estimate the cluster lifetime. As shown in C, cumulative counting
of individual localizations within a clustered region gives direct information of the minimum cluster lifetime. D shows
the corresponding lifetime distribution of EGFR clusters recorded at the dorsal as well as the ventral side of the cell in
the absence of any stimulus.
https://doi.org/10.1371/journal.ppat.1008656.g005
PLOS PATHOGENS Plasma membrane nanodomains facilitate influenza virus cell infection
PLOS Pathogens | https://doi.org/10.1371/journal.ppat.1008656 July 8, 2020 11 / 27
(DC-SIGN) [37]. Such a binding mode could be particularly relevant for influenza viruses,
which have a large morphological variability and a spike protein with strain-dependent affinity
and specificity.
Single-virus tracking of fluorescently-labeled IAVs on and inside target cells [5–7] revealed
that after forming the initial cell contact, IAV particles explore the plasma membrane for on
average 6 minutes before endocytosis [6]. More recently, multicolor imaging of IAVs together
with clathrin showed that this period is important for the induction of clathrin-dependent
endocytosis [7]. We performed single-virus tracking under conditions of limited endocytosis
to restrict virus motion to the plasma membrane. We mostly found trajectories where random
diffusion alternates with periods of spatial confinement. The estimated sizes of the confined
regions was consistent with the area found for AF nanodomains using STORM. This result is
in agreement with our basic hypothesis that virus plasma membrane motion is largely influ-
enced by the local organization and density of available AFs. Although we cannot exclude that
IAV confinement is induced by other factors such as mechanical trapping, our results allow a
model to be formulated of how the clustered organization of AFs controls virus-cell binding
early during infection.
Having formed a stable interaction with its host cell, IAVs enter the cell by endocytosis.
EGFR was shown to be activated during and promote IAV-cell entry [9], but how IAV engages
with EGFR remained unclear. We found that EGFR localizes in clusters which colocalize with
AF nanodomains. Regarding our results and those of others (reviewed recently in [38]),
the current view of the plasma membrane suggests a compartmentalization into highly
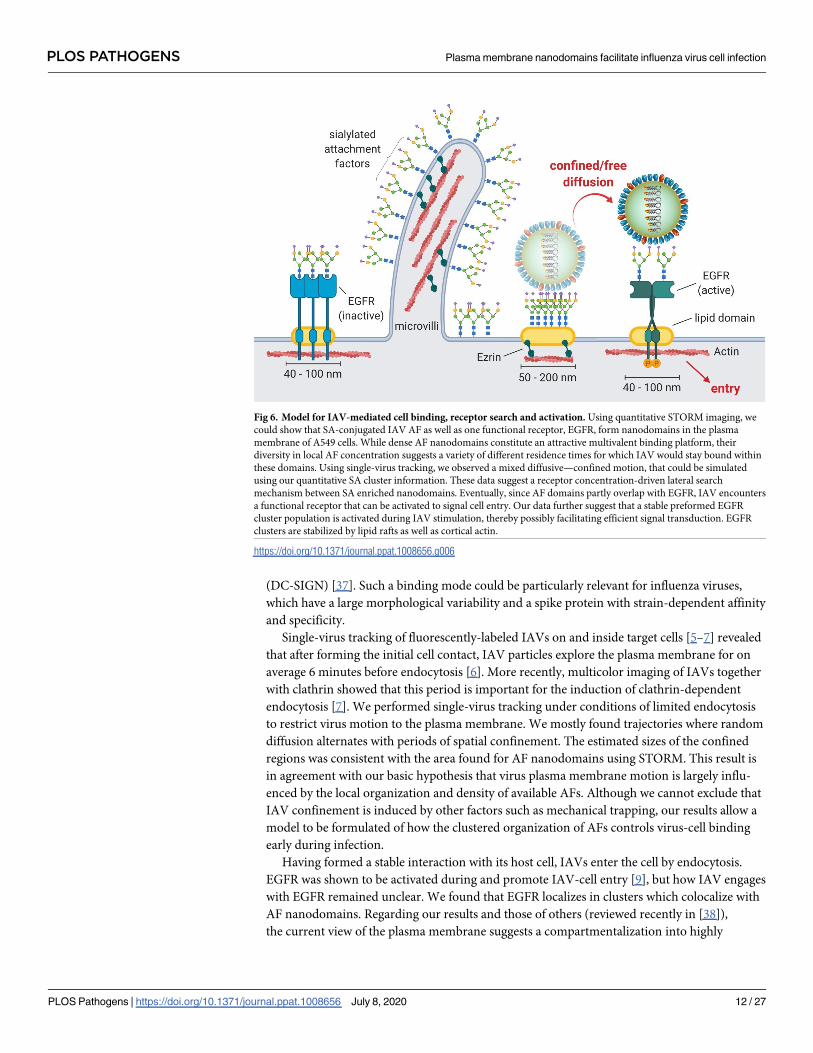
Fig 6. Model for IAV-mediated cell binding, receptor search and activation. Using quantitative STORM imaging, we
could show that SA-conjugated IAV AF as well as one functional receptor, EGFR, form nanodomains in the plasma
membrane of A549 cells. While dense AF nanodomains constitute an attractive multivalent binding platform, their
diversity in local AF concentration suggests a variety of different residence times for which IAV would stay bound within
these domains. Using single-virus tracking, we observed a mixed diffusive—confined motion, that could be simulated
using our quantitative SA cluster information. These data suggest a receptor concentration-driven lateral search
mechanism between SA enriched nanodomains. Eventually, since AF domains partly overlap with EGFR, IAV encounters
a functional receptor that can be activated to signal cell entry. Our data further suggest that a stable preformed EGFR
cluster population is activated during IAV stimulation, thereby possibly facilitating efficient signal transduction. EGFR
clusters are stabilized by lipid rafts as well as cortical actin.
https://doi.org/10.1371/journal.ppat.1008656.g006
PLOS PATHOGENS Plasma membrane nanodomains facilitate influenza virus cell infection
PLOS Pathogens | https://doi.org/10.1371/journal.ppat.1008656 July 8, 2020 12 / 27
heterogeneous nanodomains with different origin and function. Colocalization at the nano-
scale is thus measured as spatial proximity or co-clustering. The observed overlap between
IAV AF and receptor clusters thus suggests that the lateral organization of AFs and EGFR
underlies similar but not identical principles. Importantly the observed organization would
indeed allow IAV to bind EGFR while moving in and between AFs domains (Fig 6).
In the canonical activation model, EGFR binds its substrate EGF, undergoes dimerization
and subsequent autophosphorylation, thereby inducing a variety of signaling cascades [39].
However, as shown here on A549 cells, an additional level of higher oligomeric EGFR clusters
has been shown across different cell types. Their reported diameter ranges from 50 nm [29]
over 100–300 nm [26,30,40] up to near micrometer sizes [41], with molecule numbers between
<10 [42] up to thousands [41]. Clustering was suggested to facilitate receptor activation which
might play a role in tumor development [30]. Further, the EGFR cluster size was shown to
respond to activation [29] suggesting a lateral molecule redistribution. With respect to the clus-
tered EGFR organization, we hypothesized two scenarios in which, during activation, EGFR
either (1) assembles into activated clusters or (2) pre-existing clusters become activated. Hence,
we tested the organization of EGFR under (un)stimulated conditions. While we observed a
reduction of the clustered molecule fraction as well as the number of clusters per area upon
EGF stimulation, an effect that was observed previously for Erb2 [43], we did not detect a major
redistribution in response to IAV attachment. This result speaks for the activation of pre-exist-
ing clusters and might also indicate a different activation mechanism. EGFR binds EGF with
high affinity (nM), leading to fast EGFR activation (within 10 min [44]) and internalization.
IAV binds EGFR using sialylated glycans, a low affinity process that requires some degree of
multivalency. Our colocalization experiments showed that IAVs also bind multiple EGFR clus-
ters (S10 Fig) indicating a different recruitment/activation mechanism. How IAV then eventu-
ally activates EGFR is still unclear and will be the objective of future investigation. What has
been shown previously is that IAV-induced EGFR endocytosis is indeed slower compared to
the EGF-induced activation, presumably due to the different mechanism of binding and activa-
tion [9]. Using STORM, we could not detect a change in cluster size and molecule composition
following either stimulation. We hence conclude that intercluster spatial rearrangements below
our resolution limit might eventually lead to cluster activation. Methods that are more sensitive
to protein-protein distances below 20 nm such as FRET could be used to test this hypothesis.
Following our hypothesis of the activation of pre-formed EGFR clusters, we aimed to test if
EGFR clusters exist long enough to allow their activation. We thus went on to probe the stabil-
ity of EGFR nanoclusters by conducting live-cell sptPALM experiments. We found that the
lifetime of EGFR nanodomains in both, the dorsal as well as the ventral side of the cell went up
to 2 to 4 minutes. This time resembles the duration IAVs where shown to stay on the plasma
membrane before onset of endocytosis (2–3 min [7]). While a long cluster lifetime would
allow activation of pre-existing clusters, this observation raises the question for the stabiliza-
tion of EGFR clusters. Hence, we tested the stability of EGFR clusters upon treatment with
classical membrane domain-destabilizing conditions such as actin depolymerization (latrun-
culin A) and cholesterol extraction (methyl-β-cyclodextrin). As also observed before [29,30],
our results suggest cluster destabilization following both perturbations indicated by an
increased fraction of unclustered EGFR molecules. Interestingly, we found a stronger effect
after cholesterol depletion, a condition that was previously shown to attenuate IAV replication
[9]. Very long receptor cluster lifetimes were observed previously for class I major histocom-
patibility complex (MHC) molecules, that form actin-stabilized domains [45,46]. At this point,
we can only speculate about the function of membrane receptor clusters [38,47]. It can be
excitatory as shown for T-cell receptor [48] and linker for activation of T-cell (Lat) [49,50] as
well as LFA-1 [51] or CD36 [52]. These nanodomains render the cell highly sensitive to small
PLOS PATHOGENS Plasma membrane nanodomains facilitate influenza virus cell infection
PLOS Pathogens | https://doi.org/10.1371/journal.ppat.1008656 July 8, 2020 13 / 27

amounts of signaling molecules and due to the high local receptor concentration allow a fast
signaling response [39]. Such a function seems likely for EGFR clusters involved in IAV cell
entry observed in our study. But their function can also be inhibitory as shown for the B-cell
receptor [53] or its negative co-receptor CD22 [54]. Receptor nanodomains could even engage
in modulating the signaling output. As EGFR sits at the top of a broad array of signaling cas-
cades, an asymmetric distribution of receptors could enable cells to rapidly respond and pro-
cess different stimuli [39].
In summary, we identified a complex compartmentalization of the cellular plasma mem-
brane in A549 cells with both of the primary IAV-binding molecules, sialylated AFs and func-
tional receptors, organized in nanodomains. Such an organization was observed for other
membrane proteins and might indicate a general organization principle of the plasma mem-
brane (reviewed in [38]). We developed a functional model to link the lateral membrane orga-
nization to its role in virus infection (Fig 6). Quantitative super-resolution microscopy has
provided a versatile toolbox to study the structure-function relationship of the plasma mem-
brane. Our study provides a first step in understanding the nanophysiology of virus infection.
By relating organization to function within the virus-cell interface, our goal is to better under-
stand how viruses use cellular structures. How membrane compartmentalization can modulate
IAV cell and receptor binding as shown here will be complemented with functional studies
investigating the involved signal activation in the future.
Materials and methods
Ethics statement
Work with embryonated chicken eggs was conducted in the lab of Prof. Andreas Herrmann
(Institute for Biology, Humbold-Universitat zu Berlin, Germany) in accordance with European
regulations and approved by the Berlin state authority, Landesamt fur Gesundheit und Soziales.
Influenza A (H3N2) X-31 was propagated in the allantoic cavities of 10-day old embryonated
chicken eggs (Lohmann Tierzucht GmbH, Germany) as described previously [55].
Cells and viruses
A549 cells (ATCC CCL-185) were kindly provided by Dr. Thorsten Wolff (Robert-Koch Insti-
tute Berlin, Germany). A549 cells were cultured in Dulbeccos Modified Eagles Medium
(DMEM), supplemented with 10% fetal calf serum (FCS). The cells were passaged every 3–4
days. The cells were not polarized. We refer to the dorsal and ventral membrane as the upper
cell surface as well as the part of the cell attached to the substrate. One day prior to the experi-
ment, the cells were detached from the cell culture flask using 0.5% Trypsin/EDTA for about
10 min. The cells were diluted in fresh DMEM and 3�105 cells were seeded on fibronectin-
coated 25 mm round glass slides (Menzel, # 1.5). Influenza A (H3N2) X-31 was propagated in
the allantoic cavities of 10-day old chicken eggs (Lohmann Tierzucht GmbH, Germany) as
described previously [55]. Purified viruses were stored at -80˚C. Virus aliquots were thawed
on the day of the experiment and kept on ice until further use. All chemicals if not otherwise
stated where purchased from Sigma-Aldrich. Cell culture media were purchased from Life
Technologies. For the NA treatment, we use the Neuraminidase from Clostridium Perfringens(Sigma) which cleaves α2,6 and α2,3 linked SA.
A549 cell infection
One day prior to the experiment, 3�105 cells were seeded on fibronectin-coated 25 mm round
glass slides. For infection experiments (S1 Fig), the cells where either incubated in serum-free
PLOS PATHOGENS Plasma membrane nanodomains facilitate influenza virus cell infection
PLOS Pathogens | https://doi.org/10.1371/journal.ppat.1008656 July 8, 2020 14 / 27
medium for 30 min (control) or in DMEM supplemented with 100 ng/ml human EGF (R&D
Systems) for 90 min to remove EGFR from the cell surface. Cells were infected with IAV X-31
(MOI ~1) in infection medium (DMEM, 0.2% bovine serum albumine (BSA)) for 30 min
before the medium was changed and the cells were further incubated for 8 h in infection
medium. The cells were washed in pre-warmed PBS and fixed in freshly prepared 4% PFA
(Alpha Aesar) for 10 min at room temperature. We controlled that our fixation protocol could
successfully immobilize plasma membrane molecules in A549 cells (S2 Fig, S16 Fig). After a 25
min fixation/blocking step in PBS supplemented with 0.2% Triton X-100 and 0.2% BSA, the
cells were incubated with the primary antibody (anti influenza nucleoprotein (NP), Millipore)
for 1 h. The cells were washed three times 10 min in PBS before further incubated with second-
ary antibodies (goat anti-mouse, Alexa 555 conjugate, Life Technologies) for 1 h. Finally, the
cells were washed in PBS, stained with DAPI (0,2 μg/ml in PBS for 10 min) and mounted on
standard microscope slides with Mowiol (Carl Roth). The slides where imaged using a Zeiss
Axioplan epifluorescence microscope. Ten overview images (20 x magnification) were
acquired for each condition and nuclear NP signal was quantified using Cellprofiler [56]. For
the colocalization (S10 Fig) and cell stimulation experiments (Fig 4, S1A Fig, S14 Fig), the cells
were infected at MOI = 100. For more details on the establishment of the experimental system,
please see S1 Text.
A549 cell transfection
One day prior to transfection, 2�105 cells were seeded on fibronectin-coated 25 mm round
glass slides. The cells were transfected with plasmids encoding EGFR-mEos3.2 using Lipofec-
tamine 2000 (Life Technologies) according to the manufacturers guidelines. EGFR-mEos3.2
was cloned from EGFR-GFP, a gift from Alexander Sorkin (Addgene plasmid # 32751). Using
our transfection protocol, we tested the EGFR clustering at different expression levels. We
observed that the cluster density per area, but not the cluster size was dependent on the expres-
sion level (S16 Fig).
Single-virus tracking
IAV H3N2/X-31 were incubated with 50 μM of the lipid dye DiD (Life Technologies) for 2h at
RT. To remove the free dye, viruses were either pelleted (50.000 g for 5 min) or purified using
a NAP5 size exclusion column (GE Healthcare). DiD-labelled viruses were diluted in infection
medium (DMEM, 0.2% BSA) to a final concentration of 20 μg/ml (protein content) and viral
aggregates were removed using a 0.2 μm sterile filter. Labeled viruses were added to A549 cells
grown in 35 mm poly-L-lysine coated glass bottom petri dishes (MatTek Corp.) and allowed
to attach on ice for 10 min. The cells were washed with PBS and overlaid with 2 ml pre-
warmed, serum and phenol red-free DMEM supplemented with 100 mM Hepes. Unless other-
wise stated, the cells were kept either at 4 or 37 deg throughout the experiment. For the pertur-
bation experiments, the cells were pre-incubated in DMEM supplemented with 50 μM
nocodazole (Sigma) or 40 μM dynasore (Sigma) for 30 min. The drugs were kept present
throughout the experiment. Low temperature incubation was achieved using a custom build
microscope temperature chamber. DiD was excited with 633 nm laser light, which was
reflected on the sample by a 488/633 nm dichroic mirror. Emission light was collected using a
60x PlanApo VC oil-immersion objective (Nikon) and imaged onto an EMCCD camera
(Andor iXon, Andor Technology). Images were recorded at 2 frames per second for 10 min.
Image stacks were processed and the trajectories were build using ParticleTracker for ImageJ
[57]. The trajectories were further analyzed using custom MatLab (Mathworks) scripts. To
identify and characterize temporal particle confinement, we used the method developed by
PLOS PATHOGENS Plasma membrane nanodomains facilitate influenza virus cell infection
PLOS Pathogens | https://doi.org/10.1371/journal.ppat.1008656 July 8, 2020 15 / 27

Simson et al. [22] implemented into our custom analysis pipeline. Briefly, the algorithm takes
a segment of the trajectory and determines if the particle moved according to a given free dif-
fusion coefficient (Dfree) within the segment, i.e. if the particles stays in a predicted region.
This is translated into a confinement probability Iconf. Since the identification depends on the
length of the segment S [22], we optimized S using simulated trajectories resulting in S = 5 s
for our analysis.
Trajectory analysis and single particle tracking simulations
Random brownian particle trajectories were generated using the script package msdanalzer[58] incorporated into a custom MatLab routine. Single virus trajectories were analyzed as
described above. Trajectory and sub-trajectory analysis was performed using msdanalzer to
retrieve diffusion coefficients from mean square displacement (MSD, <r2>) vs. lag-time (Δt)
plots. MSD vs. lag-time plots were fitted according to the type of motional behavior, which
was either free diffusion (<r2> = 4DfreeΔt) or, for sub-trajectory analysis, confined (sub)diffu-
sion (<r2> =<r2> (1-A1exp (−4A2DconfΔt/<r2>)). We found for IAV a mean free diffusion
coefficient Dfree = 0.041 μm2/s.
Using Dfree as well as a time step (Δt = 0.5 s), the displacement of a freely diffusing particle
follows a Gaussian distribution with standard deviation given by σ = sqrt(4DfreeΔt). Temporal
confinement was introduced by generating a sub-trajectory using Dconf. For the dwell time
simulation, we generated random trajectories that run into a confinement region characterized
by Dconf with a diameter of 50–300 nm according to the size of SNA clusters from STORM
measurements (S1 Movie). Confined regions were identified using the confinement probabil-
ity Iconf and the time the particle spends confined with Iconf > threshold was taken as the dwell
time. Dconf was varied as shown in Fig 2.
Preparation of labelled lectins and antibodies
Unconjugated Sambuccus nigra agglutinin (SNA, VectorLabs) or anti-EGFR antibodies
(Sigma) were diluted to 0.6 mg/ml in 100 μl PBS (supplemented with 50 mM NaHCO3). Alexa-
Fluor 647 NHS ester (Life Technologies) or Star Red NHS ester (Abberior) was added at a final
concentration of (150 μM) and the solution was incubated for 30 min at room temperature.
100 μl PBS were added and the solution was applied to a NAP5 size exclusion column (GE
Healthcare) pre-equilibrated with PBS. 300 μl fractions were collected in a 96-well plate and
analyzed by ultraviolet—visible spectroscopy (Nanodrop2000, ThermoFisher). Peak protein
fractions were collected and the degree of labelling calculated. The labelled lectin and antibody
fractions were stored at 4˚C until further use.
SMLM sample preparation
One day prior to the experiment, 3�105 A549 cells were seeded on fibronectin-coated 25 mm
round glass slides. For SNA imaging, the cells were washed in pre-warmed PBS and fixed for
10 min in freshly prepared 4% paraformaldehyde (Alpha Aesar). The cells were blocked in
blocking solution (5% BSA in PBS) and incubated in 50 μg/ml SNA diluted in blocking buffer
for 30 min. The cells were washed 3 times in PBS and post-fixed in freshly prepared 4% para-
formaldehyde for 10 min at RT. For EGFR labelling, the cells were washes, fixed and blocked
as described above then incubated with anti-EGFR primary antibodies conjugated to Alexa
647. For two-color imaging, the cells were incubated with unconjugated primary anti-EGFR
antibodies for 1h at RT. The cells were washed three times in PBS and further incubated with a
solution of 5 μg/ml Alexa 750-conjugated secondary antibodies (goat anti-mouse, Life Tech-
nologies) and 5 μg/ml Alexa 647-conjugated SNA. The cells were washed 3 times in PBS and
PLOS PATHOGENS Plasma membrane nanodomains facilitate influenza virus cell infection
PLOS Pathogens | https://doi.org/10.1371/journal.ppat.1008656 July 8, 2020 16 / 27

post-fixed in freshly prepared 4% paraformaldehyde for 10 min at RT. A549 cells in Fig 1B
were labelled with 10 ng/ml SNA-Alexa647 and 1μg/ml Hoechst33342 (Life Technologies) in
DMEM.
SMLM microscopy
EGFR single- and two-color STORM imaging were performed using a recently developed flat-
field epi illumination microscope [59]. Briefly, two lasers with wavelengths of 642 nm
(2RU-VFL-P-2000-642-B1R, MPB Communications) and 750 nm (2RU-VFL-P-500-750-B1R,
MPB Communications) were used to switch off fluorophores on the sample, while a 405 nm
laser (OBIS, Coherent) controlled the return rate of the fluorophores to the fluorescence-emit-
ting state. A custom dichroic (ZT405/561/642/750/850rpc, Chroma) reflected the laser light
and transmitted fluorescence emission before and after passing through the objective (CFI60
PlanApo Lambda Å~60/NA 1.4, Nikon). After passing the respective filter (ET700/75M,
Chroma or ET810/90m, Chroma), emitted light from the sample was imaged onto the sCMOS
camera (Zyla 4.2, Andor). Axial sample position was controlled using the pgFocus open hard-
ware autofocus module (http://big.umassmed.edu/wiki/index.php/PgFocus). Typically, 20,000
frames at 10 ms exposure time were recorded using Micromanager[60]. Imaging was per-
formed using an optimized STORM buffer as described previously[61]. Image stacks were ana-
lyzed using a custom CMOS-adapted analysis routine[62]. Lateral sample drift was corrected
using either image correlation (Thunderstorm[63]) or gold fiducial markers (B-Store, https://
github.com/kmdouglass/bstore). Two-color datasets were analyzed using LAMA[64]. Random
datasets for CBC analysis were generated in MatLab.
SNA single color imaging was performed on a modified Olympus IX71 inverted micro-
scope. A 641 nm laser (Coherent, CUBE 640-100C) and a 405 nm laser (Coherent, CUBE 405-
100C) was reflected by a multiband dichroic (89100 bs, Chroma) on the back aperture of a
100x 1.3 NA oil objective (Olympus, UplanFL) mounted on a piezo objective scanner (P-725
PIFOC, Physik Instrumente). The collected fluorescence was filtered using a band-pass emis-
sion filter (ET700/75, Chroma) and imaged onto an EMCCD camera (IxonEM+, Andor) with
a 100 nm pixel size and using the conventional CCD amplifier at a frame rate of 25 fps. Laser
intensity on the sample measured after the objective was 2–4 kW/cm2. 20,000 frames at 30 ms
exposure time were recorded using Micromanager[60]. Image stacks were analyzed using
ThunderStorm[63]. Lateral sample drift was corrected using either image correlation (Thun-
derstorm[63]) or gold fiducial markers (PeakSelektor, IDL, courtesy of Harald Hess).
PALM imaging was performed on a Zeiss Axio Observer D1 inverted microscope, equipped
with a 100x, 1.49 NA objective (Zeiss). Activation and excitation lasers with wavelengths 405
nm (Coherent cube) and 561 nm (Crystal laser) illuminated the sample in total internal fluo-
rescence (TIRF) mode. We used a four color dichroic 89100bs (Chroma), fluorescence emis-
sion was filtered with an emission filter ET605/70 (Chroma) and detected with an electron-
multiplying CCD camera (iXon+, Andor Technology) with a resulting pixel size of 160nm.
For each region of interest, typically 10000 images of a 41x41 μm2 area were collected with an
exposure time of 30 ms. Photoactivatable proteins were activated with 405 nm laser
intensity < 0.5 W/cm2, chosen to maintain a sparse population of activated molecules for
localization, and excited with 561 nm laser intensity of ~1 kW/cm2. Image stacks were ana-
lyzed using ThunderStorm[63].
STED microscopy
Live cell STED measurements were done with Abberior STED microscope (Abberior Instru-
ments, Germany) as previously described in [65,66]. The microscope is equipped with a
PLOS PATHOGENS Plasma membrane nanodomains facilitate influenza virus cell infection
PLOS Pathogens | https://doi.org/10.1371/journal.ppat.1008656 July 8, 2020 17 / 27

titanium-sapphire STED laser (MaiTai HP, Spectra-Newport). The labelled Abberior Star
Red- labelled SNA was excited using 640 nm pulsed diode laser (Picoquant, Germany) with an
average excitation power of 5–10 μW at the objective (UPlanSApo 100x/1.4 oil, Olympus).
Depletion was achieved using tunable pulsed laser at 780 nm. The microscope was operated
using Abberior’s Imspector software. Fixed-cell STED measurements (S3 Fig) were performed
on a Leica SP8 STED microscope. The microscope was equipped with a HC PL APO 100x
objective, a white light laser for excitation and a 592 nm depletion laser.
Cluster analysis
For the cluster analysis, we used the algorithm density-based spatial clustering applications
with noise (DBSCAN)[67], which was embedded into our custom analysis MatLab routine.
DBSCAN only needs two input parameters, Eps and k. It then counts for each localization,
how many neighbor localization are within a circle of radius Eps. If the localization has kneighbors within Eps, it is classified as part of a cluster. If it does not have enough neighbors
within Eps, but is itself a neighbor of a cluster localization, it is classified as an edge point. All
remaining localization are classified as unclustered. In order to analyze the very dense and het-
erogeneous localization maps we obtained from SNA imaging, we performed two consecutive
DBSCAN runs with different parameters for Eps and k. Only this allowed us to account for all
visually visible clusters. Clustered and edge points are then combined and handed over to the
single cluster analysis part of the analysis routine. For each cluster, we examined a set of
parameters such as area and mean diameter as well as the number of localizations per cluster.
We further analyzed the localization density distribution per cluster by performing a nearest-
neighbor search using a search radius of 20 nm. All localization processing was performed
using custom written MatLab (MathWorks) scripts.
Single molecule calibration
In order to measure the localization precision of our system and calibrate the grouping param-
eters, we performed STORM imaging on isolated dye molecules. 25 mm round glass slides
(Menzel, # 1.5) were plasma cleaned for 10 min and coated with poly-L-lysine solution
(100 μg/ml in ddH2O) for 1 h at room temperature. After washing in ddH2O, the slides were
dried and incubated with 10–50 pM dye-conjugated SNA or anti-EGFR antibodies respec-
tively. After 15 min, the slides were washed once and then imaged under experimental condi-
tions. Localization maps were filtered and drift-corrected using gold fiducials. Individual
localizations were first grouped with gap = 0 and search radius 30 nm, to merge individual
blink events, then grouped again with a gap time equal to the total acquisition time (15k
frames). This allows to quantify the spread of localizations along x and y Δ(x,y) (i.e. the locali-
zation precision σ) as well as the time between individual blink events (i.e. the dark time tD).
All localization processing was performed using custom written MatLab (MathWorks) scripts.
Virus binding simulations
We simulated a flat patch of cell surface (1x1 μm2) including n attachment factor molecules at
random positions. For the analysis of the degree of clustering (S7B Fig), the simulated mole-
cules were gradually shifted into clusters, while n was kept constant. To analyze the impact of
the cluster size (i.e. the number of receptors per cluster), we simulated a constant concentra-
tion of attachment factor molecules and added receptor clusters at the indicated size (S7A Fig).
A virus attempting to attach was simulated as s two-dimensional projection of a spherical 100
nm virus particle. The virus center was randomly placed onto the simulated surface and the
number of attachment factor molecules within a radius of 50 nm was counted. More than 10
PLOS PATHOGENS Plasma membrane nanodomains facilitate influenza virus cell infection
PLOS Pathogens | https://doi.org/10.1371/journal.ppat.1008656 July 8, 2020 18 / 27

molecules were counted as successful binding. Matlab scripts to run the simulation are avail-
able at GitHub (https://github.com/christian-7/Virus_Binding_Simulation).
Supporting information
S1 Text. Establishment of the experimental system.
(DOCX)
S1 Fig. Establishment of the experimental system. We first tested if our experimental system
(virus and cells) is suitable for the intended experiments. Virus binding was tested at high
MOI after low-temperature adsorption followed by immunostaining using anti-H3N2 antise-
rum. We found that our IAV strain could efficiently bind to A549 cells at high MOI (~100)
(A). Individual cells are highlighted (dashed lines). IAV infection was performed at lower
MOI (~1) to achieve a high contrast infection and avoid overinfection. Following infection,
the cells were incubated for 8h, then fixed and immunostained using anti-NP antibodies. The
infection was quantified as nuclear NP accumulation and analyzed using CellProfiler [56]
(NP/DAPI ratio) (B). We found that our influenza A H3N2/X31 virus could efficiently infect
A549 cells at a titer of 8.3�105 focus forming units (FFU) per ml. A549 cells were either treated
with 100 ng/ml EGF for 30 min to reduce the concentration of available cell surface EGF
receptors or 0.01U/ml neuraminidase for 3h at 37˚C. Cells were infected with influenza A/X31
(MOI ~ 1) for 8h then fixed and immunolabelled for newly produced viral nucleoprotein (NP)
(D). The cell nuclei were counterstained with DAPI. Nuclear NP signal was quantified using
automated image analysis with CellProfiler (E, F).
(PDF)
S2 Fig. EGFR is immobilized after chemical fixation. A549 cells were transfected with plas-
mids encoding EGFR-mEos3.2 24h before imaging. On the day of the experiment, the DMEM
growth medium was exchanged for Leibovitz medium and the cells were transferred into the
microscopes sample holder and imaged using TIRF illumination for 10 min per field of view.
Individual EGFR proteins could be localized and tracked over several frames. A shows a ren-
dering of all localizations from a single field of view. B shows the trajectories of three EGFR
molecules around a nanocluster (boxed area in A). We detected an immobile protein fraction
of about 45%. Following PFA fixation, the EGFR mobility was strongly reduced leading to
smaller clusters (C, rendered image; D, trajectories in boxed area) and an immobile protein
fraction of>95% (E). To relate the amount of immobilization, we also tracked localizations
stemming from gold fiducials immobilized on the glass slide (Bkgd in E).
(PDF)
S3 Fig. Nanoscale glycan organization in A549 cells. A549 cells were fixed, labelled using
SNA and imaged with STED. We found a similar glycan organization of small clusters as well
as protruding microvilli as visualized with STORM (A). A similar glycan organization was
observed using SNA on MDCK cells (B). We also labelled A549 cells with wheat germ aggluti-
nin (WGA), which unlike SNA, less specifically labels all sialylated glycans (C). Using WGA,
we could reproduce the nanocluster compartmentalization of the cell surface as well as pro-
truding hollow microvilli (arrow heads in C, right panel).
(PDF)
S4 Fig. Nanoscale Ezrin organization in A549 cells. (A) A549 cells were immunolabelled for
the actin-binding protein Ezrin, which was shown to be enriched in microvilli [18]. The cells
were imaged using STORM. Microvilli are clearly distinguishable and resemble the large clus-
ter population as observed on SNA-labelled cells and in scanning electron microscopy (SEM,
PLOS PATHOGENS Plasma membrane nanodomains facilitate influenza virus cell infection
PLOS Pathogens | https://doi.org/10.1371/journal.ppat.1008656 July 8, 2020 19 / 27

inset). Scale bars: left panel: 2 μm, right panel: 500 nm, inset: 200nm. (B) Ezrin localization
maps can then be used to set a threshold for the clusters size obtained from DBSCAN cluster-
ing to specifically analyze the non-microvilli cluster population in SNA localization maps (Fig
2).
(PDF)
S5 Fig. Experimentally obtained localization precision σ for Alexa 647 and Alexa 750.
Glass slides were washed, plasma cleaned and coated with Poly-L-lysine (0.01% in water) for
1h. Conjugated antibodies were diluted in PBS to a final concentration of ~10 nM and
adsorbed to the coated glass slides. Individual molecules were imaged under experimental con-
ditions. Localizations originating from single Alexa 647 (A) and Alexa 750 (B) molecules were
aligned to allow the estimation of the average localization precision: σx,y A647 = 12 nm and σx,
y A750 = 21 nm.
(PDF)
S6 Fig. Localization precision partly mimics local concentration gradient. To test if the
localization precision accounts for the gradient in localization density we observed in AF clus-
ters (Fig 3), we simulated clusters of random localizations (A) using cluster size data taken
from our experimental STORM measurements (i.e. radius r, number of localizations n, locali-
zation precision σ). The local density was then determined using a nearest neighbor search
within a radius of 3σ. We indeed observed that the simulated clusters exhibit an up to about
8-fold local enrichment (see one example in A-C). We then simulated clusters following the
full distribution of experimental data (i.e. radius r, number of localizations n). Comparing
with the density gradient observed in our experimental data (D andFig 3), we find that both
distributions are well separated and that the described effect only accounts for density
changes < 8-fold.
(PDF)
S7 Fig. A clustered AF organization increases IAV binding probability. To estimate the
effect of AF clustering on the efficiency of a virus to bind the target cell, we simulated two sce-
narios in a 1x1 μm membrane area, (A) a varying cluster size and (B) a varying degree of clus-
tering. For A, we simulated a constant lateral concentration of AF (black) and added AF
clusters (blue) at increasing size. In B, we keep the total amount of AF constant and gradually
shift molecules into clusters. In both cases, an approaching virus was simulated as a 2D projec-
tion of a small spherical IAV particle (contact area as red circles in A and B). A binding
attempt was counted as successful if at least 10 AF molecules were found inside the contact
area. C and D show the simulation result plotted as the binding probability out of 1000 simula-
tions against the respective tested cluster parameter.
(PDF)
S8 Fig. Confinement probability can robustly identify transient immobilization in IAV
trajectories. To test the precision of the confinement probability, we simulated random trajec-
tories that did not or did contain a confined region and calculated the confinement probability
Iconf for each trajectory. The confined region was chosen according to experimental data for
the radius (r = 50–300 nm) as well as Dconf (Figs 2 and 3). To identify a confined region, we
had to set a threshold of Iconf, which we set to 5 to allow high sensitivity. Our simulations (100
trajectories) show that at this threshold we have a chance of false identification (false positives)
of ~10%, which drops to 0% at Iconf > 8 (A). For the simulations that did contain a confine-
ment (example in B), we found an average detection efficiency (true positives) of 90% across
the entire simulation space (900 trajectories, color code in C).
(PDF)
PLOS PATHOGENS Plasma membrane nanodomains facilitate influenza virus cell infection
PLOS Pathogens | https://doi.org/10.1371/journal.ppat.1008656 July 8, 2020 20 / 27

S9 Fig. IAV single-virus tracking on A549 cells. Single virus tracking on live A549 cells
revealed four main types of virus movement: (A) three-stage movement, (B) confined, (C)
mixed, (D) drift. The fraction of all modes of movement was analyzed at the indicated condi-
tions (E).
(PDF)
S10 Fig. IAVs colocalize with EGFR and pEGFR on A549 cells. A549 cells were infected with
IAV X31 (MOI = 100) at low temperature for 15 min, then fixed and immunostained using
anti-H3N2 antiserum together with either anti-EGFR or anti-pEGFR (Y1068) antibodies. We
analyzed images takes in widefield epi illumination (A) as well as two-color STORM (B).
Using widefield epi illumination, we observed bright IAV spots that co-localize with EGFR
clusters and pEGFR signal (arrow heads). Scale bar = 2 μm. We quantified this colocalization
and found that in both cases about 20% of IAVs colocalize with EGFR and pEGFR respectively.
In the two-color STORM reconstructions, we could also observe IAVs that colocalize with
EGFR or pEGFR. More specifically, due to the increased resolution, we could discriminate
fully overlapping colocalization (B, arrow heads) as well as IAVs that associate with more than
one (p)EGFR cluster (B, asterisk). Shown are overview images (left) as well as four magnified
regions (right) for each overview.
(PDF)
S11 Fig. EGFR-kinase activity is required for IAV-mediated EGFR activation and infec-
tion. A549 cells were infected with IAV X31 (MOI = 100) at 4˚C for 15 min upon pre-treat-
ment with 10 μM Gefitinib for 1h min at 37˚C. The cells were fixed and immunostained using
pEGFR (Y1068) antibodies to label activated EGFR (A) and nuclear DNA was labelled with
DAPI. The cytosolic pEGFR signal was analyzed using ImageJ (B). To probe the infection effi-
ciency, A549 cells were infected with IAV X31 (MOI = 1) for 8h upon pre-treatment with
10 μM Gefitinib for 1h min at 37˚C. The cells were fixed and immunostained using anti-NP
antibodies (A) and nuclear DNA was labelled with DAPI (C). The infected was quantified as
nuclear NP/DAPI signal as analyzed with CellProfiler (D). EGFR nanoclusters are sensitive to
actin- or lipid domain destabilization (E). A549 cells were incubated with latrunculin A
(1 μM) or methyl-b-cyclodextrin (MCD) (40 μg/ml) for 1 h at 37˚C, then fixed and stained
using anti-EGFR antibodies.
(TIF)
S12 Fig. Molecule blinking correction for EGFR data. To estimate the number of emitting
molecules from a STORM dataset and to avoid false clustering of individual molecules, we
merged multiple localizations originating from the same molecule into a single localization.
The merging procedure requires a gap distance as well as a gap time, within which localiza-
tions will be counted as originating from the same molecule. To calibrate these values, we
imaged isolated labelled anti-EGFR antibodies under experimental conditions. Localizations
originating from a single molecule could be grouped to determine their lateral spread (A) as
well as the dark time between individual bursts (B). To ensure a high certainty of merging, the
dark time cut-off was determined by the 99% quantile to 18 s. Using the experimentally deter-
mined spread of localization (A, 35 nm) and the dark-time cut off, localization bursts from the
same molecule can now be combined into a single position. While each molecule is counted
multiple times due to molecule blinking (uncorrected, C), merging allows a more precise esti-
mate of the molecule numbers while avoiding false clustering (corrected, D).
(PDF)
PLOS PATHOGENS Plasma membrane nanodomains facilitate influenza virus cell infection
PLOS Pathogens | https://doi.org/10.1371/journal.ppat.1008656 July 8, 2020 21 / 27

S13 Fig. Experimental positive control for two-color STORM colocalization analysis. We
used two differently labelled versions of SNA as an experimental colocalization positive con-
trol. This served us also as a nominator to better evaluate the degree of colocalization of our
test molecule pair SNA/EGFR. A549 cells were labelled with two SNA variants, conjugated to
Alexa 647 as well Alexa 555 (A). Both localization datasets were analyzed using CBC resulting
in a colocalization value CA associated to each individual localization. A histogram of CA for
one channel is shown in B. We set the threshold to 0.3, above which localizations were counted
as colocalized. C shows one SNA dataset color coded according to CA. D shows all localizations
from the same dataset with CA > 0.3.
(PNG)
S14 Fig. EGFR cluster size and molecule number do not change after IAV or EGF stimula-
tion. EGFR cluster activation can be inhibited by the EGFR kinase inhibitor Gefitinib (A, B).
A549 cells were infected with IAV X31 (MOI = 100) at 4˚C for 15 min upon pre-treatment
with 10 μM Gefitinib for 1h min at 37˚C. The cells were fixed and immunostained using
pEGFR (Y1068) antibodies to label activated EGFR. The cells were imaged using STORM and
pEGFR cluster identified using DBSCAN. Following stimulation with EGF or IAV, we
detected an increase in the number of pEGFR cluster per area (as also shown in Fig 5). This
effect could be inhibited by Gefitinib treatment (A, B). A549 were treated with infection
medium (control) or infection medium containing IAV (MOI = 100) or 100 ng/ml EGF for 15
min at 4˚C. The cells were fixed and immunostained using anti-EGFR antibodies. Upon either
stimulation, we could not detect a change in the size of the EGFR clusters or the amount of
molecules per cluster (C).
(PDF)
S15 Fig. Single molecule diffusion coefficients from sptPALM of EGFR-mEos3 in A549
cells. A549 cells were transiently transfected with EGFR-mEos3. sptPALM imaging and analy-
sis of single molecule trajectories revealed a wide range of diffusion coefficients. The left panels
in A and B show the distribution of diffusion coefficients from sptPALM obtained at the dorsal
(A) and the ventral plasma membrane (B). Molecules were classified as mobile (D>0.5 μm2/s)
or immobile (D<0.5 μm2/s) respectively. Calculated MDS plots (A and B, right panels) for
both classes exhibit a rather linear dependence for the mobile fraction, while the curve satu-
rates with increasing lag time for the immobile fraction, the latter indicating spatial confine-
ment.
(PDF)
S16 Fig. EGFR expression level does not correlate with the EGFR cluster size but with the
number of clusters per area. A549 cells were transfected with plasmids for EGFR-mEos3.2
24h before the imaging experiments. On the day of the experiment, the cells were fixed and
and imaged. In order to assess the expression level, we took a snapshot of the pre-converted
green mEos version before photoconversion and PALM acquisition. We performed the
DBSCAN cluster analysis for different cells at various expression levels (A). We observed that
the number of clusters per area increased at higher expression level, while the cluster radius
was not affected (B).
(PDF)
S1 Movie. Evolution of the confinement probability Iconf as well as the particles distance
from the origin for a simulated virus trajectory. The particle moves according to Dfree until
it encounters an AF cluster (top panel, red circles). Due to the higher concentration of AF, the
particles diffusion is slowed down to Dconf and the particle is confined. Particle confinement is
detected by an increase of the confinement probability (middle panel) as well as a plateau in
PLOS PATHOGENS Plasma membrane nanodomains facilitate influenza virus cell infection
PLOS Pathogens | https://doi.org/10.1371/journal.ppat.1008656 July 8, 2020 22 / 27

the distance from origin plot (lower panel).
(AVI)
Acknowledgments
We would like to thank Katharina Horst for support and Andreas Herrmann for helpful dis-
cussions on the manuscript.
Author Contributions
Conceptualization: Christian Sieben, Suliana Manley.
Data curation: Christian Sieben.
Formal analysis: Christian Sieben, Suliana Manley.
Funding acquisition: Erdinc Sezgin, Christian Eggeling, Suliana Manley.
Investigation: Christian Sieben, Erdinc Sezgin, Christian Eggeling, Suliana Manley.
Methodology: Christian Sieben, Erdinc Sezgin, Christian Eggeling, Suliana Manley.
Project administration: Suliana Manley.
Resources: Christian Sieben.
Software: Christian Sieben.
Supervision: Christian Sieben, Suliana Manley.
Validation: Christian Sieben.
Visualization: Christian Sieben, Erdinc Sezgin, Christian Eggeling, Suliana Manley.
Writing – original draft: Christian Sieben, Erdinc Sezgin, Christian Eggeling, Suliana Manley.
Writing – review & editing: Christian Sieben, Erdinc Sezgin, Christian Eggeling, Suliana
Manley.
References1. Neumann G, Noda T, Kawaoka Y. Emergence and pandemic potential of swine-origin H1N1 influenza
virus. Nature. Nature Publishing Group; 2009; 459: 931–939. https://doi.org/10.1038/nature08157
PMID: 19525932
2. Harris A, Cardone G, Winkler DC, Heymann JB, Brecher M, White JM, et al. Influenza virus pleiomorphy
characterized by cryoelectron tomography. Proc Natl Acad Sci U S A. National Academy of Sciences;
2006; 103: 19123–7. https://doi.org/10.1073/pnas.0607614103 PMID: 17146053
3. Mair CM, Ludwig K, Herrmann A, Sieben C. Receptor binding and pH stability—How influenza A virus
hemagglutinin affects host-specific virus infection. Biochim Biophys Acta—Biomembr. 2014; 1838:
1153–1168. https://doi.org/10.1016/j.bbamem.2013.10.004 PMID: 24161712
4. Sauter NK, Bednarski MD, Wurzburg BA, Hanson JE, Whitesides GM, Skehel JJ, et al. Hemagglutinins
from two influenza virus variants bind to sialic acid derivatives with millimolar dissociation constants: a
500-MHz proton nuclear magnetic resonance study. Biochemistry. 1989; 28: 8388–96. Available: http://
www.ncbi.nlm.nih.gov/pubmed/2605190 https://doi.org/10.1021/bi00447a018 PMID: 2605190
5. Liu S-L, Zhang Z-L, Tian Z-Q, Zhao H-S, Liu H, Sun E-Z, et al. Effectively and Efficiently Dissecting the
Infection of Influenza Virus by Quantum-Dot-Based Single-Particle Tracking. ACS Nano. 2012; 6: 141–
150. https://doi.org/10.1021/nn2031353 PMID: 22117089
6. Lakadamyali M, Rust MJ, Babcock HP, Zhuang X. Visualizing infection of individual influenza viruses.
Proc Natl Acad Sci U S A. 2003; 100: 9280–5. https://doi.org/10.1073/pnas.0832269100 PMID:
12883000
PLOS PATHOGENS Plasma membrane nanodomains facilitate influenza virus cell infection
PLOS Pathogens | https://doi.org/10.1371/journal.ppat.1008656 July 8, 2020 23 / 27

7. Rust MJ, Lakadamyali M, Zhang F, Zhuang X. Assembly of endocytic machinery around individual influ-
enza viruses during viral entry. Nat Struct Mol Biol. 2004; 11: 567–573. Available: https://doi.org/10.
1038/nsmb769 PMID: 15122347
8. de Vries E, Tscherne DM, Wienholts MJ, Cobos-Jimenez V, Scholte F, Garcıa-Sastre A, et al. Dissec-
tion of the Influenza A Virus Endocytic Routes Reveals Macropinocytosis as an Alternative Entry Path-
way. Pekosz A, editor. PLoS Pathog. Public Library of Science; 2011; 7: e1001329. https://doi.org/10.
1371/journal.ppat.1001329 PMID: 21483486
9. Eierhoff T, Hrincius ER, Rescher U, Ludwig S, Ehrhardt C. The epidermal growth factor receptor
(EGFR) promotes uptake of influenza A viruses (IAV) into host cells. PLoS Pathog. 2010; 6: e1001099.
https://doi.org/10.1371/journal.ppat.1001099 PMID: 20844577
10. Schlessinger J. Ligand-Induced, Receptor-Mediated Dimerization and Activation of EGF Receptor.
Cell. 2002; 110: 669–672. https://doi.org/10.1016/s0092-8674(02)00966-2 PMID: 12297041
11. Bottcher C, Ludwig K, Herrmann A, van Heel M, Stark H. Structure of influenza haemagglutinin at neu-
tral and at fusogenic pH by electron cryo-microscopy. FEBS Lett. 1999; 463: 255–259. https://doi.org/
10.1016/s0014-5793(99)01475-1 PMID: 10606732
12. Schermelleh L, Heintzmann R, Leonhardt H. A guide to super-resolution fluorescence microscopy. J
Cell Biol. 2010; 190: 165–75. https://doi.org/10.1083/jcb.201002018 PMID: 20643879
13. Liu Z, Lavis LD, Betzig E. Imaging Live-Cell Dynamics and Structure at the Single-Molecule Level. Mol
Cell. Elsevier Inc.; 2015; 58: 644–659. https://doi.org/10.1016/j.molcel.2015.02.033 PMID: 26000849
14. Hell SW, Wichmann J. Breaking the diffraction resolution limit by stimulated emission: stimulated-emis-
sion-depletion fluorescence microscopy. Opt Lett. Optical Society of America; 1994; 19: 780. https://
doi.org/10.1364/ol.19.000780 PMID: 19844443
15. Rust MJ, Bates M, Zhuang X. Sub-diffraction-limit imaging by stochastic optical reconstruction micros-
copy (STORM). Nat Methods. 2006; 3: 793–5. https://doi.org/10.1038/nmeth929 PMID: 16896339
16. Betzig E, Patterson GH, Sougrat R, Lindwasser OW, Olenych S, Bonifacino JS, et al. Imaging Intracel-
lular Fluorescent Proteins at Nanometer Resolution. Science (80-). 2006; 313.
17. Hess ST, Girirajan TPK, Mason MD. Ultra-high resolution imaging by fluorescence photoactivation
localization microscopy. Biophys J. The Biophysical Society; 2006; 91: 4258–72. https://doi.org/10.
1529/biophysj.106.091116 PMID: 16980368
18. Berryman M, Franck Z, Bretscher A. Ezrin is concentrated in the apical microvilli of a wide variety of epi-
thelial cells whereas moesin is found primarily in endothelial cells. J Cell Sci. 1993; 1043: 1025–1043.
Available: http://jcs.biologists.org/content/105/4/1025.short
19. Helenius A, Kartenbeck J, Simons K, Fries E. On the entry of semliki forest virus into BHK-21 cells. J
Cell Biol. 1980;84. https://doi.org/10.1083/jcb.87.1.84
20. Sauvanet C, Wayt J, Pelaseyed T, Bretscher A. Structure, Regulation, and Functional Diversity of
Microvilli on the Apical Domain of Epithelial Cells. Annu Rev Cell Dev Biol. Annual Reviews; 2015; 31:
593–621. https://doi.org/10.1146/annurev-cellbio-100814-125234 PMID: 26566117
21. Saxton MJ, Jacobson K. SINGLE-PARTICLE TRACKING:Applications to Membrane Dynamics. Annu
Rev Biophys Biomol Struct. Annual Reviews 4139 El Camino Way, P.O. Box 10139, Palo Alto, CA
94303–0139, USA; 1997; 26: 373–399. https://doi.org/10.1146/annurev.biophys.26.1.373 PMID:
9241424
22. Simson R, Sheets ED, Jacobson K. Detection of temporary lateral confinement of membrane proteins
using single-particle tracking analysis. Biophys J. 1995; 69: 989–993. https://doi.org/10.1016/S0006-
3495(95)79972-6 PMID: 8519998
23. Macia E, Ehrlich M, Massol R, Boucrot E, Brunner C, Kirchhausen T. Dynasore, a cell-permeable inhibi-
tor of dynamin. Dev Cell. 2006; 10: 839–50. https://doi.org/10.1016/j.devcel.2006.04.002 PMID:
16740485
24. Zhu L, Ly H, Liang Y. PLC-γ1 signaling plays a subtype-specific role in postbinding cell entry of influenza
A virus. J Virol. 2014; 88: 417–24. https://doi.org/10.1128/JVI.02591-13 PMID: 24155396
25. Dempsey GT, Vaughan JC, Chen KH, Bates M, Zhuang X. Evaluation of fluorophores for optimal per-
formance in localization-based super-resolution imaging. Nature Methods. 2011. pp. 1027–1036.
https://doi.org/10.1038/nmeth.1768 PMID: 22056676
26. Yang S, Raymond-Stintz MA, Ying W, Zhang J, Lidke DS, Steinberg SL, et al. Mapping ErbB receptors
on breast cancer cell membranes during signal transduction. J Cell Sci. 2007; 120: 2763–2773. https://
doi.org/10.1242/jcs.007658 PMID: 17652160
27. Szabo A, Szollősi J, Nagy P. Coclustering of ErbB1 and ErbB2 Revealed by FRET-Sensitized Acceptor
Bleaching. Biophys J. 2010; 99: 105–114. https://doi.org/10.1016/j.bpj.2010.03.061 PMID: 20655838
PLOS PATHOGENS Plasma membrane nanodomains facilitate influenza virus cell infection
PLOS Pathogens | https://doi.org/10.1371/journal.ppat.1008656 July 8, 2020 24 / 27
28. Malkusch S, Endesfelder U, Mondry J, Gelleri M, Verveer PJ, Heilemann M. Coordinate-based colocali-
zation analysis of single-molecule localization microscopy data. Histochem Cell Biol. 2012; 137: 1–10.
https://doi.org/10.1007/s00418-011-0880-5 PMID: 22086768
29. Ariotti N, Liang H, Xu Y, Zhang Y, Yonekubo Y, Inder K, et al. Epidermal growth factor receptor activa-
tion remodels the plasma membrane lipid environment to induce nanocluster formation. Mol Cell Biol.
2010; 30: 3795–804. https://doi.org/10.1128/MCB.01615-09 PMID: 20516214
30. Wang Y, Gao J, Guo X, Tong T, Shi X, Li L, et al. Regulation of EGFR nanocluster formation by ionic
protein-lipid interaction. Cell Res. Shanghai Institutes for Biological Sciences, Chinese Academy of Sci-
ences; 2014; https://doi.org/10.1038/cr.2014.89 PMID: 25001389
31. Zhang M, Chang H, Zhang Y, Yu J, Wu L, Ji W, et al. Rational design of true monomeric and bright
photoactivatable fluorescent proteins. Nat Methods. 2012; 9: 727–729. https://doi.org/10.1038/nmeth.
2021 PMID: 22581370
32. Carter RE, Sorkin A. Endocytosis of functional epidermal growth factor receptor-green fluorescent pro-
tein chimera. J Biol Chem. American Society for Biochemistry and Molecular Biology; 1998; 273:
35000–7. https://doi.org/10.1074/jbc.273.52.35000 PMID: 9857032
33. Manley S, Gillette JM, Patterson GH, Shroff H, Hess HF, Betzig E, et al. High-density mapping of sin-
gle-molecule trajectories with photoactivated localization microscopy. Nat Methods. 2008; 5: 155–157.
https://doi.org/10.1038/nmeth.1176 PMID: 18193054
34. Cisse II, Izeddin I, Causse SZ, Boudarene L, Senecal A, Muresan L, et al. Polymerase II Clustering in.
Science (80-). 2013; 245: 664–667. https://doi.org/10.1126/science.1239053
35. Papp I, Sieben C, Sisson AL, Kostka J, Bottcher C, Ludwig K, et al. Inhibition of Influenza Virus Activity
by Multivalent Glycoarchitectures with Matched Sizes. ChemBioChem. WILEY-VCH Verlag; 2011; 12:
887–895. https://doi.org/10.1002/cbic.201000776 PMID: 21384484
36. Papp I, Sieben C, Ludwig K, Roskamp M, Bottcher C, Schlecht S, et al. Inhibition of Influenza Virus
Infection by Multivalent Sialic-Acid-Functionalized Gold Nanoparticles. Small. WILEY-VCH Verlag;
2010; 6: 2900–2906. https://doi.org/10.1002/smll.201001349 PMID: 21104827
37. Manzo C, Torreno-Pina J a., Joosten B, Reinieren-Beeren I, Gualda EJ, Loza-Alvarez P, et al. The neck
region of the C-type lectin DC-SIGN regulates its surface spatiotemporal organization and virus-binding
capacity on antigen-presenting cells. J Biol Chem. 2012; 287: 38946–38955. https://doi.org/10.1074/
jbc.M112.380121 PMID: 23019323
38. Jacobson K, Liu P, Lagerholm BC. The Lateral Organization and Mobility of Plasma Membrane Compo-
nents. Cell. Elsevier Inc.; 2019; 177: 806–819. https://doi.org/10.1016/j.cell.2019.04.018 PMID:
31051105
39. Casaletto JB, McClatchey AI. Spatial regulation of receptor tyrosine kinases in development and can-
cer. Nat Rev Cancer. Nature Publishing Group, a division of Macmillan Publishers Limited. All Rights
Reserved.; 2012; 12: 387–400. https://doi.org/10.1038/nrc3277 PMID: 22622641
40. Abulrob A, Lu Z, Baumann E, Vobornik D, Taylor R, Stanimirovic D, et al. Nanoscale imaging of epider-
mal growth factor receptor clustering: Effects of inhibitors. J Biol Chem. 2010; 285: 3145–3156. https://
doi.org/10.1074/jbc.M109.073338 PMID: 19959837
41. Nagy P, Jenei a, Kirsch a K, Szollosi J, Damjanovich S, Jovin TM. Activation-dependent clustering of
the erbB2 receptor tyrosine kinase detected by scanning near-field optical microscopy. J Cell Sci. 1999;
112 (Pt 1: 1733–41. Available: http://www.ncbi.nlm.nih.gov/pubmed/10318765
42. Szabo A, Horvath G, Szollősi J, Nagy P. Quantitative Characterization of the Large-Scale Association
of ErbB1 and ErbB2 by Flow Cytometric Homo-FRET Measurements. Biophys J. 2008; 95: 2086–2096.
https://doi.org/10.1529/biophysj.108.133371 PMID: 18487307
43. Nagy P, Claus J, Jovin TM, Arndt-Jovin DJ. Distribution of resting and ligand-bound ErbB1 and ErbB2
receptor tyrosine kinases in living cells using number and brightness analysis. Proc Natl Acad Sci U S
A. 2010; 107: 16524–16529. https://doi.org/10.1073/pnas.1002642107 PMID: 20813958
44. Fey D, Aksamitiene E, Kiyatkin A, Kholodenko BN. Modeling of receptor tyrosine kinase signaling:
Computational and experimental protocols. Methods in Molecular Biology. Humana Press Inc.;
2017. pp. 417–453. https://doi.org/10.1007/978-1-4939-7154-1_27 PMID: 28730495
45. Lavi Y, Gov N, Edidin M, Gheber LA. Lifetime of major histocompatibility complex class-I membrane
clusters is controlled by the actin cytoskeleton. Biophys J. Biophysical Society; 2012; 102: 1543–1550.
https://doi.org/10.1016/j.bpj.2012.01.042 PMID: 22500754
46. Lavi Y, Edidin M a, Gheber L a. Dynamic patches of membrane proteins. Biophys J. Elsevier; 2007; 93:
L35–7. https://doi.org/10.1529/biophysj.107.111567 PMID: 17631538
47. Garcia-Parajo MF, Cambi A, Torreno-Pina J a., Thompson N, Jacobson K. Nanoclustering as a domi-
nant feature of plasma membrane organization. J Cell Sci. 2014; 127: 4995–5005. https://doi.org/10.
1242/jcs.146340 PMID: 25453114
PLOS PATHOGENS Plasma membrane nanodomains facilitate influenza virus cell infection
PLOS Pathogens | https://doi.org/10.1371/journal.ppat.1008656 July 8, 2020 25 / 27
48. Schamel WWA, Arechaga I, Risueño RM, van Santen HM, Cabezas P, Risco C, et al. Coexistence of
multivalent and monovalent TCRs explains high sensitivity and wide range of response. J Exp Med.
2005;202.
49. Lillemeier BF, Mortelmaier MA, Forstner MB, Huppa JB, Groves JT, Davis MM. TCR and Lat are
expressed on separate protein islands on T cell membranes and concatenate during activation. Nat
Immunol. Nature Research; 2010; 11: 90–96. https://doi.org/10.1038/ni.1832 PMID: 20010844
50. Williamson DJ, Owen DM, Rossy J, Magenau A, Wehrmann M, Gooding JJ, et al. Pre-existing clusters
of the adaptor Lat do not participate in early T cell signaling events. Nat Immunol. Nature Publishing
Group; 2011; 12: 655–662. https://doi.org/10.1038/ni.2049 PMID: 21642986
51. Cambi A, Joosten B, Koopman M, de Lange F, Beeren I, Torensma R, et al. Organization of the integrin
LFA-1 in nanoclusters regulates its activity. Mol Biol Cell. American Society for Cell Biology; 2006; 17:
4270–81. https://doi.org/10.1091/mbc.e05-12-1098 PMID: 16855029
52. Jaqaman K, Kuwata H, Touret N, Collins R, Trimble WS, Danuser G, et al. Cytoskeletal Control of
CD36 Diffusion Promotes Its Receptor and Signaling Function. Cell. 2011; 146: 593–606. https://doi.
org/10.1016/j.cell.2011.06.049 PMID: 21854984
53. Yang J, Reth M. Oligomeric organization of the B-cell antigen receptor on resting cells. Nature. Nature
Research; 2010; 467: 465–469. https://doi.org/10.1038/nature09357 PMID: 20818374
54. Gasparrini F, Feest C, Bruckbauer A, Mattila PK, Muller J, Nitschke L, et al. Nanoscale organization
and dynamics of the siglec CD 22 cooperate with the cytoskeleton in restraining BCR signalling. EMBO
J. 2015; 1–23.
55. Eisfeld AJ, Neumann G, Kawaoka Y. Influenza A virus isolation, culture and identification. Nat Protoc.
Nature Publishing Group; 2014; 9: 2663–2681. https://doi.org/10.1038/nprot.2014.180 PMID:
25321410
56. Carpenter AE, Jones TR, Lamprecht MR, Clarke C, Kang I, Friman O, et al. CellProfiler: image analysis
software for identifying and quantifying cell phenotypes. Genome Biol. BioMed Central; 2006; 7: R100.
https://doi.org/10.1186/gb-2006-7-10-r100 PMID: 17076895
57. Sbalzarini IF, Koumoutsakos P. Feature point tracking and trajectory analysis for video imaging in cell
biology. J Struct Biol. 2005; 151: 182–195. https://doi.org/10.1016/j.jsb.2005.06.002 PMID: 16043363
58. Tarantino N, Tinevez J-Y, Crowell EF, Boisson B, Henriques R, Mhlanga M, et al. TNF and IL-1 exhibit
distinct ubiquitin requirements for inducing NEMO–IKK supramolecular structures. J Cell Biol.
2014;204.
59. Douglass KM, Sieben C, Archetti A, Lambert A, Manley S. Super-resolution imaging of multiple cells by
optimized flat-field epi-illumination. Nat Photonics. Nature Research; 2016; 10: 705–708. https://doi.
org/10.1038/nphoton.2016.200 PMID: 27818707
60. Edelstein A, Amodaj N, Hoover K, Vale R, Stuurman N, Edelstein A, et al. Computer Control of Micro-
scopes Using μManager. Current Protocols in Molecular Biology. Hoboken, NJ, USA: John Wiley &
Sons, Inc.; 2010. pp. 14.20.1–14.20.17. https://doi.org/10.1002/0471142727.mb1420s92 PMID:
20890901
61. Olivier N, Keller D, Gonczy P, Manley S. Resolution doubling in 3D-STORM imaging through improved
buffers. PLoS One. Public Library of Science; 2013; 8: e69004. https://doi.org/10.1371/journal.pone.
0069004 PMID: 23874848
62. Huang F, Hartwich TMP, Rivera-Molina FE, Lin Y, Duim WC, Long JJ, et al. Video-rate nanoscopy
using sCMOS camera–specific single-molecule localization algorithms. Nat Methods. Nature Research;
2013; 10: 653–658. https://doi.org/10.1038/nmeth.2488 PMID: 23708387
63. Ovesny M, Křızek P, Borkovec J, Svindrych Z, Hagen GM. ThunderSTORM: a comprehensive ImageJ
plug-in for PALM and STORM data analysis and super-resolution imaging. Bioinformatics. 2014; 30:
2389–2390. https://doi.org/10.1093/bioinformatics/btu202 PMID: 24771516
64. Malkusch S, Heilemann M, Hensel M, Klingauf J, Piehler J, Muller B, et al. Extracting quantitative infor-
mation from single-molecule super-resolution imaging data with LAMA–LocAlization Microscopy Ana-
lyzer. Sci Rep. Nature Publishing Group; 2016; 6: 34486. https://doi.org/10.1038/srep34486 PMID:
27703238
65. Galiani S, Waithe D, Reglinski K, Cruz-Zaragoza LD, Garcia E, Clausen MP, et al. Super-resolution
Microscopy Reveals Compartmentalization of Peroxisomal Membrane Proteins. J Biol Chem. American
Society for Biochemistry and Molecular Biology; 2016; 291: 16948–62. https://doi.org/10.1074/jbc.
M116.734038 PMID: 27311714
66. Clausen MP, Galiani S, Serna JB de la, Fritzsche M, Chojnacki J, Gehmlich K, et al. Pathways to optical
STED microscopy. NanoBioImaging. De Gruyter Open; 2014; 1. https://doi.org/10.2478/nbi-2013-0001
PLOS PATHOGENS Plasma membrane nanodomains facilitate influenza virus cell infection
PLOS Pathogens | https://doi.org/10.1371/journal.ppat.1008656 July 8, 2020 26 / 27
67. Ester M, Ester M, Kriegel H-P, Sander J, Xu X. A density-based algorithm for discovering clusters in
large spatial databases with noise. Proc 2nd Internat Conf Knowl Discov Data Min. 1996; 226–231.
Available: http://citeseerx.ist.psu.edu/viewdoc/summary?doi=10.1.1.121.9220
PLOS PATHOGENS Plasma membrane nanodomains facilitate influenza virus cell infection
PLOS Pathogens | https://doi.org/10.1371/journal.ppat.1008656 July 8, 2020 27 / 27
Top Related