


Languages
Pages
Legal


UBS Pan European Conference
Andreas Schwarzwälder, Head of Investor Relations
June 1, 2012
Increase of profitability
save space
Agenda
Page 2
1 Business Overview
2 Business Development Q1 2012
3 Outlook
4 Appendix
UBS Conference Paris, June 1, 2012

save space
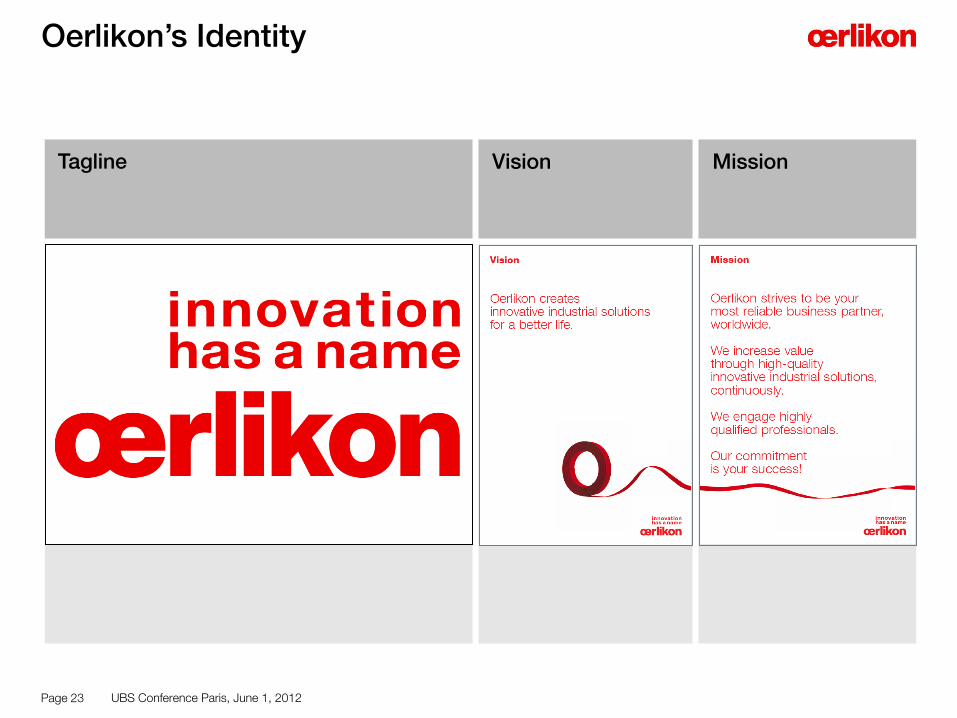
Oerlikon creates innovative industrial solutions for a better life
Innovative technology group with more than 17,000 employees at over 150 locations in 38 countries
High-quality businesses with leading market positions in global markets
Innovation is at the core of the business model across all Segments
Oerlikon Textile
Oerlikon Drive Systems
Oerlikon Advanced Technologies
Oerlikon Coating
Oerlikon Solar
Oerlikon Vacuum
Page 3 UBS Conference Paris, June 1, 2012

save space
Oerlikon Customer Base (Selection)
Page 4
Preferred technology supplier to technology leaders in their respective industries Global customer base and world leading brand names Strong long-term customer relationships
UBS Conference Paris, June 1, 2012

save space
Oerlikon benefits from growth opportunities worldwide
Asian markets fueled sales up by 27 %; Europe up by 9 %; North America up by 1 %; Other regions up by 14 %
Assessment of emerging markets (BRIC) to better balance geographical diversification
Sales* by location Sales* by market region
28%
49%
15%
8%
Europe
Asia/Pacific
Other regions
North America
18%
12%
69%Europe
Asia/ Pacific
Other regions
1%
North America
Sales by location and region FY 2011
Page 5 * Sales to third parties
UBS Conference Paris, June 1, 2012
save space
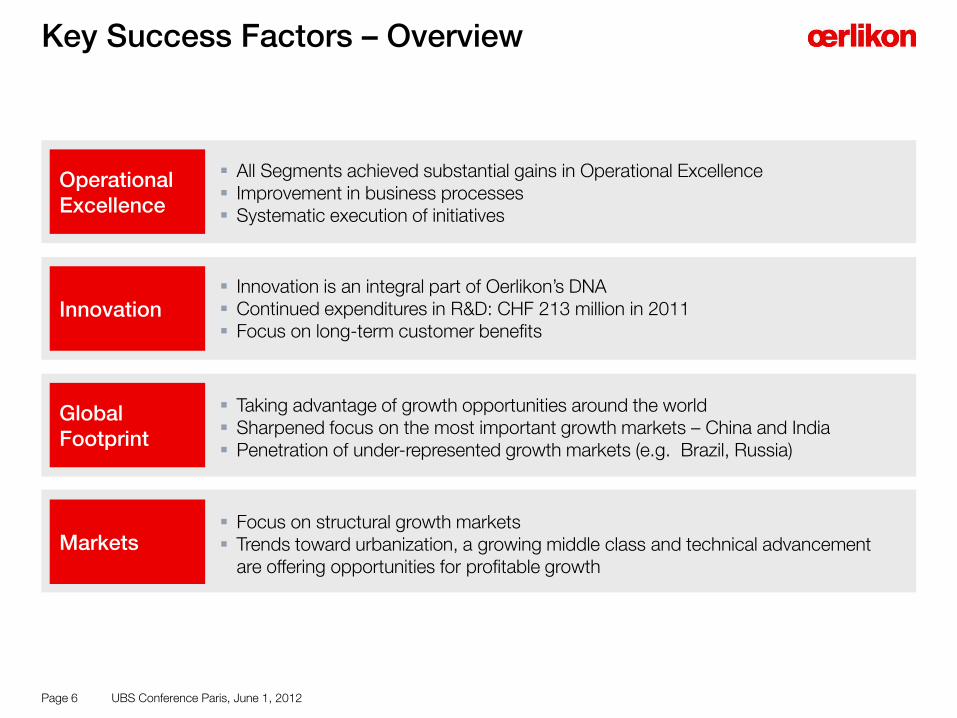
Key Success Factors – Overview
Page 6
Operational Excellence
All Segments achieved substantial gains in Operational Excellence Improvement in business processes Systematic execution of initiatives
Innovation Innovation is an integral part of Oerlikon’s DNA Continued expenditures in R&D: CHF 213 million in 2011 Focus on long-term customer benefits
Global Footprint
Taking advantage of growth opportunities around the world Sharpened focus on the most important growth markets – China and India Penetration of under-represented growth markets (e.g. Brazil, Russia)
Markets Focus on structural growth markets Trends toward urbanization, a growing middle class and technical advancement
are offering opportunities for profitable growth
UBS Conference Paris, June 1, 2012
save space
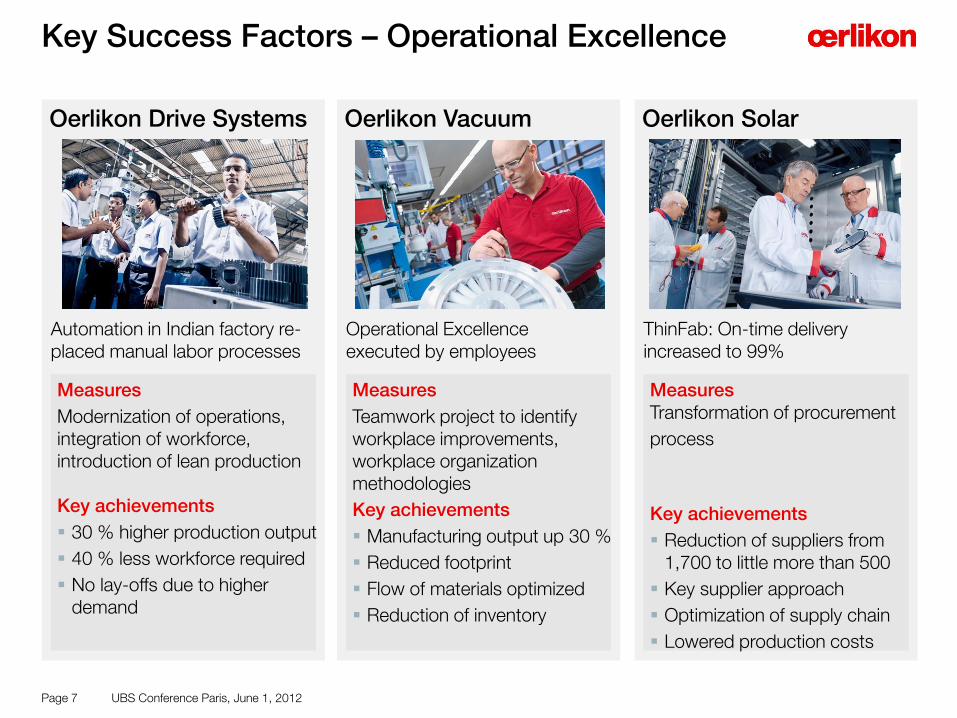
Key Success Factors – Operational Excellence
Page 7
Oerlikon Vacuum Oerlikon Drive Systems
Operational Excellence executed by employees
Automation in Indian factory re-placed manual labor processes
Measures
Modernization of operations, integration of workforce, introduction of lean production Key achievements
30 % higher production output
40 % less workforce required
No lay-offs due to higher demand
Measures
Teamwork project to identify workplace improvements, workplace organization methodologies
Key achievements
Manufacturing output up 30 %
Reduced footprint
Flow of materials optimized
Reduction of inventory
Oerlikon Solar
Measures Transformation of procurement
process
Key achievements
Reduction of suppliers from 1,700 to little more than 500
Key supplier approach
Optimization of supply chain
Lowered production costs
ThinFab: On-time delivery increased to 99%
UBS Conference Paris, June 1, 2012
save space
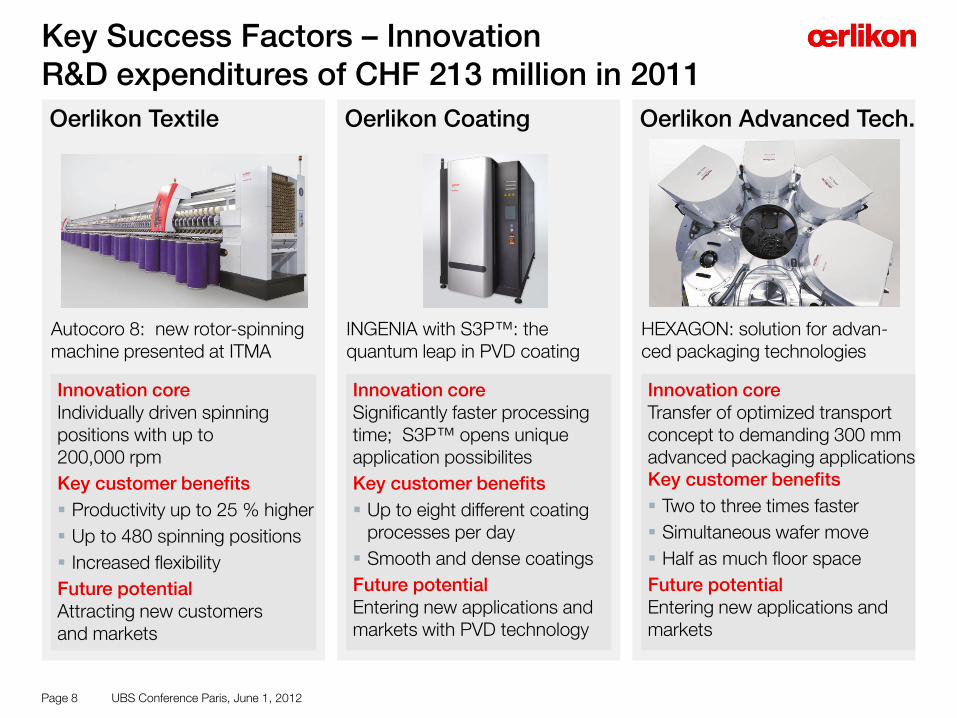
Key Success Factors – Innovation R&D expenditures of CHF 213 million in 2011
Page 8
Oerlikon Textile
Autocoro 8: new rotor-spinning machine presented at ITMA
Innovation core Individually driven spinning positions with up to 200,000 rpm
Key customer benefits
Productivity up to 25 % higher
Up to 480 spinning positions
Increased flexibility
Future potential Attracting new customers and markets
Oerlikon Advanced Tech. Oerlikon Coating
Innovation core Transfer of optimized transport concept to demanding 300 mm advanced packaging applications Key customer benefits
Two to three times faster
Simultaneous wafer move
Half as much floor space
Future potential Entering new applications and markets
Innovation core Significantly faster processing time; S3P™ opens unique application possibilites
Key customer benefits
Up to eight different coating processes per day
Smooth and dense coatings
Future potential Entering new applications and markets with PVD technology
HEXAGON: solution for advan-ced packaging technologies
INGENIA with S3P™: the quantum leap in PVD coating
UBS Conference Paris, June 1, 2012
save space
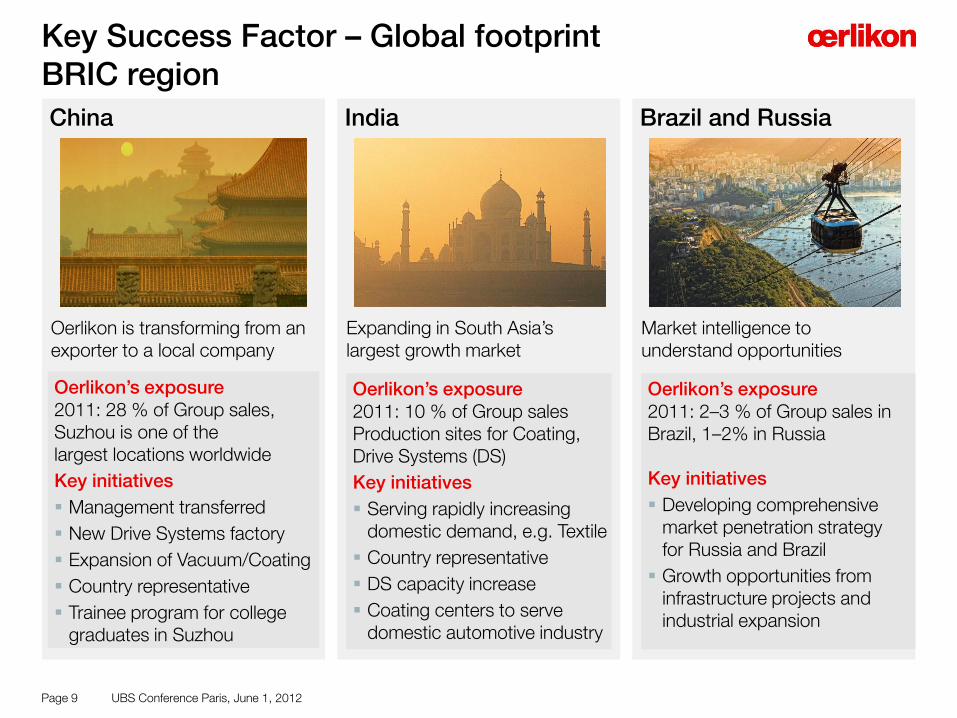
Key Success Factor – Global footprint BRIC region
Page 9
Brazil and Russia China India
Oerlikon’s exposure 2011: 2–3 % of Group sales in Brazil, 1–2% in Russia Key initiatives
Developing comprehensive market penetration strategy for Russia and Brazil
Growth opportunities from infrastructure projects and industrial expansion
Oerlikon’s exposure 2011: 10 % of Group sales Production sites for Coating, Drive Systems (DS)
Key initiatives
Serving rapidly increasing domestic demand, e.g. Textile
Country representative
DS capacity increase
Coating centers to serve domestic automotive industry
Oerlikon’s exposure 2011: 28 % of Group sales, Suzhou is one of the largest locations worldwide
Key initiatives
Management transferred
New Drive Systems factory
Expansion of Vacuum/Coating
Country representative
Trainee program for college graduates in Suzhou
Market intelligence to understand opportunities
Oerlikon is transforming from an exporter to a local company
Expanding in South Asia’s largest growth market
UBS Conference Paris, June 1, 2012
save space
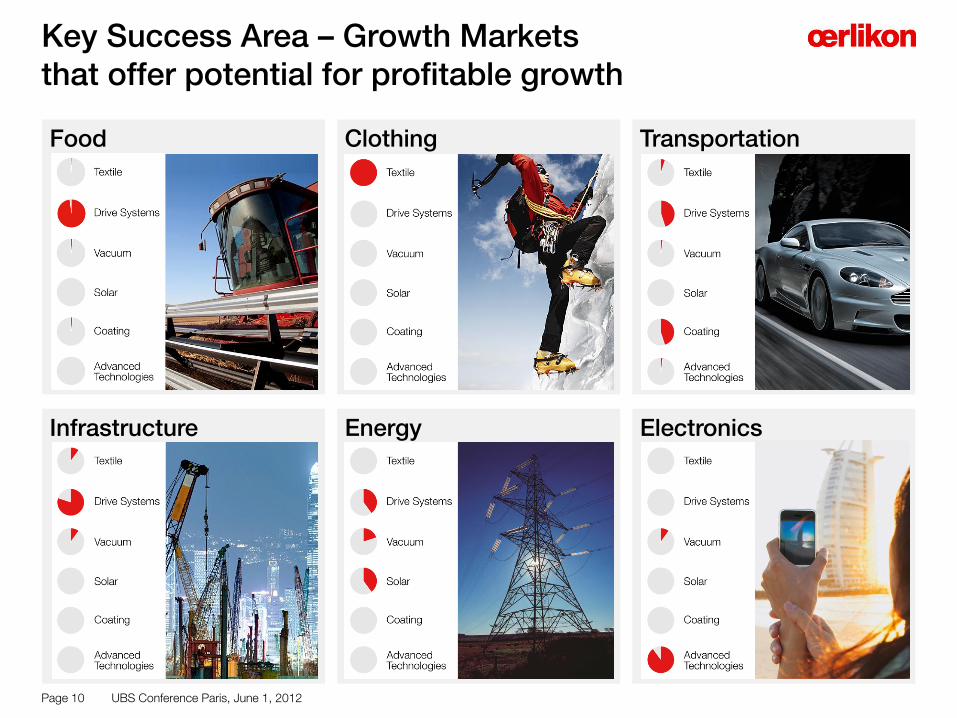
Key Success Area – Growth Markets that offer potential for profitable growth
Page 10
Transportation Food Clothing
Electronics Infrastructure Energy
UBS Conference Paris, June 1, 2012
save space
Agenda
Page 11
1 Business Overview
2 Business Development Q1 2012
3 Outlook
4 Appendix
UBS Conference Paris, June 1, 2012

save space
Increase transparency by reporting profitability Group EBIT margin* improves to 11.8 %
in CHF m / in %
Continued profitability improvement
Reported EBIT margin of 15.8 % include
one-time effect of CHF 39 million in Textile (Sale of Arbon property)
Adjusted for currency effects, sales would have increased by 11 %
Growth in the US and Asia; China in particular (China sales increased by 34 %)
Operational Excellence programs to drive profitability
Oerlikon included in SMIM Index and new Coverage by Societe Generale, Paris
Page 12
Consistent execution of portfolio optimization
Order intake Sales**
Q1 2012 cont. op.
996
Q1 2011 restated
1,126
-12% 906
+6%
Q1 2012 cont. op.
961
Q1 2011 restated
EBIT
39
106
+43%
Q1 2012 cont. op.
152
113
Q1 2011 restated
Order backlog
1,693
-21%
Q1 2012 cont. op.
1,345
Q1 2011 restated
EBIT margin*
11.7 +1%
Q1 2012 cont. op.
11.8
Q1 2011 restated
** Sales to third parties * Excluding one-time effect of property sale Arbon, CH UBS Conference Paris, June 1, 2012
save space
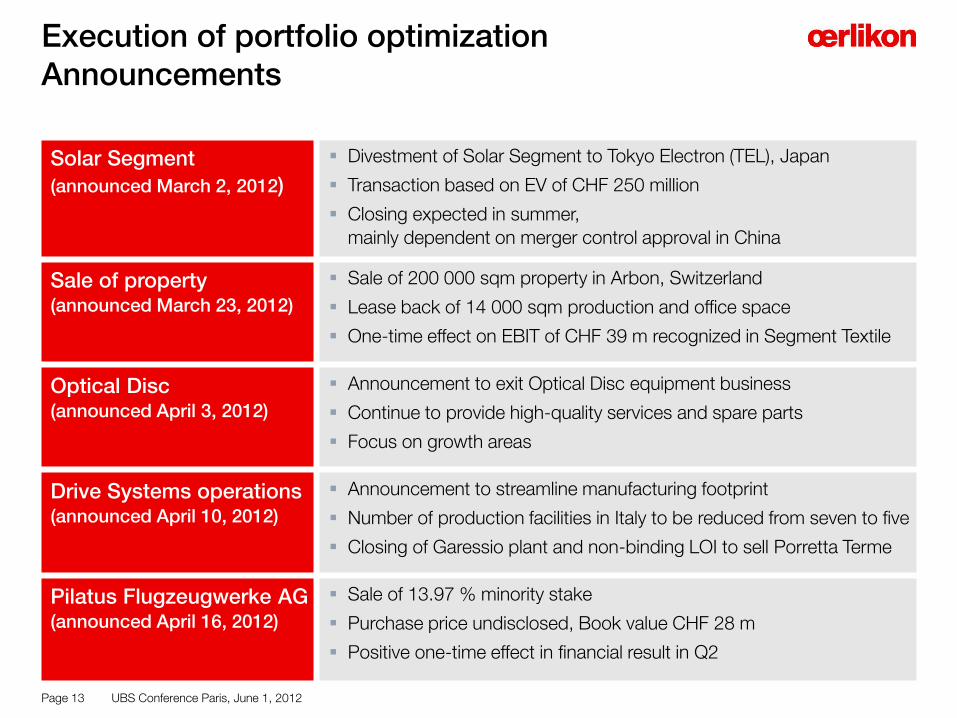
Execution of portfolio optimization
Page 13
Announcements
Solar Segment
(announced March 2, 2012)
Divestment of Solar Segment to Tokyo Electron (TEL), Japan
Transaction based on EV of CHF 250 million
Closing expected in summer,
mainly dependent on merger control approval in China
Sale of property (announced March 23, 2012)
Sale of 200 000 sqm property in Arbon, Switzerland
Lease back of 14 000 sqm production and office space
One-time effect on EBIT of CHF 39 m recognized in Segment Textile
Optical Disc (announced April 3, 2012)
Announcement to exit Optical Disc equipment business
Continue to provide high-quality services and spare parts
Focus on growth areas
Drive Systems operations (announced April 10, 2012)
Announcement to streamline manufacturing footprint
Number of production facilities in Italy to be reduced from seven to five
Closing of Garessio plant and non-binding LOI to sell Porretta Terme
Pilatus Flugzeugwerke AG (announced April 16, 2012)
Sale of 13.97 % minority stake
Purchase price undisclosed, Book value CHF 28 m
Positive one-time effect in financial result in Q2
UBS Conference Paris, June 1, 2012
save space
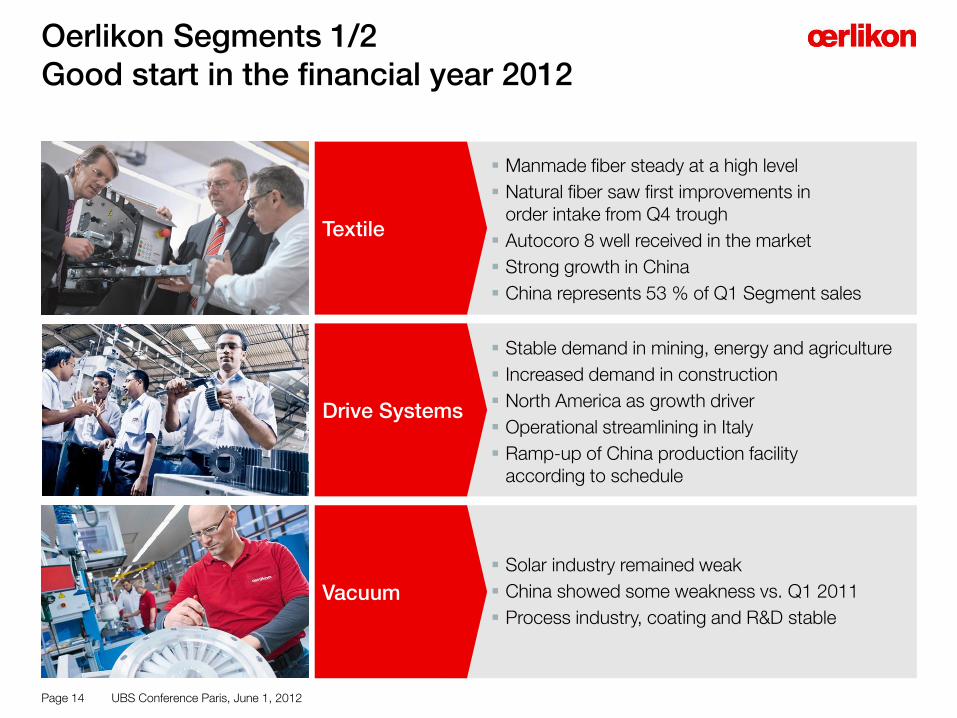
Textile
Vacuum
Oerlikon Segments 1/2
Page 14
Good start in the financial year 2012
Solar industry remained weak
China showed some weakness vs. Q1 2011
Process industry, coating and R&D stable
Drive Systems
Stable demand in mining, energy and agriculture
Increased demand in construction
North America as growth driver
Operational streamlining in Italy
Ramp-up of China production facility according to schedule
Manmade fiber steady at a high level
Natural fiber saw first improvements in order intake from Q4 trough
Autocoro 8 well received in the market
Strong growth in China
China represents 53 % of Q1 Segment sales
UBS Conference Paris, June 1, 2012
save space
Coating
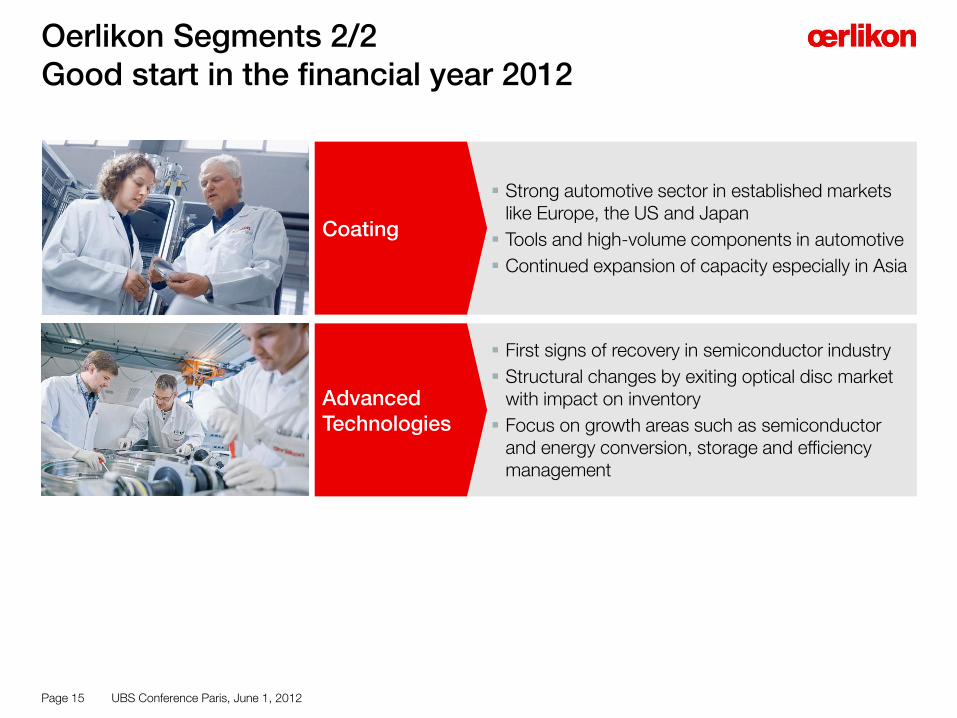
Oerlikon Segments 2/2
Page 15
Good start in the financial year 2012
Advanced Technologies
First signs of recovery in semiconductor industry
Structural changes by exiting optical disc market with impact on inventory
Focus on growth areas such as semiconductor and energy conversion, storage and efficiency management
Strong automotive sector in established markets like Europe, the US and Japan
Tools and high-volume components in automotive
Continued expansion of capacity especially in Asia
UBS Conference Paris, June 1, 2012
save space
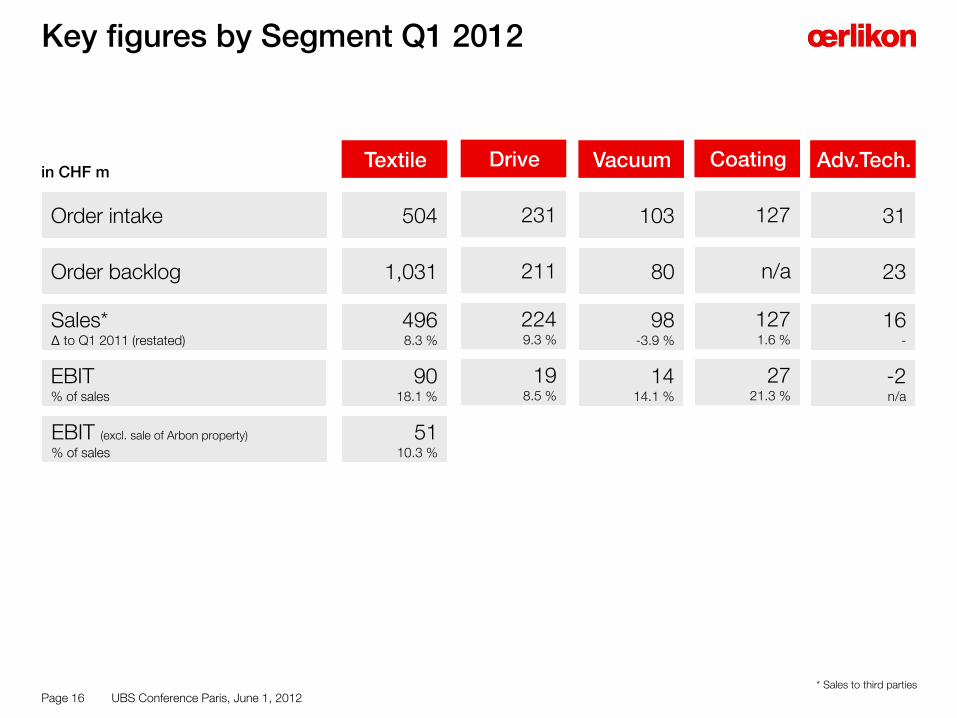
Key figures by Segment Q1 2012
Order intake
Order backlog
Sales* Δ to Q1 2011 (restated)
EBIT % of sales
EBIT (excl. sale of Arbon property)
% of sales
in CHF m Vacuum
103
80
98 -3.9 %
14 14.1 %
Page 16
Textile
504
1,031
496 8.3 %
90 18.1 %
Coating
127
n/a
127 1.6 %
27 21.3 %
51 10.3 %
Adv.Tech.
31
23
16 -
-2 n/a
Drive
231
211
224 9.3 %
19 8.5 %
* Sales to third parties
UBS Conference Paris, June 1, 2012
save space
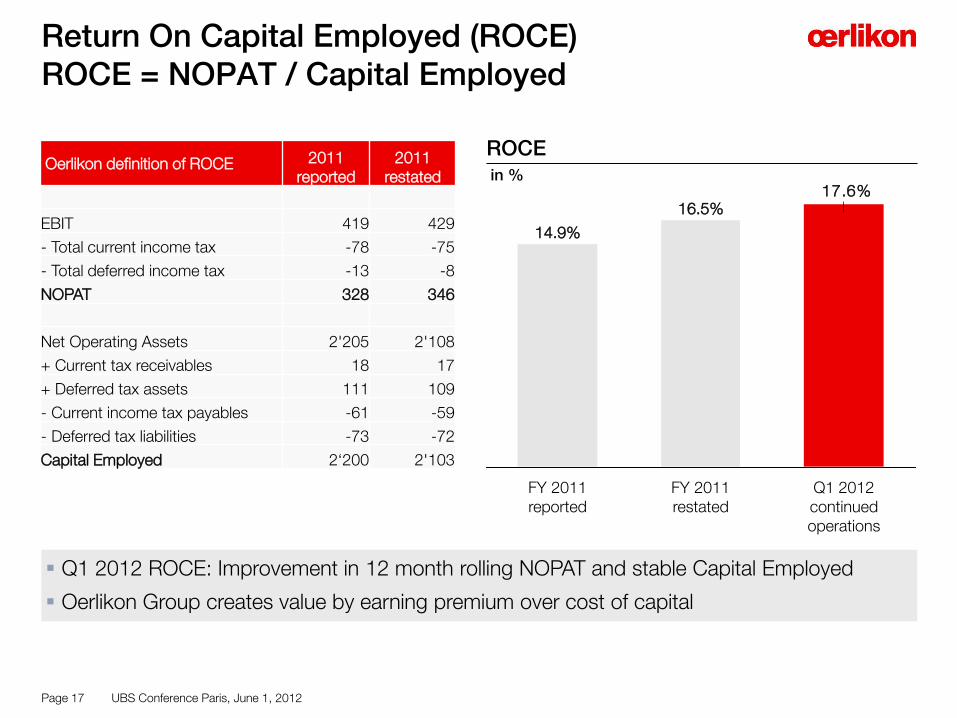
Q1 2012 ROCE: Improvement in 12 month rolling NOPAT and stable Capital Employed
Oerlikon Group creates value by earning premium over cost of capital
ROCE
Return On Capital Employed (ROCE) ROCE = NOPAT / Capital Employed
Page 17
17.6%
Q1 2012 continued operations
FY 2011 restated
16.5%
FY 2011 reported
14.9%
in % Oerlikon definition of ROCE 2011
reported 2011
restated
EBIT 419 429
- Total current income tax -78 -75
- Total deferred income tax -13 -8
NOPAT 328 346
Net Operating Assets 2'205 2'108
+ Current tax receivables 18 17
+ Deferred tax assets 111 109
- Current income tax payables -61 -59
- Deferred tax liabilities -73 -72
Capital Employed 2‘200 2'103
UBS Conference Paris, June 1, 2012

save space
Agenda
Page 18
1 Business Overview
2 Business Development Q1 2012
3 Outlook
4 Appendix
UBS Conference Paris, June 1, 2012
save space
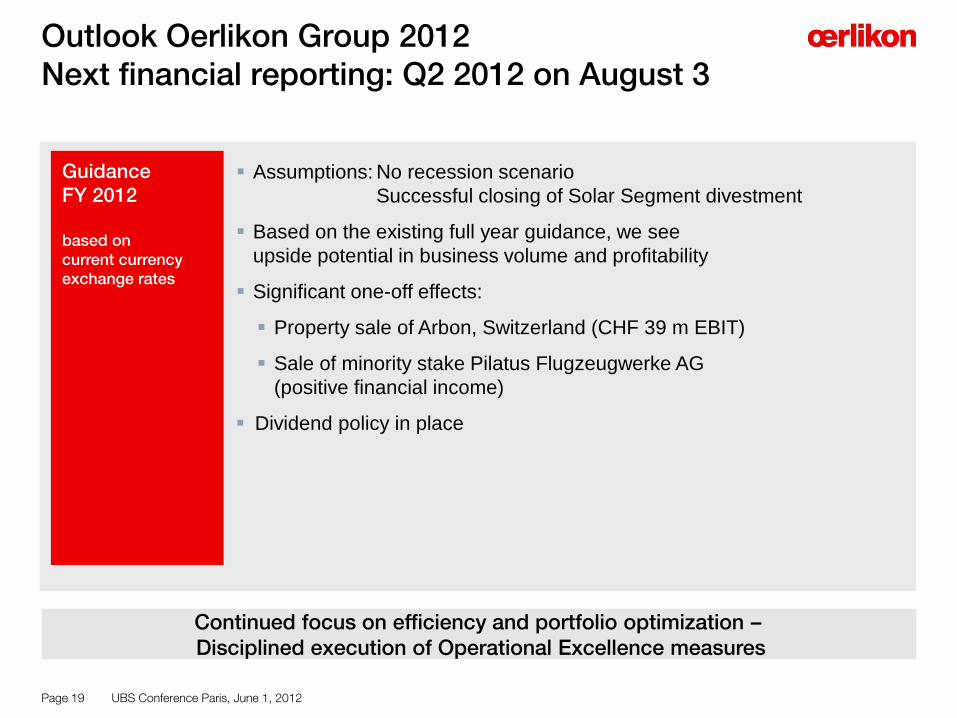
Outlook Oerlikon Group 2012 Next financial reporting: Q2 2012 on August 3
Page 19
Assumptions: No recession scenario
Successful closing of Solar Segment divestment
Based on the existing full year guidance, we see
upside potential in business volume and profitability
Significant one-off effects:
Property sale of Arbon, Switzerland (CHF 39 m EBIT)
Sale of minority stake Pilatus Flugzeugwerke AG
(positive financial income)
Dividend policy in place
Guidance FY 2012 based on current currency exchange rates
Continued focus on efficiency and portfolio optimization – Disciplined execution of Operational Excellence measures
UBS Conference Paris, June 1, 2012
save space
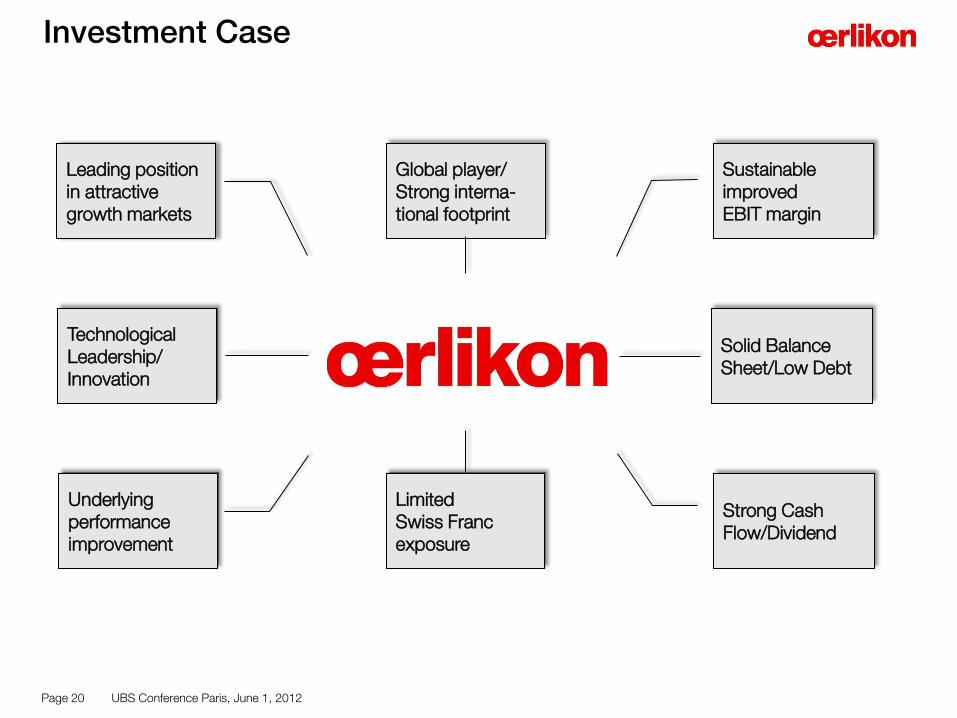
Investment Case
Page 20
Leading position in attractive growth markets
Sustainable improved EBIT margin
Underlying performance improvement
Solid Balance Sheet/Low Debt
Strong Cash Flow/Dividend
Technological Leadership/ Innovation
Limited Swiss Franc exposure
Global player/ Strong interna-tional footprint
UBS Conference Paris, June 1, 2012
save space
Questions & Answer Session
Page 21 UBS Conference Paris, June 1, 2012
save space
Agenda
Page 22
1 Business Overview
2 Business Development Q1 2012
3 Outlook
4 Appendix
UBS Conference Paris, June 1, 2012
save space
Vision Mission Tagline
Oerlikon’s Identity
Page 23 UBS Conference Paris, June 1, 2012

save space
Oerlikon Shares
Page 24
Oerlikon Shares Oerlikon Shareholder Structure
Oerlikon Share Price Development
As of May 25, 2012, Indexed; 100 percent = Closing price per December 31, 2011
Listed on Swiss Exchange (SIX) since 1975
Securities symbol: OERL
Securities number 81 682
ISIN: CH0000816824
No. of shares outstanding: 323 124 010 shares
Re-entry to Swiss SMIM on April 17, 2012
Addition to STOXX Europe 600 as of June 18, 2012
47,98% Free Float 51,88%
Treasury Shares (part of Free Float)
0,14%
Renova Group
90.0
100.0
110.0
120.0
130.0
140.0
150.0
160.0
170.0
180.0
190.0
30.1
2.1
1
06.0
1.1
2
13.0
1.1
2
20.0
1.1
2
27.0
1.1
2
03.0
2.1
2
10.0
2.1
2
17.0
2.1
2
24.0
2.1
2
02.0
3.1
2
09.0
3.1
2
16.0
3.1
2
23.0
3.1
2
30.0
3.1
2
06.0
4.1
2
13.0
4.1
2
20.0
4.1
2
27.0
4.1
2
04.0
5.1
2
11.0
5.1
2
18.0
5.1
2
25.0
5.1
2
Oerlikon STOXX 600 SMI SMIM
UBS Conference Paris, June 1, 2012
save space
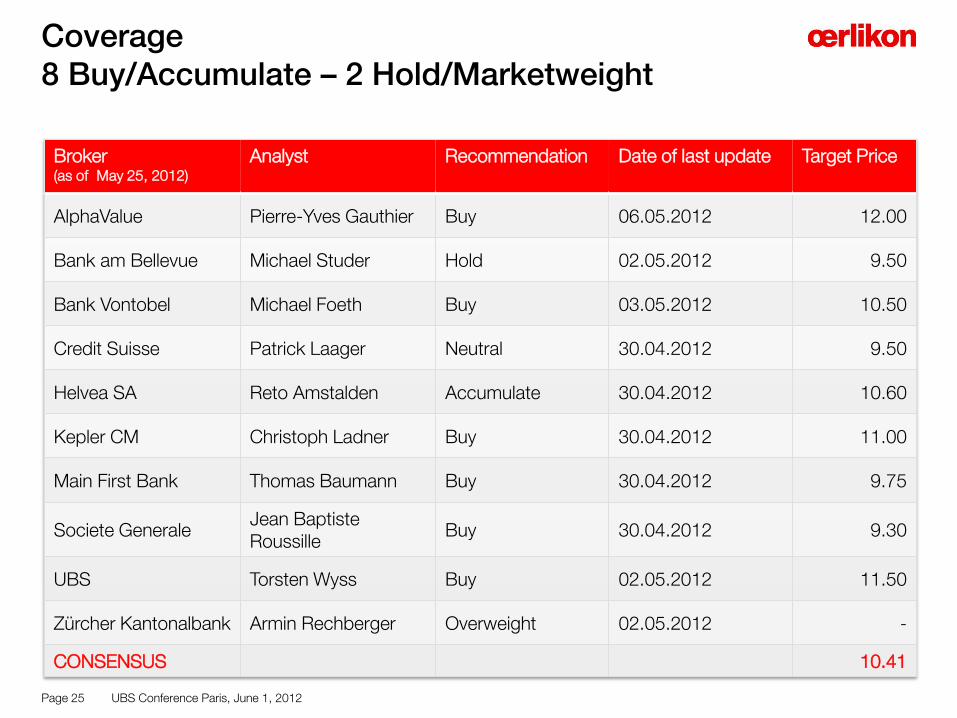
Coverage 8 Buy/Accumulate – 2 Hold/Marketweight
Page 25
Broker (as of May 25, 2012)
Analyst Recommendation Date of last update
Target Price
AlphaValue Pierre-Yves Gauthier Buy 06.05.2012 12.00
Bank am Bellevue Michael Studer Hold 02.05.2012 9.50
Bank Vontobel Michael Foeth Buy 03.05.2012 10.50
Credit Suisse Patrick Laager Neutral 30.04.2012 9.50
Helvea SA Reto Amstalden Accumulate 30.04.2012 10.60
Kepler CM Christoph Ladner Buy 30.04.2012 11.00
Main First Bank Thomas Baumann Buy 30.04.2012 9.75
Societe Generale Jean Baptiste Roussille
Buy 30.04.2012 9.30
UBS Torsten Wyss Buy 02.05.2012 11.50
Zürcher Kantonalbank Armin Rechberger Overweight 02.05.2012 -
CONSENSUS 10.41
UBS Conference Paris, June 1, 2012
save space
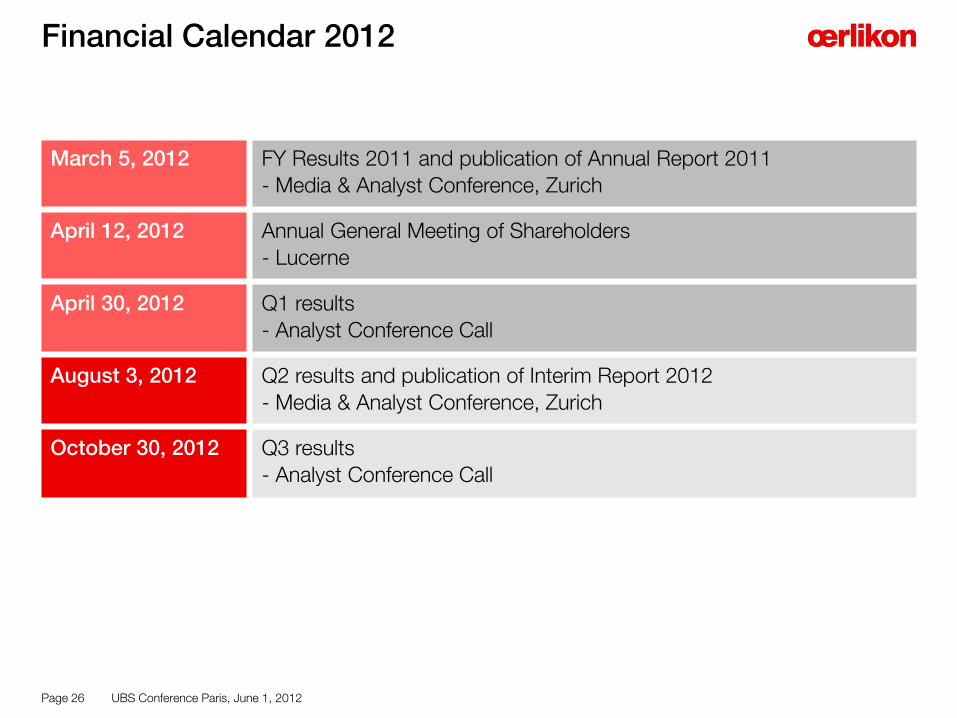
Financial Calendar 2012
Page 26
March 5, 2012 FY Results 2011 and publication of Annual Report 2011
- Media & Analyst Conference, Zurich
April 12, 2012 Annual General Meeting of Shareholders
- Lucerne
April 30, 2012
Q1 results
- Analyst Conference Call
August 3, 2012 Q2 results and publication of Interim Report 2012
- Media & Analyst Conference, Zurich
October 30, 2012 Q3 results
- Analyst Conference Call
UBS Conference Paris, June 1, 2012
save space
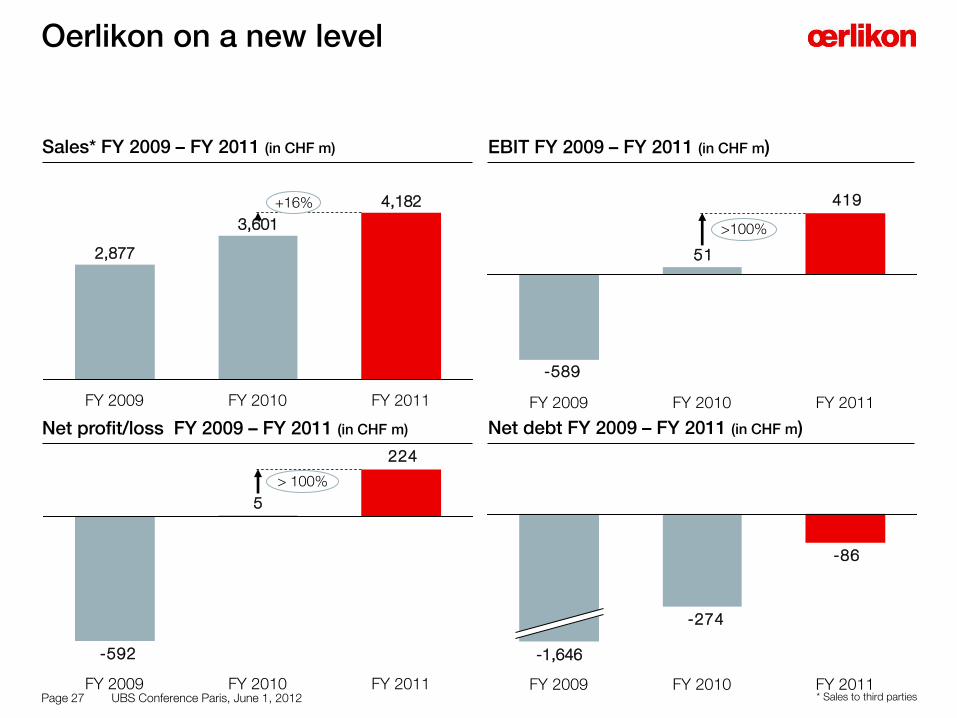
Oerlikon on a new level
Page 27
Sales* FY 2009 – FY 2011 (in CHF m)
224
5
-592
> 100%
FY 2011 FY 2010 FY 2009
FY 2009
2,877
3,601
+16%
FY 2011
4,182
FY 2010
Net debt FY 2009 – FY 2011 (in CHF m)
-86
-274
FY 2011 FY 2010 FY 2009
-1,646
EBIT FY 2009 – FY 2011 (in CHF m)
419
51
-589
>100%
FY 2011 FY 2010 FY 2009
Net profit/loss FY 2009 – FY 2011 (in CHF m)
* Sales to third parties UBS Conference Paris, June 1, 2012

save space
Oerlikon Group key figures FY 2011
in CHF m
Page 28
Order intake 4,043 4,520 –11 %
Order backlog 1,481 1,702 –13 %
Sales* 4,182 3,601 +16 %
EBITDA % of sales
605 14 %
278 8 %
>100 %
Net profit % of sales
224 5 %
5 0 %
>100%
FY 2010 FY 2011 Δ
2,205 2,196 0 % Net Operating Assets (incl. goodwill and brands)
EBIT % of sales
419 10 %
51 1 %
>100 %
Cash flow from operating activities before changes in net current assets
541 354 +53 %
* Sales to third parties
UBS Conference Paris, June 1, 2012

save space
Key figures by Segment FY 2011
Order intake
Order backlog
Sales* Δ to 2010
EBITDA % of sales
EBIT % of sales
in CHF m Vacuum
400
77
409 -
72 18 %
Page 29
59 14%
Net Operating Assets 165
Employees 1,472
Textile
1,977
1,053
2,037 23 %
233 11 %
Coating
484
n/a
484 15%
141 29 %
183 9 %
97 20 %
618 303
6,230 2,986
Adv.Tech.
88
8
108 -16%
14 13 %
11 10 %
82
200
Drive
892
213
821 12%
94 11 %
49 6 %
936
5,471
Solar
202
130
323 27 %
17 5 %
-10 n/a
97
660
* Sales to third parties
UBS Conference Paris, June 1, 2012
save space
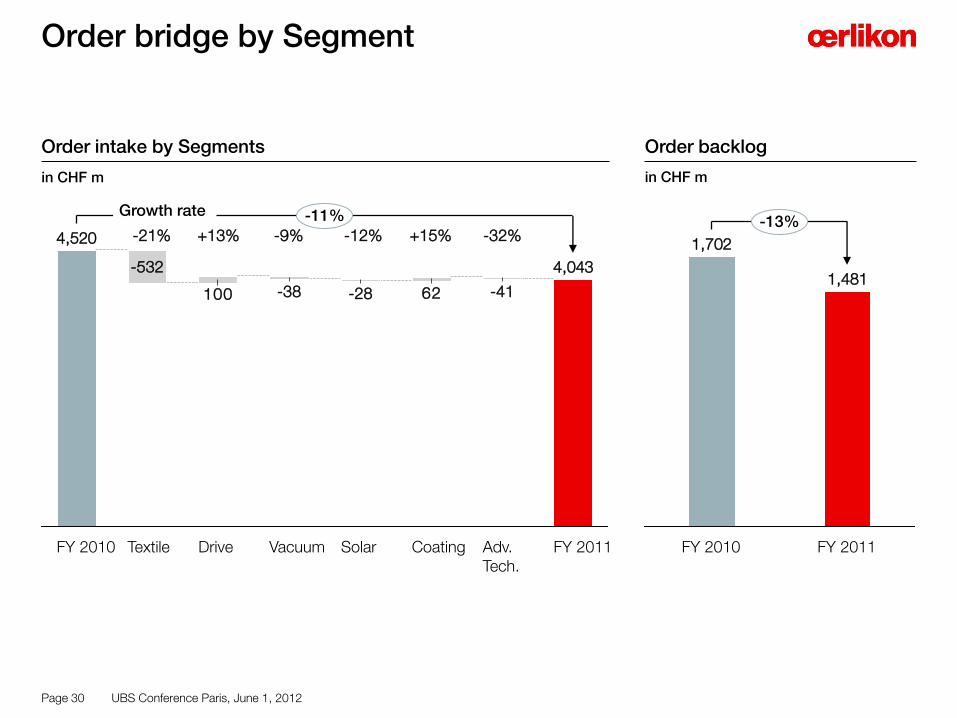
Order backlog Order intake by Segments
in CHF m
62100
Adv. Tech.
Coating
-11%
FY 2011
4,043
-41
Solar
-28
Vacuum
-38
Drive Textile
-532
FY 2010
4,520 -13%
FY 2011
1,702
1,481
FY 2010
Order bridge by Segment
Page 30
-21% +15% -12% -9% +13% -32%
Growth rate
in CHF m
UBS Conference Paris, June 1, 2012
save space
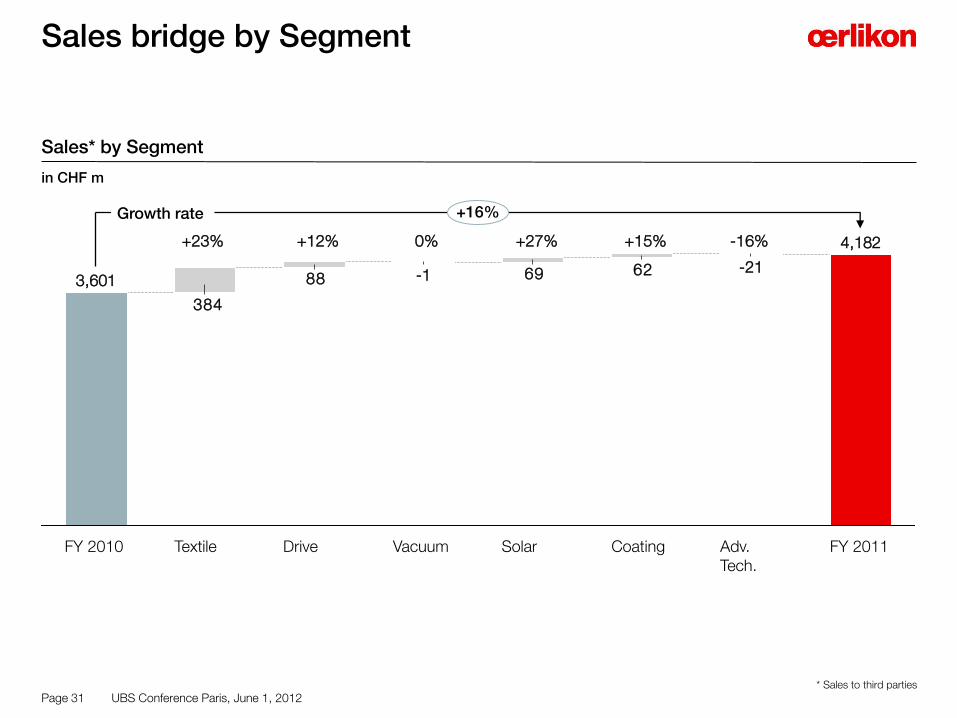
626988
384
+16%
FY 2011
4,182
Adv. Tech.
-21
Coating Solar Vacuum
-1
Drive Textile FY 2010
3,601
Sales bridge by Segment
Page 31
Sales* by Segment
in CHF m
Growth rate
+23% +15% +27% 0% +12% -16%
* Sales to third parties
UBS Conference Paris, June 1, 2012
save space
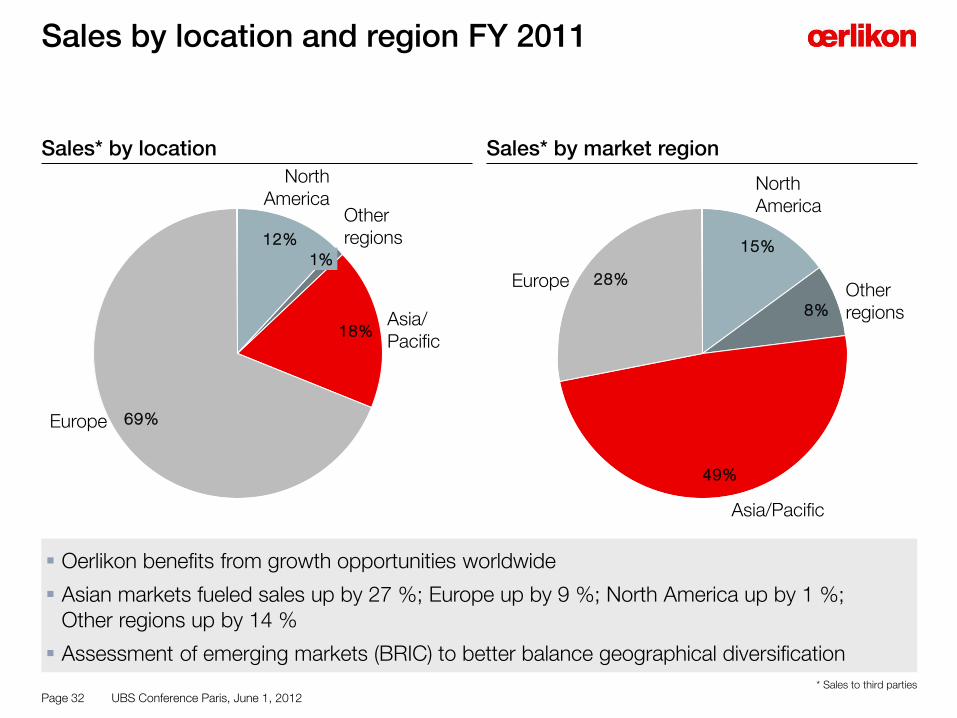
Oerlikon benefits from growth opportunities worldwide
Asian markets fueled sales up by 27 %; Europe up by 9 %; North America up by 1 %; Other regions up by 14 %
Assessment of emerging markets (BRIC) to better balance geographical diversification
Sales* by location Sales* by market region
28%
49%
15%
8%
Europe
Asia/Pacific
Other regions
North America
18%
12%
69%Europe
Asia/ Pacific
Other regions
1%
North America
Sales by location and region FY 2011
Page 32 * Sales to third parties
UBS Conference Paris, June 1, 2012
save space
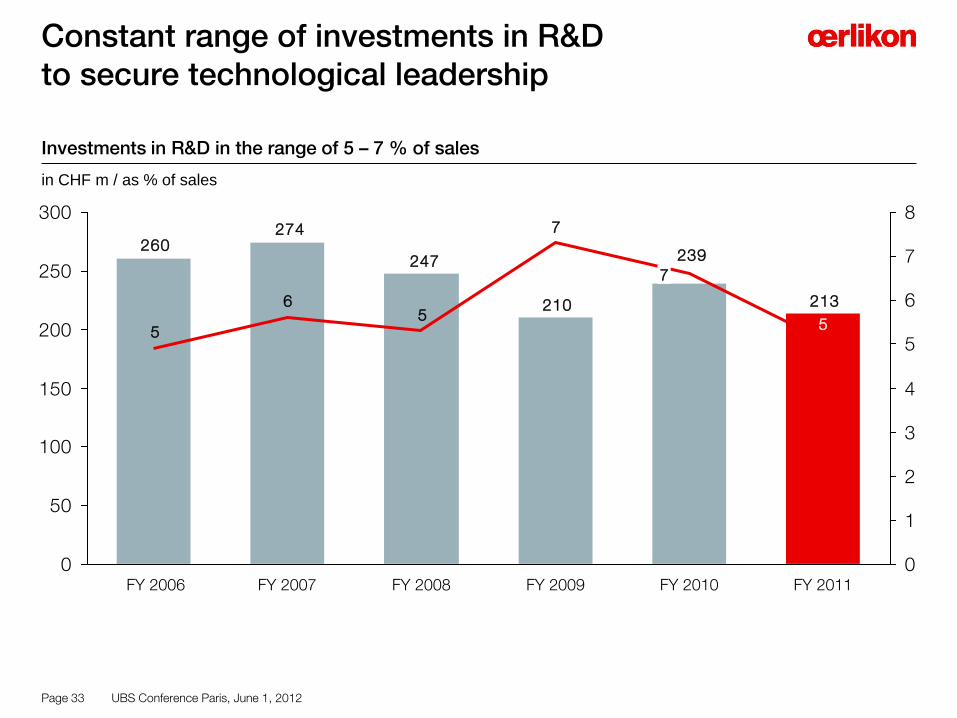
Constant range of investments in R&D to secure technological leadership
Page 33
Investments in R&D in the range of 5 – 7 % of sales
in CHF m / as % of sales
213
239
210
247
274260
7
56
5
0
50
100
150
200
250
300
0
1
2
3
4
5
6
7
8
FY 2011
5
FY 2010
7
FY 2009 FY 2008 FY 2007 FY 2006
UBS Conference Paris, June 1, 2012
save space
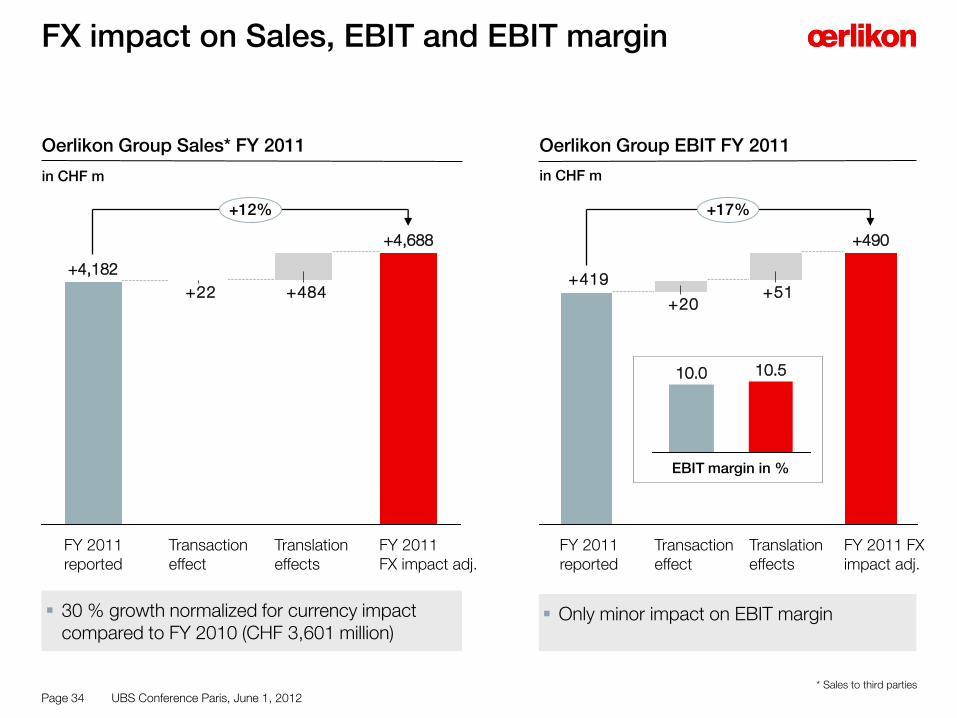
FX impact on Sales, EBIT and EBIT margin
Page 34
+484+22
+12%
FY 2011 FX impact adj.
+4,688
Translation effects
Transaction effect
FY 2011 reported
+4,182
Oerlikon Group Sales* FY 2011
in CHF m
Oerlikon Group EBIT FY 2011
in CHF m
+51+20
+419
+17%
FY 2011 FX impact adj.
+490
Translation effects
Transaction effect
FY 2011 reported
10.5 10.0
30 % growth normalized for currency impact compared to FY 2010 (CHF 3,601 million)
Only minor impact on EBIT margin
EBIT margin in %
* Sales to third parties
UBS Conference Paris, June 1, 2012
save space
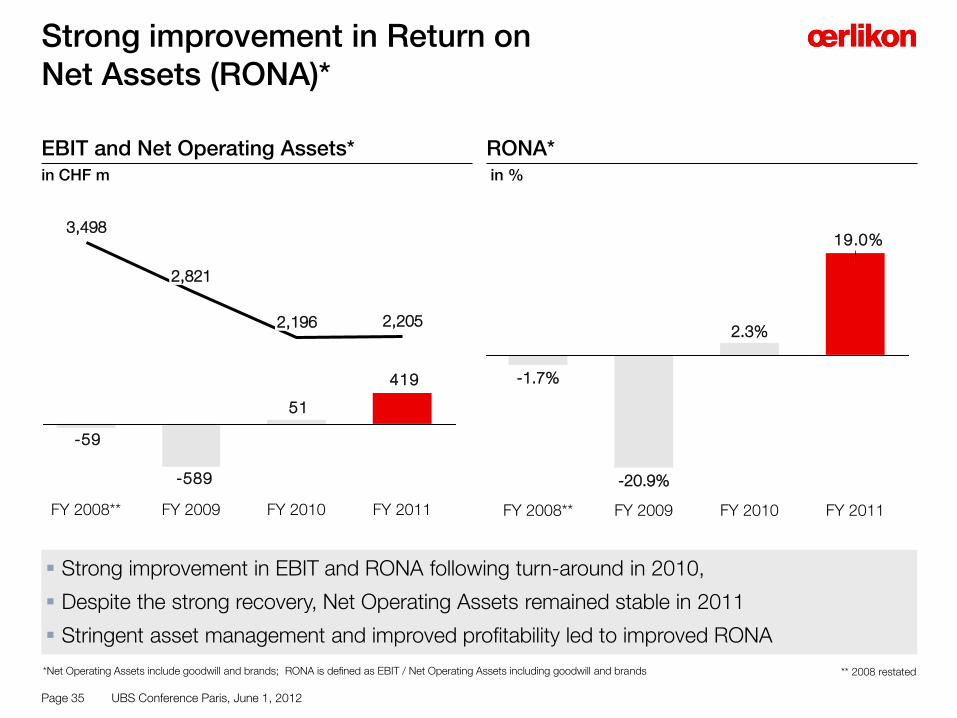
Strong improvement in EBIT and RONA following turn-around in 2010,
Despite the strong recovery, Net Operating Assets remained stable in 2011
Stringent asset management and improved profitability led to improved RONA
EBIT and Net Operating Assets* RONA*
Strong improvement in Return on Net Assets (RONA)*
Page 35
19.0%
FY 2011 FY 2010
2.3%
FY 2009
-20.9%
FY 2008**
-1.7% 419
51
-589
-59
FY 2011
2,205
FY 2010
2,196
FY 2009
2,821
FY 2008**
3,498
Label
2,000
in CHF m in %
** 2008 restated *Net Operating Assets include goodwill and brands; RONA is defined as EBIT / Net Operating Assets including goodwill and brands
UBS Conference Paris, June 1, 2012
save space
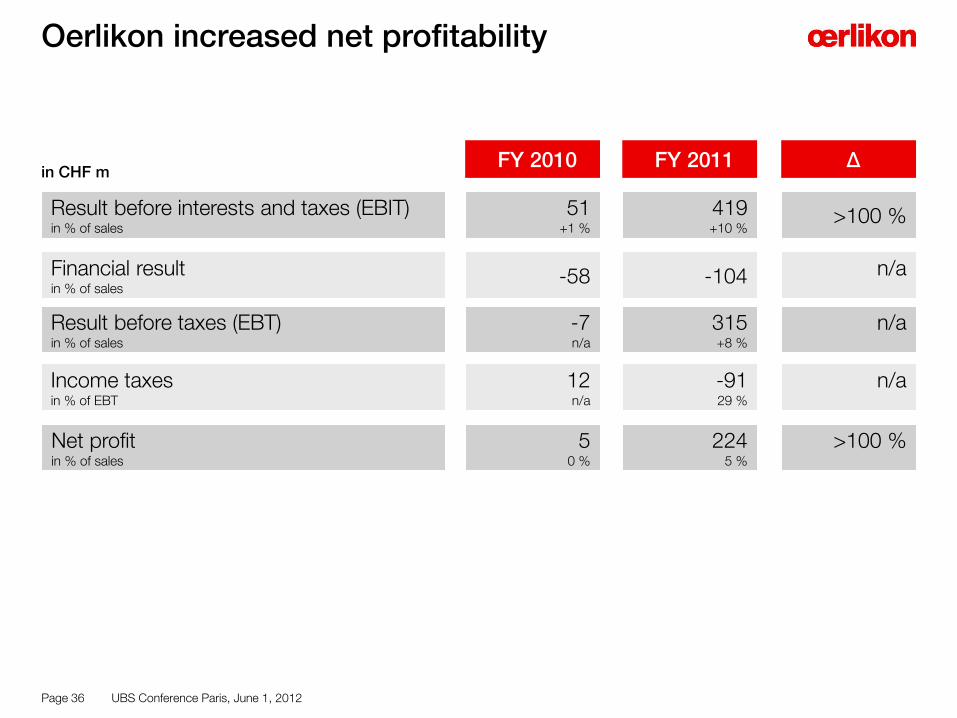
Oerlikon increased net profitability
Result before interests and taxes (EBIT) in % of sales
Financial result in % of sales
Result before taxes (EBT) in % of sales
Income taxes
in % of EBT
Net profit in % of sales
in CHF m FY 2010 FY 2011
51 +1 %
-58
-7 n/a
12 n/a
Δ
>100 %
n/a
n/a
n/a
Page 36
5 0 %
>100 %
419 +10 %
-104
315 +8 %
-91 29 %
224 5 %
UBS Conference Paris, June 1, 2012

save space
Financial Result
Page 37
315
57419
EBT FY 2011
Foreign currency loss, net
-11
Other financial expenses
-21
Interest on provisions for post-employment benefit plans
-11
Interest on financial debt
-73
Other financial income
Interest income
EBIT FY 2011
Financial income +12
Financial expense -116
in CHF m
UBS Conference Paris, June 1, 2012

save space
Tax Result
Page 38
78
224
315
Net Profit FY 2011
Deferred tax expense
13
Current income tax expense
EBT FY 2011
Tax rate of 29 %
Current income tax due to profitability contribution of most subsidiaries
Main tax payers in China, India and Germany
Deferred tax expenses mainly due to utilization of tax loss carry forwards
Mid-term targeted tax rate of around 30%
in CHF m
UBS Conference Paris, June 1, 2012
save space
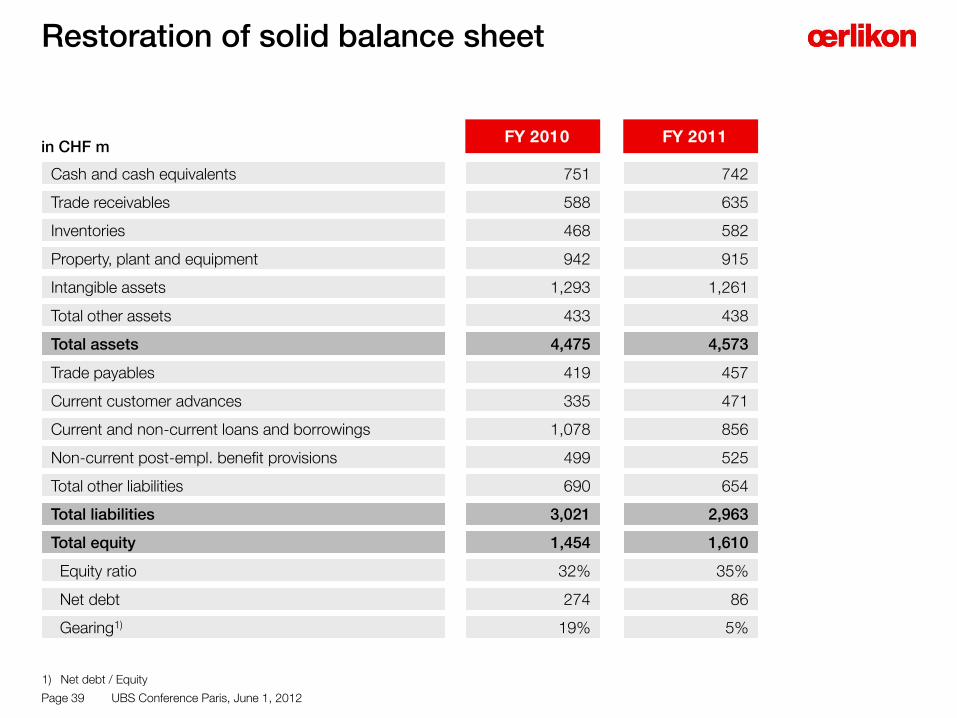
Restoration of solid balance sheet
1) Net debt / Equity
Page 39
Cash and cash equivalents
in CHF m
Trade receivables
Inventories
Property, plant and equipment
Total other assets
Total assets
Current and non-current loans and borrowings
Total liabilities
Gearing1)
Total equity
Equity ratio
Net debt
Total other liabilities
Intangible assets
Non-current post-empl. benefit provisions
Trade payables
Current customer advances
FY 2011
742
635
582
915
1,261
438
5%
4,573
856
525
654
2,963
1,610
35%
86
457
471
FY 2010
751
588
468
942
1,293
433
19%
4,475
1,078
499
690
3,021
1,454
32%
274
419
335
UBS Conference Paris, June 1, 2012

save space
Net Working Capital*
** 2007 restated
* Net Working Capital is defined as trade receivables + inventories – trade payables – current customer advances
Page 40
Net Working Capital* FY 2007- FY 2011
289302
499
837772
17%
FY 2008
18%
FY 2007**
14%
FY 2011
7%
FY 2010
8%
FY 2009
Net working capital
decreased despite higher
inventory related to higher
sales and was mainly
influenced by increased
customer advances
Net Working Capital FY 2011
at 7 % of 12-month
rolling sales
in % of sales and CHF m
UBS Conference Paris, June 1, 2012
save space
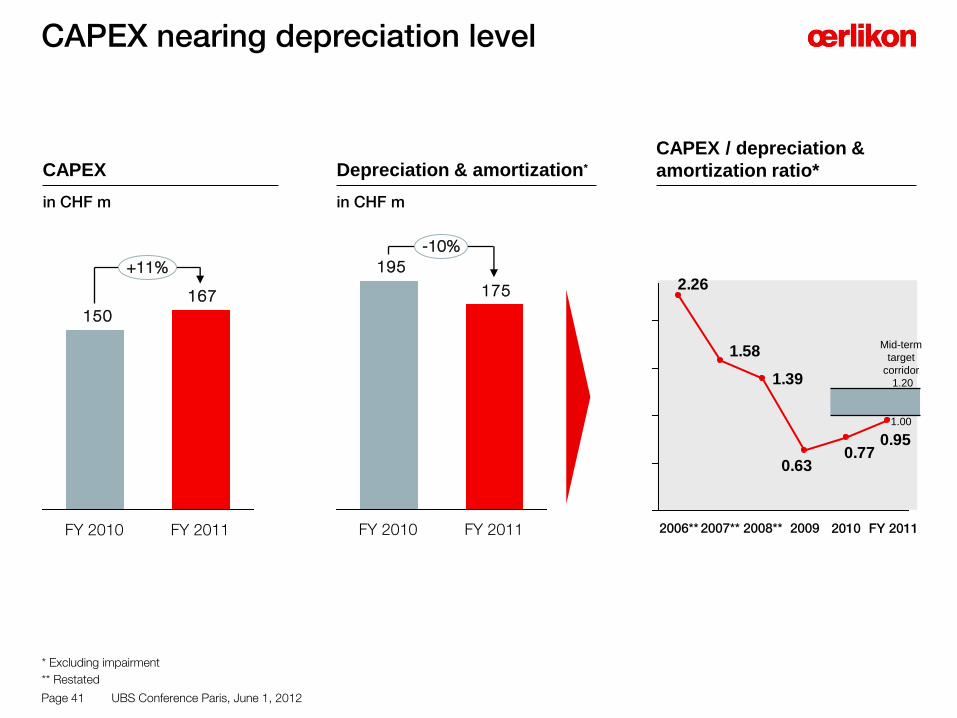
1.39
0.950.77
2.26
0.63
1.58
Depreciation & amortization* CAPEX
CAPEX / depreciation &
amortization ratio*
167
150
+11%
FY 2011 FY 2010
195
175
-10%
FY 2011 FY 2010 2007** 2008** 2006** 2009
Mid-term
target
corridor
1.20
1.00
2010
in CHF m in CHF m
CAPEX nearing depreciation level
** Restated
* Excluding impairment
Page 41
FY 2011
UBS Conference Paris, June 1, 2012
save space
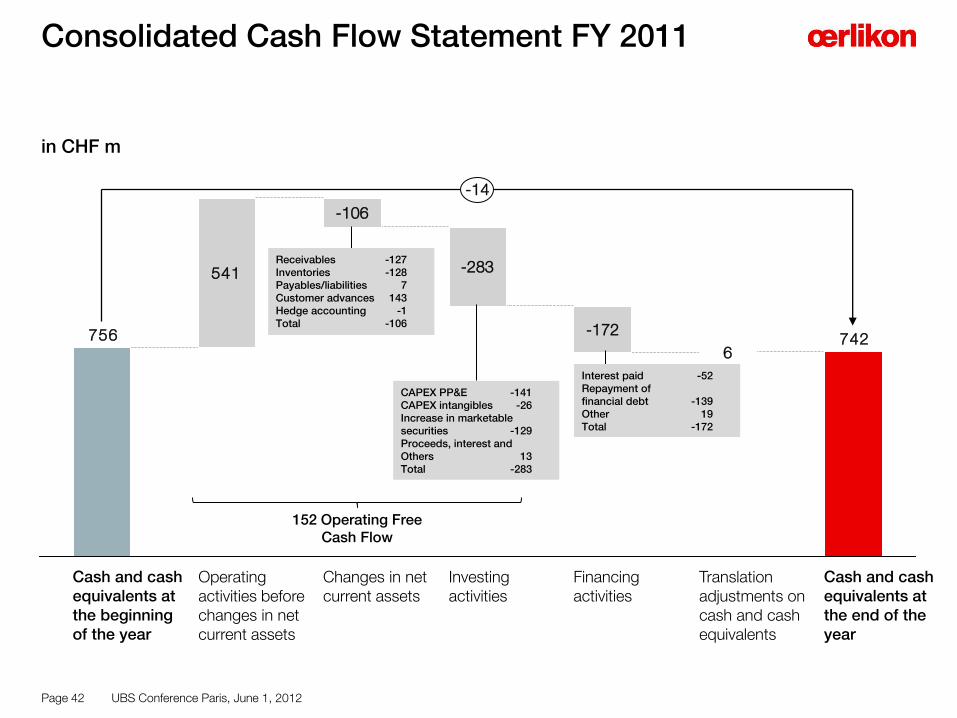
Consolidated Cash Flow Statement FY 2011
742
541
756
-14
Cash and cash equivalents at the end of the year
Translation adjustments on cash and cash equivalents
6
Financing activities
-172
Investing activities
-283
Changes in net current assets
-106
Operating activities before changes in net current assets
Cash and cash equivalents at the beginning of the year
152 Operating Free Cash Flow
CAPEX PP&E -141 CAPEX intangibles -26 Increase in marketable securities -129 Proceeds, interest and Others 13 Total -283
in CHF m
Interest paid -52 Repayment of financial debt -139 Other 19 Total -172
Receivables -127 Inventories -128 Payables/liabilities 7 Customer advances 143 Hedge accounting -1 Total -106
Page 42 UBS Conference Paris, June 1, 2012

save space
Dividend policy and dividend for 2011 Dividend yield of 4 %
Page 43
Dividend policy to pay out up to 40 % of net profit
AGM approved to pay out
CHF 0.20 per share for 2011
0.27
0.68
Up to 40% of net profit Net profit per share 2011
0.20
0.27
Max. pay-out Dividend proposal
Dividend distributed from the reserve from capital contribution
Dividend yield of 4 % based on a share price of CHF 5.03 at year-end 2011
UBS Conference Paris, June 1, 2012

save space
Investor Relations Contact
Page 44
OC Oerlikon Management AG Churerstrasse 120 CH-8808 Pfäffikon SZ Switzerland Andreas Schwarzwälder Head of Investor Relations Phone: +41 58 360 9622 Mobile: +41 79 810 8211 eMail: [email protected]
UBS Conference Paris, June 1, 2012

Oerlikon has made great efforts to include accurate and up-to-date information in this document. However, we make no representation or warranties, expressed or implied, as to the accuracy or completeness of the information provided in this document and we disclaim any liability whatsoever for the use of it.
This presentation is based on information currently available to management. The forward-looking statements contained herein could be substantially impacted by risks and influences that are not foreseeable at present, so that actual results may vary materially from those anticipated, expected or projected. Oerlikon is under no obligation to (and expressly disclaims any obligation to) update or alter its forward-looking statements, whether as a result of new information, future events, or otherwise.
All information provided in this document is not intended as, and may not be construed as, an offer or solicitation for the purchase or disposal, trading or any transaction in any Oerlikon securities. Investors must not rely on this information for investment decisions.
Disclaimer
Page 45 UBS Conference Paris, June 1, 2012
Top Related