


Languages
Pages
Legal

SPE 119242
How to Use and Misuse Proppant Crush Tests –
E i th T 10 M thExposing the Top 10 Myths
John Kullman, CARBO Ceramics
T. T. Palisch, M. Chapman, R. Duenckel, and S. Woolfolk CARBO Ceramics IncWoolfolk, CARBO Ceramics, Inc. M. C. Vincent, Insight Consulting

Outline• Introduction/Motivation• Crush Test Procedure
M ths• Myths–Misuse/misapplicationpp
• Summary
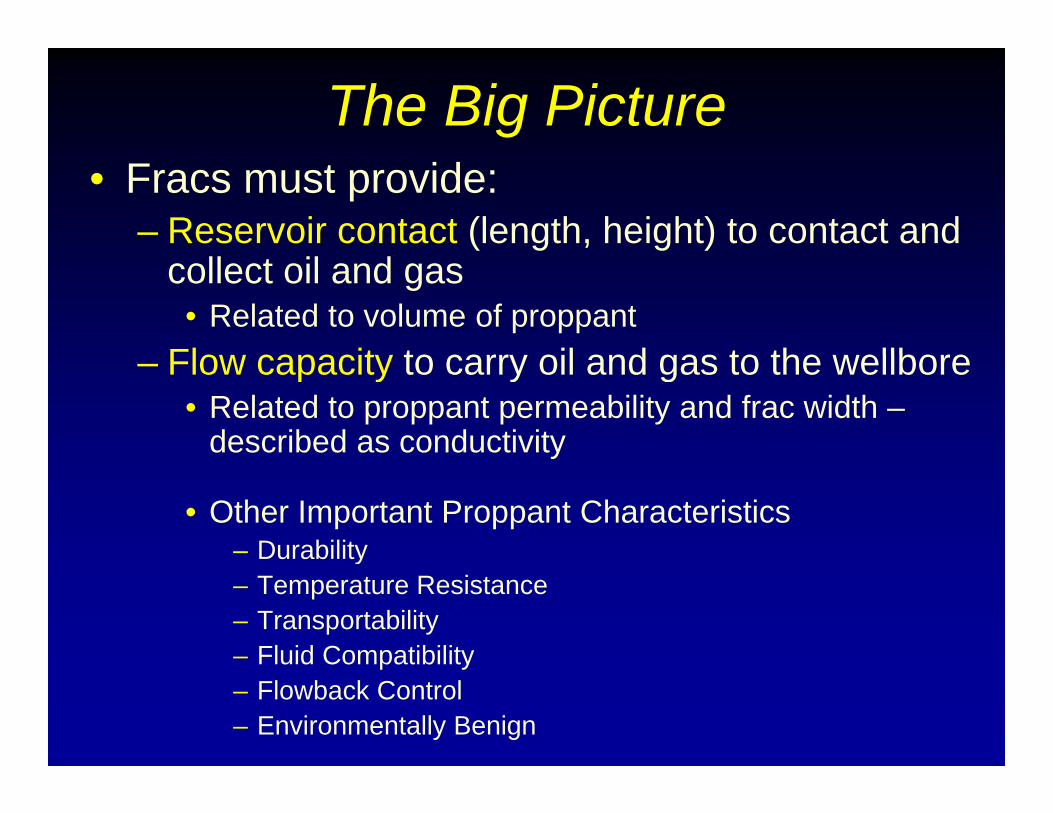
The Big Picture• Fracs must provide:
– Reservoir contact (length, height) to contact and collect oil and gas
• Related to volume of proppantFlow capacity to carry oil and gas to the wellbore– Flow capacity to carry oil and gas to the wellbore
• Related to proppant permeability and frac width –described as conductivityy
• Other Important Proppant Characteristics– Durabilityy– Temperature Resistance– Transportability– Fluid CompatibilityFluid Compatibility– Flowback Control– Environmentally Benign

Question…G W ll• Gas Well – 7500 psi stress– You can successfully place a 16/20 or 16/30
sized proppant
• Two choices of proppant– Proppant A – 16/20 Ceramic, 14% Crush (7.5k)– Proppant B – 16/30 Ceramic, 7.5% Crush (7.5k)– Which proppant would you choose?– What if I told you that they had the same MPD?y y– What would you be willing to pay for your choice?
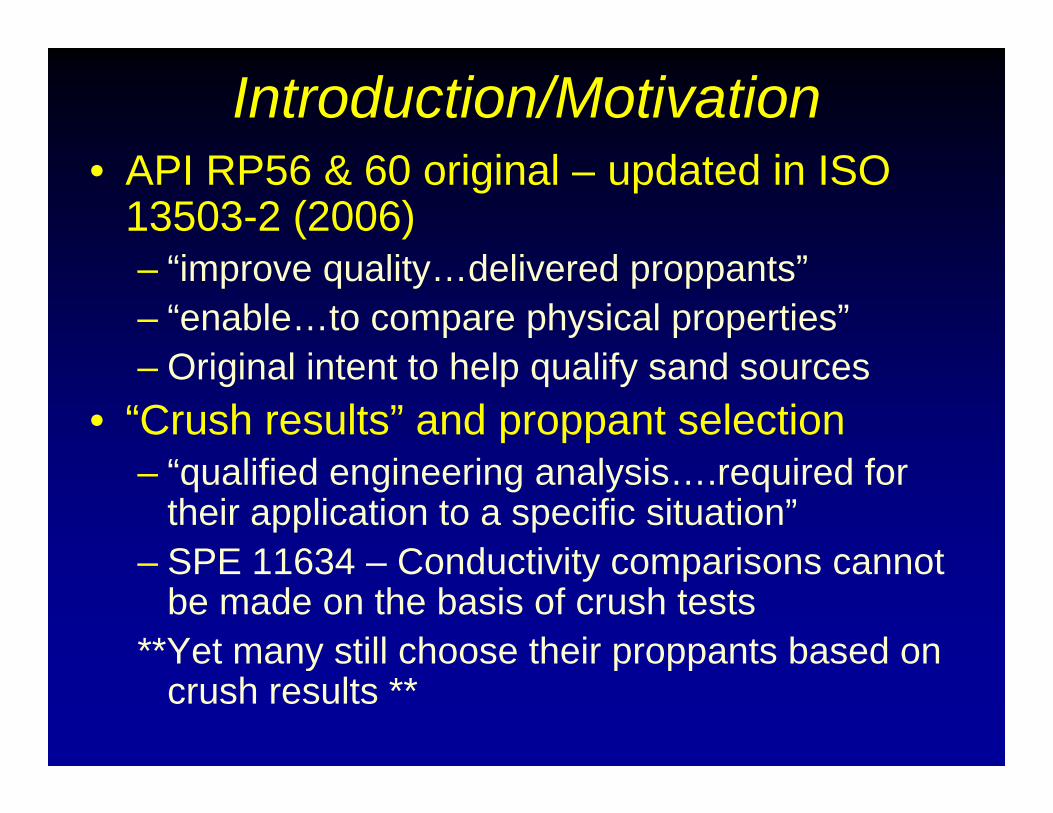
Introduction/Motivation• API RP56 & 60 original – updated in ISO
13503-2 (2006)– “improve quality…delivered proppants”– “enable…to compare physical properties”
O i i l i t t t h l lif d– Original intent to help qualify sand sources• “Crush results” and proppant selection
“ lifi d i i l i i d f– “qualified engineering analysis….required for their application to a specific situation”SPE 11634 Conductivity comparisons cannot– SPE 11634 – Conductivity comparisons cannot be made on the basis of crush tests
**Yet many still choose their proppants based onYet many still choose their proppants based on crush results **

ISO 13503-2 Crush Test ProcedureP t i i d t• Proppant is pre-sieved to remove particles outside of stated mesh range.D t l d i t l• Dry proppant placed in steel cell at ~4 lb/sq ft (sand equivalent)Room temperature• Room temperature
• Proppant evenly distributed with level surfaceL d li d t if t• Load applied at uniform rate
• Constant stress maintained for two minutes
• Proppant is sieved. The weight percent which falls below the primary screen is reported. – For 16/20 proppant all material < 20 mesh is reported as “fines”For 16/20 proppant all material 20 mesh is reported as fines – For 30/50 proppant all material < 50 mesh is reported as “fines”

ISO 13503-2 Crush Test ProcedureDo these reflect realistic conditions?• Proppant is pre-sieved.• Proppant Loading – sand/RCS/LWC ~4 lb/ft2,
IDC 4.8 lb/ft2, Bauxite ~5.2 lb/ft2• Smooth, steel plates – embedment?• “Carefully loaded”y• Dry, room temperature• 2000 psi/min relaxed after 2 minutes2000 psi/min, relaxed after 2 minutes• Only the particles smaller than bottom screen
are considered “fines” or “crush”are considered fines or crush

Are the results repeatable/reliable?Crush Cell Loading critical• “variance in crush results….associated with
method of loading…” • Significant efforts ongoing on ISO CommitteeSignificant efforts ongoing on ISO Committee
and StimLab to alleviate variations in resultsLoading technique thought to be the cause– Loading technique thought to be the cause
– Lab to lab, technician to technician, equipment to equipmentequipment
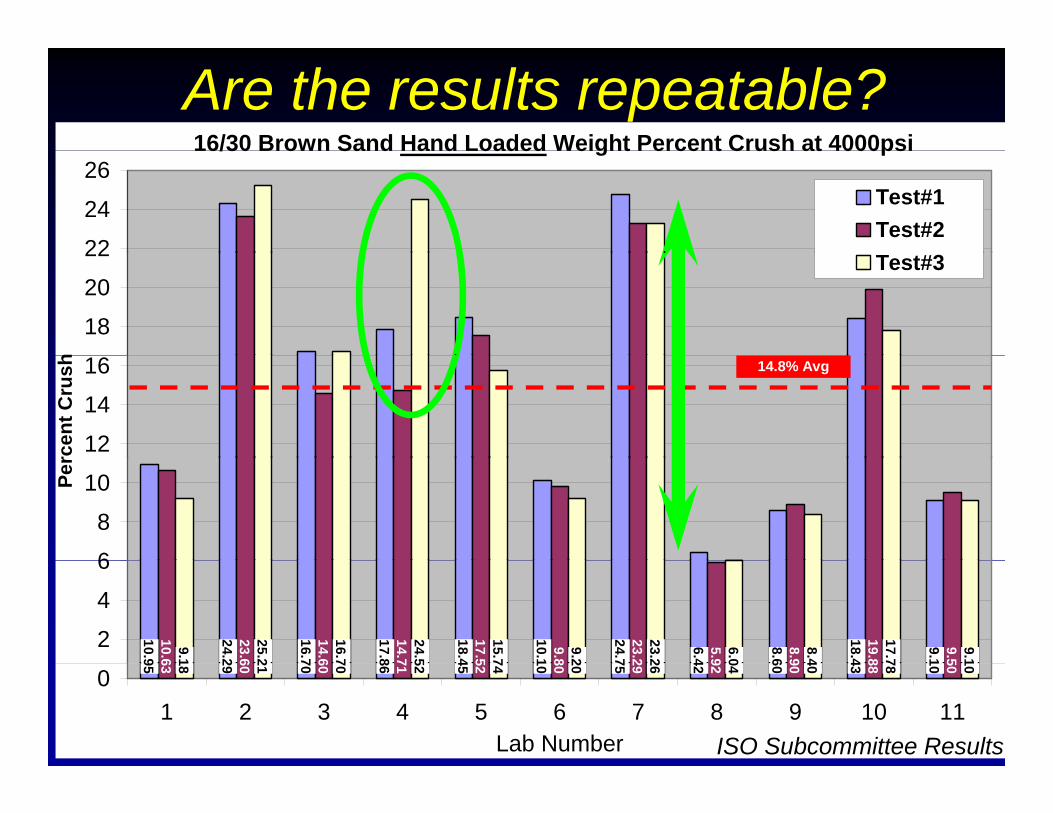
16/30 Brown Sand Hand Loaded Weight Percent Crush at 4000psi
Are the results repeatable?16/30 Brown Sand Hand Loaded Weight Percent Crush at 4000psi
22
24
26Test#1Test#2
18
20
22
h
Test#3
12
14
16
rcen
t Cru
sh 14.8% Avg
6
8
10Per
10.9
24.2
16.7
17.8
18.4
10.1
24.7
6.4
8.6
18.4
9.1
10.6
23.6
14.6
14.7
17.5
9.8
23.2
5.9
8.9
19.8
9.5
9.1
25.2
16.7
24.5
15.7
9.2
23.2
6.0
8.4
17.7
9.1
2
4
6
95 29 70 86 45 10 75 42 60 43 1063 60 60 71 52 80 29 92 90 88 5018 21 70 52 74 20 26 04 40 78 10
01 2 3 4 5 6 7 8 9 10 11
Lab Number ISO Subcommittee Results

16/30 Brown Sand Mechanical Loaded Weight Percent Crush at 18
Are the results repeatable?4000psi
16
18Test#1Test#2
12
14
h
Test#3
8
10
rcen
t Cru
sh 10.0% Avg
4
6
8
Per
9.
11.
12.
10. 9. 7. 9. 8. 9.
10.9.
16.
12.
10. 9. 8.
10. 8. 7.
10.9. 8.
12.
10.
10. 7.
10. 8. 7.
10.
2
4
No data reported.26
.41
.80
.79
.85
.76
.94
.40
.23
.60
.40
.66
.00
.89
.07
.40
.22
.20
.50
.80
.79
.96
.00
.32
.53
.80
.49
.40
.50
.10
01 2 3 4 5 6 7 8 9 10 11
Lab Number ISO Subcommittee Results

Does Fracture Width Affect Crush?• Interior grains loaded “evenly” • Exterior grains have fewer g
load points• Crush increases significantlyCrush increases significantly
as proppant loading decreasesdecreases
• For a 20/40 proppant, there are approximately 24 layers of proppant in standard crush test24 layers of proppant in standard crush test.– 8% are exterior grains
1 lb/ft2 i 6 l f 20/40 t• 1 lb/ft2 is ~6 layers of 20/40 proppant– 33% are exterior grains

Crush Depends Upon Frac Width!p p
30
25
30
15
20
Cru
sh
10
15
erce
nt
5
P
04 lb/sq ft 2 lb/sq ft 1 lb/sq ft 0.5 lb/sq ft 0.25 lb/sq ft Monolayer
~ 0.2 lb/sq ft

100%
Crush vs # LayersCrush at 10,000 psi
20/40 Proppants
80%
90%White SandELWCRCSB it C i
60%
70%
Bauxite Ceramic
1 lb/ft2
40%
50%
60%
% C
rush
1 lb/ft21 lb/ft2
B it
Sand & RCS
20%
30%
40% 1 lb/ft2
ELWCBauxite
10%
20%
0%0 1 2 3 4 5 6 7 8 9 10
# of Layers

100%
Crush vs # LayersCrush at 1000 psiAll 20/40 Proppants
80%
90%White SandRCSELWCBauxite Ceramic
60%
70%
h
40%
50%
% C
rush
20%
30%1 lb/ft2
Sand & 1 lb/ft2 1 lb/ft2
0%
10%RCSELWCBauxite
0 1 2 3 4 5 6 7# of Layers
Partial Monolayer

RANGE OF FRACTURE COMPLEXITYSPE 77441SPE 77441
Simple Fracture Complex Fracturep p
Very Complex Fracture NetworkComplex fracs are
believed to provide less cumulative conductivity
than simple widerthan simple, wider fractures

Vertical Complexity D T J i tDue To Joints
Physical evidence of fractures nearlyfractures nearly always complex
NEVADA TEST SITENEVADA TEST SITEHYDRAULIC FRACTURE
MINEBACK16

Uniform Packing Arrangement?Arrangement?
Pinch out, proppant ill i lpillars, irregular distribution?
Is this ribbon laterally yextensive and continuous for hundreds orhundreds or
thousands of feet?17

Are Large Particles weaker than Small?1488 2 18 714
80.00
let
1488 2 18 714
80.00
1488 2 18 714
80.00
let
Si l P ll t C h NO!!y = 1488.2x - 18.714
R2 = 0.7765
50.00
60.00
70.00
ush
one
pell y = 1488.2x - 18.714
R2 = 0.7765
50.00
60.00
70.00 y = 1488.2x - 18.714R2 = 0.7765
50.00
60.00
70.00
ush
one
pell Single Pellet Crush
20 00
30.00
40.00CP
F
12/18Forc
e to
cru
20 00
30.00
40.00CP
F
12/1820 00
30.00
40.00CP
F
12/18Forc
e to
cru
141618
0.00
10.00
20.00
20/4016/20
12/18
Pou
nds
of F
0.00
10.00
20.00
20/4016/20
12/18
0.00
10.00
20.00
20/4016/20
12/18
Pou
nds
of F
81012
nt C
rush0.0000 0.0100 0.0200 0.0300 0.0400 0.0500 0.0600
Proppant Size inches
P 0.0000 0.0100 0.0200 0.0300 0.0400 0.0500 0.0600Proppant Size inches
0.0000 0.0100 0.0200 0.0300 0.0400 0.0500 0.0600Proppant Size inches
P
Courtesy Stim-Lab
468
Perc
e
02
30/50 LWC 20/40 LWC 16/20 LWC 12/18 LWC

For all proppant types, larger grains have greater individual strength
140
160
greater individual strength.
100
120
140
CarboLiteHi k
12/18
20/40
60
80
100
CPF
HickoryInterpropCoSilicaJordan
20
40
ResinPR
00 0.02 0.04 0.06 0.08 0.1 0.12
Proppant Size, inchespp ,
Source: Stim-Lab Consortium, July 2001 1.8-16

Another Look at Single Grain Strengths…
140
160
100
120
140
CarboLiteHi k
12/18
20/40
60
80
100
CPF
HickoryInterpropCoSilicaJordan
20
40
ResinPR
Note that application of resin does not improve
00 0.02 0.04 0.06 0.08 0.1 0.12
Proppant Size, inches
pgrain strength, but rather improves distribution of stress between grains pp ,
Source: Stim-Lab Consortium, July 2001 1.8-16
and encapsulates fines.

So why does crush increase ith l t ?with large proppants?
• Strength in numbers?

“There’s Strength in Numbers”
Smaller mesh sizes distribute the load to across more particles compared to larger mesh sizes
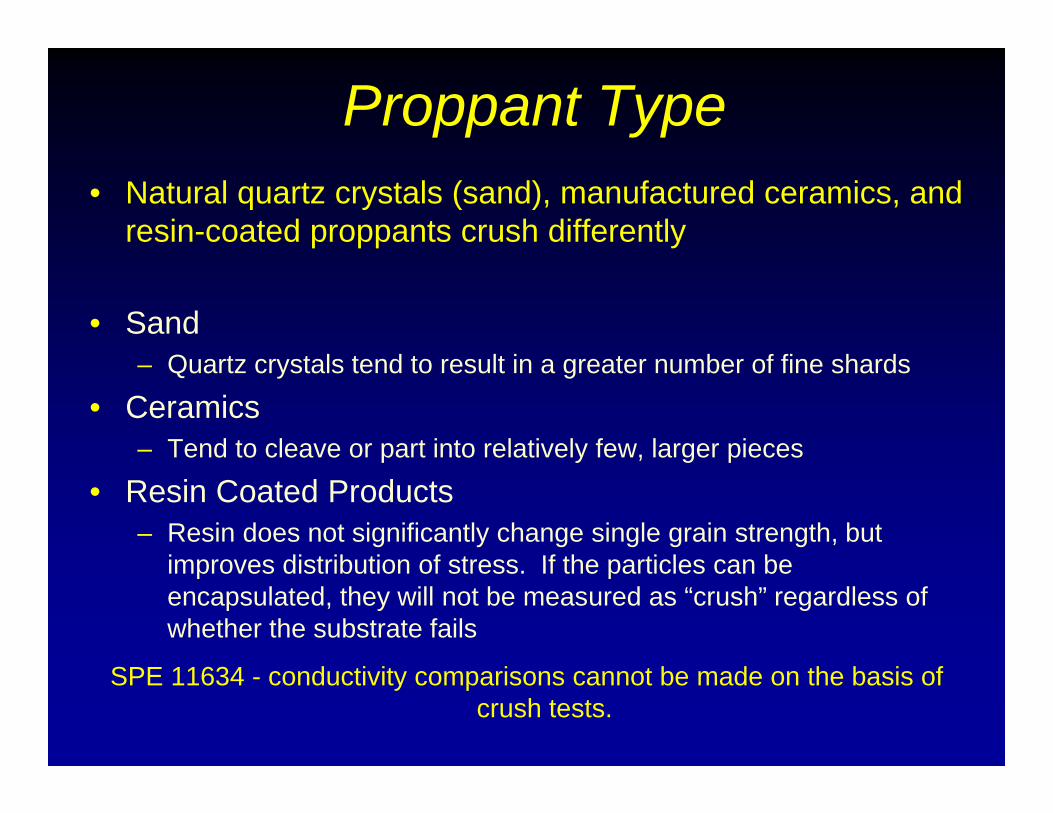
Proppant Type • Natural quartz crystals (sand), manufactured ceramics, and
resin-coated proppants crush differently
• SandQ t t l t d t lt i t b f fi h d– Quartz crystals tend to result in a greater number of fine shards
• Ceramics– Tend to cleave or part into relatively few, larger piecesp y , g p
• Resin Coated Products– Resin does not significantly change single grain strength, but
improves distribution of stress If the particles can beimproves distribution of stress. If the particles can be encapsulated, they will not be measured as “crush” regardless of whether the substrate fails
SPE 11634 - conductivity comparisons cannot be made on the basis of crush tests.

Do all Proppants Fail in the Same Manner?When they failWhen they fail…– Sands shatter like a glass
C i l lik b i k– Ceramics cleave like a brick– Resin Coated products
“deform”; fines captured
Brown Sand t 6k i
deform ; fines captured
at 6k psi.
IDC at 8k psi. RCS at 8k psi.

R b
Do fines affect all proppants similarly?Remember…• All proppants do not fail in the same manner
– The fines generated by one proppant may look drastically different than those generated by
thanother.• The packing arrangement for similarly sized
proppants are not the same for all types of proppants.– i.e. the packing arrangement for a 20/40
ceramic, 20/40 RCS and 20/40 Sand will be diff t t bl tdifferent even at comparable stresses.
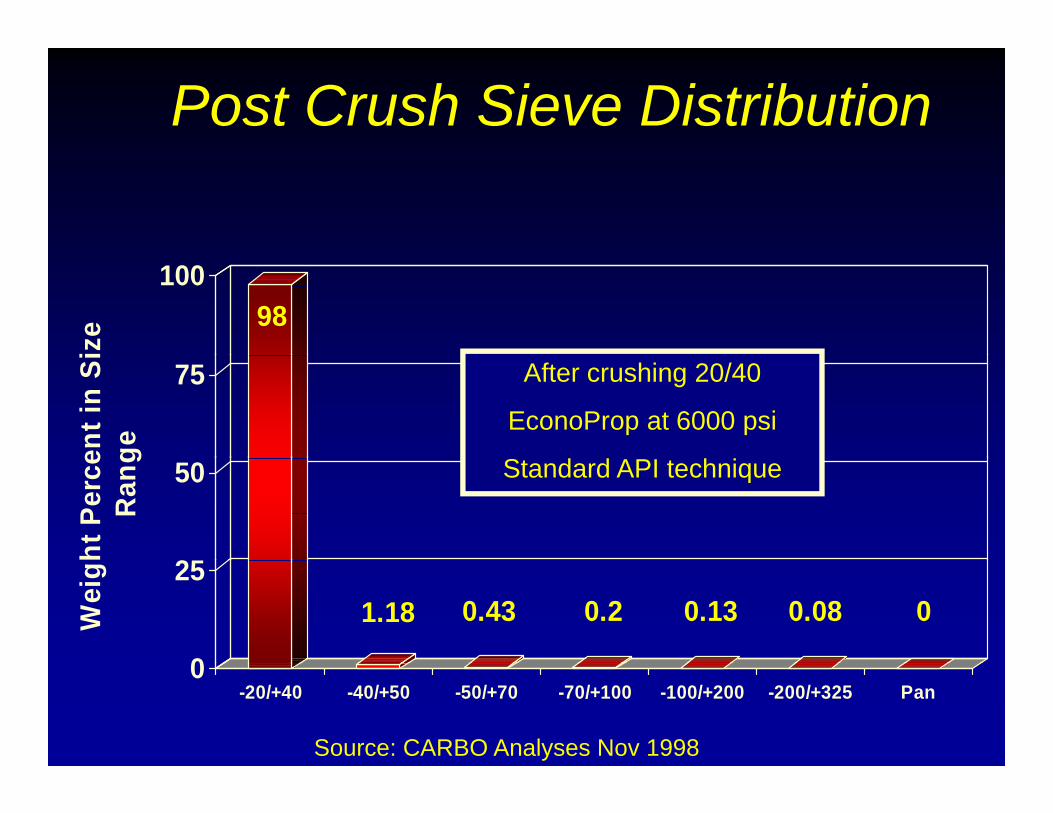
Post Crush Sieve Distribution
98100
ize
75
ent i
n Si
ge
After crushing 20/40
EconoProp at 6000 psi
25
50
ht P
erce
Ran
g Standard API technique
1.18 0.43 0.2 0.13 0.08 0
0
25
Wei
g
Source: CARBO Analyses Nov 1998
0-20/+40 -40/+50 -50/+70 -70/+100 -100/+200 -200/+325 Pan

A Closer Look at the Crushed FractionA Closer Look at the Crushed Fraction “2% fines” reported with standard
testing could mean 2 cleaved grains
1.181.00
1.20
Immobile cleaved grains
testing could mean 2 cleaved grains per 100 (4 immobile pieces), or it could represent 400 mobile fragments in the
100-mesh range
0.80
Cru
sh
Immobile cleaved grains It makes a difference!
0.43
0.20.40
0.60
Perc
ent C Potentially mobile in 20/40 pack
(SPE 24008)
0.13 0.0800.20
P
0.00-40/+50 -50/+70 -70/+100 -100/+200 -200/+325 Pan
Source: CARBO Analyses Nov 1998
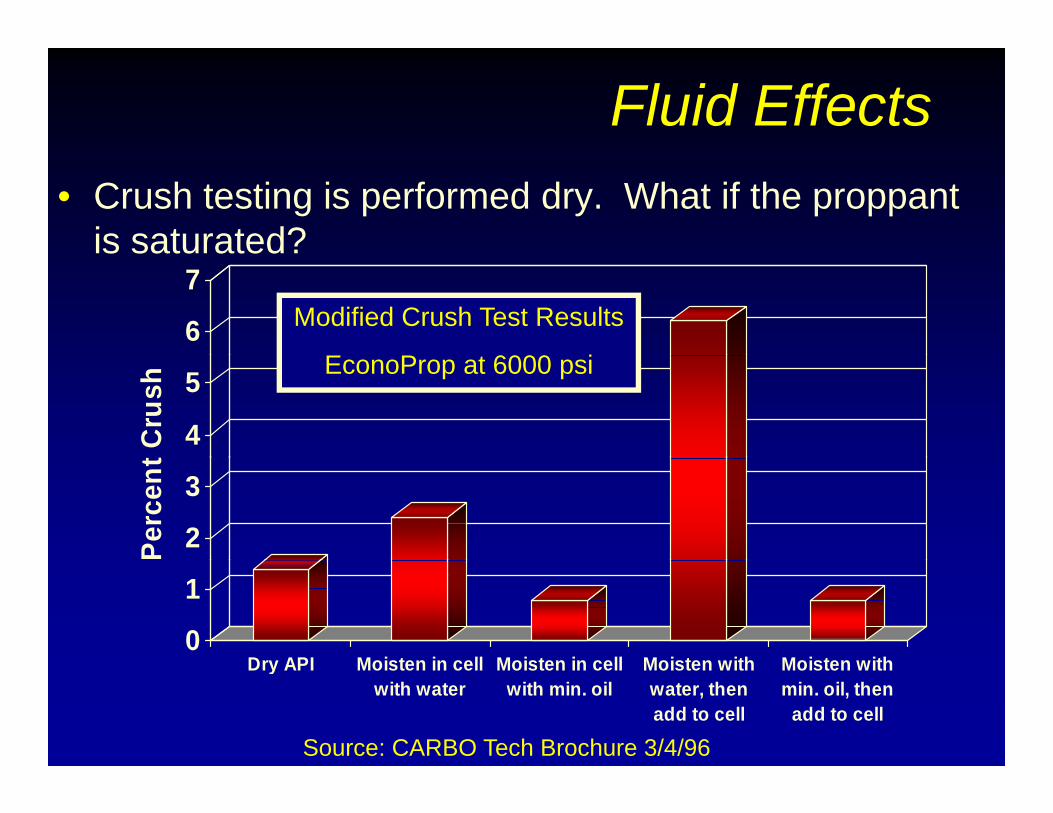
Fluid Effects• Crush testing is performed dry. What if the proppant
is saturated?is saturated?
6
7Modified Crush Test Results
E P t 6000 i
4
5
t Cru
sh
EconoProp at 6000 psi
2
3
Perc
ent
0
1
Dry API Moisten in cell Moisten in cell Moisten with Moisten with
Source: CARBO Tech Brochure 3/4/96
Dry API Moisten in cellwith water
Moisten in cellwith min. oil
Moisten withwater, thenadd to cell
Moisten withmin. oil, then
add to cell
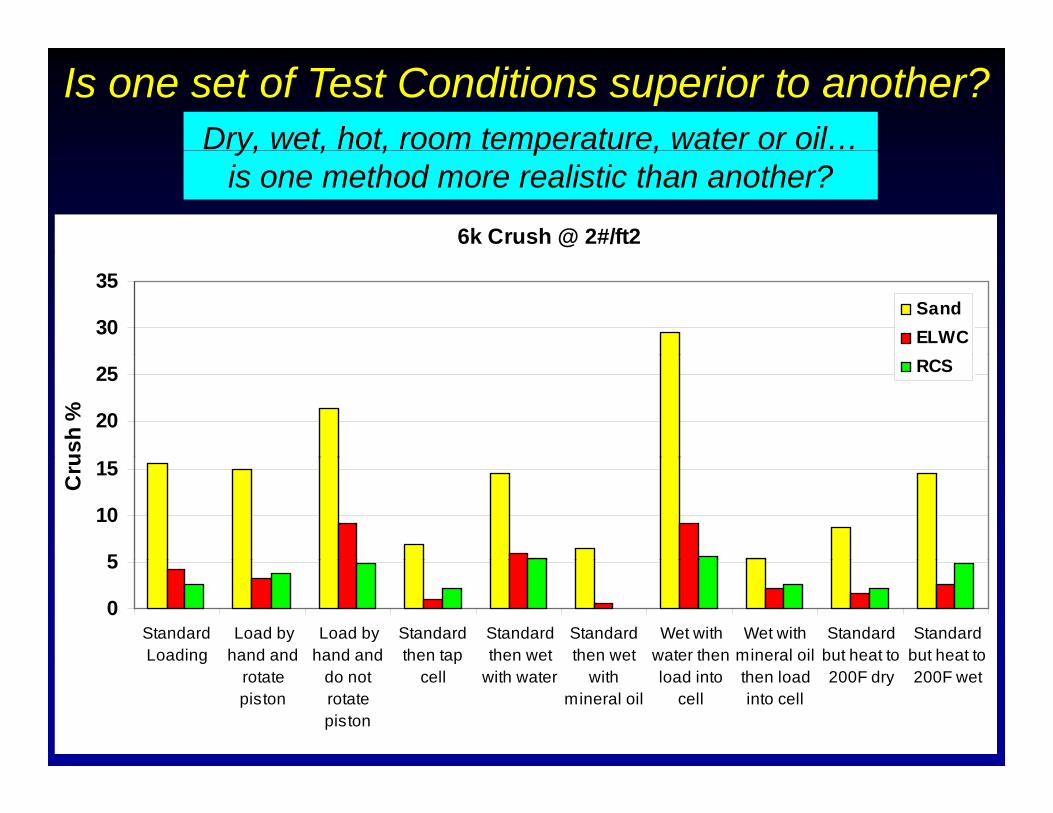
Is one set of Test Conditions superior to another?Dry, wet, hot, room temperature, water or oil…
6k Crush @ 2#/ft2
y, , , p ,is one method more realistic than another?
30
35SandELWC
20
25
ush
%
RCS
5
10
15
Cru
0
5
StandardLoading
Load byhand and
Load byhand and
Standardthen tap
Standardthen wet
Standardthen wet
Wet withwater then
Wet withmineral oil
Standardbut heat to
Standardbut heat tog
rotatepiston
do notrotatepiston
pcell with water with
mineral oilload into
cellthen loadinto cell
200F dry 200F wet
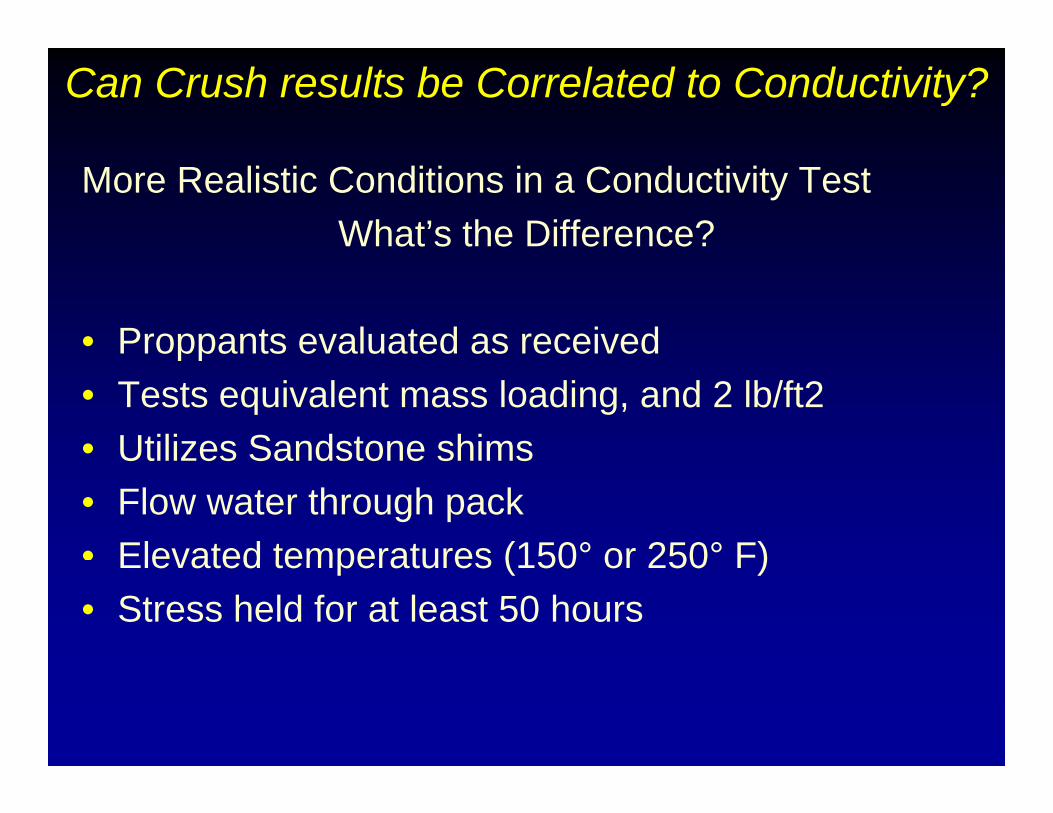
Can Crush results be Correlated to Conductivity?
More Realistic Conditions in a Conductivity TestWhat’s the Difference?
• Proppants evaluated as receivedpp• Tests equivalent mass loading, and 2 lb/ft2• Utilizes Sandstone shimsUtilizes Sandstone shims• Flow water through pack• Elevated temperatures (150° or 250° F)Elevated temperatures (150 or 250 F)• Stress held for at least 50 hours

Disassembled API Proppant Cell
Ports for MeasuringDifferential Pressure Temperature Port
Proppant Bed
Sandstone CoresFlow ThroughProppant Bed
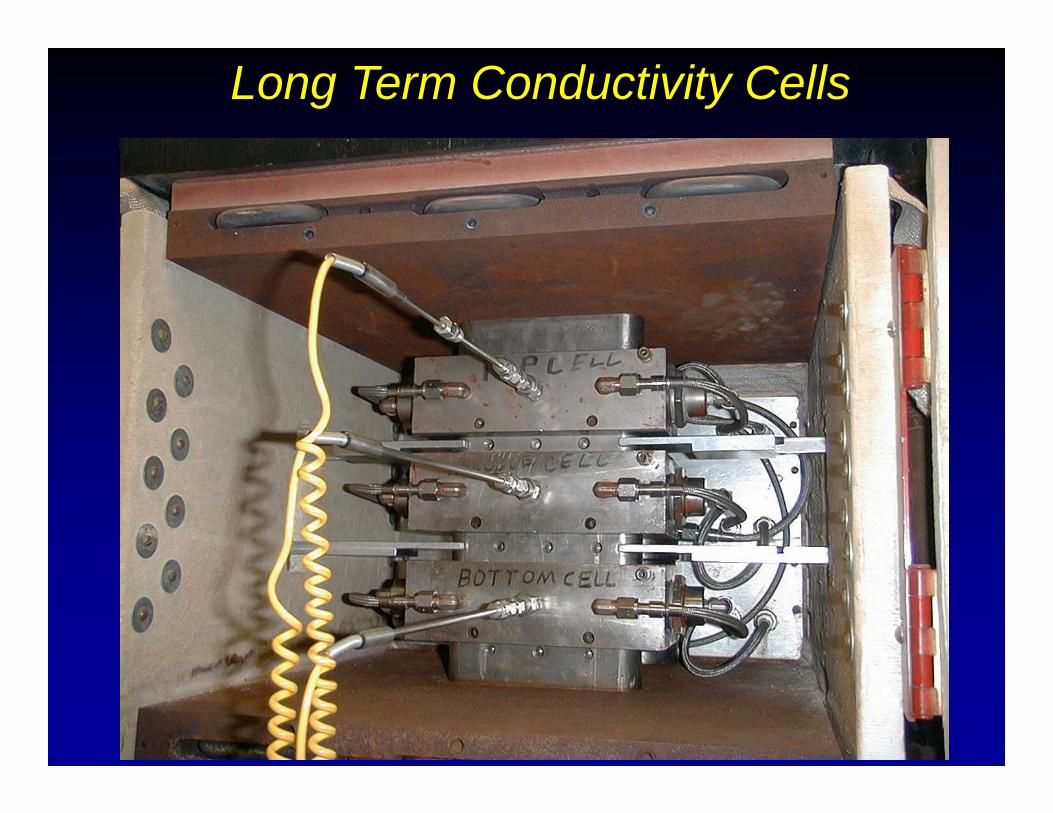
Long Term Conductivity Cells
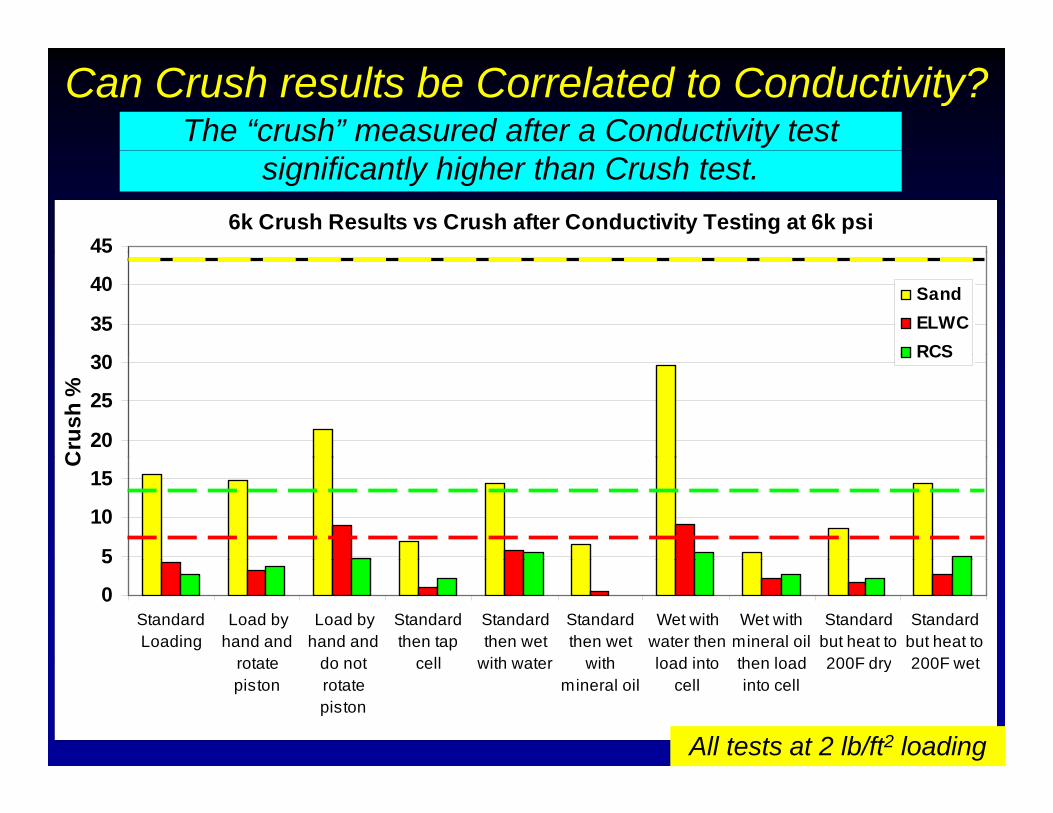
Can Crush results be Correlated to Conductivity?The “crush” measured after a Conductivity test
6k Crush Results vs Crush after Conductivity Testing at 6k psi45
significantly higher than Crush test.
30
35
40 SandELWCRCS
20
25
30
Cru
sh %
RCS
5
10
15
C
0
5
StandardLoading
Load byhand and
rotate
Load byhand and
do not
Standardthen tap
cell
Standardthen wet
with water
Standardthen wet
with
Wet withwater thenload into
Wet withmineral oilthen load
Standardbut heat to200F dry
Standardbut heat to200F wetrotate
pistondo notrotatepiston
cell with water withmineral oil
load intocell
then loadinto cell
200F dry 200F wet
All tests at 2 lb/ft2 loading

EmbedmentEmbedment
More width retained, but lower perm

Spalling
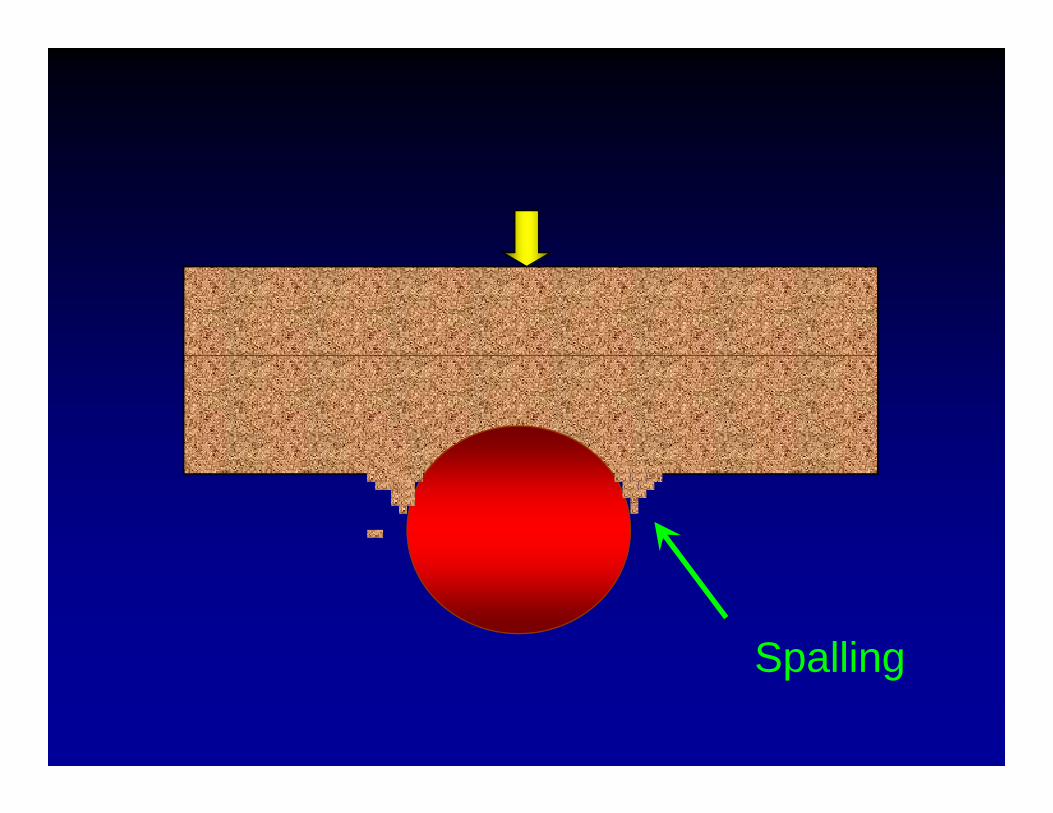
SpallingSpalling

Example of Conductivity Loss CO N D U CT IV IT Y V S . CLO S U R E S T R E S S
100000YME=5E6psi
10000S t im - L a b In c .
P re d k F 0 2
YME=5E6psiYME=1E6psiYME=.5E6psiYME=.1E6psi
1000`
10
100
100 2000 4000 6000 8000 10000 12000
C L O S U R E S T R E S S - P S I
1 0lb/ ft 20/40B d 150°F 1 0lb/ ft 20/40B d 150°F1.0lb/s qft 20/40Badger150°F 1.0lb/s qft 20/40Badger150°F
1.0lb/s qft 20/40Badger150°F 1.0lb/s qft 20/40Badger150°F
Source: Stim-Lab Consortium, Feb 2002 1.6-46
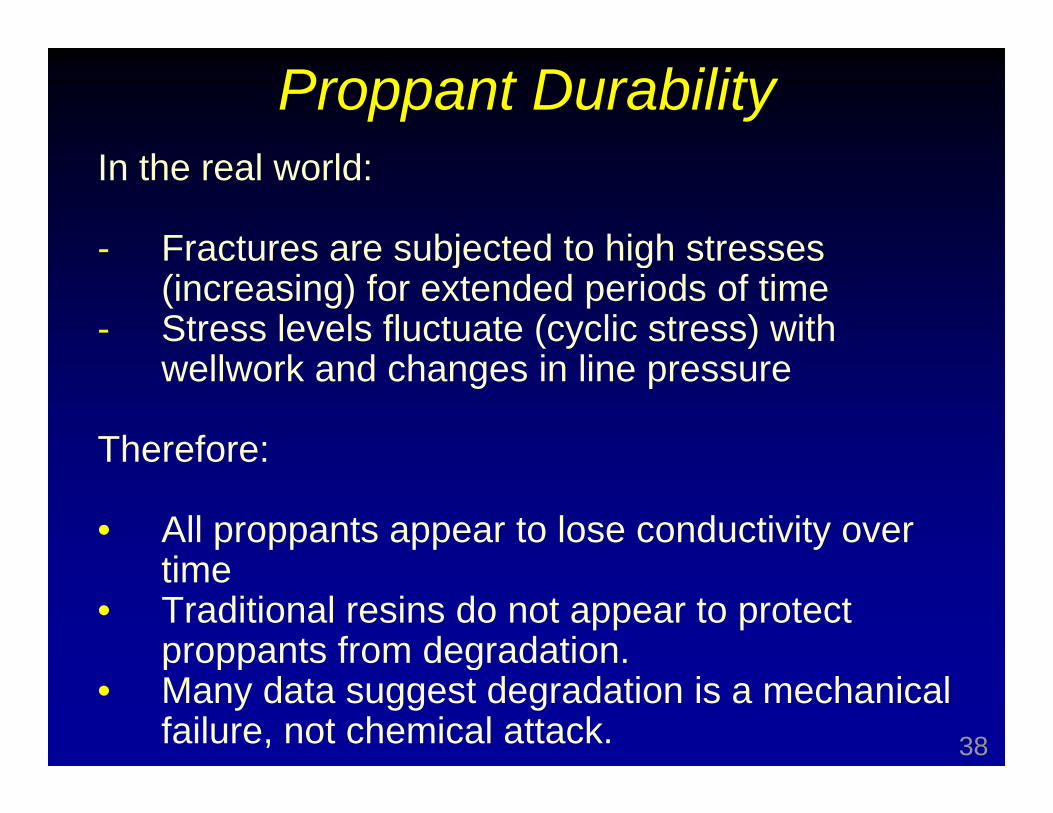
Proppant DurabilityIn the real world:
- Fractures are subjected to high stressesFractures are subjected to high stresses (increasing) for extended periods of time
- Stress levels fluctuate (cyclic stress) with ll k d h i liwellwork and changes in line pressure
Therefore:Therefore:
• All proppants appear to lose conductivity over titime
• Traditional resins do not appear to protect proppants from degradation.p oppa s o deg ada o
• Many data suggest degradation is a mechanical failure, not chemical attack. 38

Proppant Durability• Traditional “long term” conductivity tests maintain
stress on proppant for 50 hours– It is known that proppants continue to degrade beyond
50 hours, but this was a practical compromise between laboratory expense and accuracy Fig 4 SPE 16415laboratory expense and accuracy. Fig 4, SPE 16415
1000
d-ft) 20/40 Jordan sand,
8000 psiLonger test captures a portion of
ctiv
ity (m
d 8000 psiLonger test captures a portion of the time-dependent decline. We
know degradation continues beyond this, but modern “50 hour”
100Con
ducy ,
tests include correction for initial repacking/etc.
This phenomenon occurs even0 25 50 75 100
Hours at Constant Stress
This phenomenon occurs even with silica saturation
Reference: SPE 16415 Norton and Stim-Lab

Extended duration tests:1984
(75 & 250F)API “short term” cell: Metal plates, continuous flowing 2% KCl,
Non silica saturated
Fig 19, SPE 12616 between metal plates100
vity
Non-silica saturated
60
80
Con
duct
iv 20/40 Sand at 75F10/20 Sand at 250F
20
40
Orig
inal
C
00 30 60 90 120 150 180 210 240 270 300
% O
Reference: SPE 12616 by Montgomery, Steanson, Schlumberger
Days at Constant Stress, 5000 psi
40

Published extended duration tests:19861986
93C (200F)All non-corrodible surfaces, prop in
Teflon tube, continuous flowing 2% KCl 1986(300F)
Fig 4, SPE 14133
0.8
1
Rat
io
(300F)Teflon tube, continuous flowing 2% KCl,
Non-silica saturated
0.4
0.6
mea
bilit
y R
CarboPROP at 10,000 psi (69 MPa)CarboLITE at 10,000 psi (69 MPa)
SPE Drilling, April 1986, page 510000
md-
ft)
0
0.2
0 15 30 45 60 75
Perm CarboLITE at 10,000 psi (69 MPa)
Sand at 5000 psi (35 MPa)1000
nduc
tivity
(mInterpropProflow
Days at Constant Stress100
0 10 20 30 40 50
Days at Constant Stress, 8500 psi
Con RCS
Ottawa Sand
References: SPE 14133 by CARBO, SPE Drilling article by Norton-Alcoa Proppants and TerraTek Research
41

Temperature Correction for White SandAt 6500 psi and 250F, 20/40 White Sand loses
40% f it d ti it d t 150F
1
20/40 Premium White Sand
r
40% of its conductivity compared to 150F.
0.8
1
eg F
, fac
tor
0.6
from
150
de
0.4150 deg F
Cor
rect
ion
f
0.2200 degF250 deg F300 deg F
nduc
tivity
C
00 1000 2000 3000 4000 5000 6000 7000 8000 9000 10000
350 deg F
Con
Stress, psi StimLab PredictK
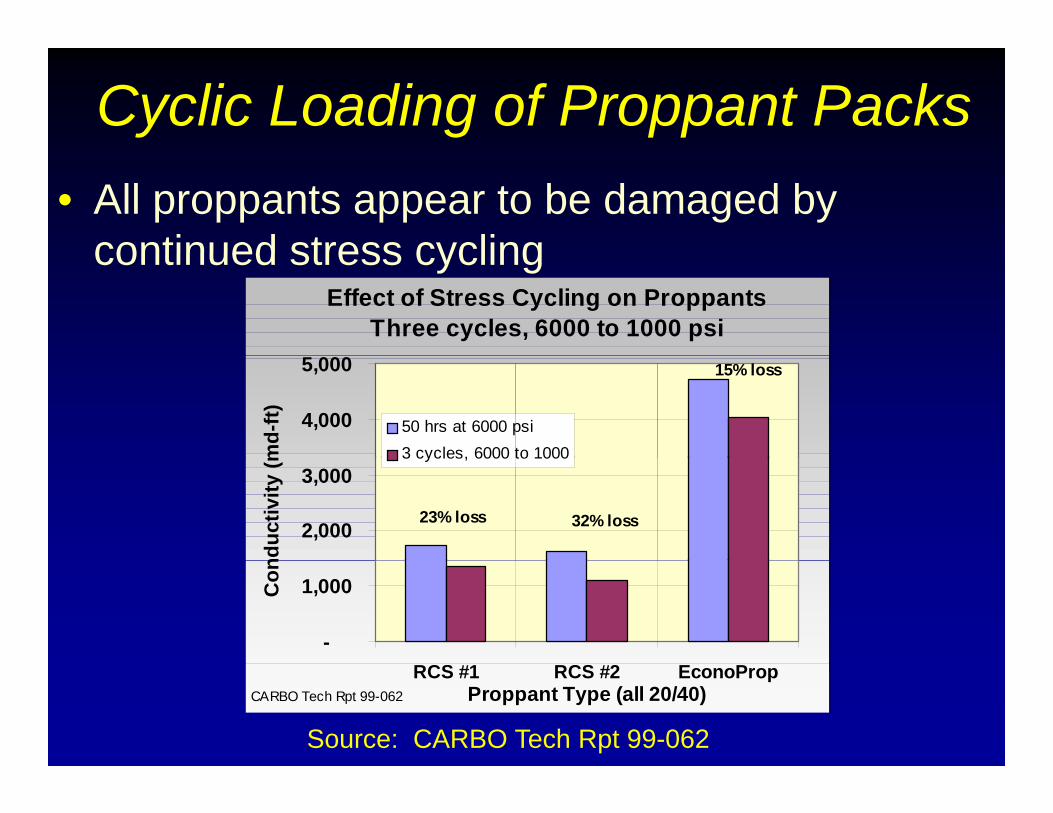
Cyclic Loading of Proppant Packs• All proppants appear to be damaged by
continued stress cyclingcontinued stress cyclingEffect of Stress Cycling on Proppants
Three cycles, 6000 to 1000 psi15% loss
4,000
5,000
md-
ft) 50 hrs at 6000 psi3 cycles, 6000 to 1000
32% loss23% loss2,000
3,000
nduc
tivity
(m
3 cycles, 6000 to 1000
-
1,000Con
Source: CARBO Tech Rpt 99-062
RCS #1 RCS #2 EconoPropProppant Type (all 20/40)CARBO Tech Rpt 99-062

Effect of Stress Cycling on Proppant Conductivity(Stim-Lab July 2000 data)
St ( i)
8 000
9,000
10,000 Stress (psi)LWCRCS
6 000
7,000
8,000
(md-
ft)
Ceramic loses 26%
4,000
5,000
6,000
duct
ivity
( Ceramic loses 26%,RCS loses 35% due to 25 cycles
2,000
3,000Con
d
-
1,000
0 100 200 300 4000 100 200 300 400
Hours

Effect of Stress Cycling on Proppant Crush (6000 psi)on Proppant Crush (6000 psi)
25
300
Single Crush at 6000 psi
Triple Cycle Dry Crush
20
25
rush
th
an 4
0 Triple Cycle Dry Crush
Triple Cycle Crush in Long Term Cell
10.44
15.79
15
cent
Cr
mal
ler t
mes
h)
3 33 3.83 3 02
8.47
5
10Perc
(wt%
sm
1.373.33
1.921.523.02
-
5(
RCS #1 RCS #2 EconoPropProppant Type (all 20/40)CARBO Tech Rpt 99-062
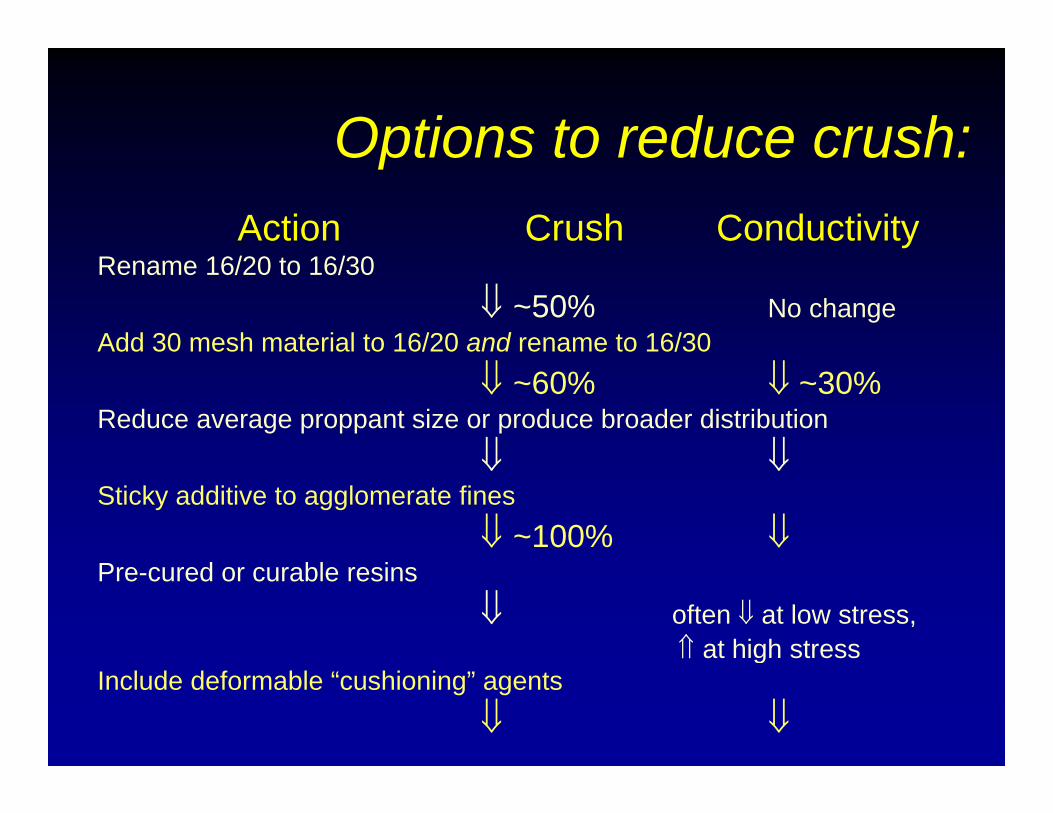
Options to reduce crush:Options to reduce crush:Action Crush Conductivity
Rename 16/20 to 16/30⇓ ~50% No change
Add 30 mesh material to 16/20 and rename to 16/30⇓ ~60% ⇓ ~30%
Reduce average proppant size or produce broader distribution⇓ ⇓⇓ ⇓
Sticky additive to agglomerate fines⇓ ~100% ⇓
Pre-cured or curable resins⇓ often ⇓ at low stress,
⇑ at high stressgInclude deformable “cushioning” agents
⇓ ⇓

The Correct Way to Test Proppant• Remember, proppant must achieve two goals:
– Reservoir contact (proppant volume)(p pp )– Ability to conduct hydrocarbons with minimal pressure loss
• These characteristics can be directly measured with a conductivity test– Proppant confined between sandstone core– Realistic temperatures– Flowing brine, oil, and/or gas
50 hour duration (or longer)– 50 hour duration (or longer)– Cyclic stress, embedment, fines migration, non-Darcy and
other issues can be investigated in specialized testsg p– Directly measures parameters of interest [frac width and
flow capacity]

SPE 119242SPE 119242
How to Use and MisuseHow to Use and Misuse Proppant Crush Tests –
Exposing the Top 10 Myths
Questions?

Darcy’s Law vs Forchheimer EquationDarcy s Law vs. Forchheimer Equation
Δ P/L / k• Δ P/L = μ v / k– Pressure drop is proportional to fluid
l itvelocity– Applicable only at low flowrates
• Δ P/L = μ v / k + β ρ v2
– Pressure drop is proportional to square of fluid velocityfluid velocity
– Applicable at realistic fracture flowrates

D F t Width Aff t C h?Does Fracture Width Affect Crush?
• Crush increases significantly in narrow fracturesfractures
Interior grains are loaded “evenly” on 6 sides
Exterior grains are not
evenly on 6 sides
Exterior grains are not stressed uniformly
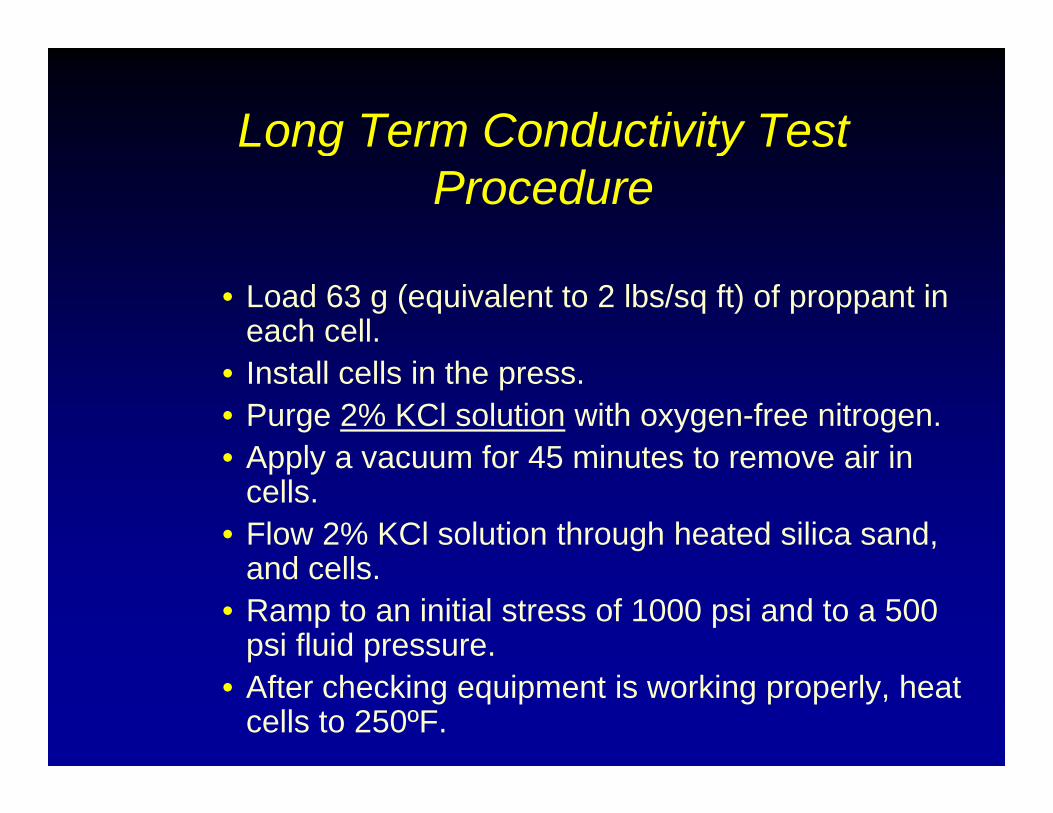
Long Term Conductivity Test g yProcedure
• Load 63 g (equivalent to 2 lbs/sq ft) of proppant in each cell.
• Install cells in the press.• Purge 2% KCl solution with oxygen-free nitrogen. • Apply a vacuum for 45 minutes to remove air in• Apply a vacuum for 45 minutes to remove air in
cells.• Flow 2% KCl solution through heated silica sand,
d lland cells.• Ramp to an initial stress of 1000 psi and to a 500
psi fluid pressure.• After checking equipment is working properly, heat
cells to 250ºF.

Long Term Conductivity TestLong Term Conductivity Test Procedure
• Increase stress to 2,000 psi. • Flow fluid at rates of 3 4 and 6 ml/minFlow fluid at rates of 3, 4 and 6 ml/min.
Measure Δ p 30 minutes after each step change in flow rate.
• Measure frac width and temperature. Maintain stress for 50 hr.
• Increase stress in 2 000 psi increments for 50Increase stress in 2,000 psi increments for 50 hours each.
• Continue measuring Δ p at 3, 4 and 6 ml/min of fluid flow, frac width and temperature until 12,000 psi stress is reached.

A B tt T t t S l t P tA Better Test to Select Proppant
• Long term conductivity testing• Direct measurement of flow capacity ofDirect measurement of flow capacity of
proppant pack• Can account for:Can account for:
– Embedment– TemperatureTemperature– Fluid Effects– Fines Migration (with appropriate flowrates)g ( pp p )

Is complexity solely attributed to “rock fabric”?to rock fabric ?
Unconsolidated 200 mesh sand, 35 lb XLG,Flow SPE 63233
Chudnovsky, Univ of Ill, Chicago
Many other examples! [TerraTek, Baker, Weijers, CSM FAST consortium]54

Frac Width – with CrossLinked GelDiffuse slurry
Low concentrationDiffuse slurry
Modest concentrationTSO + high concentration
2 ppa [240 kg/m3] sand slurry is
wfWe don’t envision thick
filtercakes in very tight rock, but it doesn’t take much to
damage a narrow frac!
pp [ g ] yabout 1 part solids to 7 parts liquid.
Final frac width could be ~1/7th the pumping width!
Navigation menu
Top Related