


Languages
Pages
Legal

Hodographs and Vertical Wind Shear Considerations
NWS Louisville, KY
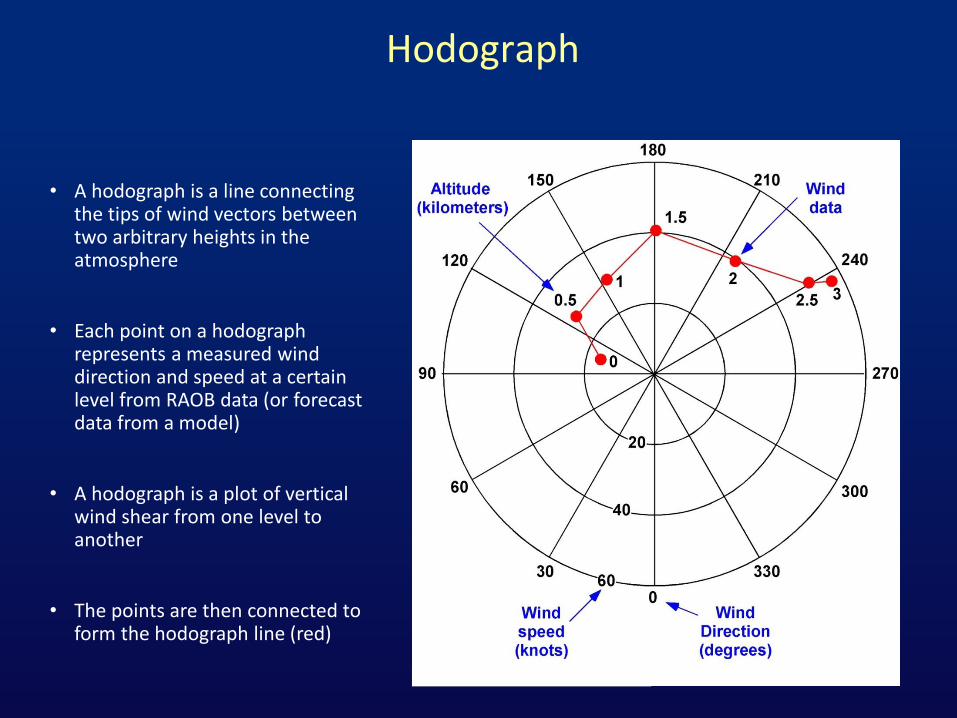
Hodograph
• A hodograph is a line connecting the tips of wind vectors between two arbitrary heights in the atmosphere
• Each point on a hodograph represents a measured wind direction and speed at a certain level from RAOB data (or forecast data from a model)
• A hodograph is a plot of vertical wind shear from one level to another
• The points are then connected to form the hodograph line (red)
e
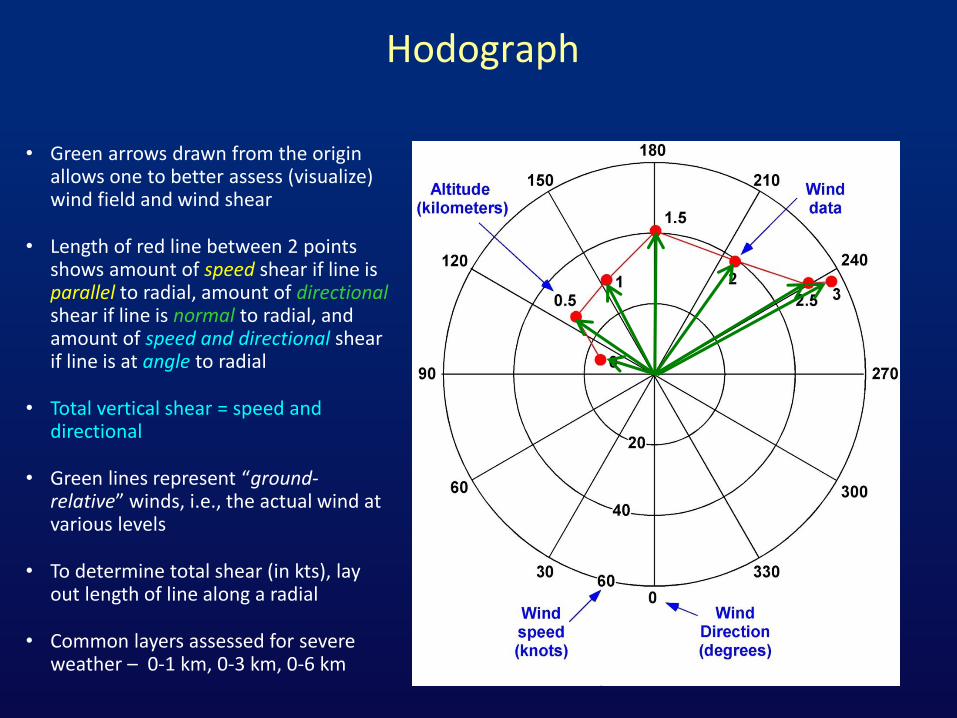
• Green arrows drawn from the origin allows one to better assess (visualize) wind field and wind shear
• Length of red line between 2 points shows amount of speed shear if line is parallel to radial, amount of directional shear if line is normal to radial, and amount of speed and directional shear if line is at angle to radial
• Total vertical shear = speed and directional
• Green lines represent “ground-relative” winds, i.e., the actual wind at various levels
• To determine total shear (in kts), lay out length of line along a radial
• Common layers assessed for severe weather – 0-1 km, 0-3 km, 0-6 km
e
Hodograph
V
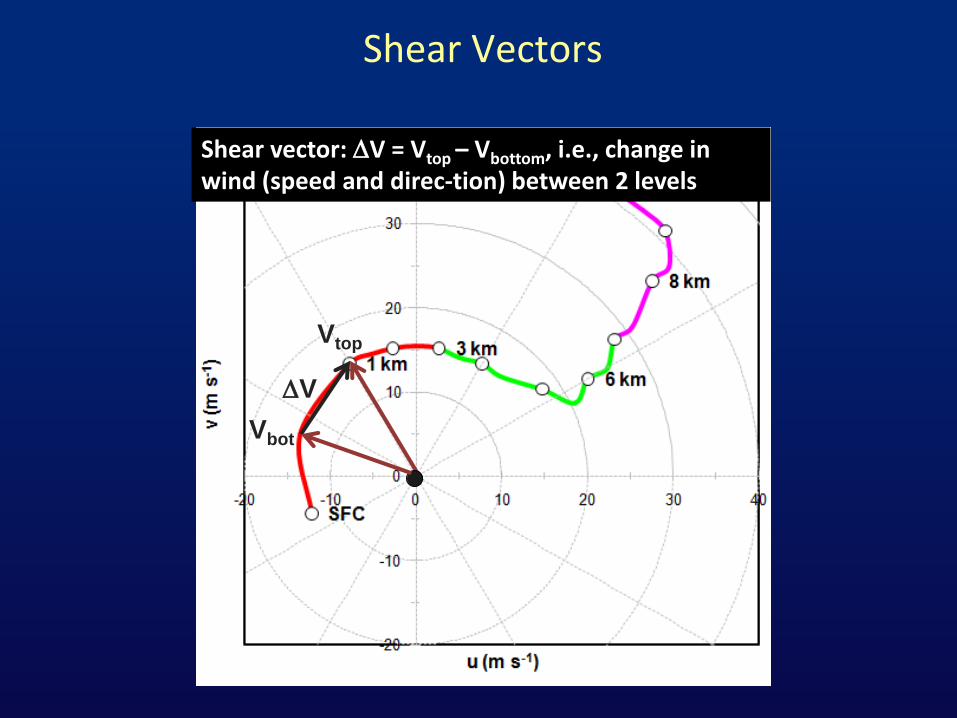
Shear vector: V = Vtop – Vbottom, i.e., change in wind (speed and direc-tion) between 2 levels
Vbot
Vtop
Shear Vectors
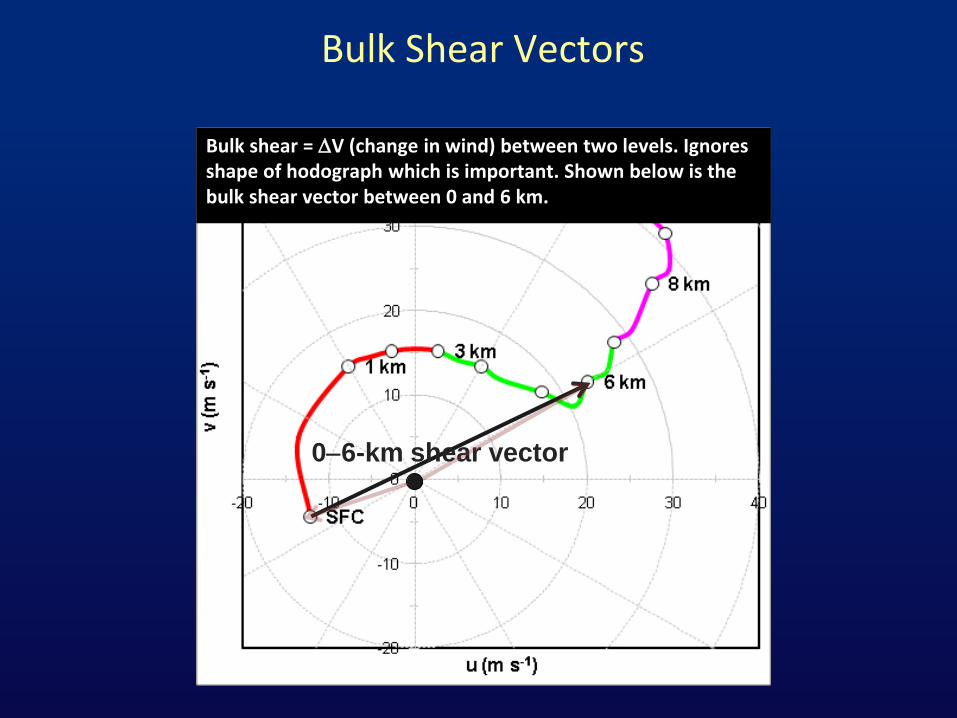
Bulk shear = V (change in wind) between two levels. Ignores shape of hodograph which is important. Shown below is the bulk shear vector between 0 and 6 km.
06-km shear vector
Bulk Shear Vectors
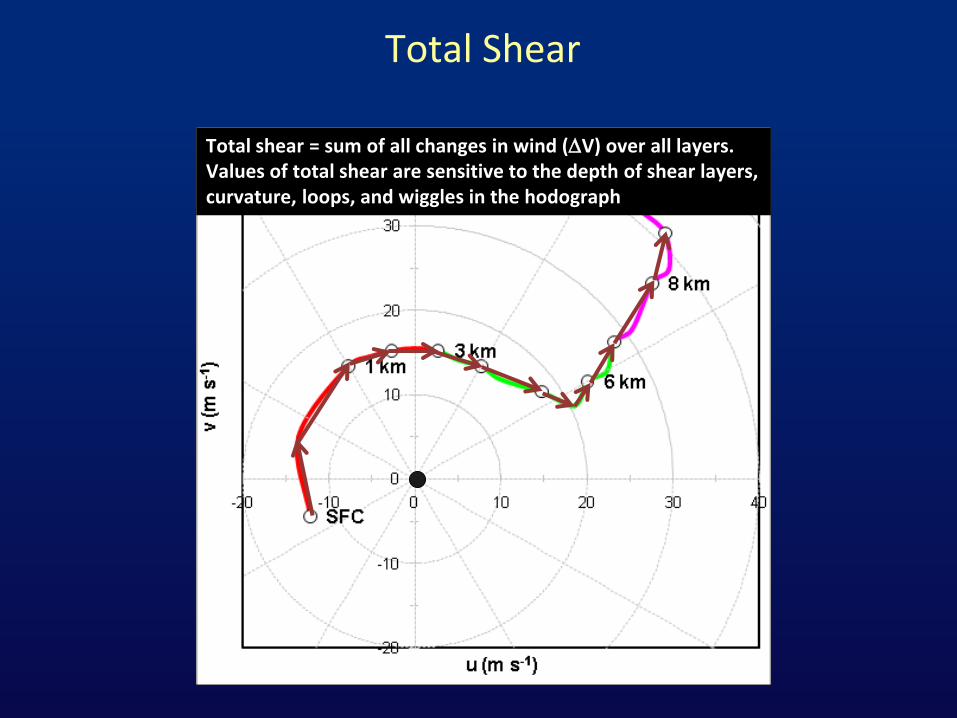
Total shear = sum of all changes in wind (V) over all layers. Values of total shear are sensitive to the depth of shear layers, curvature, loops, and wiggles in the hodograph
Total Shear
7
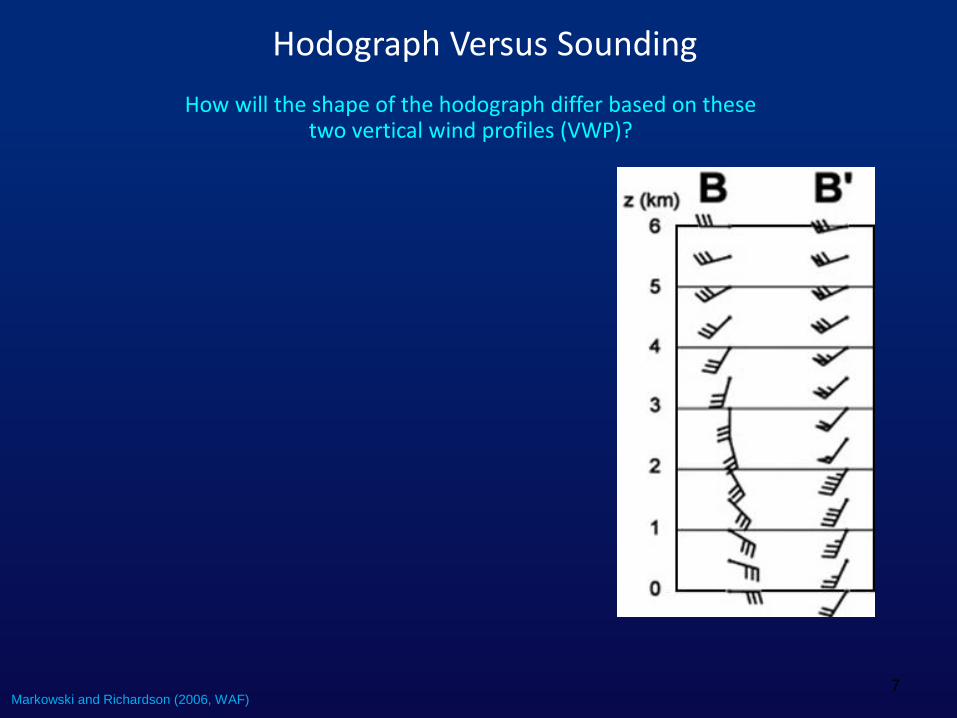
Hodograph Versus Sounding
How will the shape of the hodograph differ based on these two vertical wind profiles (VWP)?
Markowski and Richardson (2006, WAF)
8
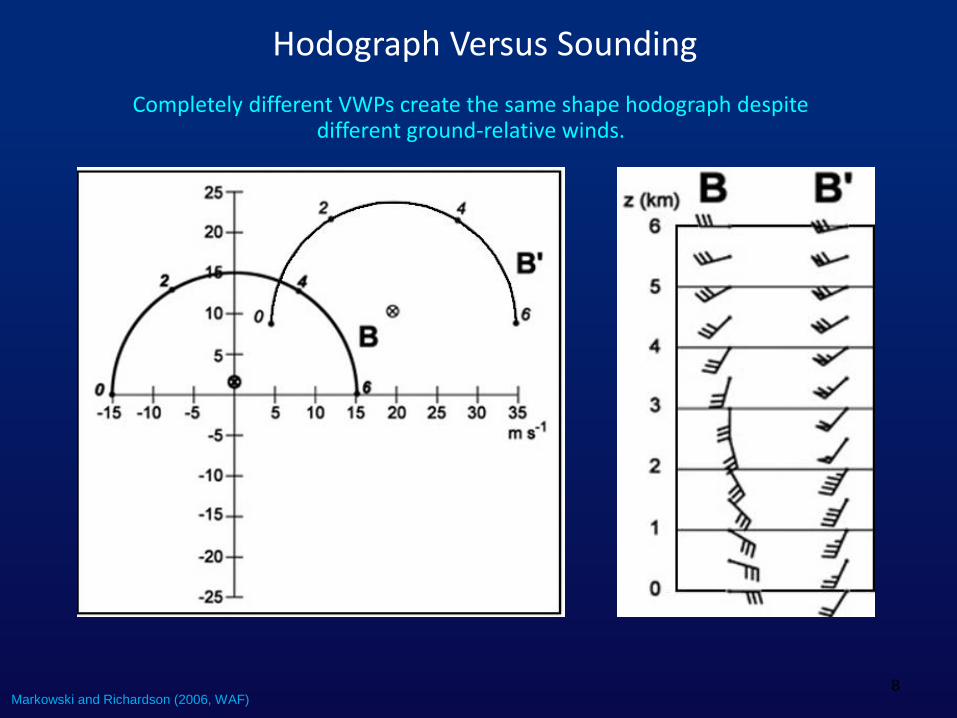
Hodograph Versus Sounding
Completely different VWPs create the same shape hodograph despite different ground-relative winds.
Markowski and Richardson (2006, WAF)
Markowski and Richardson (2006, WAF)
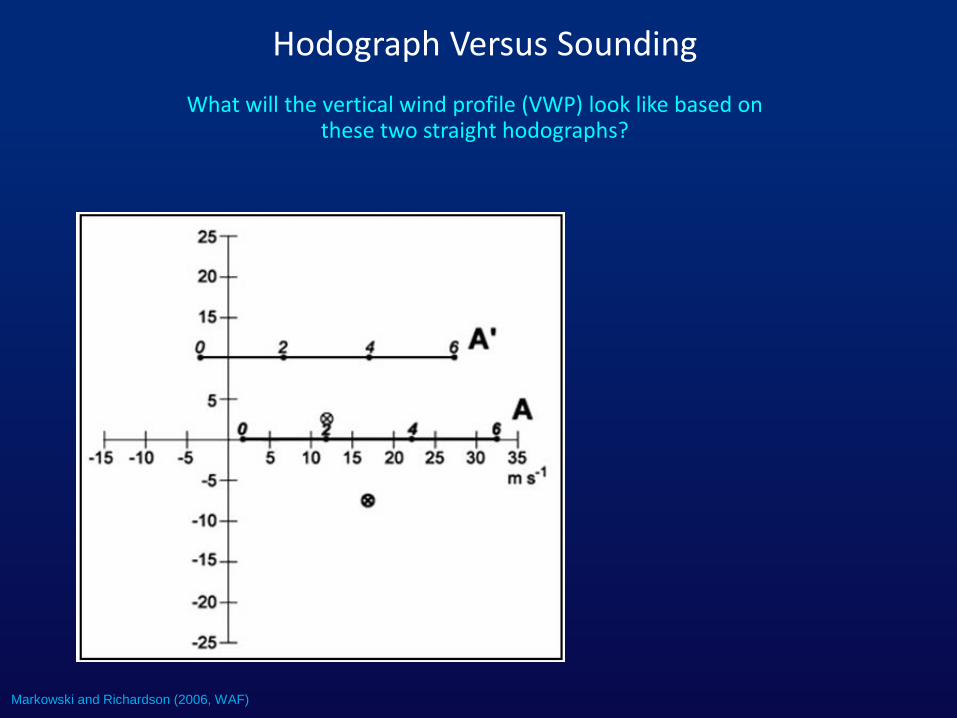
Hodograph Versus Sounding
What will the vertical wind profile (VWP) look like based on these two straight hodographs?
Markowski and Richardson (2006, WAF)
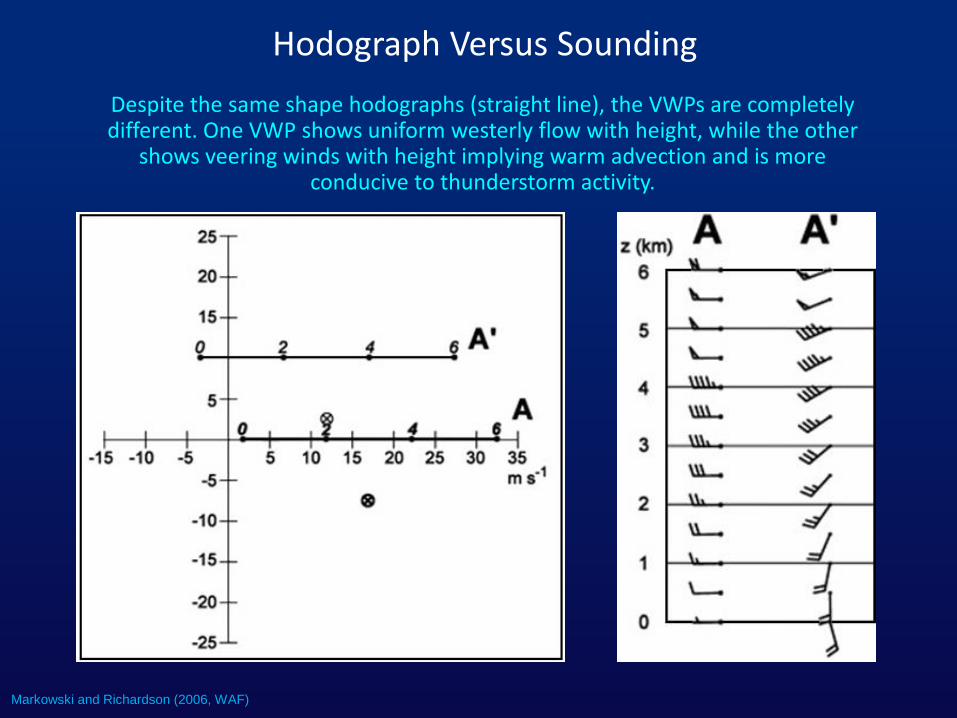
Hodograph Versus Sounding
Despite the same shape hodographs (straight line), the VWPs are completely different. One VWP shows uniform westerly flow with height, while the other
shows veering winds with height implying warm advection and is more conducive to thunderstorm activity.
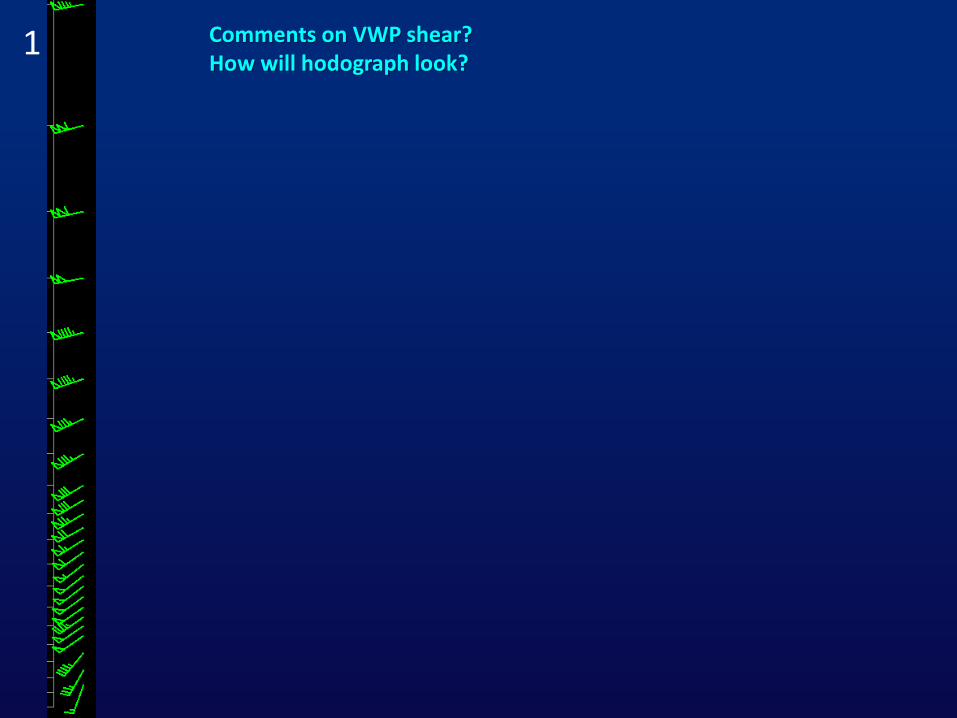
Comments on VWP shear? How will hodograph look?
1
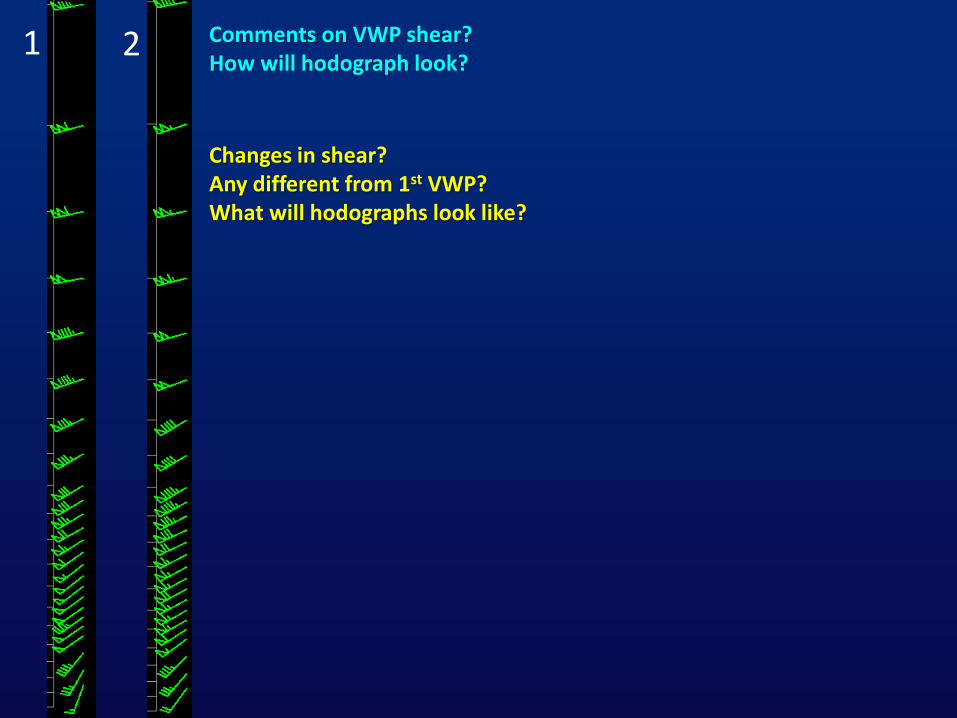
Comments on VWP shear? How will hodograph look?
Changes in shear? Any different from 1st VWP? What will hodographs look like?
1 2
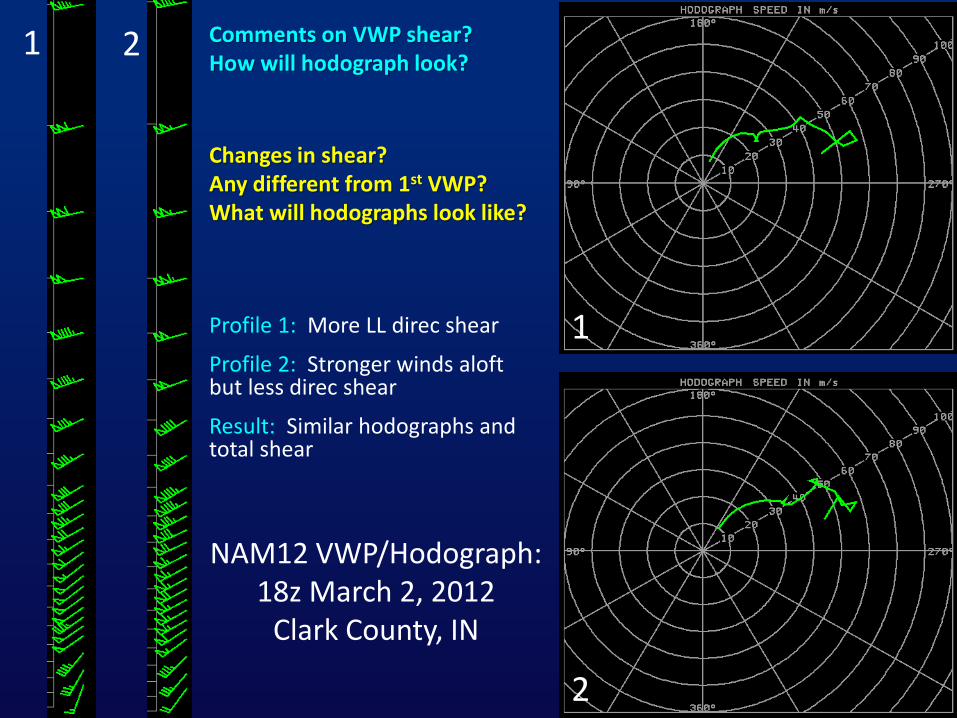
Comments on VWP shear? How will hodograph look?
NAM12 VWP/Hodograph: 18z March 2, 2012
Clark County, IN
Changes in shear? Any different from 1st VWP? What will hodographs look like?
1 2
1
2
Profile 1: More LL direc shear
Profile 2: Stronger winds aloft but less direc shear
Result: Similar hodographs and total shear
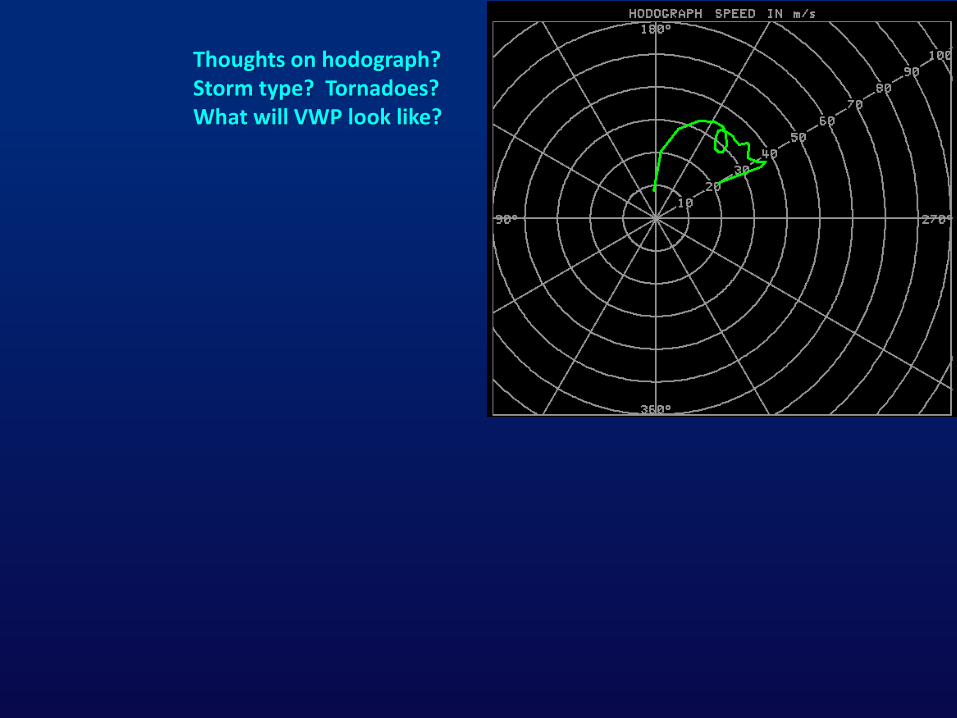
Thoughts on hodograph? Storm type? Tornadoes? What will VWP look like?
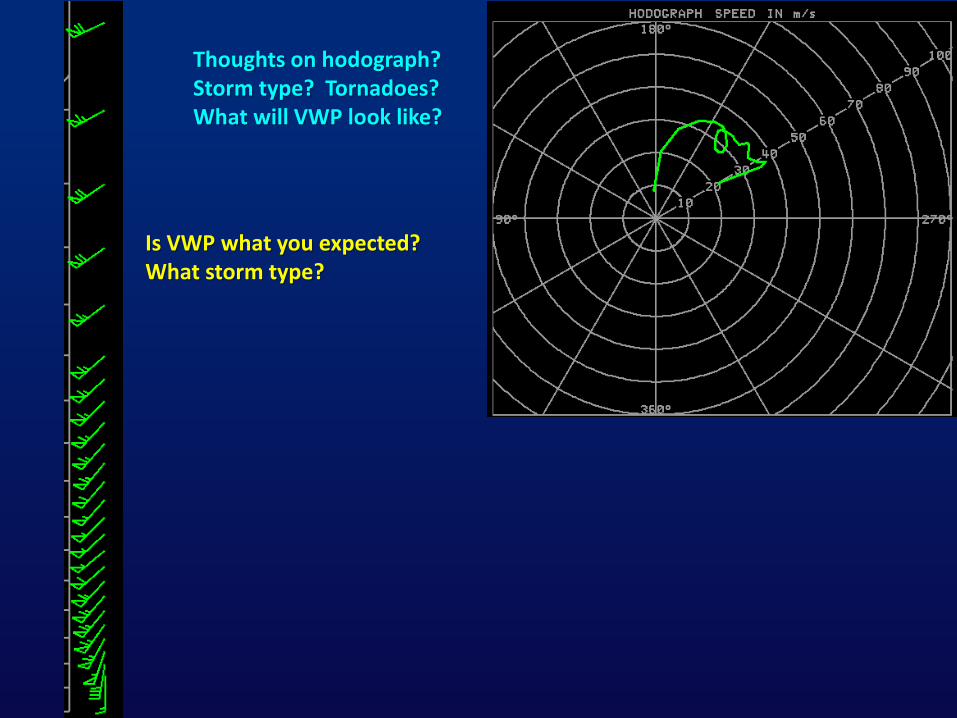
Thoughts on hodograph? Storm type? Tornadoes? What will VWP look like?
Is VWP what you expected? What storm type?

Thoughts on hodograph? Storm type? Tornadoes? What will VWP look like?
GFS Hodograph/VWP: 12z Oct 26, 2010
Jefferson County, KY
(QLCS with few tornadoes and little supercell structure)
Is VWP what you expected? What storm type?
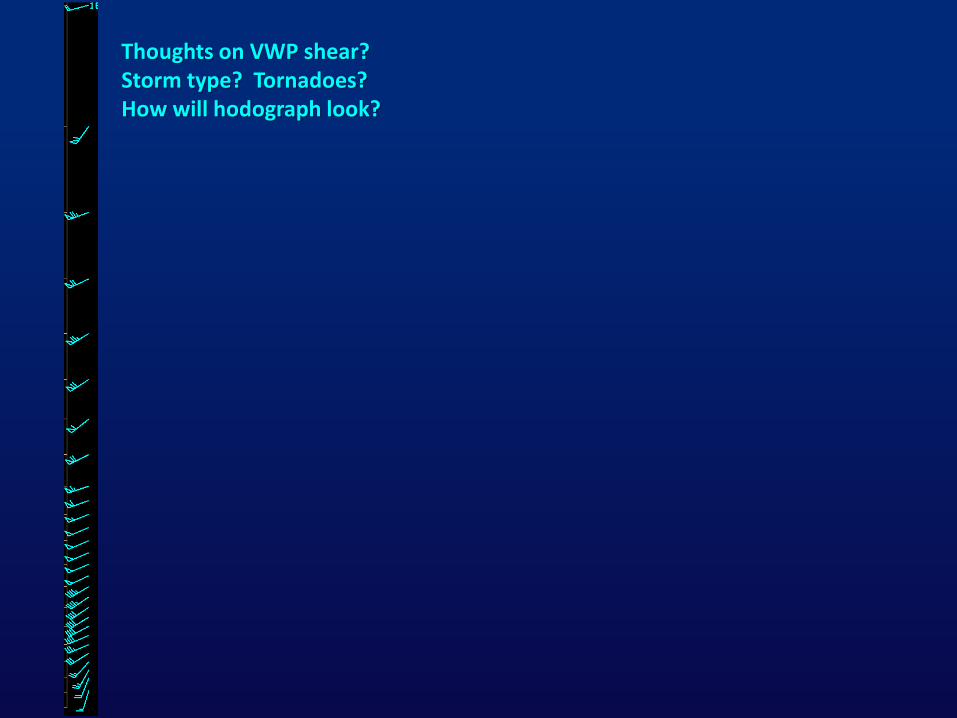
Thoughts on VWP shear? Storm type? Tornadoes? How will hodograph look?
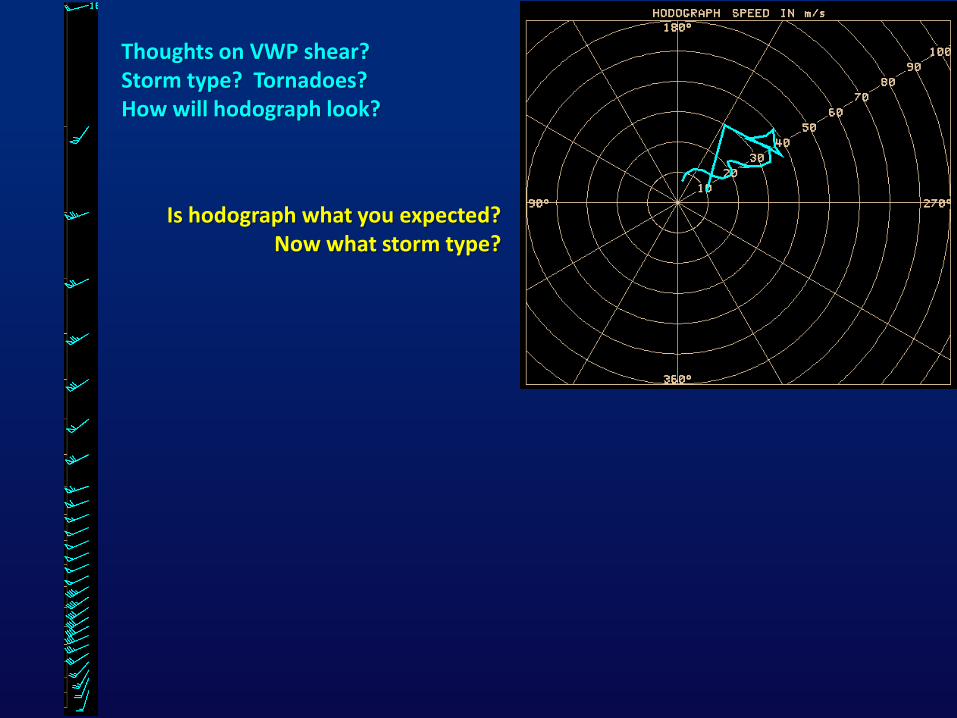
Thoughts on VWP shear? Storm type? Tornadoes? How will hodograph look?
Is hodograph what you expected? Now what storm type?
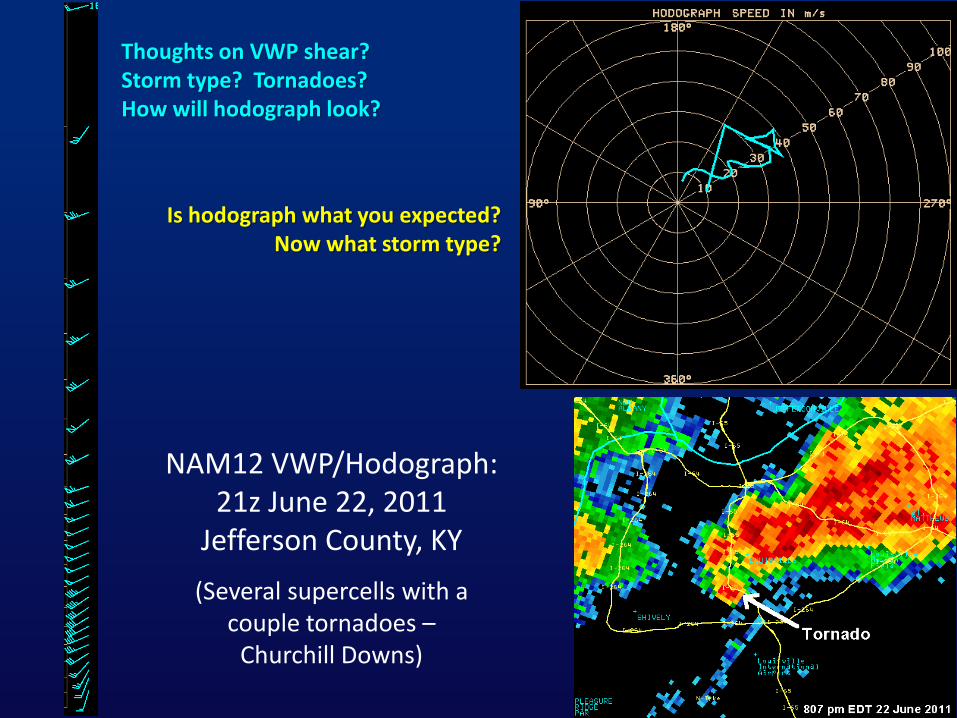
Thoughts on VWP shear? Storm type? Tornadoes? How will hodograph look?
NAM12 VWP/Hodograph: 21z June 22, 2011
Jefferson County, KY
(Several supercells with a couple tornadoes –
Churchill Downs)
Is hodograph what you expected? Now what storm type?
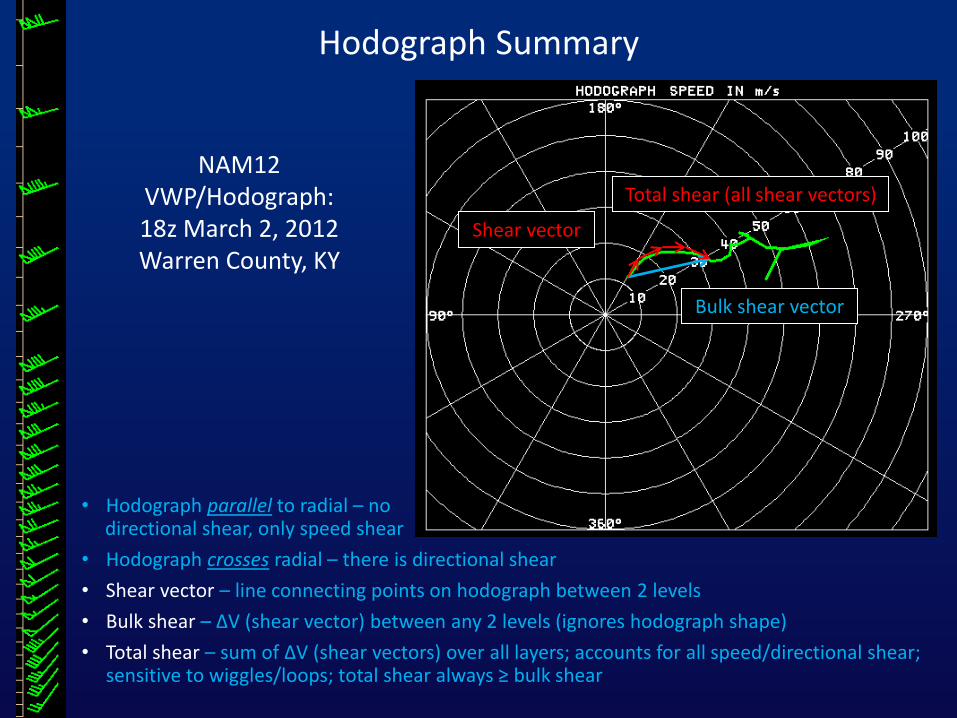
• Hodograph parallel to radial – no directional shear, only speed shear
• Hodograph crosses radial – there is directional shear
• Shear vector – line connecting points on hodograph between 2 levels
• Bulk shear – ∆V (shear vector) between any 2 levels (ignores hodograph shape)
• Total shear – sum of ∆V (shear vectors) over all layers; accounts for all speed/directional shear; sensitive to wiggles/loops; total shear always ≥ bulk shear
Hodograph Summary
NAM12 VWP/Hodograph: 18z March 2, 2012 Warren County, KY
Bulk shear vector
Shear vector
Total shear (all shear vectors)
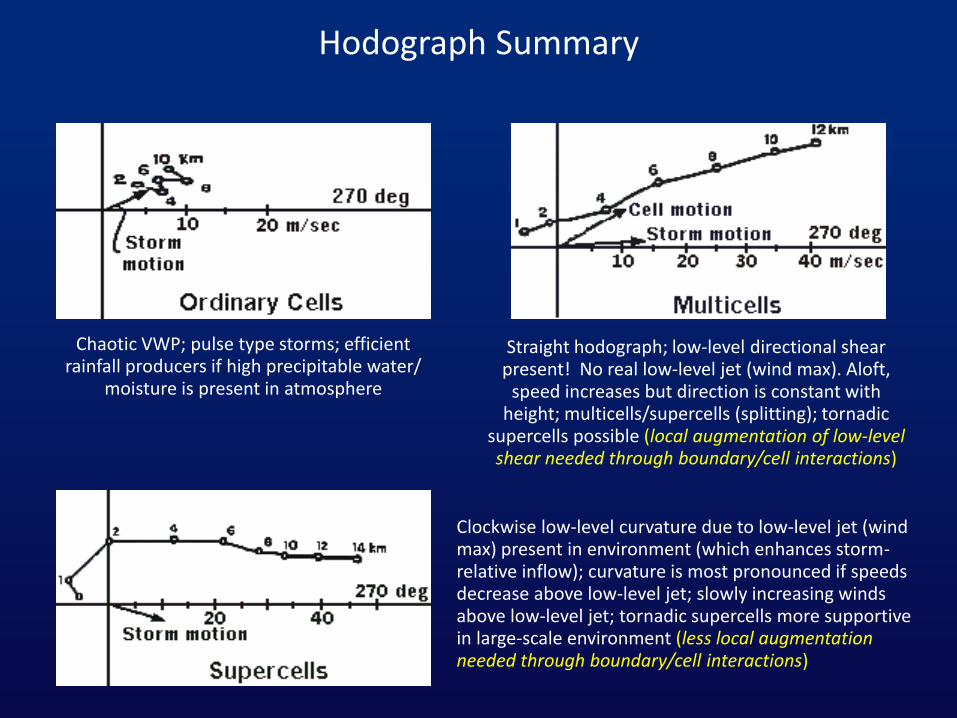
Chaotic VWP; pulse type storms; efficient rainfall producers if high precipitable water/
moisture is present in atmosphere
Straight hodograph; low-level directional shear present! No real low-level jet (wind max). Aloft,
speed increases but direction is constant with height; multicells/supercells (splitting); tornadic
supercells possible (local augmentation of low-level shear needed through boundary/cell interactions)
Clockwise low-level curvature due to low-level jet (wind max) present in environment (which enhances storm-relative inflow); curvature is most pronounced if speeds decrease above low-level jet; slowly increasing winds above low-level jet; tornadic supercells more supportive in large-scale environment (less local augmentation needed through boundary/cell interactions)
Hodograph Summary
Top Related