


Languages
Pages
Legal


AUDIENCE REPORT 2019
www.globalwebindex.com
Examining the attitudes and digital behaviors of internet users aged 37-55
Gen X

Contents Introduction
Key Insights 03
Profiling Gen X 04
Device Trends 07
Media Consumption 10
Social Media 14
Commerce & Brand Engagement 17
Notes on Methodology 22
More from GlobalWebIndex 24
GlobalWebIndex Audience reports are designed to examine the digital behaviors of a particular group – showcasing trends over time as well as analyzing how the audiences in question compare to the overall internet population. In this report, we place the spotlight on Generation X – those internet users who are aged 37-55.
This report focuses on:
• Profiling Gen X – from their attitudes and outlooks on the world to their interests, what are the defining characteristics of this group?
• Device – how do their online activities differ across devices?
• Media Consumption – where do Gen X spend most of their time online and offline?
• Social Media Engagement – what are Gen X’s favorite social media platforms and who do they prefer to “follow” on these services?
• Commerce and Brand Engagement – how many are shopping online each month and how does this audience discover and interact with brands while online? What can brands do to appeal to a Gen X?
Key Insights
PCs, laptops and tablets may collectively continue to capture the biggest share (56%) of Gen Xs’ daily time online, but mobiles have made great headway in becoming the go-to device for this generation, who are slowly becoming just as attached as millennials.
Smartphones overtook PCs/laptops as the primary device to access the internet in 2017, and now have a considerable lead. Gen Xs are more likely to reach for a mobile than a PC/laptop across the research, purchase and post-purchase phases of the journey, with the most significant difference at the early research stage of the purchase funnel.
Broadcast TV is still the biggest source of entertainment for Gen Xs, but that’s not to say they haven’t embraced digital. In fact, a third of daily time spent watching TV-based content is dedicated to online TV/streaming services, and 1 in 4 paid for a TV or movie streaming service last month, showing they’re actively engaging with and paying for this new media. However, they are relatively slower on the online TV uptake.
In line with wider global trends, YouTube is the platform they’re most likely to be visiting monthly. Facebook, however, sits 7 percentage points ahead of YouTube for membership. Facebook is often the default starting-point for consumers in the social media landscape, but is also likely to be the first platform Gen Xs joined when it launched over a decade ago. When we look at the number of Gen Xs self-reporting as actively engaging or contributing with the platforms, Facebook also comes out on top.
While for most younger consumers social media platforms have now evolved into entertainment hubs, this is less evident for Gen X. Going to social media to find funny or entertaining content has seen large increases for Gen Z and millennials, but for Gen X has consistently remained around the 30% mark. Many of their most cited motivations for going on social media are distinctly socially-driven rather than content-driven. Using social media to keep in touch with friends, fill up spare time and to generally network with others, all feature in their top five motivations.
Traditional marketing channels are still the most impactful for brand discovery. Search engines and TV ads are the top two ways they come across new brands, products or services. These are particularly impactful sources for Gen Xs in North America – a region where linear TV is still very important in daily media schedules – but are also important in Latin America and Europe.

Gen X
Audience Report 2019
Profiling Gen X

APAC
28%EUROPE
40%LAT AM
30%MEA
22%NORTH AM
37%
37−42 years41%
43−48 years30%
49−55 years29%
Non-Parents23%
2 Children26%
1 Child41%
3+ Children10%
Bottom 25%19%
Top 25%25%
Mid 50%49%
Prefer not to say
7%
% of Gen X who are the following…
% of internet users who are Gen X
EMPLOYMENTSTATUS
64%
7%
12%
5%
1%
6%
3%
2%
Full-time worker
Part-time worker
Self-employed/Freelancer
Full-time/stay-at-home parent
Student
Unemployed
Retired
Other
Gen X Around the Globe
Gen X, those born between 1964 and 1982, often get ignored next to the massive influence of boomers, millennials and Gen Zs. While Gen X may be smaller in numbers than millennials, they may well be in a better position to be big spenders over the next decade.
Gen X were the first generation where, as a majority, both parents worked and were out of the house most of the day. They came along at a time when the
divorce rate was dramatically rising, leading to more single-parent households and more independent decision-making children. They saw the Berlin Wall fall, the Cold War end, Communism disintegrate and the end of Apartheid in South Africa, all to a backdrop of grunge and disillusionment.
TOP 5 ATTITUDES
Family is the most important thing in my life 82%
When I need information, the first place I look is the internet
80%
It is important to be well informed about things 78%
It is important to me to continue to develop new skills throughout life
77%
You should seize opportunities when they arise 76%
are married are senior decision-makers
are most likely to be interested in news/current affairs
71% 11% 53%
TOP 3 INSIGHTS

The Generational Traits of Gen X: Expectation vs Reality
Here are 9 common characteristics assumed to be prevalent among people between 37-55, based on world events they’ve lived through and the life stage they are likely at now. Being the last non-digitally globalized generation, Gen X’s most formative years were before the internet. This means that, especially compared with younger generations like millennials, they may not have the same cultural commonalities between others of the same age in other regions. But what does our data say?
1. Living through the recession, they have a negative outlook on the global economy.
This isn't necessarily true of Gen X. 23% disagree that they are positive about the global economy, which is higher than both Gen Z and millennials (both 19%) but behind baby boomers (29%). A lack of positivity in the current economy generally increases with age, the exception being in Latin America, where Gen Zs are more likely than Gen Xs to disagree about being positive about the economy.
2. They are independent thinkers.
32% are easily swayed by other people’s opinions, compared to 42% of Gen Z, 40% of millennials and 20% of baby boomers. Additionally, 42% say they like to keep up with the latest fashions. This figure is massively inflated by Gen Xs in APAC, where 44% agree to being swayed by others’ opinions. In Europe, Latin America and North America, this drops to below 20%.
3. They continue to struggle with debt.
Gen X (23%) are just behind millennials (26%) for currently having a short-term loan. 7 in 10 Gen Xs have a credit card, ranging from 55% in the Middle East and Africa to 81% in North America.
4. Being the first to adapt to the internet, they have long standing habits online.
Smartphones overtook PCs/laptops as the primary device to access the internet in 2017, and now have a considerable lead. Out of the 35 online activities we track, Gen X are now more likely to carry out all of them but two on their mobile. In three regions - APAC, MEA and LatAm - Gen Xs have nearly an even split between the time they spent on mobiles and PCs/laptops.
5. Their music preferences relate to the music of their youth.
They are the most likely generation to cite ‘90s music as a genre they enjoy listening to (45%). They’re also 1.4x the global average to say they like ‘80s music (49%), although this is behind boomers (57%). In all five regions, ‘80s music is their most cited music genre that they enjoy.
6. Skilled and highly experienced Gen Xs can benefit from the growing gig economy.
Out of all four generations, Gen Xs are the most likely to say they are currently self-employed/a freelancer (12%, IDX 1.21). A substantial 23% of Gen Xs in Latin America and 19% in the Middle East and Africa say they are a freelancer.
7. They are the main shopper at home.
Gen X are the generation most likely to be the main grocery shopper in their household – 66% say they are. This figure is fairly consistent across the regions. 76% of Gen X say they have purchased a product online using any device, just eclipsing Gen Z (74%), but behind millennials (79%).
8. They spend more on specialty food as they focus on family life.
Gen Xs are just as likely as Gen Zs to say they tend to buy the premium version of a product (53%), but behind millennials (57%). 4 in 10 have purchased organic fruit/vegetables in the past month, rising to 60% in Latin America.
9. Email marketing communications are an effective channel for this group.
This is debatable. While emails or letters from companies comes 17th in brand discovery preferences (17%), although it is one of their most cited and highest indexing brand interactions in the past month (24%).

Gen X
Audience Report 2019
Device Trends

2016 2017 20192018
Smartphone
Personal PC/Laptop
Work PC/Laptop
Tablet device
Television
94%Smartphone
72%PC/Laptop
41%Tablet
40%Smart TV
21%Games console
15%TV streamingstick/device
12%Smartwatch
20%
39%
79%
89%
47%
26%34%
87%
73%
36%
11%e-Reader
11%Smart home
product
10%Smart
wristband
8%Featurephone
5%Virtual Reality
headset/device
0.6%None of
the above
Smartphones Fully Embedded into Gen Xs’ Lives
PCs, laptops and tablets may collectively continue to capture the biggest share (56%) of Gen Xs’ daily time online, but mobiles have made great headway in becoming the go-to device for this generation, who are slowly becoming just as attached as millennials.
Smartphones overtook PCs/laptops as the primary device to access the internet in 2017, and now have a considerable lead. In fact, out of the 35 online activities we track, Gen X are now more likely to carry out all but two of them on their mobile. PCs/laptops are slightly ahead for using a webmail service to access emails and to use online encyclopedias such as Wikipedia.
Computers still retain importance for this group however, particularly for commerce-related actions. 64% have used these devices to visit an online retail site like Amazon in the past month (vs. 54% of Gen Z), 53% have searched for a product or service they wanted to buy (vs. 42% of Gen Z), and 45% have purchased a product online (vs 31% of Gen Z).
4 in 10 Gen Xs have used an internet banking service on their PC/laptop in the past month.
% of Gen X who access the internet via...
% of Gen X who own the following devices
3:21 AVERAGE TIME SPENT PER DAY ON PC/LAPTOP/TABLET 2:41 AVERAGE TIME SPENT PER DAY
ON MOBILE
08DEvICE TRENDs
Question: On an average day, how long do you spend online on a mobile?Source: GlobalWebIndex Q1 2019 Base: 42,735 Gen X Internet Users aged 37-55
Question: Which of these do you use to access the internet?Source: GlobalWebIndex Q1 2019 Base: 49,253 Gen X Internet Users aged 37-55
Mobile PC/Laptop
APACGlobal Europe Lat Am MEA North Am
RESEARCHSearched for a product/service you want to buy
PURCHASEPurchased a product online
ADVOCACYPosted a review of a product/company/service
APACGlobal Europe Lat Am MEA North Am APACGlobal Europe Lat Am MEA North Am
63
53
68
43
54
68 70
63
72
53 55
64
46
45
56
3731
56
39
4942
32 36
59
27
22
37
24
13
20 23
23
22
1815
18
Mobile is the Key to the Purchase Journey
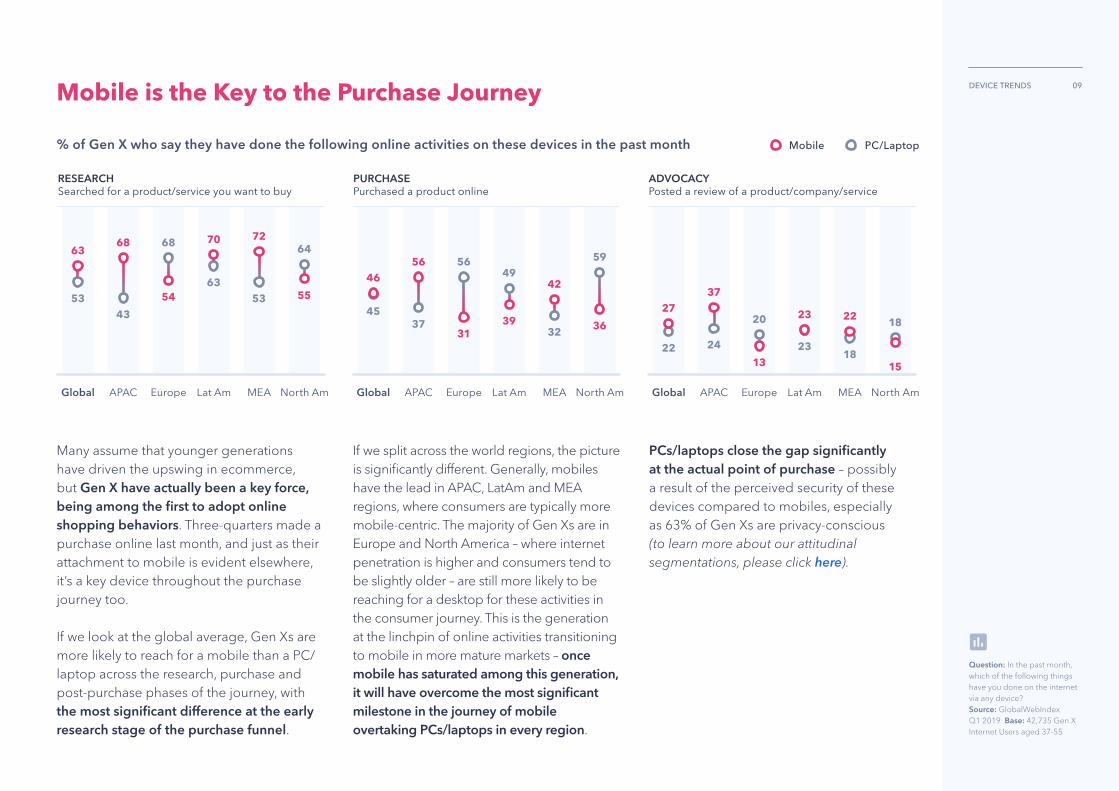
Many assume that younger generations have driven the upswing in ecommerce, but Gen X have actually been a key force, being among the first to adopt online shopping behaviors. Three-quarters made a purchase online last month, and just as their attachment to mobile is evident elsewhere, it’s a key device throughout the purchase journey too.
If we look at the global average, Gen Xs are more likely to reach for a mobile than a PC/laptop across the research, purchase and post-purchase phases of the journey, with the most significant difference at the early research stage of the purchase funnel.
If we split across the world regions, the picture is significantly different. Generally, mobiles have the lead in APAC, LatAm and MEA regions, where consumers are typically more mobile-centric. The majority of Gen Xs are in Europe and North America – where internet penetration is higher and consumers tend to be slightly older – are still more likely to be reaching for a desktop for these activities in the consumer journey. This is the generation at the linchpin of online activities transitioning to mobile in more mature markets – once mobile has saturated among this generation, it will have overcome the most significant milestone in the journey of mobile overtaking PCs/laptops in every region.
PCs/laptops close the gap significantly at the actual point of purchase – possibly a result of the perceived security of these devices compared to mobiles, especially as 63% of Gen Xs are privacy-conscious (to learn more about our attitudinal segmentations, please click here).
% of Gen X who say they have done the following online activities on these devices in the past month
09DEvICE TRENDs
Question: In the past month, which of the following things have you done on the internet via any device?Source: GlobalWebIndex Q1 2019 Base: 42,735 Gen X Internet Users aged 37-55

Gen X
Audience Report 2019
Media Consumption

One-Third of TV Time Dedicated to Online TV
2:15 AVERAGE TIME SPENT PER DAY ON LINEAR TV 1:08 AVERAGE TIME SPENT
PER DAY ON ONLINE TV
% of Gen X who watch the following TV types at least weekly
Broadcast TV is still the biggest source of entertainment for Gen Xs, but that’s not to say they haven’t embraced all things digital. In fact, a third of daily time spent watching TV-based content is dedicated to online TV/streaming services, and 1 in 4 paid for a TV or movie streaming service last month, showing they’re actively engaging with and paying for this new media. However, they are relatively slower on the online TV uptake; it’s linear TV consumption that has increased since Q4 2017, by 8 minutes per day on average.
Online TV consumption among Gen Xs hits a high of 1 hour and 21 minutes a day in APAC and low of 42 minutes in Europe. Meanwhile, Europe leads for weekly viewership of live television (89%), whereas Latin America leads for subscription services (72%).
11MEDIA CONsUMPTION
Question: How often do you... // On an average day, how long do you spend online on a mobile?Source: GlobalWebIndex Q1 2019 Base: 42,735 Gen X Internet Users aged 37-55

89% 53% 51% 25%
Watch any type of TV
38% 22% 21% 10%
Watch a TV channel'scatch-up/on-demand service
75% 24% 26% 10%
Watch live televisionon a TV channel
32% 23% 25% 12%
Watch subscriptionservices such as Netflix
TV PC/Laptop Mobile Tablet
25% OF GEN Xs HAVE WATCHED CONTENT ON A TVBY MIRRORING OR CASTING IT VIA THEIR PHONE
TV: Device Preferences
Where device preferences are concerned, Gen Xs continue to demonstrate an overwhelming preference for the traditional TV set, particularly when watching live television. PCs and laptops achieve decent figures in Latin America and APAC, however.
Although marketers seem to focus more of their efforts on the younger Gen Z or Millennial cohorts, this pattern of Gen X media consumption indicates that this generation are moving with digital media trends too, and are actually not too far behind the global pace – with the strongest indicator being that 51% are now watching some kind of TV-based content on mobile.
% of Gen X who watched these TV types last month via
12MEDIA CONsUMPTION
Question: In the past month, which devices have you used to do the following?Source: GlobalWebIndex Q1 2019 Base: 42,735 Gen X Internet Users aged 37-55

Online News Ahead of Print
Gen X’s digital footprint in news consumption is another area that is worth noting when building a profile for this audience. They dedicate more daily time to reading digital press than print press, with the average Gen X reading an hour of online press each day compared to ¾ of an hour per day reading physical print press.
When we look at the places online that Gen Xs are consuming news on social media and on websites to almost exactly the same degree, with both way ahead of news-specific apps. This does vary regionally; Gen Xs in Latin America and the Middle East and Africa show a stronger preference for consuming news on social media, whereas the more traditional Gen Xs in Europe and North America still (slightly) favour news websites.
Clearly the opportunity to consume news alongside other content resonates with Gen Xs like it does with the younger generations, and the shareability of content on social media through its role as a communal discussion platform is ideal for keeping them in the loop – something we explore later.
% who have consumed news* online in the last 30 days via...
*Social Media/News Websites/ Apps data aggregated from Gen Xs who have seen a video, article or story on those channels from at least one of 31 named online news services.
01:00 00:44AVERAGE TIME SPENT PER DAY ON ONLINE PRESS
AVERAGE TIME SPENT PER DAY ON PHYSICAL PRINT PRESS
13MEDIA CONsUMPTION
Question: For these services, could you tell us where you have seen one of their videos, articles or stories online during the last 30 days? Source: GlobalWebIndex Q1 2019 Base: 42,735 Gen X Internet Users aged 37-55

Gen X
Audience Report 2019
Social Media

Facebook is still Gen X’s Social Hub
With Gen Xs now spending an average of almost 2 hours a day on social media they shouldn’t be hard to find online, and once engaged, they can be a quick win for marketers who position themselves well to target this generation.
In line with wider global trends, YouTube is the platform they’re most likely to be visiting, with 84% doing so monthly. Facebook, however, sits 7 percentage points ahead of YouTube for membership. This highlights how Facebook is often the default starting-point for consumers in the social media landscape, but is also likely to be the first platform Gen Xs joined when it launched over a decade ago. When we look at the number of Gen Xs self-reporting actively engaging with the platforms, Facebook also comes out on top. For at least daily visits, millennials and Gen Zs now favor YouTube, but for Gen X Facebook is still the go-to platform. Traditional online marketing methods still work effectively with this group, and they are more likely to react to social media advertising on Facebook.
This isn’t to say other platforms haven’t seen significant growth in membership or visitation rates over the past few years. Since 2016, Instagram has seen a 32% increase in membership and a 31% increase in monthly visitation, while messaging services Facebook Messenger and WhatsApp have also seen increases in monthly visitation (17% and 24% increases, respectively). Although Gen X may be generally slower on the uptake of some platforms, they are slowly catching up for specific platforms.
Despite being relatively time poor due to busy lifestyles, Gen Xs are multi-networkers and keep a portfolio of social accounts. The average Gen X has 7 social media accounts, compared to 9 for Gen Z and millennials, and 5 for Baby Boomers. While not all networks are visited with the same frequency, Gen Xs are clearly switching between different platforms throughout the day and for different purposes – a behavior that mobile has facilitated.
% of Gen X who have an account/have visited the following social platforms in the past month (excl. China)
15sOCIAl MEDIA
Question: On which of the following services do you have an account? // Which of the following sites/applications have you visited or used in the past month via your PC/Laptop, Mobile or Tablet?Source: GlobalWebIndex Q1 2019 Base: 44,619 Gen X Internet Users aged 37-55 (excl. China)

Social Media Behaviors
While for most younger consumers social media platforms have now evolved into entertainment hubs, this is less evident for Gen X. Going to social to find funny or entertaining content has seen large increases for Gen Z and millennials, but for Gen X has consistently remained around the 30% mark. Although their top reason for going on social media is purposeful – to keep updated on news and current events – many of their most cited motivations for going on social media are distinctly non-purposeful. Using social media to keep in touch with friends, fill up spare time and to generally network with others all feature in their top five motivations.
% of Gen X who say the following are main reasons for using social media
% of Gen X who follow these types of accounts on social media
3 in 10 Gen Xs use social media to research products to buy, with a further 33% following brands they like and 24% following brands they are thinking of buying from on social media. This is a group that does not mind brand interaction on social media, and actively look for products and services in this space. Gen Xs are most likely to be following contacts relevant to their work (29%) and 44% fall under our Professional Networker social segment* – clearly reflecting this audience’s stage of life, and the role social media has come to play in the professional sphere.
To stay up-to-date with news and current events
To stay in touch with what my friends are doing
To find funny or entertaining content
To fill up spare time
General networking with other people
39%
37%
31%
31%
30%
People you know in real life
Brands you like
News/media organizations
Contacts relevant to your work
Singers, musicians or bands
49%
33%
29%
29%
26%
16sOCIAl MEDIA
Question: What are your main reasons for using social media?Source: GlobalWebIndex Q1 2019 Base: 42,735 Gen X Internet Users aged 37-55
Question: Who do you follow on social media? Source: GlobalWebIndex Q1 2019Base: 42,735 Internet Users aged 37-55 Link: http://g-web.in/1yduWMd
*For more information about how the segments in this question are defined, please click here

Gen X
Audience Report 2019
Commerce & Brand Engagement

Brand Discovery
Gen X may be enthusiastic about engaging with new types of media, but traditional marketing channels are still the most impactful. Search engines (39%) and TV ads (38%) are the top two ways they come across new brands, products or services, and these are especially impactful in North America (46%) – a region where linear TV is still very important in daily media schedules – but equally as important in Latin America (46%) and Europe (43%).
TOP OVER-INDEX BY REGION
APAC Articles on newspaper/magazine websites 16% 1.07
Europe Product brochures/catalogues 22% 1.31
LatAm Deals on group-buying websites 19% 1.70
MEA Ads heard on the radio 19% 1.38
North Am Ads heard on the radio 19% 1.39
% of Gen X who find out about new brands/products/services via… Digital channels, most notably online ads, have more of an impact than might be expected though, particularly in some of the world regions. In Latin America, for example, Gen X are almost as likely to discover brands via online ads as TV ads, and almost a fifth of Gen Xs find brands through preroll video ads in the region.
With a third of Gen Xs following their favorite brands on social media, many seem comfortable with seeing branded content on their newsfeeds. They’ve begun to incorporate social into their purchase journeys too, just as millennials and Gen Z have; many Gen Xs are discovering brands via ads on social media (24%) and recommendations in their social media feeds (22%), and they’re not too far behind Gen Zs for this figure. Again, social is especially important for reaching those in Latin America; 4 in 10 Gen Xs in this region say they discover new brands and products via ads seen on social media.
18COMMERCE & BRAND ENGAGEMENT
Question: How do you typically find out about new brands and products?Source: GlobalWebIndex Q1 2019 Base: 49,253 Gen X Internet Users aged 37-55

55%
IDX 1.05
Search engines
37%
IDX 1.04
Consumer reviews
34%
IDX 0.82
Social networks
34%
IDX 1.06
Product/brandsites
31%
IDX 1.15
Price comparisonwebsites
Product Research
Search engines are the go-to for Gen Xs wanting to further research a brand online (at 55%). Beyond this, consumer reviews are an important reference point for this generation’s online research, influencing over a third. While social media is used to a lesser degree compared to the average internet user, it is particularly impactful for Gen Xs in Latin America (54%) and the Middle East and Africa (56%).
Gen Xs like to do research before making purchases. 55% say they like to seek an expert opinion before buying products, and as a generation they’re more likely than younger generations to want their favorite brands to keep them up-to-date with the latest news and products. This points to the importance of offering a clear explanation of new products and their benefits to Gen Xs across their preferred points of contact.
TOP OVER-INDEX BY REGION
APAC Messaging/live chat services 17% 1.22
Europe Price comparison websites 38% 1.42
LatAm Product/brand sites 47% 1.47
MEA Social networks 56% 1.35
North Am Consumer reviews 43% 1.20
% of Gen X who mainly use the following when actively doing brand/product research
19COMMERCE & BRAND ENGAGEMENT
Question: Which of the following online sources do you mainly use when you are actively looking for more information about brands, products, or services?Source: GlobalWebIndex Q1 2019 Base: 49,253 Gen X Internet Users aged 37-55
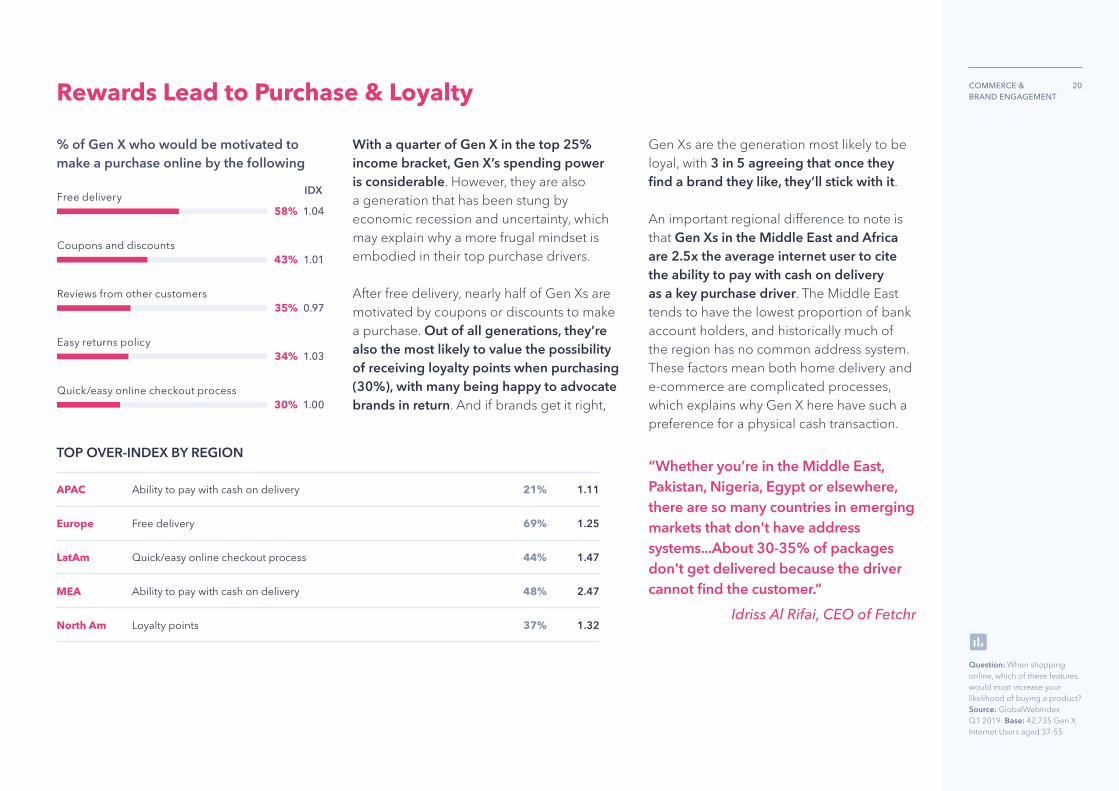
With a quarter of Gen X in the top 25% income bracket, Gen X’s spending power is considerable. However, they are also a generation that has been stung by economic recession and uncertainty, which may explain why a more frugal mindset is embodied in their top purchase drivers.
After free delivery, nearly half of Gen Xs are motivated by coupons or discounts to make a purchase. Out of all generations, they’re also the most likely to value the possibility of receiving loyalty points when purchasing (30%), with many being happy to advocate brands in return. And if brands get it right,
Gen Xs are the generation most likely to be loyal, with 3 in 5 agreeing that once they find a brand they like, they’ll stick with it.
An important regional difference to note is that Gen Xs in the Middle East and Africa are 2.5x the average internet user to cite the ability to pay with cash on delivery as a key purchase driver. The Middle East tends to have the lowest proportion of bank account holders, and historically much of the region has no common address system. These factors mean both home delivery and e-commerce are complicated processes, which explains why Gen X here have such a preference for a physical cash transaction.
“Whether you’re in the Middle East, Pakistan, Nigeria, Egypt or elsewhere, there are so many countries in emerging markets that don't have address systems...About 30-35% of packages don't get delivered because the driver cannot find the customer.”
Idriss Al Rifai, CEO of Fetchr
Rewards Lead to Purchase & Loyalty
% of Gen X who would be motivated to make a purchase online by the following
TOP OVER-INDEX BY REGION
APAC Ability to pay with cash on delivery 21% 1.11
Europe Free delivery 69% 1.25
LatAm Quick/easy online checkout process 44% 1.47
MEA Ability to pay with cash on delivery 48% 2.47
North Am Loyalty points 37% 1.32
20COMMERCE & BRAND ENGAGEMENT
Question: When shopping online, which of these features would most increase your likelihood of buying a product?Source: GlobalWebIndex Q1 2019 Base: 42,735 Gen X Internet Users aged 37-55

Rewards Lead to Purchase & Loyalty
% of Gen X who would be motivated to promote a favorite brand online by the following That’s not to say that rewards completely outweigh quality though. High-quality products are the biggest driver of brand advocacy, followed closely by rewards. The key point is that they’re prepared to spend money, but they want value for money – whether that’s reflected in the quality of the product/service, the customer service received, or through other rewarding returns.
As with any generation, the deal-breaker is to understand the needs of Gen Xs without generalization, tailoring brand message and strategy accordingly. After all, with spending power in mind, Gen X’s return and interaction is potentially more rewarding than any other.
TOP OVER-INDEX BY REGION
APAC When something enhances my online reputation/status 15% 1.16
Europe Rewards (e.g. discounts, free gifts, etc) 51% 1.23
LatAm Having insider knowledge about the brand or its products 27% 1.47
MEA When I've received great customer service 49% 1.55
North Am Rewards (e.g. discounts, free gifts, etc) 48% 1.16
IDX 0.99
High-qualityproducts
IDX 1.01
Rewards(e.g. discounts,free gifts, etc)
IDX 1.05
When I've receivedgreat customer
service
IDX 0.97
When somethingis relevant to my
own interests
IDX 0.91
Love for the brand
33%48% 42% 29%30%
21COMMERCE & BRAND ENGAGEMENT
Question: What would most motivate you to promote your favorite brand online?Source: GlobalWebIndex Q1 2019 Base: 42,735 Gen X Internet Users aged 37-55

Argentina 469
Australia 1,555
Austria 538
Belgium 484
Brazil 638
Canada 1,014
China 4,634
Colombia 394
Denmark 524
Egypt 343
France 2,168
Germany 2,233
Ghana 137
Hong Kong 724
India 1,381
Indonesia 282
Ireland 511
Italy 2,362
Japan 877
Kenya 122
Malaysia 381
Mexico 684
Morocco 178
Netherlands 553
New Zealand 473
Nigeria 156
Philippines 276
Poland 606
Portugal 522
Romania 533
Russia 919
Saudi Arabia 351
Singapore 960
South Africa 422
South Korea 563
Spain 2,403
Sweden 510
Switzerland 565
Taiwan 644
Thailand 420
Turkey 350
UAE 562
UK 4,224
USA 10,330
Vietnam 278
22
GLOBALWEBINDEX SAMPLE SIZE BY MARKET
This report draws insights from GlobalWebIndex’s Q1 2019 waves of research
across 45 countries, with a global sample of 49,253 Gen X internet users
aged 37-55.
Notes on Methodology
All figures in this report are drawn
from GlobalWebIndex’s online
research among internet users aged
16-64. Please note that we only
interview respondents aged 16-64
and our figures are representative
of the online populations of each
market, not its total population.
OUR RESEARCH
Each year, GlobalWebIndex
interviews over 575,000 internet
users aged 16-64 across 46 markets.
Respondents complete an online
questionnaire that asks them a
wide range of questions about their
lives, lifestyles and digital behaviors.
We source these respondents
in partnership with a number of
industry-leading panel providers.
Each respondent who takes a
GlobalWebIndex survey is assigned
a unique and persistent identifier
regardless of the site/panel to which
they belong and no respondent can
participate in our survey more than
once a year (with the exception of
internet users in Egypt, Saudi Arabia
and the UAE, where respondents are
allowed to complete the survey at
6-month intervals).
OUR QUOTAS
To ensure that our research is
reflective of the online population
in each market, we set appropriate
quotas on age, gender, and
education – meaning that we
interview representative numbers of
men vs women, of 16-24s, 25-34s, 35-
44s, 45-54s and 55-64s, and of people
with secondary vs tertiary education.
To do this, we conduct research across
a range of international and national
sources, including the World Bank,
the ITU, the International Labour
Organization, the CIA Factbook,
Eurostat, the US Bureau of Labor
Statistics as well as a range of national
statistics sources, government
departments and other credible and
robust third-party sources.
This research is also used to calculate
the ‘weight’ of each respondent;
that is, approximately how many
people (of the same gender, age,
and educational attainment) are
represented by their responses.
MOBILE SURVEY RESPONDENTS
From Q1 2017 on, GlobalWebIndex
has offered our Core survey on
mobile. This allows us to survey
internet users who prefer using a
mobile or are mobile-only (who use
a mobile to get online but do not
use or own any other device). Mobile
respondents complete a shorter
version of our Core survey, answering
50 questions, all carefully adapted to
be compatible with mobile screens.
Please note that the sample sizes
presented in the charts throughout
this report may differ as some will
include both mobile and PC/laptop/
tablet respondents and others will
include only respondents who
completed GWI’s Core survey via PC/
laptop/tablet. For more details on
our methodology for mobile surveys
and the questions asked to mobile
respondents, please download this
document.

ACROSS GLOBALWEBINDEX’S MARKETS
GlobalWebIndex’s research focuses exclusively
on the internet population and because
internet penetration rates can vary significantly
between countries (from a high of 90%+ in parts
of Europe to lows of c.20% in parts of APAC), the
nature of our samples is impacted accordingly.
Where a market has a high internet
penetration rate, its online population will be
relatively similar to its total population and
hence we will see good representation across
all age, gender and education breaks. This is
typically the case across North America, Western
Europe and parts of Asia Pacific such as Japan,
Australia and New Zealand. Where a market
has a medium to low internet penetration, its
online population can be very different to its
total population; broadly speaking, the lower
the country’s overall internet penetration rate,
the more likely it is that its internet users will
be young, urban, affluent and educated. This is
the case throughout much of LatAm, MEA and
Asia Pacific.
This table provides GlobalWebIndex forecasts
on internet penetration (defined as the
number of internet users per 100 people) in
2019. This forecasted data is based upon the
latest internet penetration estimates from the
International Telecommunication Union (ITU)
for each market that GlobalWebIndex conducts
online research in.
GLOBALWEBINDEX VERSUS ITU FIGURES
As GlobalWebIndex’s Core Research is
conducted among 16-64 year-olds, we
supplement the internet penetration forecasts
for a country’s total population (reproduced
above) with internet penetration forecasts for
16-64s specifically.
Forecasts for 16-64s will be higher than our
forecasts for total population, since 16-64s
are the most likely age groups to be using the
internet.
Notes on Methodology: Internet Penetration Rates
Internet Penetration Rates
GlobalWebIndex’s Forecasts for 2019 based on 2017 ITU data
Argentina 78%
Australia 88%
Austria 88%
Belgium 89%
Brazil 71%
Canada 94%
China 59%
Colombia 66%
Denmark 97%
Egypt 54%
France 85%
Germany 88%
Ghana 48%
Hong Kong 91%
India 42%
Indonesia 39%
Ireland 87%
Italy 62%
Japan 92%
Kenya 43%
Malaysia 83%
Mexico 69%
Morocco 69%
Netherlands 93%
New Zealand 93%
Nigeria 36%
Philippines 64%
Poland 79%
Portugal 78%
Romania 72%
Russia 80%
Saudi Arabia 83%
Singapore 85%
South Africa 62%
South Korea 95%
Spain 87%
Sweden 96%
Switzerland 96%
Taiwan 83%
Thailand 58%
Turkey 71%
UAE 95%
UK 96%
USA 80%
Vietnam 55%
23

Access More Reports
Like what you’ve read?There’s plenty more where that came from. Browse our latest reports and infographics
examining key consumer trends across markets.

Request Custom Research
Get more from your data.Run your own custom studies using our panel
of 22 million consumers, and get instant access to insight tailored to your business needs.

Duncan KavanaghSenior Insights Analyst & Writer
www.globalwebindex.com
Copyright © Trendstream Limited 2019 – All rights, including copyright, in the content of GlobalWebIndex (GWI) webpages and publications (including, but not limited to, GWI reports and blog posts) are owned and controlled by Trendstream Limited. In accessing such content, you agree that you may only use the content for your own personal non-commercial use and that you will not use the content for any other purpose whatsoever without an appropriate licence from, or the prior written permission of, Trendstream Limited. | Trendstream Limited uses its reasonable endeavours to ensure the accuracy of all data in GWI webpages and publications at the time of publication. However, in accessing the content of GWI webpages and publications, you agree that you are responsible for your use of such data and Trendstream Limited shall have no liability to you for any loss, damage, cost or expense whether direct, indirect consequential or otherwise, incurred by, or arising by reason of, your use of the data and whether caused by
reason of any error, omission or misrepresentation in the data or otherwise.
Jason ManderChief Research Officer
Top Related