![John Hull [Numerical method, Other Derivatives]](https://static.fdocuments.in/doc/165x107/545a9069af79594e128b5634/john-hull-numerical-method-other-derivatives.jpg)


Languages
Pages
Legal

Fundamentals of Futures and Options Markets, 7th Ed, Ch 23, Copyright © John C. Hull 2010
Credit Derivatives
Chapter 23
1

Fundamentals of Futures and Options Markets, 7th Ed, Ch 23, Copyright © John C. Hull 2010
Credit Derivatives
Derivatives where the payoff depends on the credit quality of a company or sovereign entity
The market started to grow fast in the late 1990s
2
Fundamentals of Futures and Options Markets, 7th Ed, Ch 23, Copyright © John C. Hull 2010
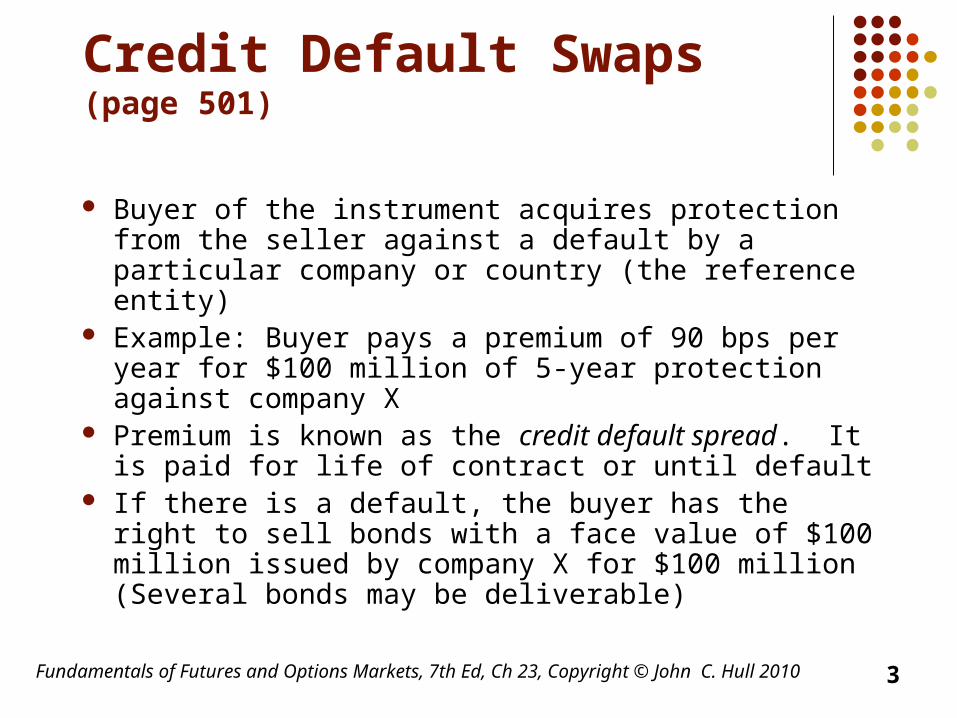
Credit Default Swaps (page 501)
Buyer of the instrument acquires protection from the seller against a default by a particular company or country (the reference entity)
Example: Buyer pays a premium of 90 bps per year for $100 million of 5-year protection against company X
Premium is known as the credit default spread. It is paid for life of contract or until default
If there is a default, the buyer has the right to sell bonds with a face value of $100 million issued by company X for $100 million (Several bonds may be deliverable)
3

Fundamentals of Futures and Options Markets, 7th Ed, Ch 23, Copyright © John C. Hull 2010
CDS Structure
Default Protection Buyer, A
Default Protection Seller, B
90 bps per year
Payoff if there is a default by reference entity=100(1-R)
Recovery rate, R, is the ratio of the value of the bond issued by reference entity immediately after default to the face value of the bond
4
Fundamentals of Futures and Options Markets, 7th Ed, Ch 23, Copyright © John C. Hull 2010
Other Details
Suppose payments are made quarterly in the example just considered. What are the cash flows if there is a default after 3 years and recovery rate is 40%?
5

Fundamentals of Futures and Options Markets, 7th Ed, Ch 23, Copyright © John C. Hull 2010
Attractions of the CDS Market
Allows credit risks to be traded in the same way as market risks
Can be used to transfer credit risks to a third party
Can be used to diversify credit risks
6
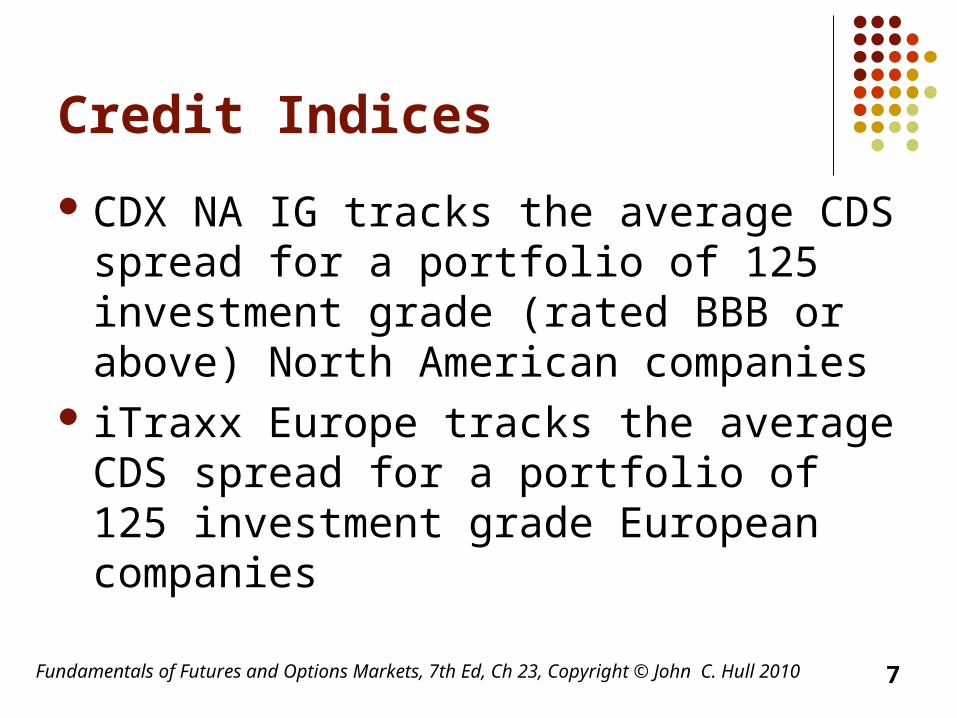
Credit Indices
CDX NA IG tracks the average CDS spread for a portfolio of 125 investment grade (rated BBB or above) North American companies
iTraxx Europe tracks the average CDS spread for a portfolio of 125 investment grade European companies
Fundamentals of Futures and Options Markets, 7th Ed, Ch 23, Copyright © John C. Hull 2010 7

Fundamentals of Futures and Options Markets, 7th Ed, Ch 23, Copyright © John C. Hull 2010
CDS Spreads and Bond Yields (See page 505)
Portfolio consisting of a 5-year corporate bond that provides a yield of 6% and a long position in a 5-year CDS costing 100 basis points per year is (approximately) a long position in a riskless instrument paying 5% per year
This shows that CDS spreads should be approximately the same as bond yield spreads
8
Fundamentals of Futures and Options Markets, 7th Ed, Ch 23, Copyright © John C. Hull 2010
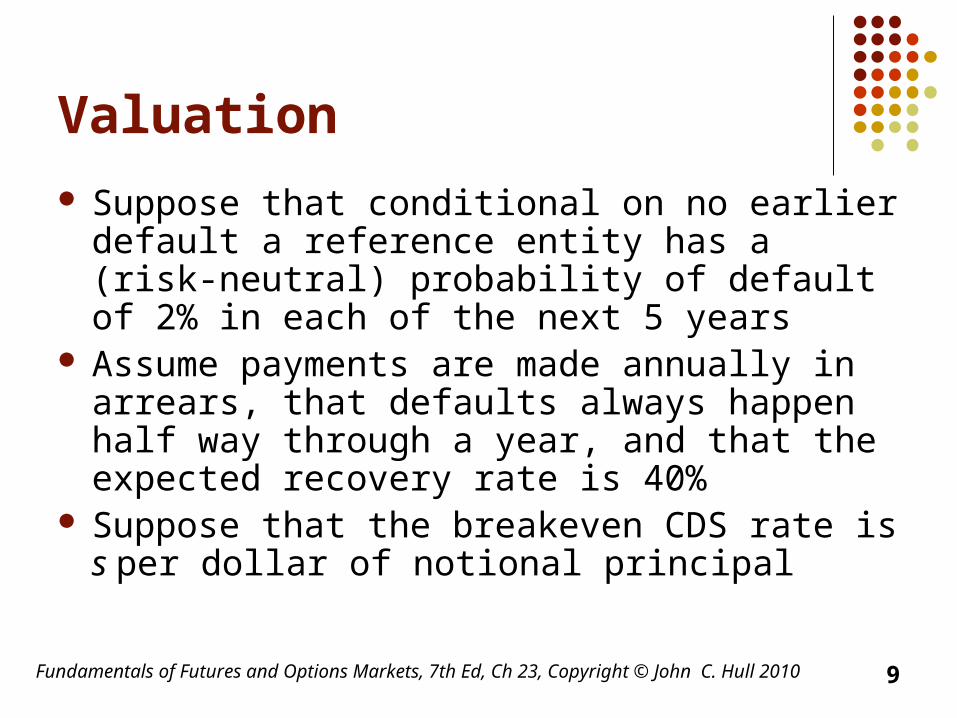
Valuation
Suppose that conditional on no earlier default a reference entity has a (risk-neutral) probability of default of 2% in each of the next 5 years
Assume payments are made annually in arrears, that defaults always happen half way through a year, and that the expected recovery rate is 40%
Suppose that the breakeven CDS rate is s per dollar of notional principal
9

Unconditional Default and Survival Probabilities (Table 23.2)
Note that 0.02*0.98 equals 0.0196, this is the probability that the company survives to the second year and then defaults in that year.
The probability of surviving to the end of the second year is 0.98 *0.98 which is 0.9604
Futures Markets, 7th Ed, Ch 23, Copyright © John C. Hull 2010 10
Time (years)
Default Probability
Survival
Probability
1 0.0200 0.9800
2 0.0196 0.9604
3 0.0192 0.9412
Fundamentals of Futures and Options Markets, 7th Ed, Ch 23, Copyright © John C. Hull 2010
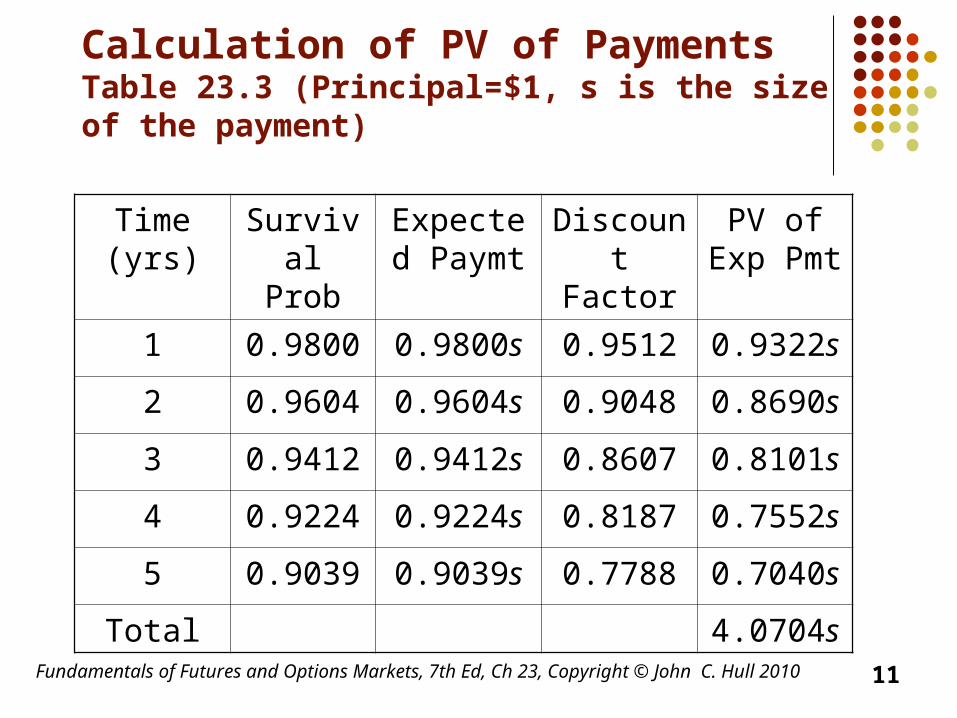
Calculation of PV of PaymentsTable 23.3 (Principal=$1, s is the size of the payment)
Time (yrs)
Survival Prob
Expected Paymt
Discount Factor
PV of Exp Pmt
1 0.9800 0.9800s 0.9512 0.9322s
2 0.9604 0.9604s 0.9048 0.8690s
3 0.9412 0.9412s 0.8607 0.8101s
4 0.9224 0.9224s 0.8187 0.7552s
5 0.9039 0.9039s 0.7788 0.7040s
Total 4.0704s
11
Fundamentals of Futures and Options Markets, 7th Ed, Ch 23, Copyright © John C. Hull 2010
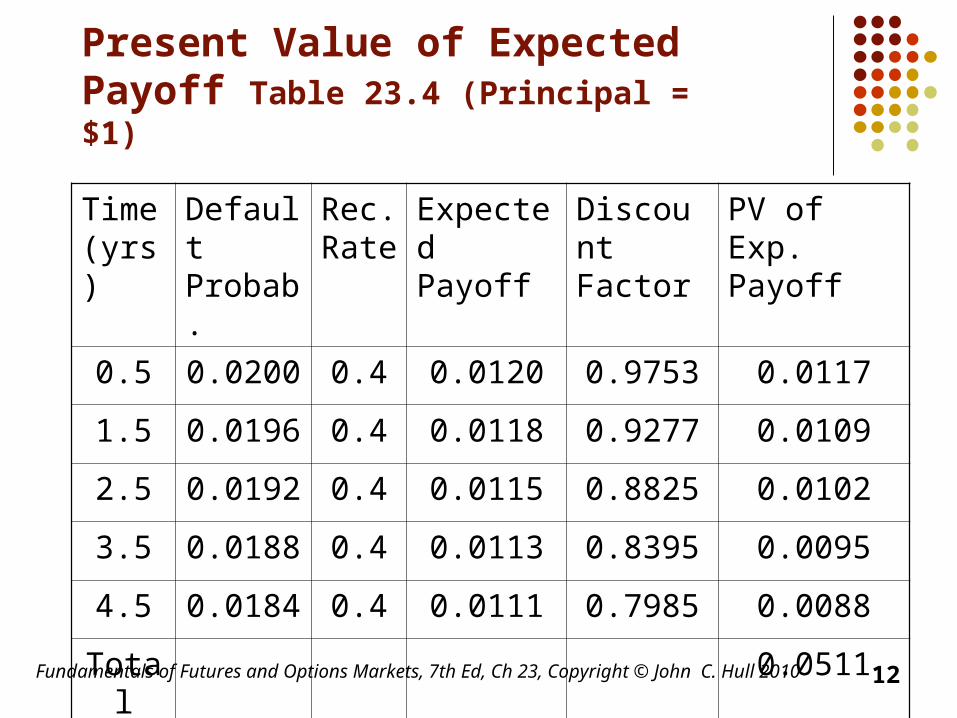
Present Value of Expected Payoff Table 23.4 (Principal = $1)
Time (yrs)
Default Probab.
Rec. Rate
Expected Payoff
Discount Factor
PV of Exp. Payoff
0.5 0.0200 0.4 0.0120 0.9753 0.0117
1.5 0.0196 0.4 0.0118 0.9277 0.0109
2.5 0.0192 0.4 0.0115 0.8825 0.0102
3.5 0.0188 0.4 0.0113 0.8395 0.0095
4.5 0.0184 0.4 0.0111 0.7985 0.0088
Total 0.0511
12
Fundamentals of Futures and Options Markets, 7th Ed, Ch 23, Copyright © John C. Hull 2010
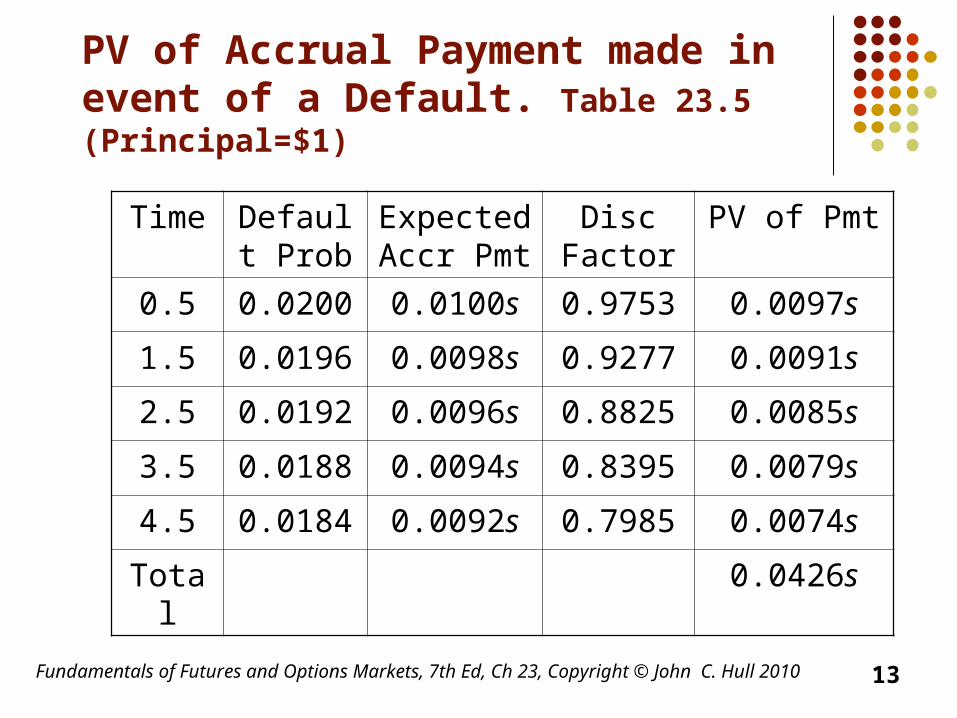
PV of Accrual Payment made in event of a Default. Table 23.5 (Principal=$1)
Time Default Prob
Expected Accr Pmt
Disc Factor
PV of Pmt
0.5 0.0200 0.0100s 0.9753 0.0097s
1.5 0.0196 0.0098s 0.9277 0.0091s
2.5 0.0192 0.0096s 0.8825 0.0085s
3.5 0.0188 0.0094s 0.8395 0.0079s
4.5 0.0184 0.0092s 0.7985 0.0074s
Total 0.0426s
13
Fundamentals of Futures and Options Markets, 7th Ed, Ch 23, Copyright © John C. Hull 2010
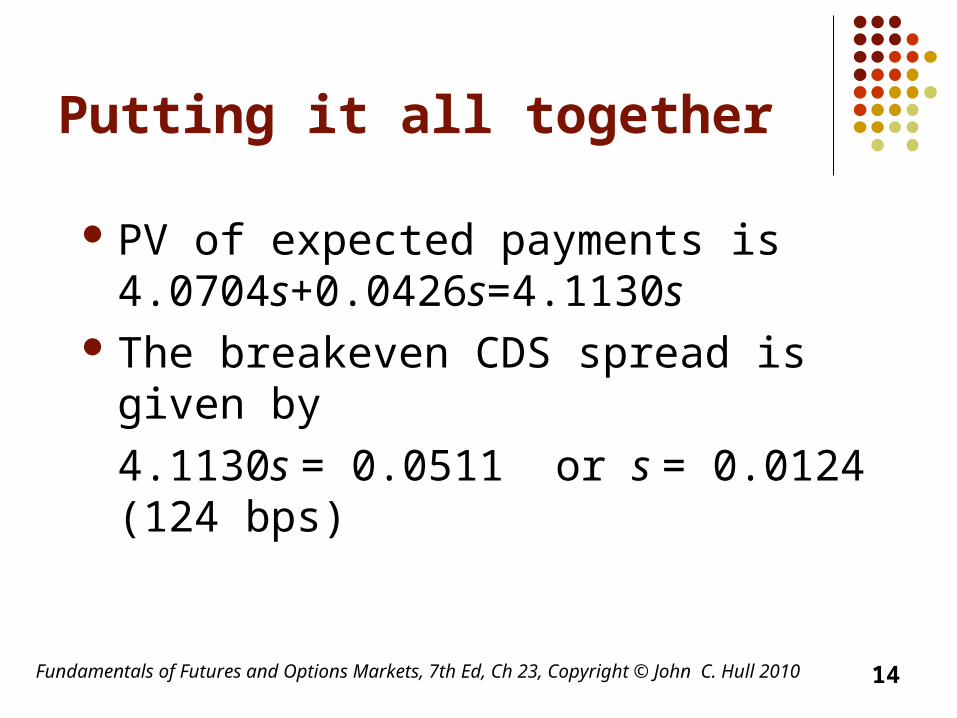
Putting it all together
PV of expected payments is 4.0704s+0.0426s=4.1130s
The breakeven CDS spread is given by
4.1130s = 0.0511 or s = 0.0124 (124 bps)
14

Fundamentals of Futures and Options Markets, 7th Ed, Ch 23, Copyright © John C. Hull 2010
Implying Default Probabilities from CDS Spreads
Suppose that the mid market spread for a 5 year newly issued CDS is 100bps per year
We can reverse engineer our calculations to conclude that the default probability is 1.61% per year.
Note that is the CDS is fairly priced then it will be worth zero when it is signed.
This would be true for a fairly priced option of any kind
15
Top Related