


Languages
Pages
Legal


Copyright: University of Vermont 2017
From 8 to 35 °Brix: Research on reverse
osmosis and syrup flavor and quality
Abby van den Berg, Ph.D.
Research Associate Professor
University of Vermont
Proctor Maple
Research Center
Ph
oto
: Bri
an S
tow
e

Increases efficiency
through reductions in
boiling time and fuel
costs
Other effects?
Chemical composition?
Flavor?
Reverse Osmosis/Membrane Separation
Copyright: University of Vermont 2017

Experiments
Controlled experiments
conducted with commercial
maple equipment at UVM
PMRC Maple Processing
Research Facility to
investigate impacts of RO
on syrup composition and
flavor:
Raw sap vs. 8% Concentrate
2, 8, 12, and 15%
8% vs. 22% ConcentrateMaple Processing Research Facility (MPRF) at UVM PMRC
Copyright: University of Vermont 2017

First Experiment Objective
Investigate the effects of
pre-concentrating sap with
RO on:
Syrup composition,
properties, flavor
Does syrup produced from raw sap
differ from syrup produced with the
same sap concentrated by RO?
van den Berg, A.K., Perkins, T.D., Isselhardt, M.L., Godshall, M.A. and Lloyd, S.W.
2014. Effects of membrane separation on maple syrup composition and flavor.
International Sugar Journal 116:656-665.
Copyright: University of Vermont 2017

Experiment Methods
Produce syrup
from raw sap and
same sap
concentrated to 8%
Compare
composition and
flavor
Copyright: University of Vermont 2017

Experiment Methods
2 Treatments:
Raw sap (2%) and
same sap
concentrated to 8%
Copyright: University of Vermont 2017

Experiment Methods
Each tank fed one of two evaporators
Copyright: University of Vermont 2017

Experiment Methods
Syrup from each evaporator collected and filtered separately
Copyright: University of Vermont 2017

Experiment Methods
Packed for analysis
Repeated on 6 days during production season
Raw sap
(2%)
Concentrate
(8%)
Copyright:
University of
Vermont 2017
Syrup analyses
Composition and
properties:
Color, pH, conductivity
Inorganic Minerals
Flavor:
Volatile flavor
compounds
Sensory evaluation
Does attribute differ in
syrup produced with
raw sap and same sap
concentrated with RO?
Raw sap
(2%)
Concentrate
(8%)
Copyright: University of Vermont 2017
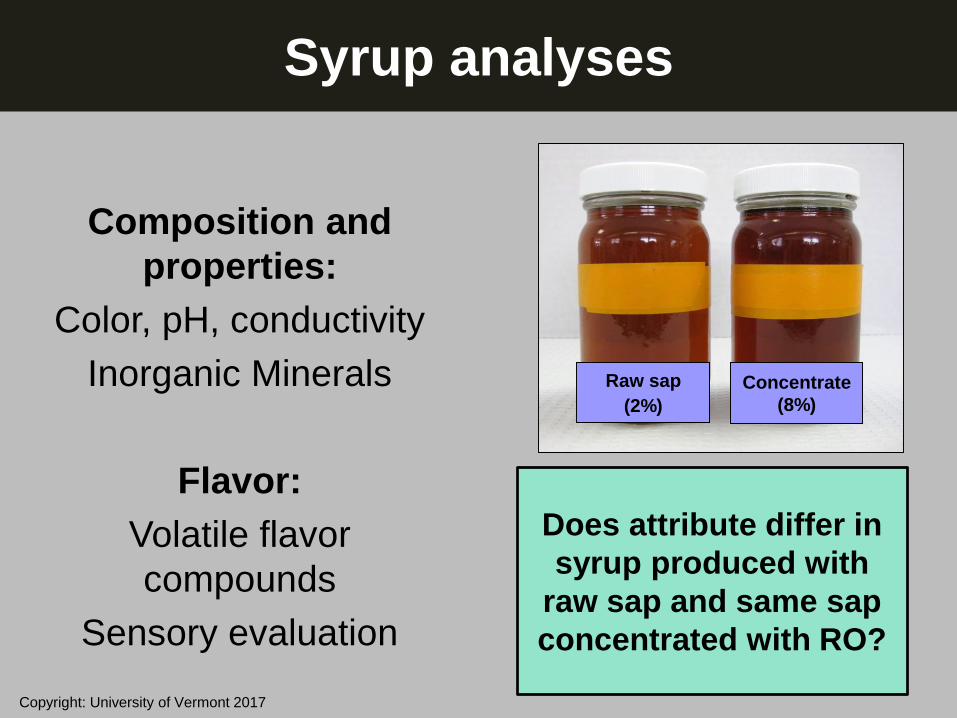
Experiment Date
Concentrate
(8%)
Raw Sap
(2%)
3/18 4/24/13/21 4/4 4/8
Results: Syrup color
32% 37% 46% 53% 55% 52%
43% 46% 57% 69% 66% 65%
11% 10% 11% 16% 11% 13%Difference
Copyright: University of Vermont 2017

Results: Syrup properties and composition
Average composition and properties of syrup produced with raw sap and the same sap concentrated to 8%. p value for paired Student’s t-test (n=6).
Parameter measured p- value
Brix (°) 67.1 ± 0.2 67.2 ± 0.1 0.4142
Conductivity (μS cm-1
) 171.6 ± 11.5 162.9 ± 9.1 0.1572
Light transmittance (%) 57.7 ± 4.4 45.9 ± 3.8 0.0001
pH 7.1 ± 0.05 7.5 ± 0.09 0.0091
Calcium (ppm) 946 ± 77 939 ± 23 0.9164
Phosphorous (ppm) 2.3 ± 0.7 4.1 ± 1.2 0.1424
Potassium (ppm) 1948 ± 37 2009 ± 48 0.2694
Magnesium (ppm) 153.2 ± 7.7 133.1 ± 8.4 0.0063
Iron (ppm)) 1.9 ± 0.5 1.9 ± 0.6 0.9171
Manganese (ppm) 27.2 ± 5.1 16.0 ± 2.4 0.1097
Boron (ppm) 1.2 ± 0.2 0.9 ± 0.1 0.0625
Copper (ppm) 0.9 ± 0.1 1.0 ± 0.1 0.6274
Zinc (ppm) 3.2 ± 0.1 3.6 ± 0.2 0.1084
Sulfur (ppm) 17.5 ± 1.2 18.7 ± 1.2 0.5443
Sucrose (%) 65.4 ± 0.9 64.2 ± 0.7 0.2175
Glucose (%) 0.11 ± 0.004 0.09 ± 0.006 0.0125
Fructose (%) 0.69 ± 0.02 0.67 ± 0.02 0.4607
Total invert sugar (%) 0.79 ± 0.02 0.75 ± 0.02 0.0938
Volatile flavor compounds
(millions of peak area count)2.4 ± 0.3 2.3 ± 0.3 0.9166
Raw Sap (2%) Concentrated Sap (8%)
Copyright:
University of
Vermont
2017

Results: Sap, Concentrate and Permeate
Experiment trial date 3/18/2011 3/21/2011 4/1/2011 4/4/2011 4/8/2011
Material type P S C P S C P S C P S C P S C
Brix (°) 0.0 2.3 8.4 0.0 2.4 7.7 0.0 2.4 8.1 0.0 2.5 8.2 0.0 2.2 8.0
pH 6.3 7.5 7.7 5.8 6.7 7.1 6.0 7.0 7.3 6.0 7.0 7.4 6.0 6.7 7.1
Conductivity (μS cm-1) 6.3 460.7 1218.0 6.5 504.7 1217.0 3.2 398.0 987.8 3.3 456.6 1105.0 4.6 464.5 1203.0
Calcium (ppm) 0.09 49.9 196.0 0.12 60.0 198.0 0.04 41.8 141.0 0.11 50.5 173.0 0.11 52.1 193.0
Phosphorous (ppm) bdl 0.5 3.4 bdl 0.5 2.2 bdl 0.4 1.9 bdl 0.2 1.1 bdl 0.3 1.4
Potassium (ppm) 1.1 58.8 256.0 1.0 62.8 257.0 0.5 49.9 212.0 0.5 56.1 202.0 0.7 56.7 276.0
Magnesium (ppm) 0.012 5.6 20.5 0.013 6.7 20.5 0.004 4.5 14.5 0.009 5.7 18.1 0.010 6.0 20.6
Iron (ppm) bdl 0.1 0.2 bdl 0.1 0.2 bdl 0.0 0.1 bdl 0.1 0.1 bdl 0.1 0.2
Manganese (ppm) bdl 5.5 22.0 bdl 5.6 18.6 bdl 4.2 14.3 bdl 5.3 17.9 bdl 6.0 21.8
Boron (ppm) bdl 0.1 0.1 bdl 0.1 0.1 bdl 0.0 0.1 bdl 0.1 0.1 bdl 0.0 0.1
Copper (ppm) bdl 0.1 0.2 bdl 0.1 0.2 bdl 0.0 0.2 bdl 0.0 0.2 0.03 0.0 0.1
Zinc (ppm) bdl 0.3 1.2 bdl 0.3 1.0 bdl 0.2 0.8 bdl 0.2 1.0 bdl 0.3 1.0
Sulfur (ppm) bdl 0.8 3.7 bdl 1.0 3.9 bdl 0.7 2.5 bdl 0.9 3.5 bdl 1.0 4.0
Sucrose (%) nm 1.8 7.1 nm 1.8 6.1 nm 2.0 7.0 nm 1.9 6.4 nm 1.6 6.4
Glucose (%) nm 0.07 0.24 nm 0.09 0.25 nm 0.07 0.22 nm 0.10 0.26 nm 0.09 0.23
Fructose (%) nm 0.04 0.12 nm 0.04 0.14 nm 0.03 0.11 nm 0.04 0.13 nm 0.04 0.13
Total invert sugar (%) nm 0.1 0.4 nm 0.1 0.4 nm 0.1 0.3 nm 0.1 0.4 nm 0.1 0.4
Composition of raw sap, 8% concentrate, and permeate for 5 experiment trials. Copyright: University of Vermont 2017

Results: Sap, Concentrate and Permeate
Permeate Sap ConcentrateCalculated
Concentration
Brix (°) 0.0 2.4 8.1 8.1
Calcium (mg kg-1) 0.04 41.8 141.0 141.0
Phosphorous (mg kg-1) bdl 0.4 1.9 1.3
Potassium (mg kg-1) 0.5 49.9 212.0 168.3
Magnesium (mg kg-1) 0.004 4.5 14.5 15.0
Iron (mg kg-1) bdl 0.04 0.12 0.14
Manganese (mg kg-1) bdl 4.2 14.3 14.2
Boron (mg kg-1) bdl 0.04 0.09 0.14
Copper (mg kg-1) bdl 0.04 0.15 0.14
Zinc (mg kg-1) bdl 0.2 0.8 0.7
Sulfur (mg kg-1) bdl 0.7 2.5 2.3
Sucrose (%) nm 2.0 7.0 6.6
Glucose (%) nm 0.07 0.22 0.24
Fructose (%) nm 0.03 0.11 0.10
Total invert sugar (%) nm 0.10 0.33 0.34
Composition of raw sap, the same sap concentrated to 8%, and the calculated composition of the concentrate based on the concentration factor (3.4x)
Copyright: University of Vermont 2017
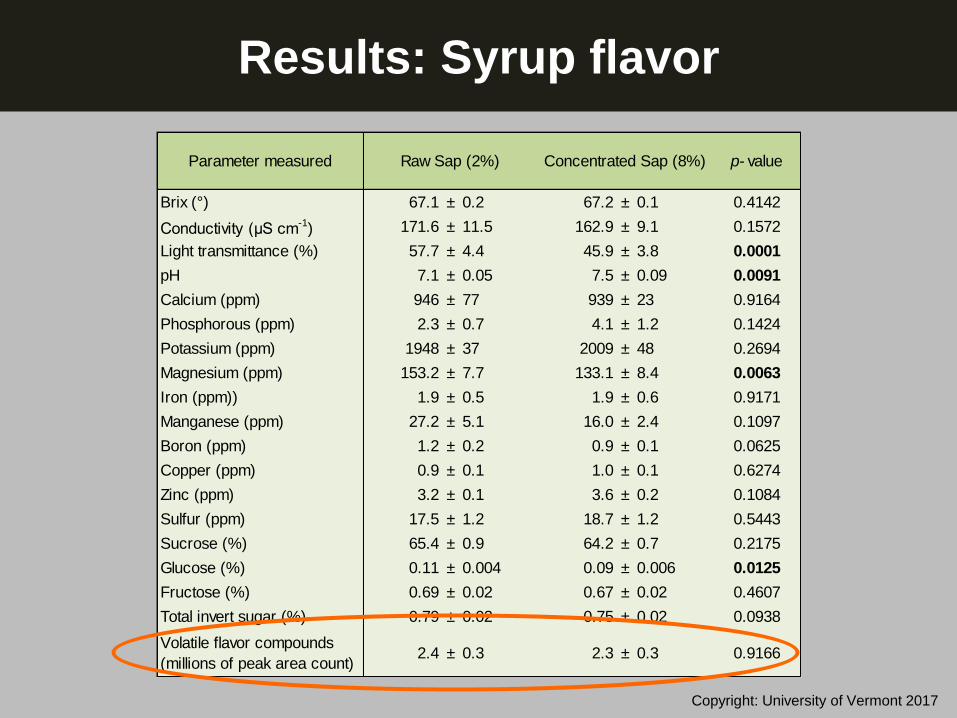
Results: Syrup flavor
Parameter measured p- value
Brix (°) 67.1 ± 0.2 67.2 ± 0.1 0.4142
Conductivity (μS cm-1
) 171.6 ± 11.5 162.9 ± 9.1 0.1572
Light transmittance (%) 57.7 ± 4.4 45.9 ± 3.8 0.0001
pH 7.1 ± 0.05 7.5 ± 0.09 0.0091
Calcium (ppm) 946 ± 77 939 ± 23 0.9164
Phosphorous (ppm) 2.3 ± 0.7 4.1 ± 1.2 0.1424
Potassium (ppm) 1948 ± 37 2009 ± 48 0.2694
Magnesium (ppm) 153.2 ± 7.7 133.1 ± 8.4 0.0063
Iron (ppm)) 1.9 ± 0.5 1.9 ± 0.6 0.9171
Manganese (ppm) 27.2 ± 5.1 16.0 ± 2.4 0.1097
Boron (ppm) 1.2 ± 0.2 0.9 ± 0.1 0.0625
Copper (ppm) 0.9 ± 0.1 1.0 ± 0.1 0.6274
Zinc (ppm) 3.2 ± 0.1 3.6 ± 0.2 0.1084
Sulfur (ppm) 17.5 ± 1.2 18.7 ± 1.2 0.5443
Sucrose (%) 65.4 ± 0.9 64.2 ± 0.7 0.2175
Glucose (%) 0.11 ± 0.004 0.09 ± 0.006 0.0125
Fructose (%) 0.69 ± 0.02 0.67 ± 0.02 0.4607
Total invert sugar (%) 0.79 ± 0.02 0.75 ± 0.02 0.0938
Volatile flavor compounds
(millions of peak area count)2.4 ± 0.3 2.3 ± 0.3 0.9166
Raw Sap (2%) Concentrated Sap (8%)
Copyright: University of Vermont 2017

Syrup flavor: Sensory evaluation
Triangle Test:
Is there an overalldifference in flavor
between 2 samples?
or
2% 8% 2%
Syrup produced March 18th:
8% 8% 2%
etc…
Copyright: University of Vermont 2017

Syrup flavor: Sensory evaluation
Is there a difference in flavor between syrup made
simultaneously from raw sap and concentrate?
Triangle Tests
4 Syrup pairs3/18, 4/2, 4/4, 4/8
Copyright: University of Vermont 2017

3/18 4/84/44/2
Concentrate
(8%)
Raw Sap
(2%)
No difference detected
Syrup flavor: Sensory evaluation
Copyright: University of Vermont 2017

Additional experiments:
Higher and varied concentration levels
Experiments to
examine:
2, 8, 12, and 15%
8% vs. 22%
Concentrate
Similar
methodologyvan den Berg, A.K., Perkins, T.D., Isselhardt, M.L., Godshall, M.A. and Lloyd, S.W. 2012. Maple syrup
production with sap concentrated to high levels by membrane separation: effects on syrup chemical
composition and flavor. International Sugar Journal 114:572-576.
van den Berg, A.K., Perkins, T.D., Isselhardt, M.L., Godshall, M.A. and Lloyd, S.W. 2011. Effects of
producing maple syrup from concentrated and reconstituted sap of different sugar concentrations.
International Sugar Journal 113:35-44.
Copyright: University of Vermont 2017
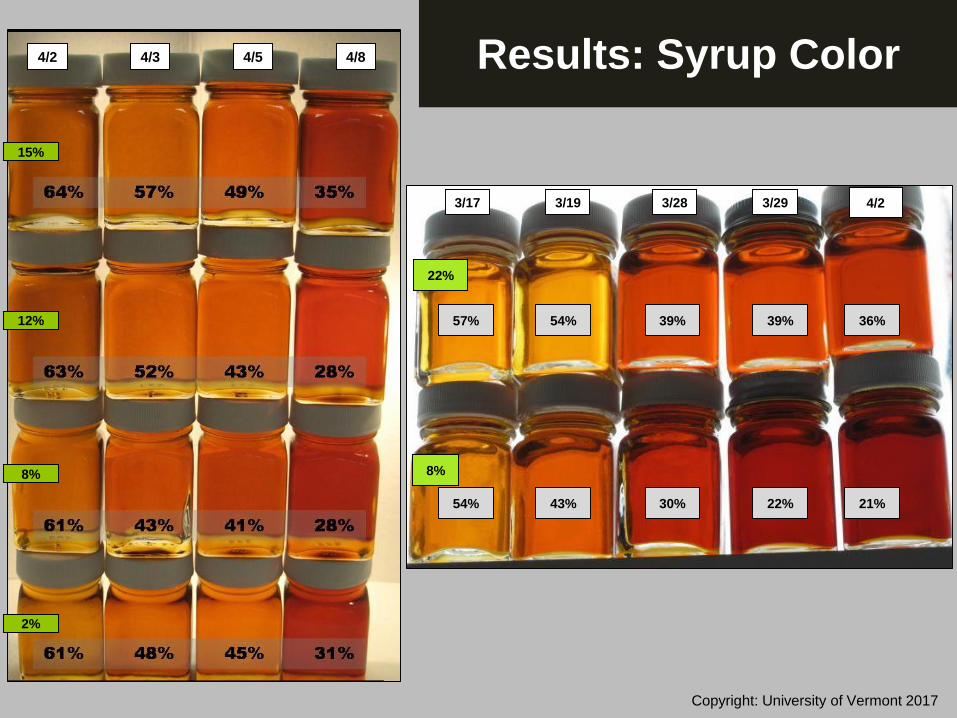
Results: Syrup Color
3/17 3/293/283/19
22%
8%
4/2
54% 43% 30% 22% 21%
57% 54% 39% 39% 36%
15%
12%
8%
2%
4/2 4/84/54/3
Copyright: University of Vermont 2017

Syrup made from raw
sap tends to be lighter
than syrup made with
sap concentrated to 8% 0.0
20.0
40.0
60.0
80.0
100.0
Raw sap (2%) Concentrate (8%)
Lig
ht
tra
ns
mit
tan
ce
(%
)
Starting sugar concentration
*
0
20
40
60
80
100
8% 22%
Lig
ht
tra
ns
mit
tan
ce
(%
)
Starting sugar concentration
*
Once RO is used:
Syrup made with more
concentrated sap tends
to be lighter than syrup
made from less
concentrated sap
RO effects on syrup color?
Copyright: University of Vermont 2017

Results: Syrup composition and flavor
Composition/
Properties:
Very few (if any)
significant differences
Flavor:
No significant
differences found in
sensory evaluations
3/17 3/293/283/19
22%
8%
No difference detected
4/2 4/84/54/3
2%
15%
No difference detected
Copyright: University of Vermont 2017

Slight to moderate effects on
color
Minimal (if any) impacts on
properties and chemical
composition
No perceptible impacts on
flavor in sensory evaluations
Ph
oto
: Gar
y G
rah
am
Effects of RO on syrup composition and flavor?
Conclusions
Copyright: University of Vermont 2017

Results of all 3 experiments outlined in
October 2015
Maple Digestarticle
http://www.uvm.edu/~pmrc
“RO Effects on Syrup”
Copyright: University of Vermont 2017
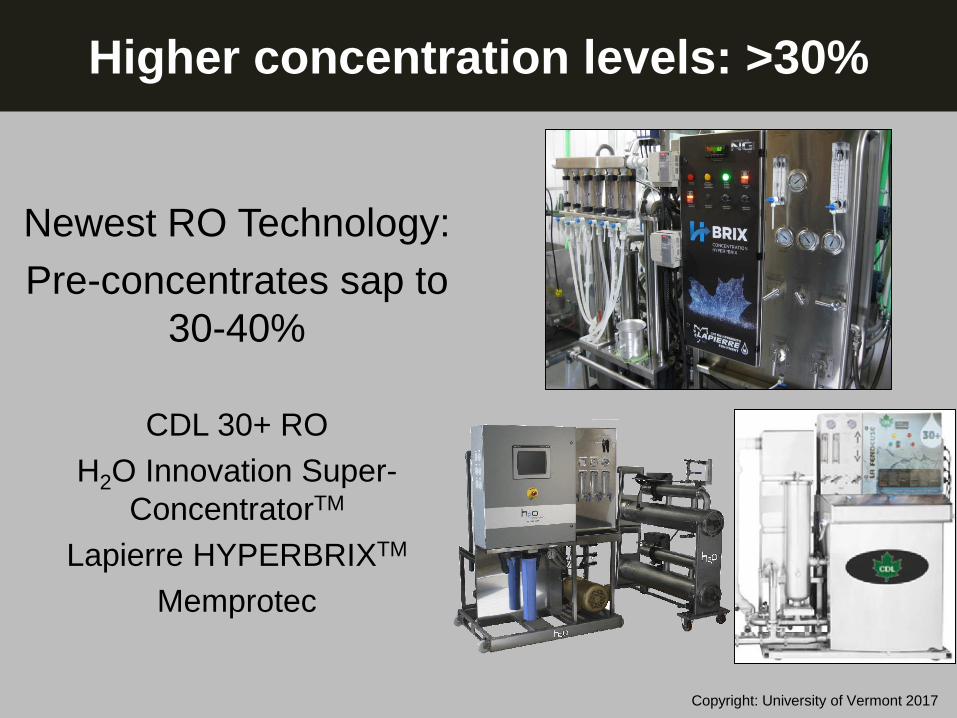
Higher concentration levels: >30%
Newest RO Technology:
Pre-concentrates sap to
30-40%
CDL 30+ RO
H2O Innovation Super-
ConcentratorTM
Lapierre HYPERBRIXTM
Memprotec
Copyright: University of Vermont 2017

Study Objective
What are the impacts of ultra-high RO
concentration on syrup flavor?
Sensory Evaluation
Experiment:Is the flavor of syrup produced with
sap concentrated to 30-40 °Brix
appealing and liked?
Is the flavor characteristic of pure
maple syrup?
Copyright: University of Vermont 2017

20
30
40
50
60
70
80
90%
Lig
ht
tran
sm
itta
nce
Syrup sample
High Brix Control High Brix Control
Syrup Samples
2016 Season
6 producers using
High-Brix
3 samples each:
Early, Middle, Late
%LT, °Brix, Organic
vs Conventional
Matched Control
Samples
Produced with
standard RO (no steam, air injection, etc.)
Matched for
Color/Grade,
Organic/Conventional Copyright: University of
Vermont 2017

Sensory Evaluation Experiment
46 panelists
recruited and
pre-screened:Like maple syrup
Non-smokers
Familiar with current
grading system
4 Experiment
sessions
Copyright: University of Vermont 2017

Sensory Evaluation Experiment
How much do you like or dislike the
overall flavor of this syrup?9-point hedonic scale
Dislike extremely Like extremely
(Is flavor of syrup made with High-Brix liked?)
Copyright: University of Vermont 2017

Sensory Evaluation Experiment
How much do you agree or disagree with this statement: “The flavor of this syrup is characteristic of pure maple syrup”
7-point Likert scale
Entirely disagree Entirely agree
(Is flavor of syrup made with High-Brix characteristic of pure maple syrup?)
Copyright: University of Vermont 2017

ResultsIs the flavor of syrup produced with High-Brix processing liked?
Indicate how much you like or dislike the overall flavor of this syrup
1% 5% 6% 11% 9% 19% 23% 22% 5%1% 3% 5% 12% 8% 20% 26% 21% 4%0%
5%
10%
15%
20%
25%
30%
Dislikeextremely
Dislike verymuch
Dislikemoderately
Dislike slightly Neither like ordislike
Like slightly Like moderately Like very much Like extremely
% o
f re
sp
on
se
s
Control
High Brix
p < 0.9453
Overall average percentage of responses in each category across Control (n=6) and High Brix (n=9) samples.
70% of High-Brix, 68% of Control “liked”
Copyright: University of Vermont 2017

ResultsIs the flavor of syrup produced with High-Brix characteristic of pure maple syrup?
Indicate how much you agree or disagree with this statement:
“The flavor of this syrup is characteristic of pure maple syrup.”
p < 0.9375
Overall average percentage of responses in each category across Control (n=6) and High Brix (n=9) samples.
2% 6% 13% 6% 21% 29% 23%1% 5% 14% 9% 22% 32% 18%0%
5%
10%
15%
20%
25%
30%
35%
Entirely disagree Mostly disagree Somewhatdisagree
Neither agree ordisagree
Somewhat agree Mostly agree Entirely agree
% o
f re
sp
on
se
Control
High Brix
72% of High-Brix, 73%
of Control “agree”
Copyright: University of Vermont 2017

Preliminary Conclusions – High-Brix
Syrup made with High-Brix
processing has flavor that is
generally liked and
characteristic of pure maple
syrup
“Liking” and “characteristic of
maple syrup” similar to syrup
of the same color/grade made
with standard RO processing
Flavor consistent with syrup of
similar color grade
Copyright: University of Vermont 2017

Thank you!
Questions?
MPRF experiments supported by the UVM
Agricultural Experiment Station, USDA
CSREES grant #2008-34157-19186, and USDA
NIFA grant #2010-34157-21008. High-Brix
sensory experiment supported by the North
American Maple Syrup Council Research Fund
Chittenden County Maple Sugarmakers
Association (MPRF evaporators)
Steve Bedard, Butternut Mountain Farm, Ben
Dana, Douglas Edwards, Rock Gaulin, Jean-
François Goulet, H2O Innovation, Teague
Henkle, Alan Howard, Jean Jones, Carl
Lapierre, Lapierre Equipment, David Marvin,
Marianne McKee, Miranda Moore, Joshua
O’Neill, Ted Ortiz Y Pino, Jack O’Wril, Brian
Perkins, Eric Sorkin, Brian Stowe, and Joel
Tilley
**Producers**
**Sensory panelists**
Copyright: University of Vermont 2017
Top Related