


![Precision medicine as a promising tool to empower research ...gsconlinepress.com/journals/gscbps/sites/default/files/GSCBPS-2018-0068.pdfsilico”’ target identification [1]. They](https://static.fdocuments.in/doc/165x107/603ba13622f8635772627722/precision-medicine-as-a-promising-tool-to-empower-research-silicoaa-target.jpg)

Languages
Pages
Legal

GSC Biological and Pharmaceutical Sciences, 2020, 11(01), 093–099
Available online at GSC Online Press Directory
GSC Biological and Pharmaceutical Sciences
e-ISSN: 2581-3250, CODEN (USA): GBPSC2
Journal homepage: https://www.gsconlinepress.com/journals/gscbps
Corresponding author: Rathnayaka RMUSK
Copyright © 2020 Author(s) retain the copyright of this article. This article is published under the terms of the Creative Commons Attribution Liscense 4.0.
(RE SE AR CH AR T I CL E)
Formulation and development of composite fruit peel powder incorporated fat and
sugar-free probiotic set yogurt
Dias PGI, Sajiwanie JWA and Rathnayaka RMUSK *
Department of Food Science and Technology, Faculty of Applied Sciences, Sabaragamuwa University of Sri Lanka, P.O.Box 02, Belihuloya, Sri Lanka.
Publication history: Received on 04 April 2020; revised on 11 April 2020; accepted on 12 April 2020
Article DOI: https://doi.org/10.30574/gscbps.2020.11.1.0084
Abstract
Reduction of milk fat and added sugar makes the yogurt even healthier, yet texture deformations and less consumer
acceptability will be attributed. Fiber incorporation may be counteracting these problems, which is tested in the present
study by incorporating underutilize and cheap fiber sources. Composite fruit peel powder (FPP) formulated from
industrial waste was incorporated into fat and added sugar-free set yogurts in three different proportions as 0.5%, 0.7%
and 1% (w/v). Yogurt without added FPP was considered as the control. Alteration of titrable acidity, pH and lactic acid
bacteria viability were evaluated over a period of a month. Total soluble solids content (TSS), color values, texture
profile, and consumer acceptability also were tested. Results showed that FPP incorporation reduces the initial pH of
the yogurt mix while increasing the TSS and impart color changes. The elevated amount of FPP mixture (0.7% and 1%)
adversely affect texture parameters, microbial count and sensory acceptability. Firmness increased, syneresis
decreased, and comparatively high lactic acid bacteria counts observed in fat and sugar-free yogurt with 0.5% FPP
incorporation. No significant difference (p<0.05) of overall consumer acceptability among 0.5% FPP mixture added and
control yogurts, which have the highest scores. Consumers preferred the bitter taste of that yogurt over the high acidic
taste of control yogurt. Hence, 0.5% FPP mixture can be used to preserve the texture characteristics and increase the
consumer acceptability of fat and sugar-free set yogurts.
Keywords: Set yogurt; Fruit peel powder; Fiber incorporation; Probiotic
1. Introduction
Yogurt is a fermented dairy product well known for its health benefits over centuries. Consumer surveys have shown
that the health benefit of yogurt is one of the major factors affect the purchasing decision [1]. Yogurt manufactures are
now focusing on even healthy innovations such as low or no fat, high fiber, low or no sugar, high vitamin, and no
additives yogurts to grab the competitive advantage in the market. Consumer demand for such products also increases
due to busy and sedentary lifestyles and the alarming rates of non-communicable diseases.
However, the reduction of milk fat and added sugar could lead to texture deformations and less consumer acceptability
of yogurt. Incorporation of fiber into yogurt was identified as a promising solution for this. Normally, such value
additions tend to raise the production cost and price, hence, the products are becoming less affordable to the general
population. This can be avoided by utilizing highly available, cheap and underutilized raw materials. Fruit processing
by-products as a fiber source for yogurts is such an example studied by many researchers [2,3]. The approach aid in the
mitigation of fruit waste accumulation and environmental issues as well.

Dias et al. / GSC Biological and Pharmaceutical Sciences, 2020, 11(01), 093–099
94
Results of our previous study revealed that annual fruit wastage of local fruit manufacturing industries is ranged from
35 to 60% and has great potential to reuse [4]. In the present study, evaluate the potential of employing composite fruit
peel powder formulated from industrial fruit peel waste to preserve the texture characteristics and increase the
consumer acceptability of fat and sugar-free probiotic set yogurts.
2. Methodology
In this study, fat and sugar-free set yogurt (T1) was considered as the control. Composite peel powder (FPP) formulated
from passion fruit (PFP), Pineapple (PP), and orange (OP) peels (60%, 20%, 20% of dry weight, respectively) were
incorporated into yogurts in three different proportions as 0.5%, 0.7% and 1% (w/v) and labeled as T10, T11 and T12,
respectively.
2.1. Sample preparation
Samples were prepared in Dairy Processing Laboratory, Department of Food Science and Technology, Sabaragamuwa
University of Sri Lanka. All the utensils used for yoghurt preparation were sterilized with boiling water. UHT treated
milk (Kothmale Dairy Products (Pvt)ltd., Sri Lanka) were heated with continuous agitating in a medium flame. Pre-
mixed gelatine, skim milk powder, and fruit peel powder was added into the milk at 60 ℃. Yogurt formulation was
heated at 85 ℃ for 10 min. The mixture was allowed to cool down to 42 ℃ and 0.01% (w/v) of YC-X11 and BB12 (Chr.
Hansen, Hoersholm, Denmark) starter cultures containing Streptococcus thermophilus, Lactobacillus bulgaricus, and
Bifidobacterium animalis subsp. lactis was added into it. The mixture was homogenized using a homogenizer (Jainon,
India) for 1-3 min. The homogenized mixture was filled into sterilized plastic containers and allowed to incubate at 42℃
until the pH of the mixture drops to 4.5.
2.2. TSS, titrable acidity, pH and color values
The determination of total solids content and titrable acidity of yogurts was made according to standard methods [5].
The initial pH was determined using a pH meter, model Q-400M1 (Quimis, Sao Paulo, Brazil). The post acidification was
determined as pH and titrable acidity after 1, 7, 14 and 28 days of cold storage.
The color of yogurts was measured using a Hunter Lab color meter (CR 400, Konica Minolta, Japan). Measurements were
taken directly at three different locations, after standardization with a white calibration plate (L* = 94.12, a* = 0.29, and
b*= 2.73). Colour was expressed in Hunter Lab units L*, a* and b*, where L* indicates lightness, a* indicates hue on a
green (–) to red (+) axis, and b* indicates hue on a blue (–) to yellow (+) axis [6].
2.3. Microbial analysis
Bacterial enumerations were carried out after 1, 7, 14 and 28 days of cold storage in three replicates of each sample.
Yogurts (1 ml) were diluted with sterile distilled water (9 mL). Afterward, serial dilutions were carried out, and bacteria
were cultured by applying the pour plate technique. All media were obtained from HiMedia Laboratory Pvt.Ltd.,
Bombay, India. In co-cultures, Streptococcus thermophilus colonies were enumerated in M17 agar, while those of
Lactobacillus delbrueckii subsp. bulgaricus in MRS agar (pH 5.4), both under aerobic incubation at 37℃ for 24 h. Total
colonies were counted by colony counter (Rocker, Galaxy 230) and expressed in CFU/mg. Viability proportion index
(VPI) of yogurt microorganism at the end of storage time were calculated as the following equation;
VPI = Final cell population (CFU/ml) / initial cell population (CFU/ml) (g-1)
2.4. Syneresis and texture profile analysis
Syneresis was measured according to a previously used filtration method [7]. Unstirred yogurt (30 g) was spread evenly
on a Whatman No. 1 filter paper (Whatman Ltd., Maidstone, UK) in a funnel, which was placed on top of a 50 ml
graduated cylinder. The graduated cylinder was then held at 4℃ for 5 h and the volume of liquid collected was recorded.
Syneresis index (%) was calculated as follows;
Syneresis index % = (volume of whey/volume of yoghurt) *100
Dias et al. / GSC Biological and Pharmaceutical Sciences, 2020, 11(01), 093–099
95
Two-cycle texture profile analysis was conducted by Brookfield CT3 texture analyzer by using the TA4/1000 cylindrical
probe and TA-BT-KIT fixture. Target distance, hold time, trigger load, recovery time, pre-test speed, return speed, and
load cell were set as 20 mm, 0, 4.5 g, 5 sec, 2 mm/s, 1 mm/s, and 1500 g, respectively. The Uniform sample size (80 ml)
was tested after 24 h cold storage at 4℃. All the samples were in the same pH (4.5) and temperature (20℃) at the testing
point. Calculations were made using a graph of time (t) vs. force (F) and texturepro CT V1.8 software.
2.5. Sensory analysis
Consumer acceptance of four yogurt samples (T1, T10, T11, and T12) was assessed by a 5-point hedonic scale using 32
untrained panelists. The panelists rinsed their mouths with water before testing each sample.
3. Results and discussion
3.1. Initial pH, TSS and color values
The initial pH decreased after FPP addition (Table 1, Figure 2). However, there was no significant difference among fruit
peel powder added samples. Some previous studies have showed that there is no influence in initial pH due to the
addition of fruit peel powders [8]. In contrast, in some other studies it has found that fiber from citric fruits caused a
slight decrease in the pH of milk; the author suggested that the fiber became warmer upon mixing and liberate acidic
compounds, favoring a decrease in pH [9]. This decrease did not affect the fermentation process of yogurt. In the present
study, all three peel types were acidic [10] and that may be the reason for this pH reduction. As shown in Table 1, total
soluble solid content increased after fiber addition, yet no significant difference observed among T10, T11, and T12.
Table 1 Effect of FPP addition on Initial pH, TSS and color values of fat and sugar-free yogurts
Initial pH Initial pH TSS L* a* b*
T1 (Control) 6.45±0.05a 14.14±0.00b 93.96±0.00a -3.52±0.00d 11.60±0.00d
T10 6.25±0.01b 22.27±0.52a 88.84±5.50b -2.50±0.47a 17.63±0.33a
T11 6.27±0.02b 23.36±0.34a 81.94±1.35c -1.55±0.05c 12.59±0.96c
T12 6.27±0.03b 23.61±0.11a 70.94±1.74d -1.67±0.33b 15.37±1.74b
Mean ± SE (n=3). Values followed by different letters in the same column are significantly different (p < 0.05) according to Tukey’s test
Fruit peel powder addition imparted the changes in color values. In one of the previous studies, yogurt containing 0.6%,
0.8%, and 1% orange peel powder had more red and yellow color than the control [11] while in another study it has
found that the incorporation of powder obtained from asparagus shoots imparted a yellowish-greenish color to the
yogurt [12]. Similarly, in the present study, lightness decreases and redness and yellowness increased with the fiber
addition (Table 1).
3.2. Post acidification and titratable acidity
In the present study titratable acidity (TA) increased and pH decreased over the time. Increasing TA is positively
correlated with fiber content (Figure 1 and Figure 2). This results are in accordance with the findings of previously
conducted similar study for date pomace added yogurts [8].

Dias et al. / GSC Biological and Pharmaceutical Sciences, 2020, 11(01), 093–099
96
Figure 1 Titrable acidity-lactic acid change with time in FPP added yogurts
Figure 2 pH change with time in fruit peel powder added yogurts
3.3. Microbial analysis
In general, fiber addition tends to increase the counts of Streptococcus thermophilous and Lactobacillus bulgaricus.
However, some studies on the supplementation of fermented milk with fruit fibers presented opposite results [2]. This
can be explained as some compounds in fruit peels such as phenolic compounds, fatty acid esters, thiols, terpenes, and
alcohols can inhibit the growth of lactic acid-producing bacteria. Some other supplements such as whey protein and
whey protein concentrates also have been reported as enhancers of probiotic viability [13,14].
In the present study, there was no significant difference in Streptococcus thermophilous counts on day 1 and day 14. On
day 7 and day 28, the least bacterial count observed in a 1% peel powder added sample (T12) (Table 2). In accordance,
although fruit peels have prebiotic actions, elevated concentrations may tend to disturb the bacterial growth.
Table 2 Counts of Streptococcus thermophilous over time
Sample Counts of Streptococcus thermophilous log(CFU/ml)
Day 1 Day 7 Day 14 Day 28 VPI%
T1 9.24±0.27a 9.40±0.10b 10.58±0.01a 11.13±0.03ab 1.20
T10 9.33±0.92a 11.09±0.33a 11.48±0.18a 12.02±0.34a 1.29
T11 9.49±0.11a 11.11±0.33a 11.52±0.06a 11.71±0.22ab 1.23
T12 8.73±0.34a 10.18±0.35ab 10.64±0.63a 10.84±0.30b 1.24
Mean ± SE (n=3). Values followed by different letters in the same column are significantly different (p < 0.05) according to Tukey’s test; VPI:
viability proportion index

Dias et al. / GSC Biological and Pharmaceutical Sciences, 2020, 11(01), 093–099
97
In the case of Lactobacillus bulgaricus, the counts increased after adding fruit peel powder, on days 7, 14 and day 28 but
no significant difference observed in day 1 between T1, T10, T11 and T12 (Table 3). Findings of a similar study showed
that the incorporation of PFP powder alone did not influence the lactic acid bacteria count [2]. Hence, this powder
combination can gain more advantages as a prebiotic agent.
Table 3 Counts of Lactobacillus bulgaricus over time
Sample Counts of Lactobacillus bulgaricus log(CFU/ml)
Day 1 Day 7 Day 14 Day 28 VPI%
T1 9.12±0.10a 9.87±0.42b 10.46±0.10c 11.25±0.46b 1.23
T10 9.96±1.26a 11.22±0.04a 11.12±0.03bc 12.23±0.10a 1.23
T11 10.05±0.70a 11.44±0.04a 11.52±0.10ab 12.38±0.20a 1.23
T12 10.29±1.06a 10.75±0.58ab 11.98±0.60a 12.41±0.02a 1.21
Mean ± SE (n=3). Values followed by different letters in the same column are significantly different (p < 0.05) according to Tukey’s test; VPI:
viability proportion index
3.4. Texture profile analysis
Findings of a previous study showed that the firmness of low fat set yogurt increase with inulin content [15]. In contrast,
in the present study, firmness increased only in 0.5% peel powder added sample and thereafter (at 0.7% and 1%
addition) decreased than the control (T1). In one of the previous studies, it has found that the addition of orange fiber
below 1% concentration reduces the firmness of skim yogurt [11]. Therefore, this peel composite is much better in the
enhancement of firmness over the incorporation of individual peel powders (Table 4).
Table 4 Texture parameters of fiber incorporated yogurts with compare to fat and sugar-free probiotic set yogurt (part
I)
Sample Hardness (g) adhesive force
(g)
Adhesiveness
(mJ)
resilience Fracturability
(g)
T1 148.33±8.40a 49.93±4.20b 5.15±0.45b 0.02±0.00b 116.40±3.40ab
T10 170.00±1.00a 62.80±0.80a 8.14±0.47a 0.02±0.00b 150.40±0.08a
T11 100.50±3.30b 34.80±0.20c 3.84±0.45b 0.03±0.00ab 30.60±0.76b
T12 102.90±5.50b 33.70±0.30c 3.77±0.40b 0.04±0.00a 63.20±3.20b
Mean ± SE (n=3). Values followed by different letters in the same column are significantly different (p < 0.05) according to Tukey’s test
Table 5 Texture parameters of fiber incorporated yogurts with compare to fat and sugar-free probiotic set yogurt (part
II)
Sample Cohesiveness
Springiness
(mm)
springiness
index
Gumminess
(g)
corrected
cohesiveness
Syneresis
Index%
T1 0.42±0.00b 19.26±0.01ab 0.97±0.01a 62.93±4.13ab 0.41±0.02b 43.30± 0.46a
T10 0.42±0.01b 19.11±0.05b 0.96±0.00b 70.60±1.93a 0.41±0.01b 22.14±0.63d
T11 0.50±0.01a 19.14±0.02b 0.96±0.00ab 51.93±1.59bc 0.47±0.00a 31.63±0.90c
T12 0.50±0.00a 19.29±0.70a 0.97±0.00a 50.45±2.98c 0.47±0.01a 37.95±1.07b
Mean ± SE (n=3). Values followed by different letters in the same column are significantly different (p < 0.05) according to Tukey’s test
Previous findings showed syneresis reduced with fiber content [8]. In here, 0.5% peel powder added sample showed
the lowest syneresis followed by 0.7% and 1% (Table 5). At high concentrations, peel powders may be disrupting the
yogurt structure, hence increase the syneresis. However, syneresis of peel powder added samples were less than control
(T1). This may be due to the better Water Holding Capacity of peel powders. Yet, syneresis values of fiber added yogurt
samples are higher than full fat (3.3%) yogurts.
Dias et al. / GSC Biological and Pharmaceutical Sciences, 2020, 11(01), 093–099
98
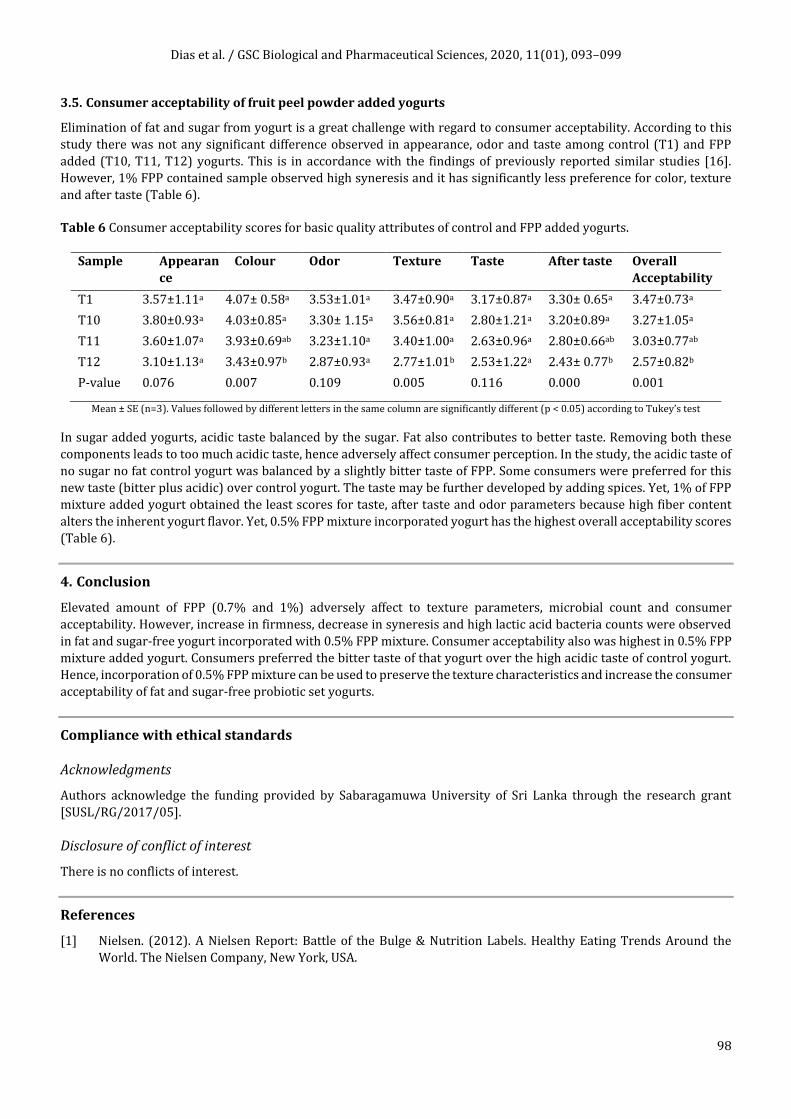
3.5. Consumer acceptability of fruit peel powder added yogurts
Elimination of fat and sugar from yogurt is a great challenge with regard to consumer acceptability. According to this
study there was not any significant difference observed in appearance, odor and taste among control (T1) and FPP
added (T10, T11, T12) yogurts. This is in accordance with the findings of previously reported similar studies [16].
However, 1% FPP contained sample observed high syneresis and it has significantly less preference for color, texture
and after taste (Table 6).
Table 6 Consumer acceptability scores for basic quality attributes of control and FPP added yogurts.
Sample Appearan
ce
Colour Odor Texture Taste After taste Overall
Acceptability
T1 3.57±1.11a 4.07± 0.58a 3.53±1.01a 3.47±0.90a 3.17±0.87a 3.30± 0.65a 3.47±0.73a
T10 3.80±0.93a 4.03±0.85a 3.30± 1.15a 3.56±0.81a 2.80±1.21a 3.20±0.89a 3.27±1.05a
T11 3.60±1.07a 3.93±0.69ab 3.23±1.10a 3.40±1.00a 2.63±0.96a 2.80±0.66ab 3.03±0.77ab
T12 3.10±1.13a 3.43±0.97b 2.87±0.93a 2.77±1.01b 2.53±1.22a 2.43± 0.77b 2.57±0.82b
P-value 0.076 0.007 0.109 0.005 0.116 0.000 0.001
Mean ± SE (n=3). Values followed by different letters in the same column are significantly different (p < 0.05) according to Tukey’s test
In sugar added yogurts, acidic taste balanced by the sugar. Fat also contributes to better taste. Removing both these
components leads to too much acidic taste, hence adversely affect consumer perception. In the study, the acidic taste of
no sugar no fat control yogurt was balanced by a slightly bitter taste of FPP. Some consumers were preferred for this
new taste (bitter plus acidic) over control yogurt. The taste may be further developed by adding spices. Yet, 1% of FPP
mixture added yogurt obtained the least scores for taste, after taste and odor parameters because high fiber content
alters the inherent yogurt flavor. Yet, 0.5% FPP mixture incorporated yogurt has the highest overall acceptability scores
(Table 6).
4. Conclusion
Elevated amount of FPP (0.7% and 1%) adversely affect to texture parameters, microbial count and consumer
acceptability. However, increase in firmness, decrease in syneresis and high lactic acid bacteria counts were observed
in fat and sugar-free yogurt incorporated with 0.5% FPP mixture. Consumer acceptability also was highest in 0.5% FPP
mixture added yogurt. Consumers preferred the bitter taste of that yogurt over the high acidic taste of control yogurt.
Hence, incorporation of 0.5% FPP mixture can be used to preserve the texture characteristics and increase the consumer
acceptability of fat and sugar-free probiotic set yogurts.
Compliance with ethical standards
Acknowledgments
Authors acknowledge the funding provided by Sabaragamuwa University of Sri Lanka through the research grant
[SUSL/RG/2017/05].
Disclosure of conflict of interest
There is no conflicts of interest.
References
[1] Nielsen. (2012). A Nielsen Report: Battle of the Bulge & Nutrition Labels. Healthy Eating Trends Around the
World. The Nielsen Company, New York, USA.
Dias et al. / GSC Biological and Pharmaceutical Sciences, 2020, 11(01), 093–099
99
[2] Espirito Santo AP, Perego P, Converti A and Oliveira MN. (2012). Influence of milk type and addition of passion
fruit peel powder on fermentation kinetics, texture profile and bacterial viability in probiotic yogurts. LWT-
Food Science and Technology, 47(2), 393–399.
[3] Perina NP, Granato D, Hirota C, Cruz AG, Bogsan CSB and Oliveira MN. de. (2015). Effect of vegetal-oil emulsion
and passion fruit peel-powder on sensory acceptance of functional yogurt. Food Research International, 70,
134–141.
[4] Dias PGI, Sajiwanie JWA and Rathnayaka RMUSK. (2020a). A Study on Fruit Wastage in Mass Scale Fruit
Processing Industries in Sri Lanka and their Potential to Reuse. Food Science and Nutrition Research, 3(1), 1-6.
[5] AOAC and Horwitz W. (1995). Official methods of analysis of the association of official analytical chemists. AOAC
International, Arlington VA.
[6] Ozcan T and Kurtuldu O. (2014). Influence of dietary fiber addition on the properties of probiotic yogurt.
International Journal of Chemical Engineering and Applications, 5(5), 397.
[7] Harwalkar VR and Kalab M. (1983). Comparison of centrifugation and drainage methods. Milchwissenschaft,
38(9), 518-522.
[8] Mohamed AG, Zayan A F and Shahein NM. (2014). Physiochemical and sensory evaluation of yogurt fortified with
dietary fiber and phenolic compounds. Life Science Journal, 11, 816–822.
[9] Lario, E Sendra, C Garcia-Perez, E Fuentes, J Sayas-Barbera, J Fernandez-Lopez and JA Perez Alvarez. (2004).
Preparation of high dietary fiber powder from lemon juice by-products., Innov Food Sci Emerg, 5, 113-117.
[10] Dias PGI, Sajiwanie JWA and Rathnayaka RMUSK. (2020b). Chemical Composition, Physicochemical and
Technological Properties of Selected Fruit Peels as a Potential Food Source. International Journal of Fruit Science,
1-12.
[11] Garcia‐Perez FJ, Lario Y, Fernandez‐Lopez J, Sayas E, Perez‐Alvarez JA and Sendra E. (2005). Effect of orange fiber
addition on yogurt color during fermentation and cold storage. Colour Research & Application: Endorsed
by Inter‐Society Colour Council, The Colour Group (Great Britain), Canadian Society for Colour, Colour Science
Association of Japan, Dutch Society for the Study of Colour, The Swedish Colour Centre Foundation,
Colour Society of Australia, Centre Francais de la Couleur, 30(6), 457-463.
[12] Sanz T, Salvador A, Jimenez A and Fiszman SM. (2008). Yogurt enrichment with functional asparagus fiber. Effect
of fiber extraction method on rheological properties, color, and sensory acceptance. European Food
Research and Technology, 227(5), 1515–1521.
[13] Castro WF, Cruz AG, Bisinotto MS, Guerreiro LMR, Faria JAF, Bolini HMA and Deliza R. (2013). Development of
probiotic dairy beverages: Rheological properties and application of mathematical models in sensory
evaluation. Journal of Dairy Science, 96(1), 16–25.
[14] Castro WF, Cruz AG, Rodrigues D, Ghiselli G, Oliveira CAF, Faria JAF and Godoy HT. (2013). Effects of different
whey concentrations on physicochemical characteristics and viable counts of starter bacteria in dairy
beverage supplemented with probiotics. Journal of Dairy Science, 96(1), 96–100.
[15] Guggisberg D, Cuthbert-Steven J, Piccinali P, Butikofer U and Eberhard P. (2009). Rheological, microstructural
and sensory characterization of low-fat and whole milk set yogurt as influenced by inulin addition.
International Dairy Journal, 19(2), 107–115.
[16] Fernandez-Garcia E and McGregor JU. (1997). Fortification of sweetened plain yogurt with insoluble dietary
fibre. Zeitschrift Für Lebensmitteluntersuchung Und-Forschung A, 204(6), 433–437.
How to cite this article
Dias PGI, Sajiwanie JWA and Rathnayaka RMUSK. (2020). Formulation and development of composite fruit peel powder
incorporated fat and sugar-free probiotic set yogurt. GSC Biological and Pharmaceutical Sciences, 11(1), 93-99.
Top Related