


Languages
Pages
Legal


.
POWER GENERATION
RETAIL
+
+
Total installed power generation capacity of 39,674MW
Forayed into the power distribution business through its subsidiary NESCL
6 coal mining blocks awarded directly to NTPC by GOI
Power Generation
Power Distribution
Coal Mining & Exploration
NTPC Vidyut Vyapar Nigam Ltd.’ (NVVN) is the 2nd largest power trading company in India
Power Trading
NTPC has formed JVs with BHEL and Bharat Forge Ltd.
Equipment Manufacturing
+
+
+
+
Initiating Coverage Report NTPC Ltd- “Size matters” Recommendation- “STRONG BUY” Target Price- INR 182
Research Analyst: Anik Das Email- [email protected]

- 2 -
Microsec Research
18th April 2013
Table of Contents
Topic Page Number Investment Highlights ……………………………………………………………………………….. 03-03 Investment Rationale ……………………………………………………………………………….. 04-10 Operational Metrics……………………………………………………………………………….. 11-12 Summary of Reforms ……………………………………………………………………………….. 13-13 Financial Outlook ……………………………………………………………………………….. 14-15 Demand Dynamics ……………………………………………………………………………….. 16-16 Company Profile……………………………………………………………………………….. 17-17 Peer Comparison ……………………………………………………………………………….. 18-18 Stock at deep discount ……………………………………………………………………………….. 19-19 Valuation ……………………………………………………………………………….. 20-20 Financial ……………………………………………………………………………….. 21-24 Disclaimer ……………………………………………………………………………….. 24-27

- 3 -
Microsec Research
18th April 2013
Investment Highlights
Key Financials Highlights (Figure in INR CR)
STRONG BUY
NTPC Ltd
Sector – Power
Source: Company, Microsec Research
NTPC, a government-owned enterprise (Government of India’s stake at 75%), is India’s largest power generator, with operational thermal capacity of 39.7GW. It is responsible for 17.75% of the national capacity and contributes to 27.40% of all power generation. NTPC is planning to commission 14GW of projects under the 12th Plan vs. 9.7GW added under the 11th Plan. NTPC is one of the safest bets in the power utility space given the company’s dominant position in electricity generation, better fuel supply arrangements (FSAs) and robust power purchase agreements (PPAs).We expect it to add 14GW of capacity - an average of 3.3GW/year v/s historic average of 1.5-2GW/year. Unlike the past, we believe execution issues will no longer hinder the stock performance. The current market price is not taking cognizance of the growth in capacity and regulated nature of the business. We are initiating coverage on the stock with a “STRONG BUY” rating and a target price of INR 182. Capacity addition pace to dramatically improve over FY12-17E-Unlike under the 10th and 11th five year plans (FYP), when NTPC missed its capacity-addition targets by 2.2GW and 12.8GW, respectively, for the 12th FYP, its capacity addition target of 14GW appears achievable, as capacity additions are front-end loaded. For FY13 NTPC plans capacity addition of 4.2GW, of which 2.7GW is already commissioned in YTDFY13 - its highest capacity addition in a year. Over FY13-17, we expect it to add 14GW of capacity - an average of 3.3GW/year v/s historic average of 1.5-2GW/year. This provides strong revenue visibility for NTPC over the next three years, making it better placed than other developers. Better fuel sourcing ahead-NTPC has assured coal linkages for 90% of installed capacity and it is partly better placed to address incremental fuel requirement given captive mines. It is in a comfortable position when it comes to coal imports given its PPA structure, which allows fuel cost pass-through. We remain upbeat on fuel supply security. In addition to its existing captive blocks, the Ministry of Coal (MoC) has given in-principle approval for allocation of new blocks to feed its upcoming capacity of 8.5GW. Scalable and de-risked business model-The Company is a regulated utility with CERC determined tariffs allowing it to recover a return of 15.5% on a pre-tax basis as per the tariff guidelines, public sector players were exempted from competitive bidding till Jan 2011. NTPC has signed PPAs with states for 37GW of fresh capacity before the expiry of the deadline. This ensures that the company is exempted from competitive bidding for 11th FYP plan (14GW) and a better part of 12th FYP plan as well. Hence, NTPC will remain a pure-play regulated model during 12th and possibly 13th plan without the risks of competitive bidding. SEBs’ Default- No Risk for NTPC- NTPC has a strong payment escrow security mechanism. In case of non-payment of receivables from the SEBs after 90 d ays grace period, NTPC can directly recover the dues from Central Government grants to the respective states. NTPC realized 100% payment of bills from the customers for 9th successive year.
Particulars FY10 FY11 FY12 FY13E FY14E FY15ENet Sales 48221.9 58,360 61,969 66,117 73,390 81,463 Growth (%) 10.3% 21.0% 6.2% 6.7% 11.0% 11.0%EBITDA 14319.7 15,796 13,897 16,579 18,399 20,413 EBITDA Margin (%) 29.7% 27.1% 22.4% 25.1% 25.1% 25.1%Net Profit 8835.24 9,103 9,224 10,690 11,607 12,764 Growth (%) 7.7% 3.0% 1.3% 15.9% 8.6% 10.0%Net Profit Margin (%) 18.3% 15.6% 14.9% 16.2% 15.8% 15.7%Diluted EPS (INR) 10.7 11.0 11.2 13.0 14.1 15.5P/E 19.32 17.48 14.48 11.25 10.36 9.43 BVPS 75.72 82.34 88.89 97.36 106.59 116.85 P/BV 2.73 2.34 1.82 1.50 1.37 1.25 EV/EBITDA 14.92 13.17 13.93 11.15 10.27 9.49 ROE % 14.15 13.41 12.58 13.32 13.21 13.25
Current Market Price (INR) 145.9052 Week High / Low(INR) 174/138Target Price (INR) 182.35Upside 25.0%Market Cap (In INR Cr) 120,301
Market Data
020406080
100120140
18
-Ap
r-1
2
18
-Ma
y-1
2
18
-Ju
n-1
2
18
-Ju
l-1
2
18
-Au
g-1
2
18
-Se
p-1
2
18
-Oc
t-1
2
18
-No
v-1
2
18
-De
c-1
2
18
-Ja
n-1
3
18
-Fe
b-1
3
18
-Ma
r-1
3
18
-Ap
r-1
3
NTPC SENSEX

- 4 -
Microsec Research
18th April 2013
-10
0
10
20
30
40
50
60FY
198
4FY
198
5FY
198
6FY
198
7FY
198
8FY
198
9FY
199
0FY
199
1FY
199
2FY
199
3FY
199
4FY
199
5FY
199
6FY
199
7FY
199
8FY
199
9FY
200
0FY
200
1FY
200
2FY
200
3FY
200
4FY
200
5FY
200
6FY
200
7FY
200
8FY
200
9FY
201
0FY
201
1FY
201
2FY
201
3EFY
201
4EFY
201
5EFY
201
6EFY
201
7E
Capacity addition to accelerate (GW)
Capacity Addition (GW) Net Addition (GW)
Investment Rationale
Capacity addition pace to dramatically improve over FY12-17E
Capacity addition over the 11th plan averaged 1.4GW/year, slower than expected, mainly impacted by contractual issues and infrastructure bottlenecks. Nevertheless, we expect NTPC to commission 3.3GW annually over FY13-17E, a significant jump over the 11th plan run rate, supported by faster execution and prior period slippages. During 9MFY13, 2.7 GW went commercial (standalone). We believe NTPC could achieve guidance of 3.3 GW for the full year, probably its best performance ever.
Projects under construction; fueling growth
CAGR Of 8%
Projects FuelCapacity (MW)
Expected Commissioning Technology Land
Environmental Clearance
Forest Clearance NTPC/JV
Koldam Hydro 800 FY14 - Yes Yes Yes NTPCBarh I Coal 1980 FY15,FY16 Super-Critical Yes Yes Yes NTPCTapavan Vishnugad Hydro 520 FY15 - Yes Yes Yes NTPCMouda I Coal 500 FY13 Sub Critical Yes Yes Yes NTPCBongaigaon Coal 750 FY14, FY15 Sub Critical Yes Yes Yes NTPCBarh II Coal 1320 FY14, FY15 Super-Critical Yes Yes Yes NTPCRihand III Coal 500 FY14 Sub Critical Yes Yes Yes NTPCVidhyachal IV Coal 500 FY13 Sub Critical Yes Yes Yes NTPCSingruali Hydro Hydro 8 FY14 - Yes Yes Yes NTPCSolapur Coal 1320 FY17+ Super-Critical Yes Yes Yes NTPCMouda II Coal 1320 FY17+ Super-Critical Yes Yes Yes NTPCVidhyachal V Coal 500 FY16 Sub Critical Yes Yes Yes NTPCKudgi Coal 2400 FY16,FY17 Super-Critical Yes Yes Yes NTPCAndaman Solar PV Solar 5 FY13 - Yes Yes Yes NTPCDadri Solar PV Solar 5 FY13 - Yes Yes Yes NTPCLara Coal 1600 FY17+ Super-Critical Yes Yes Yes NTPCLata Tapovan Hydro 171 FY17+ - Yes Yes Yes Sub(NHL)Vallur Coal 1000 FY13,FY14 Sub Critical Yes Yes Yes JVNabinagar Coal 1000 FY15,FY16 Sub Critical Yes Yes Yes JVKanti Coal 390 FY15 Sub Critical Yes Yes Yes SubMeja Coal 1320 FY17+ Super-Critical Yes Yes Yes JV
Source: Company, Microsec Research

- 5 -
Microsec Research
18th April 2013
Source: Company, Microsec Research
Unlike under the 10th and 11th five year plans (FYP), when NTPC missed its capacity-addition targets by 2.2GW and 12.8GW, respectively, for the 12th FYP, its capacity addition target of 14GW appears achievable, as capacity additions are front-end loaded.
Particulars Capacity CommentsFY13E Capacity (incl JV) 41,174 Current capacity including JVsUnder Construction 16,600 Includes 4.8GW for 13th Plan
Under bidding 10,0006.6GW under bulk tender + 3.1GW of other projects
Total 67,774Feasibility report approved, PPA signed 26,500Total 94,274
Well placed to attain 100GW+ capacity
NTPC plans to achieve capacity addition of
14GW, in line with the Central Electricity Authority's (CEA) estimate. Of this, 13.2GW is expected over FY13-16, an average capacity addition of 3.3GW/year. This compares with an average of 1.5GW/ year over FY82-07, which moved up to 2GW in 11th Plan.
6.8GW of bulk tender projects are likely to be
awarded soon, taking the capacity under construction for the 13th Plan to 12GW. An additional 3GW of projects is under bidding. This provides strong visibility in capacity addition growth for NTPC over the next decade, making it better placed than other developers.
NTPC remains well funded for execution of the
current expansion plans. NTPC offers better growth option in the generation space. Even assuming a recovery in the sector, a new project could take 5 years for commissioning - a period of growth holiday for several developers, while NTPC would continue to witness linear growth.

- 6 -
Microsec Research
18th April 2013
Better fuel sourcing ahead
Fuel supply was severely impacted in FY11/12 on flat production by Coal India. In YTDFY13, Coal India's production grew 7.2% YoY and dispatches to the Power sector improved 11% YoY.Despite the concerns, NTPC has not been facing any significant shortfall in supply from Coal India, except at Farakka and Kahalgaon. Regarding progress on the transport of coal to Farakka through inland waterways, orders have been placed by operator Jindal ITF for procurement of shore cranes and construction of ten new barges. The contracts for transhipper, coal conveyor and jetty have been awarded. Under the 12th Plan, NTPC plans to attain 90% PAF for its existing/upcoming projects through a mix of linkages, captive mine production (37m tons by FY17, beginning from 3m tons in FY14) and 20-25m tons of imports (40-45m tons of domestic coal equivalent). Given that NTPC's PPA structure allows fuel cost as pass-through and the progress on its captive coal block, we remain upbeat on fuel supply security. In addition to its existing captive blocks, the Ministry of Coal (MoC) has given in-principle approval for allocation of new blocks to feed its upcoming capacity of 8.5GW.
80% of NTPC’s capacity are pit-head plants have no logistic challenges
-3-2-101234567
0
150
300
450
600
FY 1
995
FY 1
996
FY 1
997
FY 1
998
FY 1
999
FY 2
000
FY 2
001
FY 2
002
FY 2
003
FY 2
004
FY 2
005
FY 2
006
FY 2
007
FY 2
008
FY 2
009
FY 2
010
FY 2
011
FY 2
012
FY 2
013
FY 2
014
FY 2
015
FY 2
016
FY 2
017
Flat domestic coal production in FY11/12 , improvement likely in FY13-17
M ton Growth %
CAGR of 5% According to Coal India management, the company plans to liquidate inventory up to 25mt, and it could sell more to NTPC. Selling additional coal to private IPPs could attract allegations of corruption. In addition, most of NTPCs plants (80% of its capacity) are pit-head-based, which will be the key beneficiaries of the inventory liquidation.
Source: Company, Microsec Research
Coal India’s target of lowering inventory may benefit NTPC as 80% of capacity is pithead based and has no logistics challenge

- 7 -
Microsec Research
18th April 2013
Coal, 78%
Gas/Liquid Fuel, 10%
Hydro, 3%
Others, 9%
Fuel Mix
Source: Company, Microsec Research
The deficit in domestic coal is likely to increase in the next 2 to 3 years but return to current levels by FY17. Usage of inland waterways to transport imported coal—reduction of dependence on railways. NTPC plans to tide over this gap through long-term Fuel Supply Agreements (‘FSAs’) with existing suppliers as well as
through coal production from the 6 coal blocks allocated by the Government. Commencement of production in FY14 from captive coal blocks to support PLFs of existing capacities till supply levels
from Coal India improve and new capacities based on these captive blocks are brought on-stream.
Long-term Coal Supply Agreements (CSAs) with Coal India Limited (CIL) and Singareni Collieries Company (SCCL) for 24GW out of 30GW of stand-alone capacity.CSA provides for periodic review in respect of Annual Contracted Quantities (“ACQ”).
10 out of 16 coal plants (accounting for 77% of directly
owned coal-fire capacity) within 80 km of coal mines with own merry go round rail system/belt conveyor system and supplies for the other 6 plants transported through national railway system.
Developing 6 coal blocks allotted directly to NTPC.
Imported coal accounted for 8.5% of total coal
received in FY12; Pricing linked to global indices

- 8 -
Microsec Research
18th April 2013
Long-term gas supply agreements with GAIL under APM for supply of gas to all directly owned gas power stations at regulated pricing under Government orders.
Domestic natural gas (KG-D6) supply agreements on a long-term basis at prices approved by GoI for four plants.
All owned gas plants strategically located along major gas pipelines.
Source: Company, Microsec Research

- 9 -
Microsec Research
18th April 2013
Scalable and de-risked business model The company is a regulated utility with CERC determined tariffs allowing it to recover a return of 15.5% on a pre-tax basis. As per the tariff guidelines, public sector players were exempted from competitive bidding till Jan 2011. NTPC has signed PPAs with states for 37GW of fresh capacity before the expiry of the deadline. This ensures that the company is exempted from competitive bidding for 12th plan (14GW) and a better part of 13th plan as well. Hence, NTPC will remain a pure-play regulated model during 12th and possibly 13th plan without the risks of competitive bidding. According to CERC‘s tariff guidelines for generators during 2009-14, the company‘s base rate for RoE is 15.5%, which is grossed up for the corporate tax rate. Since the company operates under the cost-plus model, its fuel costs are passed through to the customers, thereby insulating it from the fuel price risks affecting other IPPs.
PAF is a key ROE driver
Recovery of its fixed charge and incentives are based on PAF (every 1ppt higher than normative availability of 85% will allow the company to earn an incentive of 0.6% of annual fixed charge). The higher capacity charge can be treated as an incentive and results in an improvement in its realised RoEs. For instance, all else remaining the same, every 1ppt higher PAF translates to 0.5% additional ROE.
Source: Company, Microsec Research

- 10 -
Microsec Research
18th April 2013
NTPC has the least risky business model in comparison with IPP peers
Regulated Case I/II bid Merchant TotalMineLinkage 59% 9% 6,237 MWImported 27% 6% 3,003 MWOtherTotal 7,944 MW 1,296 MW 9,240 MW
Regulated Case I/II bid Merchant TotalMine 12.00% 12.0% 1,320 MWLinkage 6.40% 32% 3.6% 2,330MWImportedOther 2.70% 150 MWHydro 27.30% 3.60% 1700 MWTotal 2510 MW 1782 MW 1208 MW 5500 MW
Regulated Case I/II bid Merchant TotalMineLinkage 21.10% 1823 MWImported 18.30% 46% 5580 MWOther (furnace oil/ fuel gas) 0.20% 0.90% 1.60% 241 MWOthers - hydro and renewable 11.50% 988 MWTotal 4,411 MW 4081 MW 140 MW 8623 MW
Regulated Case I/II bid Merchant TotalMine 45% 55% 1080 MWLinkageImported 53% 47% 2060 MWOther (furnace oil/ fuel gas)Others - hydro and renewableTotal 1650 MW 1490 MW 3140 MW
Regulated Case I/II bid Merchant TotalMine 6.40% 2,658 MWLinkage 68.00% 28,357 MWImported 12.90% 5,390 MWOther 12.70% 5,275 MWTotal ( Including JVs) 41,680 MW 41,680 MW
Biggest overhang remains its high spot imported coal exposure for operational projects.
JSW EnergyOff-Take Comments
Fuel
sour
ces
Off-Take
Fuel
sour
ces
CommentsOnly 30% of the total portfolio of 9,240 MW has partial pass through of fuel costs making the business model highly risky
Adani Power
Jaiprakash Power
Fuel
sour
ces
Off-Take Comments
45% of its total capacity is regulated while 33% has fuel pass through
Tata Power
Fuel
sour
ces
Off-Take Comments
Except for the Mundra UMPP (4,000 MW), the remaining assets have low risk
NTPC
Fuel
sour
ces
Off-Take Comments
Entire capacity is based on regulated returns with various fuel sources
Source: Company, Microsec Research

- 11 -
Microsec Research
18th April 2013
80
82
84
86
88
90
92
94
96
FY08 FY09 FY10 FY11 FY12 FY13e FY14e FY15e
Yearly Plant Avalability Factor (%)
Coal based Gas based
0
20
40
60
80
100
FY07 FY08 FY09 FY10 FY11 FY12
Yearly PLF (%)
Coal based Gas based
0
20
40
60
80
100
1996-97 2001-02 2006-07 2011-12
Comparison between NTPC and All India PAF and PLF
NTPC AVF % NTPC PLF % All-India PLF %
Operational Metrics
NTPC has consistently reported availability of approximately 88-92% against normative norms of 85%. NTPC’s PLF (plant loading factor) and PAF (plant availability factor) are highest among the operational power plants in the country. This has enabled NTPC to earn better returns than allowed by regulator. For NTPC, the outlook on efficiency income for its newly commissioned plants has deteriorated on availability concerns - we are of the opinion that current stock price is factoring in the worse.
0102030405060708090
100
Q3
FY0
9
Q4
FY0
9
Q1
FY1
0
Q2
FY1
0
Q3
FY1
0
Q4
FY1
0
Q1
FY1
1
Q2
FY1
1
Q3
FY1
1
Q4
FY1
1
Q1
FY1
2
Q2
FY1
2
Q3
FY1
2
Q4
FY1
2
Q1
FY1
3
Q2
FY1
3
Q3
FY1
3
Thermal PLF % Gas PLF %
-4
-2
0
2
4
6
8
10
0
10
20
30
40
50
60
Q3 FY10
Q4 FY10
Q1 FY11
Q2 FY11
Q3 FY11
Q4 FY11
Q1 FY12
Q2 FY12
Q3 FY12
Q4 FY12
Q1 FY13
Q2 FY13
Q3 FY13
Coal-based project generation growth for NTPC
Coal Generation (Bus) Growth %
0
1
2
3
4
5
6
7
8
Q3 FY10
Q4 FY10
Q1 FY11
Q2 FY11
Q3 FY11
Q4 FY11
Q1 FY12
Q2 FY12
Q3 FY12
Q4 FY12
Q1 FY13
Q2 FY13
Q3 FY13
Gas Generation (Bus)
PLF in FY11 and FY12 has declined mainly due to back downs by SEBs
Source: Company, Microsec Research

- 12 -
Microsec Research
18th April 2013
Regulatory assets provide earnings stability – NTPC operates in a regulated environment, which makes its earnings steady and secure. We believe the company’s growth will be sustained led by its regulated business model and reasonable growth in capacity addition. Existing as well as assets under construction for NTPC will operate on a regulated basis for a foreseeable future. NTPC remains on firm footing with 107GW of regulated PPA in hand.
High Collection Efficiency
Payment Security Mechanisms- Tripartite Agreements between Government, RBI and
each state in terms of the Scheme for One Time Settlement of SEB dues valid till October 31, 2016.
Recourse to Reserve Bank of India (RBI) in case of default in making payment.
Source: Company, Microsec Research

- 13 -
Microsec Research
18th April 2013
Summary of Reforms- (Indian Power Sector)
Source: Company, Microsec Research

- 14 -
Microsec Research
18th April 2013
Financial Outlook
NTPC’s revenues are expected to grow at a CAGR of 10.5% to INR 815 Bn in FY13 driven primarily by capacity addition of 3.3GW annually over FY13-17E, a significant jump over the XI plan run rate. While capacity is expected to be added at 7% CAGR, power generation is expected to increase at 272 BU by FY15.
Source: Company, Microsec Research

- 15 -
Microsec Research
18th April 2013
NTPC’s dividend payout has moved in a tight band of 33%-35% of adjusted PAT since its IPO in November 2004. Our earnings expectations have limited risk, given we have factored no upside to 14 GW addition. Also, apart from being broadly on track in achieving commissioning targets for FY13E, its focus on maintaining healthy PAFs at the firm level is also bearing fruit. There has been discussion surrounding potential change in dividend payout policy and if that materialize than we could expect a higher payout ratio.
Source: Company, Microsec Research

- 16 -
Microsec Research
18th April 2013
Demand dynamics
The country’s power deficit since FY11 has been stagnant at 8-9% despite enormous capacity addition. This factor is partly due to the muted PLFs of the plants (led by decrease in generation for gas, hydro and nuclear) and partly due to latent power demand in the country. While it is difficult to give an exact number for the latent demand, the power cuts lasting 2-4 hours in A Tier cities and more in lower-tier cities are an indication. Another indicator is India’s per capita power consumption which is one of the lowest among emerging markets.
Power demand in India has been growing at 9-10% despite a slowdown in GDP growth from 8.5% in FY11 to 5.4% in 1HFY13. Higher power demand growth shows the pent-up demand in the system which is supported by an uptrend in the electrification rate of villages in the country.
Power deficit scenario has sustained despite capacity addition - 8.5% energy deficit in FY12 (79BU) and 11.1% peak deficit in FY12 (14GW).
Notwithstanding sustained demand, India continues to be among the lowest per capita consumers of electricity globally, lagging Brazil and China by 3:1.
106GW of capacity addition required (from current 200GW) to meet 8% GDP growth rate target.
Source: Company, Microsec Research

- 17 -
Microsec Research
18th April 2013
Company Profile
NTPC was set up in 1975 and is emerging as a diversified power major with presence in the entire value chain of the power generation business. Apart from power generation, NTPC has already ventured into consultancy, power trading, ash utilisation and coal mining. In coal mining business, production is expected by 2013 in Pakri Barwadih coal block. Five more blocks (40MTPA) have been allotted to NTPC, including two in JV with CIL. Historically, coal-based capacity has been the mainstay of power generation (contributing nearly 82% of installed capacity). Further, NTPC has also ventured into various other businesses in the power sector value chain such as power trading, equipment manufacturing, coal mining and project consultancy. NTPC is governed by the CERC regulations which mandate a 15.5% RoE for power projects (additional 0.5% is provided if the project is completed on time). All the costs such as fuel, interest and depreciation can be passed through in the tariffs (after CERC approval), thus insulating the profitability of the company from any cost variation. The regulation also provides for efficiency incentives if the power plant operates at parameters over those specified as normative in the regulations. In Oct 2004, NTPC launched its initial public offering (IPO) consisting of 5.25% as fresh issue and 5.25% as offer for sale by Government of India. NTPC thus became a listed company in Nov 2004 with the Government holding 89.5% of the equity share capital. Government further reduced its stake to 75% with an OFS. NTPC has acquired assets from SEBs and has turned around each of them using its management skills.
Business Profile Key Milestones
- 18 -
Microsec Research
18th April 2013
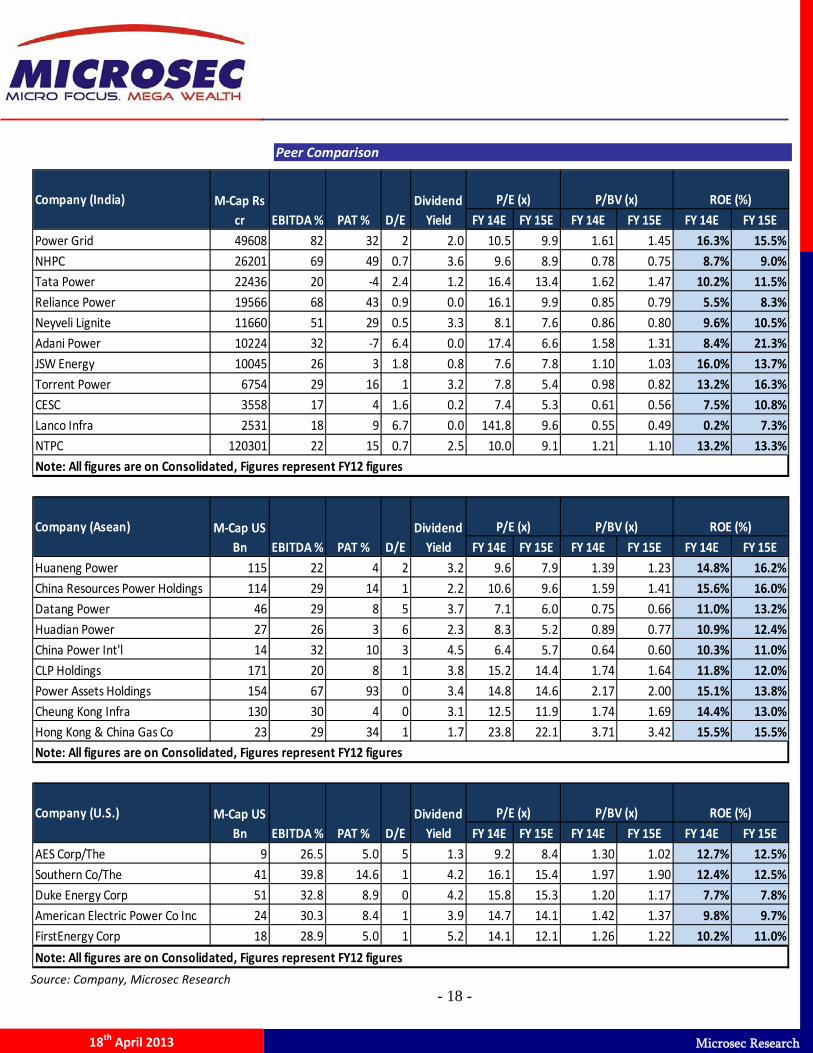
Peer Comparison
FY 14E FY 15E FY 14E FY 15E FY 14E FY 15EPower Grid 49608 82 32 2 2.0 10.5 9.9 1.61 1.45 16.3% 15.5%NHPC 26201 69 49 0.7 3.6 9.6 8.9 0.78 0.75 8.7% 9.0%Tata Power 22436 20 -4 2.4 1.2 16.4 13.4 1.62 1.47 10.2% 11.5%Reliance Power 19566 68 43 0.9 0.0 16.1 9.9 0.85 0.79 5.5% 8.3%Neyveli Lignite 11660 51 29 0.5 3.3 8.1 7.6 0.86 0.80 9.6% 10.5%Adani Power 10224 32 -7 6.4 0.0 17.4 6.6 1.58 1.31 8.4% 21.3%JSW Energy 10045 26 3 1.8 0.8 7.6 7.8 1.10 1.03 16.0% 13.7%Torrent Power 6754 29 16 1 3.2 7.8 5.4 0.98 0.82 13.2% 16.3%CESC 3558 17 4 1.6 0.2 7.4 5.3 0.61 0.56 7.5% 10.8%Lanco Infra 2531 18 9 6.7 0.0 141.8 9.6 0.55 0.49 0.2% 7.3%NTPC 120301 22 15 0.7 2.5 10.0 9.1 1.21 1.10 13.2% 13.3%Note: All figures are on Consolidated, Figures represent FY12 figures
FY 14E FY 15E FY 14E FY 15E FY 14E FY 15EHuaneng Power 115 22 4 2 3.2 9.6 7.9 1.39 1.23 14.8% 16.2%China Resources Power Holdings 114 29 14 1 2.2 10.6 9.6 1.59 1.41 15.6% 16.0%Datang Power 46 29 8 5 3.7 7.1 6.0 0.75 0.66 11.0% 13.2%Huadian Power 27 26 3 6 2.3 8.3 5.2 0.89 0.77 10.9% 12.4%China Power Int'l 14 32 10 3 4.5 6.4 5.7 0.64 0.60 10.3% 11.0%CLP Holdings 171 20 8 1 3.8 15.2 14.4 1.74 1.64 11.8% 12.0%Power Assets Holdings 154 67 93 0 3.4 14.8 14.6 2.17 2.00 15.1% 13.8%Cheung Kong Infra 130 30 4 0 3.1 12.5 11.9 1.74 1.69 14.4% 13.0%Hong Kong & China Gas Co 23 29 34 1 1.7 23.8 22.1 3.71 3.42 15.5% 15.5%
FY 14E FY 15E FY 14E FY 15E FY 14E FY 15EAES Corp/The 9 26.5 5.0 5 1.3 9.2 8.4 1.30 1.02 12.7% 12.5%Southern Co/The 41 39.8 14.6 1 4.2 16.1 15.4 1.97 1.90 12.4% 12.5%Duke Energy Corp 51 32.8 8.9 0 4.2 15.8 15.3 1.20 1.17 7.7% 7.8%American Electric Power Co Inc 24 30.3 8.4 1 3.9 14.7 14.1 1.42 1.37 9.8% 9.7%FirstEnergy Corp 18 28.9 5.0 1 5.2 14.1 12.1 1.26 1.22 10.2% 11.0%
Note: All figures are on Consolidated, Figures represent FY12 figures
Dividend Yield
Dividend Yield
EBITDA % PAT %M-Cap US
Bn
Company (India) M-Cap Rs cr EBITDA % PAT %
P/BV (x)
ROE (%)
P/E (x) P/BV (x) ROE (%)
PAT %
D/E
Dividend Yield
Note: All figures are on Consolidated, Figures represent FY12 figures
P/E (x)
ROE (%)Company (Asean) M-Cap US Bn EBITDA %
D/E
D/E
P/BV (x)Company (U.S.)
P/E (x)
Source: Company, Microsec Research

- 19 -
Microsec Research
18th April 2013
Stock at a deep discount to historical average
NTPC’s valuations are at the lowest levels since listing.The stock has underperformed the broader market over the past one year, mainly due to (1) lower PAFs given lower coal imports and (2) overhang of the government mandated divestment (usually priced at a discount to market price). It trades cheaper than many regional peers despite better RoEs and growth. For 13% overall ROE, 3.2% dividend yield and 8% net worth CAGR over FY12-15E,the stock trades at 1.3x FY14E P/B. We believe it should trade at a premium to over-leveraged IPPs.
Source: Company, Microsec Research

- 20 -
Microsec Research
18th April 2013
Valuation & View
We prefer NTPC over other IPPs over the longer term due to (a) a scalable and de-risked business model, (b) a strong balance sheet and (c) maintenance of thermal availability through fuel imports in the near term and coal mining in the longer term. NTPC offers better growth option than any other listed player in an uncertain macro scenario. 16GW of capacity is under construction, while an additional 10GW is under tendering stage. This provides visibility even beyond the 12th Plan period compared to growth holidays for many IPPs that are unable to take up new projects, given stretched balance sheets, issues with existing projects. At the CMP of INR 145 per share, NTPC is quoting at 1.37x and 1.25x its FY14E and FY15E price to book value (P/B), respectively. We have used the discounted cash flow (DCF) method to value NTPC. We have assigned a WACC of 9.12% and assumed a terminal growth rate of 2.8%. Our DCF based price target is INR182 which shows an upside potential of 25% from the current market price of INR 145. Hence we recommend a “STRONG BUY” for the stock from long term perspective.
Key Risks
Unforeseen disruptions in coal mining at owned blocks- Coal India plans to supply only 80% of LOA to NTPC’s plants which were commissioned after FY09, leaving NTPC to source the remaining coal from imported sources or its own mines. Thus, any delay in coal mining could supress PAF for NTPC’s plants. Slower than expected capacity additions- Delays in capacity commissioning are not new to NTPC. Continued delays could limit its earnings growth. SEB’s lower drawl to affect incentive income- Apart from fixed ROEs, NTPC earns incentive income under the UI and heat-rate incentive schemes. Such incentive income can get affected by lower demand for power from SEB.
- 21 -
Microsec Research
18th April 2013
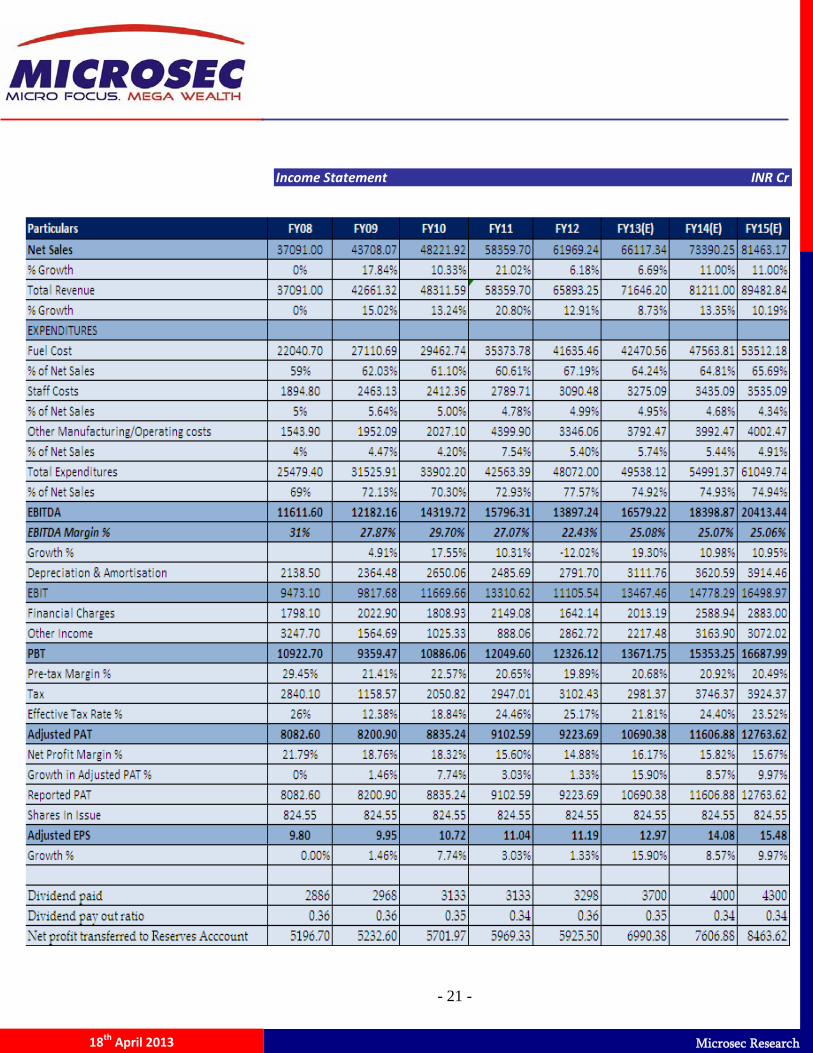
Income Statement INR Cr

- 22 -
Microsec Research
18th April 2013
Balance Sheet INR Cr
Income Statement
- 23 -
Microsec Research
18th April 2013
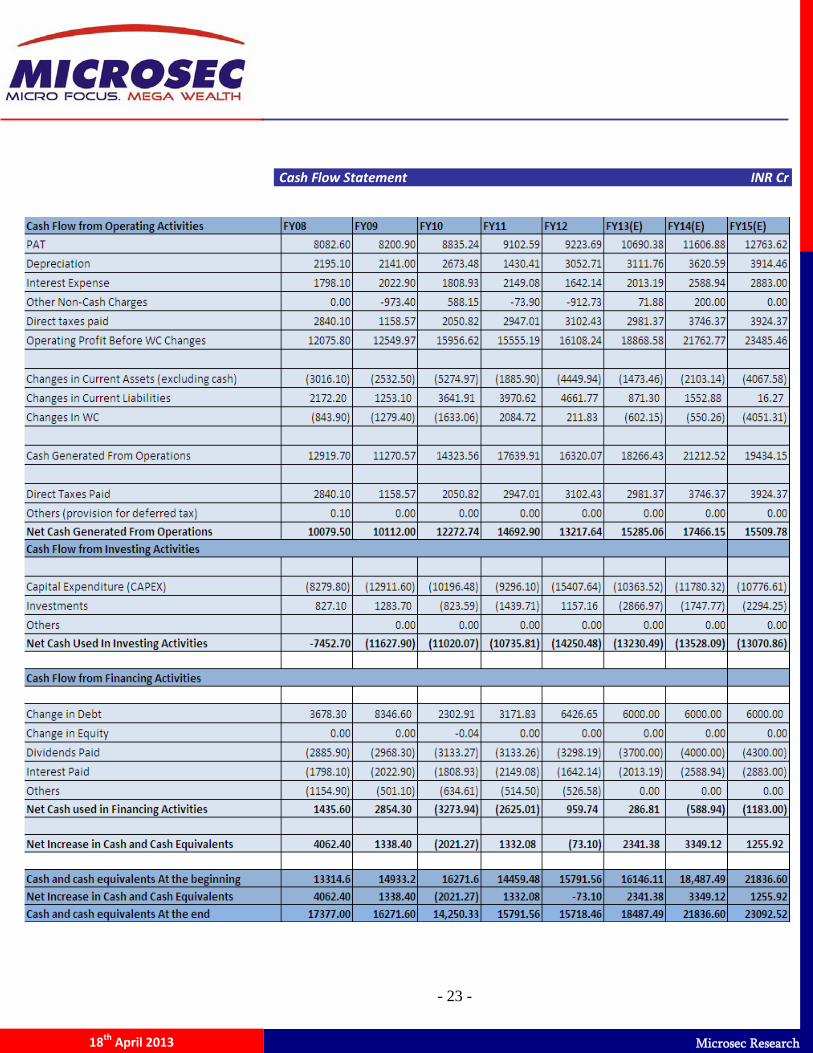
Cash Flow Statement INR Cr

- 24 -
Microsec Research
18th April 2013
Financial Ratios
- 25 -
Microsec Research
18th April 2013
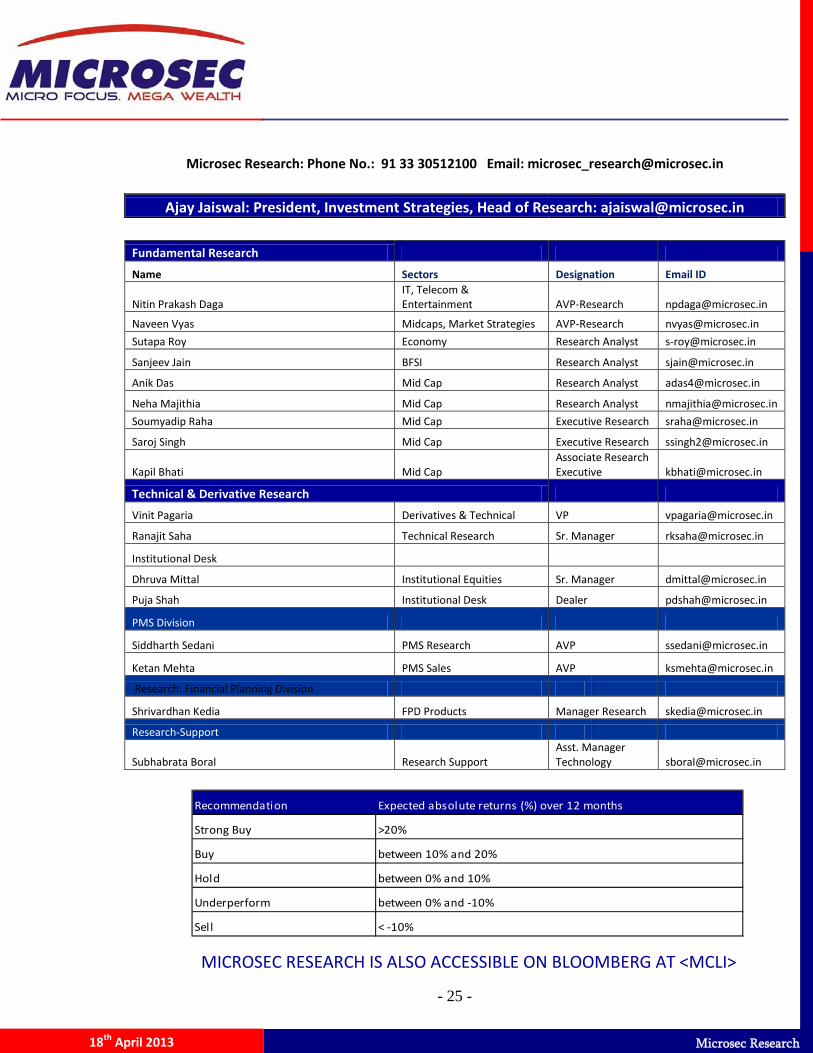
Microsec Research: Phone No.: 91 33 30512100 Email: [email protected]
Ajay Jaiswal: President, Investment Strategies, Head of Research: [email protected]
Fundamental Research
Name Sectors Designation Email ID
Nitin Prakash Daga IT, Telecom & Entertainment AVP-Research [email protected]
Naveen Vyas Midcaps, Market Strategies AVP-Research [email protected]
Sutapa Roy Economy Research Analyst [email protected]
Sanjeev Jain BFSI Research Analyst [email protected]
Anik Das Mid Cap Research Analyst [email protected]
Neha Majithia Mid Cap Research Analyst [email protected]
Soumyadip Raha Mid Cap Executive Research [email protected]
Saroj Singh Mid Cap Executive Research [email protected]
Kapil Bhati Mid Cap Associate Research Executive [email protected]
Technical & Derivative Research
Vinit Pagaria Derivatives & Technical VP [email protected]
Ranajit Saha Technical Research Sr. Manager [email protected]
Institutional Desk
Dhruva Mittal Institutional Equities Sr. Manager [email protected]
Puja Shah Institutional Desk Dealer [email protected]
PMS Division
Siddharth Sedani PMS Research AVP [email protected]
Ketan Mehta PMS Sales AVP [email protected]
Research: Financial Planning Division
Shrivardhan Kedia FPD Products Manager Research [email protected]
Research-Support
Subhabrata Boral Research Support Asst. Manager Technology [email protected]
Recommendation
Strong Buy >20%
Buy between 10% and 20%
Hold between 0% and 10%
Underperform between 0% and -10%
Sell < -10%
Expected absolute returns (%) over 12 months
MICROSEC RESEARCH IS ALSO ACCESSIBLE ON BLOOMBERG AT <MCLI>

- 26 -
Microsec Research
18th April 2013

- 27 -
Microsec Research
18th April 2013
Top Related