


Languages
Pages
Legal


The preparation of the Financial Stability Review (FSR) is one of the avenues
through which Bank Indonesia achieves its mission “to safeguard the stability of the Indonesian
Rupiah by maintaining monetary and financial system stability for sustainable national
economic development”.
Publisher:
Bank Indonesia
Information and Orders:
This edition is published in March 2012 and is based on data and information available as of September 2011,unless stated otherwise.
Source: Bank Indonesia, unless stated otherwise.
The PDF format is downloadable from: http://www.bi.go.id
For inquiries, comments and feedback please contact:
Bank Indonesia
Department of Banking Research and Regulation
Financial System Stability Group
Jl.MH Thamrin No.2, Jakarta, Indonesia
Phone: (+62-21) 381 8902, 381 8075
Fax: (+62-21) 351 8629
Email: [email protected]
FSR is published biannually with the objectives:
To improve public insight in terms of understanding financial system stability.
To evaluate potential risks to financial system stability.
To analyze the developments of and issues within the financial system.
To offer policy recommendations to promote and maintain financial system stability.

Financial Stability Review
( No. 18, March 2012)
Directorate of Banking Research and Regulation
Financial System Stability Bureau

ii
iii
Table of Contents ......................................................................................................................................... ........... iii
Foreword .............. .................................................................................................................................................... vii
Overview ......... ......................................................................................................................................................... 3
Chapter 1. External and Internal Conditions .............................................................................................................. 5
1.1. Potential External Vulnerabilities ............................................................................................................... 7
1.2. Potential Internal Vulnerabilities ................................................................................................................ 8
Box 1.1. Household Behaviour ......................................................................................................................... 14
Chapter 2. Financial System Resilience ....................................................................................................................... 17
2.1. Structure and Resilience of the Financial System ....................................................................................... 19
2.2. Risk in the Banking System ....................................................................................................................... 20
2.3. Potential Financial Market Risk and Financing Risk .................................................................................... 29
Box 2.1 An Upgraded Sovereign Rating and Financial System Stability ............................................................. 38
Chapter 3. Challenges and Prospects of Financial System Stability .............................................................................. 41
3.1. Threat of Global Economic Slowdown on Indonesian Economy ................................................................ 43
3.2. Impact on the Indonesian Financial System ............................................................................................... 47
3.3. Impact on the Banking Sector .................................................................................................................. 48
3.4. The Outlook of the Financial System Stability ............................................................................................ 49
Chapter 4. Topical Issues............................................................................................................................................ 51
4.1. Stress Testing the Impact of International Trade and Foreign Loans of the Corporation on Banks ................. 53
4.2. Strengthening Bank Capital as Part of the Efforts to Maintain Financial System Stability ........................... 56
4.3. Broadening Public Access to Financial Services through Bank Network Expansion ..................................... 58
4.4. European Crisis ........................................................................................................................................ 63
Article ................ ...................................................................................................................................................... 67
Article 1 External Shocks, Macroeconomic Stability, and Monetary Regimes in the Small-open New Keynesian
Model of the Indonesian Economy .................................................................................................... 69
Article 2 Macroprudential and Microprudential Surveillance and Policies .......................................................... 79
Article 3 Determinants of the Household Liquidity Requirement in Indonesia: an Empirical Study with
Data from the Household Balance Sheet Survey ................................................................................ 95
Table of Contents

iv
1.1 Total Indonesian Exports and Imports .............. 71.2 International Commodity Prices (USD) ............. 71.3 Transition in the Share of Indonesia Exports ... 81.4 Confidence Index ........................................... 81.5 Inflation in several ASEAN Countries .............. 81.6 Composition of Direct Investment and Portfolio Investment to Indonesia ................... 91.7 Indonesia Balance of Payments ....................... 91.8 Rupiah Exchange Rate .................................... 91.9 Rupiah Exchange Rate Volatility ...................... 101.10 ROA and ROE of Non-Financial Public Listed Companies ..................................................... 111.11 DER and TL/TA of Non-Financial Public Listed Companies ..................................................... 111.12 Key Corporate Financial Indicators .................. 111.13 Credit and NPL to the Household Sector ......... 121.14 Composition of Credit to the Household Sector by Type (per December 2011) .............. 131.15 Performance of Credit to the Household Sector by Type ............................................... 131.16 NPL in Household Sector by Type ................... 13Figure Box 1.1.1 Composition of Total Household Spending 2009-2011 ..................................... 14Figure Box 1.1.2 Changes in Price (ytd) ..................... 14Figure Box 1.1.3 Sources of Household Debt ............. 15Figure Box 1.1.4 Composition of Household Assets ... 16
2.1 Asset Composition of Financial Institutions ..... 192.2 Financial Stability Index 1996-2011 ................ 202.3 Share of Bank Funding and Financing ............. 202.4 Growth in Deposits by Semester ..................... 202.5 Deposit Growth based on Ownership ............. 212.6 Composition of Bank Liquid Assets ................. 212.7 Share of Bank Placements at Bank Indonesia .. 212.8 Share of Liquid Assets .................................... 222.9 Credit Growth by Currency ............................ 222.10 Credit Funding by Currency ............................ 222.11 Credit Growth by Type ................................... 232.12 Credit Growth by Economic Sector ................. 232.13 Growth and Share of Property Credit ............. 232.14 Non-Performing Loans (NPL) ........................... 232.15 NPL Growth by Currency ................................ 242.16 NPL Ratio by Currency .................................... 24
List of Tables and Figures
Figures
1.1 Government Foreign Debt .............................. 101.2 Government Debt Service Ratio ...................... 101.3 Probability of Default using the Contingent Claims Analysis Method ................................. 12
2.1 Number of Financial Institutions ..................... 212.2 Liquid Assets Growth ..................................... 212.3 Profit/Loss of Banking Industry ....................... 262.4 Profitability and Credit by Bank Group ........... 262.5 Performance of the Prime Lending Rate ............ 282.6 SBN Ownership .............................................. 322.7 Financing sourced from Credit, Shares and Bonds ............................................................ 342.8 Financial Indicators of Finance Companies ...... 362.9 NPL by Type of Finance .................................. 362.10 Insurance Company Investment ...................... 37
3.1 Global Economic Growth Projections .............. 443.2 Simulation of Easing Fuel Subsidies ................ 463.3 Projected GDP and Inflation ........................... 463.4 Stock Exchange Correlations .......................... 48
4.1 Summary of Results for Stress Test 1: Impact on Bank Liquidity ................................ 554.2 Summary of Results for Stress Test 2: Impact on Bank CAR and NPL ........................ 554.3 A Capital Comparison between Prevailing Regulations and the Requirements according to Basel III ...................................................... 574.4 Adoption of Financial Services ........................ 584.5 Access to Financial Services ............................ 59
Tables
v
2.17 NPL Growth by Credit Type ............................ 242.18 NPL Ratio by Credit Type ................................ 252.19 NPL Ratio by Economic Sector ........................ 252.20 NPL Ratio of Property Credit ........................... 252.21 Composition of Bank Profit/Loss ..................... 262.22 Composition of Interest Income for the Banking Industry (%) ...................................... 272.23 Rupiah Interest Rate Spread (%) ..................... 272.24 Bank ROA and BOPO (%) ............................... 272.25 Capital, the Minimum Statutory Reserve and Bank CAR ...................................................... 282.26 CAR by Bank Group (%) ................................ 282.27 MSM Credit Growth (yoy) .............................. 292.28 Non-Performing MSM Bank Loans (%) ........... 292.29 A Map of Financial System Stability ................ 302.30 Non-resident Flows of Shares, Government
Securities (SBN) and Bank Indonesia Certificates (SBI) ............................................. 302.31 SBN Prices by Tenor ........................................ 312.32 FR Benchmark Series SBN Prices ..................... 312.33 SBN VaR by Tenor .......................................... 312.34 SBN Price Volatility ......................................... 312.35 SBN Maturity Profile ....................................... 322.36 The JSX Composite and other Global Price Indices ............................................................ 322.37 The JSX Composite by Sector ......................... 322.38 Share Prices in the Banking Sector .................. 332.39 Stock Market Volatility in the Region .............. 332.40 Volatility on Regional Bourse .......................... 332.41 Mutual Fund by Type ..................................... 332.42 Issuers and Stock Issuances ............................ 342.43 Issuers and Corporate Bond Issuances ............ 342.44 Finance Company Performance ...................... 352.45 Share of Finance Company Financing ............. 352.46 Sources of Funds for Finance Companies ........ 352.47 Market Share of 11 Insurance Companies ...... 38Figure Box 2.1.1 Share of Foreign Ownership in January
2012 .............................................................. 39Figure Box 2.1.2 Inflows of Foreign Ownership to the
Indonesian Financial Market ........................... 393.1 Flows of Private Direct Investment (Net) .......... 443.2 Flows of Private Portfolio Investment (Net) ...... 44
3.3 Composition of Foreign Capital Inflows to Indonesia ....................................................... 453.4 Composition of Foreign Capital Inflows to Indonesia ....................................................... 453.5 Ratio of Credit to GDP in Indonesia, Malaysia, the Philippines and Thailand ............................ 463.6 Long-Term Trend of Credit to GDP ................. 463.7 SUN Price Volatility ......................................... 473.8 Performance of the JSX Composite and other Global-Regional Indices .................................. 473.9 Projected Credit Growth ................................ 493.10 Projected Growth in Deposits (% yoy) ............ 503.11 Financial Stability Index .................................. 50
4.1 Average projected Contraction on European Banks’ Balance Sheets .................... 644.1 European Bank Lending to Emerging Economies (in trillions of US$) ........................ 64
Figures Figures

vi
List of Abbreviations
ADB Asian Development BankAPBN Anggaran Pendapatan dan Belanja NegaraAS Amerika SerikatASEAN Association of Southeast Asian NationsATMR Aktiva Tertimbang Menurut RisikoBapepam- LK Badan Pengawas Pasar Modal dan Lembaga
KeuanganBCBS Basel Committee on Banking SupervisoryBIS Bank for International SettlementBNM Bank Negara MalaysiaBOPO Rasio Biaya Operasional terhadap
Pendapatan OperasionalBPD Bank Pembangunan DaerahBPR Bank Perkreditan RakyatBPRS Bank Perkreditan Rakyat Syariahbps basis pointBRC BPD Regional ChampionBRIC Brazil, Rusia, India, dan ChinaBUS Bank Umum SyariahCAR Capital Adequacy RatioCC Code of ConductCCP Central Counter PartiesCDS Credit Default SwapCRA Credit Rating AgencyCRBC China Banking Regulations CommissionsDER Debt to Equity RatioDPK Dana Pihak KetigaDSM Direktorat Statistik Ekonomi dan MoneterEFSF European Financial Stability FacilityETF Exchange-Traded FundEU European UnionFASB Financial Accounting Standard BoardFDI Foreign Direct InvestmentFSA Financial Service AuthorityFSAP Financial Sector Assessment ProgramFSB Financial Supervisory BoardFSI Financial Stability IndexG20 The Group of TwentyGDP Gross Domestic ProductGIM Gerakan Indonesia MenabungG-SIFI Global Systemically Important Financial
InstitutionsGWM Giro Wajib MinimumIAIS International Association of Insurance
SupervisorIASB International Accounting Standard BoardIDMA Inter-dealer Market AssociationIHK Indeks Harga KonsumenIHSG Indeks Harga Saham Gabungan
IMF International Monetary FundIOSCO International Organization of Securities
CommissionsJCI Jakarta Composite IndexJPSK Jaring Pengaman Sistem KeuanganKCBA Kantor Cabang Bank AsingKI Kredit InvestasiKK Kredit KonsumsiKMK Kredit Modal KerjaKPR Kredit Pemilikan RumahLBU Laporan Bulanan Bank UmumLC Letter of CreditLDR Loan to Deposit RatioL/R Laba RugiMEA Masyarakat Ekonomi ASEANMKM Mikro, Kecil, dan MenengahNAB Nilai Aktiva BersihNII Net Interest IncomeNIM Net Interest MarginNPF Non Performing FinancingNPI Neraca Pembayaran IndonesiaNPL Non Performing LoanOPEC Organization of the Petroleum Exporting
CountriesOTC Over the CounterPD Probability of DefaultPDB Produk Domestik BrutoPDN Posisi Devisa NetoPIIGS Portugal, Ireland, Italy, Greece and SpainPLN Pinjaman Luar NegeriPMA Penanaman Modal AsingPMDN Penanaman Modal Dalam NegeriPMK Peraturan Menteri KeuanganPMK BI Protokol Manajemen Krisis Bank IndonesiaPNS Pegawai Negeri SipilPP Perusahaan PembiayaanRBB Rencana Bisnis BankROA Return on Asset ROE Return on EquitySBDK Suku Bunga Dasar KreditSBI Sertifikat Bank IndonesiaSBN Surat Berharga NegaraSIFI Systemically Important Financial InstitutionsSUN Surat Utang NegaraTKI Tenaga Kerja IndonesiaTL/TA Rasio total kewajiban terhadap total aset TPI Tim Pengendalian InflasiTPID Tim Pengendalian Inflasi DaerahUMP Upah Minimum Provinsi
List of Abbreviations
ADB Asian Development BankAEC Asean Economic CommunityASEAN Association of Southeast Asian NationsBapepam- LK Capital market and Financial Institution
Supervisory BoardBCBS Basel Committee on Banking Supervisory
BIS Bank for International SettlementBEI Indonesia Stock Exchange
BNM Bank Negara MalaysiaBPD Regional Banksbps basis pointsBRC BPD Regional ChampionBRIC Brazil, Rusia, India, dan ChinaCAR Capital Adequacy RatioCC Code of ConductCCP Central Counter PartiesCDS Credit Default SwapCPI Consumer Price IndexCRA Credit Rating AgencyCRBC China Banking Regulations CommissionsDER Debt to Equity RatioEFSF European Financial Stability FacilityETF Exchange-Traded FundEU European UnionFASB Financial Accounting Standard BoardFDI Foreign Direct InvestmentFSA Financial Service AuthorityFSAP Financial Sector Assessment ProgramFSB Financial Supervisory BoardFSI Financial Stability IndexG20 The Group of TwentyGDP Gross Domestic ProductGIM Indonesian Saving MovementG-SIFI Global Systemically Important Financial
InstitutionsIAIS International Association of Insurance
SupervisorIASB International Accounting Standard BoardIDMA Inter-dealer Market AssociationIMF International Monetary FundIOSCO International Organization of Securities
CommissionsIHSG/JSXComposite
Jakarta Stock Exchange Index
JPSK Financial System Safety NetLBU Commercial Bank ReportLC Letter of CreditLDR Loan to Deposit RatioMSM Micro Small and Medium Credit
NII Net Interest IncomeNIM Net Interest MarginNOP Net Open PositionNPF Non Performing FinancingNPL Non Performing LoanOPEC Organization of the Petroleum Exporting
CountriesOTC Over the CounterPBI Bank Indonesia RegulationPD Probability of DefaultPIIGS Portugal, Ireland, Italy, Greece and SpainPMK BI Bank Indonesia’s Crisis Management
Protocol
ROA Return on Asset PUAB Interbank Money Market
ROE Return on EquitySBI Bank Indonesia CertificatesSBN Government SecuritiesSIFI Systemically Important Financial Institutions
SUN Government BondsSSB Securities
TL/TA Total Loss to Total Asset RatioUS United States of America UU Act

vii
Bank Indonesia publishes this 18th Edition of the Financial Stability Review (FSR), March 2012, as a form of
accountability and transparency regarding the task and function of Bank Indonesia in terms of maintaining financial
system stability. The publication is expected to assist stakeholders, particularly financial market players and policymakers,
monitor risk in the financial system at an early stage, while simultaneously helping to mitigate the risk.
This edition of the FSR contains information on financial system stability in Indonesia during the second half of
2011 and how the domestic financial system flourished despite the financial crisis in Europe. Financial system stability
bolstered national economic performance, thus prompting several international rating agencies to upgrade Indonesia’s
sovereign rating to investment grade.
The global economic slowdown and uncertainty surrounding crisis resolution in Europe had the potential to escalate
risk in the banking sector. Notwithstanding, the impact on the banking industry in Indonesia remained relatively limited
due to low exports from Indonesia to Europe as well as low domestic bank exposure to Europe. Meanwhile, banking sector
performance was positive, as reflected by adequate capital and stable profitability. Likewise, the performance of finance
companies also improved dramatically on the back of solid credit growth and the downward interest rate trend.
Nevertheless, vigilance and caution are still required looking forward considering that the direction of the global
economy can change in an instant, thereby exacerbating pressures on financial system stability. The impact of deleveraging
in the European banking sector, the efficacy of risk management and the possibility of mounting volatility on the stock
and bond markets all require closer attention, in addition to debtor performance and potential credit risk as well as an
increase in the intermediation function in productive sectors.
God willing the publication of FSR will always provide useful information to Bank Indonesia’s stakeholders, in particular
that regarding the results of research and monitoring conducted at Bank Indonesia pertinent to financial system stability.
We remain open to comments, recommendations and criticisms from any party in order to improve future editions of
the Financial Stability Review.
Jakarta, March 2012
GOVERNOR OF BANK INDONESIA
Darmin Nasution
Foreword

This page intentionally blank

Overview
1
Overview

2
Overview
This page intentionally blank

Overview
3
Financial system resilience and stability were well
preserved in Semester II 2011 despite encountering
pressure in the middle of the semester. The financial
crisis in Europe continued to overshadow risk in Indonesia
and globally, however, domestic markets and financial
institutions successfully absorbed the risk emanating from
global and domestic shocks. The success of Indonesia in
terms of maintaining financial system stability was clearly
appreciated by a couple of rating agencies, namely Fitch
and Moody’s, who upgraded Indonesia’s sovereign rating
to investment grade. This upgrade will surely translate into
capital for Indonesia in the face of potential risk looking
ahead.
Externally, a slowdown in the global economy
and uncertainty surrounding crisis resolution in
Europe had the potential to amplify risk in the
banking sector. Europe slipping into a moderate recession
as a result of fiscal consolidation, bank deleveraging and
the sovereign debt crisis prompted the IMF and World Bank
to revise down their global economic growth projections
from 4% and 3.6% to 3.25% and 2.8% respectively. Such
conditions undermined global demand and precipitated
a decline in exports from developing countries, including
Indonesia. Notwithstanding, the impact on the domestic
banking industry was limited because Indonesian exports
and exposure to Europe were relatively small. Concerning
foreign capital inflows, investment portfolio to Indonesia
experienced a decline but Foreign Direct Investment (FDI)
surged in line with solid domestic economic prospects.
Domestically, real sector performance was
steady. Global economic shocks had no significant
impact on the corporate sector in Indonesia. The corporate
probability of default indeed increased compared to the
same position in the preceding year with profitability
placed under increasing pressure. Nonetheless, the level of
corporate debt also tended to decline; hence, as a whole,
risk in the corporate sector was well managed. Meanwhile,
public confidence in the economy and the downward
interest rate trend encouraged the household sector
to increase its level of debt and consumption. This was
demonstrated by robust credit growth to the household
sector for mortgages and automotive loans compared to
other types of loan. Although credit performed well in the
reporting period, concerns emerged over the rapid pace
of consumption loans, which has the potential to create
problems at a later date.
The domestic financial market responded well
to pressures in Semester II 2011, fully recovering by
the close of the year. Greater risk aversion from global
investors had an impact on the domestic financial market.
The price of government securities (SBN) experienced
a significant decline before rebounding and stabilising
with monetary operations that concomitantly maintained
stability on the rupiah interbank money market (PUAB).
On the capital market, the JSX Composite and net asset
value (NAV) of mutual funds came under pressure but
market confidence was fully restored by the end of the
year. Financing through the capital market, primarily
Bab 1 Overview
4
Overview
shares, slumped due to the wait-and-see attitude of
potential issuers.
The banking industry and finance companies
performed steadily. Bank capital remained at a level
considered adequate to absorb risk as the global crisis
unfolded. Profitability was stable supported by a decline
in the cost of loan loss provisions as well as a wider net
interest margin for the banks. Meanwhile, rupiah and
foreign exchange credit grew rapidly in nearly all economic
sectors. The performance of finance companies also
improved significantly, the majority of which stemmed
from consumer financing for the purchase of motor
vehicles. This was buttressed by solid credit performance
as well as the downward interest rate trend.
RISK OUTLOOK
The outlook for the financial system in Indonesia
up to Semester I 2012 is more stable compared to
Semester II 2011. If they materialise, the impact of oil
price hikes in semester I 2012 will be felt in the subsequent
semester, while foreign capital flows are expected to
stabilise thus alleviating volatility on the financial market. In
addition, measures to improve prudence are also expected
to ease bank credit risk.
Nevertheless, global economic and political dynamics,
which can change in the blink of an eye, demand greater
prudence. Consequently, the banking sector and financial
market players are expected to:
• Remain alert to the deleveraging process of banks in
Europe, which has the potential to undermine credit
lines as well as USD interbank lending.
• Conduct stress tests and review liquidity contingency
plans in order to mitigate liquidity risk, in particular
for banks that depend heavily on global wholesale
funding.
• Augment risk management and stay alert to the
possibility of mounting volatility on the stock and
bond markets.
• Monitor the performance of borrowers who depend
heavily on trade with countries that are currently
experiencing difficulties.
• Remain alert to the possibility of escalating
consumption credit risk in the household sector and
enhance the intermediation function in productive
sectors.
Caution is advised in terms of maintaining adequate
liquidity amid the apparent trend of slower growth in
deposits and accelerated credit growth.

5
Chapter 1. External and Internal Conditions
Chapter 1External and Internal Conditions

6
Chapter 1. External and Internal Conditions
This page intentionally blank

7
Chapter 1. External and Internal Conditions
1.1 POTENTIAL EXTERNAL VULNERABILITIES
Mounting risk from the crisis in Europe has left
future domestic economic growth uncertain. External
risk factors, such as the sovereign debt crisis in the euro zone
and economic slowdowns in developed countries, sparked
risk in the domestic economy. Recent developments in the
euro area have indicated signs of contagion to surrounding
and trade partner countries, primarily through banks and
the economy. Consequently, the IMF revised down its
global economic growth projection from 4% to 3.25%.
The economy of Indonesia responds to changes in external
conditions, therefore, domestic economic activity could
also have experienced a slight contraction.
The economic slowdown was also attributable
to specific problems affecting certain countries.
Japan, for instance, contracted from positive 4% growth
to minus 0.9%, principally as a result of the earthquake in
March 2011. The disaster destroyed physical infrastructure,
thereby disrupting production activity, knocked out
electricity supply from the stricken nuclear power plant
and undermined consumption. Brazil, which had posted
impressive 7.5% growth in 2010, only achieved 2.9% in
2011 due to an array of structural problems that forced
the adoption of a tight monetary policy stance, prudential
policy that curbed credit growth and fiscal policy that failed
to provide economic stimuli.
This turmoil, which shows no signs of abating,
persisted in the form of fiscal policy in the US, while Europe
consistently failed to agree how to overcome the fiscal and
financial problems in financial crisis struck PIIGS countries,
as well as the second bailout for Greece that has still not
been approved by the Greek Parliament. By yearend 2011
several rating agencies downgraded the sovereign ratings
of the US and nine European countries, which spurred
increasingly risk averse sentiment from global investors.
Chapter 1 External and Internal Conditions
Source: Indonesian Financial Statistics, Bank Indonesia
Source: Indonesian Financial Statistics, Bank Indonesia
Figure 1.1Total Indonesian Exports and Imports
Figure 1.2International Commodity Prices (USD)
Million USD
-
4.000
2.000
8.000
6.000
12.000
10.000
16.000
14.000
18.000
20.000
Total Export Total Import
Feb-
07A
pr-0
7Ju
n-07
Aug
-07
Oct
-07
Dec
-07
Feb-
08A
pr-0
8Ju
n-08
Aug
-08
Oct
-08
Dec
-08
Feb-
09A
pr-0
9Ju
n-09
Aug
-09
Oct
-09
Dec
-09
Feb-
10A
pr-1
0Ju
n-10
Aug
-10
Oct
-10
Dec
-10
Feb-
11A
pr-1
1Ju
n-11
Aug
-11
Oct
-11
Dec
-11
0
200
400
600
800
1000
1200
1400
Dec-
06M
ar-0
7Ju
n-07
Sep-
07De
c-07
Mar
-08
Jun-
08Se
p-08
Dec-
08M
ar-0
9Ju
n-09
Sep-
09De
c-09
Mar
-10
Jun-
10Se
p-10
Dec-
10M
ar-1
1Ju
n-11
Sep-
11De
c-11
0
50
100
150
200
250
Natural Gas Palm Oil Coal (right) Crude Oil (right)

8
Chapter 1. External and Internal Conditions
Source: Survey conducted by the Directorate of Economic and Monetary Statistics, Bank Indonesia
Source: Indonesian Financial Statistics, Bank Indonesia
Source: Bloomberg
6.10% posted in 2010, on the back of public confidence
and business player confidence. This was further
corroborated by the increase in the consumer confidence
index1 in December 2011, which peaked at its highest level
in three years, namely 116.6 (Figure 1.4).
Figure 1.5Inflation in several ASEAN Countries
Figure 1.4Confidence Index
Figure 1.3Transition in the Share of Indonesia Exports
0%
5%
10%
15%
20%
25%
Japan China India ASEAN US Europe Others
2000 2005 2011
Consumer Confidence IndexCurrent Economic Conditions IndexConsumer Expectations Index
(Index)140
130
120
110
100
90
80
70
60 1 2 3 4 5 6 7 8 9 10 11 12
2009
1 2 3 4 5 6 7 8 9 10 11 12
2010
1 2 3 4 5 6 7 8 9 10 11 12
2011
Average weightedfor 18 cities
-6
-2
-4
2
0
4
6
10
8
14
yoy (%)
12
Jan
- 07
Apr -
07
Jun
- 07
Oct -
07
Jan
- 08
Apr -
08
Jun
- 08
Oct -
08
Jan
- 09
Apr -
09
Jun
- 09
Oct -
09
Jan
- 10
Apr -
10
Jun
- 10
Oct -
10
Jan
- 11
Apr -
11
Jun
- 11
Oct -
11
Philippines Malaysia Thailand Indonesia
1 Based on the results of the 2011 BI Consumer Survey.
1.2 POTENTIAL INTERNAL VULNERABILITIES
1.2.1 Macroeconomic Conditions and the Real Sector
Although not as high as the preceding year, the
performance of exports from Indonesia remained
positive. Based on Bank Indonesia data, during Semester
II 2011 exports from Indonesia grew by 6%, totalling
USD 201.5 billion for the year, which is up by 27.5% on
the previous year. Imports in Semester II 2011 also grew
more slowly compared to the previous semester at 10%,
achieving USD 166.1 billion (fob) for the year, which is
an increase of 30% over the preceding year. The decline
in exports was chiefly due to a slump in the commodity
prices of mainstay exports from Indonesia like palm oil,
crude oil and coal.
Slower export growth has already begun to
affect Indonesia but on a relatively small scale. The
rise in imports exceeded the rise in exports, thereby eroding
the current account surplus at the end of Semester II 2011
compared to the previous semester (Figure 1.1 and Figure
1.2). Posting a surplus amid the recession in Europe was
possible by increasingly diversified export destinations from
Indonesia, with the current trend of favouring emerging
market countries (Figure 1.3).
Low inflation helped catalyse business activity. In
terms of prices, headline inflation in Semester II 2011
tended to ease well below the inflation target of 5%
±1. Headline inflation was 3.79% (yoy) at the end of
the semester (Figure). A downward inflation trend was
reported in many countries; however, Indonesia remained
as the country with the highest level of inflation in
ASEAN-5.
Solid international trade and strong domestic
consumption buoyed economic growth. Six point five
percentgrowth was achievedin 2011, which exceeded the

9
Chapter 1. External and Internal Conditions
in Indonesia increased on the previous year from 47% to
76%, while the portion of portfolio investment contracted
from 53% to 24% (Figure 1.6). The sectors that enjoyed
the most additional direct investment in Semester II 2011
were the manufacturing sector totalling USD 529 million,
real estate, leasing and business services with USD 369
million and the agricultural sector amounting to USD 92
million.
The balance of payments recorded a surplus of
US$11.9 billion overall for the year despite relatively
intense pressures in Semester II. Foreign exchange reserves
in Indonesia at the end of Semester II 2011 amounted to
USD 110.12 billion, which is equivalent to 6.4 months of
imports and government foreign debt repayments. This
figure is smaller than the position recorded at the end of
Semester I 2011, namely USD 119.7 billion but larger than
yearend 2010 at USD 96.2 billion.
Market risk had the potential to escalate due to
the weak rupiah coupled with mounting exchange rate
volatility. In harmony with the balance of payments, the
rupiah exchange rate depreciated by around 114 points
compared to the previous semester to a level of Rp8,825
per USD (Figure 1.8) at the end of 2011. Furthermore,
average exchange rate volatility was also more pronounced
compared to the previous semester, increasing from 0.18%
(Figure 1.9) to 0.25%.
1.2.2 Investment and the Balance of Payments
The impact of a decline in portfolio investment
growth on the financial market required close monitoring.
Investment flows into Indonesia in Semester II 2011 were
negative, indicating investment outflow totalling USD 5.4
billion. The torrent of investment outflow was due to risk
averse global investors appearing in the second half of
2011 following prolonged and widespread uncertainty
surrounding the fiscal problems in Greece and the languid
recovery in the US. Notwithstanding, overall in 2011
investment flowing into Indonesia remained positive
amounting to USD 14 billion; down 47.2% on the previous
year.
Source: Indonesian Financial Statistics, Bank Indonesia
Figure 1.6Composition of Direct Investment and Portfolio
Investment to Indonesia
Figure 1.7Indonesia Balance of Payments
0%
20%
30%
10%
40%
50%
70%
60%
90%
80%
2005 2006
Direct Investment Portfolio Investment
2007 2008 2009 2010 2011
-100%
-80%
-60%
-40%
-20%
0%
20%
40%
60%
80%
100%
Q1 Q2 Q3 Q4 Q1 Q2 Q3 Q4 Q1 Q2 Q3 Q4 Q1Q2 Q3 Q4 Q1 Q2 Q3 Q4 Q1*Q2*Q3*Q4*
2006 2007 2008 2009 2010 2011
-10000
-5000
0
5000
10000
15000
FDI PI Other Investment Financial Account
Direct investment is expected to drive economic
activity and the financial market. Based on share, the
share of direct investment (FDI) against total investment Source: Bloomberg, processed
Figure 1.8Rupiah Exchange Rate
0
2.000
4.000
6.000
8.000
10.000
12.000
14.000
0
2.000
4.000
6.000
8.000
10.000
12.000
14.000
1 2 3 4 5 6 7 8 9 10 11 12 1 2 3 4 5 6 7 8 9 10 11 12 1 2 3 4 5 6 7 8 9 10 11 12 1 2 3 4 5 6 7 8 9 10 11 12
2008 2009 2010 2011
Monthly Average Quarterly Average Semesterly Average

10
Chapter 1. External and Internal Conditions
The government debt to service ratio increased
slightly but the government implemented measures
to gradually reduce its debt while simultaneously
seeking low-risk sources of finance. Pressures from a
slowdown in exports also undermined the debt to service
ratio of Indonesia from 22.5% to 27.3% (Table 1.2). The
upgraded rating affirmed for Indonesia at the end of 2011
is expected to encourage the return of investment flows,
thereby meeting the domestic requirement for foreign
exchange. The ratio of debt to GDP dropped to 25% in
2011 and is scheduled to slide further to 22% in 2014.
Source: Bloomberg, processed
Source: Indonesian Financial Statistics, Bank Indonesia
Figure 1.9Rupiah Exchange Rate Volatility
1.2.3 Condition of the Public Sector
The budget deficit remained below the safe
threshold of 3% of GDP. The state budget (APBN) for
Semester II 2011 posted a deficit of Rp88.3 trillion (2.1%
of GDP), far below the target deficit of Rp150.8 trillion.
A reduction in the budget deficit was possible through
the higher-than-expected collection of non-tax revenues,
while central government spending in 2011 only reached
96.7% of the 2011 APBN-P.
The smaller deficit provided the government
leeway to reduce domestic and foreign debt, thereby
reinforcing fiscal posture in terms of stimulating
development. At the end of Quarter III 2011 government
foreign debt had reached USD 112.96 billion; equivalent
to Rp1,002 trillion at a rate of Rp8,875/1USD.
Amid ubiquitous uncertainty surrounding global
economic conditions, the government needs to create
- 1,5
- 1
- 0,5
0
0.5
1
1.5
Volatility
Lower Limit
1 31 61 91 121 151 181 211 241 271
Upper Limit Actual
253 days Period
Table 1.1Government Foreign Debt
Dec-09 Nov-11Jun-10 Dec-10 Jun-11
Central
Government 90.853 97.571 106.860 114.887 112.962
Monetary
Authority 8.412 8.126 11.764 13.222 10.272
Total 99.265 105.697 118.624 128.109 123.234
millions of USD
Table 1.2Government Debt Service Ratio
Q-I Q-I
2010 2011
Q-II Q-IIQ-III Q-IIIQ-IV Q-IV
Foreign Exchange Reserves 71.823 76.321 86.551 96.207 105.709 119.655 114.503 110.123
In months of imports and foreign
debt repayments 6,7 6,0 6,9 7,2 7,4 7,2 7,1 6,4
Debt Service Ratio (%) 21,2% 23,2% 20,3% 23,7% 18,0% 22,5% 21,2% 27,3%
a more enabling environment for domestic economic
growth, which can be achieved through greater
government spending, particularly that which enhances
the investment climate and boosts the income of the
general public.
11
Chapter 1. External and Internal Conditions
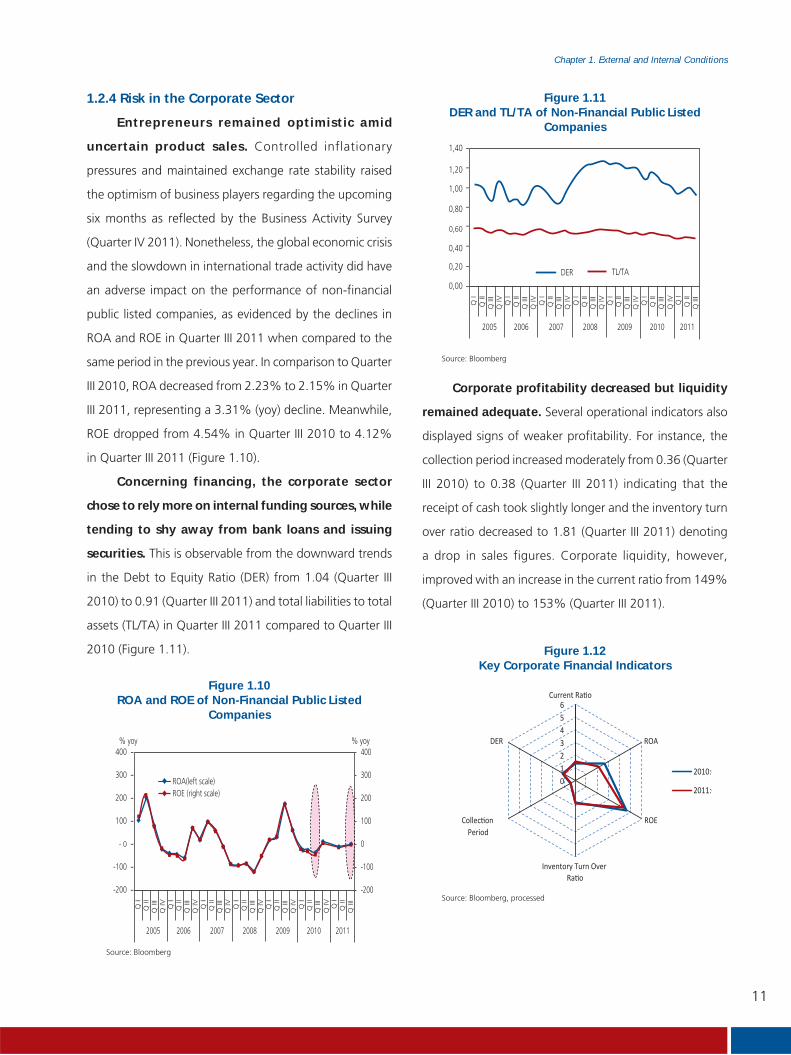
1.2.4 Risk in the Corporate Sector
Entrepreneurs remained optimistic amid
uncertain product sales. Controlled inflationary
pressures and maintained exchange rate stability raised
the optimism of business players regarding the upcoming
six months as reflected by the Business Activity Survey
(Quarter IV 2011). Nonetheless, the global economic crisis
and the slowdown in international trade activity did have
an adverse impact on the performance of non-financial
public listed companies, as evidenced by the declines in
ROA and ROE in Quarter III 2011 when compared to the
same period in the previous year. In comparison to Quarter
III 2010, ROA decreased from 2.23% to 2.15% in Quarter
III 2011, representing a 3.31% (yoy) decline. Meanwhile,
ROE dropped from 4.54% in Quarter III 2010 to 4.12%
in Quarter III 2011 (Figure 1.10).
Concerning financing, the corporate sector
chose to rely more on internal funding sources, while
tending to shy away from bank loans and issuing
securities. This is observable from the downward trends
in the Debt to Equity Ratio (DER) from 1.04 (Quarter III
2010) to 0.91 (Quarter III 2011) and total liabilities to total
assets (TL/TA) in Quarter III 2011 compared to Quarter III
2010 (Figure 1.11).
Corporate profitability decreased but liquidity
remained adequate. Several operational indicators also
displayed signs of weaker profitability. For instance, the
collection period increased moderately from 0.36 (Quarter
III 2010) to 0.38 (Quarter III 2011) indicating that the
receipt of cash took slightly longer and the inventory turn
over ratio decreased to 1.81 (Quarter III 2011) denoting
a drop in sales figures. Corporate liquidity, however,
improved with an increase in the current ratio from 149%
(Quarter III 2010) to 153% (Quarter III 2011).
Source: Bloomberg
Figure 1.10ROA and ROE of Non-Financial Public Listed
Companies
-200
-100
0
100
200
300
400
- 0
-200
-100
100
200
300
400
Q I
Q II
Q II
IQ
IV Q I
Q II
Q II
IQ
IV Q I
Q II
Q II
IQ
IV Q I
Q II
Q II
IQ
IV Q I
Q II
Q II
IQ
IV Q I
Q II
Q II
I
Q II
Q II
I
Q IV Q
I
2005 2006 2007 2008 2009 2010 2011
% yoy% yoy
ROA(left scale)ROE (right scale)
Source: Bloomberg
Figure 1.11DER and TL/TA of Non-Financial Public Listed
Companies
0,60
0,00
0,20
0,40
0,80
1,00
1,20
1,40
Q I
Q II
Q II
IQ
IV Q I
Q II
Q II
IQ
IV Q I
Q II
Q II
IQ
IV Q I
Q II
Q II
IQ
IV Q I
Q II
Q II
IQ
IV Q I
Q II
Q II
I
Q II
Q II
I
Q IV Q
I
2005 2006 2007 2008 2009 2010 2011
DER TL/TA
Figure 1.12Key Corporate Financial Indicators
0123456
ROA
ROE
Inventory Turn Over
DER
2010:Q
2011:Q
Source: Bloomberg, processed
12
Chapter 1. External and Internal Conditions
Looking ahead, the performance of the
corporate sector is expected to grow positively on
the back of robust purchasing power and strong
domestic demand. The most salient vulnerabilities
that require anticipatory measures from the corporate
sector are, among others, credit risk and exchange rate
risk. The expected probability of default in one year for
non-financial public listed companies in Quarter III 2011
was 2.44%,which is higher than that posted in the same
quarter of the previous year at 2.31% (Table 1.3).
The impact of global economic uncertainty on
international trade and corporate offshore loans on the
banking sector remained relatively insignificant (Box
1.1). However, close monitoring is required of corporate
vulnerability considering that conditions change in real
time and often without warning making them difficult
to predict.
1.2.5 Conditions in the Household Sector
Consumer optimism concerning current
economic conditions helped spur an increase in the
consumer confidence index. The Consumer Confidence
Index (CCI) followed an upward trend throughout Semester
II 2011, peaking at its highest point since 2009 and driven
by consumer optimism in current economic conditions. Up
until the time of writing, CCI had rallied by 2.6 points to
119.2 in January 2012.
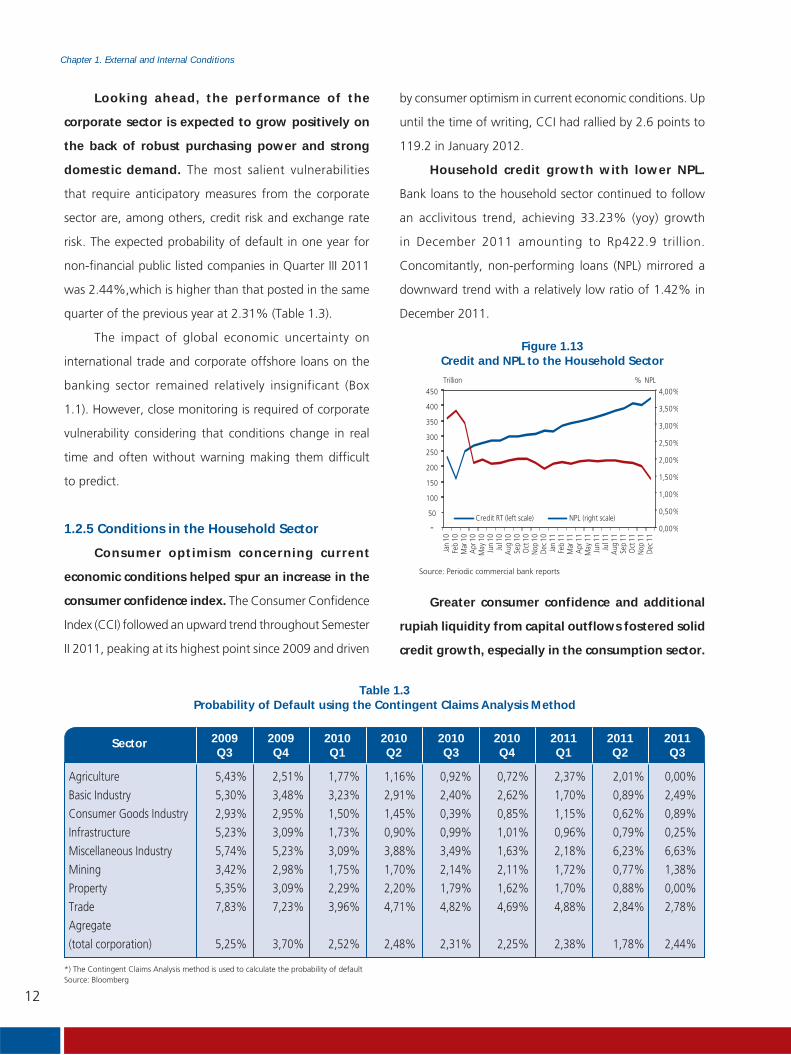
Household credit growth with lower NPL.
Bank loans to the household sector continued to follow
an acclivitous trend, achieving 33.23% (yoy) growth
in December 2011 amounting to Rp422.9 trillion.
Concomitantly, non-performing loans (NPL) mirrored a
downward trend with a relatively low ratio of 1.42% in
December 2011.
Table 1.3Probability of Default using the Contingent Claims Analysis Method
2009Q3
Sector 2009Q4
2010Q1
2011Q1
2010Q2
2011Q2
2010Q3
2011Q3
2010Q4
Agriculture 5,43% 2,51% 1,77% 1,16% 0,92% 0,72% 2,37% 2,01% 0,00%
Basic Industry 5,30% 3,48% 3,23% 2,91% 2,40% 2,62% 1,70% 0,89% 2,49%
Consumer Goods Industry 2,93% 2,95% 1,50% 1,45% 0,39% 0,85% 1,15% 0,62% 0,89%
Infrastructure 5,23% 3,09% 1,73% 0,90% 0,99% 1,01% 0,96% 0,79% 0,25%
Miscellaneous Industry 5,74% 5,23% 3,09% 3,88% 3,49% 1,63% 2,18% 6,23% 6,63%
Mining 3,42% 2,98% 1,75% 1,70% 2,14% 2,11% 1,72% 0,77% 1,38%
Property 5,35% 3,09% 2,29% 2,20% 1,79% 1,62% 1,70% 0,88% 0,00%
Trade 7,83% 7,23% 3,96% 4,71% 4,82% 4,69% 4,88% 2,84% 2,78%
Agregate
(total corporation) 5,25% 3,70% 2,52% 2,48% 2,31% 2,25% 2,38% 1,78% 2,44%
*) The Contingent Claims Analysis method is used to calculate the probability of defaultSource: Bloomberg
Source: Periodic commercial bank reports
Figure 1.13Credit and NPL to the Household Sector
0,00%
0,50%
1,00%
1,50%
2,00%
2,50%
3,00%
3,50%
4,00%
50
100
150
200
250
300
350
400
450
Jan
10Fe
b10
Mar
10A
pr10
May
10Ju
n10
Jul1
0A
ug10
Sep
10O
ct10
Nop
10De
c10
Jan
11Fe
b11
Mar
11A
pr11
May
11Ju
n11
Jul1
1A
ug11
Sep
11O
ct11
Nop
11De
c11
% NPLTrillion
Credit RT (left scale) NPL (right scale)
Greater consumer confidence and additional
rupiah liquidity from capital outflows fostered solid
credit growth, especially in the consumption sector.

13
Chapter 1. External and Internal Conditions
Based on type, most credit to the household sector
(46.68%) was in the form of mortgages, followed by
motor vehicle loans (24.99%), multipurpose loans (24.9%)
and others. The upward growth trend for mortgages and
motor vehicle loans outpaced that of bank loans in general.
Referring to the position in December 2011 for instance,
mortgages grew by 34% (yoy), while bank loans only
achieved 23% (yoy). In fact, motor vehicle loans grew by
an impressive 62.2% on the previous year. Although the
NPL ratio for mortgages and motor vehicle loans remained
relatively low, more specifically at 0.9% and 0.8%
respectively in December 2011, the current downward
interest rate trend together with more widespread public
optimism regarding economic conditions have led to
concerns over excessive public euphoria when applying
for consumption loans. This is possible due to pragmatic
bank behaviour in favouring the allocation of consumption
credit. Countercyclical measurement should be considered
to prevent this, which can curb excessively rapid growth
in mortgages and motor vehicle loans.
Source: Bloomberg, processed
Figure 1.14Composition of Credit to the Household Sector by
Type (per December 2011)
Housing46,68%
motor vehicle24,99%
household appliances0,58%
Multipurpose24,90%
Others2,86%
Source: Periodic commercial bank reports
Figure 1.15Performance of Credit to the Household Sector
by Type
-
50
100
150
200
250
Jan
10Fe
b10
Mar
10A
pr10
May
10Ju
n10
Jul1
0A
ug10
Sep
10O
ct10
Nop
10De
c10
Jan
11Fe
b11
Mar
11A
pr11
May
11Ju
n11
Jul1
1A
ug11
Sep
11O
ct11
Nop
11De
c11
Trillion Rupiah
Housing Motor vehicle Household appliances Multipurpose Others
Sumber: LBU
Grafik 1.16NPL in Household Sector by Type
10 10 10 10 10 10 10 10 10 10 10 10 11 11 11 11 11 11 11 11 11 11 11 11
Percent
0,0%
1,0%
2,0%
3,0%
4,0%
5,0%
6,0%
7,0%
8,0%
9,0%
Jan
Feb
Mar
Apr
May Jun Jul
Aug Se
pO
ctNo
pDe
cJa
nFe
bM
arA
prM
ay Jun Jul
Aug Se
pO
ctNo
pDe
c
Housing Motor vehicle Household appliances Multipurpose Others

14
Chapter 1. External and Internal Conditions
Household Behaviour
Since 2007, Bank Indonesia has routinely
conducted an annual survey of household balance
sheets (Survei NRT). The survey is performed because
economic dynamics and financial system stability in a
country are not merely influenced by macroeconomic
variables but also by specific household factors like
spending, debt and assets.
1. Spending
prices of basic necessities increased, households tended
to allocate spending to basic needs while reducing
spending on non-essential items2. Conversely, in the
event of lower prices the household sector tended to
spend more on non-essential items. This trend can
be observed from a couple of surveys conducted by
Bank Indonesia. In 2010 when food prices soared,
the portion of spending on staple foods increased
from 30% to 33% while non-essential consumption
declined.
In 2011, the share of spending allocated
to basic necessities, in particular food staples
and transportation, declined again. An increase
in spending on basic necessitieswas only reported for
clothing and fashion, as a result of a significant hike
in the price of clothing from 1.85% (2010) to 3.63%
(2011).
Figure Box 1.1.1Composition of Total Household Spending
2009-2011
Food
2009
Wealth accumulation
Transportation, vehiclemaintenance, fuelDebt repaymentsEducationOthers
Food
2010
Debt repayments
Transportation, vehiclemaintenance, fuelElectricity, water,communicationsEducationOthers
Food
2011
Debt repayments
EducationClothing and FashionElectricity, waterOthers
The household sector remained sufficiently
flexible in terms of adjusting its composition of
spending when faced with price hikes. When the
Figure Box 1.1.2 Changes in Price (ytd)
Source: Survey of Household Balance Sheets
Percent
-6,00
-4,00
-2,00
0,00
2,00
4,00
6,00
8,00
2009 2010 2011
Foodstuffs Processed foodsHouses, electricity, water, gas ClothingHealth Education and recreation
Transportation andcommunications
2 Basic Necessities: Clothing, food, housing, transportation, electricity and water. Everything else is considered a non-essential item.
15
Chapter 1. External and Internal Conditions
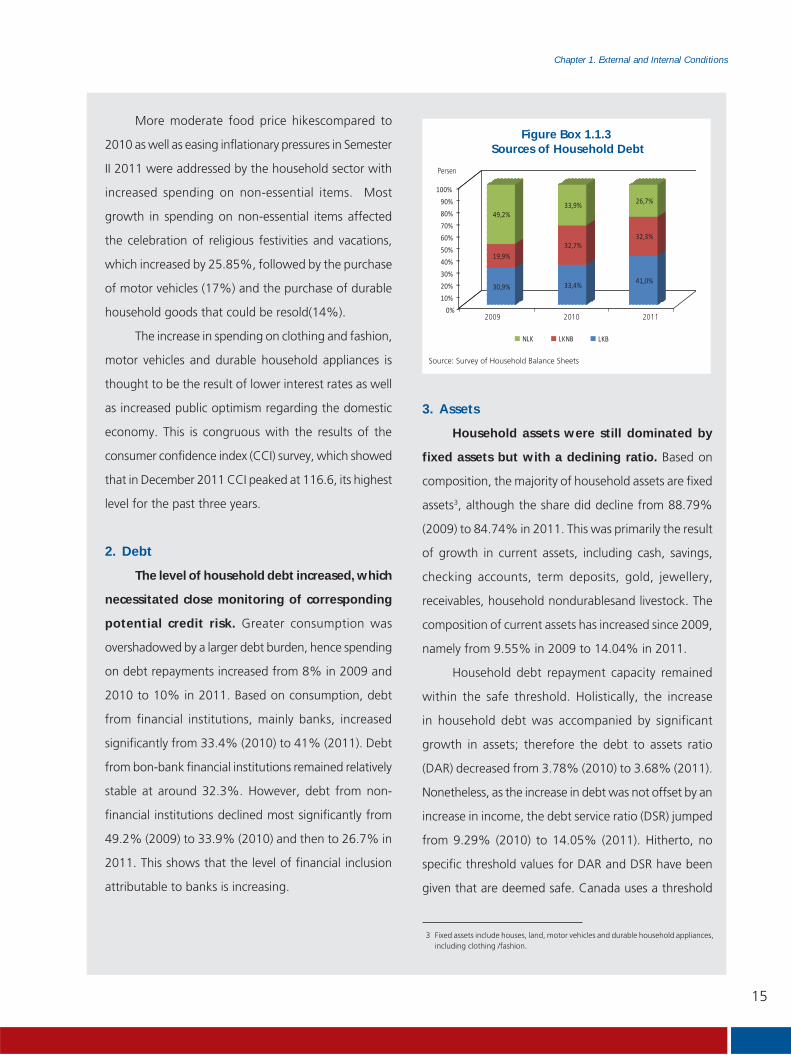
More moderate food price hikescompared to
2010 as well as easing inflationary pressures in Semester
II 2011 were addressed by the household sector with
increased spending on non-essential items. Most
growth in spending on non-essential items affected
the celebration of religious festivities and vacations,
which increased by 25.85%, followed by the purchase
of motor vehicles (17%) and the purchase of durable
household goods that could be resold(14%).
The increase in spending on clothing and fashion,
motor vehicles and durable household appliances is
thought to be the result of lower interest rates as well
as increased public optimism regarding the domestic
economy. This is congruous with the results of the
consumer confidence index (CCI) survey, which showed
that in December 2011 CCI peaked at 116.6, its highest
level for the past three years.
2. Debt
The level of household debt increased, which
necessitated close monitoring of corresponding
potential credit risk. Greater consumption was
overshadowed by a larger debt burden, hence spending
on debt repayments increased from 8% in 2009 and
2010 to 10% in 2011. Based on consumption, debt
from financial institutions, mainly banks, increased
significantly from 33.4% (2010) to 41% (2011). Debt
from bon-bank financial institutions remained relatively
stable at around 32.3%. However, debt from non-
financial institutions declined most significantly from
49.2% (2009) to 33.9% (2010) and then to 26.7% in
2011. This shows that the level of financial inclusion
attributable to banks is increasing.
Figure Box 1.1.3 Sources of Household Debt
Source: Survey of Household Balance Sheets
0%
10%
20%
30%
40%
50%
60%
70%
80%
90%
100%
30,9% 33,4%41,0%
19,9%32,7%
32,3%
49,2%33,9% 26,7%
NLK LKNB LKB
Persen
2009 2010 2011
3. Assets
Household assets were still dominated by
fixed assets but with a declining ratio. Based on
composition, the majority of household assets are fixed
assets3, although the share did decline from 88.79%
(2009) to 84.74% in 2011. This was primarily the result
of growth in current assets, including cash, savings,
checking accounts, term deposits, gold, jewellery,
receivables, household nondurablesand livestock. The
composition of current assets has increased since 2009,
namely from 9.55% in 2009 to 14.04% in 2011.
Household debt repayment capacity remained
within the safe threshold. Holistically, the increase
in household debt was accompanied by significant
growth in assets; therefore the debt to assets ratio
(DAR) decreased from 3.78% (2010) to 3.68% (2011).
Nonetheless, as the increase in debt was not offset by an
increase in income, the debt service ratio (DSR) jumped
from 9.29% (2010) to 14.05% (2011). Hitherto, no
specific threshold values for DAR and DSR have been
given that are deemed safe. Canada uses a threshold
3 Fixed assets include houses, land, motor vehicles and durable household appliances, including clothing /fashion.

16
Chapter 1. External and Internal Conditions
of 80% for DAR, which is categorised as high, while
Davaney (1994) used a benchmark DSR of 30%.
The current persistent downward interest rate
trend has stimulated public consumption as reflected
by an increase in certain types of consumption credit
that far outpaced that of credit growth in general.
Accordingly, appropriate macroprudential policy
is required to ease the rate of consumption credit
growth.
Figure Box 1.1.4 Composition of Household Assets
Source: Survey of Household Balance Sheets
Percent
2009 2010 2011
9,55% 10,86% 13,38%0,11% 0,41%0,34%1,09% 0,24%0,25%
88,79% 88,27% 85,46%
0,47% 0,22% 0,60%
0%
10%
20%
30%
40%
50%
60%
70%
80%
90%
100%
Other Assets Fixed assetsInvestment
Restricted assets, Current assets

17
Chapter 2. Financial System Resilience
Chapter 2Financial System Resilience

18
Chapter 2. Financial System Resilience
This page intentionally blank
19
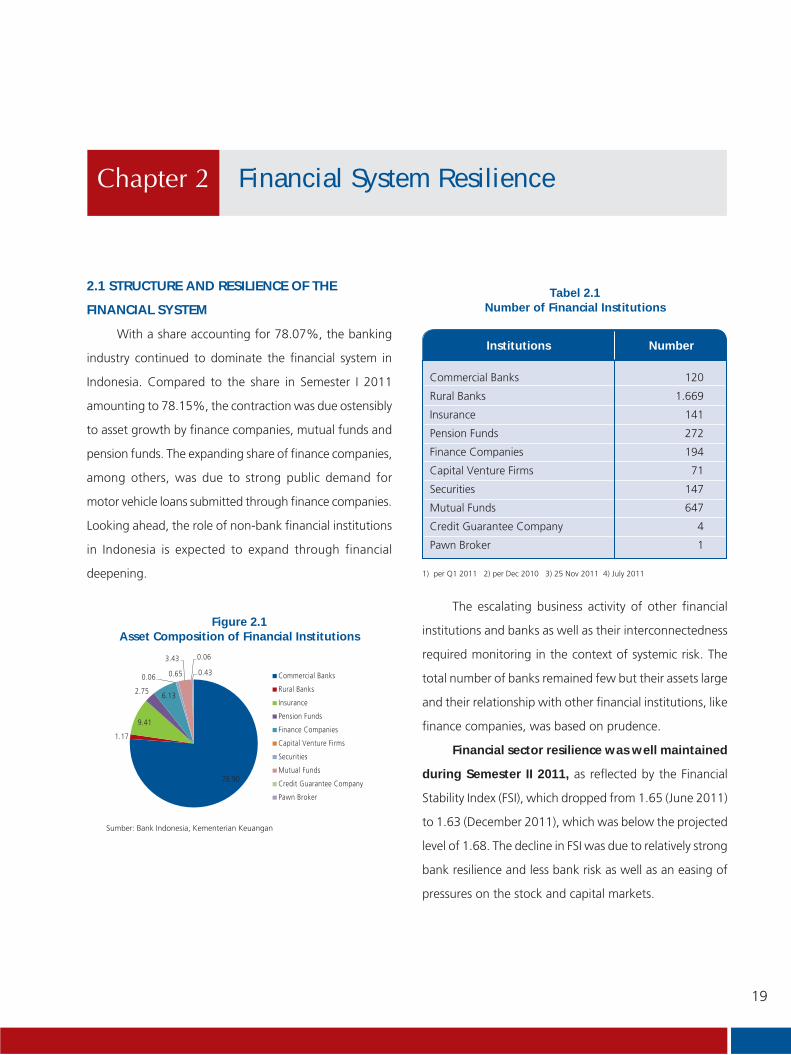
Chapter 2. Financial System Resilience
The escalating business activity of other financial
institutions and banks as well as their interconnectedness
required monitoring in the context of systemic risk. The
total number of banks remained few but their assets large
and their relationship with other financial institutions, like
finance companies, was based on prudence.
Financial sector resilience was well maintained
during Semester II 2011, as reflected by the Financial
Stability Index (FSI), which dropped from 1.65 (June 2011)
to 1.63 (December 2011), which was below the projected
level of 1.68. The decline in FSI was due to relatively strong
bank resilience and less bank risk as well as an easing of
pressures on the stock and capital markets.
76.90
1.17
9.41
2.75 6.13
0.06 0.65
3.43 0.06
0.43 Commercial Banks
Rural Banks
Insurance
Pension Funds
Finance Companies
Capital Venture Firms
Securities
Mutual Funds
Credit Guarantee Company
Pawn Broker
Financial System Resilience
2.1 STRUCTURE AND RESILIENCE OF THE
FINANCIAL SYSTEM
With a share accounting for 78.07%, the banking
industry continued to dominate the financial system in
Indonesia. Compared to the share in Semester I 2011
amounting to 78.15%, the contraction was due ostensibly
to asset growth by finance companies, mutual funds and
pension funds. The expanding share of finance companies,
among others, was due to strong public demand for
motor vehicle loans submitted through finance companies.
Looking ahead, the role of non-bank financial institutions
in Indonesia is expected to expand through financial
deepening.
Sumber: Bank Indonesia, Kementerian Keuangan
Figure 2.1Asset Composition of Financial Institutions
Institutions Number
Tabel 2.1Number of Financial Institutions
Commercial Banks 120
Rural Banks 1.669
Insurance 141
Pension Funds 272
Finance Companies 194
Capital Venture Firms 71
Securities 147
Mutual Funds 647
Credit Guarantee Company 4
Pawn Broker 1
1) per Q1 2011 2) per Dec 2010 3) 25 Nov 2011 4) July 2011
20
Chapter 2. Financial System Resilience
2.2. RISK IN THE BANKING SYSTEM
2.2.1. Funding and Liquidity Risk
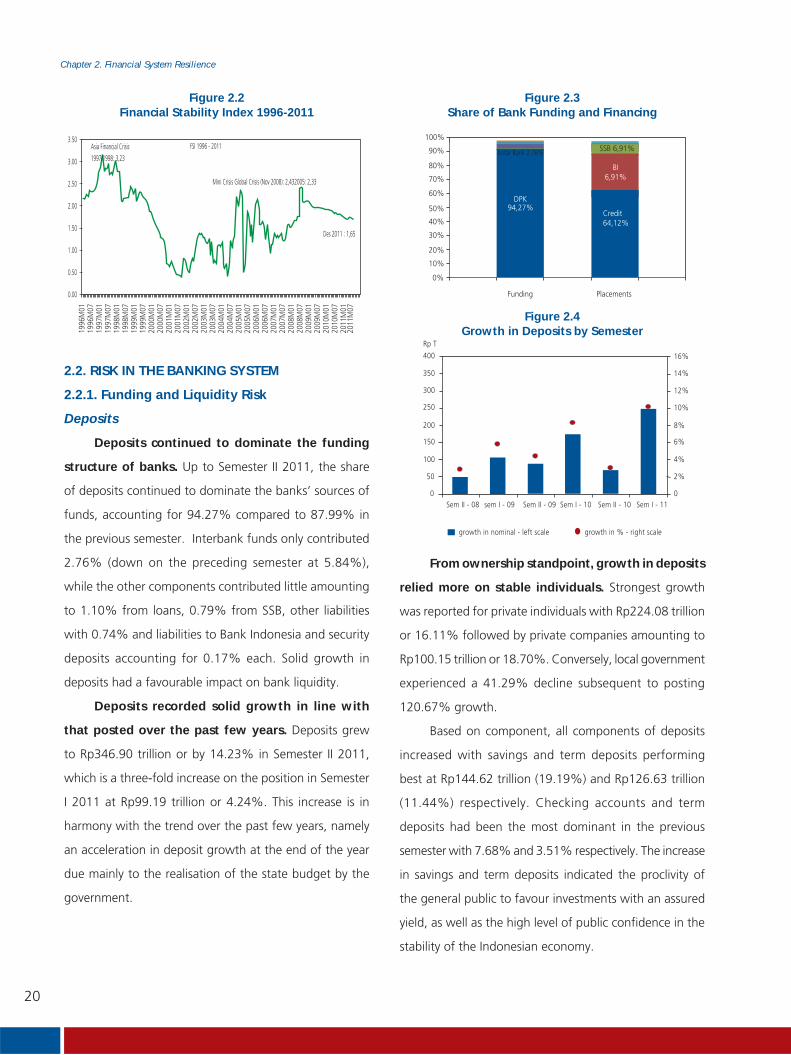
Deposits
Deposits continued to dominate the funding
structure of banks. Up to Semester II 2011, the share
of deposits continued to dominate the banks’ sources of
funds, accounting for 94.27% compared to 87.99% in
the previous semester. Interbank funds only contributed
2.76% (down on the preceding semester at 5.84%),
while the other components contributed little amounting
to 1.10% from loans, 0.79% from SSB, other liabilities
with 0.74% and liabilities to Bank Indonesia and security
deposits accounting for 0.17% each. Solid growth in
deposits had a favourable impact on bank liquidity.
Deposits recorded solid growth in line with
that posted over the past few years. Deposits grew
to Rp346.90 trillion or by 14.23% in Semester II 2011,
which is a three-fold increase on the position in Semester
I 2011 at Rp99.19 trillion or 4.24%. This increase is in
harmony with the trend over the past few years, namely
an acceleration in deposit growth at the end of the year
due mainly to the realisation of the state budget by the
government.
Figure 2.2Financial Stability Index 1996-2011
94,27%
0%
10%
20%
30%
40%
50%
60%
70%
80%
90%
100%
Funding Placements
DPK
Antar Bank 2,76%
Credit64,12%
SSB 6,91%
BI6,91%
0
100
50
250
200
150
300
350
400
0
6%
4%
2%
12%
10%
8%
14%
16%
Sem II - 08 sem I - 09 Sem II - 09 Sem I - 10 Sem II - 10 Sem I - 11
Rp T
growth in nominal - left scale growth in % - right scale
Figure 2.3Share of Bank Funding and Financing
Figure 2.4Growth in Deposits by Semester
From ownership standpoint, growth in deposits
relied more on stable individuals. Strongest growth
was reported for private individuals with Rp224.08 trillion
or 16.11% followed by private companies amounting to
Rp100.15 trillion or 18.70%. Conversely, local government
experienced a 41.29% decline subsequent to posting
120.67% growth.
Based on component, all components of deposits
increased with savings and term deposits performing
best at Rp144.62 trillion (19.19%) and Rp126.63 trillion
(11.44%) respectively. Checking accounts and term
deposits had been the most dominant in the previous
semester with 7.68% and 3.51% respectively. The increase
in savings and term deposits indicated the proclivity of
the general public to favour investments with an assured
yield, as well as the high level of public confidence in the
stability of the Indonesian economy.
0.00
0.50
1.00
1.50
2.00
2.50
3.00
3.50
1996
M01
1996
M07
1997
M01
1997
M07
1998
M01
1998
M07
1999
M01
1999
M07
2000
M01
2000
M07
2001
M01
2001
M07
2002
M01
2002
M07
2003
M01
2003
M07
2004
M01
2004
M07
2005
M01
2005
M07
2006
M01
2006
M07
2007
M01
2007
M07
2008
M01
2008
M07
2009
M01
2009
M07
2010
M01
2010
M07
2011
M01
2011
M07
Des 2011 : 1,65
Asia Financial Crisis
1997/1998: 3,23
Mini Crisis Global Crisis (Nov 2008): 2,432005: 2,33
FSI 1996 - 2011

21
Chapter 2. Financial System Resilience
0
250
200
150
100
50
-50
-100
Centr
al Go
vernm
ent
Local
Gov
ernme
ntPri
vate i
ndivid
uals
Privat
e - Fin
ancia
l Instit
ution
sPri
vate C
ompa
nies
Othe
r priv
ate
Non-r
eside
nts
Rp T
semester I 2011 semester II 2010
Figure 2.5Deposit Growth based on Ownership
Primary ReservesTertiary Reserve
Secondary ReserveLiquid Assets (right)
0
600
Rp T Rp T
400
200
1,100
1,000
900
800
700
600
Dec
- 1
0
Jan -
11
Feb -
11
Mar
- 1
1
Apr
- 11
Mey
- 1
1
Jun -
11
Aug -
11
Sep -
11
Oct
- 1
1
Nov
- 11
Dec
- 1
1
Jul -
11
Figure 2.6Composition of Bank Liquid Assets
Table 2.2Total Number of Financial Institutions
Growth ytdDec
2011(Rp T)
Nominal(Rp T)
Nominal(Rp T)
% %
Growth yoy
Primary Reserves 314.09 37.78 13.67 87.55 38.65
Secondary Reserves 663.41 114.67 20.90 96.80 17.08
Tertiary Reserves 69.24 (3.12) (4.32) (4.76) (6.43)
Total 1,046.74 149.32 16.64 179.59 20.71
* The components of liquid assets above has not exclude primary reserve obligation
Based on currency, growth in deposits was
contributed by those denominated in rupiah as well as
foreign currency. Rupiah deposits grew during the reporting
semester to Rp305.50 trillion or 88.06% of total growth
in deposits, while dollar deposits accounted for Rp41.40
trillion or 11.94% of the total. This increase in dollar deposits
exceeded the Rp3.26 trillion contraction experienced in the
previous semester.
Liquidity Risk
The growth in liquid assets (16.64%) outpaced
that of deposits (14.23%). Total bank liquid assets
increased by 16.64% in Semester II 2011 to Rp1,046.74
trillion. The growth in liquid assets stemmed primarily from
the increase in secondary reserves consisting of SBI, other
placements at Bank Indonesia, Trading SUN and available-
for-sale SUN making up 20.90% and an increase in primary
reserves comprising of cash and checking accounts held
at Bank Indonesia amounting to 13,67%. Meanwhile,
the banks’ tertiary reserves declined in Semester II 2011
by 4.32%.
The increase in bank secondary reserves was
principally due to an increase in other placements at
Bank Indonesia (consisting of the Deposit Facility and Call
Money) and increases in Trading SUN.
BI Checking Account Placements in other BI instrumentsSBI
0%
100%
Rp T
90%80%70%60%50%40%30%20%10%
Dec-1
0
Jan-1
1
Feb-
11
Mar-
11
Apr-1
1
May
-11
Jun-
11
Jul-1
1
Aug-1
1
Sep-
11
Oct-11
Nov-1
1
Dec-1
1
Figure 2.7Share of Bank Placements at Bank Indonesia

22
Chapter 2. Financial System Resilience
Bank liquidity remained adequate to meet the
corresponding liabilities. The AL/NCD ratio increased
from 182.34% to 184.70% compared to the position
at the end of Semester I 2011. This was due chiefly to
a significant increase in liquid assets in Semester II 2011
despite an uneven spread of liquidity and funds. The
majority of liquid assets and deposits were held by 14 large
banks with a share accounting for more than 70%, while
116 other banks shared less than 30% between them.
In terms of liquidity risk, the level of liquid
assets held to anticipate deposit withdrawals was
adequate. Based on the results of stress tests, no individual
bank had the potential to experience liquidity shortfalls
under a scenario of a 5% decline in deposits (during the
2008 crisis average deposit withdrawals reached 5%).
Meanwhile, when compared to conditions at the end of
December 2008, the position of individual banks in terms
of covering the withdrawal of non-core deposits continued
to improve. In this context, there remained many banks
with a ratio of liquid assets to non-core deposits in excess
of 100% and not one bank had a ratio below 50%.
2.2.2. Credit Risk and Performance
Credit Performance
Bank loans to productive sectors increased.
Credit grew by 12.78% in the second semester of 2011 or
24.59% for the year (yoy), which exceeded that recorded
in the same semester of the preceding year at 11.3%.
The acceleration in credit growth in Semester II 2011 was
linked to increasingly conducive economic conditions that
allowed the banks to allocate more credit, especially to
productive sectors.
Foreign exchange denominated credit grew
rapidly by 16.2%, up on the previous semester.
Rapid forex credit growth has endured since Semester II
2010, which seemed inextricably linked to the trend of
rupiah appreciation. Consequently, banks are urged to
remain cautious of risks stemming from a weaker rupiah
that could undermine the debt repayment capacity of
borrowers and eventually lead to non-performing loans.
Forex credit was financed in Semester II 2011 by liquidating
86%
7%
4% 3%1%
1_mo
1_3_mo
3_6_mo
6_12_mo
12_mo
50,5
(29,7)
8,3
Loans
Interbank (Net)
Placement at BI
(3,6)
(5,5)
41,4
(40)(20) 0 20 40 60
Other Liabilities
Borrowing
Total Deposits
Rp T
Figure 2.10Credit Funding by Currency
Figure 2.9Credit Growth by Currency
9.7%
21.0%
11.3%9.9%
13.6%
10.5%12.1%
16.2%
12.8%
0%
5%
10%
15%
20%
25%
Rupiah FX Total
sem II/10 sem I/11 sem II/11
Liquid Assetsof 14 Large Bank
73%
Other BankLiquid Unit
27%
Deposits of14 Large Bank72%
Other BankDeposits
28%
Share of liquid assetsin the banking industry
Share of Funds inthe banking industry
Figure 2.8Share of Liquid Assets

23
Chapter 2. Financial System Resilience
interbank foreign exchange funds that tended to be short
term in nature, while foreign exchange deposits actually
experienced positive growth. Unstable global economic
conditions stemming from the protracted debt crisis in
Europe and the slowdown in the US encouraged bankers to
opt for foreign exchange funds to finance domestic credit
allocation. Therefore, the banking sector must remain
vigilant of such funding sources due to the possibility of
a mismatch, which has the potential to trigger additional
losses in the exchange rate.
The role of credit to productive sectors was
relatively dominant during Semester II 2011.
Compared to the prior semester, investment credit grew
by 14.1% to Rp464.3 trillion, working capital credit grew
by 13.6% to Rp1,068.7 trillion, and consumption credit
by 10.6% to Rp667.12 trillion. Solid investment credit
growth is expected to benefit the real sector and contribute
to national economic growth. Nevertheless, the banking
15.8%
6.8%
13.6%
3.5%
16.8%
14.1%
9.7%
12.3%
10.6%
0%
2%
4%
6%
8%
10%
12%
14%
16%
18%
20%
sem II/10 sem I/11 sem II/11
Working capital credit Investment credit Consumption credit
Figure 2.11Credit Growth by Type
-20%
-10%
0%
10%
20%
30%
40%
50%
60%
70%
80%
Agric
ultu
re
Min
ing
Man
ufac
turin
gIn
dust
ry
Elec
tric
ity
Cons
truc
tion
Trad
e
Tran
spor
tatio
n
Buss
ines
sSe
rvic
e
Soci
al S
ervi
ce
Oth
ers
sem II/10 semI/11 semII/11
Figure 2.12Credit Growth by Economic Sector
0
10
20
30
40
50
60
0
1
2
3
4
5
6
2007 2008 2009 2010 2011
RpT%Loan Loss Provisions
(right-hand scale)
Nominal NPL (right-hand scale)
Gross NPL(left-hand scale)Net NPL
(left-hand scale)
0%
2%
4%
6%
8%
10%
12%
14%
16%
0%
10%
20%
30%
40%
50%
60%
70%
80%
2004 2005 2006 2007 2008 2009 2010 2011
Share of property credit against total credit (right-hand scale)
Property credit growth (yoy) (left-hand scale)
Figure 2.13Growth and Share of Property Credit
Figure 2.14Non-Performing Loans (NPL)
sector must continue to closely monitor investment credit
risk, particularly in terms of bank funding sources that
tend to be short term while the majority of investment
credit tends to be longer term. Meanwhile, based on
sector, all productive sectors grew positively compared
to June 2011.
Growth in property credit, which collapsed in
2009, rebounded in the middle of 2010. Property credit
growth in Semester II 2011 increased by 12.4% or 23.8%
(yoy), which exceeded that posted in Semester I 2011 at
just 10.1% or 17.8% (yoy) as well as that reported for
the same position a year earlier at 7% or 15.5% (yoy).
The share of property credit in total bank credit remained
relatively small at 13.1% of the total. However, with a
large unmet requirement from residents for housing,
property credit and especially mortgages will have further
opportunity to flourish.

24
Chapter 2. Financial System Resilience
Credit Risk4
Bank credit risk eased slightly in Semester II
2011 compared to Semester I-2011. The gross NPL ratio
was just 2.17% at the end of Semester II 2011, down
from 2.74% in June 2011 and 2.56% in December 2010.
Total non-performing loans decreased to Rp5.7 trillion in
Semester II 2011 or around 2.3% of the total increase in
bank credit for the period. In addition to strong bank credit
growth, writing off around Rp6 trillion in credit by several
banks in December 2011 contributed to the significant
decline in the gross NPL ratio.
Banks confronted a potential increase in risk on
foreign currency denominated loans. Historically, the
ratio of non-performing foreign currency loans peaked
in 2000 at over 30% as fallout from the 1997/1998
crisis; well above the NPL ratio for rupiah denominated
loans. Nonetheless, the performance of foreign currency
credit has improved significantly in the past few periods.
The NPL ratio of foreign currency credit since January
2011 has remained below that of rupiah based loans,
reaching 2.03% and 2.19% respectively in December
2011. According to the ratio, non-performing loans have
declined, however, nominally NPL for foreign currency
denominated credit increased by 8.9% compared to the
previous semester when a 10% drop was recorded.
6,4%
-17,3% -17,4%
15,4%19,1%
25,5%
-10,72% -11,26% -10,53%
-20%
-15%
-10%
-5%
0%
5%
10%
15%
20%
25%
30%
KKKIKMK
sem II/10 sem I/11 sem II/11
Figure 2.17NPL Growth by Credit Type
0
1
2
3
4
5
6
7
8
9
2007 2008 2009 2010 2011
%
Rp NPL Ratio FX NPL Ratio NPL Total
-4,8%-2,3%
-4,4%
23,8%
-10,0%
18,2%
-13,7%
8,9%
-10,8%
-20%
-15%
-10%
-5%
0%
5%
10%
15%
20%
25%
30%
Rupiah Valas Total
sem II/10 sem I/11 sem II/11
Figure 2.15NPL Growth by Currency
Figure 2.16NPL Ratio by Currency
When observed according to the type of loan,
a decline in total NPL was reported for all three
types of loans in Semester II 2011, with the biggest
decrease affecting investment credit. This decline in
NPL for investment credit, among others, was thanks to
improvements in the quality of middle segment investment
credit at several large banks. In line with the decline in
non-performing loans, the gross NPL ratio for working
capital credit, investment credit and consumption credit
decreased on the preceding semester from 3.37%, 2.47%
and 1.95% to 2.65%, 1.92% and 1.57%.
Considering its longer time frame compared
to the other types of loan, investment credit has
inherently more credit risk. Historical data indicates
that investment credit has maintained a higher gross
4 Excluding channelling unless otherwise stated.

25
Chapter 2. Financial System Resilience
0
3
6
9
12
2007 2008 2009 2010 2011
%
consumptioncredit
Investmentcredit
workingcapital credit
Figure 2.18NPL Ratio by Credit Type
Figure 2.19NPL Ratio by Economic Sector
0
2
4
6
8
10
2007 2008 2009 2010 2011
%
Agriculture Mining Manufacturing Industry Electricity Construction
0
2
4
6
8
10
2007 2008 2009 2010 2011
%
Trade Transportation Business Services Social Services Others
NPL ratio than the other two types of loan since the year
2000. However, since 2009 the NPL ratio of investment
credit has remained below that of working capital credit.
In Semester II 2011, nominal NPL for investment credit
dropped by 11.26%, leading to a decline in the gross
NPL ratio to 1.92% compared to the 2.4% posted at
year end 2010. Looking ahead, investment credit risk can
be controlled if credit allocation continues to adhere to
prudential principles.
0%
2%
4%
6%
8%
10%
12%
14%
16%
Mortgages Real Estate Construction Total Property
By sector, nearly all sectors experienced a
decline in non-performing loans in Semester II 2011,
with the largest declines affecting the mining sector
(72%), followed by transportation (35.2%), social services
(26.2%), business services (24.4%), others (12.5%), trade
(9.8%) and construction (3.1%). Notwithstanding, the
electricity and agricultural sectors experienced an increase
in non-performing loans amounting to 41.2% and 5.6%
respectively. This increase in NPL was attributable to more
loans being classified as doubtful and loss in the agricultural
and utilities (electricity, gas and water) sectors. In terms
of credit risk stemming from other sectors, the nascent
emergence of rising NPL in the trade and manufacturing
sectors requires closer monitoring.
Property credit risk in Semester II 2011 was well
controlled, with a decline in the NPL ratio for property
credit from 3.0% (June 2011) to 2.4% in December
2011. Although the ratio was slightly above that for
total credit (2.17% in December 2011%), the trend was
downward. This decline NPL for property credit in Semester
II 2011 was primarily contributed by improvements in the
collectability of mortgages. The NPL ratio of mortgages
dropped to 1.8% compared to the position in June 2011
at 2.5% in line with enhancements to loan management
at commercial banks.
Figure 2.20NPL Ratio of Property Credit

26
Chapter 2. Financial System Resilience
2.2.3. Profitability and Capital
Profitability
The profitability of the banking industry
increased on the strength of improved domestic
economic conditions. Banks posted a net profit of Rp75
trillion, which exceeded that posted in Semester I 2011 and
Semester II 2010 at just Rp37.1 trillion and Rp57.3 trillion
respectively. The jump in profit was driven by, among
others, growth in loan interest income, which accounts
for 82.66% of total interest income, linked to the 24.59%
(yoy) level of credit growth at the end of the reporting
period. Solid profits were reflected by the 3.03% return
on assets posted by the banks in December 2011.
When observed by bank group (data for December
2011 compared to December 2010), all bank groups
experienced an increase in their net profits due to credit
growth. The strongest growth in profit was recorded by
state-owned banks, achieving 43.5% growth on net profit
in 2010, followed by foreign bank branch offices with
35.4%, foreign exchange banks with 27%, joint venture
banks with 18% and regional banks with 5.9%.
Up to the end of Semester II 2011, the
composition of bank profit was still dominated by
operational profit. In December 2011, bank operational
profit was recorded at Rp56.4 trillion or 58.16% of total
profit, which is a two-fold increase over that posted in
June 2011 at Rp26 trillion.
The dominance of operational profit stems from
increased Net Interest Income (NII). Average monthly NII
in Semester II 2011 was Rp13.93 trillion, which surpassed
that reported in Semester I 2010 (Rp12.18 trillion) and
0
10
20
30
40
50
60
70
80
0
10
20
30
40
50
60
%T Rp
Operational Profit/Loss(left-hand scale)Non-Operational Profit/Loss (left-hand scale)Share of Profit/Loss (right-hand scale)
Figure 2.21Composition of Bank Profit/Loss
Table 2.3Profit/Loss of Banking Industry
Source: Periodic commercial bank reports, Bank Indonesia
Rp T Dec 2010 Jun 2011 Dec 2011
Operational profit/loss 48,3 26,1 56,4
Non-operational profit/loss 27,7 20,5 40,7
Before taxes profit/loss 76,1 46,6 97,1
After taxes profit/loss 57,3 37,1 75,0
Source: Periodic commercial bank reports
Dec-10
L/R After Taxes(T Rp)
NIM (%)Growth Credit
(% YOY)
Dec-10Dec-10Dec-11 Dec-11Dec-11Jun-11 Jun-11
Bank Group
1. State-owned 22,77 16,62 32,66 18,0% 20,9% 6,11 6,30 6,55
2, Private 21,06 13,14 26,74 29,8% 29,1% 5,69 5,58 5,65
3, Regional 7,51 4,14 7,95 19,0% 22,3% 8,74 8,14 8,10
4, Joint venture 2,06 1,12 2,43 22,3% 21,6% 3,83 4,02 3,91
5, Foreign branch office 3,91 2,07 5,29 13,0% 20,8% 3,54 3,59 3,62
Industry total 57,31 37,10 75,08 22,8% 24,6% 5,73 5,79 5,91
Table 2.4Profitability and Credit by Bank Group
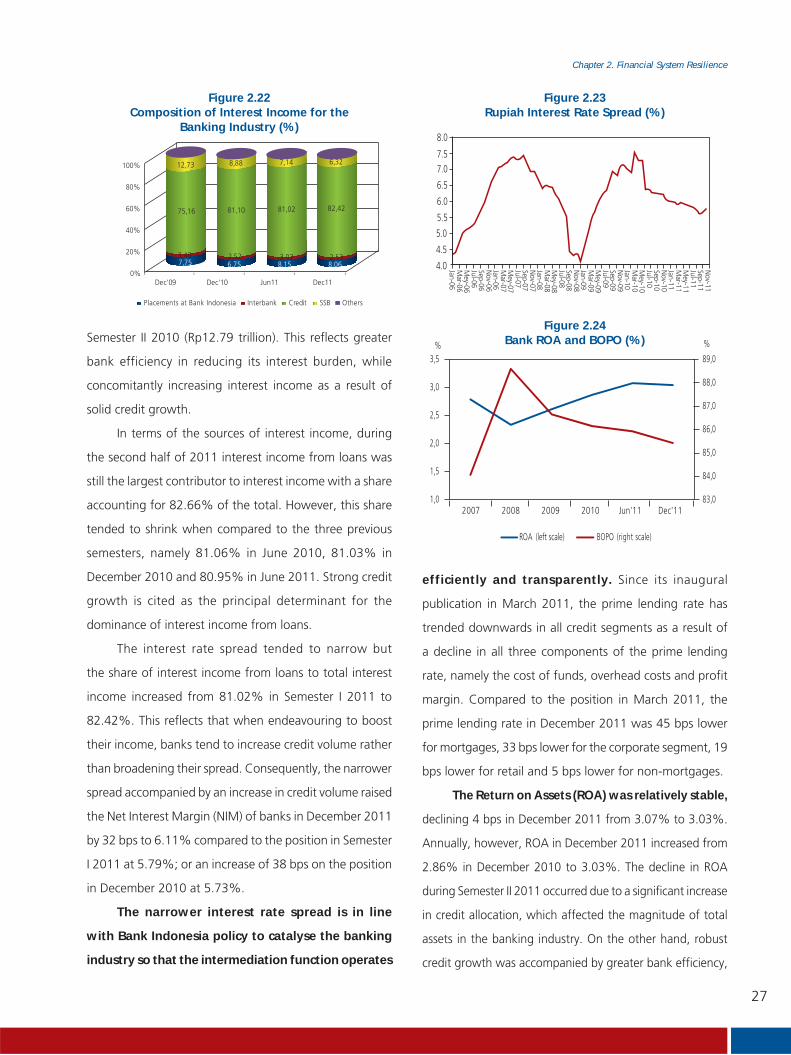
27
Chapter 2. Financial System Resilience
Figure 2.22Composition of Interest Income for the
Banking Industry (%)
0%
20%
40%
60%
80%
100%
Dec'09 Dec'10 Jun11 Dec11
Placements at Bank Indonesia Interbank Credit SSB Others
7,75 6,75 8,15 8,063,46 2,52 3,02 2,53
75,16 81,10 81,02 82,42
12,73 8,88 7,14 6,32
Semester II 2010 (Rp12.79 trillion). This reflects greater
bank efficiency in reducing its interest burden, while
concomitantly increasing interest income as a result of
solid credit growth.
In terms of the sources of interest income, during
the second half of 2011 interest income from loans was
still the largest contributor to interest income with a share
accounting for 82.66% of the total. However, this share
tended to shrink when compared to the three previous
semesters, namely 81.06% in June 2010, 81.03% in
December 2010 and 80.95% in June 2011. Strong credit
growth is cited as the principal determinant for the
dominance of interest income from loans.
The interest rate spread tended to narrow but
the share of interest income from loans to total interest
income increased from 81.02% in Semester I 2011 to
82.42%. This reflects that when endeavouring to boost
their income, banks tend to increase credit volume rather
than broadening their spread. Consequently, the narrower
spread accompanied by an increase in credit volume raised
the Net Interest Margin (NIM) of banks in December 2011
by 32 bps to 6.11% compared to the position in Semester
I 2011 at 5.79%; or an increase of 38 bps on the position
in December 2010 at 5.73%.
The narrower interest rate spread is in line
with Bank Indonesia policy to catalyse the banking
industry so that the intermediation function operates
Figure 2.23Rupiah Interest Rate Spread (%)
8.0
7.57.0
6.5
6.0
5.5
5.0
4.5
4.0 Jan-06M
ar-06M
ey-06Jul-06Sep-06N
ov-06Jan-06M
ar-07M
ey-07Jul-07Sep-07N
ov-07Jan-08M
ar-08M
ey-08Jul-08Sep-08N
ov-08Jan-09M
ar-09M
ey-09Jul-09Sep-09N
ov-09Jan-10M
ar-10M
ey-10Jul-10Sep-10N
ov-10Jan-11M
ar-11M
ey-11Jul-11Sep-11N
ov-11
83,0
84,0
85,0
86,0
87,0
88,0
89,0
1,0
1,5
2,0
2,5
3,0
3,5
2007 2008 2009 2010 Jun'11 Dec'11
%%
ROA (left scale) BOPO (right scale)
efficiently and transparently. Since its inaugural
publication in March 2011, the prime lending rate has
trended downwards in all credit segments as a result of
a decline in all three components of the prime lending
rate, namely the cost of funds, overhead costs and profit
margin. Compared to the position in March 2011, the
prime lending rate in December 2011 was 45 bps lower
for mortgages, 33 bps lower for the corporate segment, 19
bps lower for retail and 5 bps lower for non-mortgages.
The Return on Assets (ROA) was relatively stable,
declining 4 bps in December 2011 from 3.07% to 3.03%.
Annually, however, ROA in December 2011 increased from
2.86% in December 2010 to 3.03%. The decline in ROA
during Semester II 2011 occurred due to a significant increase
in credit allocation, which affected the magnitude of total
assets in the banking industry. On the other hand, robust
credit growth was accompanied by greater bank efficiency,
Figure 2.24Bank ROA and BOPO (%)

28
Chapter 2. Financial System Resilience
as denoted by the decline in the BOPO efficiency ratio in
semester II 2011 to 85.42% from 90.47% in June 2011,
86.14% in December 2010 and 85.92% in June 2011.
Capital
The average capital adequacy ratio (CAR) of the
banking industry dropped to 16.82% compared to
17.53% in the prior semester. Over the past three years,
average bank CAR dipped to lowest level in semester II-2010
(16.79%). Meanwhile, based on its position at the end of
Semester II 2011, CAR had recorded a new low of 16.07%.
Nevertheless, this level of bank CAR is still relatively high
compared to the minimum capital requirement stipulated in
Basel II. The low average level of CAR at the end of Semester
II 2011 compared to Semester I 2011 was primarily caused
by a hike in the minimum statutory reserve that exceeded
the average increase in capital. In Semester II 2011, the
average minimum statutory reserve for banks increased
by Rp244.59 trillion or 11.46% while average capital only
increased by Rp25.97 trillion or 6.94%.
Based on bank group, the downward trend in
average CAR stemmed from a decline in average CAR
for all bank groups, excluding foreign bank branch
offices. The average CAR of foreign bank branch offices
rebounded to its highest level at 25.71% with the support
of a significant increase in average capital during Semester
II 2011, more specifically Rp6.47 trillion (13.45%), and a
10
12
11
13
14
15
16
17
18
19
0,00Dec’08 Dec’09 Jun’10 Dec’10 Jun’11 Dec’11
0,50
1,00
1,50
2,00
2,50
3,00
%Rp T
CAR (right scale)Risk-WeightedAssets (left scale)
Capital (left scale)
Figure 2.25Capital, the Minimum Statutory
Reserve and Bank CAR
Figure 2.26CAR by Bank Group (%)
35.00 %
30.00
State-owned Private Regional Joint venture Foreign
25.00
20.00
15.00
10.00
5.00
0.00
Dec’08 Dec’09 Jan’10 Dec’10 Jan’11 Dec’11
decline in average statutory reserves of Rp17.82 trillion
(9.16%). The average CAR of joint venture banks remained
relatively high at a level of 20.58%. On the other hand,
average CAR for the largest extenders of credit, namely
regional banks, private banks and state-owned banks,
trended downwards compared to the previous period.
Average CAR for regional banks was 14.55%, private banks
was 15.51% and stsate-owned banks was 16.06%.
Table 2.5Performance of the Prime Lending Rate
Note: data excludes outliers and calculated by weighted average
SamplesCredit
Segment March April May June July Augt Sept Oct Nov Dec
Corporate 10,51 10,58 10,64 10,72 10,54 10,55 10,51 10,50 10,36 10,18
Retail 11,80 12,21 11,84 11,91 12,00 12,08 12,04 11,98 11,78 11,61
Mortgages 11,16 11,25 11,35 11,38 11,03 11,03 11,04 10,98 10,82 10,71
Non-Mortgages 11,56 11,70 11,76 11,86 11,86 11,96 11,88 11,83 11,68 11,51
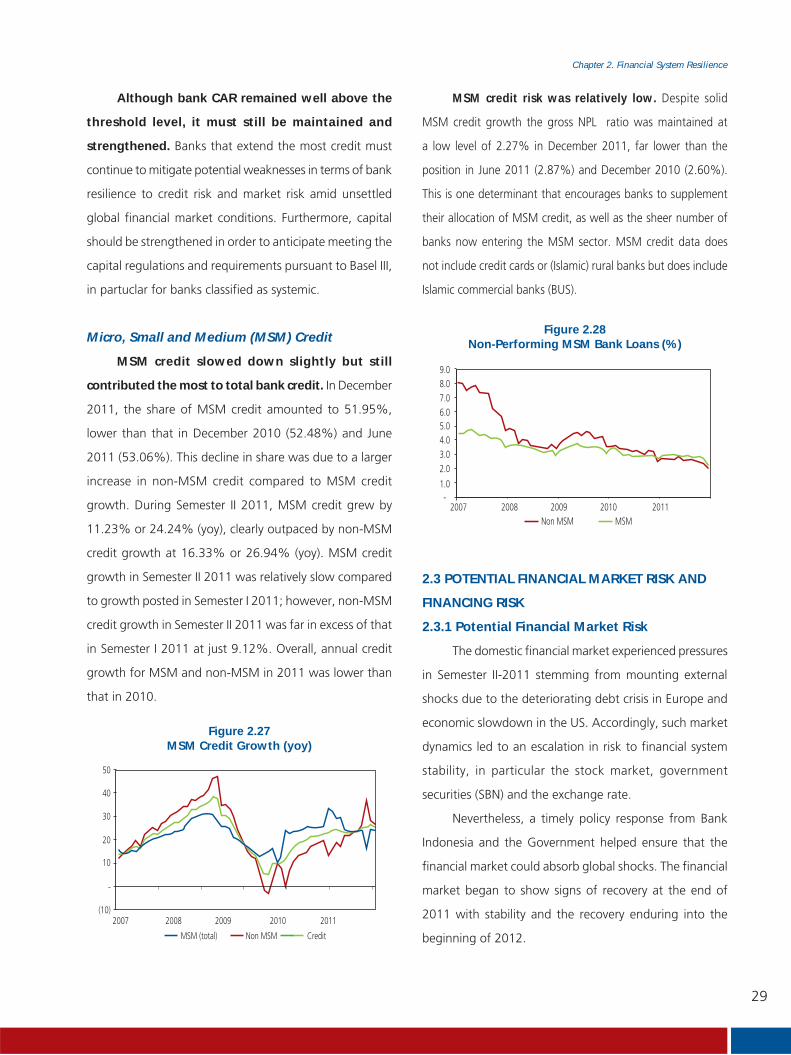
29
Chapter 2. Financial System Resilience
Figure 2.27MSM Credit Growth (yoy)
50
40
30
20
10
-
(10)2007 2008 2009
MSM (total) Non MSM
2010 2011
Credit
Although bank CAR remained well above the
threshold level, it must still be maintained and
strengthened. Banks that extend the most credit must
continue to mitigate potential weaknesses in terms of bank
resilience to credit risk and market risk amid unsettled
global financial market conditions. Furthermore, capital
should be strengthened in order to anticipate meeting the
capital regulations and requirements pursuant to Basel III,
in partuclar for banks classified as systemic.
Micro, Small and Medium (MSM) Credit
MSM credit slowed down slightly but still
contributed the most to total bank credit. In December
2011, the share of MSM credit amounted to 51.95%,
lower than that in December 2010 (52.48%) and June
2011 (53.06%). This decline in share was due to a larger
increase in non-MSM credit compared to MSM credit
growth. During Semester II 2011, MSM credit grew by
11.23% or 24.24% (yoy), clearly outpaced by non-MSM
credit growth at 16.33% or 26.94% (yoy). MSM credit
growth in Semester II 2011 was relatively slow compared
to growth posted in Semester I 2011; however, non-MSM
credit growth in Semester II 2011 was far in excess of that
in Semester I 2011 at just 9.12%. Overall, annual credit
growth for MSM and non-MSM in 2011 was lower than
that in 2010.
MSM credit risk was relatively low. Despite solid
MSM credit growth the gross NPL ratio was maintained at
a low level of 2.27% in December 2011, far lower than the
position in June 2011 (2.87%) and December 2010 (2.60%).
This is one determinant that encourages banks to supplement
their allocation of MSM credit, as well as the sheer number of
banks now entering the MSM sector. MSM credit data does
not include credit cards or (Islamic) rural banks but does include
Islamic commercial banks (BUS).
Figure 2.28Non-Performing MSM Bank Loans (%)
9.08.07.06.05.04.03.02.0
1.0
2007 2008 2009 2010 2011MSM
-
Non MSM
2.3 POTENTIAL FINANCIAL MARKET RISK AND
FINANCING RISK
2.3.1 Potential Financial Market Risk
The domestic financial market experienced pressures
in Semester II-2011 stemming from mounting external
shocks due to the deteriorating debt crisis in Europe and
economic slowdown in the US. Accordingly, such market
dynamics led to an escalation in risk to financial system
stability, in particular the stock market, government
securities (SBN) and the exchange rate.
Nevertheless, a timely policy response from Bank
Indonesia and the Government helped ensure that the
financial market could absorb global shocks. The financial
market began to show signs of recovery at the end of
2011 with stability and the recovery enduring into the
beginning of 2012.
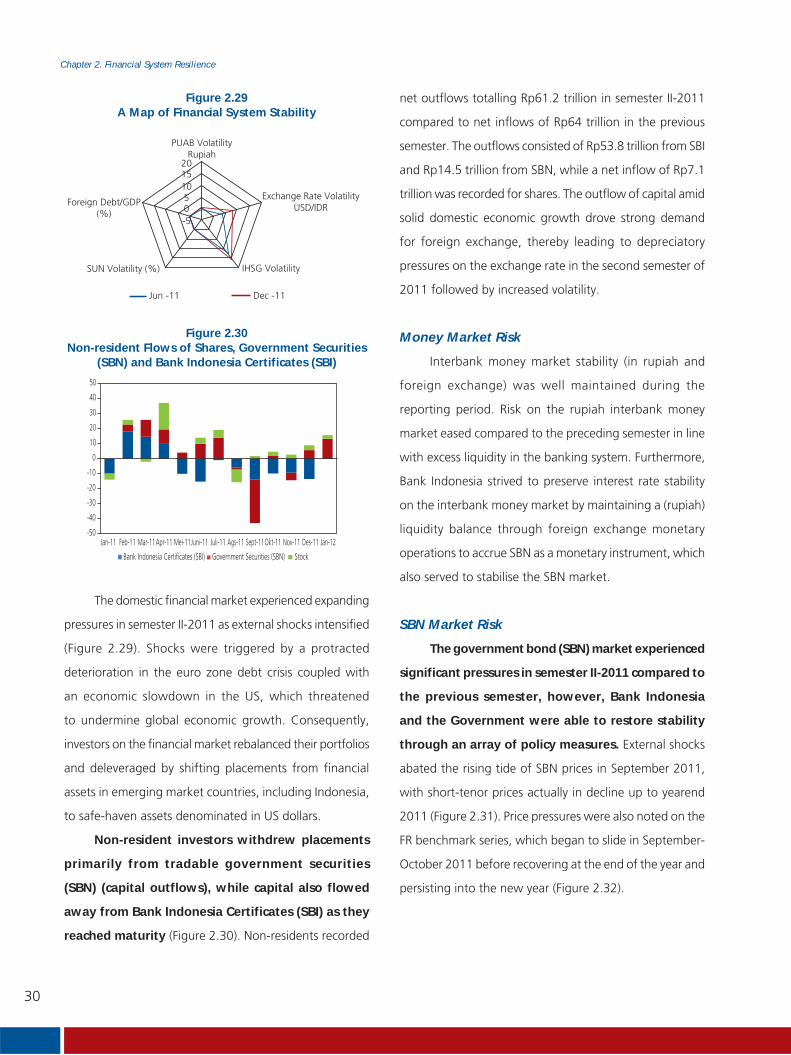
30
Chapter 2. Financial System Resilience
net outflows totalling Rp61.2 trillion in semester II-2011
compared to net inflows of Rp64 trillion in the previous
semester. The outflows consisted of Rp53.8 trillion from SBI
and Rp14.5 trillion from SBN, while a net inflow of Rp7.1
trillion was recorded for shares. The outflow of capital amid
solid domestic economic growth drove strong demand
for foreign exchange, thereby leading to depreciatory
pressures on the exchange rate in the second semester of
2011 followed by increased volatility.
Money Market Risk
Interbank money market stability (in rupiah and
foreign exchange) was well maintained during the
reporting period. Risk on the rupiah interbank money
market eased compared to the preceding semester in line
with excess liquidity in the banking system. Furthermore,
Bank Indonesia strived to preserve interest rate stability
on the interbank money market by maintaining a (rupiah)
liquidity balance through foreign exchange monetary
operations to accrue SBN as a monetary instrument, which
also served to stabilise the SBN market.
SBN Market Risk
The government bond (SBN) market experienced
significant pressures in semester II-2011 compared to
the previous semester, however, Bank Indonesia
and the Government were able to restore stability
through an array of policy measures. External shocks
abated the rising tide of SBN prices in September 2011,
with short-tenor prices actually in decline up to yearend
2011 (Figure 2.31). Price pressures were also noted on the
FR benchmark series, which began to slide in September-
October 2011 before recovering at the end of the year and
persisting into the new year (Figure 2.32).
-50
-40
-30
-20
-10
0
10
20
30
40
50
Jan-11 Feb-11 Mar-11Apr-11 Mei-11Juni-11 Juli-11 Ags-11 Sept-11Okt-11 Nov-11 Des-11 Jan-12
Bank Indonesia Certificates (SBI) Government Securities (SBN) Stock
Figure 2.30Non-resident Flows of Shares, Government Securities
(SBN) and Bank Indonesia Certificates (SBI)
The domestic financial market experienced expanding
pressures in semester II-2011 as external shocks intensified
(Figure 2.29). Shocks were triggered by a protracted
deterioration in the euro zone debt crisis coupled with
an economic slowdown in the US, which threatened
to undermine global economic growth. Consequently,
investors on the financial market rebalanced their portfolios
and deleveraged by shifting placements from financial
assets in emerging market countries, including Indonesia,
to safe-haven assets denominated in US dollars.
Non-resident investors withdrew placements
primarily from tradable government securities
(SBN) (capital outflows), while capital also flowed
away from Bank Indonesia Certificates (SBI) as they
reached maturity (Figure 2.30). Non-residents recorded
Figure 2.29A Map of Financial System Stability
PUAB VolatilityRupiah
20151050-5
Jun -11 Dec -11
Exchange Rate VolatilityUSD/IDR
IHSG VolatilitySUN Volatility (%)
Foreign Debt/GDP(%)
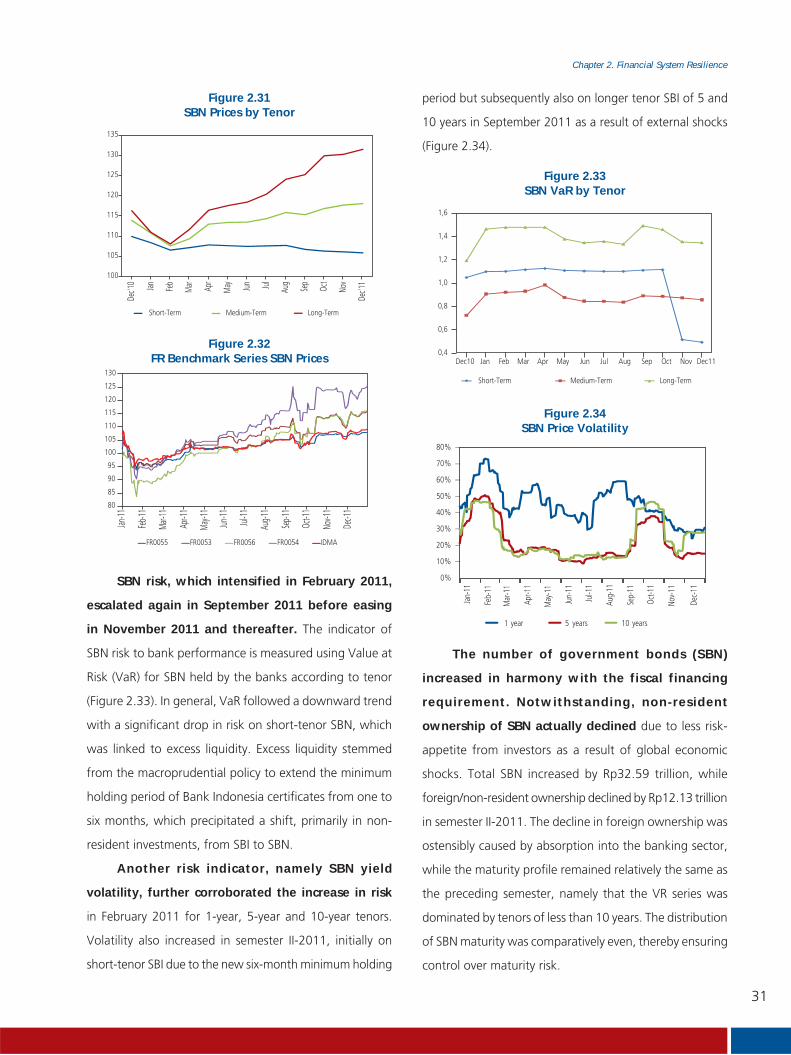
31
Chapter 2. Financial System Resilience
80
85
90
95
100
105
110
115
120
125
130
Jan-11
Feb-1
1
Mar-1
1
Apr-1
1
May-1
1
Jun-11
Jul-11
Aug-1
1
Sep-1
1
Oct-1
1
Nov-1
1
Dec-1
1
FR0055 FR0053 FR0056 FR0054 IDMA
Figure 2.32FR Benchmark Series SBN Prices
0,4
0,6
0,8
1,0
1,2
1,4
1,6
Dec10 Jan Feb Mar Apr May Jun Jul Aug Sep Oct Nov Dec11
Short-Term Medium-Term Long-Term
Figure 2.33SBN VaR by Tenor
Figure 2.34SBN Price Volatility
0%
10%
20%
30%
40%
50%
60%
70%
80%
Jan-
11
Feb-
11
Mar
-11
Apr-1
1
May
-11
Jun-
11
Jul-1
1
Aug-
11
Sep-
11
Oct-1
1
Nov-
11
Dec-
11
1 year 5 years 10 years
Figure 2.31SBN Prices by Tenor
100
105
110
115
120
125
130
135De
c'10 Jan Feb
Mar Apr
May Jun Jul
Aug
Sep
Oct
Nov
Dec'1
1
Short-Term Medium-Term Long-Term
SBN risk, which intensified in February 2011,
escalated again in September 2011 before easing
in November 2011 and thereafter. The indicator of
SBN risk to bank performance is measured using Value at
Risk (VaR) for SBN held by the banks according to tenor
(Figure 2.33). In general, VaR followed a downward trend
with a significant drop in risk on short-tenor SBN, which
was linked to excess liquidity. Excess liquidity stemmed
from the macroprudential policy to extend the minimum
holding period of Bank Indonesia certificates from one to
six months, which precipitated a shift, primarily in non-
resident investments, from SBI to SBN.
Another risk indicator, namely SBN yield
volatility, further corroborated the increase in risk
in February 2011 for 1-year, 5-year and 10-year tenors.
Volatility also increased in semester II-2011, initially on
short-tenor SBI due to the new six-month minimum holding
period but subsequently also on longer tenor SBI of 5 and
10 years in September 2011 as a result of external shocks
(Figure 2.34).
The number of government bonds (SBN)
increased in harmony with the fiscal financing
requirement. Notwithstanding, non-resident
ownership of SBN actually declined due to less risk-
appetite from investors as a result of global economic
shocks. Total SBN increased by Rp32.59 trillion, while
foreign/non-resident ownership declined by Rp12.13 trillion
in semester II-2011. The decline in foreign ownership was
ostensibly caused by absorption into the banking sector,
while the maturity profile remained relatively the same as
the preceding semester, namely that the VR series was
dominated by tenors of less than 10 years. The distribution
of SBN maturity was comparatively even, thereby ensuring
control over maturity risk.

32
Chapter 2. Financial System Resilience
70
90
110
130
150
170
190
210
230
250
Jan-
10Fe
b-10
Mar-
10Ap
r-10
May
-10
Jun-
10Ju
l-10
Aug-
10Se
p-10
Oct-1
0No
v-10
Dec-1
0Ja
n-11
Feb-
11M
ar-11
Apr-1
1M
ay-1
1Ju
n-11
Jul-1
1Au
g-11
Sep-
11Oc
t-11
Nov-1
1De
c-11
FinancialConsumptionInfrastructure
AgriculturePropertyTrade
JSX CompositeBasic IndustryMiningMiscellaneous Industry
Figure 2.37The JSX Composite by Sector
Figure 2.36The JSX Composite and other Global Price Indices
60
80
100
120
140
160
180
Jan-
10Fe
b-10
Mar
-10
Apr-
10M
ay-1
0Ju
n-10
Jul-1
0Au
g-10
Sep-
10O
ct-1
0N
ov-1
0D
ec-1
0Ja
n-11
Feb-
11M
ar-1
1Ap
r-11
May
-11
Jun-
11Ju
l-11
Aug-
11Se
p-11
Oct
-11
Nov
-11
Dec
-11
IHSG FSSTI NKY Hang Seng KOSPI DJIA
-
5
10
15
20
25
30
35
40
45
50
2012
2013
2014
2015
2016
2017
2018
2019
2020
2021
2022
2023
2024
2025
2026
2027
2028
2030
2031
2032
2037
2038
2041
2042
Fixed Rate Variable Rate
Figure 2.35SBN Maturity Profile
By sector, financial sector shares continued to
outperform the market overall (Figure 2.36). This was
due to stable conditions in the banking sector with an
expanding intermediation function and improved quality,
hence maintaining bank profitability. Meanwhile, the
shares of several large banks nearly all performed better
in semester I-2011 compared to the declines reported in
semester II as a result of concerns over external shocks
on the domestic banking sector (2.38). Congruent with
the limited exposure of domestic banks to foreign banks,
the impact of external shocks had minimal effect on the
performance of individual shares.
Stock Market Risk
Similar to the SBN market, the stock market was
also beset with external pressures in semester II-2011,
followed by a subsequent recovery emerging at the
beginning of 2012. The dynamics of the domestic bourse
were subjected to a battle between bullish sentiment
domestically and in the US and bearish sentiment
stemming from the euro zone debt crisis and its impact on
economies in Asia. The JSX composite index experienced
pressures in August 2011, sliding from 3,888 points at the
end of June 2011 to dip below the psychological barrier
of 3,000 points in December 2011 before rebounding
strongly to 3,821.99 points.
Table 2.6SBN Ownership
SBN Ownership (trillions of rupiah)
Jun’11 Dec’11 ChangesBanks 226,54 265,03 38,49
Bank Indonesia 3,12 7,84 4,72
Mutual Funds 48,76 47,22 -1,54
Insurance 93,42 93,09 -0,33
Foreign 234,99 222,86 -12,13
Pension Funds 36,69 34,39 -2,3
Securities 0,07 0,14 0,07
Others 47,44 53,05 5,61
Total 691,03 723,62 32,59

33
Chapter 2. Financial System Resilience
0
10
20
30
40
50
60
Dec1
0
Jan
11
Mar
11
Apr1
1
May
11
Jun
11
Jul1
1
Aug1
1
Sep
11
Oct1
1
Nov1
1
Dec1
1
Jan
12
Indonesia Malaysia JapanSingapore Thailand Hong kong
%
0,01
-0,04
-0,05
0,18
0,01
0,05
-0,03
0,04
-0,07
0,00
0,00
0,00
0,01
0,09
0,08
-0,01
0,07
0,01
0,10
-0,05
-10,00% -5,00% 0,00% 5,00% 10,00% 15,00% 20,00%
BCA
Niaga
Permata
Panin
BII
Mandiri
Bukopin
BRI
Danamon
BNI
January December
Figure 2.38Share Prices in the Banking Sector
Figure 2.39Stock Market Volatility in the Region
020406080
100120140160180200
Jan
11
Feb
11
Mar
11
Apr1
1
May
11
Jun
11
Jul1
1
Aug1
1
Sept
11
Oct1
1
Nov1
1
Dec1
1
Rp T
Equity funds Money market funds Discretionary fundsFixed-income funds Protected funds Indexed fundsETF equity funds ETF fixed-income funds Sharia compliant funds
Figure 2.41Mutual Fund by Type
Figure 2.40 Volatility on Regional Bourse
540
560
580
600
620
640
660
680
50
70
90
110
130
150
170
Jan
11
Feb
11
Mar
11
Apr1
1
May
11
Jun
11
Jul1
1
Aug
11
Sep
11
Oct
11
Nov
11
Dec
11
NAV (Rp T) Number of Shares/Units of Billion Number of Mutual Fund
Stock market risk escalated but has since
subsided. JSX composite risk, measured by the level of
volatility, was well controlled in semester I-2011 despite
intense risk from Japan due to the natural disasters
that befell the country in March 2011 (Figure 2.40).
Deteriorating conditions on global financial markets in
September 2011 prompted concerns over weaker global
demand and economic performance in Asia, thus stock
market risk escalated in the region. JSX composite risk
was the highest in the region but returned to normal at
yearend with volatility actually lower than that reported
at the beginning of the same year. A pre-emptive
government and Bank Indonesia policy response instituted
to minimise the impact of externalities coupled with the
positive response of market players to less concern over
an economic slowdown in the US helped ease volatility
significantly, which tended to flatten/stabilise.
Mutual Funds
The performance of mutual funds continued to
improve in semester I and II despite a stutter in the growth
rate in September 2011, as reflected by the correction in
Net Asset Value (NAV) subsequent to significant growth
in the preceding month. The NAV correction largely
affected discretionary funds, fixed-income funds and
equity funds in line with their underlying investments, for
which the indicators of risk or volatility spiked in August
and September 2011.
Several indicators of mutual fund performance
followed an upward trend during the reporting
period. The number of mutual funds available in semester
II-2011 expanded slightly from 632 (June 2011) to 646
(December 2011). The NAV of mutual funds increased
by 5.34% to Rp157 trillion in semester I-2011 and by
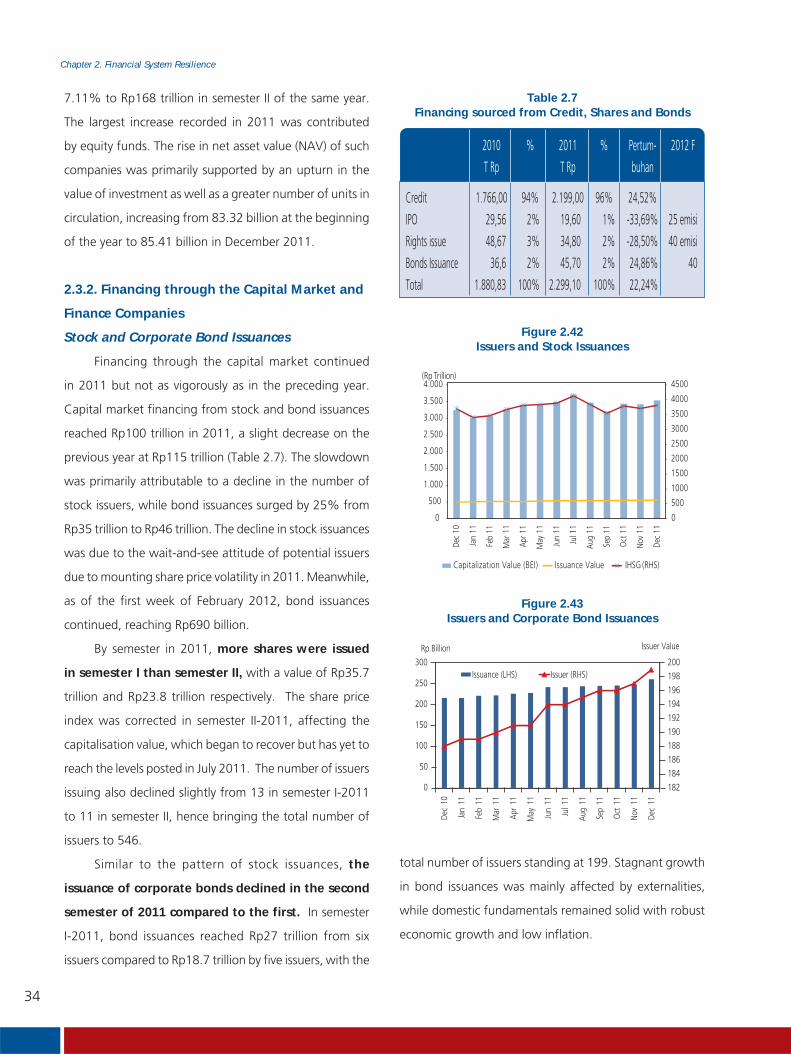
34
Chapter 2. Financial System Resilience
7.11% to Rp168 trillion in semester II of the same year.
The largest increase recorded in 2011 was contributed
by equity funds. The rise in net asset value (NAV) of such
companies was primarily supported by an upturn in the
value of investment as well as a greater number of units in
circulation, increasing from 83.32 billion at the beginning
of the year to 85.41 billion in December 2011.
2.3.2. Financing through the Capital Market and
Finance Companies
Stock and Corporate Bond Issuances
Financing through the capital market continued
in 2011 but not as vigorously as in the preceding year.
Capital market financing from stock and bond issuances
reached Rp100 trillion in 2011, a slight decrease on the
previous year at Rp115 trillion (Table 2.7). The slowdown
was primarily attributable to a decline in the number of
stock issuers, while bond issuances surged by 25% from
Rp35 trillion to Rp46 trillion. The decline in stock issuances
was due to the wait-and-see attitude of potential issuers
due to mounting share price volatility in 2011. Meanwhile,
as of the first week of February 2012, bond issuances
continued, reaching Rp690 billion.
By semester in 2011, more shares were issued
in semester I than semester II, with a value of Rp35.7
trillion and Rp23.8 trillion respectively. The share price
index was corrected in semester II-2011, affecting the
capitalisation value, which began to recover but has yet to
reach the levels posted in July 2011. The number of issuers
issuing also declined slightly from 13 in semester I-2011
to 11 in semester II, hence bringing the total number of
issuers to 546.
Similar to the pattern of stock issuances, the
issuance of corporate bonds declined in the second
semester of 2011 compared to the first. In semester
I-2011, bond issuances reached Rp27 trillion from six
issuers compared to Rp18.7 trillion by five issuers, with the
Table 2.7Financing sourced from Credit, Shares and Bonds
2010 % 2011 % Pertum- 2012 F
T Rp T Rp buhan
Credit 1.766,00 94% 2.199,00 96% 24,52%
IPO 29,56 2% 19,60 1% -33,69% 25 emisi
Rights issue 48,67 3% 34,80 2% -28,50% 40 emisi
Bonds Issuance 36,6 2% 45,70 2% 24,86% 40
Total 1.880,83 100% 2.299,10 100% 22,24%
0
500
1000
1500
2000
2500
3000
3500
4000
4500
0
500
1.000
1.500
2.000
2.500
3.000
3.500
4.000
Dec
10
Jan
11
Feb
11
Mar
11
Apr1
1
May
11
Jun
11
Jul1
1
Aug
11
Sep
11
Oct
11
Nov
11
Dec
11
(Rp Trillion)
Capitalization Value (BEI) Issuance Value IHSG (RHS)
Figure 2.42Issuers and Stock Issuances
182
184
186
188
190
192
194
196
198
200
0
50
100
150
200
250
300
Dec
10
Jan
11
Feb
11
Mar
11
Apr
11
May
11
Jun
11
Jul1
1
Aug
11
Sep
11
Oct
11
Nov
11
Dec
11Issuer ValueRp Billion
Issuance (LHS) Issuer (RHS)
Figure 2.43Issuers and Corporate Bond Issuances
total number of issuers standing at 199. Stagnant growth
in bond issuances was mainly affected by externalities,
while domestic fundamentals remained solid with robust
economic growth and low inflation.
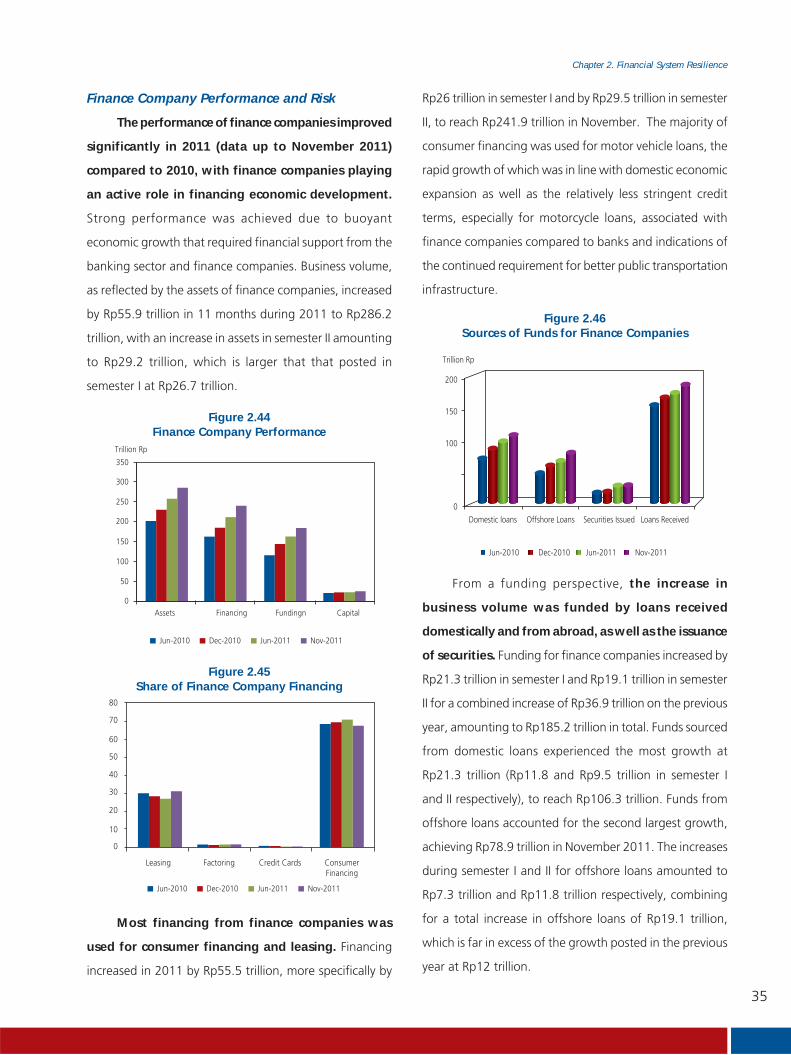
35
Chapter 2. Financial System Resilience
Finance Company Performance and Risk
The performance of finance companies improved
significantly in 2011 (data up to November 2011)
compared to 2010, with finance companies playing
an active role in financing economic development.
Strong performance was achieved due to buoyant
economic growth that required financial support from the
banking sector and finance companies. Business volume,
as reflected by the assets of finance companies, increased
by Rp55.9 trillion in 11 months during 2011 to Rp286.2
trillion, with an increase in assets in semester II amounting
to Rp29.2 trillion, which is larger that that posted in
semester I at Rp26.7 trillion.
350
Trillion Rp
Assets Financing Fundingn Capital
300
250
200
150
100
50
0
Jun-2010 Dec-2010 Jun-2011 Nov-2011
Figure 2.44Finance Company Performance
Figure 2.45Share of Finance Company Financing
80
70
60
50
40
30
20
10
Leasing Factoring Credit Cards ConsumerFinancing
0
Jun-2010 Dec-2010 Jun-2011 Nov-2011
200
Trillion Rp
150
100
0
Offshore LoansDomestic loans Loans ReceivedSecurities Issued
Jun-2010 Dec-2010 Jun-2011 Nov-2011
Figure 2.46Sources of Funds for Finance Companies
Rp26 trillion in semester I and by Rp29.5 trillion in semester
II, to reach Rp241.9 trillion in November. The majority of
consumer financing was used for motor vehicle loans, the
rapid growth of which was in line with domestic economic
expansion as well as the relatively less stringent credit
terms, especially for motorcycle loans, associated with
finance companies compared to banks and indications of
the continued requirement for better public transportation
infrastructure.
From a funding perspective, the increase in
business volume was funded by loans received
domestically and from abroad, as well as the issuance
of securities. Funding for finance companies increased by
Rp21.3 trillion in semester I and Rp19.1 trillion in semester
II for a combined increase of Rp36.9 trillion on the previous
year, amounting to Rp185.2 trillion in total. Funds sourced
from domestic loans experienced the most growth at
Rp21.3 trillion (Rp11.8 and Rp9.5 trillion in semester I
and II respectively), to reach Rp106.3 trillion. Funds from
offshore loans accounted for the second largest growth,
achieving Rp78.9 trillion in November 2011. The increases
during semester I and II for offshore loans amounted to
Rp7.3 trillion and Rp11.8 trillion respectively, combining
for a total increase in offshore loans of Rp19.1 trillion,
which is far in excess of the growth posted in the previous
year at Rp12 trillion.
Most financing from finance companies was
used for consumer financing and leasing. Financing
increased in 2011 by Rp55.5 trillion, more specifically by

36
Chapter 2. Financial System Resilience
Table 2.8Financial Indicators of Finance Companies
Billion Rp Dec-10 June-11 Nov-11
Assets 230.301 259.548 286.226Liabilities 182.470 211.019 231.888 o/w Debt 163.701 192.183 213.899Capital 47.831 48.529 51.162Profit Before Tax 11.563 5.932 10.812Profit After Tax 8.929 4.727 8.491
%
ROA 0,05 0,02 0,04ROE 0,24 0,12 0,21BOPO 0,74 0,79 0,78Debt/Equity 3,42 4,35 4,53Obligations/Equity 3,81 4,35 4,53
Table 2.9NPL by Type of Finance
NPL (Billion Rp) Dec-10 Jun-11 Nov-11
Leasing 351 261 297Factoring 73 78 119Credit Cards 44 38 0Consumer Financing 2.189 2.469 2.701Total Financing 2.658 2.846 3.117
% NPL Dec-10 Jun-11 Nov-11
Leasing 0,63% 0,43% 0,38%Factoring 3,07% 2,51% 3,37%Credit Cards 4,62% 4,06% 3,03%Consumer Financing 1,63% 1,59% 1,61%Total Financing 1,37% 1,29% 1,25%
Insurance Company Performance and Risk
Robust expansion in 2009 endured into 2010.
In harmony with ongoing economic expansion and
the development of financial services, 138 insurance
companies operated specialising in life insurance (46
companies), general insurance (87) and social insurance
(5) in December 2010. Of those 138 insurance companies,
11 were public listed with assets topping Rp21.65 trillion,
which is up 18 % on the position in December of the
previous year at Rp18.27 trillion. Two large insurance
companies dominated the 11 public listed companies with
an 81% market share.
Investment risk from the assets of the 11 public
listed companies was linked to share and bond price
volatility. The investment asset composition of insurance
companies was dominated by shares (54%), term deposits
(18%) and bonds (14%). The impact on insurance
company investment of share price volatility risk must be
monitored due to the large portion of investment assets
as well as unstable financial markets due to the unresolved
debt crisis in the euro zone.
The inherent risks associated with finance company
financing were controlled at a low level, as reflected by a
low NPL ratio and relatively stable financial indicators. Non-
performing loans from finance companies were maintained
below 1.4%, although the method used to calculate NPL
is different to that used for banks. The low NPL ratio was
also attributable to the increased level of collateral held by
finance companies, the majority of which was consumer
financing, in particular motor vehicle loans that are easy
to seek approval for and liquidate if the loan becomes
doubtful or a loss. In terms of the type of finance, the NPL
ratio for factoring and credit cards was above average.
Meanwhile, amid persistent business expansion, financial
indicators for finance companies remained sound.
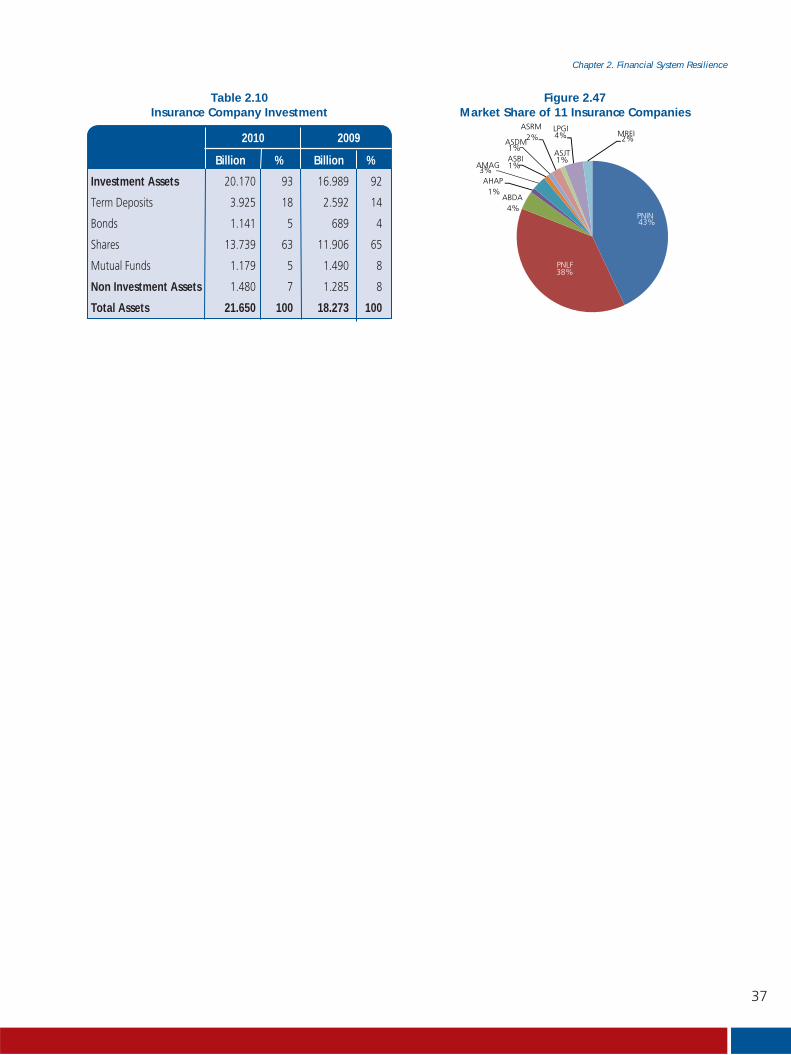
37
Chapter 2. Financial System Resilience
PNIN43%
PNLF38%
ABDA4%
AHAP1%
AMAG3%
ASBI1%
ASDM1%
ASRM2%
ASJT1%
LPGI4% MREI
2%
Figure 2.47Market Share of 11 Insurance Companies
Table 2.10Insurance Company Investment
2010 2009
Billion % Billion %
Investment Assets 20.170 93 16.989 92
Term Deposits 3.925 18 2.592 14
Bonds 1.141 5 689 4
Shares 13.739 63 11.906 65
Mutual Funds 1.179 5 1.490 8
Non Investment Assets 1.480 7 1.285 8
Total Assets 21.650 100 18.273 100

38
Chapter 2. Financial System Resilience
Firmly positioned as an emerging market
country in Asia, the role of the Indonesian economy
started to become significant in the region with
Indonesia one of the few countries that maintained
stable economic growth amid the global economic
downturn. Improvements in a number of national
economic indicators demonstrated that the condition
of the domestic financial system was resilient enough
to absorb the economic turbulence in Europe and the
US over the past several years. Despite a minor spillover
effect from the global turmoil on domestic financial
markets, particularly the stock and bond markets, the
effect on the real sector was minimal.
The prospects of the Indonesian economy and
its ability to absorb global pressures led to an upgrade
in Indonesia’s sovereign rating. Two international
rating agencies, namely Fitch and Moody’s, affirmed
Indonesia’s Investment Grade status and upgraded
their corresponding sovereign rating. The upgraded
rating provides Indonesia with greater momentum to
attract foreign investment into the country and also
strengthens the monitoring mechanisms for capital
and foreign investment flowing in and out of the
economy.
Domestically, economic resilience accompanied
by stable public purchasing power due to rising
incomes and a demographic dominated by productive-
aged citizens, helped ensure the sustainability of retail
production in line with growing public consumption.
This paints a sound picture for potential investors that
the domestic economy will continue to expand even in
the midst of a global economic slowdown.
Impact of upgraded Sovereign Rating on
Financial Market
An upgraded credit rating certainly affects the
perception of investment risk as well as the magnitude
of risk premium when conducting international financial
transactions. As the rating improves it indirectly lowers
the risk premium on financial transactions. Consequently,
the cost of international financial transactions to Indonesia
becomes more efficient and simpler to process. In addition,
assuming that other economic fundamentals also improve
and infrastructure is conducive, then the potential for a
deluge of short, medium and long-term foreign investment
increases. The process of foreign funds gradually flowing into
the country through financial market instruments improves
with financial product diversification of various tenors.
The flow of foreign funds to Indonesia is linked to
the regional flow of capital, which itself is the result of
global investment flowing around pressures emanating
from the protracted debt crisis in Europe. Flows of foreign
funds to Indonesia began to evaporate in the middle of
2011, which also affected financial markets in the region.
Notwithstanding, the domestic policy mix applied to manage
foreign capital flows and bank liquidity through a measured
exchange rate and interest rate policy response, coupled
with macroprudential policy and enhanced infrastructure for
domestic financial transactions provoked a positive response
from domestic investors. The diverse array of policy measures
instituted by domestic authorities was effective in providing
ample room to reinforce the money market and capital
market in order to dampen external economic pressures.
An Upgraded Sovereign Rating and Financial System Stability

39
Chapter 2. Financial System Resilience
into the economy, including foreign direct investment
(FDI). Furthermore, long-term investment flowing into
Indonesia is expected to reduce the potential for a
sudden capital reversal while indirectly helping maintain
domestic financial system stability.
Risk Prudence
Other aspects of risk required close monitoring to
ensure comparative advantage in terms of investment
transaction efficiency. The potential for criminality in
financial transactions as well as moral hazard required
special attention. To this end, intermediation and
arbitration was prioritised along with strengthening
legal aspects in order to ensure the ease of investing
in Indonesia, which will stimulate positive sentiment
regarding longer-term portfolio investment in the
domestic economy. In addition, market risk, liquidity
risk and credit risk are all used as the basis for
calculating risk, without ignoring other forms of risk.
Therefore, a broad source of capital flows through a
diverse investor base is expected to catalyse the real
sector and stimulate domestic GDP growth.
Building on what has already been discussed, an
improvement in the investment rating not only lowers
the cost of investment but also minimises the potential
risk linked to investments in speculative financial
instruments. Furthermore, a diverse investor base will
raise market expectations, thereby augmenting the
quality of capital inflows.
Coordination and cooperation between the
respective financial authorities is a prerequisite to
investment-based policy synchronisation and an
integrated potential risk mitigation process, which
aims to buoy the national economy and exploit the
momentum gained from the upgraded sovereign rating
in order to create a better investment regime.
An easing of sovereign risk as a result of an
upgraded rating is further evidenced by the narrower
spread on several financial instruments, including a
number of derivatives. Taking into consideration the
natural market forces of supply and demand, a lower
perception of sovereign risk will encourage a narrower
pricing interval/spread on financial instruments. In
addition, a simpler transaction process together with
a simpler fund transfer procedure from the financial
market in one country to that in another country,
including a shift in capital flows on financial markets
all serve to reduce the cost of investment. Therefore,
it is expected that the growing ease of investing
in Indonesia will act as an additional incentive for
foreign investors to broaden the types of investment
-60,00
-50,00
-40,00
-30,00
-20,00
-10,00
0,00
10,00
20,00
30,00
40,00
Semester 12011 Semester 2 2011 Jan-12
SBI SBN Stock
Figure Box 2.1.2Inflows of Foreign Ownership to the Indonesian
Financial Market
SBI SBN Stock
Figure Box 2.1.1Share of Foreign Ownership in January 2012

This page intentionally blank

41
Chapter 3. Challenges and Prospects of Financial System Stability
Chapter 3Challenges and Prospects ofFinancial System Stability

42
Chapter 3. Challenges and Prospects of Financial System Stability
This page intentionally blank

43
Chapter 3. Challenges and Prospects of Financial System Stability
3.1 THREAT OF GLOBAL ECONOMIC SLOWDOWN
ON INDONESIAN ECONOMY
The global economy has been confronting
numerous challenges especially relating to large
public debt, significant budget deficits and interest
rates that are trending towards zero. In its latest
edition, the World Economic Outlook (WEO) was most
critical of the deteriorating conditions in the euro zone.
Furthermore, through its WEO published on 24th January
2012, the IMF announced that in order to overcome the
issues in Europe there are thee recovery requirements
as follows: more gradual and therefore sustainable
adjustments; providing adequate liquidity and easy
monetary policy; and enhancing policymaking credibility.
The policy measures taken to overcome
the crisis in the euro area remained suboptimal.
Multilateral institutions like the IMF revised down their
initial predictions of global economic growth to 3.3%,
down by 0.75% from the estimate published in September
2011. The revisions to previous growth projections were
triggered by an increase in the yield on government
bonds, the impact of bank deleveraging on the economy
as well as fiscal consolidation by governments in the euro
zone. Meanwhile, economic growth in other developed
countries was also predicted to slow as a result of spillover
from neighbouring countries through the trade sector and
financial sector, which will continue to deteriorate.
In addition to developed countries, the IMF also
predicts a slowdown in emerging market countries like
China and India. A downturn in these two powerhouses
would be the result of a decline in exports to Japan, the
United States and Europe. On the other hand, economic
growth projections for ASEAN-5 member countries are
optimistic with higher growth projected compared to
2011. Despite a decline in exports from these developing
countries, an influx of foreign capital in the form of
foreign direct investment coupled with strong domestic
consumption will drive economic growth to a more
optimistic level. Widespread global optimism surrounding
the economy of Indonesia is illustrated by such growth
predictions, where the domestic economy is projected to
expand by 6.6%, which is even higher that that projected
for Thailand and the Philippines.
Positive expectations for the Indonesian
economy have the potential to provoke a torrent
of foreign capital in the form of direct and indirect
investment. This is even more likely when considering the
conditions in other countries still struggling to overcome
the crises. Figure 3.1 illustrates private direct foreign capital
flows into developing countries, which have surged in
recent years since 2003 despite a brief decline in 2007 but
then rebounding post-crisis in 2009. Private capital flows
followed a similar trend with a significant upswing after
the global crisis in 2008.
Chapter 3 Challenges and Prospects of Financial
System Stability
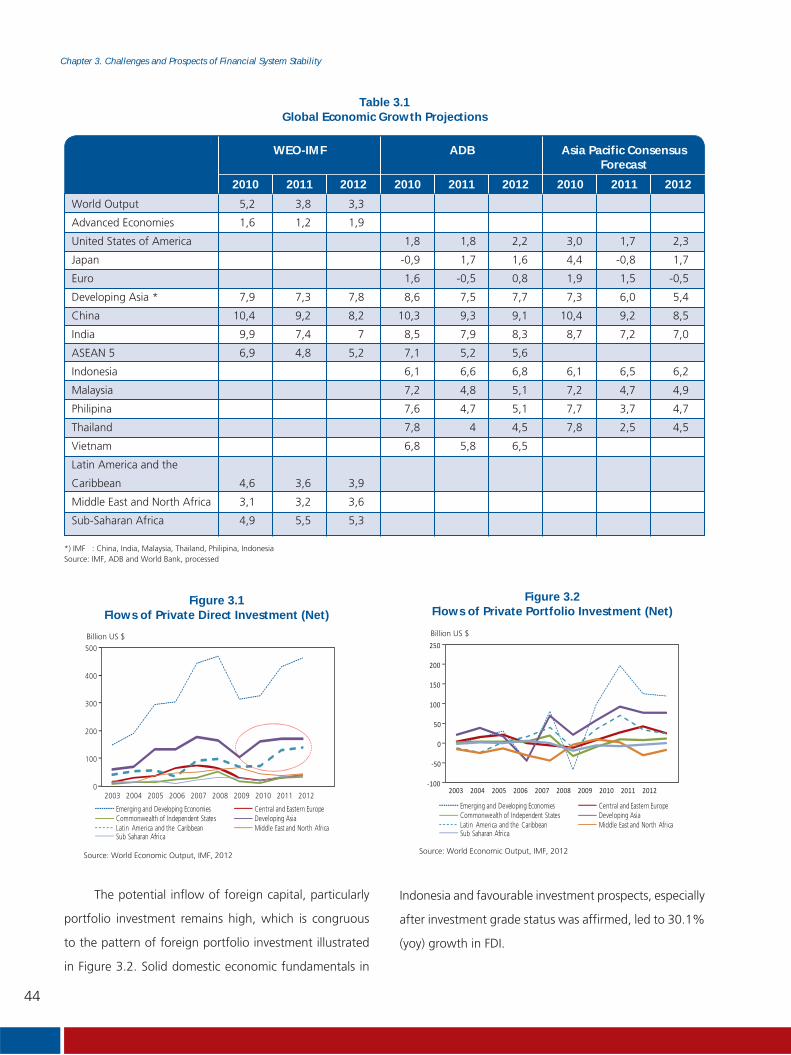
44
Chapter 3. Challenges and Prospects of Financial System Stability
Source: World Economic Output, IMF, 2012
Figure 3.1Flows of Private Direct Investment (Net)
Source: World Economic Output, IMF, 2012
Figure 3.2Flows of Private Portfolio Investment (Net)
*) IMF : China, India, Malaysia, Thailand, Philipina, IndonesiaSource: IMF, ADB and World Bank, processed
ADBWEO-IMF
2010 2010 20102011 2011 20112012 2012 2012
Asia Pacific Consensus Forecast
Table 3.1Global Economic Growth Projections
World Output 5,2 3,8 3,3
Advanced Economies 1,6 1,2 1,9
United States of America 1,8 1,8 2,2 3,0 1,7 2,3
Japan -0,9 1,7 1,6 4,4 -0,8 1,7
Euro 1,6 -0,5 0,8 1,9 1,5 -0,5
Developing Asia * 7,9 7,3 7,8 8,6 7,5 7,7 7,3 6,0 5,4
China 10,4 9,2 8,2 10,3 9,3 9,1 10,4 9,2 8,5
India 9,9 7,4 7 8,5 7,9 8,3 8,7 7,2 7,0
ASEAN 5 6,9 4,8 5,2 7,1 5,2 5,6
Indonesia 6,1 6,6 6,8 6,1 6,5 6,2
Malaysia 7,2 4,8 5,1 7,2 4,7 4,9
Philipina 7,6 4,7 5,1 7,7 3,7 4,7
Thailand 7,8 4 4,5 7,8 2,5 4,5
Vietnam 6,8 5,8 6,5
Latin America and the
Caribbean 4,6 3,6 3,9
Middle East and North Africa 3,1 3,2 3,6
Sub-Saharan Africa 4,9 5,5 5,3
Billion US $
0
100
200
300
400
500
2003 2004 2005 2006 2007 2008 2009 2010 2011 2012
Emerging and Developing Economies Central and Eastern EuropeCommonwealth of Independent States Developing AsiaLatin America and the Caribbean Middle East and North AfricaSub Saharan Africa
Billion US $
Emerging and Developing Economies Central and Eastern EuropeCommonwealth of Independent States Developing AsiaLatin America and the Caribbean Middle East and North AfricaSub Saharan Africa
-100
-50
0
50
100
150
200
250
2003 2004 2005 2006 2007 2008 2009 2010 2011 2012
The potential inflow of foreign capital, particularly
portfolio investment remains high, which is congruous
to the pattern of foreign portfolio investment illustrated
in Figure 3.2. Solid domestic economic fundamentals in
Indonesia and favourable investment prospects, especially
after investment grade status was affirmed, led to 30.1%
(yoy) growth in FDI.

45
Chapter 3. Challenges and Prospects of Financial System Stability
In addition is the threat of a soaring oil price
that continues to trend in excess of USD 100/
barrel and which is currently USD 118/barrel. The
skyrocketing price of oil directly affects the burden of
fuel subsidies borne by the government and has the
potential to raise domestic fuel prices. Past experience
has provided a number of valuable lessons, including that
soaring international oil pricesinfluence inflation and in
turn affect the NPL ratio of bank loans. Any deterioration
in NPL requires vigilance because it can undermine overall
financial system stability.
A number of threats from the domestic
economy remained on top on the external challenges
faced. Internal sources of vulnerability loomed until the
end of 2011, including short-term capital flow volatility,
corporate and household debt pressures, rapid credit
growth, particularly consumption credit and inefficient
banking conditions. However, the range of policy measures
and efforts taken by Bank Indonesia and the banking
community were successful in supressing credit risk and
market risk in the financial system.
Another vulnerability with the potential
to exacerbate credit risk was fuel price hikes.
Implementation of Government Regulation No. 15, 2012,
which controls retail prices and private consumption of
certain types of fuel, will affect credit growth targets
and compound bank credit risk. Research conducted
by Bank Indonesia showed that if fuel prices are raised,
then economic growth targets will face corrections and
credit growth will drop by 0.46% within three quarters
(predominantly investment credit) and NPL will increase by
0.14% in one quarter, with the largest increase affecting
working capital credit.
Source: Indonesian Financial Statistics, Bank Indonesia, processed
Figure 3.3Composition of Foreign Capital Inflows to Indonesia
Source: Indonesian Financial Statistics, Bank Indonesia, processed
Figure 3.4Composition of Foreign Capital Inflows to Indonesia
From the perspective of portfolio investment,
uncertainty over resolution of the euro debt crisis along
with a slowdown in the US recovery process precipitated
a USD 4.3 billion deficit in public portfolio investment up
to quarter III-2011. The deficit was principally blamed
on foreign capital outflow from the SUN market and
widespread non-resident ownership of SBI reaching
maturity. Such conditions confirmed the very real threat
of a sudden capital reversal. In just a brief moment of
around three months the surplus capital flows evaporated
to become a deficit. Therefore, policy measures to balance
macroeconomic conditions are vital in the upcoming
periods.
0
25
50
75
100Percent
Q1
Q2
Q3
Q4
Q1
Q2
Q3
Q4
Q1
Q2
Q3
Q4
Q1
Q2
Q3
Q4
Q1
Q2
Q3
Q4
Q1*
Q2*
Q3*
Q4*
*
2006 2007 2008 2009 2010 2011
FDI PI OI
(10,000)
(5,000)
-
5,000
10,000
15,000
6000
4000
-
-
-2000
0
2000
4000
6000
8000
Q1 Q3 Q1 Q3 Q1 Q3 Q1 Q3 Q1 Q3 Q1* Q3*2006 2007 2008 2009 2010 2011
FDI PI Other Investment Financial Account

46
Chapter 3. Challenges and Prospects of Financial System Stability
Despite the range of internal and external pressures,
the economy of Indonesia is still expected to expand at
a level of 6.63% with the possibility of a correction in
accordance with policy relating to fuel prices.
an assessment in to the long-term trend of credit growth
showed that credit would continue to grow exponentially,
even exceeding actual conditions. Credit growth that has
already surpassed its historical average requires vigilance
in order to avoid another crisis.
2012*2010 2011
GDP (%, yoy) 6.1% 6.3% 6.32% (baseline)
Adjustment:
6.26% (Fuel limitation)
6.09% (Fuel price increase)
Inflation
(%, end period) 6.96% 3.9% 4.33%
Adjustment:
5.08% (Fuel limitation)
6.32% (Fuel price increase)
Table 3.3Projected GDP and Inflation
*) Bank Indonesia projected values
Type
Lag LagDec 2011 Dec 2011Scenario: Decline in GDP from 6.5% to 6.3%
Fuel Price Increases Fuel Price Increases
% Credit (Y-o-Y) % NPL
Table 3.2Simulation of Easing Fuel Subsidies
Investment Credit 3 33,20 -0,46 1 2,17 0,06
Working Capital Credit 1 21,38 -0,27 1 2,65 0,14
Consumption Credit 3 24,07 -0,20 1 1,52 0,04
Total Credit 4 24,53 -0,42 1 2,17 0,08
*) Assume there are increasing price in Electricity Tariff and Fuel (rise for Rp1.500/liter and Rp2.000/liter)
Source: World Bank, 2011
Figure 3.5Ratio of Credit to GDP in Indonesia, Malaysia, the
Philippines and Thailand
-
50.00
100.00
150.00
200.00
250.00
300.00
350.00
1999 2000 2001 2002 2003 2004 2005 2006 2007 2008 2009 2010
Indonesia Malaysia Philippines Thailand
Source: Monthly bank reports
Figure 3.6Long-Term Trend of Credit to GDP
-20
-10
0
10
20
30
40
2001
M09
2002
M02
2002
M07
2002
M12
2003
M05
2003
M10
2004
M03
2004
M08
2005
M01
2005
M06
2005
M11
2006
M04
2006
M09
2007
M02
2007
M07
2007
M12
2008
M05
2008
M10
2009
M03
2009
M08
2010
M01
2010
M06
2010
M11
2011
M04
2011
M09
Credit Growth Credit Cycle Trend
Another challenge is to raise credit quality
under a framework of bank intermediation. The role
of the banking sector in the national economy is already
optimal despite a lower ratio of credit to GDP than that
found in other ASEAN member countries. The low ratio of
credit to GDP indicates that the business sector in Indonesia
does not merely rely on funds sourced from banks alone,
but also from other sources like bonds, internal funds and
so forth. In addition, greater flows of FDI are also a source
of funds for investment and a source of funds for domestic
entrepreneurs in the production process. The results of
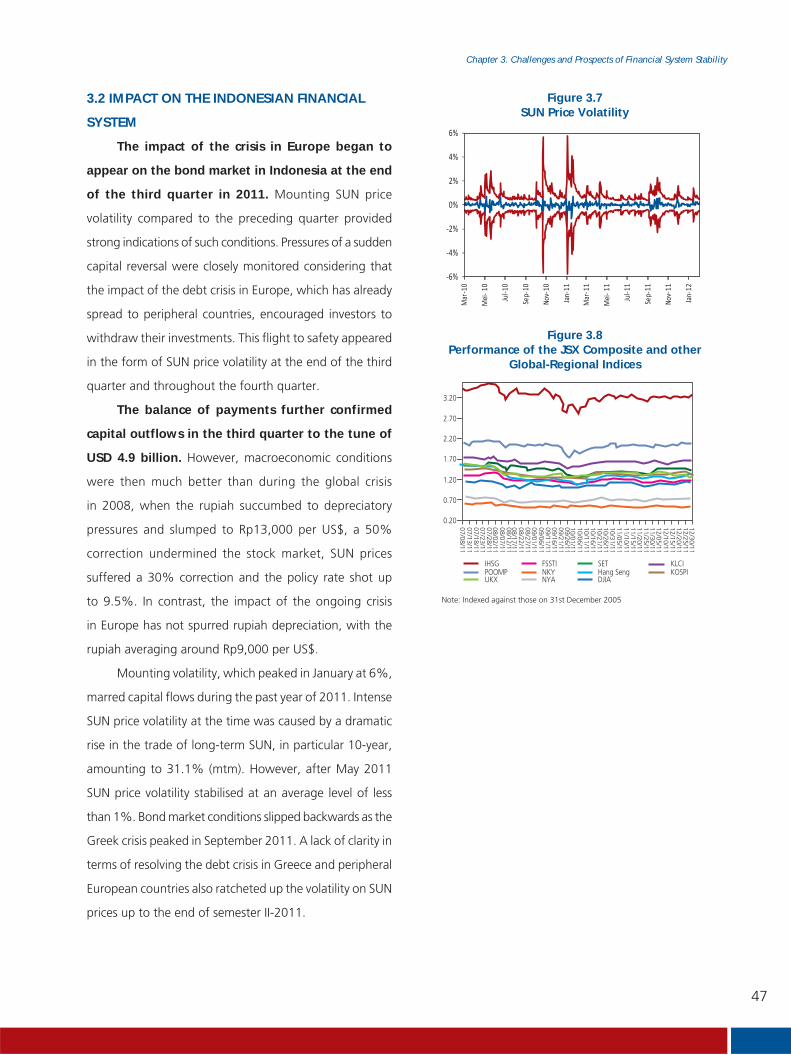
47
Chapter 3. Challenges and Prospects of Financial System Stability
3.2 IMPACT ON THE INDONESIAN FINANCIAL
SYSTEM
The impact of the crisis in Europe began to
appear on the bond market in Indonesia at the end
of the third quarter in 2011. Mounting SUN price
volatility compared to the preceding quarter provided
strong indications of such conditions. Pressures of a sudden
capital reversal were closely monitored considering that
the impact of the debt crisis in Europe, which has already
spread to peripheral countries, encouraged investors to
withdraw their investments. This flight to safety appeared
in the form of SUN price volatility at the end of the third
quarter and throughout the fourth quarter.
The balance of payments further confirmed
capital outflows in the third quarter to the tune of
USD 4.9 billion. However, macroeconomic conditions
were then much better than during the global crisis
in 2008, when the rupiah succumbed to depreciatory
pressures and slumped to Rp13,000 per US$, a 50%
correction undermined the stock market, SUN prices
suffered a 30% correction and the policy rate shot up
to 9.5%. In contrast, the impact of the ongoing crisis
in Europe has not spurred rupiah depreciation, with the
rupiah averaging around Rp9,000 per US$.
Mounting volatility, which peaked in January at 6%,
marred capital flows during the past year of 2011. Intense
SUN price volatility at the time was caused by a dramatic
rise in the trade of long-term SUN, in particular 10-year,
amounting to 31.1% (mtm). However, after May 2011
SUN price volatility stabilised at an average level of less
than 1%. Bond market conditions slipped backwards as the
Greek crisis peaked in September 2011. A lack of clarity in
terms of resolving the debt crisis in Greece and peripheral
European countries also ratcheted up the volatility on SUN
prices up to the end of semester II-2011.
Figure 3.7SUN Price Volatility
-6%
-4%
-2%
0%
2%
4%
6%
Mar
-10
Mei
-10
Jul-1
0
Sep-
10
Nov-
10
Jan-
11
Mar
-11
Mei
-11
Jul-1
1
Sep-
11
Nov-
11
Jan-
12
Note: Indexed against those on 31st December 2005
Figure 3.8Performance of the JSX Composite and other
Global-Regional Indices
0.20
0.70
1.20
1.70
2.20
2.70
3.20
07/08/1107/13/1107/18/1107/23/1107/28/1108/02/1108/07/1108/12/1108/17/1108/22/1108/27/1109/01/1109/06/1109/11/1109/16/1109/21/1109/26/11
10/31/11
10/01/1110/06/1110/11/1110/16/1110/21/1110/26/11
11/05/1111/10/1111/15/1111/20/1111/25/1111/30/1112/05/1112/10/1112/15/1112/20/1112/25/1112/30/11
IHSGPOOMP
FSSTI
UKXNKY
DJIANYA
KLCIKOSPI
SETHang Seng

48
Chapter 3. Challenges and Prospects of Financial System Stability
3.3 IMPACT ON THE BANKING SECTOR
The banking sector continued to dominate
the financial system in Indonesia. In general, bank
resilience was reflected by changes in CAR to absorb
exposure to the external sector in the form of
foreign banks. Low bank exposure, with a contribution
of just 3.56% of total bank assets at the end of semester
I-2012, ensured that the impact of shocks overseas did
not significantly affect bank capital domestically. In broad
terms, direct exposure to foreign banks was found in the
form of securities, placements at other banks, acceptances,
bank guarantees and irrevocable L/C. At the end of 2011,
direct exposure to foreign banks was valued at Rp129.95
trillion, representing an increase of 24.16%.
According to the results of stress tests, bank resilience
was more than adequate, with merely a small decline in the
level of CAR, to absorb market risk stemming from a drop
in SUN prices, rupiah depreciation and rising interest rates.
Meanwhile, bank resilience to domestic pressures like fuel
price hikes, which have ramifications for economic growth
and will indeed intensify bank credit risk, is sufficient
according to stress tests. Domestic economic growth is
suspected of having a significant influence over bank credit
risk. The results of simulated fuel price hikes amounting to
Rp1,500 per litre would raise credit risk as evidenced by
the 0.25% increase in non-performing loans.
1 2 3 4 5 6 7 8 9 10 11 12 13 14 15 16 17 18 19 20 21 22
1, Indonesia 1,00 0,59 0,45 0,47 0,48 0,38 0,26 0,45 0,47 0,13 0,15 0,31 0,47 0,28 0,57 0,31 0,27 0,29 0,30 0,27 0,32 0,31
2. Singapore 1,00 0,55 0,50 0,52 0,36 0,28 0,56 0,58 0,20 0,23 0,43 0,59 0,41 0,70 0,41 0,39 0,43 0,41 0,39 0,45 0,41
3. Taiwan 1,00 0,38 0,45 0,37 0,30 0,56 0,64 0,12 0,15 0,27 0,55 0,26 0,58 0,27 0,23 0,27 0,28 0,23 0,28 0,27
4. Thailand 1,00 0,41 0,32 0,21 0,37 0,40 0,14 0,16 0,31 0,38 0,30 0,48 0,27 0,28 0,31 0,32 0,30 0,32 0,30
5. Malaysia 1,00 0,41 0,26 0,42 0,44 0,11 0,12 0,28 0,44 0,26 0,48 0,26 0,28 0,28 0,31 0,26 0,29 0,28
6. Philippines 1,00 0,18 0,38 0,36 0,03 0,06 0,13 0,42 0,14 0,39 0,17 0,13 0,15 0,16 0,15 0,17 0,21
7. China 1,00 0,26 0,30 0,07 0,08 0,15 0,27 0,15 0,43 0,10 0,12 0,15 0,15 0,15 0,16 0,16
8. Japan 1,00 0,65 0,12 0,13 0,30 0,65 0,30 0,59 0,29 0,26 0,32 0,28 0,27 0,33 0,29
9. Korea 1,00 0,17 0,19 0,31 0,60 0,31 0,63 0,30 0,26 0,31 0,30 0,28 0,33 0,32
10. Dow Jones 1,00 0,90 0,58 0,13 0,61 0,17 0,44 0,56 0,61 0,40 0,57 0,55 0,29
11. Nasdaq 1,00 0,54 0,15 0,58 0,19 0,44 0,53 0,58 0,38 0,54 0,52 0,27
12. UK 1,00 0,33 0,86 0,38 0,70 0,82 0,89 0,66 0,82 0,81 0,50
13. Australia 1,00 0,30 0,63 0,31 0,29 0,32 0,32 0,29 0,33 0,32
14. German 1,00 0,35 0,69 0,86 0,94 0,66 0,87 0,83 0,51
15.Hongkong 1,00 0,34 0,33 0,37 0,36 0,33 0,39 0,38
16. Ireland 1,00 0,67 0,72 0,58 0,67 0,69 0,49
17. Spain 1,00 0,88 0,70 0,86 0,80 0,54
18. French 1,00 0,69 0,90 0,88 0,54
19. Portugal 1,00 0,68 0,68 0,51
20. Italy 1,00 0,82 0,54
21. Belgium 1,00 0,54
22. Greece 1,00
Table 3.4Stock Exchange Correlations
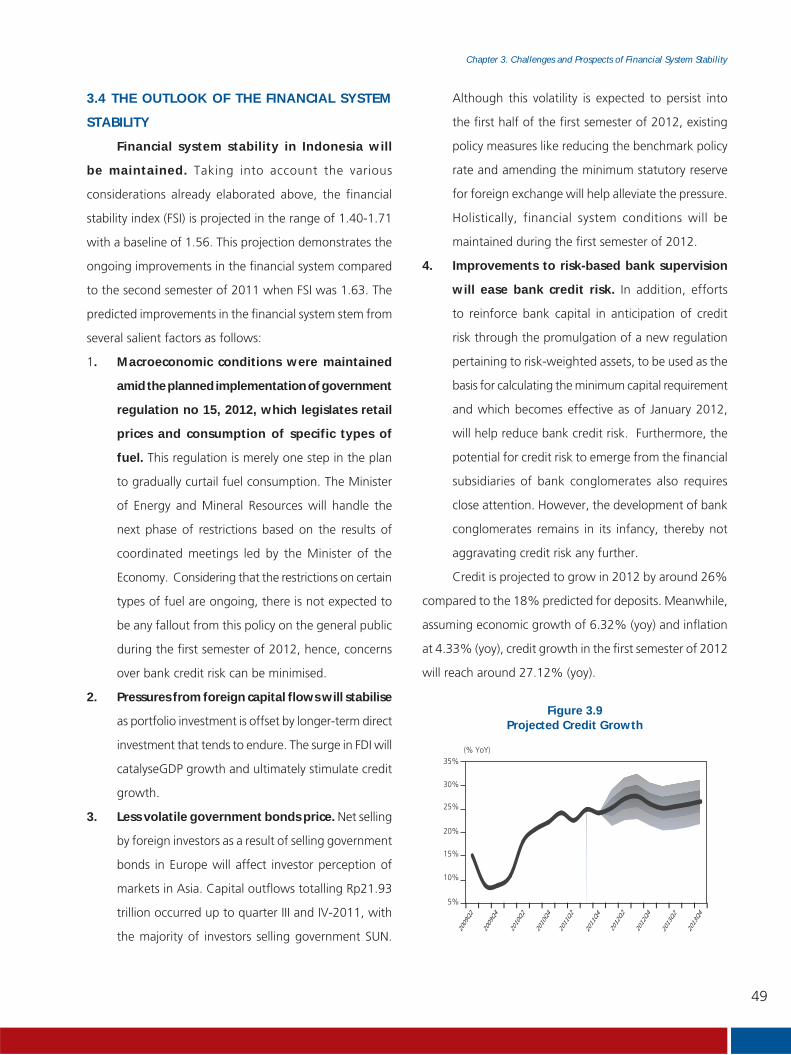
49
Chapter 3. Challenges and Prospects of Financial System Stability
Although this volatility is expected to persist into
the first half of the first semester of 2012, existing
policy measures like reducing the benchmark policy
rate and amending the minimum statutory reserve
for foreign exchange will help alleviate the pressure.
Holistically, financial system conditions will be
maintained during the first semester of 2012.
4. Improvements to risk-based bank supervision
will ease bank credit risk. In addition, efforts
to reinforce bank capital in anticipation of credit
risk through the promulgation of a new regulation
pertaining to risk-weighted assets, to be used as the
basis for calculating the minimum capital requirement
and which becomes effective as of January 2012,
will help reduce bank credit risk. Furthermore, the
potential for credit risk to emerge from the financial
subsidiaries of bank conglomerates also requires
close attention. However, the development of bank
conglomerates remains in its infancy, thereby not
aggravating credit risk any further.
Credit is projected to grow in 2012 by around 26%
compared to the 18% predicted for deposits. Meanwhile,
assuming economic growth of 6.32% (yoy) and inflation
at 4.33% (yoy), credit growth in the first semester of 2012
will reach around 27.12% (yoy).
3.4 THE OUTLOOK OF THE FINANCIAL SYSTEM
STABILITY
Financial system stability in Indonesia will
be maintained. Taking into account the various
considerations already elaborated above, the financial
stability index (FSI) is projected in the range of 1.40-1.71
with a baseline of 1.56. This projection demonstrates the
ongoing improvements in the financial system compared
to the second semester of 2011 when FSI was 1.63. The
predicted improvements in the financial system stem from
several salient factors as follows:
1. Macroeconomic conditions were maintained
amid the planned implementation of government
regulation no 15, 2012, which legislates retail
prices and consumption of specific types of
fuel. This regulation is merely one step in the plan
to gradually curtail fuel consumption. The Minister
of Energy and Mineral Resources will handle the
next phase of restrictions based on the results of
coordinated meetings led by the Minister of the
Economy. Considering that the restrictions on certain
types of fuel are ongoing, there is not expected to
be any fallout from this policy on the general public
during the first semester of 2012, hence, concerns
over bank credit risk can be minimised.
2. Pressures from foreign capital flows will stabilise
as portfolio investment is offset by longer-term direct
investment that tends to endure. The surge in FDI will
catalyseGDP growth and ultimately stimulate credit
growth.
3. Less volatile government bonds price. Net selling
by foreign investors as a result of selling government
bonds in Europe will affect investor perception of
markets in Asia. Capital outflows totalling Rp21.93
trillion occurred up to quarter III and IV-2011, with
the majority of investors selling government SUN. Sumber:
Figure 3.9Projected Credit Growth
30%
35%(% YoY)
25%
20%
15%
10%
5%

50
Chapter 3. Challenges and Prospects of Financial System Stability
Financial system resilience in Indonesia was
relatively well preserved, which is evidenced by the
decline in the Financial Stability Index (FSI) from
1.65 in June 2011 to 1.63 in December 2011. The
value of FSI in December 2011 was below the projected
figure of 1.68. Banking sector resilience and an easing of
pressures on the capital market are in harmony with solid
economic resilience overall in Indonesia. Such conditions
were corroborated by two international rating agencies
when Moody’s and Fitch upgraded Indonesia’s rating and
affirmed investment grade status amid widespread global
economic uncertainty.
Financial system stability will be maintained
throughout semester II-2012. FSI is projected in the
range of 1.40-1.71 with a baseline of 1.56. Conducive
macroeconomic conditions, denoted by controlled inflation
and relatively robust economic growth looking ahead, will
drive positive performance in the banking sector and on
the capital market. Indonesia’s upgraded sovereign rating
to investment grade status will contribute to an influx of
foreign funds in the form of foreign direct investment
and portfolio investment. Nonetheless, vigilance and
monitoring is required from Bank Indonesia and the
Government concerning a potential sudden capital reversal
and policy measures must be put in place to anticipate as
well as minimise potential instability risk in the future.
Vigilance is also required over a number of
externalities that could potentially undermine
financial system resilience, for instance the prolonged
global economic crisis could spillover to the Indonesian
economy, in particular through a direct impact on the
balance of payments that would ultimately aggravate
domestic economic growth and inflation. Within the
country itself, unpopular fuel price hikes and restrictions
on fuel consumption, planned for semester I-2012, will
also affect inflation and economic growth. Figure 3.11Financial Stability Index
Figure 3.10Projected Growth in Deposits (% yoy)
0,00
0,50
1,00
1,50
2,00
2,50
3,00
3,50
1996
M01
1996
M07
1997
M01
1997
M07
1998
M01
1998
M07
1999
M01
1999
M07
2000
M01
2000
M07
2001
M01
2001
M07
2002
M01
2002
M07
2003
M01
2003
M07
2004
M01
2004
M07
2005
M01
2005
M07
2006
M01
2006
M07
2007
M01
2007
M07
2008
M01
2008
M07
2009
M01
2009
M07
2010
M01
2010
M07
2011
M01
2011
M07
2012
M01
FSI 1996 - 2012
Global Crisis (Nov 2008): 2.43
1.71
1.40
Asia Financial Crisis1997/1998: 3.23
Mini Crisis 2005: 2.33
Des 2011: 1.63 Jun 2012 : 1.
(% YoY)
10
12
14
16
18
20
22
24
2009
Q2
2009
Q3
2009
Q4
2010
Q1
2010
Q2
2010
Q3
2010
Q4
2011
Q1
2011
Q2
2011
Q3
2011
Q4
2012
Q1
2012
Q2
2012
Q3
2012
Q4
2013
Q1
2013
Q2
2013
Q3
2013
Q4

51
Chapter 4. Topical Issues
Chapter 4Topical Issues

52
Chapter 4. Topical Issues
This page intentionally blank

53
Chapter 4. Topical Issues
Chapter 4 Topical Issues
4.1 STRESS TESTING THE IMPACT OF INTERNATIONAL
TRADE AND FOREIGN LOANS OF THE CORPORATION
ON BANKS
Stress Test 1: the impact of a decline in exports/
imports with PIIGS countries on the banking sector
in Indonesia
One mechanism that facilitates spillover from
the global crisis to the banking sector is through the
international trade channel (exports/imports), which can
also undermine the financial position of the corporate
sector as borrowers from the banks.
In relation to the ongoing crises in PIIGS countries
and the USA, the share of Indonesia’s trade with PIIGS is
relatively small at less than 5% of total domestic exports
and imports. The share of trade with the USA is relatively
larger at 10% of the total but this trend is in decline,
substituted by emerging market countries.
A serious problem could emerge if large domestic
conglomerates were reliant on PIIGS countries and the
USA for trade. Stress testing is performed involving lending
banks that transact (import/export) with PIIGS countries
and the USA in order to investigate the direct impact of
disruptions to trade with these countries on the banking
sector in Indonesia.
Exporters
Based on data from November 2011, there are 205
corporate exporters currently operating with loans from
domestic banks. The total amount of credit extended
to the 205 firms is Rp27 trillion, allocated by 75 banks.
Assuming that the majority of exports from these firms are
destined for the USA and PIIGS, it is fair to acknowledge
the dependence of such firms on these countries.
Using a scenario of deteriorating economic conditions
in the USA and PIIGS, the domestic corporate sector suffers
financial difficulties with 50% of the loans written off as a
loss. Based on stress tests, the aggregate average NPL of
the 75 banks exposed to the 205 exporters would increase
from 2.7% to 3.4%, while CAR would decline from 16.5%
to 15.9%. In addition, 11 smaller banks would see their
non-performing loans skyrocket to over 5% with one
bank experiencing a significant decline in CAR to below
the threshold of 8%.
Importers
Also based on data from November 2011, 40
importers are operating with loans from 35 domestic banks
for a total of Rp 38.9 trillion. Assuming that the importers
produce and trade goods, the majority of which have been
imported from the USA or PIIGS countries, there is a clear
dependence by importers on such countries.
Using a scenario of deteriorating economic conditions
in the USA and PIIGS, the domestic corporate sector suffers
financial difficulties with 50% of the loans written off as
a loss. According to stress tests, the average NPL ratio
would increase form 2.7% to 3.9%, while CAR would
drop from 16.4% to 15.4%. A further 11 banks, one of
which being a large bank, would experience an increase
in NPL to above 5% but no banks would suffer a decline
in CAR to below 8%.
54
Chapter 4. Topical Issues
Stress Test 2: the impact of corporate offshore
bank loans from PIIGS countries on the banking
sector in Indonesia
Spillover form the global crisis can also be transmitted
through the offshore loans channel. Although the
monitoring of private offshore loans has been an area of
focus for improvement since the onset of the modern era
of Bank Indonesia by overseeing flows of foreign exchange,
assessments into the possibility of a worst-case scenario are
continuously required through stress testing as no other
mechanism can gauge the depth of crisis conditions.
Consequently, stress testing is conducted to measure
the magnitude of the impact on the banking sector in
terms of liquidity, capital and non-performing loans if a
borrower (bank) is overly dependent on the USA and PIIGS
countries. A scenario of domestic banks with offshore loans
from the USA and PIIGS is used assuming that conditions
in the lending countries deteriorate with all loans written
off as loss (sudden death).
Two Scenarios of the Stress Tests
The first scenario measures the impact on domestic
bank liquidity if the corporate sector requests that the
banks convert the foreign debt into domestic loans. This
implies that domestic banks allocate additional credit to
such firms in order to service their foreign loans. In this
context the banking sector is confronted by a dilemma,
where in the event that the request to convert the loans
is not met, the corporate sector would have to resort to
using its own business funds to repay the outstanding
offshore loans, which would undermine business activity
and ultimately limit the affected firms’ domestic debt
repayment capacity.
On the other hand, the banking sector must also
maintain adequate liquidity (calculated by dividing liquid
assets by non-core deposits), for which the ideal value
is 100%. Ideally, banks would therefore only need to
use their excess liquidity when accepting the transfer.
Accordingly, banks would only be able to convert the
foreign debt if the process did not bring the ratio down
to below 100%.
The second scenario measures the impact on capital
and non-performing loans if domestic banks are unable
to convert the foreign debt into domestic bank loans and
bank credit to the corporate sector simultaneously matures.
Consequently, the corporate sector would have to utilise
internal funds to first repay its outstanding offshore loans
before subsequently paying off its domestic loans.
Based on the position in August 2011, as many
as 74 firms had outstanding foreign debt from the USA
and PIIGS countries totalling Rp29.3 trillion, with the US
accounting for 99.4% of the total. Furthermore, the 74
corporations were also indebted to domestic banks to the
tune of Rp12.03 trillion.
Results of the first Scenario – Impact on Bank
Liquidity
According to the first scenario 14 domestic banks
would not have sufficient liquidity to convert 50% of
the foreign debt into domestic loans. Similar results
are obtained when the worst-case scenario of 100% is
converted, only the magnitude is more severe. Under the
most probable scenario, namely that only loans maturing
in 2012 would be converted, all banks would be able
to absorb the foreign debt and convert it into domestic
loans.
Results of the Second Scenario – Impact on Bank
NPL and CAR
A second series of stress tests was conducted on
between 40 and 74 corporations, for whom financial
statements could be acquired. The assumption is that
the corporate sector would repay 50% and 100% of
its foreign debt and domestic loans respectively, where
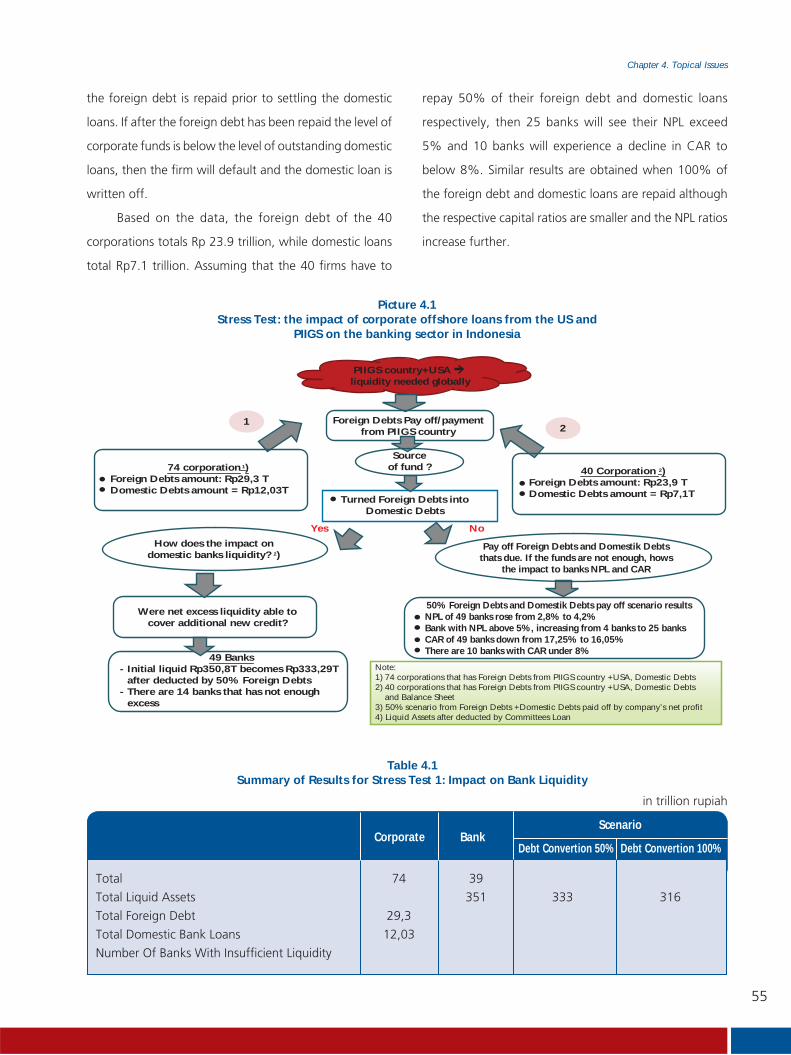
55
Chapter 4. Topical Issues
the foreign debt is repaid prior to settling the domestic
loans. If after the foreign debt has been repaid the level of
corporate funds is below the level of outstanding domestic
loans, then the firm will default and the domestic loan is
written off.
Based on the data, the foreign debt of the 40
corporations totals Rp 23.9 trillion, while domestic loans
total Rp7.1 trillion. Assuming that the 40 firms have to
PIIGS country+USA
liquidity needed globally
Foreign Debts Pay off/payment
from PIIGS country
74 corporation 1
)
Foreign Debts amount: Rp29,3 T
Domestic Debts amount = Rp12,03T
40 Corporation 2
)
Foreign Debts amount: Rp23,9 T
Domestic Debts amount = Rp7,1T
Source
of fund ?
Yes No
Turned Foreign Debts into
Domestic Debts
How does the impact on
domestic banks liquidity? 2
)
Pay off Foreign Debts and Domestik Debts
thats due. If the funds are not enough, hows
the impact to banks NPL and CAR
Were net excess liquidity able to
cover additional new credit?
49 Banks
- Initial liquid Rp350,8T becomes Rp333,29T
after deducted by 50% Foreign Debts
- There are 14 banks that has not enough
excess
50% Foreign Debts and Domestik Debts pay off scenario results
NPL of 49 banks rose from 2,8% to 4,2%
Bank with NPL above 5%, increasing from 4 banks to 25 banks
CAR of 49 banks down from 17,25% to 16,05%
There are 10 banks with CAR under 8%
Note:
1) 74 corporations that has Foreign Debts from PIIGS country +USA, Domestic Debts
2) 40 corporations that has Foreign Debts from PIIGS country +USA, Domestic Debts
and Balance Sheet
3) 50% scenario from Foreign Debts +Domestic Debts paid off by company’s net profit
4) Liquid Assets after deducted by Committees Loan
1
2
Picture 4.1Stress Test: the impact of corporate offshore loans from the US and
PIIGS on the banking sector in Indonesia
repay 50% of their foreign debt and domestic loans
respectively, then 25 banks will see their NPL exceed
5% and 10 banks will experience a decline in CAR to
below 8%. Similar results are obtained when 100% of
the foreign debt and domestic loans are repaid although
the respective capital ratios are smaller and the NPL ratios
increase further.
Total 74 39
Total Liquid Assets 351 333 316
Total Foreign Debt 29,3
Total Domestic Bank Loans 12,03
Number Of Banks With Insufficient Liquidity
Corporate BankScenario
Debt Convertion 50% Debt Convertion 100%
Table 4.1Summary of Results for Stress Test 1: Impact on Bank Liquidity
in trillion rupiah

56
Chapter 4. Topical Issues
4.2 STRENGTHENING BANK CAPITAL AS PART OF
THE EFFORTS TO MAINTAIN FINANCIAL SYSTEM
STABILITY
A valuable lesson to come out of the global crisis was
the ease at which the impacts spread from one economy
to the next. This was linked to the increasingly integrated
nature of global financial markets and institutions. Banks,
as a financial institution with a significant role, are the
focus of attention considering their vital function as
intermediation institutions, where nearly all economic
activities involve a bank in some way. However, in reality
there are numerous banks operating globally that do not
maintain an adequate capital buffer to absorb potential
losses. One reason for this is the weak capital regulatory
regime that tends to amplify procyclicality. In addition to
capital, liquidity shortfalls are one problem that surface
during crisis periods.
The G-20 initiated global financial sector reforms in
response to the global financial crisis. The most important
elements of the reforms include reforming the capital and
liquidity regulatory regime globally as well as mitigating
procyclicality, commonly referred to as Basel III. The
new regulations are not merely microprudential but
also macroprudential due to their interconnectedness.
Accordingly, the resilience of an individual bank will
contribute to reduce the risk of shocks in the banking
system overall.
One of the new microprudential regulations relates
to efforts to augment bank capital in terms of quality
and quantity. One way to enhance the quality of capital
is through predominant common equity on tier 1 capital,
simplifying tier 2 capital as well as eliminating tier 3 and
innovative tier 1 capital. Meanwhile, in order to increase
the quantity of capital, minimum common equity should
be raised from 2% to 4.5% of risk-weighted assets and
the tier 1 minimum should be raised from 4% to 6%.
Therefore, after factoring in the conservation buffer of
2.5%, the common equity ratio, tier 1 and CAR to risk-
weighted assets are 7%, 8.5% and 10.5% respectively. An
increase in capital, which is the primary buffer to absorb
losses, is expected to ensure banks are more resilient when
facing crisis conditions.
From a macroprudential standpoint, efforts were
introduced to mitigate procyclicality through formulation
of a countercyclical capital framework, which requires a
capital conservation buffer (2.5%) and countercyclical
capital buffer (0 - 2.5%). Under the prevailing concept,
as business or economic conditions improve, banks tend
to utilise their capital to conduct business activities, for
instance by allocating credit, which can be excessive.
However, during crisis conditions banks are forced to
maintain additional capital in order to absorb any losses
that are incurred. Clearly this will exacerbate the situation
of the banks, which are already in a difficult position.
According to the new concept, banks are required to raise
their levels of capital during economic boom conditions
Table 4.2Summary of Results for Stress Test 2: Impact on Bank CAR and NPL
Average NPL of 39 banks 2,8% 4,19% 4,24%
Number of banks with NPL > 5% 5 25
Average CAR of 39 banks 17,25% 16,05% 16%
Number of banks with CAR < 8% 0 10
Before Stress TestScenario
Debt Convertion 50% Debt Convertion 100%
in trillion rupiah

57
Chapter 4. Topical Issues
through a conservation buffer that can be utilised during
the subsequent downturn. This is expected to alleviate
some of the burden borne by the banks during crisis
conditions.
Meanwhile, the countercyclical capital buffer was
put in place in order to avoid excessive credit growth. This
was motivated by the experience that credit bubbles often
precede banking crises. Of course, the implementation
of this policy must be performed prudentially in order
to avoid restricting much needed credit growth to boost
activity in the business community, which in turn catalyses
the economy as a whole. Therefore, the application of
a countercyclical capital buffer ranges from 0 – 2.5%
according to policy in each respective jurisdiction.
A combination of the policies mentioned, coupled
with the application of international liquidity standards
known as the liquidity coverage ratio (LCR) and net stable
funding ratio (NSFR), is expected to reduce the frequency
and depth of future banking crises. Such policies can
clearly not be implemented immediately; therefore
they will be phased in gradually starting in 2013 with
full implementation planned for 2019. Consequently,
the banking sector has sufficient time to adjust to the
new policies and meet the new requirements through a
predetermined transitional period.
The Basel Committee on Banking Supervision
(BCBS) conducted a quantitative impact study (QIS) in
order to investigate the impact of the new regulations.
Two banks from Indonesia were included in the sample
for the study, which revealed that the level of capital at
these two respondent banks was actually higher than the
level of capital based on prevailing regulations. Moreover,
internally Bank Indonesia has also conducted studies on
the application of Basel III on all banks in Indonesia using
data from monthly bank reports. In general, the results are
consistent with the QIS undertaken by BCBS, namely that
the average CAR of banks is higher based on the new Basel
III requirements compared to current regulations. Bank
CAR according to Basel III shows that the aggregate capital
value of banks remains above the minimum requirement
of 8% and 10.5% with the additional conservation buffer.
In terms of individual banks, nearly all of the banks were
able to meet the new requirements.
Prevailing Basel III RegulationsCommon Equity/Total Modal 98.5%* 88.7%
Tier 1/Total Modal 89.9% 88.4%
Common Equity/ATMR 16.0% 15.3%
Tier 1/ATMR 14.6% 15.3%
CAR 16.1% 17.3%
*) common equity prior to adjustment
Table 4.3A Capital Comparison between Prevailing Regulations
and the Requirements according to Basel III
Bank CAR according to Basel III is higher than
prevailing regulations because bank capital in Indonesia is
in the form of common equity and the majority regulatory
adjustment required by Basel III represents a regulatory
adjustment to current Bank Indonesia regulations. A
number of current regulatory adjustments are relatively
conservative; hence the application of Basel III will have a
favourable impact of bank capital. Although the share of
common equity and tier 1 to total bank capital in Basel III
is lower compared to prevailing regulations, this is more to
do with conceptual differences. For instance, according to
prevailing regulations, regulatory adjustments can be made
to tier 1 and tier 2 capital, while under Basel III all regulatory
adjustments focus on tier 1 capital. In general, tier 1 bank
capital is dominated by common equity, which is evidence
that banks in Indonesia have a solid capital structure that
is permanent and tailored to absorbing losses. In addition,
the magnitude of bank capital in Indonesia indicates that
domestic banks will comfortably meet the two new BCBS
requirements, set at a minimum of 4.5% (LCR) and 6%
(NSFR) respectively.

58
Chapter 4. Topical Issues
In general, banks in Indonesia will be able to meet
the capital requirements associated with Basel III, however,
a number of borderline banks require special attention.
Furthermore, many banks allocated a lot of credit
throughout the past year of 2011. Such banks will need
to start formulating ways to increase their capital. As the
dominant force in the financial system of Indonesia, sound
banks are the key to maintaining overall financial system
stability. One way that this can be achieved is through
strengthening bank capital. An adequate capital buffer
can boost domestic bank resilience to potential shocks
stemming from within the country or from overseas,
while also simultaneously enhancing the resilience of
the financial system as a whole. Crises can often not be
avoided, however, if an adequate system is set in place
then the adverse impacts should be minimised.
4.3 BROADENING PUBLIC ACCESS TO FINANCIAL
SERVICES THROUGH BANK NETWORK EXPANSION
Background
A World Bank survey conducted in 2007 found
that around 48% of all households in Indonesia did not
have access to formal financial institutions. In addition,
financial institutions in Indonesia were only serving 31%
of the general public, while 17% lived without any form
of financial services. This reality reflects the suboptimal
financial system in Indonesia. If the financial system could
reach all strata of society then the benefits of financial
services would be felt throughout the community. This in
turn would buoy the national economy considering that
the contribution from the financial sector is an important
element of economic growth.
A comparison between several countries performed
by the World Bank and IMF in 2010 revealed that use
of financial services remains relatively low in Indonesia.
This is reflected by the ratio of outstanding bank credit
(as a percentage of GDP), MSME credit (as a percentage
of GDP), total bank depositors per 1,000 adults, and
outstanding deposits (as a percentage of GDP), all of which
are relatively low as presented in Table 4.4.
One determinant of the high number of citizens with
no access to financial services in Indonesia is geographical.
Limited infrastructure and the natural conditions of the
Indonesian archipelago are two of the constraints banks
must fight to overcome when providing public services in
remote and rural areas. The problem of limited banking
services in such outlying areas is also linked to the bank’s
economies of scale in each respective area of operation.
This pattern can be observed from the distribution of
banking services, like branch offices and ATM per 1,000
km2, as well as the ratio of banking services to service area
as presented in Table 4.4.
Table 4.4Adoption of Financial Services
Indicator Indonesia Malaysia Thailand Philippines Brazil
Adoption of Financial Services Number of bank borrowers per 1,000 adults 274,80 284,06 236,98 n.a 193,96
(unit: persons)
Outstanding bank credit (% of GDP) 27,49 93,59 85,18 27,57 29,04
MSME credit (% of GDP) 0,67 17,43 30,67 n.a 3,77
% of MSME credit/total bank credit 21,6 39 35 n.a n.a
Number of depositors per 1,000 adults 504,74 1.619,94 1.119,94 487,76 n.a
(unit: persons))
Outstanding deposits (% of GDP) 36,41 117,17 74,04 53,02 47,51

59
Chapter 4. Topical Issues
Data on the ease of access to the financial sector in
Indonesia, when observed for each respective province,
illustrates a variety of conditions. In West Irian Jaya and
Papua, financial services have to cover an area of more than
1,000 km2. The hostile terrain that must be covered and the
lack of infrastructure available exacerbate the exhausting
distances that must be traversed by those wishing to
engage in financial services. Java is the best-served island
by banking services, while Sumatera, Kalimantan and
Sulawesi continue to suffer from a dearth of banking
services in the form of branch offices and ATMs.
When the number of adults served by each outlet
is taken into consideration, it can be seen that areas
in Eastern Indonesia, like East Nusa Tenggara, Papua
and Maluku require better financial services with each
outlet currently serving more than 20,000 of the adult
population.
Branchless Banking
In response, a breakthrough is required in order to
broaden public access to financial services, in particular
banking services. The concept of branchless banking is
one solution to reaching the unbanked in remote areas.
Branchless banking is a distribution strategy to provide
financial services without depending on the presence of a
traditional or ‘brick-and-mortar’ branch office. One aspect
is to exploit information, communications and technology,
namely cellular telephones (mobile banking), point of sale
systems connected to terminals, GPRS and others. Another
aspect is the current outsourcing trend, involving grocery
Table 4.5Access to Financial Services
Indicator Indonesia Malaysia Thailand Philippines Brazil
Level of Access to Financial Services Number of branch offices per 1,000 km2 7,71 6,18 11,59 15,69 2,33
Number of branch offices per 100,000 adults 8,32 10,48 11,16 7,69 13,76
Number of ATMs per 1,000 km2 12,39 33,12 80,68 30,35 20,46
Number of ATMs per 100,000 adults. 13,37 56,18 77,69 14,88 120,62
Figure 4.2Number of Banking Services per km2
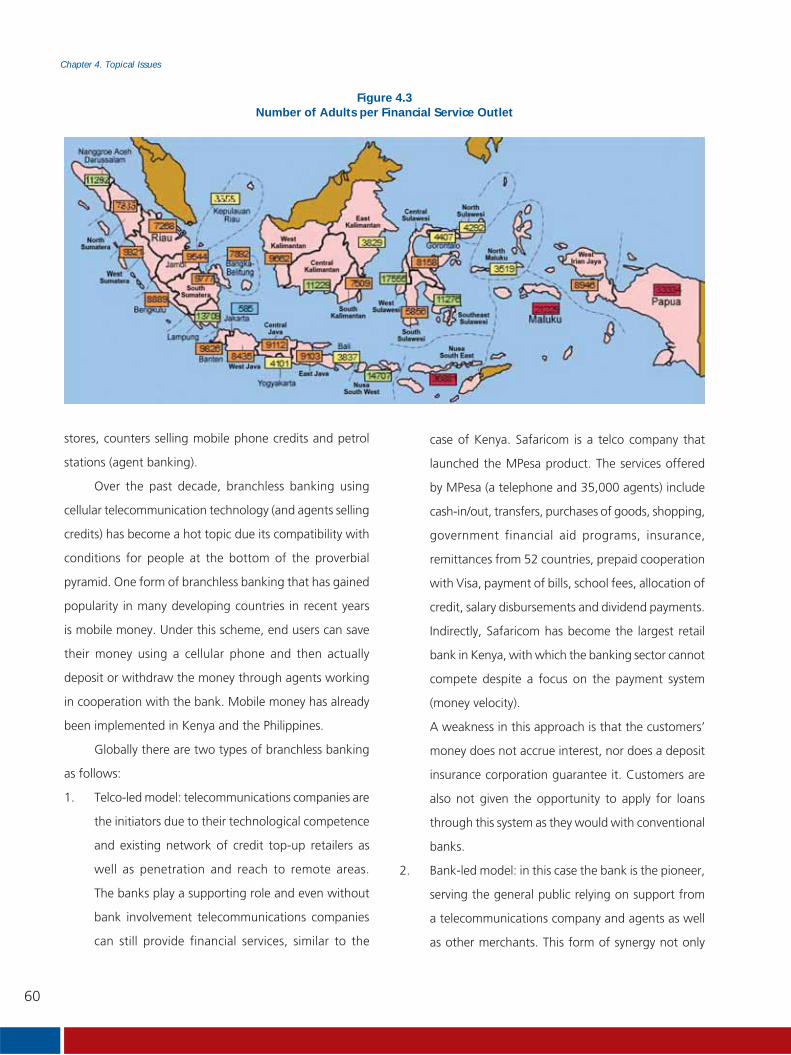
60
Chapter 4. Topical Issues
Figure 4.3Number of Adults per Financial Service Outlet
stores, counters selling mobile phone credits and petrol
stations (agent banking).
Over the past decade, branchless banking using
cellular telecommunication technology (and agents selling
credits) has become a hot topic due its compatibility with
conditions for people at the bottom of the proverbial
pyramid. One form of branchless banking that has gained
popularity in many developing countries in recent years
is mobile money. Under this scheme, end users can save
their money using a cellular phone and then actually
deposit or withdraw the money through agents working
in cooperation with the bank. Mobile money has already
been implemented in Kenya and the Philippines.
Globally there are two types of branchless banking
as follows:
1. Telco-led model: telecommunications companies are
the initiators due to their technological competence
and existing network of credit top-up retailers as
well as penetration and reach to remote areas.
The banks play a supporting role and even without
bank involvement telecommunications companies
can still provide financial services, similar to the
case of Kenya. Safaricom is a telco company that
launched the MPesa product. The services offered
by MPesa (a telephone and 35,000 agents) include
cash-in/out, transfers, purchases of goods, shopping,
government financial aid programs, insurance,
remittances from 52 countries, prepaid cooperation
with Visa, payment of bills, school fees, allocation of
credit, salary disbursements and dividend payments.
Indirectly, Safaricom has become the largest retail
bank in Kenya, with which the banking sector cannot
compete despite a focus on the payment system
(money velocity).
A weakness in this approach is that the customers’
money does not accrue interest, nor does a deposit
insurance corporation guarantee it. Customers are
also not given the opportunity to apply for loans
through this system as they would with conventional
banks.
2. Bank-led model: in this case the bank is the pioneer,
serving the general public relying on support from
a telecommunications company and agents as well
as other merchants. This form of synergy not only
61
Chapter 4. Topical Issues
accelerates money velocity, however, customer
protection and the possibility of obtaining credit that
suits the needs of the customer are also important.
Using this approach, Brazil successfully added 19
million new bank accounts in four years circulating
more than USD 100 billion. There is now no district
in Brazil that does not benefit from banking products
and services.
In general, the application of branchless banking
requires a number of important elements as follows:
1. Information, communications and technology.
This includes the technology provided by
telecommunications companies, interoperability
among the payment systems like ATMs, as well as
retail clearing available to all providers and banks/
institutions involved.
2. Reliable and trusted agents that can open accounts for
new customers and handle cash-in/out and transfers.
Agents must be furnished with additional technology
like EDC, POS and/or cellular telephones.
3. Supporting polices/regulations. Neither of the first
two points will materialise without support from
appropriate policies and regulations.
Branchless banking “extends the reach and depth
of financial services” and greatly benefits the general
public at the bottom of the pyramid, who are generally
found in rural areas, well out of the reach of traditional
banking services.
Application Constraints
1. Documents. It would be wrong if, because of limited
valid documents, a lack of technology and low
incomes, the people at the bottom of the pyramid
were unable to connect to the banking sector, could
not save or could not transfer money or apply for
credit congruent to their conditions and requirements.
Proportional regulations supplemented with other
mitigating tools are one possible solution. Looking
ahead, the general public is believed will favour
financial transactions with non-bank providers,
namely in the form of branchless banking and this
trend has already persisted for the past decade in
many emerging market countries.
2. Knowledge and culture. The understanding of people
at the grass roots level concerning banking products
and services remains low; therefore, it is necessary to
improve financial literacy. This is compounded further
by an untrusting culture in terms of entrusting money
to someone else or through the use of technology.
3. Suitable products. For grass roots members of the
general public, administrative fees are a consideration
because they can erode their level of savings. Small
loans repaid on a daily or weekly basis are most
appropriate but rarely offered by conventional
commercial banks.
4. Know your customer principles, which require each
new account to be opened with a valid document
that the customer must sign directly, face-to-face
with the bank employee, can help the bank ensure
the validity of the prospective customer.
Practices in other Countries
1. In Kenya prior to 2007 only 7.5% of the population
had a bank account, however, fast-forward to 2011
and as many as 40% of the adult population owned
a bank account with 83% of the population owning
a mobile telephone. Accordingly, Safaricom, which
is the largest telecommunications operator in Kenya
with an 89% market share, became known as one
of the most successful companies through its mobile
money financial service and the associated product
called MPesa. MPesa experienced growth in excess of
250% from April 2007 to November 2011. Using the
62
Chapter 4. Topical Issues
MPesa product citizens can transfer money, initiate
payments as well as deposit and withdraw money
through the biggest agent network in Kenya.
2. Public access to banks in South Africa is relatively
good with 63% of the adult population having
a bank account. The high pick-up rate for bank
accounts in SA is due to a government program
known as ‘Mzansi Initiatives’ operated from 2004-
08 that invited the unbanked community to open
bank accounts in the form of a magnetic debit card.
There are over 10,000 ATMs and 100,000 POS in
the country so South Africans were already used to
making card-based payments. This mobile banking
product was offered by nearly all banks in SA as an
additional service for their customers.
3. In the Philippines the first SMS financial service
using mobile phones was offered by SMART (a
telecommunications company), where the general
public could access services like deposits and
withdrawals without visiting a bank. Over time,
SMART extended its network through cooperation
with merchants and public service companies as well
as the banking sector in order to enhance its service.
The development of mobile money in the Philippines
was possible due to deep mobile phone penetration,
with mobile phone subscribers skyrocketing from
5 million in 2000 to more than 81 million in 2010.
Growth in mobile phone usage was bolstered by the
availability of mobile payments through handsets in
2009, by which time 57% of the adult population
in the Philippines had a bank account.
Practices in Indonesia
From observations in Indonesia, branchless banking
has already begun domestically (in addition to ATMs and
the Internet) but products remain thin on the ground as
follows:
1. Telkomsel launched its product known as T-Cash.
2. Telkom has a product known as Delima.
3. Satelindo launched DompetKu (MyWallet).
4. BPR-KS has EDC.
5. Bank Sinarmas serves the Sinarmas Group through
cooperation with Smart.
6. Bank Sinar Harapan Bali is conducting trials regarding
cooperation with Axis.
Future Application
The best application of branchless banking in
Indonesia would come in the form of a hybrid model,
namely one that is led by the banks but supported through
cooperation with telecommunications companies and
agents (bank-led model). Implementation also involves
rural banks and microfinance institutions (LKPD, LPN, BKD,
etc.). The involvement of rural banks and microfinance
institutions is crucial to create synergy among those
involved.
In its preliminary stage, the application of branchless
banking enables customers access to services like cash-in/
out, money transfers and payment of bills as a pilot project.
All mobile phone subscribers have the mobile banking
application pre-installed on their SIM cards. In order to
succeed, the existing constraints must be overcome,
including revisions to KYC principles, massive financial
education programs, availability of suitable products, as
well as supporting infrastructure.
Bank Indonesia is continuing its financial inclusion
program in collaboration with the Government in order
to broaden public access to banking services by negating
existing price and non-price constraints. The financial
inclusion program is supported by five pillars, one of
which is distribution that aims to expand the reach of
formal financial services to residents in remote and rural
areas. One activity conducted was a study into branchless
banking, which covered the possibility of applying mobile

63
Chapter 4. Topical Issues
banking in Indonesia. Through this concept it is hoped
that unbanked citizens in remote and rural areas will have
access to banking services. (*)
4.4 EUROPEAN CRISIS
The turmoil in Europe remained at a critical stage
with vulnerability rife in the banking sector. Deleveraging
by banks in the euro zone continued, which led to a scarcity
of global financing. The effect of contagion was visible
through the financial and trade channels. Consequently,
effective coordination is required in terms of compiling a
sound contingency plan.
The impact of the crisis in Europe on the performance
and resilience of the global financial sector, including
Indonesia, requires close observation. Up to yearend
2011 the performance of financial markets and banking
sectors in the Asia/Pacific region, including Indonesia, were
affected by the sovereign debt crisis in the euro zone as
well as the downturn in global economic growth and less
international trade. In Asia/Pacific, contagion from the
crisis in Europe was transmitted through the trade and
financial channels. Regarding the financial channel, banks
in Europe experienced funding shortfalls in US dollars,
which went on to affect other banks with the exception
of those not yet active internationally, including banks in
Indonesia. Nonetheless, action from the ECB and other
central banks through multi-currency swap lines has
alleviated tight dollar liquidity for the time being. Referring
to the trade channel, weak exports are being reported as
reflected by languid trade growth in a number of countries
that depend heavily on exports. Although the financial
sector in Indonesia was stable up to yearend 2011, the
Government and Bank Indonesia remained vigilant over
the transmission of contagion through the financial and
trade channels. Preparations in Indonesia took the form of
a Crisis Management Protocol (CMP) formulated by Bank
Indonesia with the Government.
Shocks in the Euro Area
The sovereign debt crisis in Europe remained at a
critical stage. Although agreement was reached to save
Greece, market players remained relatively pessimistic
considering that the decision undermined the already bleak
global economic growth outlook for 2012. Risk aversion
continued globally, despite previous endeavours to
supplement market liquidity by the ECB and other specific
central banks5, among others, through multi-currency
swap lines. Such circumstances illustrated the relative
scepticism of market players concerning the policies taken.
In addition, credit rating agencies signalled their intent to
downgrade the ratings of all euro zone member countries,
which reinforced the lost perception of risk-free status for
financial instruments categorised as sovereign.
The deleveraging process of banks in Europe began
amid a scarcity in sources of funds and capital. More
deleveraging is expected in 2012, with banks cutting
back their credit lines and trade finance or withdrawing
dollars from other jurisdictions. This is reflected by a
significant potential contraction on the banks’ balance
sheet (refer to Figure 4.1), which creates feedback loops
between pressures on the sovereign and the banking
system and undermines economic prospects. Spillover
pressures emerged outside of the euro zone, which
dented global economic prospects over the past few
months. Furthermore, in the midst of lacklustre market
confidence investors tended to seek safe havens. Under
serious conditions, potential deleveraging in emerging
market countries is significant.
The relevant authorities instituted a policy response
to the sovereign debt crisis and slow growth in the US.
The policy response taken comprised of low interest rates,
the purchase of assets and the provision of liquidity by the
central bank as lender of last resort. Consequently, the
5 ECB bekerjasama dengan Federal Reserves, Bank of Japan, dan Swiss National Bank.
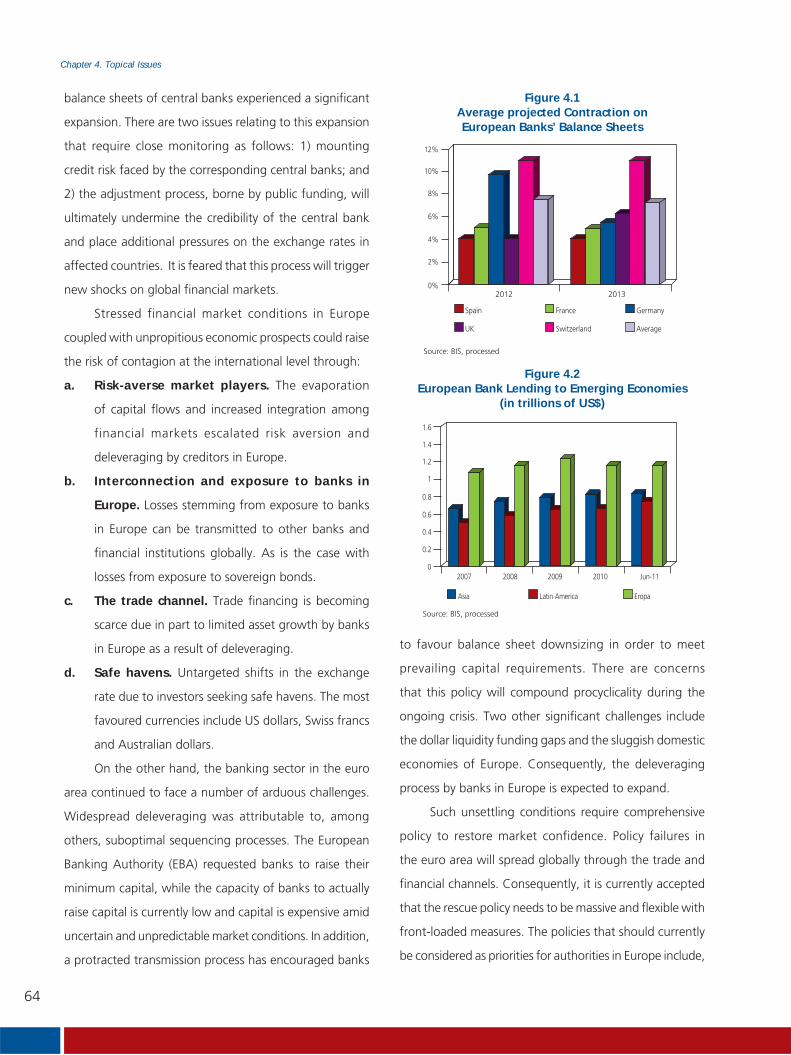
64
Chapter 4. Topical Issues
balance sheets of central banks experienced a significant
expansion. There are two issues relating to this expansion
that require close monitoring as follows: 1) mounting
credit risk faced by the corresponding central banks; and
2) the adjustment process, borne by public funding, will
ultimately undermine the credibility of the central bank
and place additional pressures on the exchange rates in
affected countries. It is feared that this process will trigger
new shocks on global financial markets.
Stressed financial market conditions in Europe
coupled with unpropitious economic prospects could raise
the risk of contagion at the international level through:
a. Risk-averse market players. The evaporation
of capital flows and increased integration among
financial markets escalated risk aversion and
deleveraging by creditors in Europe.
b. Interconnection and exposure to banks in
Europe. Losses stemming from exposure to banks
in Europe can be transmitted to other banks and
financial institutions globally. As is the case with
losses from exposure to sovereign bonds.
c. The trade channel. Trade financing is becoming
scarce due in part to limited asset growth by banks
in Europe as a result of deleveraging.
d. Safe havens. Untargeted shifts in the exchange
rate due to investors seeking safe havens. The most
favoured currencies include US dollars, Swiss francs
and Australian dollars.
On the other hand, the banking sector in the euro
area continued to face a number of arduous challenges.
Widespread deleveraging was attributable to, among
others, suboptimal sequencing processes. The European
Banking Authority (EBA) requested banks to raise their
minimum capital, while the capacity of banks to actually
raise capital is currently low and capital is expensive amid
uncertain and unpredictable market conditions. In addition,
a protracted transmission process has encouraged banks
to favour balance sheet downsizing in order to meet
prevailing capital requirements. There are concerns
that this policy will compound procyclicality during the
ongoing crisis. Two other significant challenges include
the dollar liquidity funding gaps and the sluggish domestic
economies of Europe. Consequently, the deleveraging
process by banks in Europe is expected to expand.
Such unsettling conditions require comprehensive
policy to restore market confidence. Policy failures in
the euro area will spread globally through the trade and
financial channels. Consequently, it is currently accepted
that the rescue policy needs to be massive and flexible with
front-loaded measures. The policies that should currently
be considered as priorities for authorities in Europe include,
Spain France Germany
20132012
12%
10%
8%
6%
4%
2%
0%
UK Switzerland Average
Figure 4.1Average projected Contraction onEuropean Banks’ Balance Sheets
Source: BIS, processed
Asia Latin America Eropa
2010 Jun-112007 2008 2009
1.6
1.4
1.2
1
0.8
0.6
0.4
0.2
0
Figure 4.2European Bank Lending to Emerging Economies
(in trillions of US$)
Source: BIS, processed

65
Chapter 4. Topical Issues
among others: a) bank recapitalisation and restructuring
as conducted in Indonesia during the crisis in 1997-98; b)
a term-funding backstop; and c) application of a blanket
guarantee or explicit deposit insurance.
To this end and in anticipation of more severe
fallout to come, the role of the Financial Stability Board is
becoming increasingly important, where inter-authority
coordination is urgently required, among others, to
undertake contingency planning as follows:
a. Intensive cooperation among all FSB members to
minimise the potential risk of deleveraging and the
possibility of worse to come.
b. Home supervisors must ensure that the deleveraging
process is orderly and various options are attempted
to strengthen capital.
c. Clear communications between home and host
authorities to ensure joint implementation of the
contingency plan, particularly in countries most
affected by the crisis.
Liquidity support on primary markets for each
currency is required to reduce funding stress. Under the
worst-case scenario, it is crucial to guarantee the smooth
operation of financial infrastructure and identify ways to
overcome big bank defaults.
Impact on and Mitigation of Risk in Indonesia
For Indonesia, one impact of the low interest rate
policy and weak global economic prospects that requires
tight vigilance is capital inflows. This is due to favourable
growth prospects in Indonesia, which boosts market
confidence. In addition, the improvement in Indonesia’s
rating to investment grade status also spurred market
confidence. In this respect, the return of potential carry
trades on currencies with a relatively high interest rate
must also be monitored. A deluge of capital inflows will
catalyse credit growth but there remains the threat of asset
price bubbles if credit growth exceeds its corresponding
prudential corridor.
Nevertheless, amid global financial market shocks,
the banking sector in Indonesia maintained positive
performance and solid resilience. The capital adequacy ratio
(CAR) reached 16.6% with net NPL at 0.8% (November
2011), which demonstrated the high level of solvency and
resilience to credit risk as the main risk faced by the banking
industry in Indonesia. The results of stress tests indicated
that the domestic banking sector would dampen any
increases in credit risk, market risk and liquidity risk. On the
other hand, the minimum statutory reserve requirement
based on the loan to deposit ratio has helped balance
intermediation with policy to avoid systemic liquidity risk.
In addition, the Government and Bank Indonesia have
prepared a crisis management protocol, which is expected
to bolster coordination and facilitate a quick authority
response in order to prevent systemic risk.

This page intentionally blank

67
Article 1. External Shocks, Macroeconomic Stability, and Monetary Regimes in the Small open
New Keynesian Model of the Indonesian Economy
Article

68
Article 1. External Shocks, Macroeconomic Stability, and Monetary Regimes in the Small open
New Keynesian Model of the Indonesian Economy
This page intentionally blank

69
Article 1. External Shocks, Macroeconomic Stability, and Monetary Regimes in the Small open
New Keynesian Model of the Indonesian Economy
I. INTRODUCTION
To stimulate the US economy which was hardly affected
by the US financial crisis 2008, the Federal Reserve pumped
billion dollars to the economy in the effort searching the light of
recovery. This action is well-known as quantitative easing (QE)
program. In Europe, similar problem exists. Some European Union
(EU) members like Greece and Ireland have very serious public
debt problem and current deficit. To avoid being default, they
seek liquidities assistance from European central bank. Greece
has received the second bailout within 1 year.
Large-scale monetary stimuli in the US and Europe precipitated a surge in liquidity that ultimately
lowered the level of yield on global financial markets. Furthermore, bleak economic prospects
stemming from excessive government debt, acute budget deficits and shortfalls in the current
accounts of numerous advanced countries undermined investor confidence. Consequently, investors
diverted their funds away from developed countries in favour of emerging market countries that
performed better economically and could offer higher yields. The influx of short-term capital flows
to developing countries became known as hot money. In this paper the small-open new Keynesian
model is used to model the determinants of hot money flows to Indonesia and their impact on
economic stability in terms of monetary policy (domestic inflation targeting, (CPI) inflation targeting,
exchange rate targeting and Taylor Rule implicit policy targeting). Simulations revealed that domestic
inflation targeting leads to the smallest welfare losses while exchange rate targeting leads to the
largest compared to other elements of monetary policy.
Keywords: new Keynesian, small open economy, external shocks, monetary regimes, Indonesia.
JEL Classification Number: E52, E32, F41
The Fed and European central bank printed new money
to conduct the QE programs or bailouts. As the result, the US
and European financial markets have excess liquidities which
push down the returns in their financial markets. These excess
liquidities which flow to emerging markets are regarded as
“hot money”. They have a short investment horizon and can
be pulled out any time without any exit constraints. Financial
markets in EM become bullish. As the result, cost of borrowing
is decreasing. However, there is concern about negative effects
of hot money inflows. First, sudden reversal of hot money flows
1 flexible CPI inflation targeting in Svenson (2000) is close to the definition of “Taylor rule” implicit policy targeting in this paper.
External Shocks, Macroeconomic Stability, and
Monetary Regimes in the Small-open New Keynesian Model
of the Indonesian Economy
Article 1
Bayu Kariastanto1
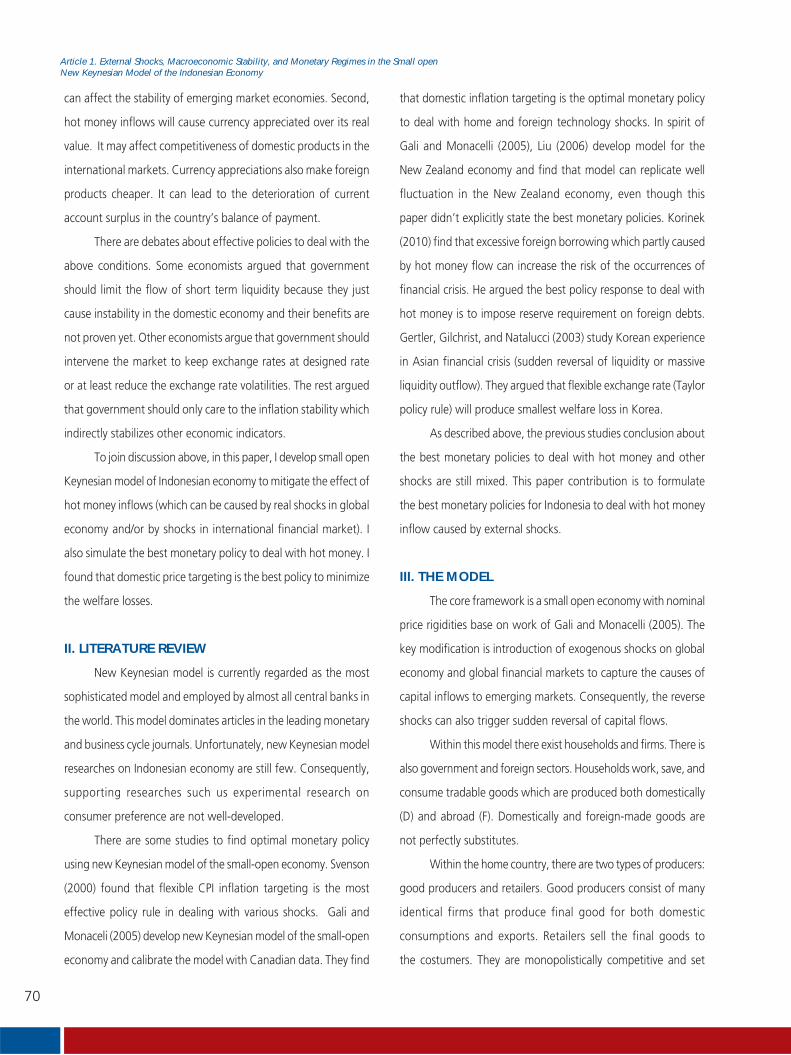
70
Article 1. External Shocks, Macroeconomic Stability, and Monetary Regimes in the Small open
New Keynesian Model of the Indonesian Economy
can affect the stability of emerging market economies. Second,
hot money inflows will cause currency appreciated over its real
value. It may affect competitiveness of domestic products in the
international markets. Currency appreciations also make foreign
products cheaper. It can lead to the deterioration of current
account surplus in the country’s balance of payment.
There are debates about effective policies to deal with the
above conditions. Some economists argued that government
should limit the flow of short term liquidity because they just
cause instability in the domestic economy and their benefits are
not proven yet. Other economists argue that government should
intervene the market to keep exchange rates at designed rate
or at least reduce the exchange rate volatilities. The rest argued
that government should only care to the inflation stability which
indirectly stabilizes other economic indicators.
To join discussion above, in this paper, I develop small open
Keynesian model of Indonesian economy to mitigate the effect of
hot money inflows (which can be caused by real shocks in global
economy and/or by shocks in international financial market). I
also simulate the best monetary policy to deal with hot money. I
found that domestic price targeting is the best policy to minimize
the welfare losses.
II. LITERATURE REVIEW
New Keynesian model is currently regarded as the most
sophisticated model and employed by almost all central banks in
the world. This model dominates articles in the leading monetary
and business cycle journals. Unfortunately, new Keynesian model
researches on Indonesian economy are still few. Consequently,
supporting researches such us experimental research on
consumer preference are not well-developed.
There are some studies to find optimal monetary policy
using new Keynesian model of the small-open economy. Svenson
(2000) found that flexible CPI inflation targeting is the most
effective policy rule in dealing with various shocks. Gali and
Monaceli (2005) develop new Keynesian model of the small-open
economy and calibrate the model with Canadian data. They find
that domestic inflation targeting is the optimal monetary policy
to deal with home and foreign technology shocks. In spirit of
Gali and Monacelli (2005), Liu (2006) develop model for the
New Zealand economy and find that model can replicate well
fluctuation in the New Zealand economy, even though this
paper didn’t explicitly state the best monetary policies. Korinek
(2010) find that excessive foreign borrowing which partly caused
by hot money flow can increase the risk of the occurrences of
financial crisis. He argued the best policy response to deal with
hot money is to impose reserve requirement on foreign debts.
Gertler, Gilchrist, and Natalucci (2003) study Korean experience
in Asian financial crisis (sudden reversal of liquidity or massive
liquidity outflow). They argued that flexible exchange rate (Taylor
policy rule) will produce smallest welfare loss in Korea.
As described above, the previous studies conclusion about
the best monetary policies to deal with hot money and other
shocks are still mixed. This paper contribution is to formulate
the best monetary policies for Indonesia to deal with hot money
inflow caused by external shocks.
III. THE MODEL
The core framework is a small open economy with nominal
price rigidities base on work of Gali and Monacelli (2005). The
key modification is introduction of exogenous shocks on global
economy and global financial markets to capture the causes of
capital inflows to emerging markets. Consequently, the reverse
shocks can also trigger sudden reversal of capital flows.
Within this model there exist households and firms. There is
also government and foreign sectors. Households work, save, and
consume tradable goods which are produced both domestically
(D) and abroad (F). Domestically and foreign-made goods are
not perfectly substitutes.
Within the home country, there are two types of producers:
good producers and retailers. Good producers consist of many
identical firms that produce final good for both domestic
consumptions and exports. Retailers sell the final goods to
the costumers. They are monopolistically competitive and set
71
Article 1. External Shocks, Macroeconomic Stability, and Monetary Regimes in the Small open
New Keynesian Model of the Indonesian Economy
nominal price on a staggered basis. The role of retailers in this
model is to provide nominal price rigidities as common in the
new Keynesian model.
III.1. Households
IIII.1.1.Consumption Composites
Let Ct be a composite of tradable consumption goods.
Households preference over home consumption, , and foreign
consumption, , is expressed by CES index:
(1)
The corresponding consumer price index (CPI), Pt , is
expressed by:
(2)
The static optimization the above problems yield the
optimal allocation between domestic and foreign goods at
any given expenditure which can be expressed by the isoelastic
consumption demands:
(3)
III.1.2.Household’s Decision Problem
Let N denotes household labor, then for each period,
household maximizes his utilities which are represented by:
(4)
Subject to sequent of budget constraint:
(5)
where Wt denotes nominal wages, TRt government
transfer, Tt lump sum tax, Bt nominal bond in domestic currency,
and it nominal interest rate.
The optimality condition for household problem can be
written as:
(6)
(7)
III.2. Firms
III.2.1.Production
A typical firm in the home economy produces a
differentiated good with linear technology, A, represented by
the production function:
(8)
The real marginal cost, MC, will be common across
domestic firm and expressed by:
(9)
In the equilibrium, the domestic production should be equal
with domestic good consumptions and exports. Mathematically,
it can be expressed with:
(10)
III.2.2.Price Setting
Following Calvo (1983) and Yun (1996), each firm may
reset its price with probability 1- ø at any given period. This
implies that domestic firm will choose to maximize:
Subject to sequent budget constraints:
where is the stochastic discount factor for nominal payoffs,
ø_t (.) is the cost function, and is output in period t+k for
a firm which reset its price at period t.
The first order condition (FOC) of this optimization problem is
written as follow:
(11)
where denotes the nominal marginal cost and M=
denotes desired mark up.
Given the pricing rule above, the domestic aggregate price index
evolve as follow:
(12)
III.3. Government
Each period government imposes a lump sum tax on
household income and spends tax revenue on welfare program
which directly enjoyed by household. Government maintains
balance budget such as Tt= TRt at all t.
Government also conducts monetary policy to stabilize
the economy. There are four policy rules which can be chosen:
�
.

72
Article 1. External Shocks, Macroeconomic Stability, and Monetary Regimes in the Small open
New Keynesian Model of the Indonesian Economy
domestic inflation targeting (DIT), strict (CPI) inflation targeting
(CIT), exchange rate targeting (PEG), and “Taylor rule” implicit
policy targeting (IPT).
Policy rule for DIT, CIT, PEG, and IPT consecutively can be written
as2:
(13)
(14)
(15)
(16)
where denotes nominal exchange rate and denote natural
rate of capital returns.
III.4. Foreign Sectors
III.4.1.Term of Trade, Exchange Rate, and Risk
Sharing
Terms of trade, S, are defined as the price of imported
good relative to price of domestic good than can be expressed
as follow:
(17)
Hence, real exchange rate is defined as:
(18)
Under the assumption of complete international financial
market and homogenous preferences across the countries, we can
derive uncovered interest parity (UIP) condition from household’s
Euler equation (equation 7) which can be written as:
(19)
III.4.2. Philips Curve and Economic Dynamics in
the Rest of the World
Since the small open economy cannot affect the equilibrium
in the rest of the world, the Philips curve in the rest of the world’s
economy corresponds to the Philips curve in the closed economy
which can be expressed in the log-linearized form as:
(20)
where and marginal cost is given by:
(21)
I shock technology to capture exogenous shocks in the rest of
the world’s economy. The dynamic of technology is represented
by AR(1) process as follow:
(22)
As discussed in Gali and Monacelli (2002), monetary
authority in the rest of world economy can conduct monetary
policy base on a policy rule. I assume that monetary authority
conducted monetary policy base on standard Taylor rule which
is not necessary to be the best policy in this model. The rule is
as follow:
(23)
Where is exogenous monetary policy shock to capture
sudden increase (decrease) premium that should be paid by small
open economy when borrow from financial market. Current hot
money inflow to the emerging market in this model is regarded as
a shock to which decreases rate of return in the international
market. Consequently, sudden reversal should be regarded as a
big shock in the international financial markets. The evolves
as AR(1) process expressed by:
(24)
III.5. Calibration
For calibration, quarterly Indonesian and US data from
1990 to 2010 is obtained from International Monetary Fund’s
International Finance Statistic (IMF’s IFS). US economy is used to
represent the rest of world’s economy described in the model.
I fix the quarterly discount factor at 0.97, which implies
a riskless annual return of about 14% as the average central
bank rate in the data. A baseline value of is set to be 0.7 to
match average consumption to GDP ratio in Indonesia from
1990 to 2010. It implies that degree of openness to be 0.3.
To reach balance trade in the steady state, I set inter temporal
consumption elasticity and elasticity of substitution between
home and foreign good to be 1. Since I cannot find experimental
study about preference parameters in Indonesia, I follow Gali
and Monacelli (2005) in choosing parameters value in the labor
preference. Hence, labor disutility parameter set to be 3. As 2 The first three equations follow Gali and monacelli (2005).

73
Article 1. External Shocks, Macroeconomic Stability, and Monetary Regimes in the Small open
New Keynesian Model of the Indonesian Economy
is common in the literature, I set the probability of the price
not adjusting on Carlvo pricing, θ to be 0.75. The elasticity of
substitution between differentiated goods from the same origin,
θ set to be 6 which implies a steady state of mark up of 20%.
To calibrate parameters in monetary rule, I follow original
Taylor rule. Hence, I set , , and to be 1.5, 0.5, and 0.5
respectively. Natural rate of capital returns τ set to be 0 to make
the equilibrium closer to equilibrium in competitive economy.
I went to the data set to calibrate premium shock. Table 1
shows the regression result. The result implies that the average
Indonesian premium rate is about 2%. Foreign technology shock
is calibrated using US data following Gali (2008). The exogenous
stochastic processes finally can be approximated by following
equations:
(24)
(25)
IV. RESULT
IV.1. Impulse Responses
Figure 1 shows evolutions of foreign GDP and nominal
interest rate under technology shock and monetary shock.3
Technology shock is a standard deviation of foreign technology
shock which leads to temporary increase in foreign productivity.
Technology shock will increase GDP and decrease price level
in foreign countries. Inflation has more weight than GDP in
determination of nominal interest rate. Consequently, nominal
interest rate will decrease by 0.4 of standard deviation of
technology shock. Since home interest rate is still higher than
foreign interest rate, demand on domestic bond will increase
and domestic interest rate will decrease until UIP condition is
satisfied.4
A standard deviation monetary shock can cause decrease
both foreign GDP and nominal interest rate. As discussed in
Gali (2008), monetary shocks will correlate positively with real
interest rate. Since the real interest rate increase, foreign GDP will
decrease. GDP decrease will be responded by decrease nominal
interest rate to stimulate the economy. Because at that moment
home interest rate is still higher than foreign interest rate,
demand on domestic bond will increase and domestic interest
rate will decrease until UIP condition is satisfied.
Finally, conclusion can be made that a positive technology
shock and monetary shocks in foreign countries will lead to
the capital inflow to home economy (a small open economy).
Phenomenon of current hot money inflow to Indonesia and other
emerging markets could be explained by technology shock or
monetary shock in global economy. To be more precise, it caused
by technology or monetary shocks in the US and Europe.5
Figure 2 shows the evolution of domestic variables
under foreign technology shocks. As discussed above, foreign
technology shock increases foreign GDP, decreases foreign
price level and foreign interest rate. It is difficult to intuitively
determine overall effects of foreign technology shock on various
domestic variables because the effect’s directions are mixed.
The summarized effects are as follow: increase foreign GDP
stimulate increase domestic export, foreign deflation decreases
CPI/domestic price level and then decreases home GDP, decrease
foreign interest rates will depreciate domestic currency and/or
decrease domestic interest rate to satisfy UIP condition. Overall
effects will depend on monetary policies and parameters in the
model.
Output is reduced under all monetary policies. CIT brings
the lowest drop in output. Meanwhile, DIT almost replicates CIT
result and IPT causes the biggest output volatility. Regarding
response on inflations, both CPI and domestic inflation decrease
under all monetary policies. DIT brings the lowest inflations
volatility, followed by CIT, IPT, and PEG.
From the figure 2 we can also see that PEG brings no
volatility in exchange rate. Meanwhile, the other monetary
regimes bring permanent depreciation on exchange rate. DIT
causes the biggest depreciation, followed by CIT and IPT. The
3 Note that all variables are in log deviation or in deviation from competitive equilibrium.
4 See equation 16.
5 The US and Europe can represent foreign economy in this model since their GDP is big enough and shocks in Indonesia (home economy) cannot affect their economy.
74
Article 1. External Shocks, Macroeconomic Stability, and Monetary Regimes in the Small open
New Keynesian Model of the Indonesian Economy
effect on term of trade is also negative under all monetary
regimes. The order from the most efficient monetary regimes
in minimizing volatility of term of trade is as follow: CIT, DIT,
PEG, and IPT.
Figure 3 shows the evolution of domestic variables under
foreign monetary shocks. In the foreign country, foreign monetary
shock will decreases foreign GDP, increase foreign price level, and
decrease interest rate. It is also difficult to intuitively determine
overall effects of monetary shock on various domestic variables
because the effect’s directions are mixed. The summarized effects
are as follow: decrease foreign GDP will decrease domestic
export, foreign inflation will increase CPI/domestic price level and
then increases home GDP, and decrease foreign interest rates will
depreciate domestic currency and/or decrease domestic interest
rate to satisfy UIP condition. Overall effects will also depend on
monetary policies and parameters in the model.
We should note that the current hot money inflow is more
suitable to be modeled as monetary/financial shocks. Monetary
shocks reduce both GDP and interest rates in foreign economy
such us what currently happen in global economy.
Under foreign monetary shocks, domestic output decreases
in the first period, but increases in the following period under IPT
and ICT. Output remains constant under DIT, but decrease under
PEG. If government only cares with benefit of capital inflow and
doesn’t care with the reversal of capital flow, IPT will become
the best monetary policy, followed by CIT.
Nominal interest rate increases under CIT and gradually
reverts back to the steady state value. Under IPT, interest rate
increases in the first period and decreases afterward until revert
back to the steady state value. Meanwhile, interest rate remains
constant under DIT and decrease under PEG. Both domestic and
CPI inflation increase under CIT and IPT, and then gradually revert
back to the steady state value. Under DIT, domestic inflation
remains constant and CPI inflation increases in the first period,
and then decreases afterward. Under IPT, both domestic and
CPI inflation are decreasing until they revert back to the steady
state value.
Regarding exchange rate, PEG brings no volatility in
exchange rate. Meanwhile, the other monetary regimes bring
permanent depreciation. IPT causes the biggest depreciation,
followed by CIT and DIT. The effect on term of trade is neutral
under PEG, but positive under other monetary regimes. The order
from the most efficient monetary regimes in minimizing volatility
of term of trade is as follow: PEG, DIT, CIT, and IPT.
IV.2. Welfare Analysis
Following Gali and Monacelli (2005), we calculate the
expected welfare losses which can be expressed in term of
variance of inflation and the output gap as follow:
(26)
Table 2 shows the welfare losses under various shocks
and monetary policies. The DIT is the most efficient policies,
followed by CIT, and IPT. PEG is the most inefficient policies
since it produces the biggest welfare lost. Therefore, government
should consider deeper if they want to peg exchange rate directly
or indirectly. DIT and CIT produce almost same welfare losses. It
highlights that inflation targeting framework is still considered
as the best policy to deal with hot money.
V. CONCLUSION
Hot money inflow to the emerging market can be regarded
as natural economic process to balance return on global financial
market. There are two external causes of hot money inflow:
technology shocks and monetary shocks in global economy.
However, the current hot money inflow is more suitable to be
modeled as monetary/financial shocks in global economy because
they reduce both GDP and interest rates in foreign economy such
us what currently happen in global economy.
The effects of hot money inflow on macroeconomics in
Indonesia are mixed and depend on what monetary policy will
be employed in Indonesia. From the welfare analysis, domestic
inflation targeting (DIT) is the most efficient policy and exchange
rate peg (PEG) is the most inefficient policy to deal with hot
money inflow.

75
Article 1. External Shocks, Macroeconomic Stability, and Monetary Regimes in the Small open
New Keynesian Model of the Indonesian Economy
REFERENCES
Calvo, G. (1983). Staggered Prices in a Utility-Maximizing
Framework. Journal of Monetary Economics, 12,
383-398.
Gali, J. (2008). Monetary Policy, Inflation, and the Business
Cycle. New Jersey: Princeton University Press.
Gali, J., and Monacelli, T. (2005). Monetary Policy and
Exchange Rate Volatility in a Small Open Economy.
Review of Economic Studies, 72, 707-734.
Gertler, M., Gilchrist, S., and Natalucci, F. (2003). External
Constraints on Monetary Policy and the Financial
Accelerator. NBER Working Paper No. 10128,
retrieved August 15th, 2011, from http://www.bis.
org/events/conf0303/gertgilc.pdf.
Harmanta, Bathaluddin, M.B., and Waluyo, J. (2010).
Inflation Targeting under Imperfect Credibility based
on ARIMBI; Lesson from Indonesian Experience.
Paper presented at Central Bank Macroeconomic
Modeling Workshop 19 - 20 October 2010 Manila,
Philippines, from: www.bsp.gov.ph/events/2010/
cbmmw/downloads/papers 2010_CBMMW_01_
paper.pdf.
Korinek, A. (2010, September). Excessive Dollar Borrowing
in Emerging Market. Retreived August 15th, 2011,
from http://www.korinek.com/papers.
Liu, P. (2006). A Small New Keynesian Model of the
New Zealand Economy. Retrieved August 15th,
2011, from http://www.rbnz.govt.nz/research/
discusspapers/dp06_03.pdf.
Monacelli, T. (2004). Into the Mussa Puzzle: Monetary
Policy Regimes and the Real Exchange Rate in a Small
Open Economy. Journal of International Economics,
62, 191-217.
Svensson, L. E. (2000). Open-economy Inflation Targeting.
Journal of International Economics, 50, 155-183.
Stéphane, A., Houtan, B., Juillard, M., Mihoubi, F.,
Perendia, G., Ratto, M., and Villemot, S. (2011),
“Dynare: Reference Manual, Version 4”, Dynare
Working Papers, 1, CEPREMAP.
Yun, T. (1996). Nominal Price Rigidity, Money Supply
Endogeneity, and the Business Cycles. Journal of
Monetary Economics, 37, 345-370.

76
Article 1. External Shocks, Macroeconomic Stability, and Monetary Regimes in the Small open
New Keynesian Model of the Indonesian Economy
APPENDIX
Table 1 AR Regression of Borrowing Premium
Variable Coefficient Std. Error t-Statistic Prob.
Constant 2.043667 0.935542 2.184473 0.0319Borrowing Premium(-1) 0.809694 0.066240 12.22360 0.0000
R-squared 0.657017 F-statistic 149.4163Adjusted R-squared 0.652619 Prob(F-statistic) 0.000000
Table 2 Welfare Losses
Monetary Policies Technology Shocks
Monetary Shocks
CPI inflation targeting -0.1101 -0.0109 Domestic inflation targeting -0.1088 0 Exchange rate peg -1.2860 -1.8584 “Taylor Rule” implicit policy targeting -0.2069 -0.0405
Figure 1Evolution of Global GDP and Interest Rate under Various Shocks
-0.4-0.20
0.20.40.60.81
2 4 6 8 10 12 14 16
-0.5-0.4-0.3-0.2-0.10
2 4 6 8 10 12 14 16
GDP Gap Interest Rate

77
Article 1. External Shocks, Macroeconomic Stability, and Monetary Regimes in the Small open
New Keynesian Model of the Indonesian Economy
Figure 2Domestic Variables under Foreign Technology Shocks
2 4 6 8 10 12 14 16-0.25
-0.2
-0.15
-0.1
-0.05
0
2 4 6 8 10 12 14 16-0.4
-0.3
-0.2
-0.1
0
0.1
2 4 6 8 10 12 14 160
0.5
1
1.5
2
2.5
2 4 6 8 10 12 14 16
-0.2
-0.1
0
0.1
fixed CIT DIT Taylor Rule
2 4 6 8 10 12 14 16
-0.4
-0.3
-0.2
-0.1
0
2 4 6 8 10 12 14 16
-0.4
-0.3
-0.2
-0.1
0
Output Gap Interest Rate
Domestic Inflation CPI Inflation
Exchange Rate Term of Trade

78
Article 1. External Shocks, Macroeconomic Stability, and Monetary Regimes in the Small open
New Keynesian Model of the Indonesian Economy
Figure 3Domestic Variables under Foreign Monetary Shocks
2 4 6 8 10 12 14 16-0.6
-0.4
-0.2
0
0.2
2 4 6 8 10 12 14 16-0.4
-0.2
0
0.2
2 4 6 8 10 12 14 16-0.8
-0.6
-0.4
-0.2
0
0.2
2 4 6 8 10 12 14 160
1
2
3
4
2 4 6 8 10 12 14 160
0.2
0.4
0.6
fixed CIT DIT Taylor Rule
2 4 6 8 10 12 14 16-0.8
-0.6
-0.4
-0.2
0
0.2
Output Gap Interest Rate
Domestic Inflation CPI Inflation
Exchange Rate Term of Trade
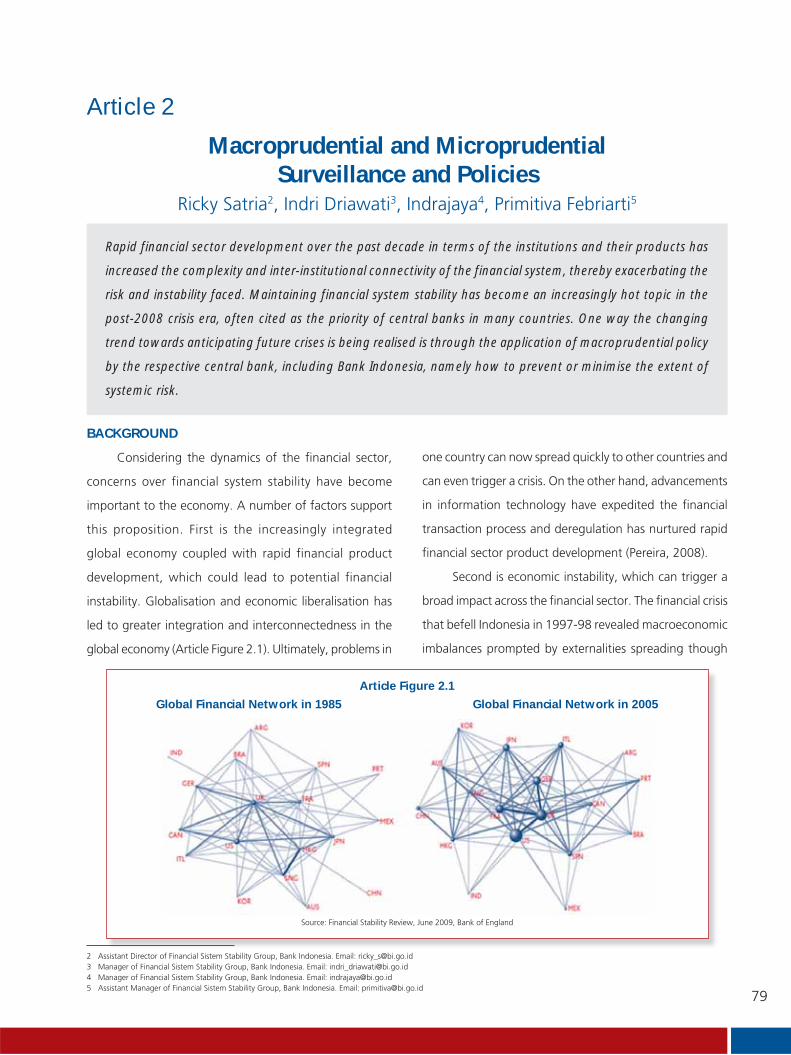
79
Article 2. Macroprudential and Microprudential Surveillance and Policies
Macroprudential and Microprudential
Surveillance and Policies
Article 2
Rapid financial sector development over the past decade in terms of the institutions and their products has
increased the complexity and inter-institutional connectivity of the financial system, thereby exacerbating the
risk and instability faced. Maintaining financial system stability has become an increasingly hot topic in the
post-2008 crisis era, often cited as the priority of central banks in many countries. One way the changing
trend towards anticipating future crises is being realised is through the application of macroprudential policy
by the respective central bank, including Bank Indonesia, namely how to prevent or minimise the extent of
systemic risk.
BACKGROUND
Considering the dynamics of the financial sector,
concerns over financial system stability have become
important to the economy. A number of factors support
this proposition. First is the increasingly integrated
global economy coupled with rapid financial product
development, which could lead to potential financial
instability. Globalisation and economic liberalisation has
led to greater integration and interconnectedness in the
global economy (Article Figure 2.1). Ultimately, problems in
one country can now spread quickly to other countries and
can even trigger a crisis. On the other hand, advancements
in information technology have expedited the financial
transaction process and deregulation has nurtured rapid
financial sector product development (Pereira, 2008).
Second is economic instability, which can trigger a
broad impact across the financial sector. The financial crisis
that befell Indonesia in 1997-98 revealed macroeconomic
imbalances prompted by externalities spreading though
Global Financial Network in 1985
Article Figure 2.1
Global Financial Network in 2005
Source: Financial Stability Review, June 2009, Bank of England
Ricky Satria2, Indri Driawati3, Indrajaya4, Primitiva Febriarti5
2 Assistant Director of Financial Sistem Stability Group, Bank Indonesia. Email: [email protected] Manager of Financial Sistem Stability Group, Bank Indonesia. Email: [email protected] Manager of Financial Sistem Stability Group, Bank Indonesia. Email: [email protected] Assistant Manager of Financial Sistem Stability Group, Bank Indonesia. Email: [email protected]
80
Article 2. Macroprudential and Microprudential Surveillance and Policies
the exchange rate and undermining domestic banking
stability, eventually leading to a multi-dimensional crisis.
Meanwhile, in 2007-08, monetary stability centred on low
interest rates to catalyse economic growth but had the
unintended impact of encouraging risk-taking behaviour
(Hyman Minsky’s, 1992) through product innovation and
an increase in leveraging by financial institutions, which
led to the subprime mortgage debacle. Investors became
a source of procyclicality that resulted in boom and bust
cycles due to their collective behaviour.
Third, the financial crisis incurs large recovery costs.
The financial crisis in Indonesia in 1997-98 cost the country
approximately 50% of GDP in recovery costs. Meanwhile,
the US poured nearly $ 700 billion into the economy to
rescue its financial system from economic crisis in 2008.
The costs borne were not merely incurred by commercial
banks but investment banks and insurance companies too.
Meanwhile, the Bank of England (BoE) spent around £3
billion saving Northern Rock and injecting capital into a
number of large banks.
The 2008 crisis prompted fundamental changes to
several aspects of crisis anticipation around the globe:
1. The crisis was caused by a failure in the banking
sector supervision function. Several countries in
Europe began to reassess their financial sector
supervision structure, particularly for banks, which
had previously separated the supervision function
from the central bank. With a focus on the soundness
of individual banks no longer adequate, systemic
stability became desirable and necessary. The
National Bank of Belgium (NBB) began supervising
systemic financial institutions that had previously
been under the auspices of the Financial Services
Authority (FSA). Meanwhile, the FSA in the UK
will become a subsidiary of the Bank of England in
2015. Similarly, Spain, France and Italy plan to follow
suit.
2. Strengthening the disparate consumer protection
function through microprudential policy, similar to
that implemented in the Netherlands (twin peak) in
2002 and the proposed Vocker Rule in the US as well
as plans in the UK.
3. Mandating the central bank with maintaining financial
system stability (through macroprudential policy and
supervision of systemic financial institutions) by
conducting surveillance on the financial system as a
whole in order to detect potential systemic risk.
4. Bolstering inter-institutional coordination as well as
accountability and governance. This can be achieved
by establishing committees similar to those set up in
the UK (Financial Policy Committee), the US (Financial
Stability Oversight Council), France (Financial
Regulation and Systemic Risk Council) and the ECB
(European Systemic Risk Board).
MACROPRUDENTIAL
Definition of Macroprudential
Experience gleaned form the crisis in 2008 led
to demands to change the views, policies, authority
and responsibility of the government, regulators in the
financial sector and the central bank with a renewed
focus on financial system stability (FSS). The application
of macroprudential policy represents one of the efforts
taken to maintain financial system stability. Use of the term
macroprudential has snowballed since the crisis in 2008,
particularly by regulators, central banks and international
institutions (BIS, IMF and G30). In addition, research by
academics relating to macroprudential policy has also
mushroomed. The term macroprudential first emerged
in the 1970s but was formally coined by Andrew Crocket
(2000), the General Manager of BIS, who postulated
that microprudential policy must be juxtaposed against
macroprudential policy.
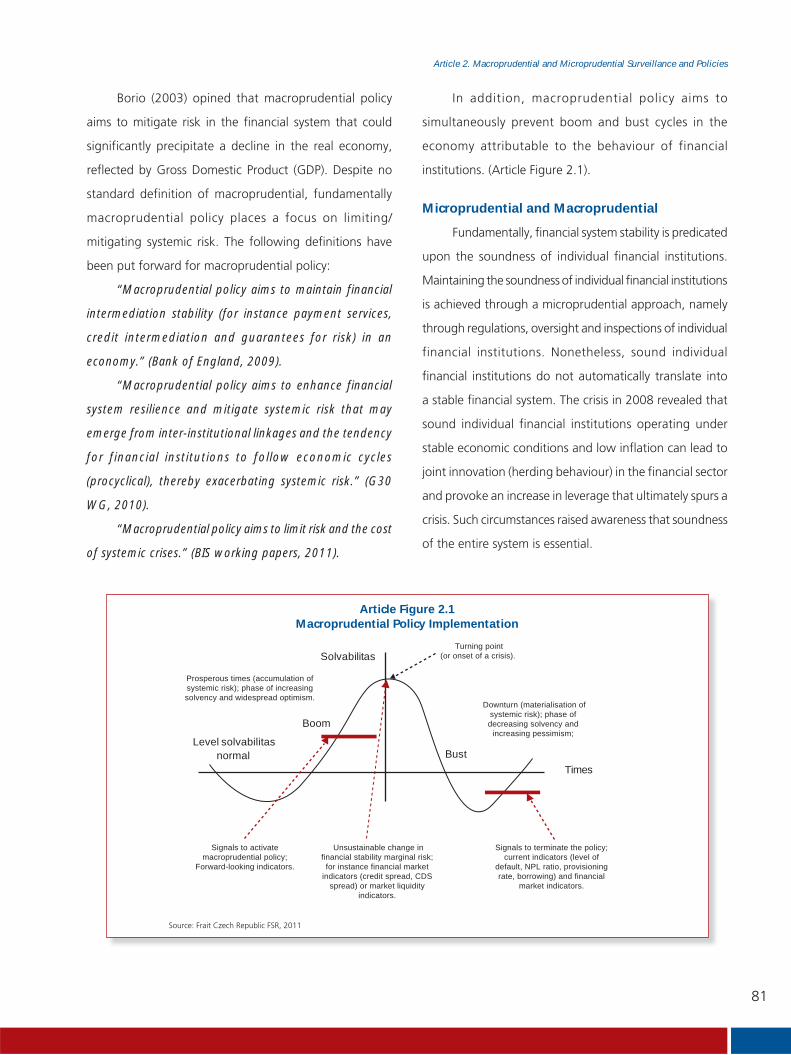
81
Article 2. Macroprudential and Microprudential Surveillance and Policies
Borio (2003) opined that macroprudential policy
aims to mitigate risk in the financial system that could
significantly precipitate a decline in the real economy,
reflected by Gross Domestic Product (GDP). Despite no
standard definition of macroprudential, fundamentally
macroprudential policy places a focus on limiting/
mitigating systemic risk. The following definitions have
been put forward for macroprudential policy:
“Macroprudential policy aims to maintain financial
intermediation stability (for instance payment services,
credit intermediation and guarantees for risk) in an
economy.” (Bank of England, 2009).
“Macroprudential policy aims to enhance financial
system resilience and mitigate systemic risk that may
emerge from inter-institutional linkages and the tendency
for financial institutions to follow economic cycles
(procyclical), thereby exacerbating systemic risk.” (G30
WG, 2010).
“Macroprudential policy aims to limit risk and the cost
of systemic crises.” (BIS working papers, 2011).
In addition, macroprudential policy aims to
simultaneously prevent boom and bust cycles in the
economy attributable to the behaviour of financial
institutions. (Article Figure 2.1).
Microprudential and Macroprudential
Fundamentally, financial system stability is predicated
upon the soundness of individual financial institutions.
Maintaining the soundness of individual financial institutions
is achieved through a microprudential approach, namely
through regulations, oversight and inspections of individual
financial institutions. Nonetheless, sound individual
financial institutions do not automatically translate into
a stable financial system. The crisis in 2008 revealed that
sound individual financial institutions operating under
stable economic conditions and low inflation can lead to
joint innovation (herding behaviour) in the financial sector
and provoke an increase in leverage that ultimately spurs a
crisis. Such circumstances raised awareness that soundness
of the entire system is essential.
Solvabilitas
Times
Level solvabilitasnormal Bust
Boom
Signals to activatemacroprudential policy;
Forward-looking indicators.
Downturn (materialisation of systemic risk); phase of decreasing solvency and
increasing pessimism;
Turning point(or onset of a crisis).
Prosperous times (accumulation of systemic risk); phase of increasing solvency and widespread optimism.
Unsustainable change in financial stability marginal risk;
for instance financial market indicators (credit spread, CDS
spread) or market liquidity indicators.
Signals to terminate the policy; current indicators (level of
default, NPL ratio, provisioning rate, borrowing) and financial
market indicators.
Article Figure 2.1Macroprudential Policy Implementation
Source: Frait Czech Republic FSR, 2011
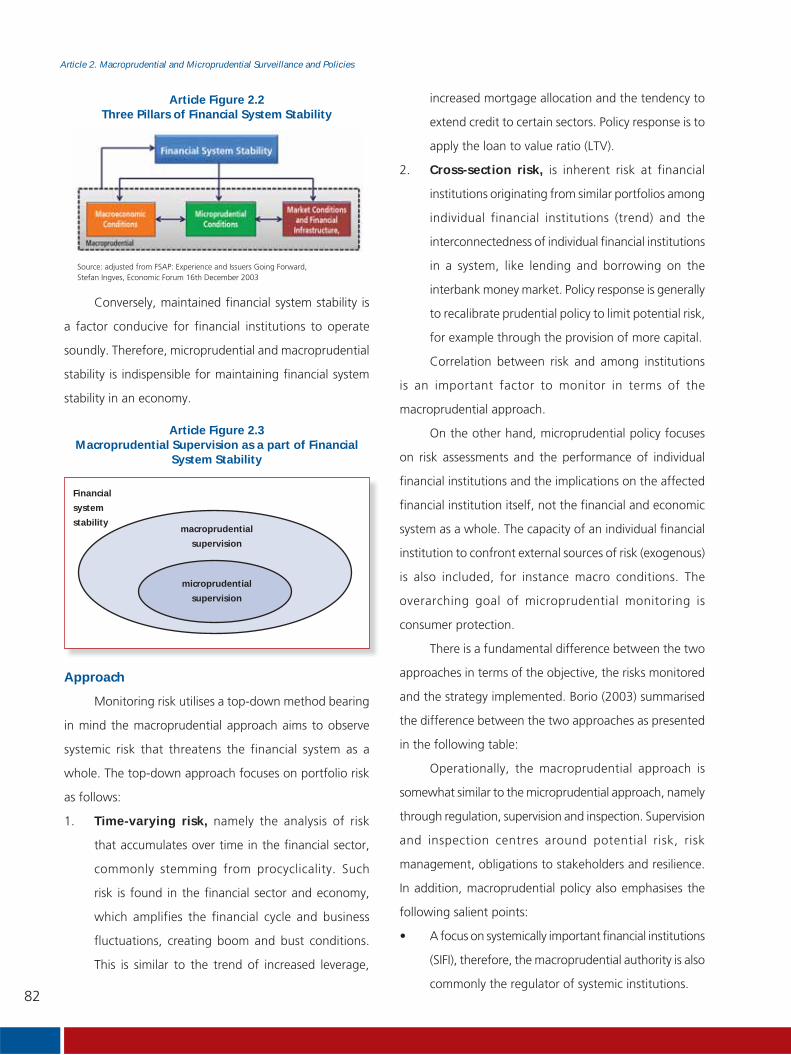
82
Article 2. Macroprudential and Microprudential Surveillance and Policies
increased mortgage allocation and the tendency to
extend credit to certain sectors. Policy response is to
apply the loan to value ratio (LTV).
2. Cross-section risk, is inherent risk at financial
institutions originating from similar portfolios among
individual financial institutions (trend) and the
interconnectedness of individual financial institutions
in a system, like lending and borrowing on the
interbank money market. Policy response is generally
to recalibrate prudential policy to limit potential risk,
for example through the provision of more capital.
Correlation between risk and among institutions
is an important factor to monitor in terms of the
macroprudential approach.
On the other hand, microprudential policy focuses
on risk assessments and the performance of individual
financial institutions and the implications on the affected
financial institution itself, not the financial and economic
system as a whole. The capacity of an individual financial
institution to confront external sources of risk (exogenous)
is also included, for instance macro conditions. The
overarching goal of microprudential monitoring is
consumer protection.
There is a fundamental difference between the two
approaches in terms of the objective, the risks monitored
and the strategy implemented. Borio (2003) summarised
the difference between the two approaches as presented
in the following table:
Operationally, the macroprudential approach is
somewhat similar to the microprudential approach, namely
through regulation, supervision and inspection. Supervision
and inspection centres around potential risk, risk
management, obligations to stakeholders and resilience.
In addition, macroprudential policy also emphasises the
following salient points:
• A focus on systemically important financial institutions
(SIFI), therefore, the macroprudential authority is also
commonly the regulator of systemic institutions.
Source: adjusted from FSAP: Experience and Issuers Going Forward,Stefan Ingves, Economic Forum 16th December 2003
Conversely, maintained financial system stability is
a factor conducive for financial institutions to operate
soundly. Therefore, microprudential and macroprudential
stability is indispensible for maintaining financial system
stability in an economy.
Article Figure 2.3Macroprudential Supervision as a part of Financial
System Stability
Article Figure 2.2Three Pillars of Financial System Stability
macroprudential
supervision
Financial
system
stability
microprudential
supervision
Approach
Monitoring risk utilises a top-down method bearing
in mind the macroprudential approach aims to observe
systemic risk that threatens the financial system as a
whole. The top-down approach focuses on portfolio risk
as follows:
1. Time-varying risk, namely the analysis of risk
that accumulates over time in the financial sector,
commonly stemming from procyclicality. Such
risk is found in the financial sector and economy,
which amplifies the financial cycle and business
fluctuations, creating boom and bust conditions.
This is similar to the trend of increased leverage,

83
Article 2. Macroprudential and Microprudential Surveillance and Policies
Article Table 2.1Macroprudential versus Microprudential Policies
Macroprudential Microprudential
Intermediate objective Monitoring and assessment of the financial system as a whole
Monitoring and assessment of the soundness of individual f inancial institutions
Overarching goal Reducing the cost of the crisis (decline in GDP)
Consumer protection.
Risk Model Partly endogenous Exogenous
Correlation and exposure to cross-border financial institutions (contagion risk)
Important Irrelevant
Prudential policy calibration Focus on systemic risk; top down Focus on the risk faced by individual financial institutions ; bottom up.
Source: Claudio Borio (2003), Towards a Macroprudential Framework for Financial Supervision and Regulation
• Monitoring industrial trends, including small
banks.
• Observing the impact on the financial system and
the economy:
o In the event of problems at a systemic financial
institution.
o Of financial institution trends holistically.
• The soundness group business model is crucial for
holding companies.
These issues are observed collectively as a whole in
relation to prevailing phenomena and macroeconomic
performance domestically and internationally to calculate
the probability of shocks and their impact on the financial
system. Monitoring represents the starting point when
looking for systemic potential. Consequently, stress tests
and simulations of various scenarios are regularly used
as the primary tools. Detailed surveillance is conducted
on individual financial institutions to corroborate the
conclusions drawn and avoid bias in the results or erroneous
signals when applying the top-down, macroprudential
approach.
Another difference is in the indicators used. The
macroprudential approach refers to Financial Soundness
Indicators (IMF) consisting of key indicators and additional
indicators, including aggregated banking, economic and
corporate indicators. An array of additional indicators can
be used depending on the dynamics faced. Meanwhile,
the microprudential approach refers to financial ratios
indicating the soundness level of individual banks,
including aspects of capital, asset quality, management
competence, financial performance, liquidity conditions,
market risk and other supporting indicators.
Macroprudential Policy Instruments
The most common macroprudential policies
introduced to prevent systemic risk stemming from time
varying risk and cross-section risk are presented in the
following table:
From a microprudential perspective, regulations are
instituted to maintain the soundness of individual banks
as follows:
• Relating to capital in order to control minimum
capital.
• Relating to asset quality by determining bank
asset quality, provisions and limitations on credit
allocation.
• Relating to management by reinforcing risk
management, governance, compliance, the
composition of directors and commissioners as well
as fit and proper tests.
• Relating to performance by limiting the disbursement
of dividends to shareholders.

84
Article 2. Macroprudential and Microprudential Surveillance and Policies
• Relating to liquidity by regulating the level of liquid
assets that must be maintained.
In addition to the more general regulations
promulgated, close monitoring is also conducted by
preventing certain activities through cease and desist
orders.
Institutions that play a Macroprudential Role
In principle, any authority can issue macroprudential
policy, however, central banks are considered the most
suitable (Nier, 2011). This has been evidenced over
the past decade, particularly during the 2008 crisis, by
central banks adjusting their vision and mission, including
regulations, to include or strengthen the financial system
stability function.
The results of an IMF survey on macroprudential
policy in 2010 revealed that of the 60 respondents globally,
as many as 90% of central banks were mandated with
maintaining financial system stability. Meanwhile, 48% of
those were also mandated with setting macroprudential
policy.
The function to maintain financial system stability
by central banks has also been reflected by an increase
in the publication of Financial Stability Reviews over the
past 15 years.
Central banks are the most appropriate institutions to
implement macroprudential policy based on the following
considerations:
a. Independence. Policy implementation in the
financial sector must be conducted by a fully
independent organisation. Independence helps to
minimise political intervention during disruptions
to the financial system. Independence encourages
central banks to take more rapid and decisive actions
prior to a financial crisis.
b. Comprehensive Instruments. Central banks are
able to rapidly mitigate the impact of financial system
instability on the economy through the existing
Tool Dimension of Risk
Time Varying Cross Section
Category 1. Tools developed specifically to mitigate systemic risk.
• Countercyclical capital buffer• Through-the-cycle valuation of margins or haircuts for repos• Levy on non core liabilities• Countercyclical change in risk weights for exposureto certain sectors• Time varying systemic liquidity surcharges
• Systemic capital surcharges• Systemic liquidity surcharges• Levyon non-core liabilities• Higher capital charges for trades not cleared through CCPs
Category 2. Recalibration tools.
• Time varying LTV, Debt to income and Loan to income caps• Timevarying limits in currency mismatch or exposures (e.g. Real estate)• Time varying limits on loan to deposit ratio• Time varying caps and limits on credit or credit growth• Dynamic provisioning• Stressed VaR• Rescalling risk weights
• Powers to break up financial firms on systemic risk concerns• Capital charge on derivative payable• Deposit insurance risk premiums sensitive to systemic risk• Restrictions on permissible activities
Source: IMF Paper 2011, Macroprudential Policy: An Organising Framework
Article Table 2.2Examples of Macroprudential Tools
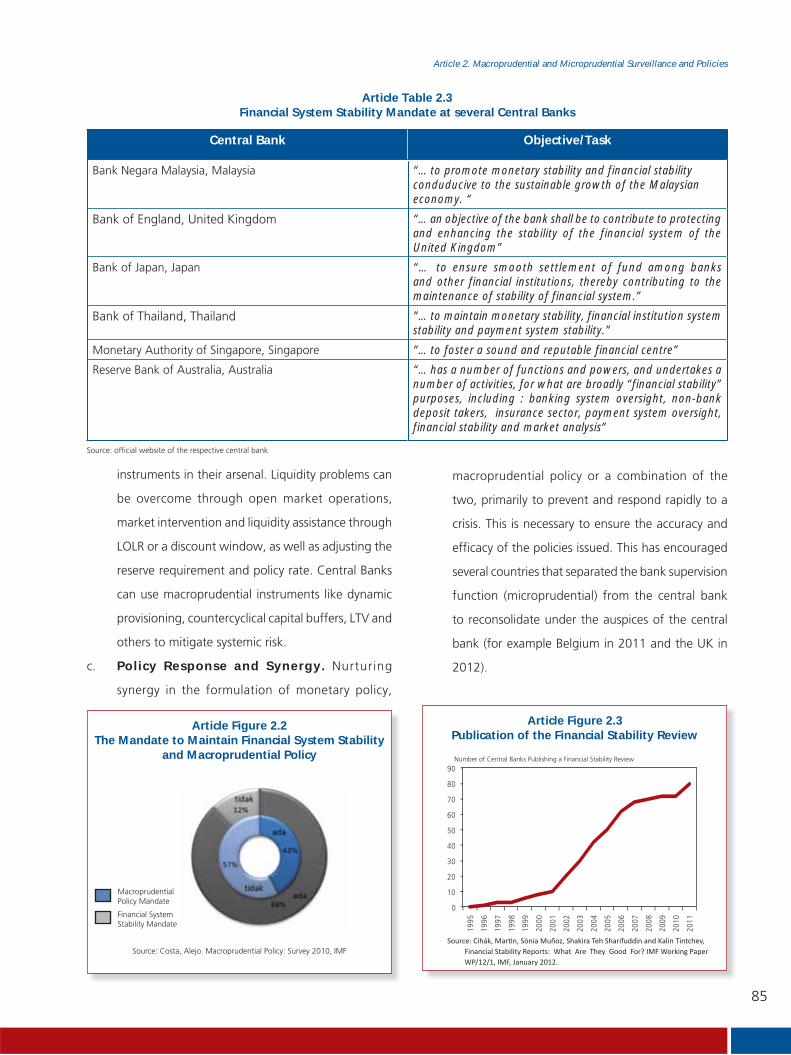
85
Article 2. Macroprudential and Microprudential Surveillance and Policies
Source: Costa, Alejo. Macroprudential Policy: Survey 2010, IMFSource: Cihák, Martin, Sònia Muñoz, Shakira Teh Sharifuddin and Kalin Tintchev,
Financial Stability Reports: What Are They Good For? IMF Working Paper WP/12/1, IMF, January 2012.
Article Figure 2.2 The Mandate to Maintain Financial System Stability
and Macroprudential Policy
Article Figure 2.3 Publication of the Financial Stability Review
Central Bank Objective/Task
Bank Negara Malaysia, Malaysia “…to promote monetary stability and financial stability conduducive to the sustainable growth of the Malaysian economy. “
Bank of England, United Kingdom “…an objective of the bank shall be to contribute to protecting and enhancing the stability of the financial system of the United Kingdom”
Bank of Japan, Japan “… to ensure smooth settlement of fund among banks and other financial institutions, thereby contributing to the maintenance of stability of financial system.”
Bank of Thailand, Thailand “…to maintain monetary stability, financial institution system stability and payment system stability.”
Monetary Authority of Singapore, Singapore “…to foster a sound and reputable financial centre”
Reserve Bank of Australia, Australia “…has a number of functions and powers, and undertakes a number of activities, for what are broadly “financial stability” purposes, including : banking system oversight, non-bank deposit takers, insurance sector, payment system oversight, financial stability and market analysis”
Source: official website of the respective central bank
Article Table 2.3Financial System Stability Mandate at several Central Banks
Macroprudential Policy Mandate
Financial System Stability Mandate
0
10
20
30
40
50
60
70
80
90
1995
1996
1997
1998
1999
2000
2001
2002
2003
2004
2005
2006
2007
2008
2009
2010
2011
.
Number of Central Banks Publishing a Financial Stability Review
instruments in their arsenal. Liquidity problems can
be overcome through open market operations,
market intervention and liquidity assistance through
LOLR or a discount window, as well as adjusting the
reserve requirement and policy rate. Central Banks
can use macroprudential instruments like dynamic
provisioning, countercyclical capital buffers, LTV and
others to mitigate systemic risk.
c. Policy Response and Synergy. Nurturing
synergy in the formulation of monetary policy,
macroprudential policy or a combination of the
two, primarily to prevent and respond rapidly to a
crisis. This is necessary to ensure the accuracy and
efficacy of the policies issued. This has encouraged
several countries that separated the bank supervision
function (microprudential) from the central bank
to reconsolidate under the auspices of the central
bank (for example Belgium in 2011 and the UK in
2012).
86
Article 2. Macroprudential and Microprudential Surveillance and Policies
d. In harmony with function as Lender of Last
Resort (LOLR). Efforts to create and maintain
financial system stability in line with its authority
as lender of last resort, which is required for crisis
prevention and resolution.
e. Comprehensive Resources. In general, central
banks have adequate resources in terms of competent
human resources, infrastructure, budget and
information systems.
Authority
From the existing literature, it can be summarised
that the authority naturally possessed by the institutions
mandated with implementing financial system stability/
macroprudential is as follows:
a. The authority to acquire data and information
concerning financial institutions. Data on individual
financial institutions is crucial in the analysis of
financial system conditions and systemic risk.
Furthermore, on-site examinations can be conducted
as required.
b. Designation powers. The institutions mandated with
implementing macroprudential policy also have the
authority to determine the scope of banks and non-
bank financial institutions that can individually or
jointly trigger systemic risk.
c. The authority to determine and formulate policy. The
macroprudential policy/regulations formulated can
be used to overcome problems in the financial system
according to the source and the level of risk.
d. The authority to use specific and effective instruments
to mitigate systemic risk.
Ultimately, the macroprudential institution chosen
will have a wide and extensive scope of authority, however,
this is necessary considering that the overarching goal
is vital for the economy of a country. Balancing this
broad scope of authority can be achieved through clear
governance and accountability.
Governance
Based on the considerations mentioned, accountability
and governance are prerequisites for the implementation
of macroprudential policy. Furthermore, a transparent
decision-making process is also crucial. In broad terms,
what has happened in other countries is as follows:
• Reporting surveillance activity and the macroprudential
policy taken regularly to the general public through
publications like the Financial Stability Review.
• Establishing internal and external financial stability
committees. Externally, such committees generally
consist of the central bank, the financial sector
regulator and the Ministry of Finance as members.
Under crisis conditions or if a troubled financial
institution is potentially systemic, such committees
decide which policy to take, including the use of
public funds.
Monetary Links
During the period leading up to the crisis in 2008,
success by central banks in terms of creating sound
macroeconomic conditions, as reflected by a low level of
inflation (low interest rates) to stimulate the economy,
was actually responded to very differently by investors.
Stable monetary and economic conditions, in actual fact,
triggered speculative actions by investors chasing higher
returns and led to more leveraging in order to expand their
opportunities. This was primarily attributable to excessively
high future expectations, which resulted in economic
bubbles and a financial crisis. Such conditions opened the
eyes of world to the trade-off between price stability and
financial system stability.
Investors created additional procyclicality (accelerating
economic growth during an expansionary period and
exacerbating the contractionary period) that spurred
fluctuations in economic output. Procyclicality appeared in
the business cycle and affected financial conditions due to

87
Article 2. Macroprudential and Microprudential Surveillance and Policies
the herding behaviour of investors. Consequently, boom
and bust conditions were created, which undermined the
efficacy of monetary policy implementation.
Considering that the natural mandate of a central
bank is in the monetary sector, namely price stability,
an additional macroeconomic mandate would serve to
bolster the effectiveness of monetary policy management.
Furthermore, positive synergy is created through the
implementation of monetary and macroprudential policy
under the auspices of the central bank (Nier, 2011). In
fact, Blachard (2010) also emphasised that the formulation
of monetary policy is improved if macroprudential
policymaking is housed under the same roof.
Accordingly, macroprudential policy formulation
will take into consideration conditions in the financial
sector and vice versa, thereby ensuring that the policies
issued are more effective and accurate. This is because
monetary policy and macroprudential policy directly affect
conditions in the economy and financial sector despite
differing objectives. Both policies are mutually beneficial
but not substitutable. Under crisis conditions the linkages
between monetary and macroprudential policy become
even clearer (Volcker 2010).
Implementation of Micro and Macroprudential
Policy in several Countries
The macro and microprudential approach has
become the focus of authorities in each country to
maintain financial system stability. In practice, macro
and microprudential supervision can be placed under the
umbrella of one authority or separated depending on the
structure and characteristics of the respective financial
system, legal system and culture of inter-institution
coordination. In other words, there is no one-size-fits-all
macroprudential framework.
Inflation expectationsAggregate supply-demand
High measure of debt levels (dangerous)Overvalued asset valueIndicators of excess liquidityIndicators of construction and activity on the property marketIndicators of internal and external economic equilibriumIndicators of the external position financial institutionsLevel of leverage between institutions and capitalRatio of market liquidity and other indicators of liquidityIndicators of asset maturity and liabilitiesIndicators of currency mismatch.
Policy Indicators
Monetary stability Financial sector resilience and capacity to absorb pressuresChanges in the financial cycleAsset price volatilityLevel of uncertainty that relates to the soundness of the financial system under unstable financial conditions
Intermediate Target
Monetary Stability Financial System StabilityUltimate Goal
Instruments Interest rateLiquidity management (OPO, etc)Forex intervention
Reserves (buffer)CAR (countercyclical buffers)Liquidity ratio – to prevent panic sales
Other macroprudential regulatory and supervision instrumentsLTV, etcCommunications
Short-term Interest RatesMoney In CirculationThe Exchange Rate
Capital And Bank Liquidity ChannelsBank Costs Related To Bank Risk Exposure
Price stability defined as low and stable inflation
Financial System Stability, namely preventing the spread of systemic risk
Transmission Mechanism
Sanctions Imposed On Banks And Non-bank Financial Institutions Due To An Increase In The Scale Of Risk
Article Table 2.4Monetary Stability versus Financial System Stability
Source: Bank Indonesia
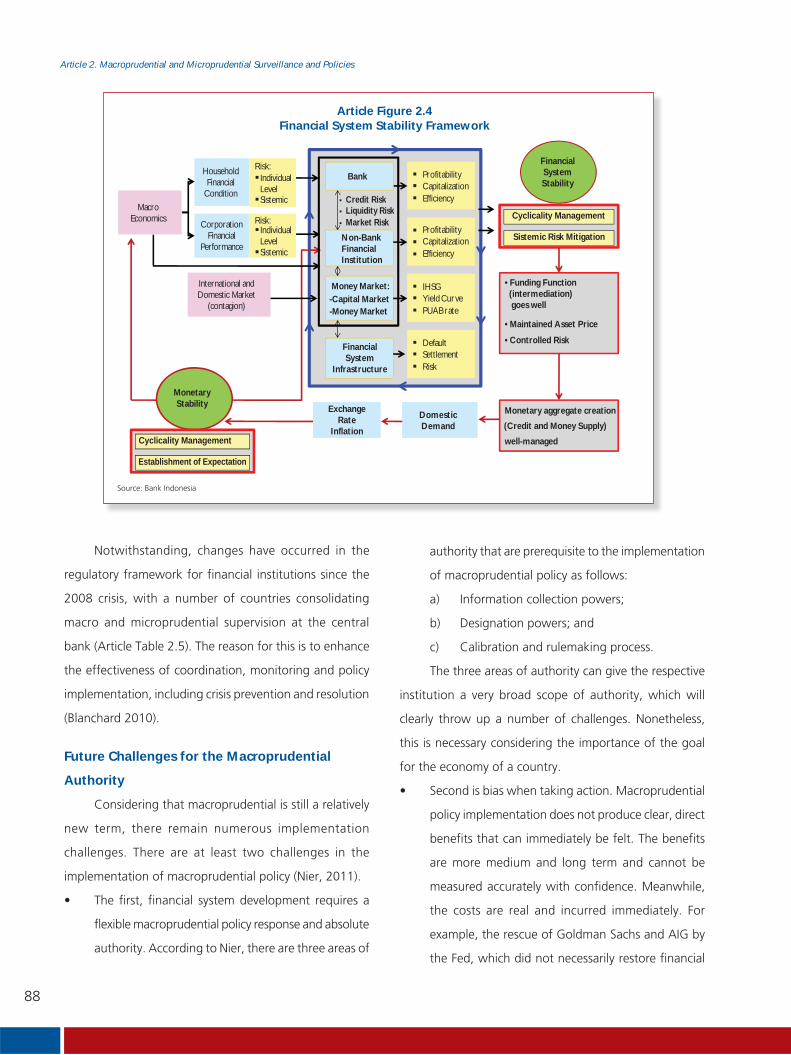
88
Article 2. Macroprudential and Microprudential Surveillance and Policies
MacroEconomics
HouseholdFinancial
Condition
CorporationFinancial
Performance
Bank
Non-BankFinancialInstitution
Money Market: -Capital Market-Money Market
FinancialSystem
Infrastructure
ProfitabilityCapitalizationEfficiency
ProfitabilityCapitalizationEfficiency
IHSGYield CurvePUAB rate
DefaultSettlementRisk
FinancialSystemStability
MonetaryStability Exchange
RateInflation
DomesticDemand
Risk:IndividualLevelSistemic Credit Risk
Liquidity RiskMarket Risk
International andDomestic Market
(contagion)
Cyclicality Management
Sistemic Risk Mitigation
• Funding Function (intermediation) goes well
• Maintained Asset Price
• Controlled Risk
Monetary aggregate creation
(Credit and Money Supply)
well-managedCyclicality Management
Establishment of Expectation
ProfitabilityCapitalizationEfficiency
Risk:IndividualLevelSistemic
Article Figure 2.4Financial System Stability Framework
Source: Bank Indonesia
Notwithstanding, changes have occurred in the
regulatory framework for financial institutions since the
2008 crisis, with a number of countries consolidating
macro and microprudential supervision at the central
bank (Article Table 2.5). The reason for this is to enhance
the effectiveness of coordination, monitoring and policy
implementation, including crisis prevention and resolution
(Blanchard 2010).
Future Challenges for the Macroprudential
Authority
Considering that macroprudential is still a relatively
new term, there remain numerous implementation
challenges. There are at least two challenges in the
implementation of macroprudential policy (Nier, 2011).
• The first, financial system development requires a
flexible macroprudential policy response and absolute
authority. According to Nier, there are three areas of
authority that are prerequisite to the implementation
of macroprudential policy as follows:
a) Information collection powers;
b) Designation powers; and
c) Calibration and rulemaking process.
The three areas of authority can give the respective
institution a very broad scope of authority, which will
clearly throw up a number of challenges. Nonetheless,
this is necessary considering the importance of the goal
for the economy of a country.
• Second is bias when taking action. Macroprudential
policy implementation does not produce clear, direct
benefits that can immediately be felt. The benefits
are more medium and long term and cannot be
measured accurately with confidence. Meanwhile,
the costs are real and incurred immediately. For
example, the rescue of Goldman Sachs and AIG by
the Fed, which did not necessarily restore financial
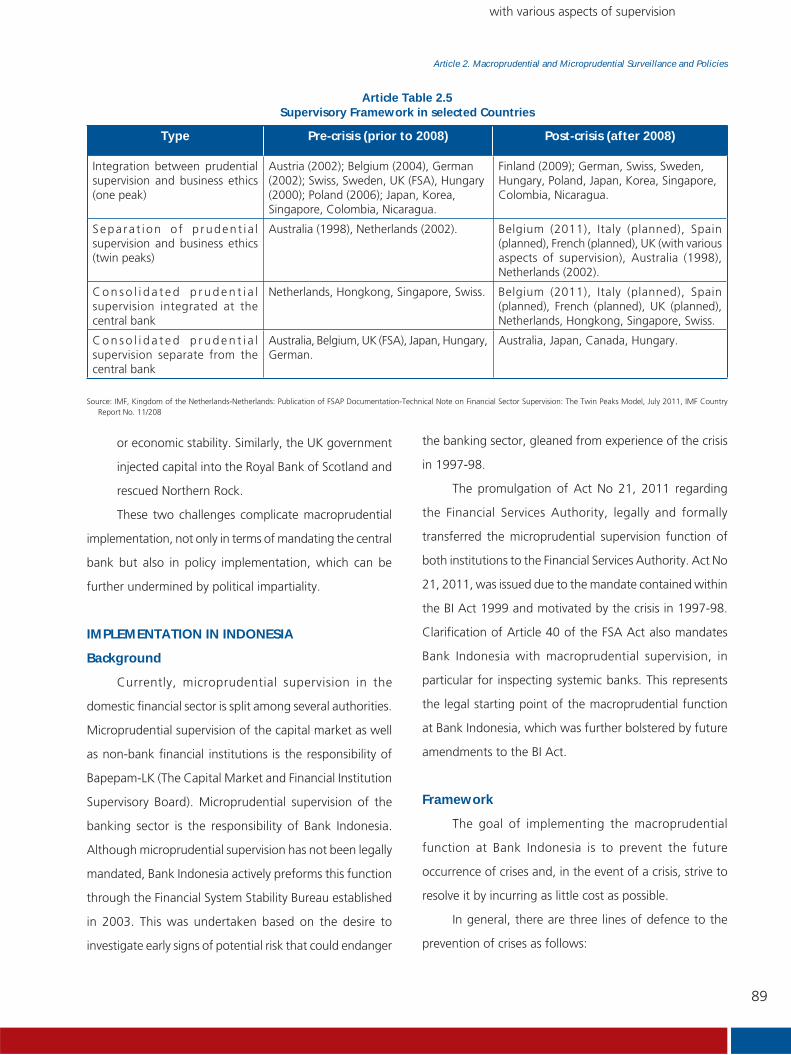
89
Article 2. Macroprudential and Microprudential Surveillance and Policies
the banking sector, gleaned from experience of the crisis
in 1997-98.
The promulgation of Act No 21, 2011 regarding
the Financial Services Authority, legally and formally
transferred the microprudential supervision function of
both institutions to the Financial Services Authority. Act No
21, 2011, was issued due to the mandate contained within
the BI Act 1999 and motivated by the crisis in 1997-98.
Clarification of Article 40 of the FSA Act also mandates
Bank Indonesia with macroprudential supervision, in
particular for inspecting systemic banks. This represents
the legal starting point of the macroprudential function
at Bank Indonesia, which was further bolstered by future
amendments to the BI Act.
Framework
The goal of implementing the macroprudential
function at Bank Indonesia is to prevent the future
occurrence of crises and, in the event of a crisis, strive to
resolve it by incurring as little cost as possible.
In general, there are three lines of defence to the
prevention of crises as follows:
or economic stability. Similarly, the UK government
injected capital into the Royal Bank of Scotland and
rescued Northern Rock.
These two challenges complicate macroprudential
implementation, not only in terms of mandating the central
bank but also in policy implementation, which can be
further undermined by political impartiality.
IMPLEMENTATION IN INDONESIA
Background
Currently, microprudential supervision in the
domestic financial sector is split among several authorities.
Microprudential supervision of the capital market as well
as non-bank financial institutions is the responsibility of
Bapepam-LK (The Capital Market and Financial Institution
Supervisory Board). Microprudential supervision of the
banking sector is the responsibility of Bank Indonesia.
Although microprudential supervision has not been legally
mandated, Bank Indonesia actively preforms this function
through the Financial System Stability Bureau established
in 2003. This was undertaken based on the desire to
investigate early signs of potential risk that could endanger
Type Pre-crisis (prior to 2008) Post-crisis (after 2008)
Integration between prudential supervision and business ethics (one peak)
Austria (2002); Belgium (2004), German (2002); Swiss, Sweden, UK (FSA), Hungary (2000); Poland (2006); Japan, Korea, Singapore, Colombia, Nicaragua.
Finland (2009); German, Swiss, Sweden, Hungary, Poland, Japan, Korea, Singapore, Colombia, Nicaragua.
Sepa ra t ion o f p rudent i a l supervision and business ethics (twin peaks)
Australia (1998), Netherlands (2002). Belgium (2011), Italy (planned), Spain (planned), French (planned), UK (with various aspects of supervision), Australia (1998), Netherlands (2002).
C o n s o l i d a t e d p r u d e n t i a l supervision integrated at the central bank
Netherlands, Hongkong, Singapore, Swiss. Belgium (2011), Italy (planned), Spain (planned), French (planned), UK (planned), Netherlands, Hongkong, Singapore, Swiss.
C o n s o l i d a t e d p r u d e n t i a l supervision separate from the central bank
Australia, Belgium, UK (FSA), Japan, Hungary, German.
Australia, Japan, Canada, Hungary.
Source: IMF, Kingdom of the Netherlands-Netherlands: Publication of FSAP Documentation-Technical Note on Financial Sector Supervision: The Twin Peaks Model, July 2011, IMF Country Report No. 11/208
Article Table 2.5Supervisory Framework in selected Countries
with various aspects of supervision
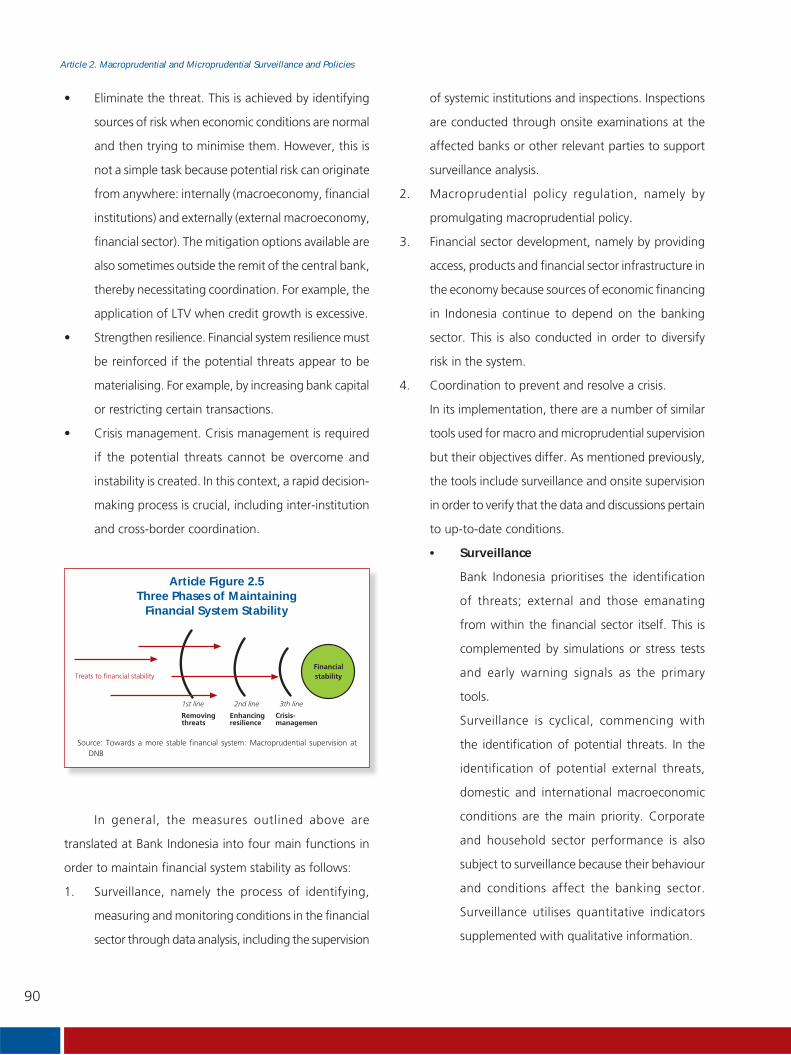
90
Article 2. Macroprudential and Microprudential Surveillance and Policies
• Eliminate the threat. This is achieved by identifying
sources of risk when economic conditions are normal
and then trying to minimise them. However, this is
not a simple task because potential risk can originate
from anywhere: internally (macroeconomy, financial
institutions) and externally (external macroeconomy,
financial sector). The mitigation options available are
also sometimes outside the remit of the central bank,
thereby necessitating coordination. For example, the
application of LTV when credit growth is excessive.
• Strengthen resilience. Financial system resilience must
be reinforced if the potential threats appear to be
materialising. For example, by increasing bank capital
or restricting certain transactions.
• Crisis management. Crisis management is required
if the potential threats cannot be overcome and
instability is created. In this context, a rapid decision-
making process is crucial, including inter-institution
and cross-border coordination.
of systemic institutions and inspections. Inspections
are conducted through onsite examinations at the
affected banks or other relevant parties to support
surveillance analysis.
2. Macroprudential policy regulation, namely by
promulgating macroprudential policy.
3. Financial sector development, namely by providing
access, products and financial sector infrastructure in
the economy because sources of economic financing
in Indonesia continue to depend on the banking
sector. This is also conducted in order to diversify
risk in the system.
4. Coordination to prevent and resolve a crisis.
In its implementation, there are a number of similar
tools used for macro and microprudential supervision
but their objectives differ. As mentioned previously,
the tools include surveillance and onsite supervision
in order to verify that the data and discussions pertain
to up-to-date conditions.
• Surveillance
Bank Indonesia prioritises the identification
of threats; external and those emanating
from within the financial sector itself. This is
complemented by simulations or stress tests
and early warning signals as the primary
tools.
Surveillance is cyclical, commencing with
the identification of potential threats. In the
identification of potential external threats,
domestic and international macroeconomic
conditions are the main priority. Corporate
and household sector performance is also
subject to surveillance because their behaviour
and conditions affect the banking sector.
Surveillance utilises quantitative indicators
supplemented with qualitative information.
Source: Towards a more stable financial system: Macroprudential supervision at DNB
Article Figure 2.5Three Phases of Maintaining
Financial System Stability
In general, the measures outlined above are
translated at Bank Indonesia into four main functions in
order to maintain financial system stability as follows:
1. Surveillance, namely the process of identifying,
measuring and monitoring conditions in the financial
sector through data analysis, including the supervision
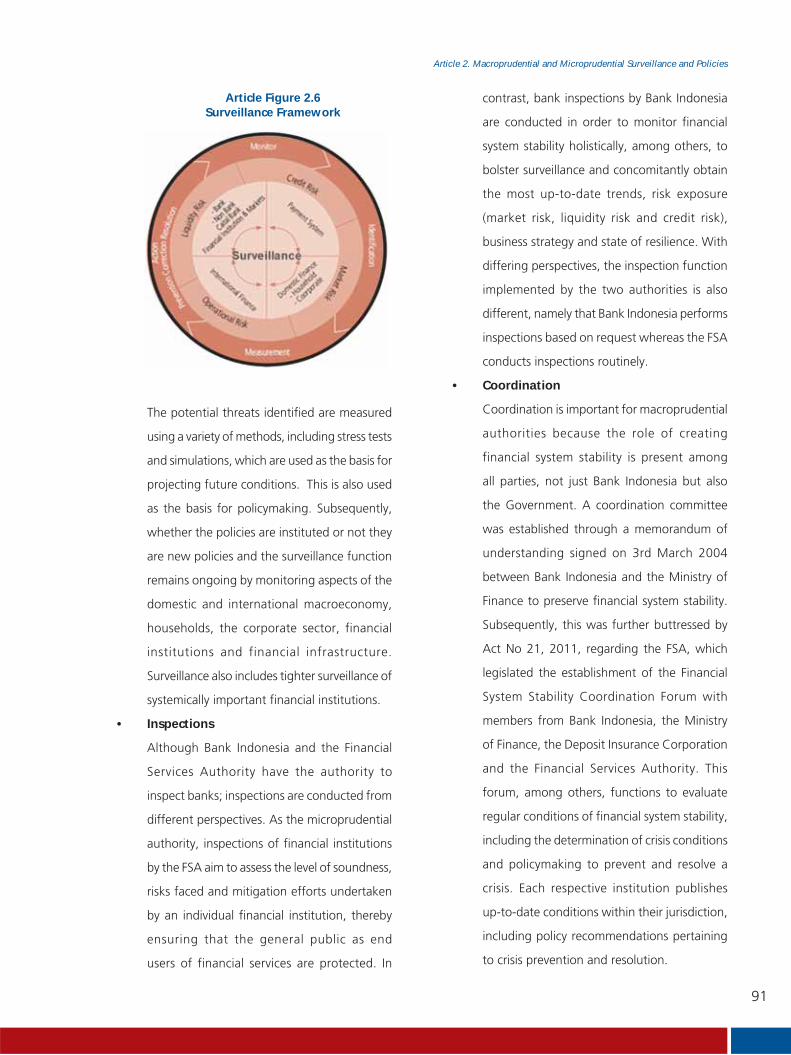
91
Article 2. Macroprudential and Microprudential Surveillance and Policies
contrast, bank inspections by Bank Indonesia
are conducted in order to monitor financial
system stability holistically, among others, to
bolster surveillance and concomitantly obtain
the most up-to-date trends, risk exposure
(market risk, liquidity risk and credit risk),
business strategy and state of resilience. With
differing perspectives, the inspection function
implemented by the two authorities is also
different, namely that Bank Indonesia performs
inspections based on request whereas the FSA
conducts inspections routinely.
• Coordination
Coordination is important for macroprudential
authorities because the role of creating
financial system stability is present among
all parties, not just Bank Indonesia but also
the Government. A coordination committee
was established through a memorandum of
understanding signed on 3rd March 2004
between Bank Indonesia and the Ministry of
Finance to preserve financial system stability.
Subsequently, this was further buttressed by
Act No 21, 2011, regarding the FSA, which
legislated the establishment of the Financial
System Stability Coordination Forum with
members from Bank Indonesia, the Ministry
of Finance, the Deposit Insurance Corporation
and the Financial Services Authority. This
forum, among others, functions to evaluate
regular conditions of financial system stability,
including the determination of crisis conditions
and policymaking to prevent and resolve a
crisis. Each respective institution publishes
up-to-date conditions within their jurisdiction,
including policy recommendations pertaining
to crisis prevention and resolution.
The potential threats identified are measured
using a variety of methods, including stress tests
and simulations, which are used as the basis for
projecting future conditions. This is also used
as the basis for policymaking. Subsequently,
whether the policies are instituted or not they
are new policies and the surveillance function
remains ongoing by monitoring aspects of the
domestic and international macroeconomy,
households, the corporate sector, financial
institutions and financial infrastructure.
Surveillance also includes tighter surveillance of
systemically important financial institutions.
• Inspections
Although Bank Indonesia and the Financial
Services Authority have the authority to
inspect banks; inspections are conducted from
different perspectives. As the microprudential
authority, inspections of financial institutions
by the FSA aim to assess the level of soundness,
risks faced and mitigation efforts undertaken
by an individual financial institution, thereby
ensuring that the general public as end
users of financial services are protected. In
Article Figure 2.6Surveillance Framework

92
Article 2. Macroprudential and Microprudential Surveillance and Policies
Coordination also consists of a sharing
mechanism as well as data and information
exchange.
• Governance
The macroprudential tasks and responsibilities
of Bank Indonesia are set forth in clear work
processes and the outputs are reported publicly
as a form of accountability. The reports can
be in the form of written reports like the
Financial Stability Review or regular reports
to the House of Representatives or seminars
and discussions with various stakeholders.
Meanwhile, internally Bank Indonesia formed
the Financial System Stability Committee.
CONCLUSION
Globalisation, economic l iberal isation and
financial sector deregulation supported by technological
advancements has created economic linkages, integrated
financial sectors and product complexity. This has
exacerbated the impact of contagion and the frequency
of crises. The crisis in 2008 provided an invaluable
lesson for all countries regarding the importance of
maintaining financial system stability through the
application of macroprudential policy. Despite no one-
size-fits-all framework, central banks around the world
have bolstered their function through the application of
macroprudential aspects by revising their respective vision
and mission as well as issuing regulations to broaden
their mandate. Initially, there were conflicts between
the monetary and macroprudential function, however,
the majority of the literature and practical experience
has shown the impact to be positive for the economy
thanks to synergy and the complementary nature. In
fact, the most recent phenomenon is for microprudential
regulators to consolidate under the central bank because
the transmission of monetary and macroprudential policy
of found in the microprudential function. This is meant
to boost the effectiveness of maintaining financial system
stability while supporting sustainable economic growth.
The separation of the microprudential authority
within the FSA, from the macroprudential function
implemented at Bank Indonesia means that effective task
implementation must be maintained at both authorities
through clear coordination. Coordination on crisis
prevention and resolution includes providing access to data
and information that supports task implementation at the
two institutions as well as a joint policy response.
References
1. Acharya, Viral and Matthew Richardson, Restoring
Financial Stability: How to Repair a Failed System,
prologue: A Bird’s Eye View, Wiley, 2009
2. Bank of England, Financial Stability Review, No.25 &
26, 2009.
3. Bank of England (2009), “The Role of Macroprudential
Policy”, Bank of England Discussion Paper
4. Beck, Thorsten, Asli Demirgüç-Kunt and Ross Levine,
Bank Concentration and Crisis, Working Paper 9921,
NBER, 2003.
5. Bikker J.A. and K. Haaf, Competition, Concentration
and Their Relationship: An Empirical Analysis of the
Banking Industry, Research Series Supervision no.
30, De Nederlandsche Bank, September 2000.
6. BIS working papers, Macoprudential policy - A
Literature Review, February 2011
7. Blanchard, O, G Dell’Ariccia, and P Mauro (2010),
“Rethinking Macroeconomic Policy”. IMF Staff
Position Note SPN/10/03, 12 Februari 2010.
8. Bonfiglioli, Alessandra and Caterina Mendicino,
F inancia l L ibera l izat ion, Bank Cr ises and
Growth:Assessing the Links, Oktober, 2004.
9. Borio, Claudio,Towards a macroprudential framework
for financial supervision and regulation? BIS Working
Papers.No 128, BIS, February 2003

93
Article 2. Macroprudential and Microprudential Surveillance and Policies
10. Borio, Claudio, Implementing a macroprudential
framework: Blending Boldness and Realism, BIS,
2010.
11. Borio, Claudio and Ilhyock Shim, What Can (Macro-)
Prudential Do to Support Monetary Policy, BIS
Working Paper, 2007
12. Boyd, John H, Gianni De Nicolò, and Abu M. Jalal,
Bank Risk-Taking and Competition Revisited: New
Theory and New Evidence, IMF Working Paper,
December 2006.
13. Brunnermeier, Markus, Andrew Crockett, Charles
Goodhart, Avinash D. Persaud and Hyun Shin, The
Fundamental Principles of Financial Regulation, ICMB
Januari 2009.
14. Čihák, Martin, Sònia Muñoz, Shakira Teh Sharifuddin,
dan Kalin Tintchev, Financial Stability Reports: What
Are They Good For?, IMF Working Paper WP/12/1,
IMF, Januari 2012
15. Costa, Alejo, Macroprudential Policy: Survey, 2010,
IMF
16. Crockett, Andrew, Marrying the micro- and macro-
prudential dimensions of financial stability, BIS,
2000
17. De Nicolo, Gianni, Phillip Bhartolomew, Johanara
Zaman, Mary Zephirin, Bank Consolidation,
Internalization and Conglomeration, Trend and
Implications for Financial Risk, IMF Working Paper,
Juli 2003.
18. Dutch National Bank, Towards a more stable financial
system: Macroprudential supervision at DN, 2010
19. Group of Thirty, Financial Reform, a Framework for
Financial Stability, Januari 2009.
20. WG G30, Enhancing Financial Stability and Resilience:
Macroprudential Policy, Tools, and Systems for the
Future, 2010
21. Guttmann, Robert, A Primer on Finance-Led
Capitalism and Its Crisis, Revue de la regulation,
November 2008.
22. Hannoun, Hervé, The expanding role of central
banks since the crisis: what are the limits?, 150th
Anniversary of the Central Bank of the Russian
Federation, Moscow, 18 June 2010
23. Hellmann, Thomas F, Kevin C. Murdock and Joseph
E. Stiglitz, Liberalization, Moral Hazard in Banking,
and Prudential Regulation: Are Capital Requirements
Enough?, 2000.
24. Hoggarth, Glenn, Jack Reidhill, and Peter Sinclair, On
the resolution of banking crises: theory and evidence,
Working Paper no. 229, 2002.
25. IMF, Kingdom of the Netherlands-Netherlands:
Publication of FSAP Documentation—Technical Note
on Financial Sector Supervision: The Twin Peaks
Model, July 2011, IMF Country Report No. 11/208
26. IMF Policy Paper, Macroprudential Policy: an
Organizing Framework, 2011
27. Minsky, Hyman P, The Financial Instability Hypothesis,
The Jerome Levy Economics Institute Working Paper
No. 74, Mei 1992.
28. Minsky, Hyman P, Financial Instability revisited: The
Economics of Disaster, Prepared for the Steering
Committee for the Fundamental Reappraisal of
the Discount Mechanism, Board of Governor FRSB,
1972.
29. Nier, Erlend W, Macroprudential Policy – Taxonomy
and Challenges, National Institute Economic Review
No. 216, R1-R15, April 2011
30. Nier, Erlend W., Jacek Osiński, Luis I. Jácome,
and Pamela Madrid, Institutional Models for
Macroprudential Policy, IMF, 1 November 1 2011.
31. Reinhart, Carmen M and Kenneth S. Rogoff,
Banking Crises: An Equal Opportunity Menace,
Desember 2008.
32. Viñals, José, Macroprudential Policy: An Organizing
Framework, IMF, 14 Maret 2011

This page intentionally blank

95
Article 3. Determinants of the Household Liquidity Requirement in Indonesia:
an Empirical Study with Data from the Household Balance Sheet Survey
Determinants of the Household Liquidity Requirement
in Indonesia: an Empirical Study with Data from the
Household Balance Sheet Survey
Article 3
The household sector has a relatively large impact on financial system stability and the macroeconomy.
A decline in the level of household liquidity can be an early warning indicator of disruptions to financial
stability in a country. Therefore, analyses on the level of liquidity in the household sector have come to
the attention of policymakers. This article attempts to analyse the internal determinants of the level of
household liquidity in Indonesia. Data from the 2010 household balance sheet survey conducted by Bank
Indonesia is used.
Results of the study indicate that a number of internal household factors play an important role in determining
household demand for liquidity. The most salient variables include, among others, household asset value,
household income, the ratio of household income to household assets, the household debt to income
ratio, debt to assets ratio, number of household members, ratio of operational profit to operational cash
in, level of operational cash out, cash out to repay debt, a dummy variable for employment, a dummy for
self-employed and property ownership. The variables for the age of eldest household member, a dummy
for pensioners and cash out for consumption were also significant for a number of estimates. The results of
this research also indicate that households in Indonesia hold liquid assets motivated by transactional motives
and precautionary motives.
Keyword : household liquidity, household behaviour, consumption.
JEL Classification Number : D14, D13, E21
INTRODUCTION
The level of liquidity in an economy affects
macroeconomic and financial stability. Excessive liquidity
can trigger rising inflation (asset price inflation), while a
very low level of liquidity leaves the economy vulnerable
to shocks. A variety of activities across a range of sectors
affects the overall level of liquidity, including real sector
activities (corporate and household) and government
activities.
Households, as a component of the real sector, play
a pivotal role in the economy, observable through three
lenses, namely as providers of production factors, as
consumers and as taxpayers on income earned from the
sale of production factors.
Bagus Santoso6, Pungky P. Wibowo7, Dwityapoetra S. Besar8
6 Faculty of Economics, GadjahMada University. Email [email protected] Deputy Director of the Department of Banking Research and Regulation, Bank Indonesia. Email [email protected] Deputy Director of the Department of Banking Research and Regulation, Bank Indonesia. Email [email protected]
96
Article 3. Determinants of the Household Liquidity Requirement in Indonesia:
an Empirical Study with Data from the Household Balance Sheet Survey
One concrete measure that can be taken to maintain
financial sector stability is the analysis of credit risk in the
household sector. Financially sound households have
a favourable impact on financial and macroeconomic
stability. Conversely, when the household sector
experiences a shock, financial and macroeconomic stability
is undermined. According to Kask (2003), financially
unsound households are an early warning indicator of
financial instability in a country.
Bank Indonesia, as the monetary authority, is fully
aware of the importance of preserving stability in the
household sector in order to maintain financial stability
overall. One form of surveillance conducted by Bank
Indonesia on the household sector is through a survey of
the household balance sheet (HBS), performed regularly
since 2007. The overarching goal of the survey is to
monitor the financial condition of households in Indonesia
from year to year, gauged using the balance sheet, cash
flow as well as profit or loss of each household.
This research has two main objectives: first is to
analyse the liquidity management behaviour of households
in Indonesia and identify what determines the level of
liquidity in Indonesian households; the second is to assist
policymaking at the monetary authority to preserve
household sector stability in order to buoy sustainable
economic growth.
This paper proceeds with a review of the literature
relating to the level of liquidity in general and specifically
the level in the household sector. The subsequent sections
present the research methodology, the empirical analysis
using 2010 HBS survey data and finally the conclusion and
policy recommendations.
LITERATURE REVIEW
Literature concerning household liquidity is relatively
scarce with not much previous research discussing the topic
comprehensively. Crane (1995) wrote one early research
paper that explored this issue. According to Crane (1995)
household demand for cash is affected by two factors,
namely predictable needs for cash and unpredictable
needs for cash. Crane postulated that households will
hold an amount of cash to accommodate their daily needs,
however households will encounter constraints under
such conditions, with households ultimately losing the
opportunity to accrue a return on that cash. In addition,
households tend to place their funds in current assets.
The results of research conducted by Hubbardet et
al. (1994)demonstrated that low-income households also
generally tend to have a lower level of savings compared
to higher income households. Additionally, Paxton and
Young (2010) as well as Lee and Sawada (2010) concluded
that level of wealth and access to credit has a strong
correlation with precautionary saving. Precautionary
savings are additional savings allocated by a household
from its wealth for use when a shock strikes. The form
of precautionary savings varies, including informal savings
and non-financial savings.
Cunha et al. (2011) found that determinants of
demand for household liquidity are not entirely the same
as factors affecting corporate demand for liquidity. In
determining their level of cash holdings, the household
decision-making process tends to be based on transactional
motives and precautionary motives. The former helps
simplify the household’s daily transactions while the latter
ensures the household holds an amount of cash as a
safety net. Differing from the corporate sector, asymmetric
information tends not to affect household demand for
liquidity.
97
Article 3. Determinants of the Household Liquidity Requirement in Indonesia:an Empirical Study with Data from the Household Balance Sheet Survey
Liquidityi= i+ β1Ln_asseti +β2 Ln_disp_inci +β3ras_de_asi +β4 ras_de_inci +β5 ras_inc_asi +β6 Ln_hh_memi +β7 Ln_eldesti +β8 ln_lasti_networth +β9 ras_operationali _profit +β10 ln_consumption credit_operationali +β11Ln_consumption credit_investmenti +β12 Ln_consumption credit_crediti_funding +β13 ln_consumption credit_consumptioni+β14 Ln_working capital credit_operationali +β15 Ln_working capital credit_investmenti +β16 Ln_working capital credit_fundingi+ β17 dum_peni+β18 dum_own_homei+β19 dum_empl β20 dum_selfi
METHODOLOGY
Research Data
This working paper utilises data obtained from the
household balance sheet (HBS) survey in 2010, which can
be constructed to a form and definition similar to that of
the corporate sector, thereby making it easier to apply
corporate concepts to the household sector. In addition
to financial data, the HBS survey also covers demographic
data.
This research uses data from 4,052 households
in Indonesia, equivalent to the size of the valid sample
from the HBS survey. The data is sourced from three
household financial reports, namely the household balance
sheet, household cash flow and household profit or loss,
complemented by demographic information.
Research Model
This study adapts the model developed by Cunha
et al. (2011) in order to analyse the determinants of the
level of liquidity in the household sector in Indonesia. The
research conducted by Cunha et al. (2011) was in fact the
application and development of the model constructed
by Opler et al. (1999) but with a focus on households. A
number of modifications are made in this paper to the
model of Cunha et al. (2011), the objective of which is to
more clearly explain the characteristics of the household
sector in Indonesia.
A number of additional variables are included in this
research in line with the findings of other relevant studies,
for instance Paxton and Young (2010) and Lee and Sawada
(2010), and variables suspected of having a significant
correlation with the household level of liquidity.
The research model of Cunha et al. (2011) was
modified by only using cross-sectional data of all sample
households in each period. In general, the research model
developed in this study can be expressed as follows:
(1)
The model detailed in Equation (1) is estimated using
a number of liquidity measures as follows:
a) Cash logarithm;
b) Cash and savings logarithm;
c) Cash, savings and checking logarithm;
d) Cash, savings, checking and term deposit
logarithm;
e) Savings, checking and term deposit logarithm;
f) Ratio of cash to total assets (in %); and
g) Ratio of current assets to total assets (in %).
A summary of the expected signs of the respective
independent variables is presented in Article Table 3.1 as
follows:

98
Article 3. Determinants of the Household Liquidity Requirement in Indonesia:an Empirical Study with Data from the Household Balance Sheet Survey
Article Table 3.1Definition of Independent Variables used in the Model
Independent Variable Description Expected Sign
ln_asset Total asset logarithm +/-
ln_disp_inc disposable income logarithm +/-
pct_de_as percentage of debt to total assets +/-
pct_de_inc percentage of debt to disposable income +/-
pct_inc_as percentage of disposable income to total assets -
ln_hh_mem number of household members logarithm +/-
ln_eldest_age age of eldest household member logarithm +/-
ln_last_networth household net worth logarithm +
pct_operasional_profit percentage of profit/loss to operational cash in +
ln_consumption credit_operational
operational cash out logarithmhousehold spending on productive processes
+
ln_consumption credit_investment
investment cash out logarithmcash outflow from investment activity
+
ln_consumption credit_credit_funding
funding cash out for debt logarithmhousehold repayments
+
ln_consumption credit_consumption
consumption cash out logarithm +
ln_working capital credit_operational
operational cash in logarithmhousehold income from productive household sectors
+
ln_working capital credit_investment
investment cash in logarithmcash inflow from investment activity
+
ln_working capital credit_funding
funding cash in logarithmreceipt of payments from third parties
+
Dum_pen dummy, if 1: pension and 0: othersfor households with pensioners
+
Dum_own_home dummy, if 1: owns a house and 0: othersfor households that own the property
-
Dum_empl dummy, if 1: employed and 0: othersfor households with working members
+
Dum_self dummy, if 1: self-employed and 0: othersfor households that conduct business activity.
+
Estimation Results
The research model is estimated using the Ordinary
Least Square (OLS) method for each non-independent
variable. Each regression model estimated was confirmed
not to contain independent variables with serious
multicollinearity. The estimation process was performed
using E-Views and Oxmetrics software. The general-to-
specific method model developed by David F. Hendry
(1995) is applied in this research in order to obtain the
best final model from each estimation conducted. The
estimation process begins with a general unrestricted
model (GUM) that is gradually reduced to produce the
best and most robust final model.
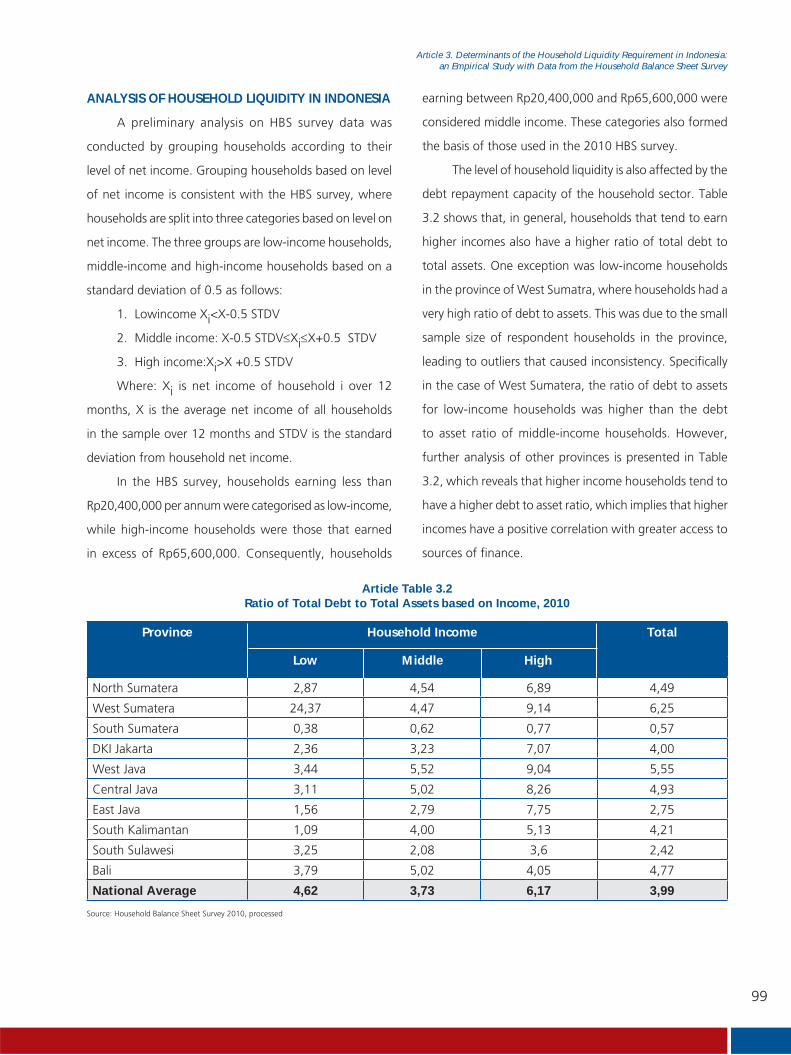
99
Article 3. Determinants of the Household Liquidity Requirement in Indonesia:
an Empirical Study with Data from the Household Balance Sheet Survey
earning between Rp20,400,000 and Rp65,600,000 were
considered middle income. These categories also formed
the basis of those used in the 2010 HBS survey.
The level of household liquidity is also affected by the
debt repayment capacity of the household sector. Table
3.2 shows that, in general, households that tend to earn
higher incomes also have a higher ratio of total debt to
total assets. One exception was low-income households
in the province of West Sumatra, where households had a
very high ratio of debt to assets. This was due to the small
sample size of respondent households in the province,
leading to outliers that caused inconsistency. Specifically
in the case of West Sumatera, the ratio of debt to assets
for low-income households was higher than the debt
to asset ratio of middle-income households. However,
further analysis of other provinces is presented in Table
3.2, which reveals that higher income households tend to
have a higher debt to asset ratio, which implies that higher
incomes have a positive correlation with greater access to
sources of finance.
ANALYSIS OF HOUSEHOLD LIQUIDITY IN INDONESIA
A preliminary analysis on HBS survey data was
conducted by grouping households according to their
level of net income. Grouping households based on level
of net income is consistent with the HBS survey, where
households are split into three categories based on level on
net income. The three groups are low-income households,
middle-income and high-income households based on a
standard deviation of 0.5 as follows:
1. Lowincome Xi<X-0.5 STDV
2. Middle income: X-0.5 STDV≤Xi≤X+0.5 STDV
3. High income:Xi>X +0.5 STDV
Where: Xi is net income of household i over 12
months, X is the average net income of all households
in the sample over 12 months and STDV is the standard
deviation from household net income.
In the HBS survey, households earning less than
Rp20,400,000 per annum were categorised as low-income,
while high-income households were those that earned
in excess of Rp65,600,000. Consequently, households
Province Household Income Total
North Sumatera 2,87 4,54 6,89 4,49
West Sumatera 24,37 4,47 9,14 6,25
South Sumatera 0,38 0,62 0,77 0,57
DKI Jakarta 2,36 3,23 7,07 4,00
West Java 3,44 5,52 9,04 5,55
Central Java 3,11 5,02 8,26 4,93
East Java 1,56 2,79 7,75 2,75
South Kalimantan 1,09 4,00 5,13 4,21
South Sulawesi 3,25 2,08 3,6 2,42
Bali 3,79 5,02 4,05 4,77
National Average 4,62 3,73 6,17 3,99
Article Table 3.2Ratio of Total Debt to Total Assets based on Income, 2010
Low Middle High
Source: Household Balance Sheet Survey 2010, processed

100
Article 3. Determinants of the Household Liquidity Requirement in Indonesia:
an Empirical Study with Data from the Household Balance Sheet Survey
One measure of household liquidity is the ratio of
household short-term debt to household current assets.
On average, the value of the short-term debt to current
assets ratio varied across the different provinces, ranging
from 0.58% in South Sumatera to 54.8% in West Java, as
presented in Table 3.3. The table also illustrates a common
pattern, or inverse correlation, between the level of current
assets and the level of income. This denotes that high-
income households tend to have more liquidity compared
to low-income households.
More specifically, we can analyse the ratio of
household debt held at banks to fixed assets. Based on
the results of the 2010 HBS survey as presented in Table
3.4, it can be noted that the ratio of household debt held
at banks to fixed assets is in the range of 0.46% (South
Sumatera) to 4.16% (Bali). In general, Table 3.4 reveals
that high-income households tend to have a relatively
higher portion of debt at banks compared to low-income
households. This indicates that higher incomes positively
correlate to broader household access to bank loans.
Province Household Income Total
North Sumatera 82,43 29,37 5,34 37,3
West Sumatera 0,00 17,87 8,2 14,8
South Sumatera 1,17 0,4 0,06 0,58
DKI Jakarta 30,88 43,16 21,56 36,9
West Java 58,95 59,91 22,99 54,8
Central Java 36,2 25,84 13,18 26,9
East Java 10,49 12,22 28,14 12,7
South Kalimantan 54,8 11,56 4,51 12,7
South Sulawesi 1,95 7,02 3,97 5,97
Bali 9,43 21,82 0,82 17,6
National Average 28,63 22,917 10,877 22,037
Table Article 3.3Ratio of Short-Term Debt to Current Assets based on Level of Income, 2010
Low Middle High
Source: Household Balance Sheet Survey 2010, processed
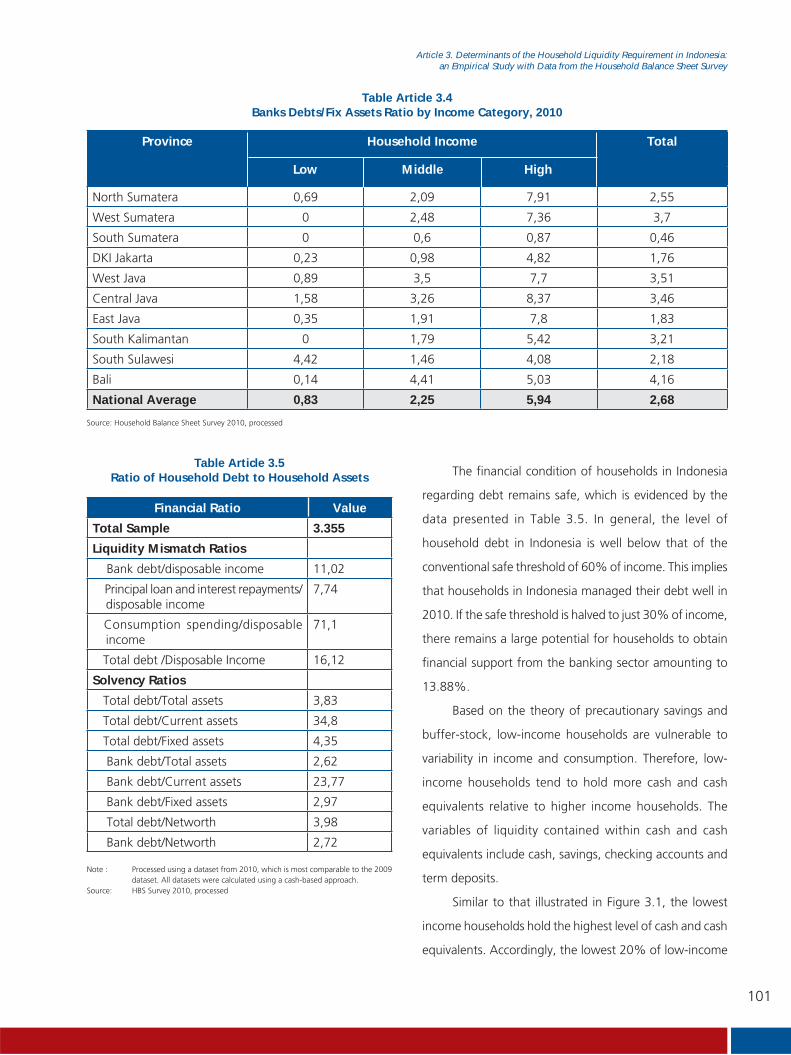
101
Article 3. Determinants of the Household Liquidity Requirement in Indonesia:
an Empirical Study with Data from the Household Balance Sheet Survey
Province Household Income Total
North Sumatera 0,69 2,09 7,91 2,55
West Sumatera 0 2,48 7,36 3,7
South Sumatera 0 0,6 0,87 0,46
DKI Jakarta 0,23 0,98 4,82 1,76
West Java 0,89 3,5 7,7 3,51
Central Java 1,58 3,26 8,37 3,46
East Java 0,35 1,91 7,8 1,83
South Kalimantan 0 1,79 5,42 3,21
South Sulawesi 4,42 1,46 4,08 2,18
Bali 0,14 4,41 5,03 4,16
National Average 0,83 2,25 5,94 2,68
Table Article 3.4Banks Debts/Fix Assets Ratio by Income Category, 2010
Low Middle High
Source: Household Balance Sheet Survey 2010, processed
Table Article 3.5Ratio of Household Debt to Household Assets
Financial Ratio Value
Total Sample 3.355
Liquidity Mismatch Ratios
Bank debt/disposable income 11,02
Principal loan and interest repayments/disposable income
7,74
Consumption spending/disposable income
71,1
Total debt /Disposable Income 16,12
Solvency Ratios
Total debt/Total assets 3,83
Total debt/Current assets 34,8
Total debt/Fixed assets 4,35
Bank debt/Total assets 2,62
Bank debt/Current assets 23,77
Bank debt/Fixed assets 2,97
Total debt/Networth 3,98
Bank debt/Networth 2,72
Note : Processed using a dataset from 2010, which is most comparable to the 2009 dataset. All datasets were calculated using a cash-based approach.
Source: HBS Survey 2010, processed
The financial condition of households in Indonesia
regarding debt remains safe, which is evidenced by the
data presented in Table 3.5. In general, the level of
household debt in Indonesia is well below that of the
conventional safe threshold of 60% of income. This implies
that households in Indonesia managed their debt well in
2010. If the safe threshold is halved to just 30% of income,
there remains a large potential for households to obtain
financial support from the banking sector amounting to
13.88%.
Based on the theory of precautionary savings and
buffer-stock, low-income households are vulnerable to
variability in income and consumption. Therefore, low-
income households tend to hold more cash and cash
equivalents relative to higher income households. The
variables of liquidity contained within cash and cash
equivalents include cash, savings, checking accounts and
term deposits.
Similar to that illustrated in Figure 3.1, the lowest
income households hold the highest level of cash and cash
equivalents. Accordingly, the lowest 20% of low-income
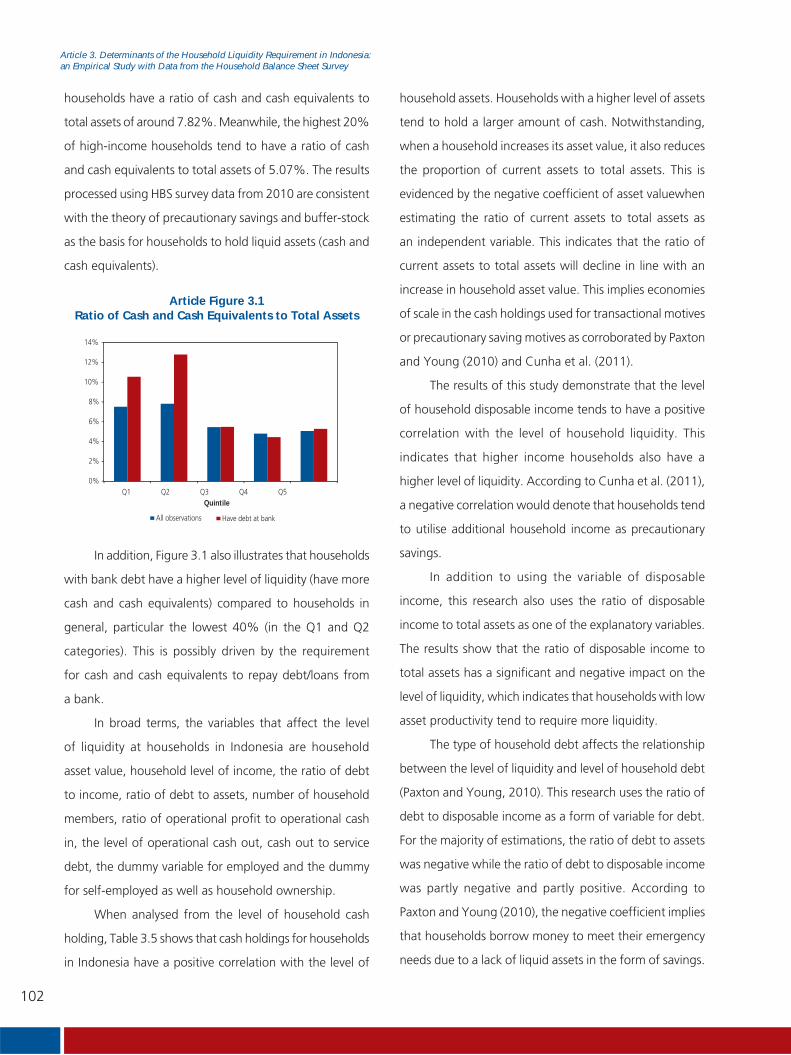
102
Article 3. Determinants of the Household Liquidity Requirement in Indonesia:
an Empirical Study with Data from the Household Balance Sheet Survey
households have a ratio of cash and cash equivalents to
total assets of around 7.82%. Meanwhile, the highest 20%
of high-income households tend to have a ratio of cash
and cash equivalents to total assets of 5.07%. The results
processed using HBS survey data from 2010 are consistent
with the theory of precautionary savings and buffer-stock
as the basis for households to hold liquid assets (cash and
cash equivalents).
household assets. Households with a higher level of assets
tend to hold a larger amount of cash. Notwithstanding,
when a household increases its asset value, it also reduces
the proportion of current assets to total assets. This is
evidenced by the negative coefficient of asset valuewhen
estimating the ratio of current assets to total assets as
an independent variable. This indicates that the ratio of
current assets to total assets will decline in line with an
increase in household asset value. This implies economies
of scale in the cash holdings used for transactional motives
or precautionary saving motives as corroborated by Paxton
and Young (2010) and Cunha et al. (2011).
The results of this study demonstrate that the level
of household disposable income tends to have a positive
correlation with the level of household liquidity. This
indicates that higher income households also have a
higher level of liquidity. According to Cunha et al. (2011),
a negative correlation would denote that households tend
to utilise additional household income as precautionary
savings.
In addition to using the variable of disposable
income, this research also uses the ratio of disposable
income to total assets as one of the explanatory variables.
The results show that the ratio of disposable income to
total assets has a significant and negative impact on the
level of liquidity, which indicates that households with low
asset productivity tend to require more liquidity.
The type of household debt affects the relationship
between the level of liquidity and level of household debt
(Paxton and Young, 2010). This research uses the ratio of
debt to disposable income as a form of variable for debt.
For the majority of estimations, the ratio of debt to assets
was negative while the ratio of debt to disposable income
was partly negative and partly positive. According to
Paxton and Young (2010), the negative coefficient implies
that households borrow money to meet their emergency
needs due to a lack of liquid assets in the form of savings.
Article Figure 3.1Ratio of Cash and Cash Equivalents to Total Assets
0%
2%
4%
6%
8%
10%
12%
14%
Q1 Q2 Q3 Q4 Q5Quintile
All observations Have debt at bank
In addition, Figure 3.1 also illustrates that households
with bank debt have a higher level of liquidity (have more
cash and cash equivalents) compared to households in
general, particular the lowest 40% (in the Q1 and Q2
categories). This is possibly driven by the requirement
for cash and cash equivalents to repay debt/loans from
a bank.
In broad terms, the variables that affect the level
of liquidity at households in Indonesia are household
asset value, household level of income, the ratio of debt
to income, ratio of debt to assets, number of household
members, ratio of operational profit to operational cash
in, the level of operational cash out, cash out to service
debt, the dummy variable for employed and the dummy
for self-employed as well as household ownership.
When analysed from the level of household cash
holding, Table 3.5 shows that cash holdings for households
in Indonesia have a positive correlation with the level of
103
Article 3. Determinants of the Household Liquidity Requirement in Indonesia:
an Empirical Study with Data from the Household Balance Sheet Survey
Meanwhile, a positive coefficient indicates that households
have sufficient liquid assets and income but tend to
allocate this to precautionary savings. Therefore, it is most
likely that household debt is used to meet the investment
needs of the household (in the form of financial assets or
fixed assets like property or motor vehicles). In brief, this
indicates that a portion of households in Indonesiautilise
debt to cover their emergency needs yet another portion
uses their debt for investment purposes or the purchase
of assets.
The number of household members had a negative
correlation in all final models, which reveals that as
households expand they tend to require more liquidity to
fund spending on daily household needs. High spending
on household expenses also makes it more difficult for the
households to allocate funds to savings and, hence, such
households tend to have a limited saving portfolio.
The variable net worth had a positive affect on
the level of household liquidity, which indicates that
households with a higher net worth tend to have larger
cash holdings. Moreover, the proportion of current assets
to total assets tended to decline as net worth increases,
similar to that shown by estimations using the ratio of
current assets to total assets as a dependent variable. Such
conditions show that an increase in net worth precipitates
a change in asset portfolio, where households tend to hold
a larger portion of fixed assets.
The level of profitability (ratio of profit or loss to
operational income) produced the expected sign and
significance consistently for each model, which indicates
that highly profitable households tend also to have a higher
level of liquidity.
The variable of cash in/out for operational activity
had a positive coefficient, which reveals that household
demand for liquidity is driven by transactional motives,
where the households tend to use liquid assets for
operational activities.
In contrast, the variable of cash in/out for investment
activity had a negative coefficient, while the coefficient of
cash out for investment was positive. These findings show
that when a household is awash with excess liquidity the
household tends to spend on investment, for instance
through the purchase of financial assets to store wealth.
Conversely, when a liquidity shortfall isexperienced,
households tend to disinvest, for example by liquidating
financial assets or lending household assets.
This research utilisedthe variable of cash out to
service debt as a determinant of household liquidity.
The results show that the coefficient of this variable is
ambiguous. The level of household liquidity measured
using total savings, checking accounts and term deposits
correlates positively to the variable cash out. Nevertheless,
liquidity measured using the amount of cash held had a
negative correlationwith cash out to service debt. This
indicates that the household requirement for liquidity to
repay outstanding liabilities tends to exceed the amount
of cash available, thereby forcing households to dip into
their savings, checking accounts or term deposits to service
the debt.
Estimation results also show that households with
members in employment also have a higher level of
liquidity. This is because those in employment tend to have
a higher level of income compared to the unemployed.
The findings demonstrate that higher levels of income led
to higher levels of liquidity.
Meanwhile, the dummy variable for self-employed
household members had different signs of coefficient for
the different measures of liquidity. Households with self-
employed members tended to hold more cash, however,
their level of liquidity from the perspective of cash and
cash equivalents (cash, savings, checking accounts, term
deposits) was lower. This indicates that households with
a small business or self-employed members tend to make
relatively more cash-based transactions.
104
Article 3. Determinants of the Household Liquidity Requirement in Indonesia:
an Empirical Study with Data from the Household Balance Sheet Survey
The dummy variable for households that own their
housewas significant in the majority of models with a
negative coefficient. This reveals that households with
property tend to have less liquidity than those not in
possession of property. This can be explained by two
considerations as follows:
1. Households that own their house tend to have more
fixed assets (a change in the asset portfolio).
2. Households that own property tend to have less need
to rent a house compared to households that do not
own property.
The variable for the age of the eldest household
member, the dummy variable for pensions and cash out
for consumption were also significant in a number of
estimations. Similar to the coefficient for total household
members, the variable for the age of the eldest household
member had a negative coefficient. As explained by Paxton
and Young (2010), this negative coefficient is evidence
of a dissaving process by households as the ages of
their members increase. Household members of pension
age experience a decline in income, thereby reducing
household liquidity. Therefore, dissaving is commonplace
in order to meet the spending needs of the household.
The dummy variable of pension in this research
predominantly had a positive coefficient in line with
expectations. This indicates that households with pensioners
tend to have stronger demand for liquidity than households
without members of pension age. This can be explained by
the physical limitations of pensioner households in terms
of liquidating assets as required. According to Cunha et al.
(2011), households with pensioners require more liquidity
due to higher risk aversion.
The variable cash out for consumption spending had
a positive correlation in a number of the models, which
indicates that demand for household liquidity is driven by
transactional motives, where the households tend to utilise
liquid assets to meet the daily needs.
CONCLUSION AND POLICY RECOMMENDATIONS
This research strived to analyse the determinants
of household liquidity in Indonesia. The findings provide
empirical evidence that internal factors play an important
role in determining household demand for liquidity. The
factors include, among others, household asset value, ratio
of household income to household assets, ratio of debt
to income, ratio of debt to assets, number of household
members, ratio of operational profit to operation cash in,
the level of operational cash out, cash out to service debt,
the dummy variables for employed and self-employed as
well as property ownership. The variable for the age of the
eldest household member, the dummy for pensioners and
consumption cash out were also significant for a number
of estimations. The results of this study also showed that
households in Indonesia hold liquid assets motivated by
transactions and precautionary saving.
Disruptions to the financial stability of the household
sector can affect the financial stability of the economy
overall. Therefore, the findings of this research into the
level of household liquidity are expected to assist the
policymaking process in order to formulate appropriate
policies that maintain financial system stability. In particular,
policymakers could formulate strategic measures to
facilitate an increase in liquidity at households experiencing
liquidity shortfalls, for instance through household
financing schemes that do not leave households exposed
and vulnerable to shocks. In addition, policymakers could
also formulate a strategy to help absorb excess liquidity
at households experiencing a liquidity surplus, reallocating
the liquidity to productive activities that are expected to
ultimately raise the welfare and prosperity of households
in Indonesia.
This research focused on internal household factors
like disposable income, assets, net worth and dummy
variables relating to the internal characteristics of the
household. The findings show that internal variables have

105
Article 3. Determinants of the Household Liquidity Requirement in Indonesia:
an Empirical Study with Data from the Household Balance Sheet Survey
Finance and Accounting, Vol. 38, pp. 1016-1052.
David, D.F., 1995, “Dynamic Econometrics,” Oxford:
Oxford University Press.
Draghi, M., 2007, “Household Wealth in Central Bank
Policy Analysis,” In The Luxembourg Wealth Study:
Enhancing Comparative Research on Household
Finance, Banca d’Italia, Roma, 5-7 July, pp. 1-12.
Deaton, A., 1991, “Saving and Liquidity Constraints,”
Econometrica, 69, pp. 1221–1248.
Eisfeldt, A. L., 2007, “Smoothing with Liquid and Illiquid
Assets,” Journal of Monetary Economics, Vol. 54,
No. 6, pp. 1572–8.
FDIC, 2005, “Risk Management Manual of Examination
Policies” available at http://www.fdic.gov/regulations/
safety/manual/section6-1.html
Garleanu, N., dan Lasse Heje Pedersen, 2011, “Margin-
Based Asset Pricing and Deviations from the Law
of One Price,” Working paper, U.C. Berkeley,
forthcoming, Review of Financial Studies.
Georgarakos, D., Adriana Lojschova, danMelanie E. Ward-
Warmedinger, 2009, “Mortgage Indebtedness and
Household Financial Distress,” IZA Discussion Paper
No. 4631.
Gertler, M., dan R. G. Hubbard, 1988, “Financial Factors in
Business Fluctuations,” In Financial Market Volatility -
Causes, Consequences, and Policy Responses. Kansas
City, MO: Federal Reserve Bank of Kansas City.
Herceg, I. dan V. Sosic, 2010, “The Anatomy of Household
Debt Build Up: What Are the Implications for the
Financial Stability in Croatia?,” In The Sixteenth
Dubrovnik Economic Conference, Croatian National
Bank.
Hollo, D., 2007, “Household Indebtedness and Financial
Stability: Reasons to be Afraid?,” MNB Bulletin, pp.
23-30.
Hubbard, R. G., Jonathan Skinner, dan Stephen P.
Zeldes, 1994, “Expanding the Life-Cycle Model:
a significant impact on the level of household liquidity.
Looking ahead, the development of a similar model
could accommodate external household factors and
macroeconomic variables that affect household demand
for liquidity, like economic growth, inflation, interest rates,
fuel prices and other factors that can affect the level of
household liquidity. These additional variables would
boost the power of explanation of a similar study. Other
research could analyse financially constrained households
and financially unconstrained households, for instance
using Logit or Probit estimation methods.
REFERENCES
Baum, Christopher. et al., 2006, “The Impact of
Macroeconomic Uncertainty on Non-financial
Firms’ Demand for Liquidity,” Review of Financial
Economics, Vol. 15, pp. 289-304.
Bordo, Michael D., 2008, “An Historical Perspective on The
Crisis Of 2007-2008,” NBER Working Paper Series,
http://www.nber.org/papers/w14569.
Bruinshoofd, Allard dan Clemens J.M. Kool, 2002,
“The Determinants of Corporate Liquidity in the
Netherland,” Maastricht University Economics
Working Paper, pp. 1-24.
Carson, Josep G., 2010a, “Improving Household Liquidity
and Cash Flows Provide Support for Fragile US
Consumers,” Economics: US Perspectives - March
19, 2010.
Carson, Josep G., 2010b, “US Households Continue
to Reduce Debt Burdens and Boost Liquidity,”
Economic: US Perspective.
Crane, Roger, 1995, “Fairly Priced Deposit Insurance and
Bank Charter Policy,” Journal of Finance, Vol. 50,
No. 5, pp. 1735-1746.
Cunha, M. R., B. M. Lambrecht dan G. Pawlina, 2011,
“Household Liquidity and Incremental Financing
Decisions: Theory and Evidence,” Journal of Business

106
Article 3. Determinants of the Household Liquidity Requirement in Indonesia:
an Empirical Study with Data from the Household Balance Sheet Survey
Precautionary Saving and Public Policy,” The
American Economic Review: Papers and Proceedings,
84(2), pp. 174–179.
Hull, L., 2003, “Financial Deregulation and Household
Indebtedness,” Reserve Bank of New Zealand
Discussion Paper (DP2003/01).
Kask, J., 2003, “Household Debt and Financial Stability,”
Kroon & Economy (4), pp. 35-42.
Keynes, J. M., 193, “The General Theory of Employment,
Interest and Money”, Harcourt Brace and World,
New York, NY.
Kieso, Dinald E., Paul D. Kimmel, dan Jerry Weygant, 2000,
“Accounting Principle 9th Edition,” Wiley.
Kim, Chang-Soo, David C. Mauer, dan Ann E. Sherman,
1998, “The Determinants of Corporate Liquidity:
Theory and Evidence,” Journal of Financial and
Quantitative Analysis, Vol. 33, pp. 335–359.
Koralun-Bereznicka, J., 2011, “Country and Industry
Factors as Deerminants of Corporate Financial
Liquidity in the European Union Countries,” Bank I
Kredyt, 42, (1), pp. 19-46.
Lee, Jeong-Joon dan Yasuyuki Sawada, 2010, “Precautionary
Saving under Liquidity Constraints: Evidence from
Rural pakistan,” Journal of Development Economics,
91 (2010), pp. 77-86.
Longworth, David, 2010, “Bank of Canada Liquidity
Facilities: Past, Present, and Future,” Deputy
Governor of the Bank of Canada, at the C.D. Howe
Institute, Toronto, 17 February 2010.
Morduch, J., 1995, “Income Smoothing and Consumption
Smoothing,” Journal of Economic Perspectives, 9,
pp. 103–114.
Opler, Tim, Lee Pinkowitz, Rene Stulz dan Rohan Williamson,
1999, “The Determinants and Implications of
Corporate Cash Holdings,” Journal of Financial
Economics, Vol. 52, No. 1, pp. 3–46.
Paxton, Julian, 2009, “Subsistence Saving Strategies of
Male and Female headed Household: Evidence
from Mexico,” Eastern Economic Journal, 35(2),
pp. 209-231.
Paxton, Julian dan Lauren Young, 2010, “Liquidity Profiles
of Poor Mexican Household,” Elsevier, Vol. 39, No.
4, pp. 600-610.
Rutherford, S., 2000, “The Poor and Their Money,” Oxford,
England: Oxford University Press.
Santoso, W. dan Made Sukada, 2009, “Risk Profile of
Households and The Impact on Financial Stability,”
BIS Papers, (46), pp. 58-74.
Telyukova, I. A. and R. Wright, 2008,“A Model of Money
and Credit, with Application to the Credit Card
Debt Puzzle,”Review of Economic Studies, 75(2),
pp. 629-647.
Telyukova, I. A., 2011, “Household Need for Liquidity and
the Credit Card Debt Puzzle.”
Whited, Toni M., 1992, “Debt, Liquidity Constraints and
Corporate Investment: Evidence from Panel Data,”
Journal of Finance, Vol. 47, pp. 425–46
DIRECTOR
Wimboh Santoso Suhaedi Linda Maulidina
COORDINATOR & EDITOR
Dwityapoetra S. Besar
COORDINATOR & EDITOR fOR CHAPTER I
Fernando R. Butarbutar
COORDINATOR & EDITOR fOR CHAPTER II
Eva Aderia S., Kurniawan Agung W.
COORDINATOR & EDITOR fOR CHAPTER III
Diana Yumanita
ANAlysTs
Elisabeth Sukowati, Yunita Resmi Sari, Agusman, Pungky P. Wibowo, Endang K. Saputra, Imansyah,
Oman Abdurrahman, Henry R. Hamid, Ita Rulina, Sri Noerhidajati, Wahyu S. Hidayat, Fernando
R. Butarbutar, Noviati, Diana Yumanita, Kurniawan Agung, Nuraini Yuanita, Risa Fadila, Heny
Sulistyaningsih, Mestika Widantri, Hero Wonida, Primitiva Febriarti, Advis Budiman, Harris Dwi Putra,
Indri Driawati, Indrajaya
OTHER DEPARTmENT CONTRIBUTION ON sElECTED ANAlysIs
Credit, Rural Bank, and MSME Department
Banking Lincensing and Information Department
PRODUCTION AND DIssEmINATION TEAm
Suharso, Ratih Maharani, I Made Yogi, Farah Fadilla, Dyta Tri Utami, Arliza Putri Wardhani
Financial Stability ReviewNo. 18, march 2012

Top Related