


Languages
Pages
Legal


& Feel based on OSF/Motif dependingon the user feedback.
Significant contributions were added in the application area as weil. TheIRSPEC reduction was revised by T.Oliva, while an image restoration andco-addition application, based on ideasof L. Lucy, was added by R. Hook (STECF). A Time Series Analysis context,wh ich includes analysis of non-equallyspaced data, was made by A. Schwarzenberg-Czerny. Finally, a photometryscheduling programme was introducedby A. T. Young as the first application ina new context for calibrations of point-
source photometry.There are now more than 160 regis
tered MIOAS sites, of wh ich approximately 100 are in the ESO memberStates, 30 in other European countriesand 16 in North America. Since many ofthese sites have several different computer systems, this represents a significantly larger number of installations. Ourcurrent statistics (not fully complete)show that 70 % of the systems runUNIX, while the remainder have VAX/VMS. Of the UNIX systems, the distribution between different vendors is 42 %,21%,15% and 7% for SUN/SPARC,
OEC, HP/Apollo and IBM, respectively.The MIOAS site data-base as weil asproblem reports are available throughthe starcat account on the hostdbhost.hq.eso.org.
A number of MIOAS information services are provided through Internet ore-mail. A bulletin board can be accessed by login on the esobb accounton bbhost.hq.eso.org. Oocumentationand patches can be obtained throughanonymous ftp from ftphost.hq.eso.org.General questions and problems can bemailed to the MIOAS hot-line accountmidas at eso.org.
FFT Removal of Pattern Noise in CCO ImagesE. J. WAMPLER, ESO
1. Introduction
The second-generation CCO detectors at ESO have very greatly reducedreadout noise. This noise reductionallows ESO astronomers to extend theirobservations to fainter sources. Unfortunately, with the lower detectorbackground, electronic interferencenoise now often becomes the limitingbackground noise source. It is thoughtthat this noise is mostly generated bythe switching power supplies that areused in the CCO controllers (RolandReiss, private communication). Theseare to be replaced in the near future byless noisy power supplies, but in themeantime it is useful to search for waysto remove the interference from existingframes as weil as to develop tools tocope with possible future problems.
After experimenting with the MIOASFast Fourier Transform (FFT) packages,
a simple way has been found to obtain aconsiderable reduction in the patternnoise seen in the ESO CCO frames.Because this method may be useful toothers, it is described here in some de-
tail. Briefly, the technique is a crudeapproximation of Wiener, or optimal,FFT filtering. See Brault and White(1971) or Press et al. (1988) for descriptions of Wiener filtering using FFT.
Figure 1: A comparison of an unfiltered frame(Iower half of the image) with a FFT filteredimage (upper half).
82
Figure 2: Frames produced during the filtering process. a: The real FFT image of the raw inputframe. b: The raw input frame with the stars replaced by the median value of the background.c: The real FFT image of the frame shown in panel b. d: The real FFT image after setting all lowamplitude pixels (both positive and negative) equal to zero.
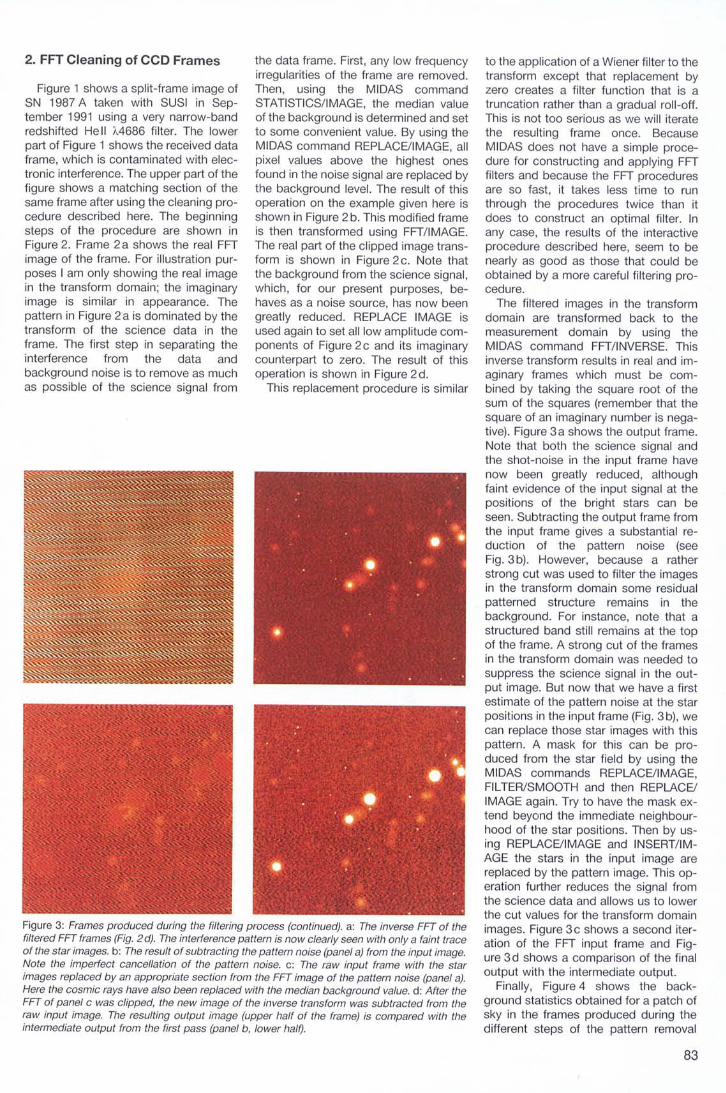
Figure 3: Frames produced during the filtering process (conlinued). a: The inverse FFT of thefiltered FFT frames (Fig. 2d). The interference paNern is now clearly seen with onlya faint traceof the star images. b: The result of subtracting the pattern noise (panel a) from the input image.Note the imperfect cancellation of the paNern noise. c: The raw input frame with the starimages replaced by an appropriate seclion from the FFT image of the pattern noise (panel a).Here the cosmic rays have also been replaced with the median background value. d: After theFFT of panel c was clipped, the new image of the inverse transform was subtracted from theraw input image. The resulting output image (upper half of the frame) is compared with theintermediate output from the first pass (panel b, lower half).
to the application of a Wiener filter to thetransform except that replacement byzero creates a filter function that is atruncation rather than a gradual roll-off.This is not too serious as we will iteratethe resulting frame once. BecauseMIDAS does not have a simple procedure for constructing and applying FFTfilters and because the FFT proceduresare so fast, it takes less time to runthrough the procedures twice than itdoes to construct an optimal filter. Inany case, the results of the interactiveprocedure described here, seem to benearly as good as those that could beobtained by a more careful filtering procedure.
The filtered images in the transformdomain are transformed back to themeasurement domain by using theMIDAS command FFT/INVERSE. Thisinverse transform results in real and imaginary frames which must be combined by taking the square root of thesum of the squares (remember that thesquare of an imaginary number is negative). Figure 3a shows the output frame.Note that both the science signal andthe shot-noise in the input frame havenow been greatly reduced, althoughfaint evidence of the input signal at thepositions of the bright stars can beseen. Subtracting the output frame fromthe input frame gives a substantial reduction of the pattern noise (seeFig. 3 b). However, because a ratherstrong cut was used to filter the imagesin the transform domain some residualpatterned structure remains in thebackground. For instance, note that astructured band still remains at the topof the frame. A strong cut of the framesin the transform domain was needed tosuppress the science signal in the output image. But now that we have a firstestimate of the pattern noise at the starpositions in the input frame (Fig. 3 b), wecan replace those star images with thispattern. A mask for this can be produced from the star field by using theMIDAS commands REPLACElIMAGE,FILTER/SMOOTH and then REPLACEIIMAGE again. Try to have the mask extend beyond the immediate neighbourhood of the star positions. Then by using REPLACElIMAGE and INSERT/IMAGE the stars in the input image arereplaced by the pattern image. This operation further reduces the signal fromthe science data and allows us to lowerthe cut values for the transform domainimages. Figure 3 c shows a second iteration of the FFT input frame and Figure 3d shows a comparison of the finaloutput with the intermediate output.
Finally, Figure 4 shows the background statistics obtained for a patch ofsky in the frames produced during thedifferent steps of the pattern removal
the data frame. First, any low frequencyirregularities of the frame are removed.Then, using the MIDAS commandSTATISTICS/IMAGE, the median valueof the background is determined and setto some convenient value. By using theMIDAS command REPLACElIMAGE, allpixel values above the highest onesfound in the noise signal are replaced bythe background level. The result of thisoperation on the example given here isshown in Figure 2 b. This modified frameis then transformed using FFT/IMAGE.The real part of the clipped image transform is shown in Figure 2 c. Note thatthe background from the science signal,which, for our present purposes, behaves as a noise source, has now beengreatly reduced. REPLACE IMAGE isused again to set all low amplitude components of Figure 2c and its imaginarycounterpart to zero. The result of thisoperation is shown in Figure 2d.
This replacement procedure is similar
2. FFT Cleaning of CCO Frames
Figure 1 shows a split-frame image ofSN 1987 A taken with SUSI in September 1991 using a very narrow-bandredshifted He 11 A4686 filter. The lowerpart of Figure 1 shows the received dataframe, which is contaminated with electronic interference. The upper part of thefigure shows a matching section of thesame frame after using the cleaning procedure described here. The beginningsteps of the procedure are shown inFigure 2. Frame 2 a shows the real FFTimage of the frame. For illustration purposes I am only showing the real imagein the transform domain; the imaginaryimage is similar in appearance. Thepattern in Figure 2 a is dominated by thetransform of the science data in theframe. The first step in separating theinterference from the data andbackground noise is to remove as muchas possible of the science signal from
83

Figure 4: The background statistics of the images. Ootted line: the input image; dashed line: anintermediate output; solid line: the final output. See the text.
References(1) Brault. JW. and White, O.R. 1971, A & A.,
13,169-189.[2] Press, W.H., Flannery, B.P., Teukolwsky,
S.A. and Vetleling, W.T. 1988, NumericalRecipes in C (Cambridge UniversilyPress, Cambridge) p. 434 ff.
(3) Adorf, H.M. and Calchpole, R. 1992, inST-ECF Newsletter, February, 16-17.
that the distribution of values is nearlyGaussian. After the second iteration thewidth of the distribution has been furtherreduced, allowing improved detection ofthreshold stars. The use of a properWiener filter would result in optimalnoise reduction but would require aMIDAS programme that could adjust thevalue of low amplitude signals in thetransform domain by factors that depend on the signal amplitude. Thecleaning procedure described here islogically very similar to the procedure byAdorf and Catchpole (1992) for creatinga filter by isolating a domain in Fourierpower space. The sharp edges of hisdomains are equivalent to a box filter, asis used here, rather than the optimalWiener filter.
I am indebted to L. Lucy for pointingout the references to Wiener filtering.
260250240
reduced after the first pass through theFFT filter. At this stage the distribution ofpixel values in the log-linear plot lookslike an inverted parabola, suggesting
210 220 230PIXEL VALUE
200190180
o
3
.:... :.:'\J
>- :.'
Il
U ..Z IW .' r~ 2 -'0 1
~J
I~ -'
I0
r
0 I.....:l I
1
process. The distribution of pixel valuesfor the input frame (dotted line) showsthe wide, flat peak caused by the interference pattern noise. This is greatly
Adaptive Optics on the 3.6-rn Telescope:Latest News!
After several strenuous months ofassembly and testing, the Come-OnPlus Adaptive Optics system has finallycome to life in the "Laboratoire d'lnterterometrie Infrarouge et d'Optique Turbulente (LYOT)" of the Observatoire deMeudon, under ONERA's supervision.Thanks to LASERDOT, who designedthe control computer and the deformable mirror, the closed-Ioop 40-Hzbandwidth performance (at 0 dB) hasbeen achieved. The LEP (Laboratoiresd'Electronique Philips) delivered theEBCCD (see The Messenger No. 67), alow-flux wavefront sensor detector,wh ich is a quantum noise limited detector with a switchable frame frequencyfrom 25 to 400 Hz. The 52-actuator deformable mirror has been tested withsuccessful results. The actuators, madeof a very hard piezoelectric material,show no hysteresis or heat dissipationat all, and the mechanical bandwidth ismore than 10KHz (far more than required for an atmospherical turbulencecorrection). The surface quality is alsovery good: by means of a self-correc-
tion, the mirror can lower its own wavefront residual error to less than 20 nmrms. The whole system is now ready to
be tested on the sky, under real conditions in December 1992.
E. GENORON and N. HUB/N, ESO
84
Top Related