


Languages
Pages
Legal

EXTRACTION AND ANALYSIS OF SULFUR MUSTARD (HD)
FROM VARIOUS FOOD MATRICES BY GAS
CHROMATOGRAPHY–MASS SPECTROMETRY
ECBC-TR-1340
Sue Y. Bae Mark D. Winemiller
RESEARCH AND TECHNOLOGY DIRECTORATE
January 2016
Approved for public release; distribution is unlimited.
Disclaimer
The findings in this report are not to be construed as an official Department of the Army position
unless so designated by other authorizing documents.
REPORT DOCUMENTATION PAGE Form Approved
OMB No. 0704-0188 Public reporting burden for this collection of information is estimated to average 1 h per response, including the time for reviewing instructions, searching existing data sources, gathering and maintaining the data needed, and completing and reviewing this collection of information. Send comments regarding this burden estimate or any other aspect of this collection of information, including suggestions for reducing this burden to Department of Defense, Washington Headquarters Services, Directorate for Information Operations and Reports (0704-0188), 1215 Jefferson Davis Highway, Suite 1204, Arlington, VA 22202-4302. Respondents should be aware that notwithstanding any other provision of law, no person shall be subject to any penalty for failing to comply with a collection of information if it does not display a currently valid OMB control number. PLEASE DO NOT RETURN YOUR FORM TO THE ABOVE ADDRESS.
1. REPORT DATE (DD-MM-YYYY)
XX-01-2016 2. REPORT TYPE
Final 3. DATES COVERED (From - To)
Nov 2013 – Jan 2014
4. TITLE AND SUBTITLE
Extraction and Analysis of Sulfur Mustard (HD) from Various Food
Matrices by Gas Chromatography–Mass Spectrometry
5a. CONTRACT NUMBER
5b. GRANT NUMBER
5c. PROGRAM ELEMENT NUMBER
6. AUTHOR(S)
Bae, Sue Y.; and Winemiller, Mark D. 5d. PROJECT NUMBER
5e. TASK NUMBER
5f. WORK UNIT NUMBER
7. PERFORMING ORGANIZATION NAME(S) AND ADDRESS(ES)
Director, ECBC, ATTN: RDCB-DRC-C, APG, MD 21010-5424
8. PERFORMING ORGANIZATION REPORT NUMBER
ECBC-TR-1340
9. SPONSORING / MONITORING AGENCY NAME(S) AND ADDRESS(ES)
10. SPONSOR/MONITOR’S ACRONYM(S)
11. SPONSOR/MONITOR’S REPORT NUMBER(S)
12. DISTRIBUTION / AVAILABILITY STATEMENT
Approved for public release; distribution is unlimited.
13. SUPPLEMENTARY NOTES
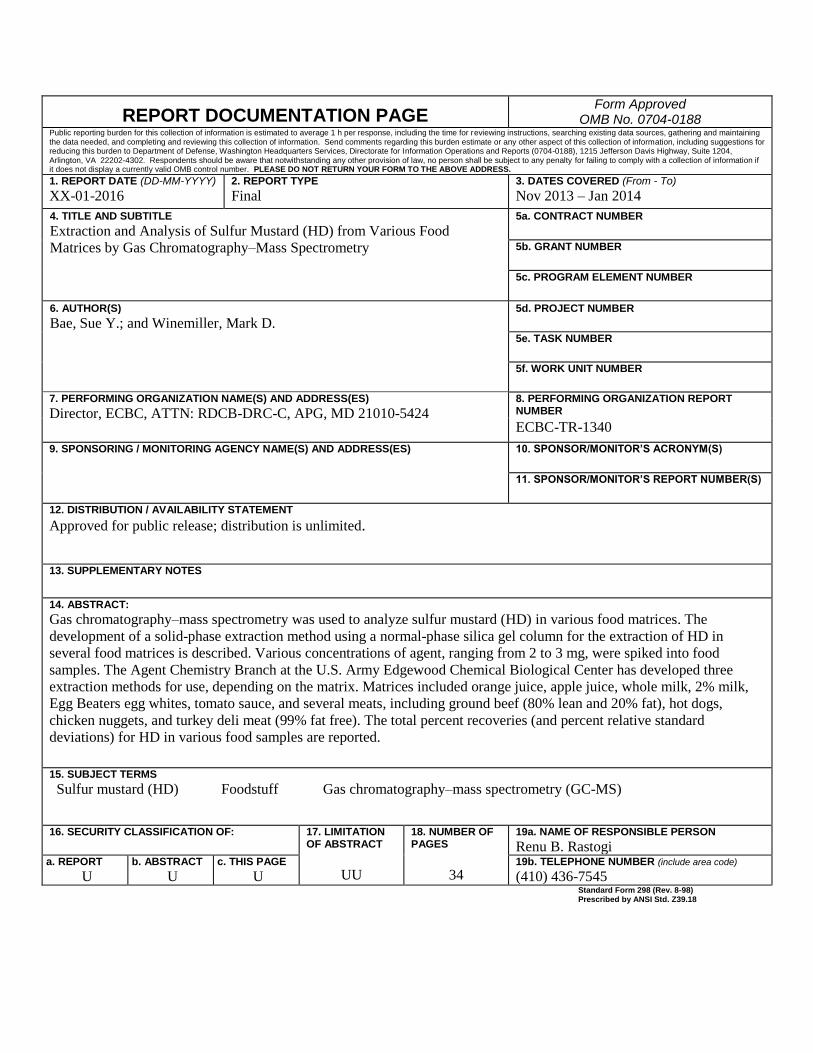
14. ABSTRACT:
Gas chromatography–mass spectrometry was used to analyze sulfur mustard (HD) in various food matrices. The
development of a solid-phase extraction method using a normal-phase silica gel column for the extraction of HD in
several food matrices is described. Various concentrations of agent, ranging from 2 to 3 mg, were spiked into food
samples. The Agent Chemistry Branch at the U.S. Army Edgewood Chemical Biological Center has developed three
extraction methods for use, depending on the matrix. Matrices included orange juice, apple juice, whole milk, 2% milk,
Egg Beaters egg whites, tomato sauce, and several meats, including ground beef (80% lean and 20% fat), hot dogs,
chicken nuggets, and turkey deli meat (99% fat free). The total percent recoveries (and percent relative standard
deviations) for HD in various food samples are reported.
15. SUBJECT TERMS
Sulfur mustard (HD) Foodstuff Gas chromatography–mass spectrometry (GC-MS)
16. SECURITY CLASSIFICATION OF:
17. LIMITATION OF ABSTRACT
UU
18. NUMBER OF PAGES
34
19a. NAME OF RESPONSIBLE PERSON
Renu B. Rastogi a. REPORT
U
b. ABSTRACT
U
c. THIS PAGE
U
19b. TELEPHONE NUMBER (include area code)
(410) 436-7545 Standard Form 298 (Rev. 8-98)
Prescribed by ANSI Std. Z39.18

ii
Blank
iii
PREFACE
This work was started in November 2013 and completed in January 2014.
The use of either trade or manufacturers’ names in this report does not constitute
an official endorsement of any commercial products. This report may not be cited for purposes of
advertisement.
This report has been approved for public release.

iv
Blank
v
CONTENTS
1. INTRODUCTION ...................................................................................................1
2. EXPERIMENTAL METHODS...............................................................................2
2.1 Reagents and Chemicals ....................................................................................2
2.2 Instrumentation ..................................................................................................2
2.3 Procedure for HD Extraction from Foodstuffs ..................................................2
3. RESULTS AND DISCUSSION ..............................................................................3
3.1 GC Separation and Analytical Figures of Merit ................................................3
3.2 Extraction of HD from Foodstuffs .....................................................................4
3.3 Extraction of H from Munitions-Grade Mustard .............................................17
4. CONCLUSION ......................................................................................................20
LITERATURE CITED ..........................................................................................21
ACRONYMS AND ABBREVIATIONS ..............................................................23
vi
FIGURES
1. Structure of HD ........................................................................................................2
2. A RediSep Rf normal-phase silica gel column ........................................................3
3. (a) GC chromatogram and (b) mass spectrum for HD standard in IPA. ..................5
4. (a) GC chromatogram and (b) mass spectrum for HD extracted
from apple juice .......................................................................................................6
5. (a) GC chromatogram and (b) mass spectrum for HD extracted
from orange juice .....................................................................................................7
6. (a) GC chromatogram and (b) mass spectrum for HD extracted from
2% milk ....................................................................................................................8
7. (a) GC chromatogram and (b) mass spectrum for HD extracted from
whole milk ...............................................................................................................9
8. (a) GC chromatogram and (b) mass spectrum for HD extracted from
hot dog; (c) mass spectrum at Rt = 5.08 min (benzoic acid) ..................................10
9. (a) GC chromatogram and (b) mass spectrum for HD extracted from
tomato sauce...........................................................................................................11
10. (a) GC chromatogram and (b) mass spectrum for HD extracted from
Egg Beaters egg whites ..........................................................................................12
11. (a) GC chromatogram and (b) mass spectrum for HD extracted from
turkey deli meat......................................................................................................13
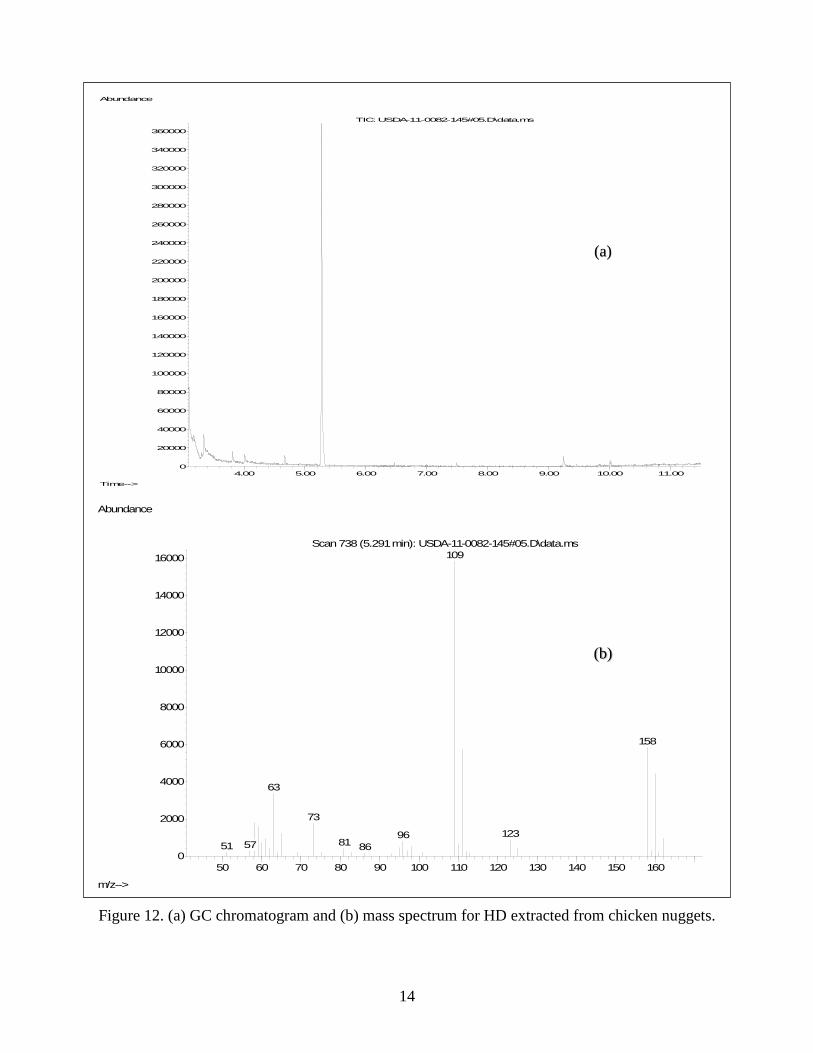
12. (a) GC chromatogram and (b) mass spectrum for HD extracted from
chicken nuggets ......................................................................................................14
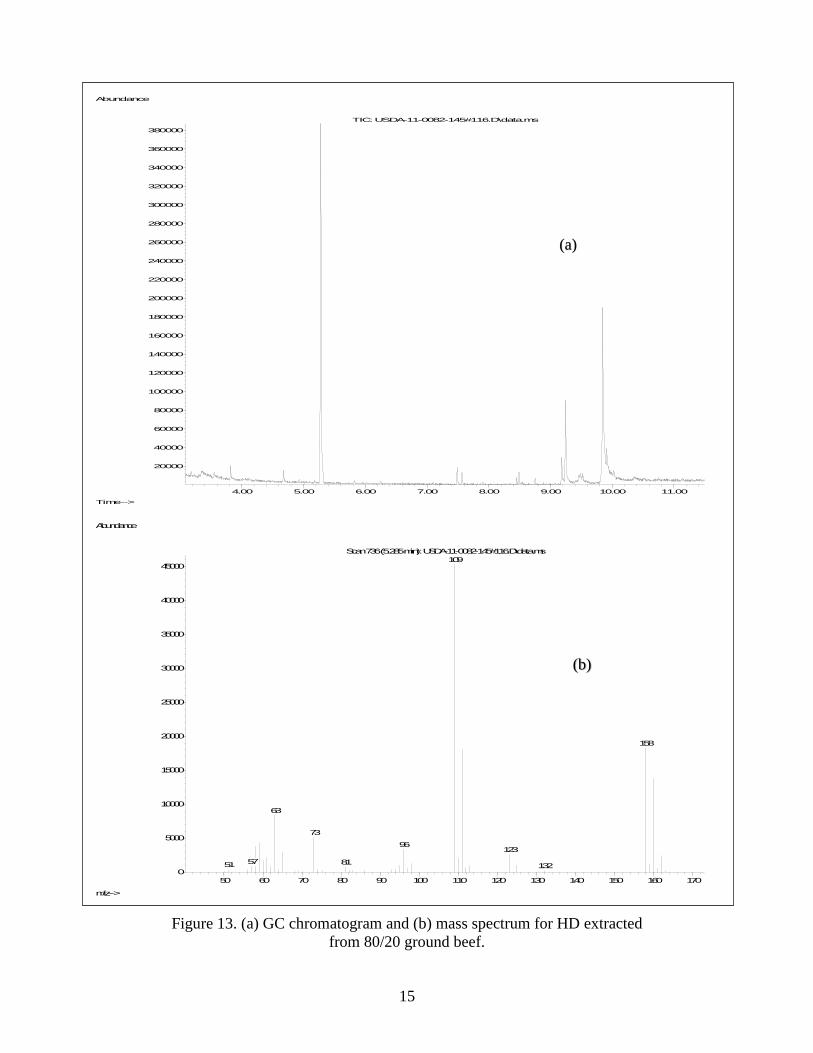
13. (a) GC chromatogram and (b) mass spectrum for HD extracted from
80/20 ground beef ..................................................................................................15
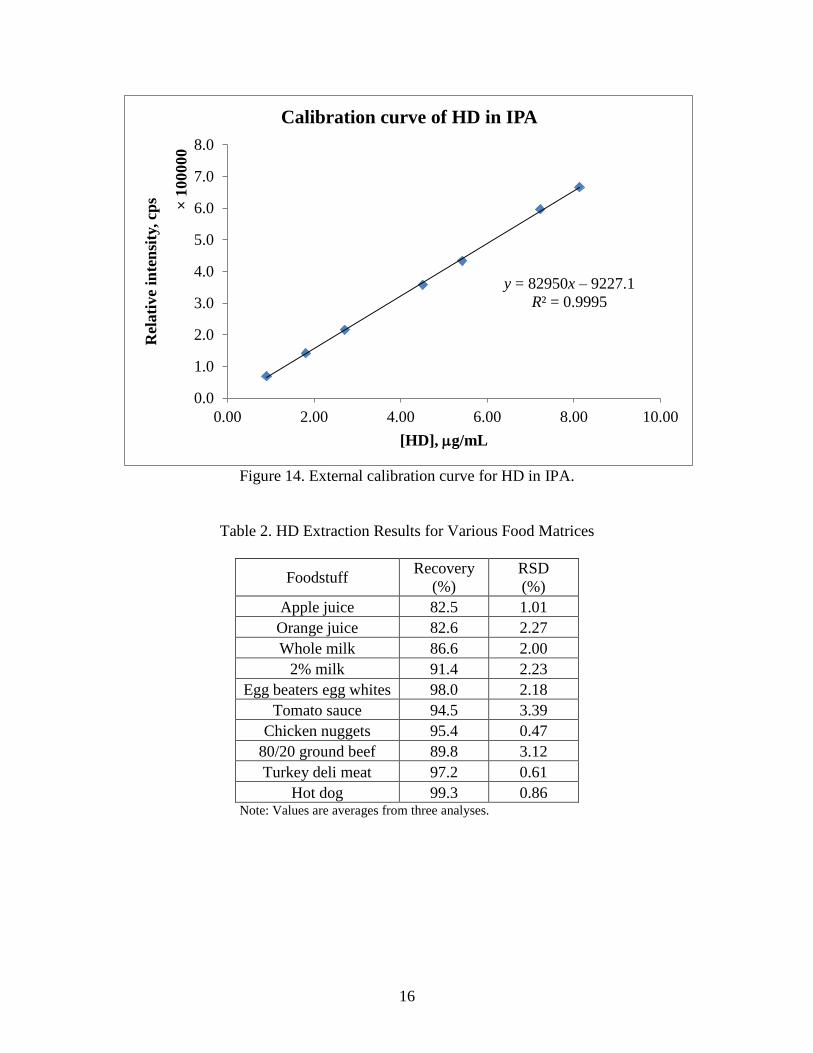
14. External calibration curve for HD in IPA ..............................................................16
15. (a) GC chromatogram and (b) mass spectrum for H extracted from
MGM (peak no. 2) .................................................................................................18
16. Mass spectra for H extracted from MGM: (a) peak no. 1, for 1,4-dithiane;
and (b) peak no. 3, for sesquimustard ....................................................................19
TABLES
1. Analytical Figures of Merit for HD .........................................................................4
2. HD Extraction Results for Various Food Matrices ................................................16
3. Percent Recoveries and RSDs for H from MGM ..................................................17
1
EXTRACTION AND ANALYSIS OF SULFUR MUSTARD (HD) FROM VARIOUS
FOOD MATRICES BY GAS CHROMATOGRAPHY–MASS SPECTROMETRY
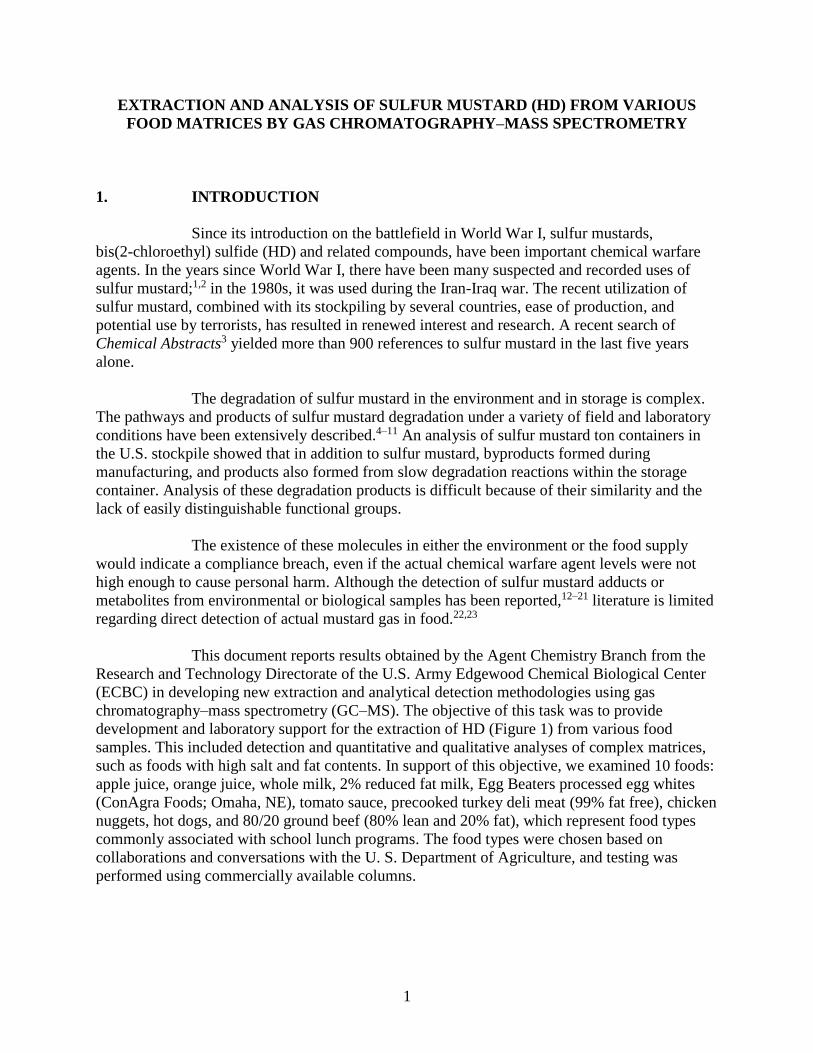
1. INTRODUCTION
Since its introduction on the battlefield in World War I, sulfur mustards,
bis(2-chloroethyl) sulfide (HD) and related compounds, have been important chemical warfare
agents. In the years since World War I, there have been many suspected and recorded uses of
sulfur mustard;1,2 in the 1980s, it was used during the Iran-Iraq war. The recent utilization of
sulfur mustard, combined with its stockpiling by several countries, ease of production, and
potential use by terrorists, has resulted in renewed interest and research. A recent search of
Chemical Abstracts3 yielded more than 900 references to sulfur mustard in the last five years
alone.
The degradation of sulfur mustard in the environment and in storage is complex.
The pathways and products of sulfur mustard degradation under a variety of field and laboratory
conditions have been extensively described.4–11 An analysis of sulfur mustard ton containers in
the U.S. stockpile showed that in addition to sulfur mustard, byproducts formed during
manufacturing, and products also formed from slow degradation reactions within the storage
container. Analysis of these degradation products is difficult because of their similarity and the
lack of easily distinguishable functional groups.
The existence of these molecules in either the environment or the food supply
would indicate a compliance breach, even if the actual chemical warfare agent levels were not
high enough to cause personal harm. Although the detection of sulfur mustard adducts or
metabolites from environmental or biological samples has been reported,12–21 literature is limited
regarding direct detection of actual mustard gas in food.22,23
This document reports results obtained by the Agent Chemistry Branch from the
Research and Technology Directorate of the U.S. Army Edgewood Chemical Biological Center
(ECBC) in developing new extraction and analytical detection methodologies using gas
chromatography–mass spectrometry (GC–MS). The objective of this task was to provide
development and laboratory support for the extraction of HD (Figure 1) from various food
samples. This included detection and quantitative and qualitative analyses of complex matrices,
such as foods with high salt and fat contents. In support of this objective, we examined 10 foods:
apple juice, orange juice, whole milk, 2% reduced fat milk, Egg Beaters processed egg whites
(ConAgra Foods; Omaha, NE), tomato sauce, precooked turkey deli meat (99% fat free), chicken
nuggets, hot dogs, and 80/20 ground beef (80% lean and 20% fat), which represent food types
commonly associated with school lunch programs. The food types were chosen based on
collaborations and conversations with the U. S. Department of Agriculture, and testing was
performed using commercially available columns.
2
Figure 1. Structure of HD.
2. EXPERIMENTAL METHODS
2.1 Reagents and Chemicals
Two structurally identical sulfur mustard blister agents, HD and H, were provided
by ECBC. HD is previously distilled mustard; its purity is usually >97%. H is mustard from
chemical munitions or ton containers, and it typically contains 20–30% of other sulfur-
containing compounds. All reagents and solvents were high-performance liquid chromatography
grade. Isopropyl alcohol (IPA) was purchased from Sigma-Aldrich (St. Louis, MO). Apple juice,
orange juice, 2% milk, whole milk, Egg Beaters egg whites, tomato sauce, chicken nuggets,
80/20 ground beef , turkey deli meat, and hot dog foodstuffs were purchased from a local grocery
store (Food Lion; Edgewood, MD).
2.2 Instrumentation
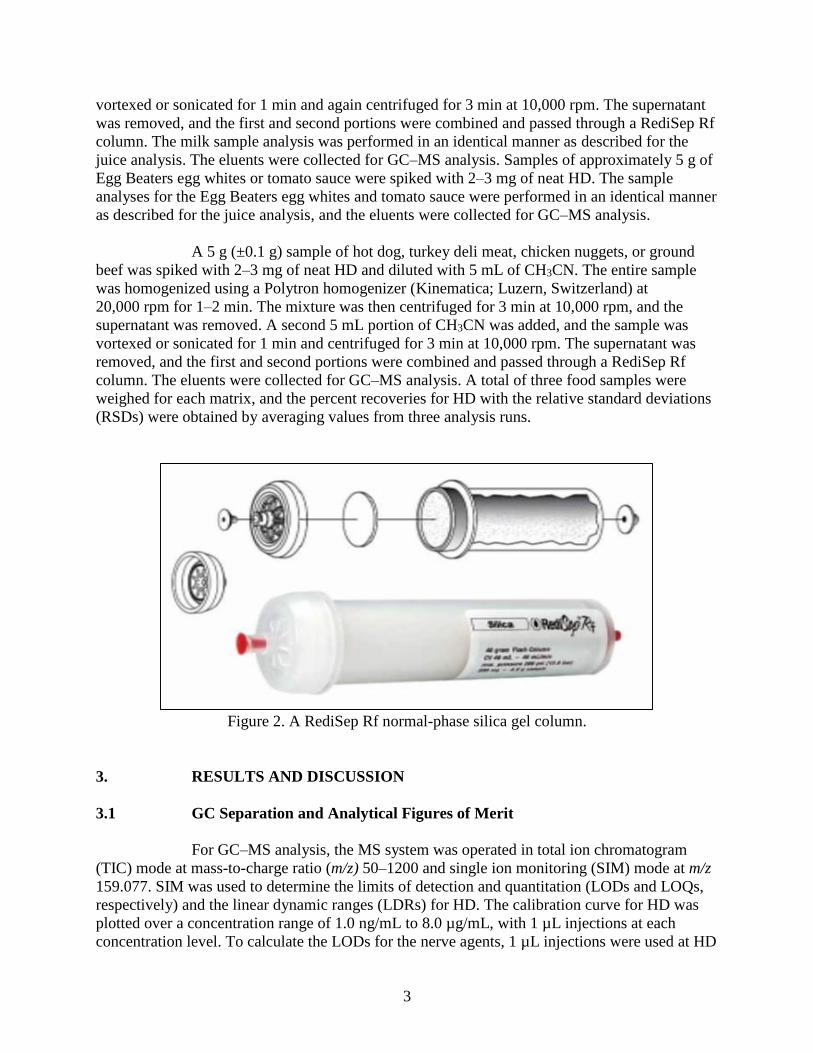
RediSep Rf normal-phase silica gel columns (5 g) obtained from Teledyne Isco
(Lincoln, NE) were used to extract HD from the food samples. GC–MS analysis of HD was
performed on an Agilent 5975 mass spectrometer interfaced to a 6890 series gas chromatograph
(Agilent Technologies; Santa Clara, CA). The gas chromatograph was equipped with an Agilent
J&W Scientific HP-5ms bonded-phase capillary column (30 m × 0.25 mm i.d.) with a film
thickness of 0.25 µm. The injection port temperature was 220 °C, the GC–MS interface
temperature was 250 °C, and the source temperature was 150 °C. The carrier gas was helium,
with a flow rate of 1 mL/min, and the oven temperature was programmed from 60 to 250 °C at
15 °C/min. A split injector was used (split ratio, 75:1), and a 0.2 µL sample volume was placed
on the column. The scanned mass range was 50 to 450 Da at 4 scans/s.
2.3 Procedure for HD Extraction from Foodstuffs
Samples of apple or orange juice (2 mL) were placed into glass vials and spiked
with 2–3 mg of neat HD. First, the RediSep Rf column (Figure 2) was eluted with 50 mL of
1% diethylmethylamine/2% triethylamine (TEA) in CH3CN, and in-house air was used to pass
the solution through the column. Second, the HD-spiked apple juice was passed through the
column, and the sample was collected. Third, 1 mL of 2% TEA in CH3CN solution was added to
the column and pushed slightly into the silica gel, until 1 mL of the solution had just cleared the
top of the silica gel. This step was repeated three times. Finally, the remaining 47 mL of
2% TEA in CH3CN solution was added to the column and passed through the bed. A small
aliquot was filtered through a 0.45 µm poly(tetrafluoroethylene) membrane filter and then
diluted with IPA (at a 1:10 dilution) for GC–MS analysis.
A similar range of neat HD was spiked into both milk samples. Each milk sample
was diluted with 5 mL of CH3CN. The mixture was centrifuged for 3 min at 10,000 rpm, and the
supernatant was decanted. A second 5 mL portion of CH3CN was added, and the mixture was
3
vortexed or sonicated for 1 min and again centrifuged for 3 min at 10,000 rpm. The supernatant
was removed, and the first and second portions were combined and passed through a RediSep Rf
column. The milk sample analysis was performed in an identical manner as described for the
juice analysis. The eluents were collected for GC–MS analysis. Samples of approximately 5 g of
Egg Beaters egg whites or tomato sauce were spiked with 2–3 mg of neat HD. The sample
analyses for the Egg Beaters egg whites and tomato sauce were performed in an identical manner
as described for the juice analysis, and the eluents were collected for GC–MS analysis.
A 5 g (±0.1 g) sample of hot dog, turkey deli meat, chicken nuggets, or ground
beef was spiked with 2–3 mg of neat HD and diluted with 5 mL of CH3CN. The entire sample
was homogenized using a Polytron homogenizer (Kinematica; Luzern, Switzerland) at
20,000 rpm for 1–2 min. The mixture was then centrifuged for 3 min at 10,000 rpm, and the
supernatant was removed. A second 5 mL portion of CH3CN was added, and the sample was
vortexed or sonicated for 1 min and centrifuged for 3 min at 10,000 rpm. The supernatant was
removed, and the first and second portions were combined and passed through a RediSep Rf
column. The eluents were collected for GC–MS analysis. A total of three food samples were
weighed for each matrix, and the percent recoveries for HD with the relative standard deviations
(RSDs) were obtained by averaging values from three analysis runs.
Figure 2. A RediSep Rf normal-phase silica gel column.
3. RESULTS AND DISCUSSION
3.1 GC Separation and Analytical Figures of Merit
For GC–MS analysis, the MS system was operated in total ion chromatogram
(TIC) mode at mass-to-charge ratio (m/z) 50–1200 and single ion monitoring (SIM) mode at m/z
159.077. SIM was used to determine the limits of detection and quantitation (LODs and LOQs,
respectively) and the linear dynamic ranges (LDRs) for HD. The calibration curve for HD was
plotted over a concentration range of 1.0 ng/mL to 8.0 µg/mL, with 1 µL injections at each
concentration level. To calculate the LODs for the nerve agents, 1 µL injections were used at HD
4
concentrations as low as 1 ng/mL, with a signal-to-noise ratio of 3:1. The LOQs for the analyte
were also calculated, with a signal-to-noise ratio of 10:1. The linear regression equations were
calculated by a least-squares analysis of the LDRs, LODs, and LOQs. The linear regression
equations and the correlation coefficients are tabulated in Table 1.
Table 1. Analytical Figures of Merit for HD
Agent LDR
(ng/mL)
LOD
(ng/mL)
LOQ
(ng/mL)
Correlation
Coefficienta
HD in IPA 1.1–7340 1.15 4.59 0.9980 aCalculated over the calibration range 0.0011–7.3 µg/mL for HD.
3.2 Extraction of HD from Foodstuffs
An electron impact (EI) mass spectrum usually contains the molecular ion, M+˙,
and many fragment ions, which make EI useful for structural characterization. In this study, we
examined the extraction efficiency of HD from 10 different matrices. Samples of apple and
orange juices, 2% and whole milk, Egg Beaters egg whites, tomato sauce, chicken nuggets,
80/20 ground beef, turkey deli meat, and hot dogs were tested. To optimize the extraction
efficiency of HD, several extraction solvents were examined. The best performance was
achieved using a 2% TEA/acetonitrile solution. The extracted samples were then diluted 1:10
with IPA for GC–MS analysis.
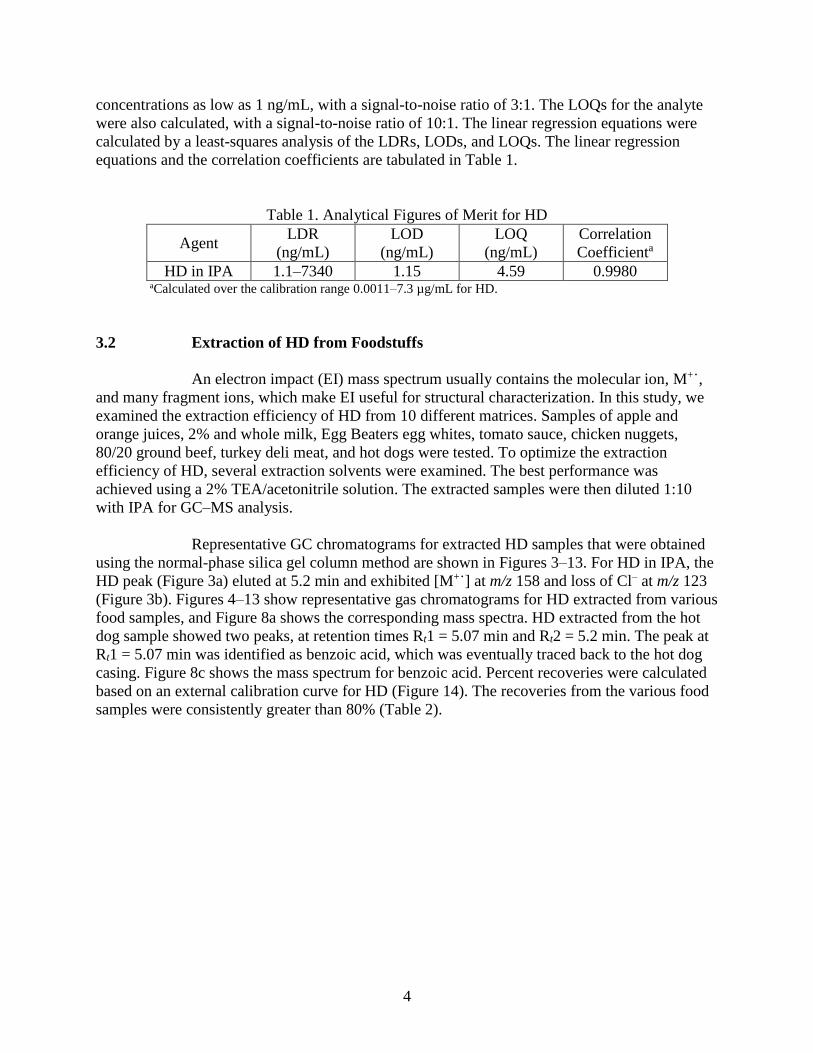
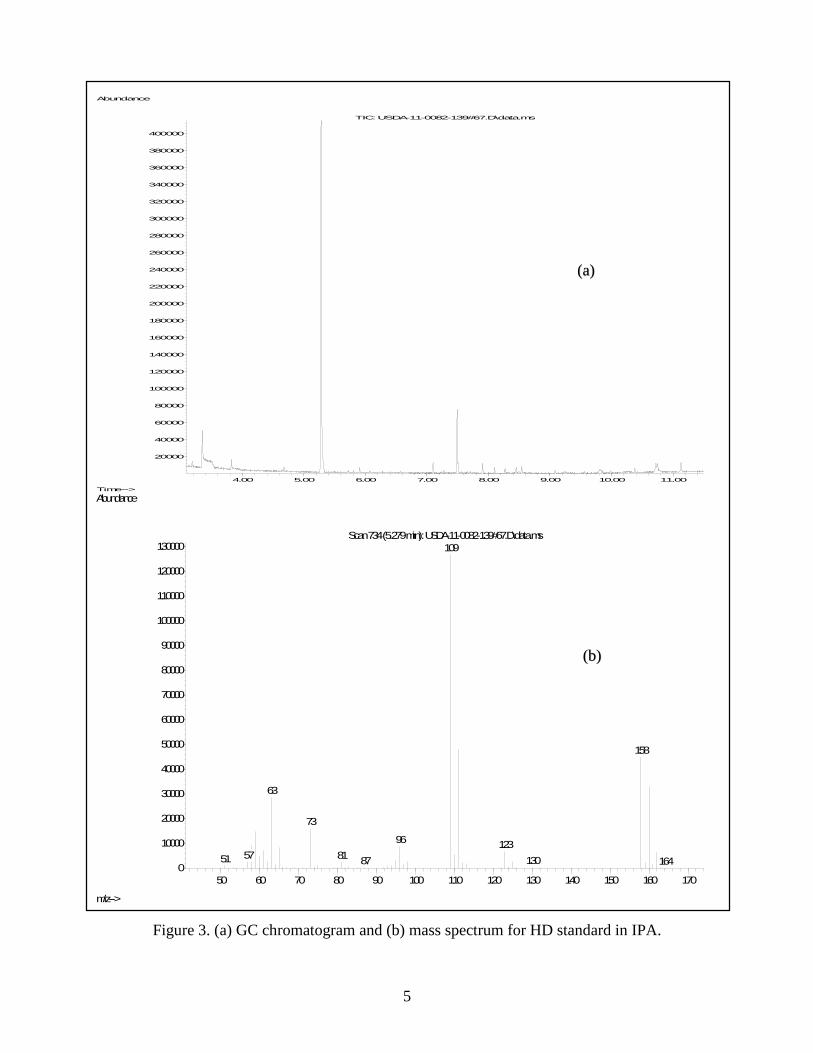
Representative GC chromatograms for extracted HD samples that were obtained
using the normal-phase silica gel column method are shown in Figures 3–13. For HD in IPA, the
HD peak (Figure 3a) eluted at 5.2 min and exhibited [M+˙] at m/z 158 and loss of Cl– at m/z 123
(Figure 3b). Figures 4–13 show representative gas chromatograms for HD extracted from various
food samples, and Figure 8a shows the corresponding mass spectra. HD extracted from the hot
dog sample showed two peaks, at retention times Rt1 = 5.07 min and Rt2 = 5.2 min. The peak at
Rt1 = 5.07 min was identified as benzoic acid, which was eventually traced back to the hot dog
casing. Figure 8c shows the mass spectrum for benzoic acid. Percent recoveries were calculated
based on an external calibration curve for HD (Figure 14). The recoveries from the various food
samples were consistently greater than 80% (Table 2).
5
Figure 3. (a) GC chromatogram and (b) mass spectrum for HD standard in IPA.
4.00 5.00 6.00 7.00 8.00 9.00 10.00 11.00
20000
40000
60000
80000
100000
120000
140000
160000
180000
200000
220000
240000
260000
280000
300000
320000
340000
360000
380000
400000
Time-->
Abundance
TIC: USDA-11-0082-139#67.D\data.ms
50 60 70 80 90 100 110 120 130 140 150 160 170
0
10000
20000
30000
40000
50000
60000
70000
80000
90000
100000
110000
120000
130000
m/z-->
Abundance
Scan 734 (5.279 min): USDA-11-0082-139#67.D\data.ms
109
158
63
73
96123
57 8151 13087 164
(a)
(b)
6
Figure 4. (a) GC chromatogram and (b) mass spectrum for HD extracted from apple juice.
4.00 5.00 6.00 7.00 8.00 9.00 10.00 11.00
0
20000
40000
60000
80000
100000
120000
140000
160000
180000
200000
220000
240000
260000
280000
300000
320000
Time-->
Abundance
TIC: USDA-11-0082-139#44.D\data.ms
50 60 70 80 90 100 110 120 130 140 150 160 170
0
5000
10000
15000
20000
25000
30000
35000
40000
45000
50000
55000
60000
65000
70000
75000
80000
85000
90000
95000
m/z-->
Abundance
Scan 734 (5.279 min): USDA-11-0082-139#44.D\data.ms
109
158
63
73
96 123
57 8151 13087 164
(a)
(b)
7
Figure 5. (a) GC chromatogram and (b) mass spectrum for HD extracted from orange juice.
4.00 5.00 6.00 7.00 8.00 9.00 10.00 11.00
0
20000
40000
60000
80000
100000
120000
140000
160000
180000
200000
220000
240000
260000
280000
300000
320000
340000
Time-->
Abundance
TIC: USDA-11-0082-144#07.D\data.ms
50 60 70 80 90 100 110 120 130 140 150 1600
1000
2000
3000
4000
5000
6000
7000
8000
9000
10000
11000
12000
13000
14000
m/z-->
Abundance
Scan 738 (5.291 min): USDA-11-0082-144#07.D\data.ms109
158
63
73
96123
8157
(a)
(b)
8
Figure 6. (a) GC chromatogram and (b) mass spectrum for HD extracted from 2% milk.
4.00 5.00 6.00 7.00 8.00 9.00 10.00 11.00
0
20000
40000
60000
80000
100000
120000
140000
160000
180000
200000
220000
240000
260000
280000
300000
Time-->
Abundance
TIC: USDA-11-0082-143#27.D\data.ms
50 60 70 80 90 100 110 120 130 140 150 160 170
0
5000
10000
15000
20000
25000
30000
35000
m/z-->
Abundance
Scan 736 (5.285 min): USDA-11-0082-143#27.D\data.ms
109
158
63
73
96 123
815751 130
(a)
(b)
9
Figure 7. (a) GC chromatogram and (b) mass spectrum for HD extracted from whole milk.
4.00 5.00 6.00 7.00 8.00 9.00 10.00 11.00
0
20000
40000
60000
80000
100000
120000
140000
160000
180000
200000
220000
240000
260000
280000
300000
320000
340000
360000
Time-->
Abundance
TIC: USDA-11-0082-145#63.D\data.ms
50 60 70 80 90 100 110 120 130 140 150 160 170
0
5000
10000
15000
20000
25000
30000
35000
40000
45000
50000
55000
60000
65000
70000
75000
80000
85000
90000
95000
100000
m/z-->
Abundance
Scan 734 (5.279 min): USDA-11-0082-145#63.D\data.ms
109
158
63
73
96123
57 8151 13087 164
(a)
(b)
10
Figure 8. (a) GC chromatogram and (b) mass spectrum for HD extracted from hot dog;
(c) mass spectrum at Rt = 5.08 min (benzoic acid).
4.00 5.00 6.00 7.00 8.00 9.00 10.00 11.00
0
20000
40000
60000
80000
100000
120000
140000
160000
180000
200000
220000
240000
260000
280000
300000
320000
340000
Time-->
Abundance
TIC: USDA-11-0082-139#73.D\data.ms
50 60 70 80 90 100 110 120 130 140 150 160 170
0
2000
4000
6000
8000
10000
12000
14000
16000
18000
20000
22000
24000
m/z-->
Abundance
Scan 736 (5.285 min): USDA-11-0082-139#73.D\data.ms
109
158
63
73
12396
8157 16951
45 50 55 60 65 70 75 80 85 90 95 100 105 110 115 120 125 1300
1000
2000
3000
4000
5000
6000
7000
8000
9000
10000
11000
12000
13000
14000
m/z-->
Abundance
Scan 668 (5.082 min): USDA-11-0082-139#73.D\data.ms105
122
77
51
58
7365 9486
(a)
(b)
(c)
11
Figure 9. (a) GC chromatogram and (b) mass spectrum for HD extracted from tomato sauce.
4.00 5.00 6.00 7.00 8.00 9.00 10.00 11.00
20000
40000
60000
80000
100000
120000
140000
160000
180000
200000
220000
240000
260000
280000
300000
320000
340000
Time-->
Abundance
TIC: USDA-11-0082-139#60.D\data.ms
50 60 70 80 90 100 110 120 130 140 150 160 170
0
5000
10000
15000
20000
25000
30000
35000
40000
45000
50000
55000
60000
65000
70000
75000
80000
85000
90000
95000
m/z-->
Abundance
Scan 734 (5.279 min): USDA-11-0082-139#60.D\data.ms
109
158
63
73
96123
57 8151 13087 164
(a)
(b)
12
Figure 10. (a) GC chromatogram and (b) mass spectrum for HD extracted from
Egg Beaters egg whites.
4.00 5.00 6.00 7.00 8.00 9.00 10.00 11.00
20000
40000
60000
80000
100000
120000
140000
160000
180000
200000
220000
240000
260000
280000
300000
320000
340000
360000
Time-->
Abundance
TIC: USDA-11-0082-139#52.D\data.ms
50 60 70 80 90 100 110 120 130 140 150 160
0
5000
10000
15000
20000
25000
30000
35000
40000
45000
m/z-->
Abundance
Scan 736 (5.285 min): USDA-11-0082-139#52.D\data.ms
109
158
63
73
96 123
815751
(b)
(a)
13
Figure 11. (a) GC chromatogram and (b) mass spectrum for HD extracted from turkey deli meat.
4.00 5.00 6.00 7.00 8.00 9.00 10.00 11.00
20000
40000
60000
80000
100000
120000
140000
160000
180000
200000
220000
240000
260000
280000
300000
320000
Time-->
Abundance
TIC: USDA-11-0082-144#17.D\data.ms
50 60 70 80 90 100 110 120 130 140 150 160 170
0
5000
10000
15000
20000
25000
30000
m/z-->
Abundance
Scan 736 (5.285 min): USDA-11-0082-144#17.D\data.ms
109
158
63
73
1239657 8151 163
(b)
(a)
14
Figure 12. (a) GC chromatogram and (b) mass spectrum for HD extracted from chicken nuggets.
4.00 5.00 6.00 7.00 8.00 9.00 10.00 11.00
0
20000
40000
60000
80000
100000
120000
140000
160000
180000
200000
220000
240000
260000
280000
300000
320000
340000
360000
Time-->
Abundance
TIC: USDA-11-0082-145#05.D\data.ms
50 60 70 80 90 100 110 120 130 140 150 160
0
2000
4000
6000
8000
10000
12000
14000
16000
m/z-->
Abundance
Scan 738 (5.291 min): USDA-11-0082-145#05.D\data.ms
109
158
63
73
12396815751 86
(b)
(a)
15
Figure 13. (a) GC chromatogram and (b) mass spectrum for HD extracted
from 80/20 ground beef.
4.00 5.00 6.00 7.00 8.00 9.00 10.00 11.00
20000
40000
60000
80000
100000
120000
140000
160000
180000
200000
220000
240000
260000
280000
300000
320000
340000
360000
380000
Time-->
Abundance
TIC: USDA-11-0082-145#116.D\data.ms
50 60 70 80 90 100 110 120 130 140 150 160 170
0
5000
10000
15000
20000
25000
30000
35000
40000
45000
m/z-->
Abundance
Scan 736 (5.285 min): USDA-11-0082-145#116.D\data.ms
109
158
63
73
96123
57 8151 132
(b)
(a)
16
Figure 14. External calibration curve for HD in IPA.
Table 2. HD Extraction Results for Various Food Matrices
Foodstuff Recovery
(%)
RSD
(%)
Apple juice 82.5 1.01
Orange juice 82.6 2.27
Whole milk 86.6 2.00
2% milk 91.4 2.23
Egg beaters egg whites 98.0 2.18
Tomato sauce 94.5 3.39
Chicken nuggets 95.4 0.47
80/20 ground beef 89.8 3.12
Turkey deli meat 97.2 0.61
Hot dog 99.3 0.86 Note: Values are averages from three analyses.
y = 82950x – 9227.1
R² = 0.9995
0.0
1.0
2.0
3.0
4.0
5.0
6.0
7.0
8.0
0.00 2.00 4.00 6.00 8.00 10.00
Rel
ati
ve
inte
nsi
ty, cp
s ×100000
[HD], mg/mL
Calibration curve of HD in IPA
17
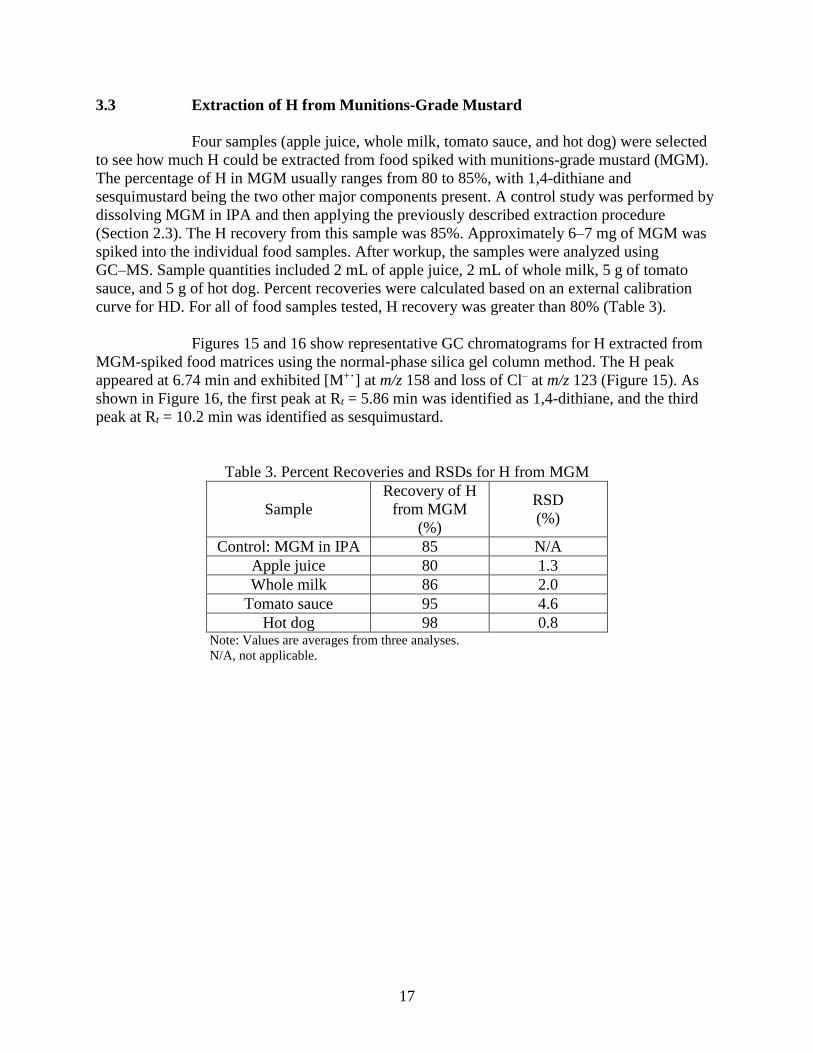
3.3 Extraction of H from Munitions-Grade Mustard
Four samples (apple juice, whole milk, tomato sauce, and hot dog) were selected
to see how much H could be extracted from food spiked with munitions-grade mustard (MGM).
The percentage of H in MGM usually ranges from 80 to 85%, with 1,4-dithiane and
sesquimustard being the two other major components present. A control study was performed by
dissolving MGM in IPA and then applying the previously described extraction procedure
(Section 2.3). The H recovery from this sample was 85%. Approximately 6–7 mg of MGM was
spiked into the individual food samples. After workup, the samples were analyzed using
GC–MS. Sample quantities included 2 mL of apple juice, 2 mL of whole milk, 5 g of tomato
sauce, and 5 g of hot dog. Percent recoveries were calculated based on an external calibration
curve for HD. For all of food samples tested, H recovery was greater than 80% (Table 3).
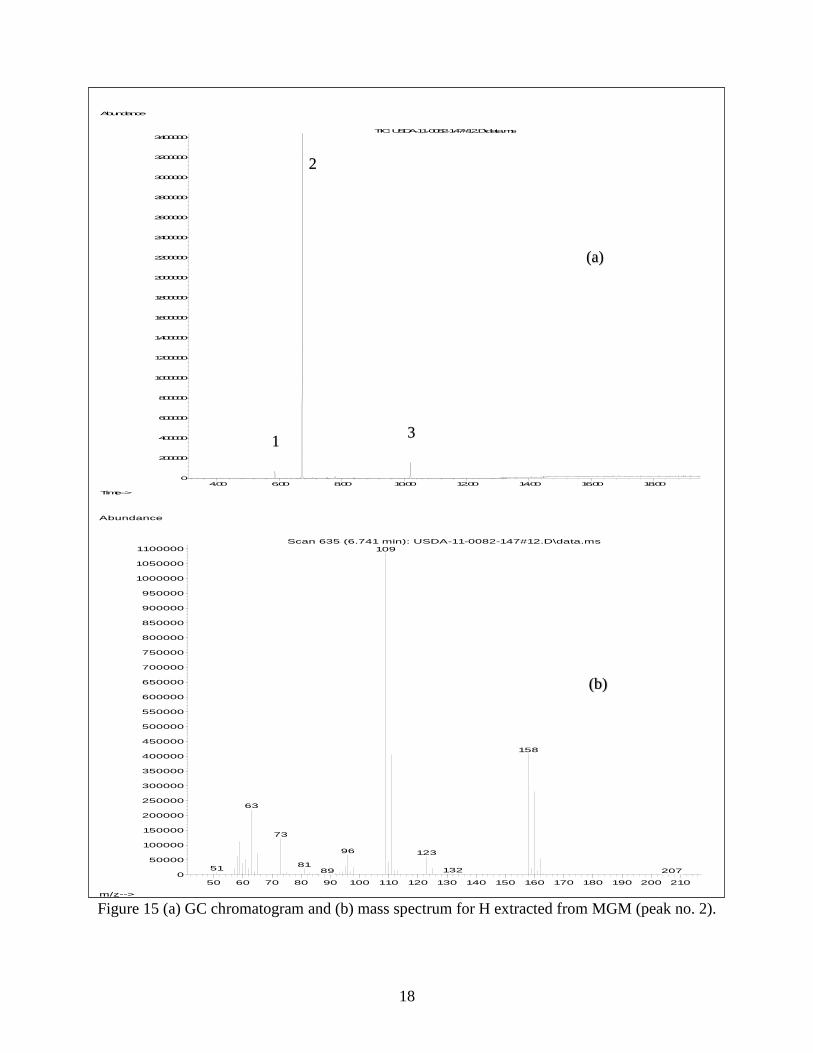
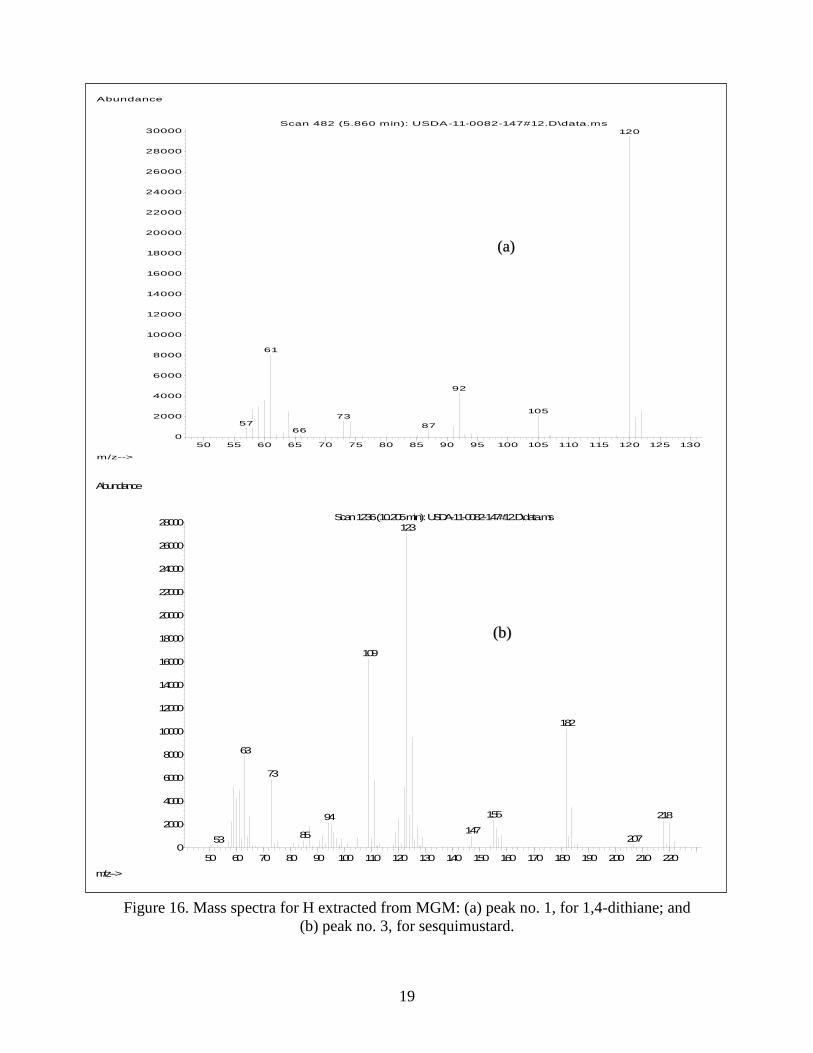
Figures 15 and 16 show representative GC chromatograms for H extracted from
MGM-spiked food matrices using the normal-phase silica gel column method. The H peak
appeared at 6.74 min and exhibited [M+˙] at m/z 158 and loss of Cl– at m/z 123 (Figure 15). As
shown in Figure 16, the first peak at Rt = 5.86 min was identified as 1,4-dithiane, and the third
peak at Rt = 10.2 min was identified as sesquimustard.
Table 3. Percent Recoveries and RSDs for H from MGM
Sample
Recovery of H
from MGM
(%)
RSD
(%)
Control: MGM in IPA 85 N/A
Apple juice 80 1.3
Whole milk 86 2.0
Tomato sauce 95 4.6
Hot dog 98 0.8 Note: Values are averages from three analyses.
N/A, not applicable.
18
Figure 15 (a) GC chromatogram and (b) mass spectrum for H extracted from MGM (peak no. 2).
4.00 6.00 8.00 10.00 12.00 14.00 16.00 18.00
0
200000
400000
600000
800000
1000000
1200000
1400000
1600000
1800000
2000000
2200000
2400000
2600000
2800000
3000000
3200000
3400000
Time-->
Abundance
TIC: USDA-11-0082-147#12.D\data.ms
50 60 70 80 90 100 110 120 130 140 150 160 170 180 190 200 210
0
50000
100000
150000
200000
250000
300000
350000
400000
450000
500000
550000
600000
650000
700000
750000
800000
850000
900000
950000
1000000
1050000
1100000
m/z-->
Abundance
Scan 635 (6.741 min): USDA-11-0082-147#12.D\data.ms
109
158
63
73
96 123
8151 13289 207
(b)
(a)
1
2
3
19
Figure 16. Mass spectra for H extracted from MGM: (a) peak no. 1, for 1,4-dithiane; and
(b) peak no. 3, for sesquimustard.
50 55 60 65 70 75 80 85 90 95 100 105 110 115 120 125 130
0
2000
4000
6000
8000
10000
12000
14000
16000
18000
20000
22000
24000
26000
28000
30000
m/z-->
Abundance
Scan 482 (5.860 min): USDA-11-0082-147#12.D\data.ms
120
61
92
10573
57 8766
50 60 70 80 90 100 110 120 130 140 150 160 170 180 190 200 210 2200
2000
4000
6000
8000
10000
12000
14000
16000
18000
20000
22000
24000
26000
28000
m/z-->
Abundance
Scan 1236 (10.205 min): USDA-11-0082-147#12.D\data.ms123
109
182
63
73
155 21894
14785 20753
(a)
(b)
20
4. CONCLUSION
An extraction technique for HD was successfully developed, and recoveries were
greater than 80% for all food matrices. This report details the extraction procedure and the
analysis to demonstrate how these results were achieved. This easy-to-use extraction method can
be used to determine HD amounts in complex food matrices, including foods in high-salt and
high-fat categories. Future work will focus on applying smaller HD spikes to foodstuffs in an
effort to use other commercially available columns.
21
LITERATURE CITED
1. Andersson, G. Analysis of Two Chemical Weapons Samples from the Iran–Iraq War;
NBC Defence and Technology International: New York, 1986; pp 62–65.
2. Sidell, F.R.; Urbanetti, J.S.; Smith, W.J.; Hurst, C.G. Vesicants. In Textbook of Military
Medicine: Medical Aspects of Chemical and Biological Warfare. Part I, Warfare,
Weaponry, and the Casualty. Walter Reed Army Medical Center: Washington, DC, 1997,
pp 198–227.
3. SciFinder; Chemical Abstracts Service: Columbus, OH; https://scifinder.cas.org/
(accessed January 2016).
4. Rohrbaugh, D.K.; Yang, Y.C.; Ward, J.R. Identification of Degradation Products of
2-Chloroethyl Ethyl Sulfide by Gas Chromatography–Mass Spectrometry.
J. Chromatogr. 1988, 447, 165–169.
5. Yang, Y.C.; Szafraniec, L.L.; Beaudry, W.T.; Davis, F.A. A Comparison of the Oxidative
Reactivities of Mustard (2,2'-Dichlorodiethyl Sulfide) and Bivalent Sulfides. J. Org.
Chem. 1990, 55, 3664–3666.
6. Yang, Y.C.; Szafraniec, L.L.; Beaudry, W.T.; Ward, J.R. Kinetics and Mechanisms of the
Hydrolysis of 2-Chloroethyl Sulfides. J. Org. Chem. 1988, 53, 3293–3297.
7. Hsu, F.L.; Szafraniec, L.L.; Beaudry, W.T.; Yang, Y.C. Oxidation of 2-Chloroethyl
Sulfides to Sulfoxides by Dimethyl Sulfoxide. J. Org. Chem. 1990, 55, 4153–4155.
8. Wagner, G.W.; MacIver, B.K. Degradation and Fate of Mustard in Soil as Determined by 13C MAS NMR. Langmuir 1998, 14, 6930–6934.
9. Wagner, G.W.; MacIver, B.K.; Rohrbaugh, D.K.; Yang, Y.C. Thermal Degradation of
Bis (2-Chloroethyl) Sulfide (Mustard Gas). Phosphorus Sulfur Silicon Relat. Elem. 1999,
152, 65–76.
10. Bae, S.Y.; Winemiller, M.D. Mechanistic Insights into the Hydrolysis of 2-Chloroethyl
Ethyl Sulfide: The Expanded Roles of Sulfonium Salts. J. Org. Chem. 2013, 78,
6457–6470.
11. Budde, W.L. Analytical Mass Spectrometry: Strategies for Environmental and Related
Applications; American Chemical Society: Washington, DC, 2001.
12. Hassko, A. Action of Mustard Gas on Foods. Analyst 1940, 65, 427.
13. Martin, F. Analytical Characteristics of Dichloroethyl Sulfide. Journal de Pharmacie et
de Chimie 1920, 22, 161–165.
14. Wang, P.; Zhang, Y.J.; Chen, J.; Guo, L.; Xu, B.; Wang, L.L.; Xu, H.; Xie, J.W. Analysis
of Different Fates of DNA Adducts in Adipocytes Post-Sulfur Mustard Exposure in Vitro
and in Vivo Using a Simultaneous UPLC-MS/MS Quantification Method. Chem. Res.
Toxicol. 2015, 28, 1224–1233.
15. van der Schans, G.P.; Noort, D.; Mars-Groenendijk, R.H.; Fidder, A.; Chau, L.F.;
de Jong, L.P.A.; Benschop, H.P. Immunochemical Detection of Sulfur Mustard Adducts
with Keratins in the Stratum Corneum of Human Skin. Chem. Res. Toxicol. 2002, 15,
21–25.
16. Van Delft, J.H.M.; Van Weert, E.J.M.; Schellekens, M.M.; Claassen, E.; Baan, R.A. The
Isolation of Monoclonal Antibodies Selected for the Detection of Imidazole Ring-Opened
N7-Ethylguanine in Purified DNA and in Cells in Situ. Crossreaction with Methyl,
2-Hydroxyethyl and Sulphur Mustard Adducts. Carcinogenesis 1991, 12, 1041–1049.
22
17. Li, C.Z.; Chen, J.; Liu, Q.; Xie, J.W.; Li, H. Simultaneous Quantification of Seven
Plasma Metabolites of Sulfur Mustard by Ultra High Performance Liquid
Chromatography–Tandem Mass Spectrometry. J. Chromatogr. B 2013, 917, 100–107.
18. Maisonneuve, A.; Callebat, I.; Debordes, L.; Coppet, L. Specific and Sensitive
Quantitation of 2,2'-Dichlorodiethyl Sulphide (Sulphur Mustard) in Water, Plasma and
Blood: Application to Toxicokinetic Study in the Rat after Intravenous Intoxication.
J. Chromatogr. 1992, 583, 155–165.
19. Pantazides, B.G.; Crow, B.S.; Garton, J.W.; Quiñones-Gonzalez, J.A.; Blake, T.A.;
Thomas, J.D.; Johnson, R.C. Simplified Method for Quantifying Sulfur Mustard Adducts
to Blood Proteins by Ultrahigh Pressure Liquid Chromatography−Isotope Dilution
Tandem Mass Spectrometry. Chem. Res. Toxicol. 2015, 28, 256–261.
20. Kanaujia, P.K.; Pardasani, D.; Gupta, A.K.; Dubey, D.K. Extraction of Chemical Warfare
Agents from Water with Hydrophilic-Lipophilic Balance and C18 Cartridges:
Comparative Study. J. Chromatogr. A 2007, 1139, 185–190.
21. Palit, M.; Pardasani, D.; Gupta, A.K.; Dubey, D.K. Application of Single Drop
Microextraction for Analysis of Chemical Warfare Agents and Related Compounds in
Water by Gas Chromatography/Mass Spectrometry. Anal. Chem. 2005, 77, 711–717.
22. Lockwood, H.C. The Determination of Traces of Mustard Gas in Contaminated
Foodstuffs and Other Commodities. Analyst 1941, 66, 480–486.
23. Feng, C.L.; Zhou, Q.X.; Hu, Q.Y. Analysis of 7 Chemical Warfare Agents in
Contaminated Grain by Gas Chromatography–Flame Photometric Detection. Chinese J.
Anal. Chem. 2000, 28, 1245–1247.
23
ACRONYMS AND ABBREVIATIONS
80/20 80% lean and 20% fat
ECBC U.S. Army Edgewood Chemical Biological Center
EI electron impact
GC gas chromatography
HD sulfur mustard; bis(2-chloroethyl) sulfide
IPA isopropyl alcohol
LDR linear dynamic range
LOD limit of detection
LOQ limit of quantitation
M+˙ molecular ion
MGM munitions-grade mustard
MS mass spectrometry
m/z mass-to-charge ratio
RSD relative standard deviation
SIM single ion monitoring
TEA triethylamine
TIC total ion chromatogram

DISTRIBUTION LIST
The following organizations were provided with one Adobe portable document
format (pdf) version of this report:
U.S. Army Edgewood Chemical
Biological Center (ECBC)
RDCB-DRC-C
ATTN: Bae, S.
Winemiller, M.
Berg, F.
ECBC Technical Library
RDCB-DRB-BL
ATTN: Foppiano, S.
Stein, J.
Defense Technical Information Center
ATTN: DTIC OA
G-3 History Office
U.S. Army RDECOM
ATTN: Smart, J.
Office of the Chief Counsel
AMSRD-CC
ATTN: Upchurch, V.
ECBC Rock Island
RDCB-DES
ATTN: Lee, K.

Top Related