


Languages
Pages
Legal

ENGINEERING GROWTHPIONEERING EXCELLENCE
Mehul Shah

2
ENERGY PRODUCTS DIVISION
Mehul Shah

3
EPD
Organization Structure & Escalation Matrix
Amit Bhatia
SBU Head, EPD
Mehul Shah
Head, Operations
Raviraj Pawar
Vendor Dvlpmnt
Hiranmoy Dey
Gajendra Singh
Zakir Saiyad
Santosh Sinh
Narendra Mahale
Procurement
Dharmik Kalathia
Harshit Doshi
Deepak Atri
Gyandev Barot
Himanshu Gandhi,
Head, QA
Hemang Gala,
Customer Service
Sinu Sadashivan
Production
Tenish Francis
TPM and BE
4
EPD
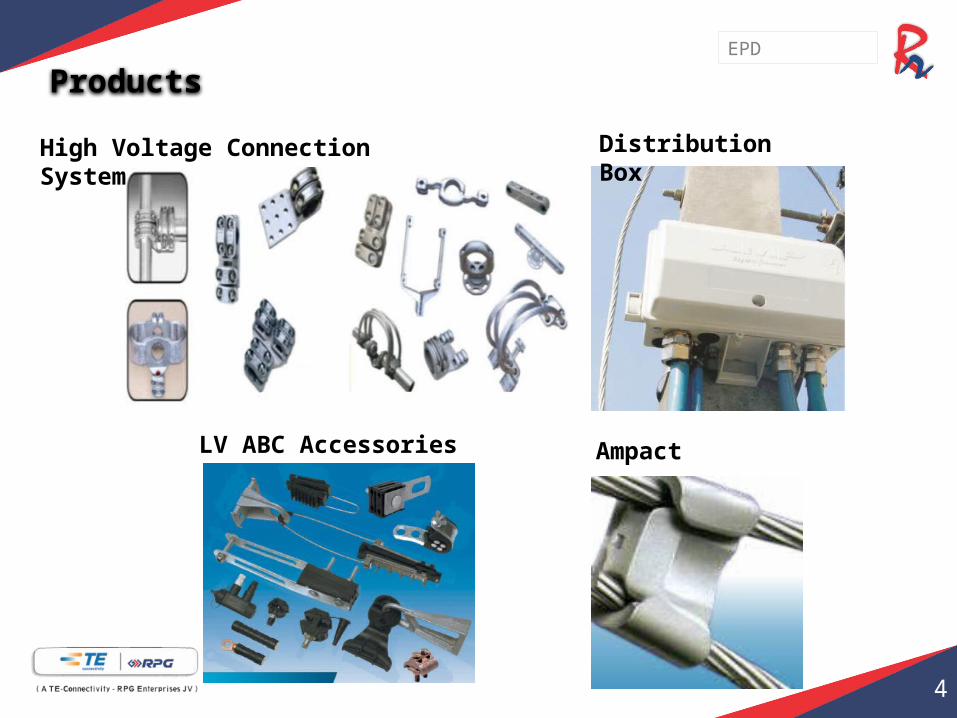
Products
High Voltage Connection System Distribution Box
LV ABC Accessories Ampact

5
EPD
Products
Surge Arresters Insulators
Drop Out Fuses
6
EPD
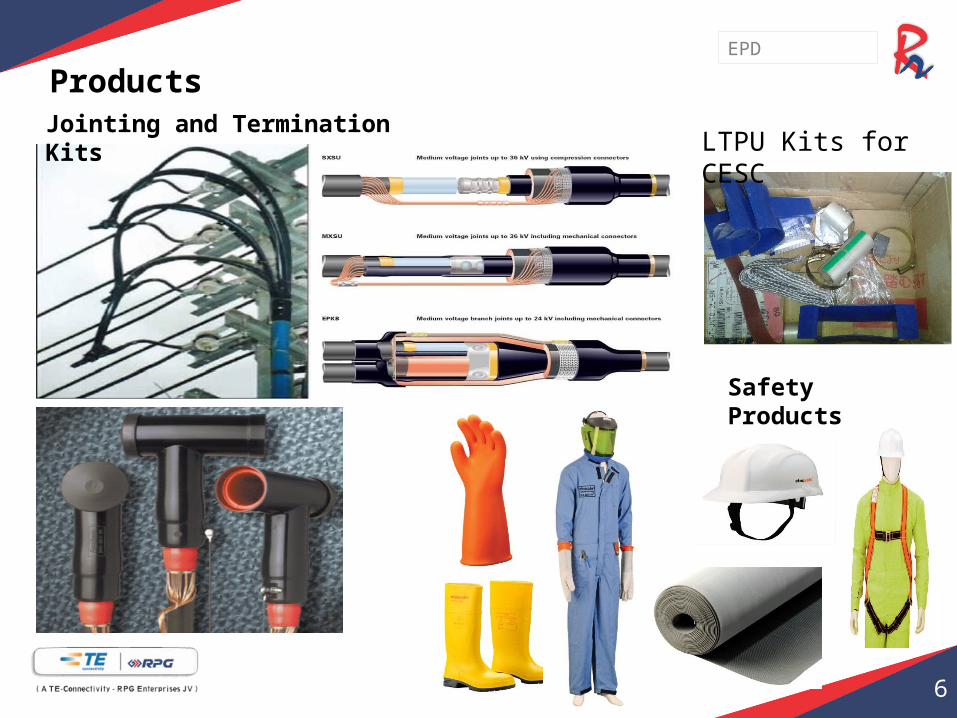
ProductsJointing and Termination Kits
Safety Products
LTPU Kits for CESC
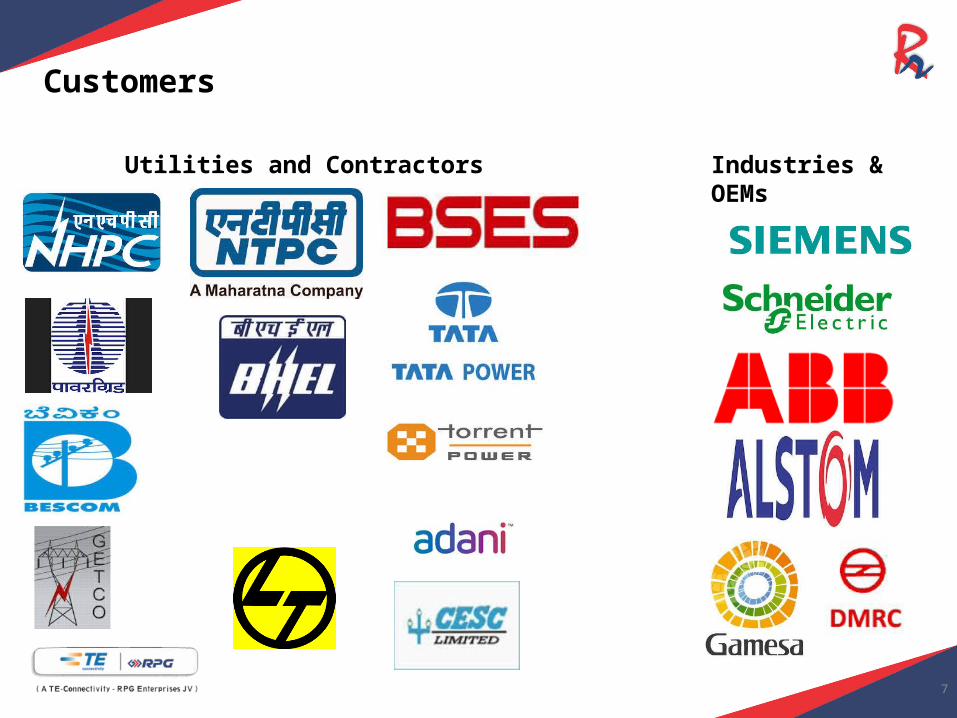
Customers
7
Utilities and Contractors Industries & OEMs
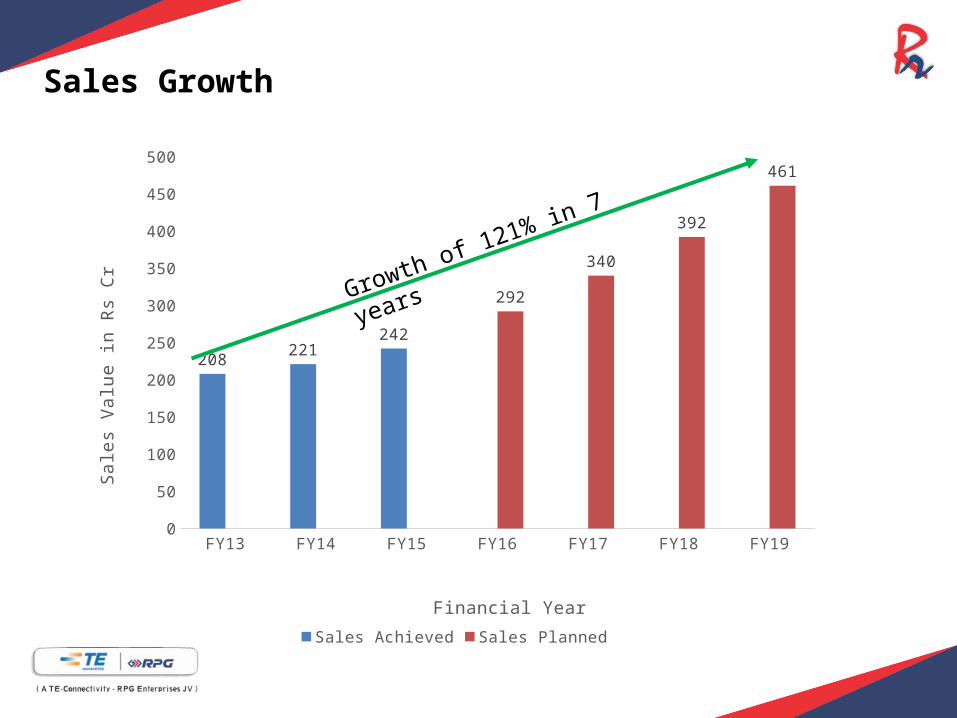
Sales Growth
FY13 FY14 FY15 FY16 FY17 FY18 FY190
50
100
150
200
250
300
350
400
450
500
208221
242
292
340
392
461
Sales Achieved Sales Planned
Financial Year
Sa
les
Va
lue
in R
s C
r
Growth of 121% in 7 years

SRI-DSI
FY14 FY15 2015-04 2015-05 2015-060.0%
10.0%
20.0%
30.0%
40.0%
50.0%
60.0%
70.0%
80.0%
90.0%
61.0%
72.9%
59.0%
80.0% 79.0%
15.0%
21.5%
16.0%
26.0%
34.0%
Trend
SRI Linear (SRI) DSI Linear (DSI)
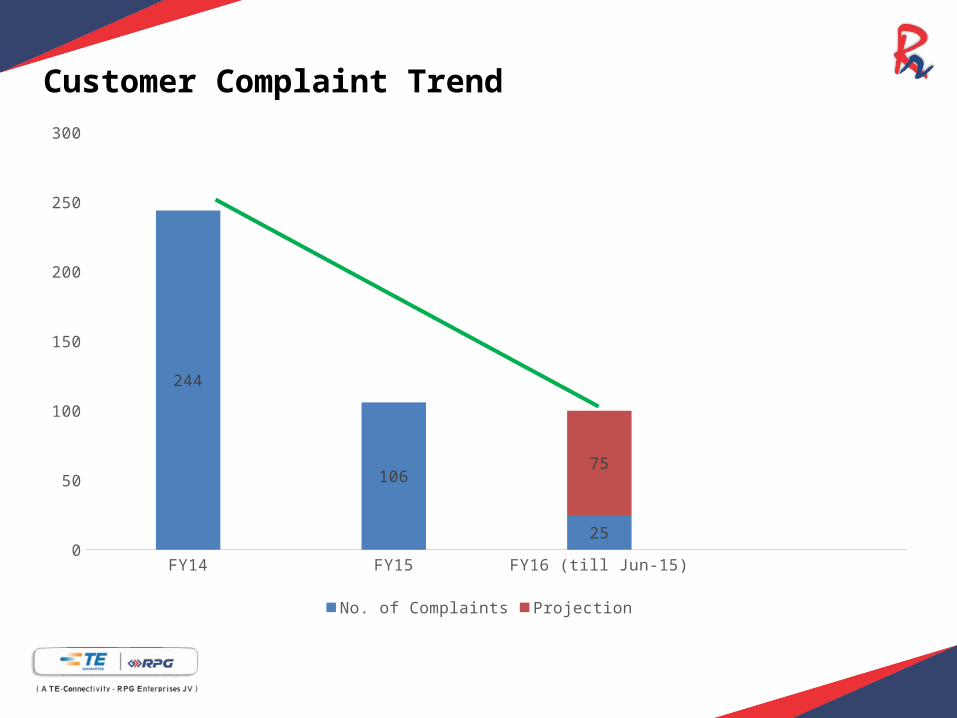
Customer Complaint Trend
FY14 FY15 FY16 (till Jun-15)0
50
100
150
200
250
300
244
106
25
75
No. of Complaints Projection
Challenges Lead Time Reduction
First Time Right Quality for new developed products
Price Erosion
Tailor-made / Value Added Products
Working Capital

Expectations from Vendor Partners
Consistency and Reliability in supplies Delivery Quality
Partnership for New Product Development Aggressive Lead Times First Time Right
VMI for improved deliveries ( DSI/SRI )
Upgrading under RSVP umbrella to Green Channel

THANK YOU
Top Related