


Languages
Pages
Legal


Durable
Business Drives
Cash Flow and
Dividend Growth
June 2017
Safe Harbor Language and Reconciliation of Non-GAAP Measures
2
This presentation contains certain forward-looking statements within the meaning of the Private Securities Litigation Reform Act of 1995 and other securities laws and is subject to the safe-harbor
created by such Act. Forward-looking statements include, but are not limited to, our financial performance outlook and statements concerning our operations, economic performance, financial
condition, goals, beliefs, future growth strategies, investment objectives plans and current expectations, such as 2017 guidance, 2020 outlook, expected shareholder returns and cash available for
distribution, the expected total cost to integrate Recall Holdings Limited (“Recall”) with our company and expected synergies from the acquisition, strategic goals, impact and expected cost savings
associated with the Transformation Initiative, projected revenue and financial impact from acquisition pipeline, valuation creation and returns associated with our data center and other adjacent
businesses, capex and innovation spend and targeted leverage ratios. These forward-looking statements are subject to various known and unknown risks, uncertainties and other factors. When we
use words such as "believes," "expects," "anticipates," "estimates" or similar expressions, we are making forward-looking statements. You should not rely upon forward-looking statements except
as statements of our present intentions and of our present expectations, which may or may not occur. Although we believe that our forward-looking statements are based on reasonable
assumptions, our expected results may not be achieved, and actual results may differ materially from our expectations. Important factors that could cause actual results to differ from our other
expectations include, among others: (i) our expected dividends may be materially different than our estimates (ii) our ability to remain qualified for taxation as a real estate investment trust for U.S.
federal income tax purposes; (iii) the adoption of alternative technologies and shifts by our customers to storage of data through non-paper based technologies; (iv) changes in customer
preferences and demand for our storage and information management services; (v) the cost to comply with current and future laws, regulations and customer demands relating to data security,
privacy issues, as well as fire and safety standards; (vi) the impact of litigation or disputes that may arise in connection with incidents in which we fail to protect our customers' information; (vii)
changes in the price for our storage and information management services relative to the cost of providing such storage and information management services; (viii) changes in the political and
economic environments in the countries in which our international subsidiaries operate and changes in the global political climate; (ix) our ability or inability to complete acquisitions on satisfactory
terms and to integrate acquired companies efficiently; (x) changes in the amount of our capital expenditures; (xi) changes in the cost of our debt; (xii) the impact of alternative, more attractive
investments on dividends; (xiii) the cost or potential liabilities associated with real estate necessary for our business; (xiv) the performance of business partners upon whom we depend for technical
assistance or management expertise outside the United States; (xv) other trends in competitive or economic conditions affecting our financial condition or results of operations not presently
contemplated; and (xvi) other risks described more fully in our filings with the Securities and Exchange Commission, including under the caption “Risk Factors” in our periodic reports including our
Annual Report on Form 10-K for the fiscal year ending December 31, 2016. Except as required by law, we undertake no obligation to release publicly the result of any revision to these forward-
looking statements that may be made to reflect events or circumstances after the date hereof or to reflect the occurrence of unanticipated events.
Reconciliation of Non-GAAP Measures:
Throughout this presentation, Iron Mountain will discuss (1) Adjusted EBITDA, (2) Adjusted Earnings per Share (“Adjusted EPS”), (3) Funds from Operations (“FFO NAREIT”), (4) FFO
(Normalized) and (5) Adjusted Funds from Operations (“AFFO”). These measures do not conform to accounting principles generally accepted in the United States (“GAAP”). These non-GAAP
measures are supplemental metrics designed to enhance our disclosure and to provide additional information that we believe to be important for investors to consider in addition to, but not as a
substitute for, other measures of financial performance reported in accordance with GAAP, such as operating income, income (loss) from continuing operations, net income (loss) or cash flows
from operating activities from continuing operations (as determined in accordance with GAAP). The reconciliation of these measures to the appropriate GAAP measure, as required by Regulation
G under the Securities Exchange Act of 1934, as amended, and the definitions of such Non-GAAP measures and certain operational measures are included in the Supplemental Financial
Information. Iron Mountain does not provide a reconciliation of non-GAAP measures that it discusses as part of its annual guidance or long term outlook because certain significant information
required for such reconciliation is not available without unreasonable efforts or at all, including, most notably, the impact of exchange rates on Iron Mountain’s transactions, loss or gain related to
the disposition property, plant and equipment (including of real estate) and other income or expense. Without this information, Iron Mountain does not believe that a reconciliation would be
meaningful.
Note: All financial projections and forward looking statements included herein are current as of reporting
the company’s first quarter results on April 27, 2017.

Introduction and
Strategic Plan
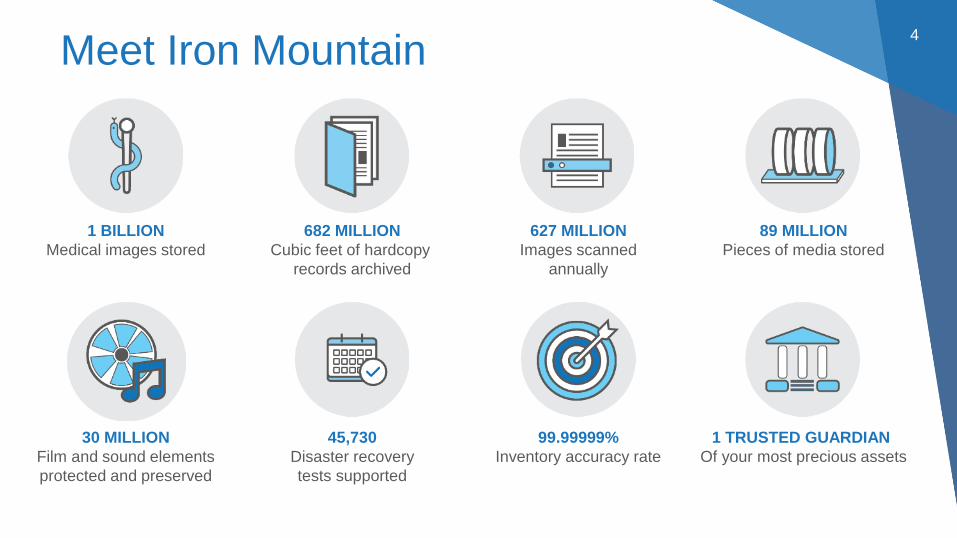
Meet Iron Mountain4
1 BILLION
Medical images stored
682 MILLION
Cubic feet of hardcopy
records archived
627 MILLION
Images scanned
annually
89 MILLION
Pieces of media stored
45,730
Disaster recovery
tests supported
30 MILLION
Film and sound elements
protected and preserved
99.99999%
Inventory accuracy rate
1 TRUSTED GUARDIAN
Of your most precious assets
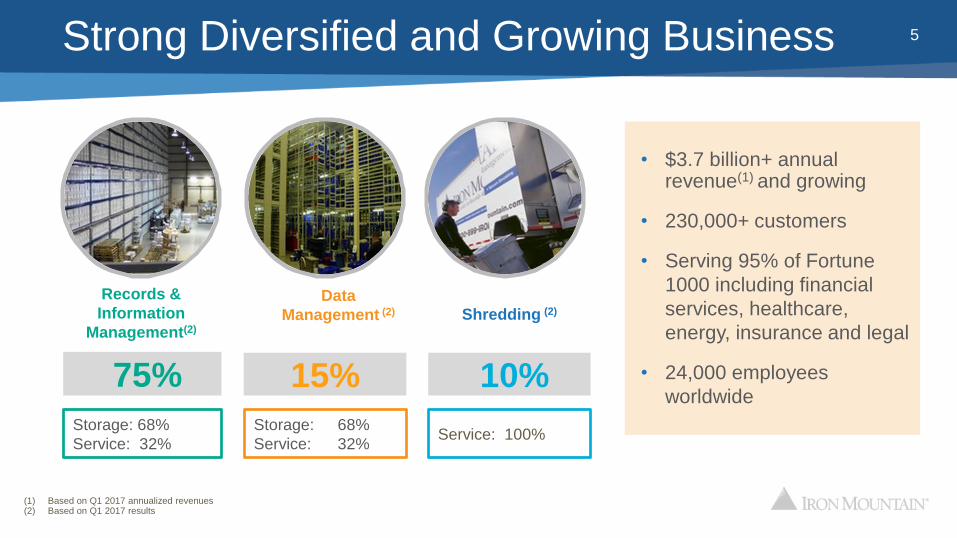
Strong Diversified and Growing Business 5
75% 15% 10%
Records &
Information
Management(2)
Data
Management (2) Shredding (2)
Storage: 68%
Service: 32%
Storage: 68%
Service: 32%Service: 100%
• $3.7 billion+ annual revenue(1) and growing
• 230,000+ customers
• Serving 95% of Fortune
1000 including financial
services, healthcare,
energy, insurance and legal
• 24,000 employees
worldwide
(1) Based on Q1 2017 annualized revenues (2) Based on Q1 2017 results
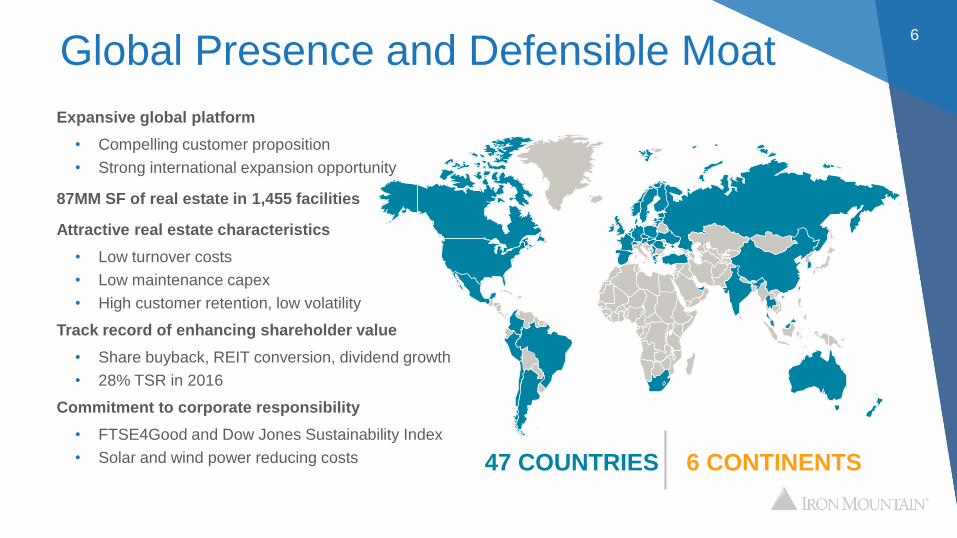
Global Presence and Defensible Moat6
Expansive global platform
• Compelling customer proposition
• Strong international expansion opportunity
87MM SF of real estate in 1,455 facilities
Attractive real estate characteristics
• Low turnover costs
• Low maintenance capex
• High customer retention, low volatility
Track record of enhancing shareholder value
• Share buyback, REIT conversion, dividend growth
• 28% TSR in 2016
Commitment to corporate responsibility
• FTSE4Good and Dow Jones Sustainability Index
• Solar and wind power reducing costs 6 CONTINENTS47 COUNTRIES
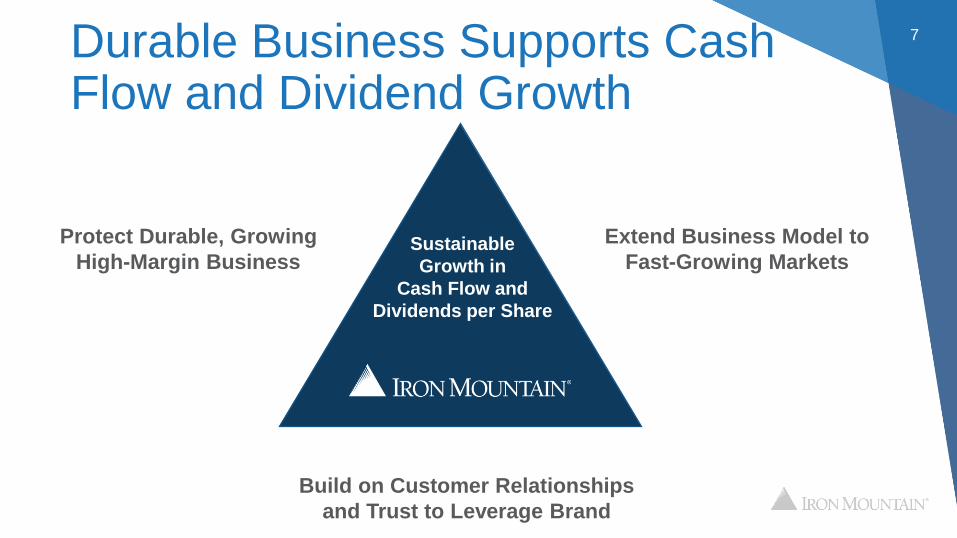
Durable Business Supports Cash Flow and Dividend Growth
7
Extend Business Model to
Fast-Growing Markets
Build on Customer Relationships
and Trust to Leverage Brand
Sustainable Growth in
Cash Flow and
Dividends per Share
Protect Durable, Growing
High-Margin Business Sustainable
Growth in
Cash Flow and
Dividends per Share
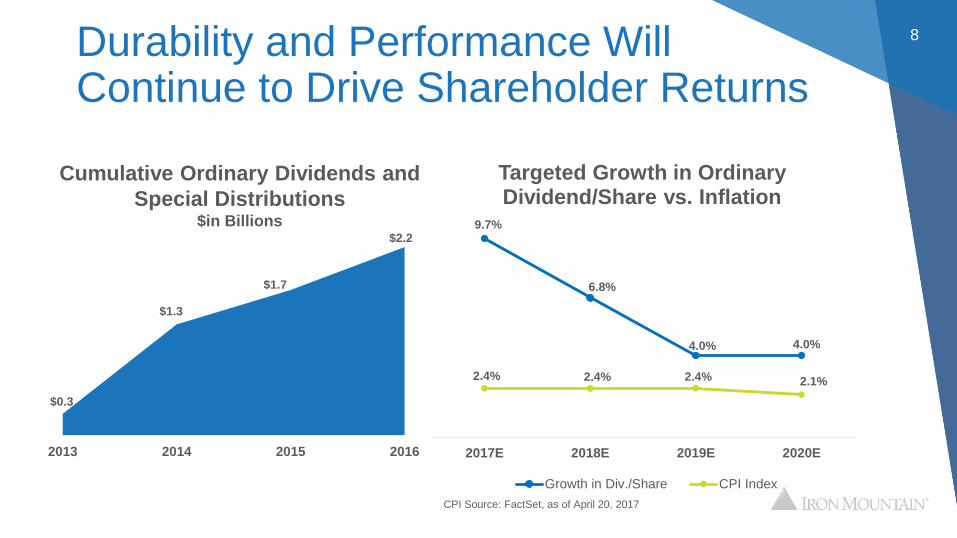
8Durability and Performance Will Continue to Drive Shareholder Returns
$0.3
$1.3
$1.7
$2.2
2013 2014 2015 2016
Cumulative Ordinary Dividends and
Special Distributions $in Billions 9.7%
6.8%
4.0% 4.0%
2.4% 2.4% 2.4% 2.1%
2017E 2018E 2019E 2020E
Targeted Growth in Ordinary Dividend/Share vs. Inflation
Growth in Div./Share CPI Index
CPI Source: FactSet, as of April 20, 2017
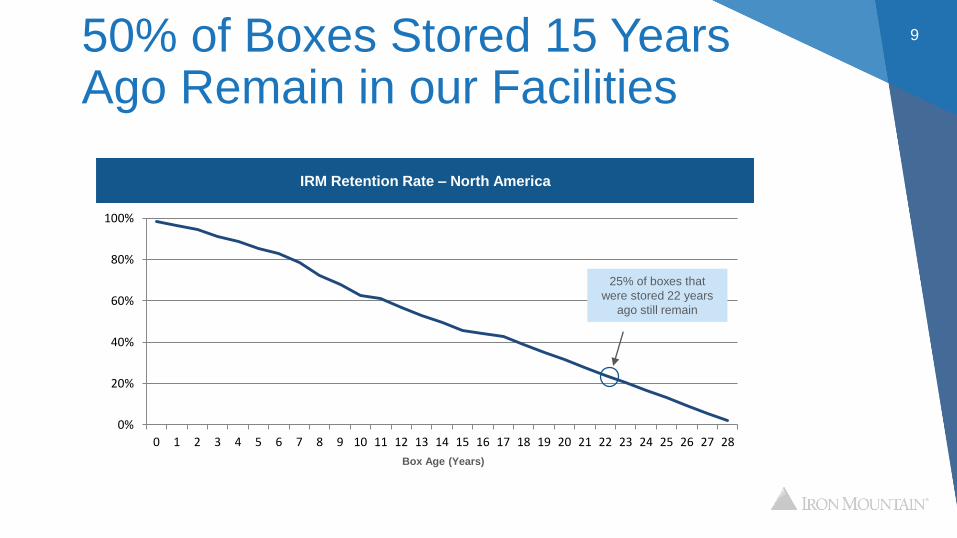
50% of Boxes Stored 15 Years Ago Remain in our Facilities
9
0%
20%
40%
60%
80%
100%
0 1 2 3 4 5 6 7 8 9 10 11 12 13 14 15 16 17 18 19 20 21 22 23 24 25 26 27 28
IRM Retention Rate – North America
25% of boxes that
were stored 22 years
ago still remain
Box Age (Years)
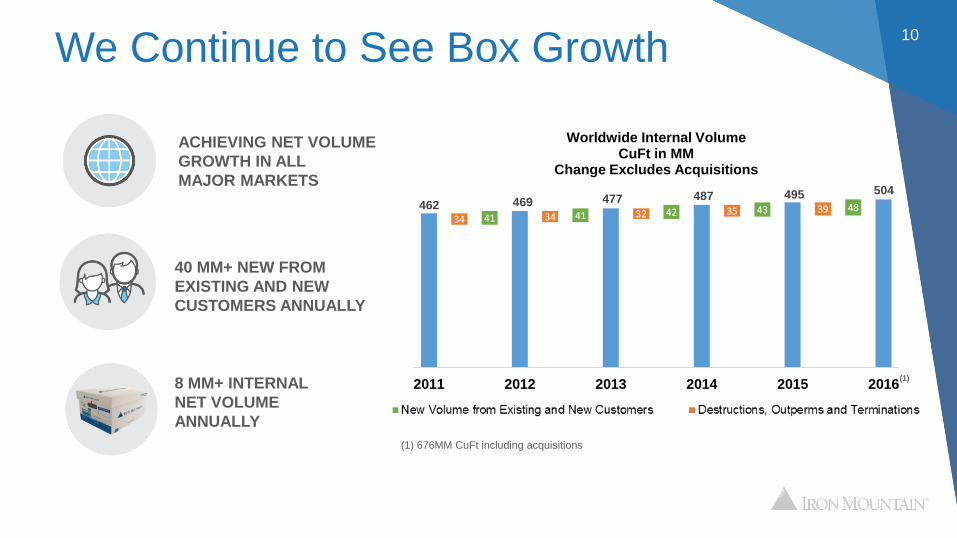
We Continue to See Box Growth10
40 MM+ NEW FROM
EXISTING AND NEW
CUSTOMERS ANNUALLY
8 MM+ INTERNAL
NET VOLUME
ANNUALLY
ACHIEVING NET VOLUME
GROWTH IN ALL
MAJOR MARKETS
462 469 477 487 495 504
34 41 34 41 32 42 35 43 39 48
2011 2012 2013 2014 2015 2016
Worldwide Internal Volume CuFt in MM
Change Excludes Acquisitions
(1) 676MM CuFt including acquisitions
(1)
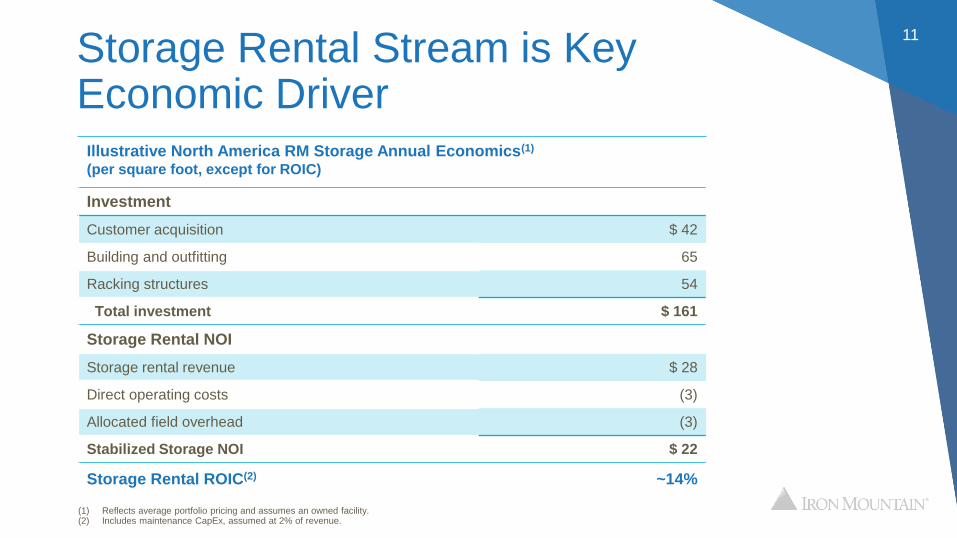
Storage Rental Stream is Key Economic Driver
11
Illustrative North America RM Storage Annual Economics(1)
(per square foot, except for ROIC)
Investment
Customer acquisition $ 42
Building and outfitting 65
Racking structures 54
Total investment $ 161
Storage Rental NOI
Storage rental revenue $ 28
Direct operating costs (3)
Allocated field overhead (3)
Stabilized Storage NOI $ 22
Storage Rental ROIC(2) ~14%
(1) Reflects average portfolio pricing and assumes an owned facility.(2) Includes maintenance CapEx, assumed at 2% of revenue.
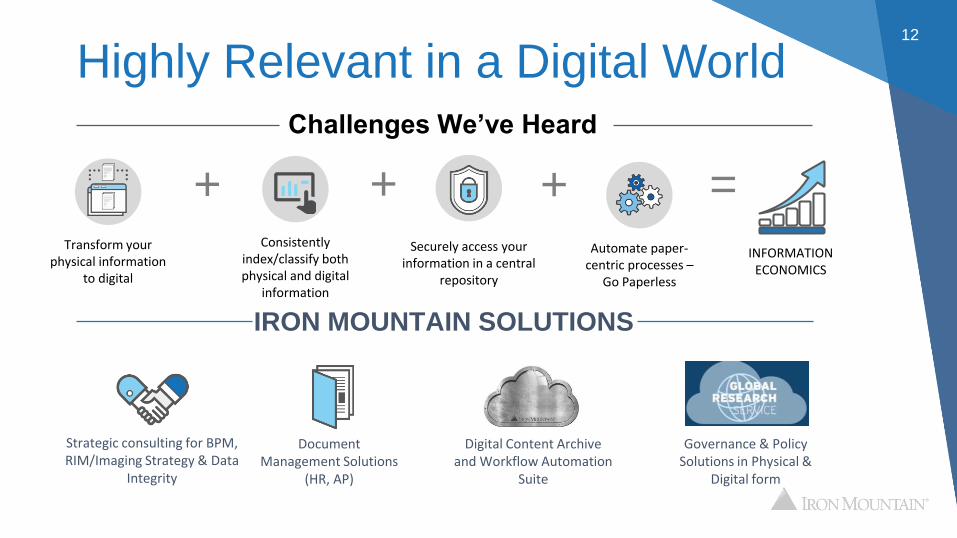
Highly Relevant in a Digital World12
IRON MOUNTAIN SOLUTIONS
+ =+ +Automate paper-
centric processes –Go Paperless
Securely access your information in a central
repository
Transform your physical information
to digital
Consistently index/classify both physical and digital
information
INFORMATION ECONOMICS
Document Management Solutions
(HR, AP)
Strategic consulting for BPM, RIM/Imaging Strategy & Data
Integrity
Digital Content Archive and Workflow Automation
Suite
Challenges We’ve Heard
Governance & Policy Solutions in Physical &
Digital form
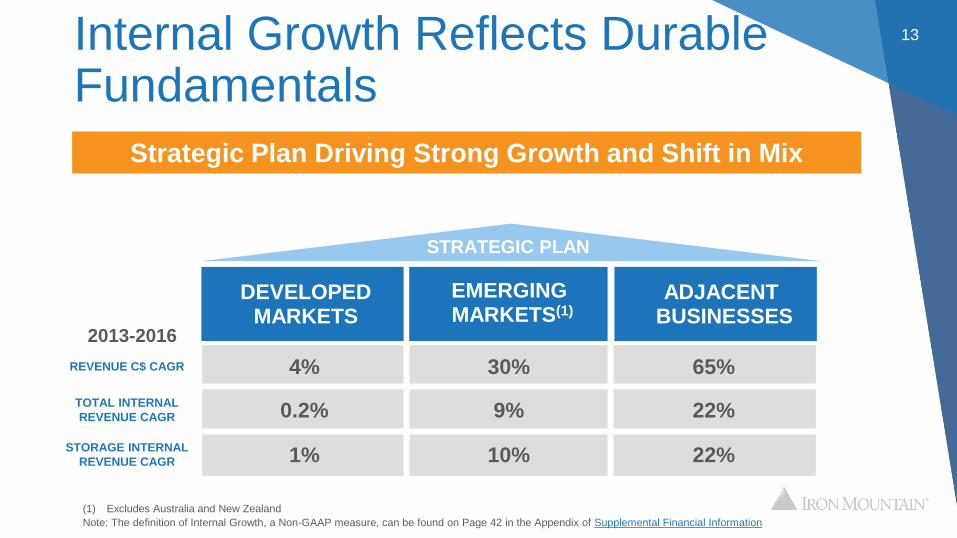
Internal Growth Reflects Durable Fundamentals
13
STRATEGIC PLAN
DEVELOPED MARKETS
EMERGING MARKETS(1)
ADJACENT BUSINESSES
REVENUE C$ CAGR 4% 30% 65%
TOTAL INTERNAL
REVENUE CAGR 0.2% 9% 22%
STORAGE INTERNAL
REVENUE CAGR 1% 10% 22%
2013-2016
Strategic Plan Driving Strong Growth and Shift in Mix
(1) Excludes Australia and New Zealand
Note: The definition of Internal Growth, a Non-GAAP measure, can be found on Page 42 in the Appendix of Supplemental Financial Information

Internal Revenue Growth Shows Momentum in Underlying Business
14
0.5%0.2%
0.8%
1.2%
2013 2014 2015 2016
Internal Total Revenue GrowthRolling 3-Year Average
2.7%2.4% 2.3% 2.4%
2013 2014 2015 2016
Storage Internal GrowthRolling 3-Year Average
-2.5%-2.8%
-1.5%-0.6%
2013 2014 2015 2016
Service Internal GrowthRolling 3-Year Average
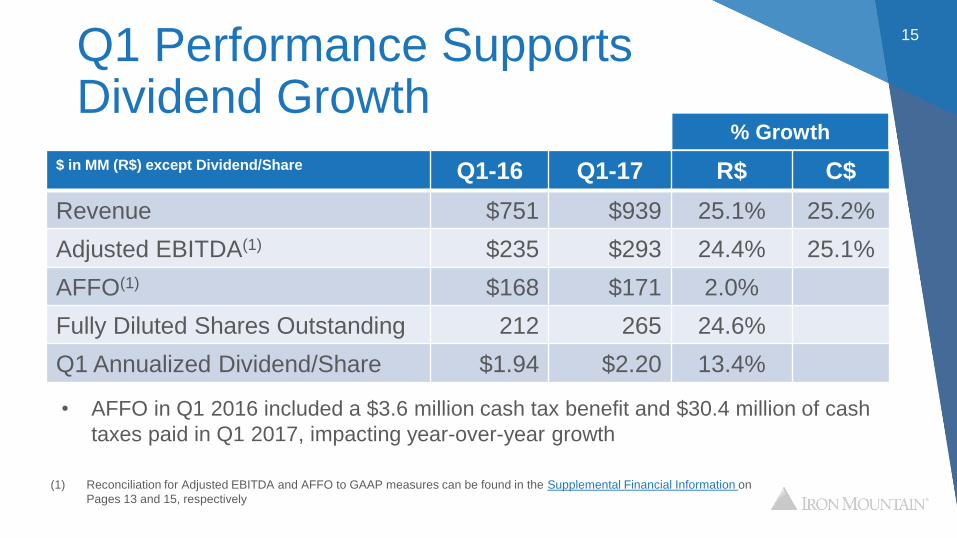
Q1 Performance Supports Dividend Growth
15
$ in MM (R$) except Dividend/Share Q1-16 Q1-17 R$ C$
Revenue $751 $939 25.1% 25.2%
Adjusted EBITDA(1) $235 $293 24.4% 25.1%
AFFO(1) $168 $171 2.0%
Fully Diluted Shares Outstanding 212 265 24.6%
Q1 Annualized Dividend/Share $1.94 $2.20 13.4%
(1) Reconciliation for Adjusted EBITDA and AFFO to GAAP measures can be found in the Supplemental Financial Information on
Pages 13 and 15, respectively
% Growth
• AFFO in Q1 2016 included a $3.6 million cash tax benefit and $30.4 million of cash
taxes paid in Q1 2017, impacting year-over-year growth

Expecting Continued Growth16
~5% Revenue Growth
• 60/40 Internal Growth and M&A
~8% Adjusted EBITDA Growth(1)
• Leveraging leadership and scale
~9% AFFO Growth(1)
• Disciplined capital allocation
4%+ Dividend per Share Growth
• Consistent with business growth
Steady Cash Flow Growth Beyond 2017
(1) Represents CAGRs for 2018-2020
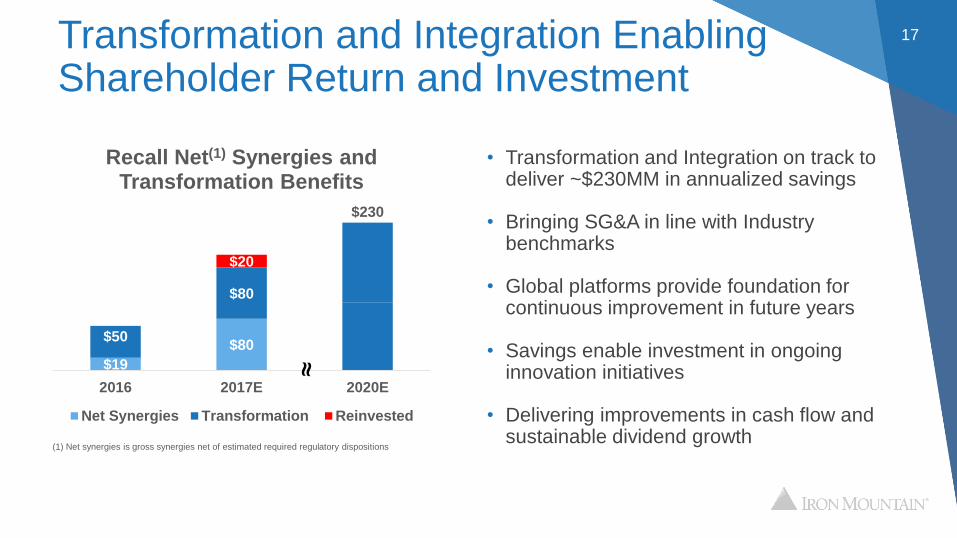
Transformation and Integration Enabling Shareholder Return and Investment
17
• Transformation and Integration on track to deliver ~$230MM in annualized savings
• Bringing SG&A in line with Industry benchmarks
• Global platforms provide foundation for continuous improvement in future years
• Savings enable investment in ongoing innovation initiatives
• Delivering improvements in cash flow and sustainable dividend growth
(1) Net synergies is gross synergies net of estimated required regulatory dispositions
$19
$80$50
$80
$230
$20
2016 2017E 2020E
Recall Net(1) Synergies and Transformation Benefits
Net Synergies Transformation Reinvested
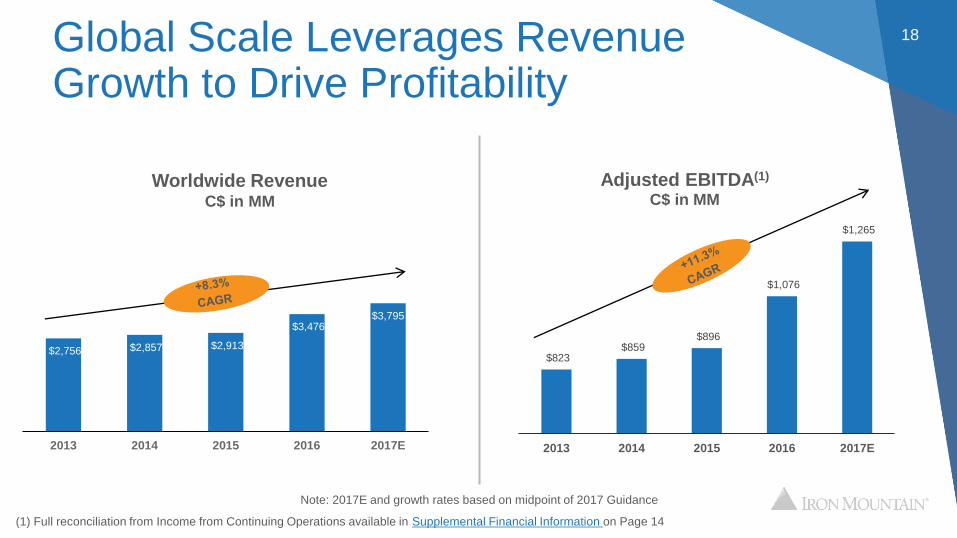
18Global Scale Leverages Revenue Growth to Drive Profitability
$823 $859
$896
$1,076
$1,265
2013 2014 2015 2016 2017E
Adjusted EBITDA(1)
C$ in MMWorldwide Revenue
C$ in MM
$2,756 $2,857 $2,913
$3,476 $3,795
2013 2014 2015 2016 2017E
Note: 2017E and growth rates based on midpoint of 2017 Guidance
(1) Full reconciliation from Income from Continuing Operations available in Supplemental Financial Information on Page 14
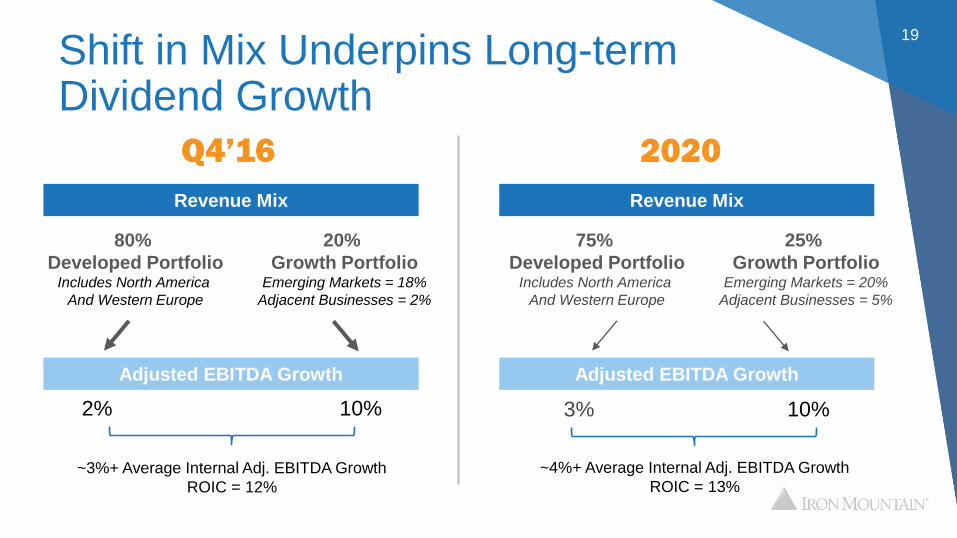
Shift in Mix Underpins Long-term Dividend Growth
19
80%
Developed PortfolioIncludes North America
And Western Europe
20%
Growth PortfolioEmerging Markets = 18%
Adjacent Businesses = 2%
2% 10%
~3%+ Average Internal Adj. EBITDA Growth
ROIC = 12%
Q4’16 2020
Revenue Mix
Adjusted EBITDA Growth
75%
Developed PortfolioIncludes North America
And Western Europe
25%
Growth PortfolioEmerging Markets = 20%
Adjacent Businesses = 5%
3% 10%
~4%+ Average Internal Adj. EBITDA Growth
ROIC = 13%
Revenue Mix
Adjusted EBITDA Growth

Developed Markets and Data Management Opportunity
20
1. Strong Top-line Growth 3% Total Revenue CAGR
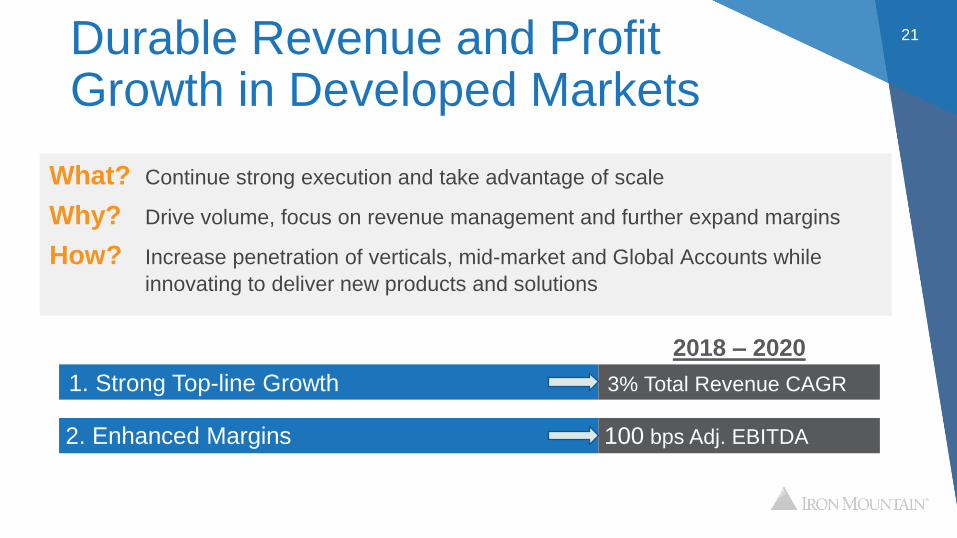
21Durable Revenue and Profit Growth in Developed Markets
2. Enhanced Margins 100 bps Adj. EBITDA
What? Continue strong execution and take advantage of scale
Why? Drive volume, focus on revenue management and further expand margins
How? Increase penetration of verticals, mid-market and Global Accounts while
innovating to deliver new products and solutions
2018 – 2020
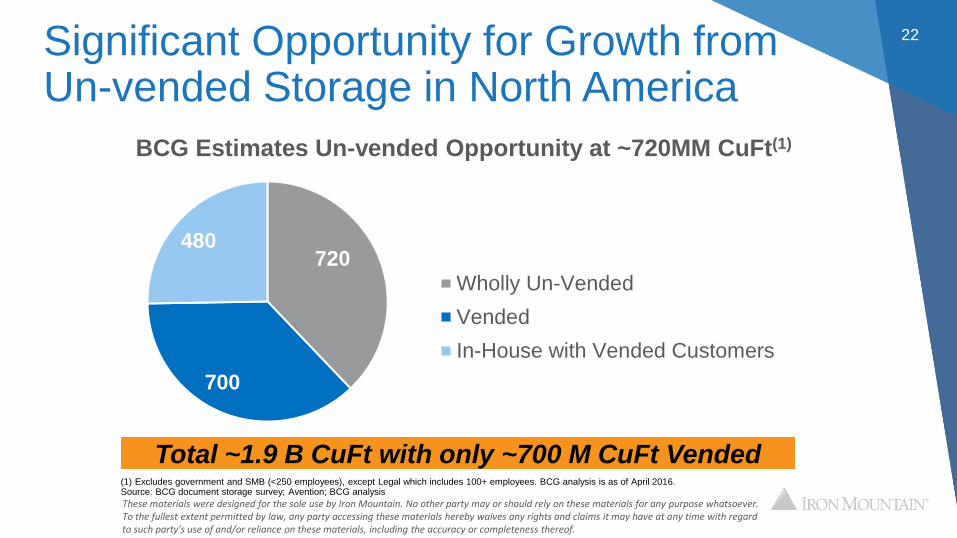
22
720
700
480
Wholly Un-Vended
Vended
In-House with Vended Customers
Significant Opportunity for Growth from Un-vended Storage in North America
Total ~1.9 B CuFt with only ~700 M CuFt Vended(1) Excludes government and SMB (<250 employees), except Legal which includes 100+ employees. BCG analysis is as of April 2016. Source: BCG document storage survey; Avention; BCG analysis
These materials were designed for the sole use by Iron Mountain. No other party may or should rely on these materials for any purpose whatsoever. To the fullest extent permitted by law, any party accessing these materials hereby waives any rights and claims it may have at any time with regard to such party's use of and/or reliance on these materials, including the accuracy or completeness thereof.
BCG Estimates Un-vended Opportunity at ~720MM CuFt(1)
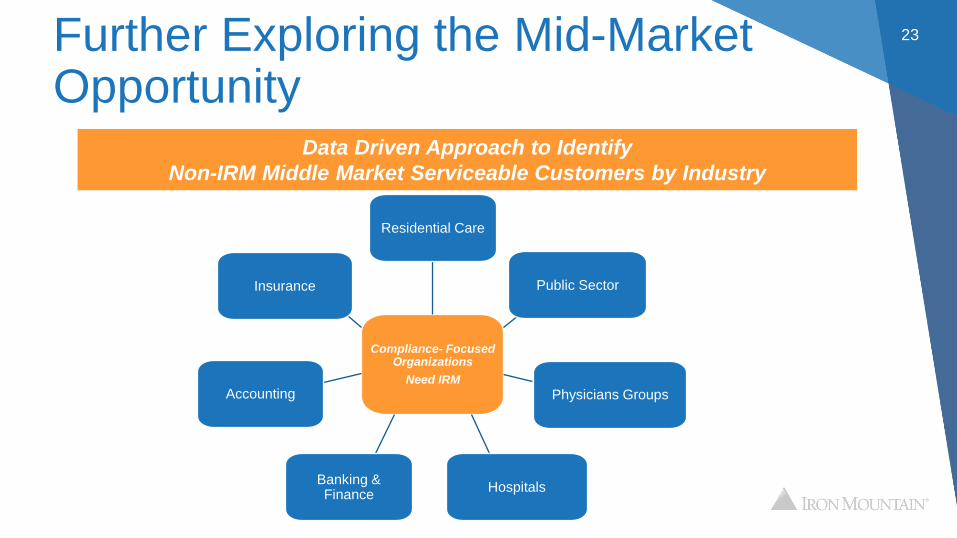
Further Exploring the Mid-Market Opportunity
23
Compliance- Focused Organizations
Need IRM
Residential Care
Public Sector
Physicians Groups
HospitalsBanking & Finance
Accounting
Insurance
Data Driven Approach to Identify
Non-IRM Middle Market Serviceable Customers by Industry
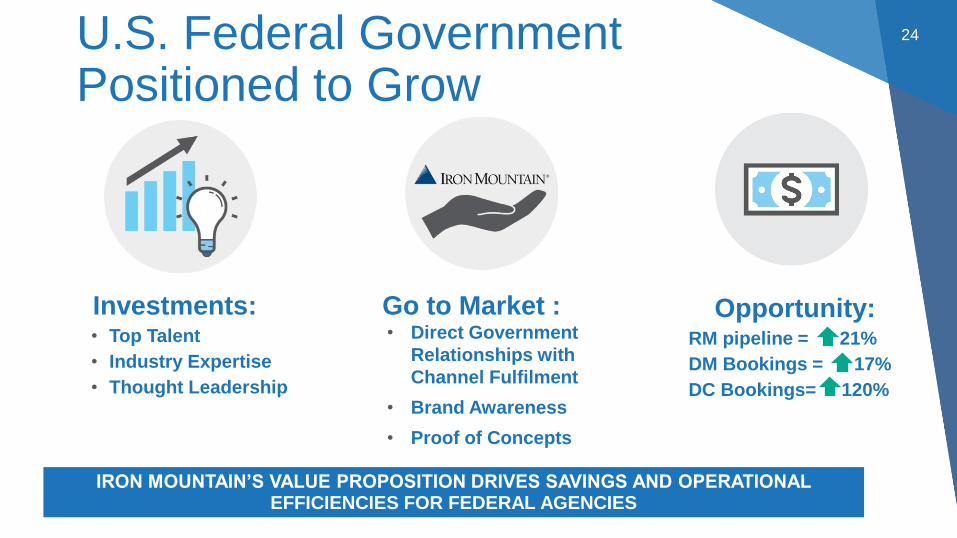
U.S. Federal Government Positioned to Grow
24
IRON MOUNTAIN’S VALUE PROPOSITION DRIVES SAVINGS AND OPERATIONAL EFFICIENCIES FOR FEDERAL AGENCIES
Investments:• Top Talent
• Industry Expertise
• Thought Leadership
Go to Market :• Direct Government
Relationships with
Channel Fulfilment
• Brand Awareness
• Proof of Concepts
Opportunity:RM pipeline = 21%
DM Bookings = 17%
DC Bookings= 120%
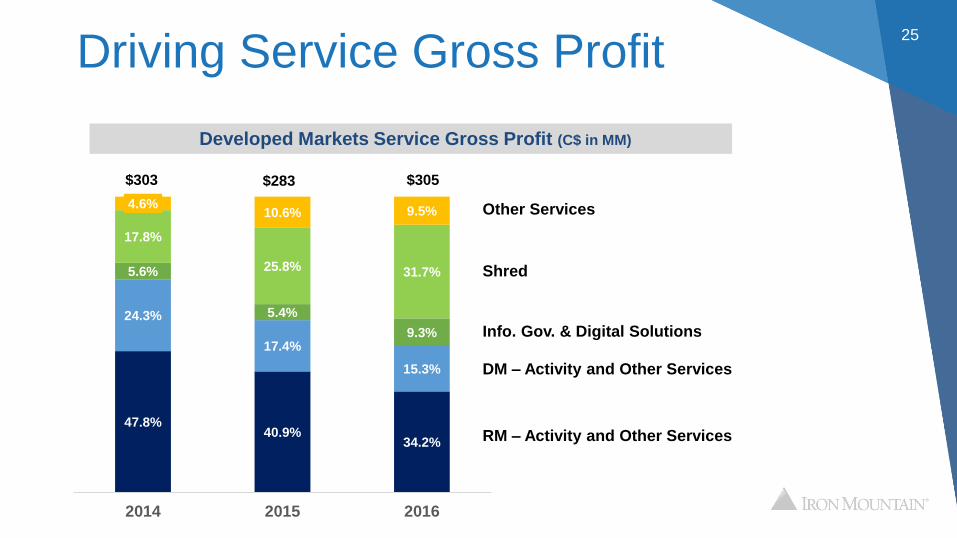
Driving Service Gross Profit 25
Developed Markets Service Gross Profit (C$ in MM)
RM – Activity and Other Services
Shred
DM – Activity and Other Services
Info. Gov. & Digital Solutions
Other Services
47.8% 40.9%
34.2%
24.3%
17.4%
15.3%
5.6%
5.4%
9.3%
17.8%
25.8% 31.7%
4.6% 10.6% 9.5%
2014 2015 2016
$303 $283 $305
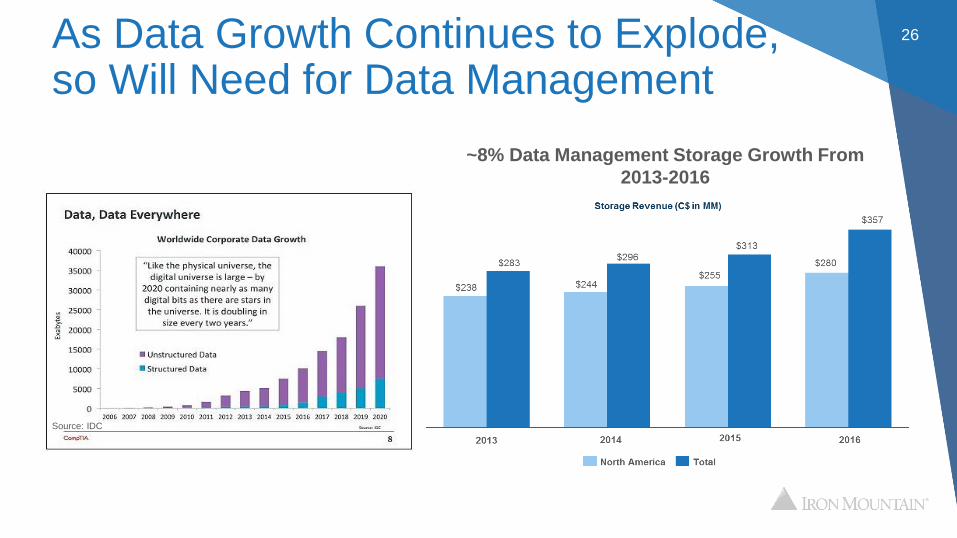
As Data Growth Continues to Explode, so Will Need for Data Management
26
Data is projected to
grow from 4.4ZB to
44ZB by 2020
Source: IDC
~8% Data Management Storage Growth From
2013-2016

Emerging
Markets: Delivering
Strong Growth
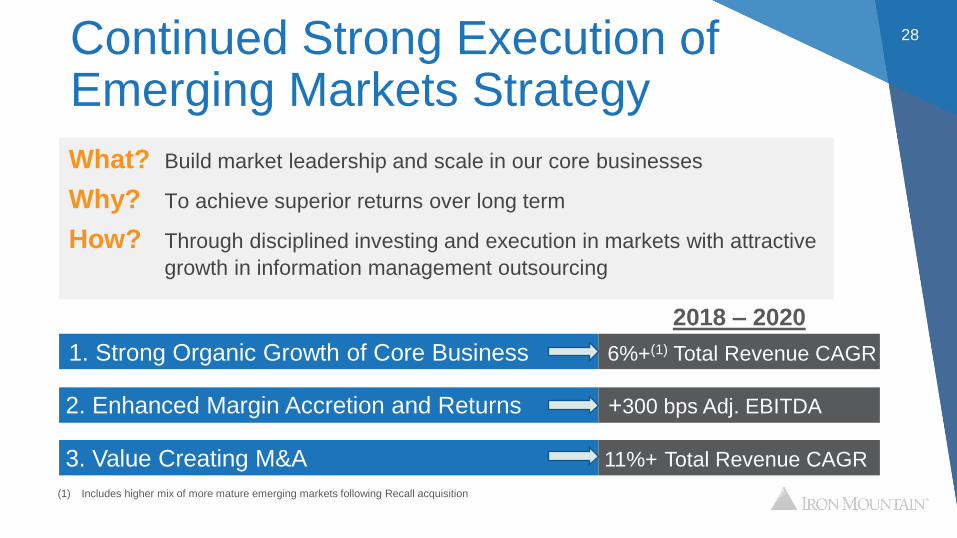
1. Strong Organic Growth of Core Business 6%+(1) Total Revenue CAGR
28Continued Strong Execution ofEmerging Markets Strategy
2. Enhanced Margin Accretion and Returns +300 bps Adj. EBITDA
What? Build market leadership and scale in our core businesses
Why? To achieve superior returns over long term
How? Through disciplined investing and execution in markets with attractive
growth in information management outsourcing
3. Value Creating M&A 11%+ Total Revenue CAGR
(1) Includes higher mix of more mature emerging markets following Recall acquisition
2018 – 2020
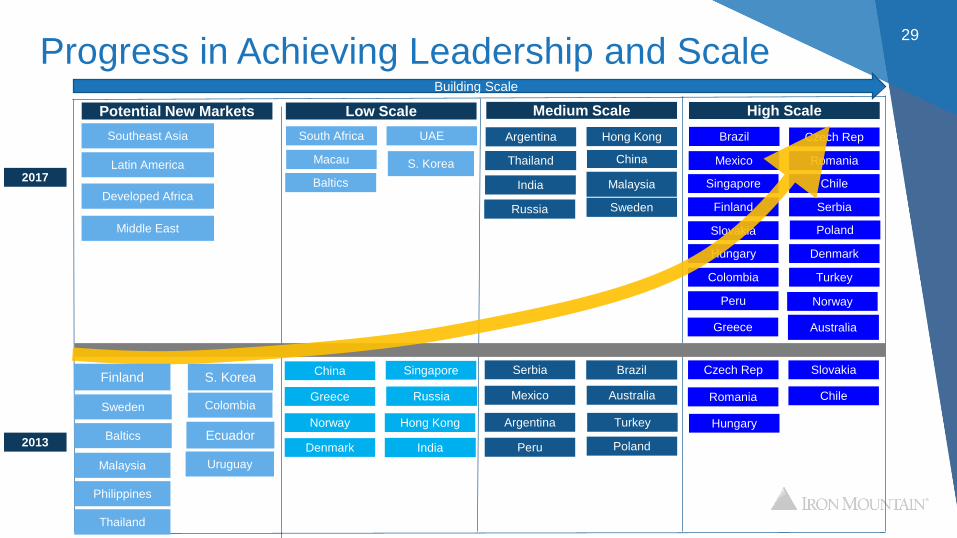
Progress in Achieving Leadership and Scale29
Potential New Markets
2013
2017
Romania
Slovakia
Hungary
Czech Rep
Chile
Poland
Mexico Australia
Peru
Turkey
China Singapore
ArgentinaHong Kong
BrazilSerbia
RussiaGreece
China
Finland
Hong Kong
Singapore
Argentina
Serbia
Colombia
Peru
Turkey
Romania
Slovakia
Hungary
Czech Rep
Chile
Brazil
MexicoMacau S. Korea
Building Scale
Baltics
UAE
Norway
Malaysia
Thailand
Sweden
Denmark
India
Denmark
Norway
Greece
South Africa
Australia
Russia
India
Low Scale Medium Scale High Scale
Poland
Developed Africa
Middle East
Southeast Asia
Sweden Colombia
Malaysia
Philippines
S. Korea
Uruguay
Thailand
EcuadorBaltics
Finland
Latin America

Disciplined Capital
Allocation and Long-
term Outlook
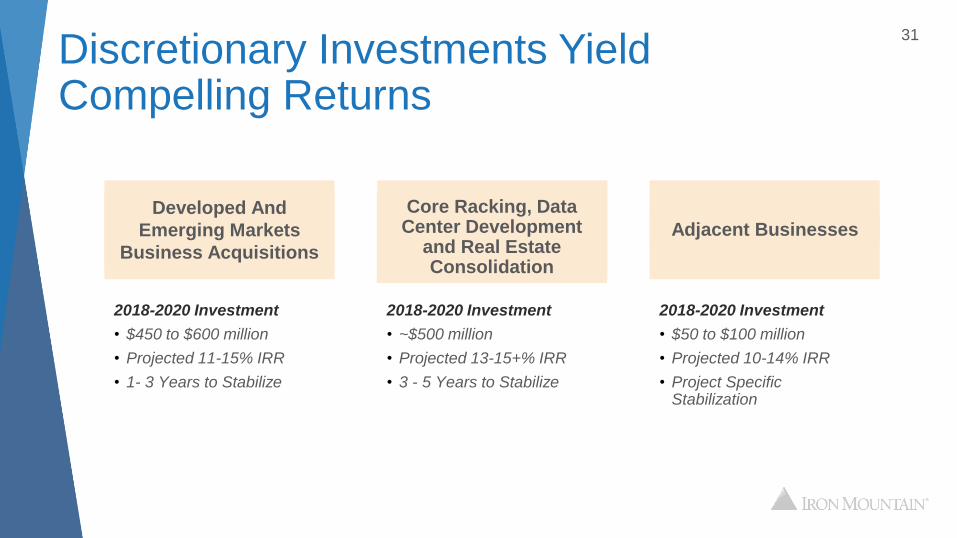
Developed And
Emerging Markets
Business Acquisitions
2018-2020 Investment
• $450 to $600 million
• Projected 11-15% IRR
• 1- 3 Years to Stabilize
2018-2020 Investment
• ~$500 million
• Projected 13-15+% IRR
• 3 - 5 Years to Stabilize
2018-2020 Investment
• $50 to $100 million
• Projected 10-14% IRR
• Project Specific Stabilization
Discretionary Investments Yield Compelling Returns
31
Core Racking, Data Center Development
and Real Estate Consolidation
Adjacent Businesses
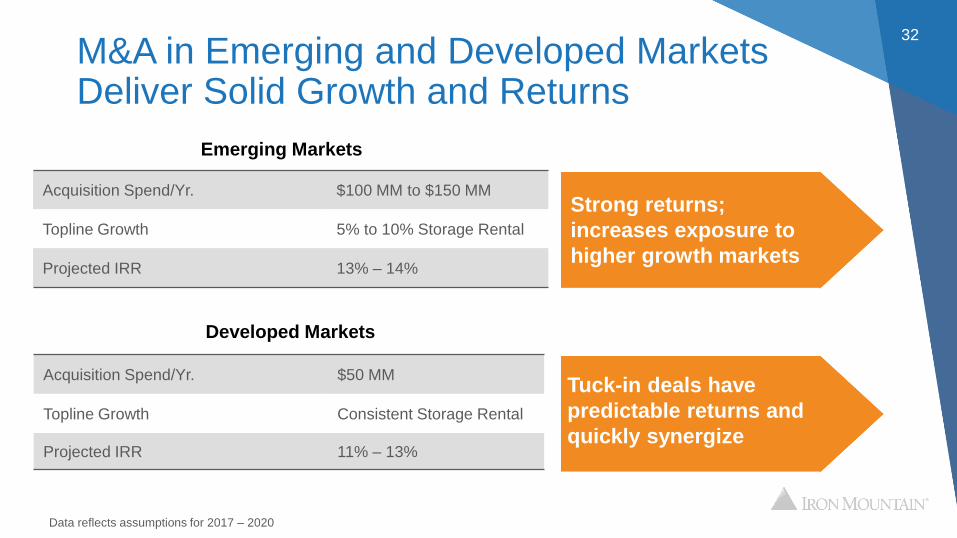
M&A in Emerging and Developed Markets Deliver Solid Growth and Returns
32
Acquisition Spend/Yr. $100 MM to $150 MM
Topline Growth 5% to 10% Storage Rental
Projected IRR 13% – 14%
Emerging Markets
Acquisition Spend/Yr. $50 MM
Topline Growth Consistent Storage Rental
Projected IRR 11% – 13%
Developed Markets
Tuck-in deals have
predictable returns and
quickly synergize
Data reflects assumptions for 2017 – 2020
Strong returns;
increases exposure to
higher growth markets
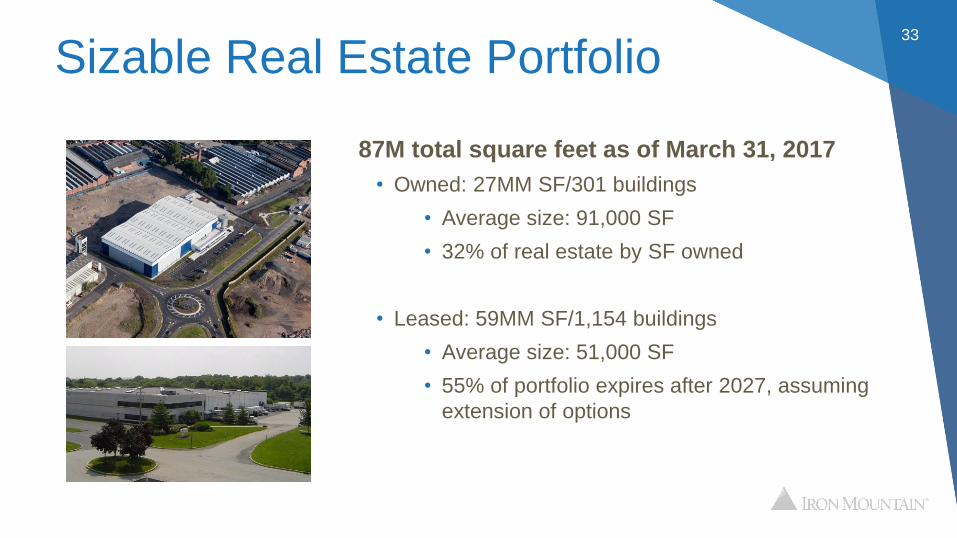
Sizable Real Estate Portfolio33
Storage
87M total square feet as of March 31, 2017
• Owned: 27MM SF/301 buildings
• Average size: 91,000 SF
• 32% of real estate by SF owned
• Leased: 59MM SF/1,154 buildings
• Average size: 51,000 SF
• 55% of portfolio expires after 2027, assuming
extension of options
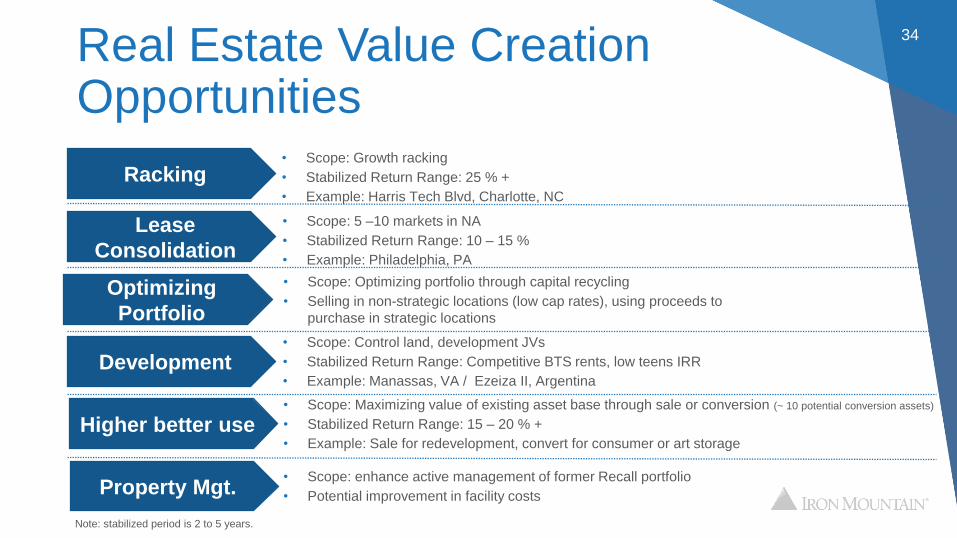
Real Estate Value Creation Opportunities
34
Lease
Consolidation
• Scope: 5 –10 markets in NA
• Stabilized Return Range: 10 – 15 %
• Example: Philadelphia, PA
Development• Scope: Control land, development JVs
• Stabilized Return Range: Competitive BTS rents, low teens IRR
• Example: Manassas, VA / Ezeiza II, Argentina
• Scope: enhance active management of former Recall portfolio
• Potential improvement in facility costsProperty Mgt.
Optimizing
Portfolio
• Scope: Optimizing portfolio through capital recycling
• Selling in non-strategic locations (low cap rates), using proceeds to
purchase in strategic locations
Higher better use• Scope: Maximizing value of existing asset base through sale or conversion (~ 10 potential conversion assets)
• Stabilized Return Range: 15 – 20 % +
• Example: Sale for redevelopment, convert for consumer or art storage
Racking• Scope: Growth racking
• Stabilized Return Range: 25 % +
• Example: Harris Tech Blvd, Charlotte, NC
Note: stabilized period is 2 to 5 years.
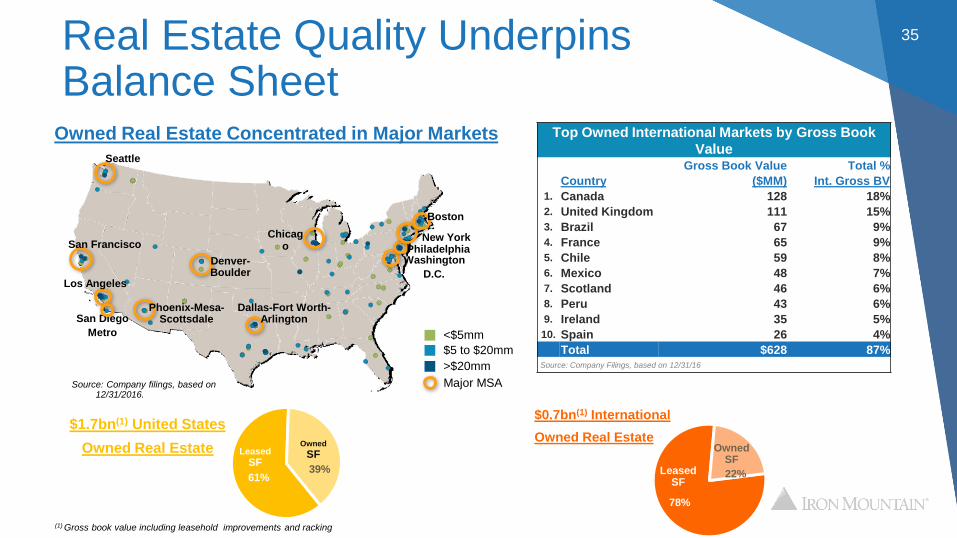
Real Estate Quality Underpins Balance Sheet
35
Owned Real Estate Concentrated in Major Markets
NY0086JT / 645841_1.wor
Denver-Boulder
San Francisco
Los Angeles
Phoenix-Mesa-Scottsdale
Dallas-Fort Worth-Arlington
Chicago
Washington
D.C.
Philadelphia
Boston
New York
Seattle
San Diego
Metro
Source: Company filings, based on 12/31/2016.
(1) Gross book value including leasehold improvements and racking
$5 to $20mm
>$20mm
<$5mm
Major MSA
61%39%
Owned
SFLeased
SF
$1.7bn(1) United States
Owned Real Estate
Top Owned International Markets by Gross Book
ValueGross Book Value Total %
Country ($MM) Int. Gross BV
1. Canada 128 18%
2. United Kingdom 111 15%
3. Brazil 67 9%
4. France 65 9%
5. Chile 59 8%
6. Mexico 48 7%
7. Scotland 46 6%
8. Peru 43 6%
9. Ireland 35 5%
10. Spain 26 4%
Total $628 87%Source: Company Filings, based on 12/31/16
78%
22%
Owned SF
Leased SF
$0.7bn(1) International
Owned Real Estate
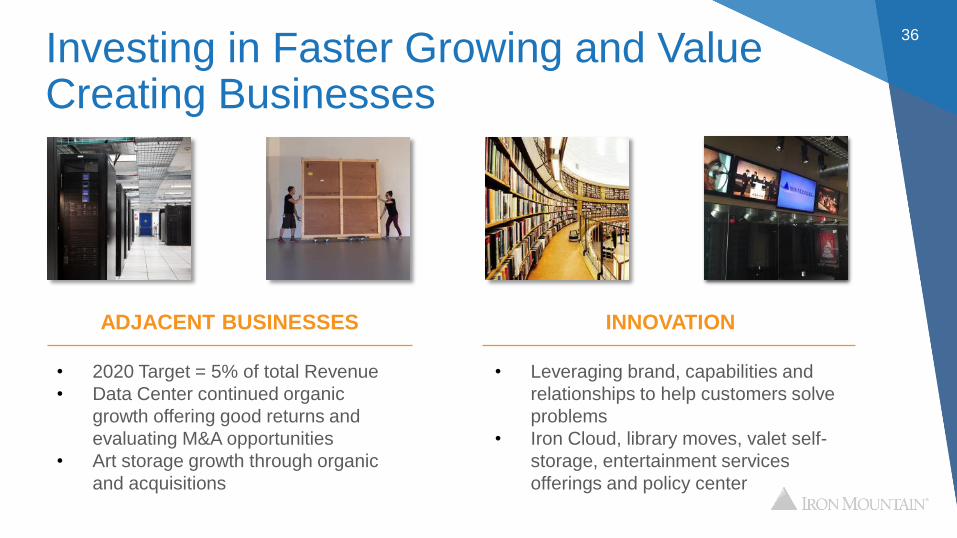
Investing in Faster Growing and Value Creating Businesses
36
ADJACENT BUSINESSES INNOVATION
• 2020 Target = 5% of total Revenue
• Data Center continued organic
growth offering good returns and
evaluating M&A opportunities
• Art storage growth through organic
and acquisitions
• Leveraging brand, capabilities and
relationships to help customers solve
problems
• Iron Cloud, library moves, valet self-
storage, entertainment services
offerings and policy center
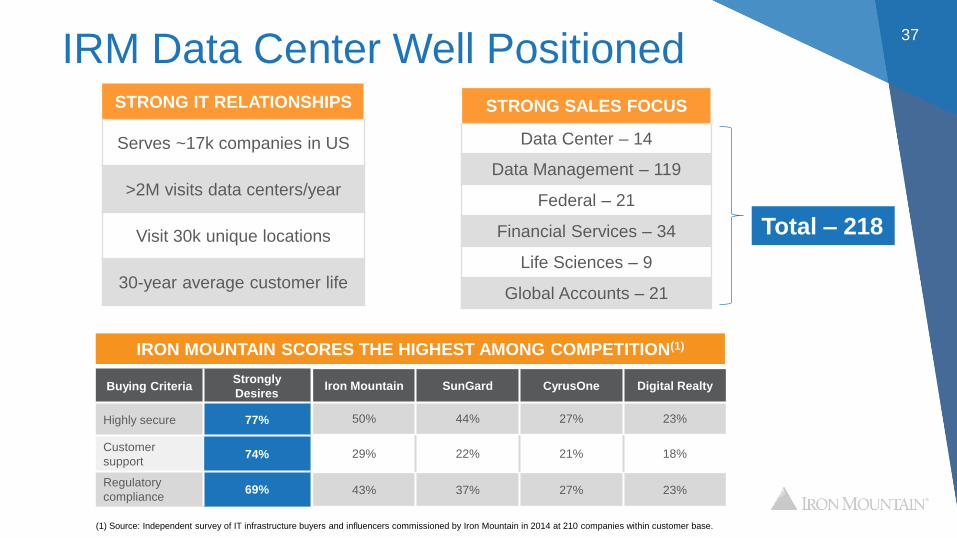
IRM Data Center Well Positioned37
STRONG IT RELATIONSHIPS
Serves ~17k companies in US
>2M visits data centers/year
Visit 30k unique locations
30-year average customer life
STRONG SALES FOCUS
Data Center – 14
Data Management – 119
Federal – 21
Financial Services – 34
Life Sciences – 9
Global Accounts – 21
Buying CriteriaStrongly
Desires
Highly secure 77%
Customer
support74%
Regulatory
compliance69%
Iron Mountain SunGard CyrusOne Digital Realty
50% 44% 27% 23%
29% 22% 21% 18%
43% 37% 27% 23%
IRON MOUNTAIN SCORES THE HIGHEST AMONG COMPETITION(1)
Total – 218
(1) Source: Independent survey of IT infrastructure buyers and influencers commissioned by Iron Mountain in 2014 at 210 companies within customer base.
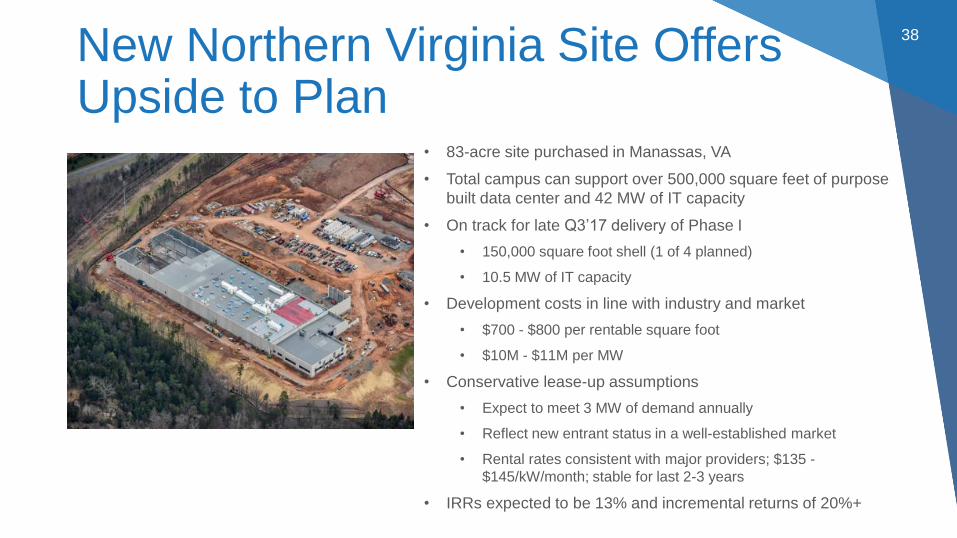
New Northern Virginia Site Offers Upside to Plan
38
• 83-acre site purchased in Manassas, VA
• Total campus can support over 500,000 square feet of purpose
built data center and 42 MW of IT capacity
• On track for late Q3’17 delivery of Phase I
• 150,000 square foot shell (1 of 4 planned)
• 10.5 MW of IT capacity
• Development costs in line with industry and market
• $700 - $800 per rentable square foot
• $10M - $11M per MW
• Conservative lease-up assumptions
• Expect to meet 3 MW of demand annually
• Reflect new entrant status in a well-established market
• Rental rates consistent with major providers; $135 -
$145/kW/month; stable for last 2-3 years
• IRRs expected to be 13% and incremental returns of 20%+
Multiple Financing Sources and Sound Balance Sheet
39
• Ample liquidity of ~$1 billion
• Sources include: • Growing operating cash flow from the business • Secured and unsecured borrowings• Capital recycling
• Debt structure: 73% fixed and 27% floating
• Average interest rate of 5.3% with 5-year average maturity
• Utilizing foreign-denominated debt to create natural hedge
• Lease adjusted leverage ratio of 5.8x projected to be ~5.0x by 2020
• Funding for opportunistic investments beyond plan could include:• Potential ATM program or other equity• Co-investment• Portfolio realignment
Note: Data as of 03/31/2017
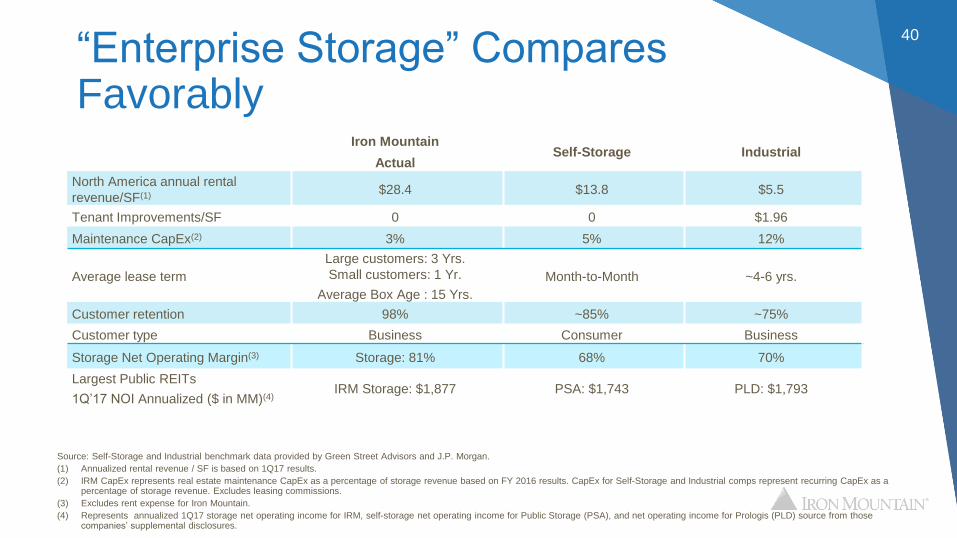
“Enterprise Storage” Compares Favorably
40
Iron Mountain
ActualSelf-Storage Industrial
North America annual rental
revenue/SF(1)$28.4 $13.8 $5.5
Tenant Improvements/SF 0 0 $1.96
Maintenance CapEx(2) 3% 5% 12%
Average lease term
Large customers: 3 Yrs.
Small customers: 1 Yr.
Average Box Age : 15 Yrs.
Month-to-Month ~4-6 yrs.
Customer retention 98% ~85% ~75%
Customer type Business Consumer Business
Storage Net Operating Margin(3) Storage: 81% 68% 70%
Largest Public REITs
1Q’17 NOI Annualized ($ in MM)(4)IRM Storage: $1,877 PSA: $1,743 PLD: $1,793
Source: Self-Storage and Industrial benchmark data provided by Green Street Advisors and J.P. Morgan.
(1) Annualized rental revenue / SF is based on 1Q17 results.
(2) IRM CapEx represents real estate maintenance CapEx as a percentage of storage revenue based on FY 2016 results. CapEx for Self-Storage and Industrial comps represent recurring CapEx as a percentage of storage revenue. Excludes leasing commissions.
(3) Excludes rent expense for Iron Mountain.
(4) Represents annualized 1Q17 storage net operating income for IRM, self-storage net operating income for Public Storage (PSA), and net operating income for Prologis (PLD) source from those companies’ supplemental disclosures.
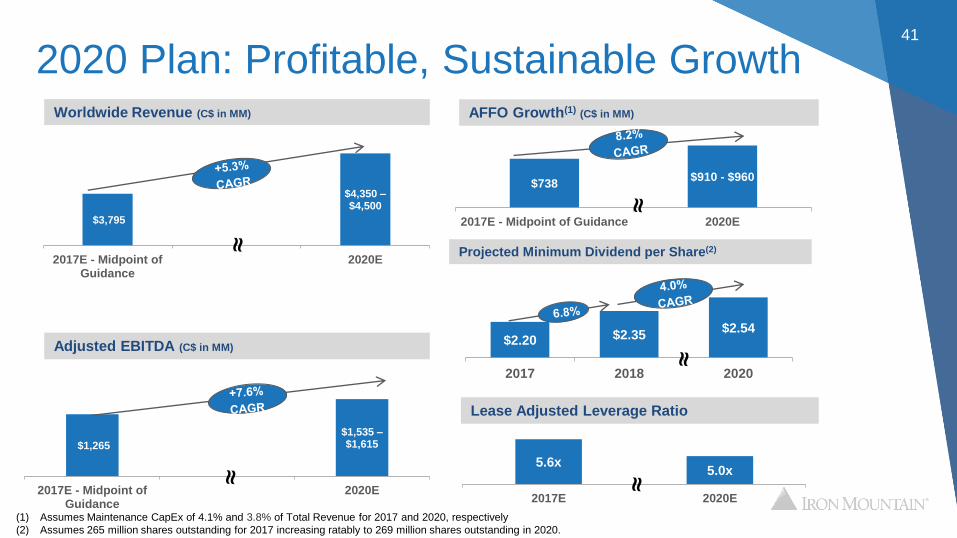
2020 Plan: Profitable, Sustainable Growth41
(1) Assumes Maintenance CapEx of 4.1% and 3.8% of Total Revenue for 2017 and 2020, respectively
(2) Assumes 265 million shares outstanding for 2017 increasing ratably to 269 million shares outstanding in 2020.
Lease Adjusted Leverage Ratio
5.6x5.0x
2017E 2020E
$1,265
$1,535 –$1,615
2017E - Midpoint ofGuidance
2020E
$3,795
$4,350 –$4,500
2017E - Midpoint ofGuidance
2020E
Worldwide Revenue (C$ in MM)
Adjusted EBITDA (C$ in MM)$2.20 $2.35
$2.54
2017 2018 2020
Projected Minimum Dividend per Share(2)
$738$910 - $960
2017E - Midpoint of Guidance 2020E
AFFO Growth(1) (C$ in MM)
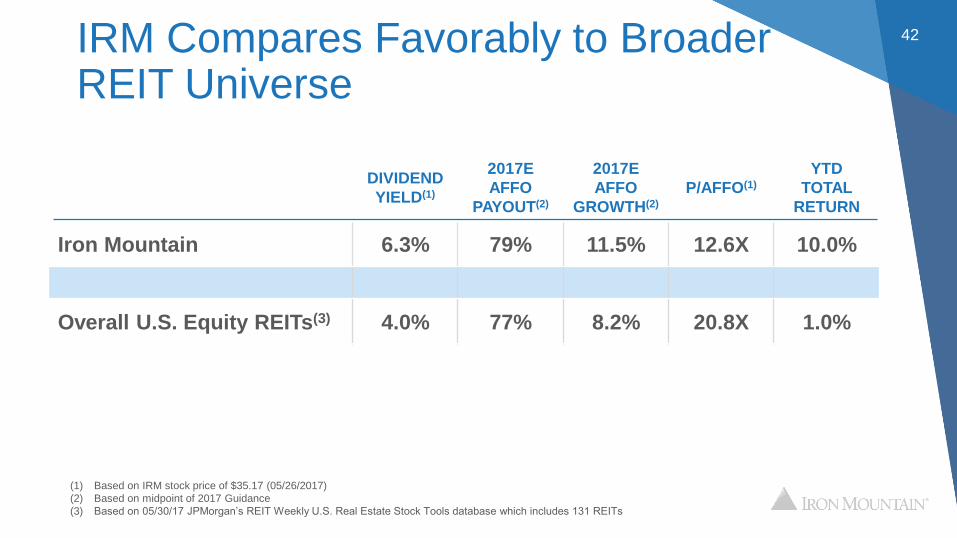
IRM Compares Favorably to Broader REIT Universe
42
DIVIDEND
YIELD(1)
2017E
AFFO
PAYOUT(2)
2017E
AFFO
GROWTH(2)
P/AFFO(1)
YTD
TOTAL
RETURN
Iron Mountain 6.3% 79% 11.5% 12.6X 10.0%
Overall U.S. Equity REITs(3) 4.0% 77% 8.2% 20.8X 1.0%
(1) Based on IRM stock price of $35.17 (05/26/2017)
(2) Based on midpoint of 2017 Guidance
(3) Based on 05/30/17 JPMorgan’s REIT Weekly U.S. Real Estate Stock Tools database which includes 131 REITs
Key Takeaways 43
Durable records management growth: internal and acquisitions
High return investments enhance shareholder returns
Strong cash flow generation with increasing margins
Adjacent Businesses provide upside potential
Strategic plan drives sustainable dividend growth and future investments
Attractive valuation with superior business fundamentals
Appendix: Q1 2017Financial Results
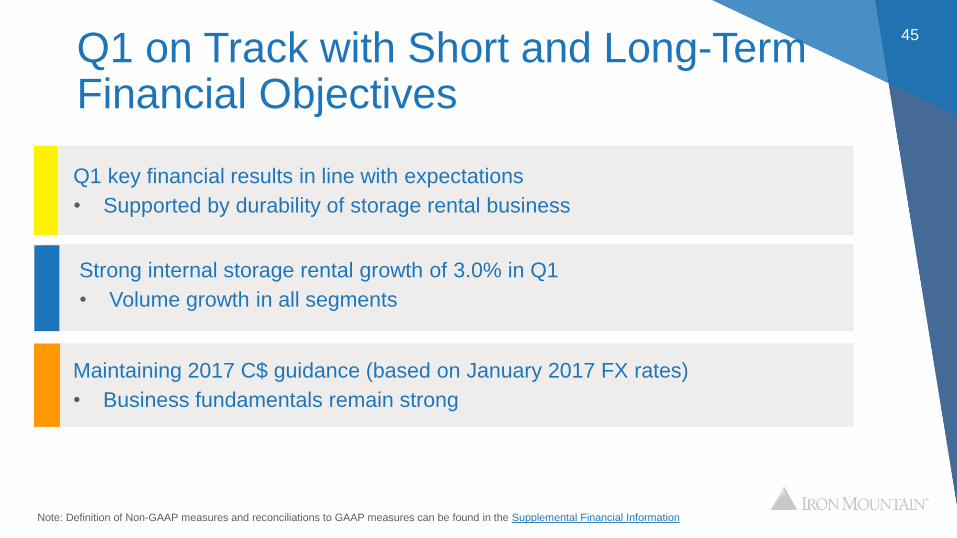
Q1 on Track with Short and Long-Term Financial Objectives
45
Q1 key financial results in line with expectations
• Supported by durability of storage rental business
Maintaining 2017 C$ guidance (based on January 2017 FX rates)
• Business fundamentals remain strong
Strong internal storage rental growth of 3.0% in Q1
• Volume growth in all segments
Note: Definition of Non-GAAP measures and reconciliations to GAAP measures can be found in the Supplemental Financial Information
46
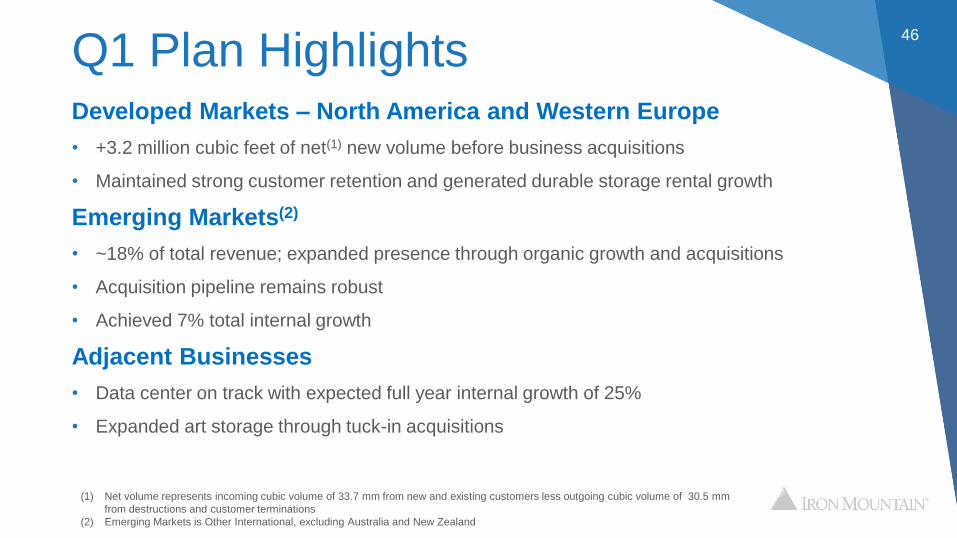
Q1 Plan HighlightsDeveloped Markets – North America and Western Europe
• +3.2 million cubic feet of net(1) new volume before business acquisitions
• Maintained strong customer retention and generated durable storage rental growth
Emerging Markets(2)
• ~18% of total revenue; expanded presence through organic growth and acquisitions
• Acquisition pipeline remains robust
• Achieved 7% total internal growth
Adjacent Businesses
• Data center on track with expected full year internal growth of 25%
• Expanded art storage through tuck-in acquisitions
(1) Net volume represents incoming cubic volume of 33.7 mm from new and existing customers less outgoing cubic volume of 30.5 mm
from destructions and customer terminations
(2) Emerging Markets is Other International, excluding Australia and New Zealand
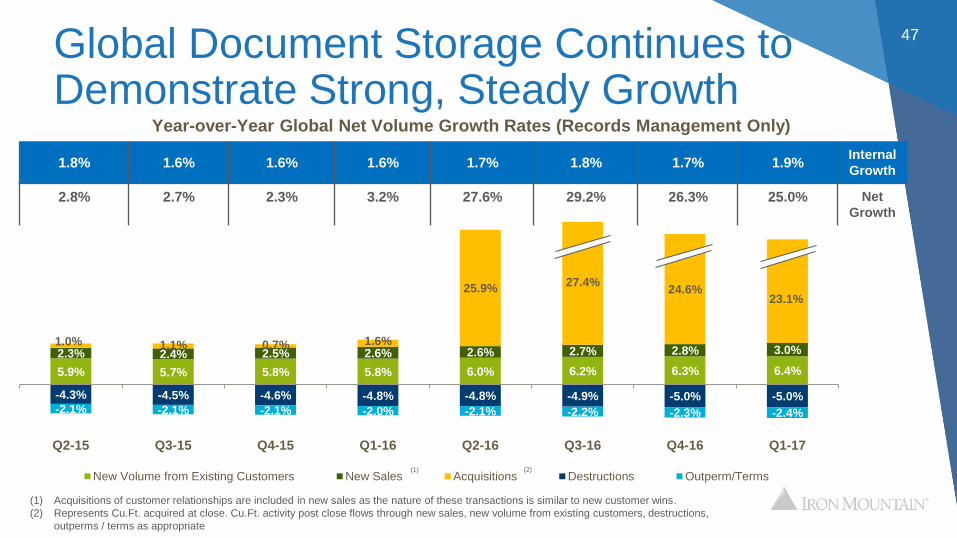
5.9% 5.7% 5.8% 5.8% 6.0% 6.2% 6.3% 6.4%
2.3% 2.4% 2.5% 2.6% 2.6% 2.7% 2.8% 3.0%1.0% 1.1% 0.7% 1.6%
25.9%27.4%
24.6%23.1%
-4.3% -4.5% -4.6% -4.8% -4.8% -4.9% -5.0% -5.0%-2.1% -2.1% -2.1% -2.0% -2.1% -2.2% -2.3% -2.4%
Q2-15 Q3-15 Q4-15 Q1-16 Q2-16 Q3-16 Q4-16 Q1-17
New Volume from Existing Customers New Sales Acquisitions Destructions Outperm/Terms
Global Document Storage Continues to Demonstrate Strong, Steady Growth
47
Year-over-Year Global Net Volume Growth Rates (Records Management Only)
(1) Acquisitions of customer relationships are included in new sales as the nature of these transactions is similar to new customer wins.
(2) Represents Cu.Ft. acquired at close. Cu.Ft. activity post close flows through new sales, new volume from existing customers, destructions,
outperms / terms as appropriate
1.8% 1.6% 1.6% 1.6% 1.7% 1.8% 1.7% 1.9%Internal
Growth
2.8% 2.7% 2.3% 3.2% 27.6% 29.2% 26.3% 25.0% Net
Growth
(1) (2)
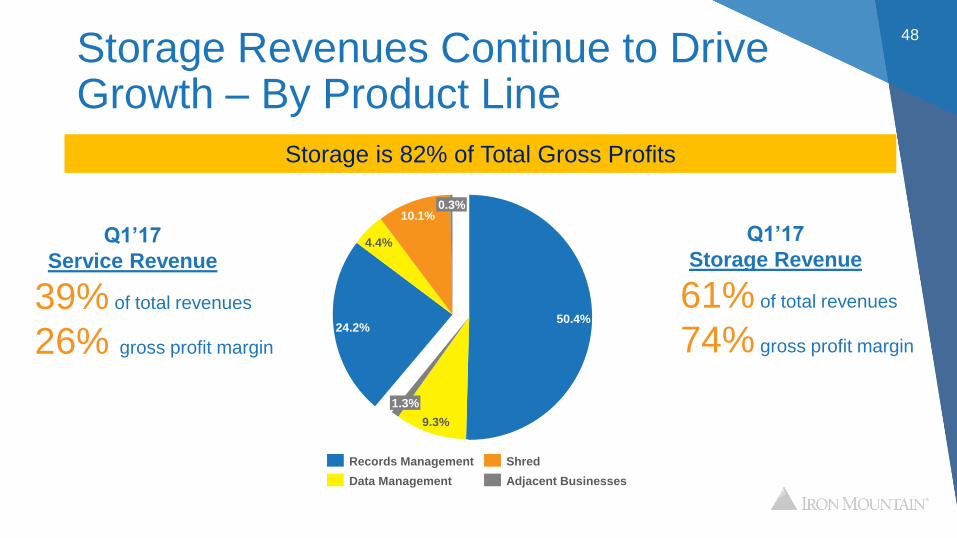
Storage Revenues Continue to Drive Growth – By Product Line
48
1.3%
9.3%
50.4%
0.3%10.1%
4.4%
24.2%
Adjacent Businesses
Shred
Data Management
Records Management
Storage is 82% of Total Gross Profits
Q1’17
Service Revenue
39% of total revenues
26% gross profit margin
Q1’17
Storage Revenue
61% of total revenues
74% gross profit margin
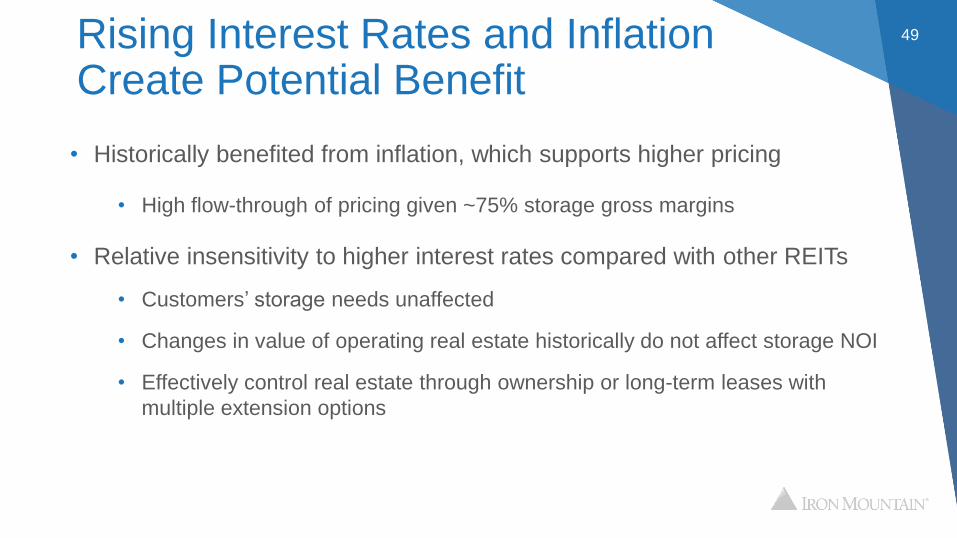
Rising Interest Rates and Inflation Create Potential Benefit
• Historically benefited from inflation, which supports higher pricing
• High flow-through of pricing given ~75% storage gross margins
• Relative insensitivity to higher interest rates compared with other REITs
• Customers’ storage needs unaffected
• Changes in value of operating real estate historically do not affect storage NOI
• Effectively control real estate through ownership or long-term leases with
multiple extension options
49
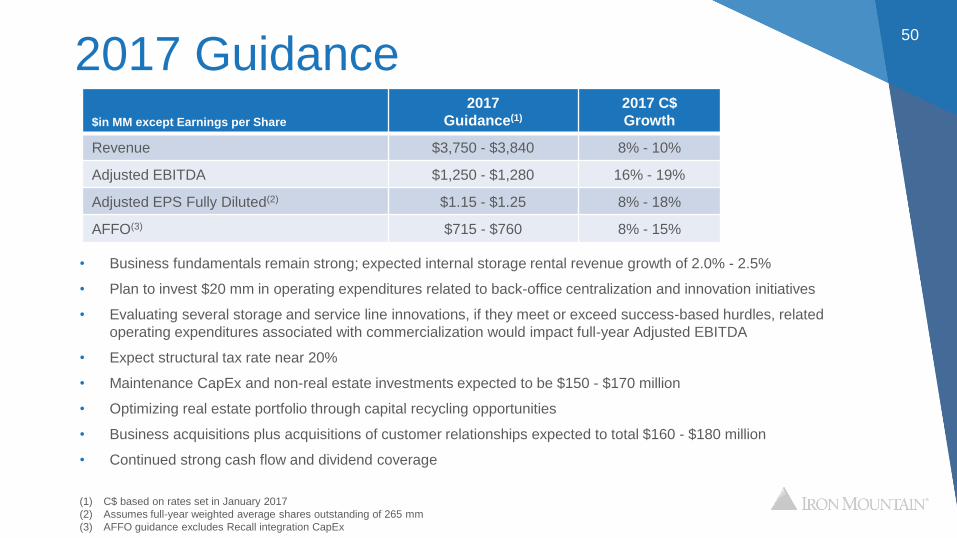
2017 Guidance50
• Business fundamentals remain strong; expected internal storage rental revenue growth of 2.0% - 2.5%
• Plan to invest $20 mm in operating expenditures related to back-office centralization and innovation initiatives
• Evaluating several storage and service line innovations, if they meet or exceed success-based hurdles, related
operating expenditures associated with commercialization would impact full-year Adjusted EBITDA
• Expect structural tax rate near 20%
• Maintenance CapEx and non-real estate investments expected to be $150 - $170 million
• Optimizing real estate portfolio through capital recycling opportunities
• Business acquisitions plus acquisitions of customer relationships expected to total $160 - $180 million
• Continued strong cash flow and dividend coverage
$in MM except Earnings per Share
2017
Guidance(1)
2017 C$
Growth
Revenue $3,750 - $3,840 8% - 10%
Adjusted EBITDA $1,250 - $1,280 16% - 19%
Adjusted EPS Fully Diluted(2) $1.15 - $1.25 8% - 18%
AFFO(3) $715 - $760 8% - 15%
(1) C$ based on rates set in January 2017
(2) Assumes full-year weighted average shares outstanding of 265 mm
(3) AFFO guidance excludes Recall integration CapEx

Increasing Cash Available for Dividends and Discretionary Investments
51
(1) Customer inducements and acquisitions of customer relationships are not deducted from AFFO as they represent discretionary growth investment
(2) Includes core growth racking and excludes Northern Virginia Data Center development under capital lease
Note: Iron Mountain does not provide a reconciliation of non-GAAP measures that it discusses as part of its annual guidance or long term outlook
because certain significant information required for such reconciliation is not available without unreasonable efforts or at all, including, most notably, the
impact of exchange rates on Iron Mountain’s transactions, loss or gain related to the disposition of real estate and other income or expense. Without this
information, Iron Mountain does not believe that a reconciliation would be meaningful.
$ in MM
2017E
Midpoint of
Guidance
Adjusted EBITDA 1,265$
Non-cash stock compensation / other (including non-cash permanent withdrawal fees) 50
Adjusted EBITDA plus non-cash expenses 1,315$
Less: Cash interest and normalized cash taxes 415
Total maintenance CapEx and non-real estate investment 160
Customer inducements and acquisition of customer relationships (1)35
Cash available for dividends and investments 705$
Expected common dividend (based on record date) 583
Cash available for core and discretionary investments 122$
Less discretionary investments:
Acquisitions 150
Growth real estate, data center and innovation(2)185
Incremental capital needed to fund discretionary investments (213)$
Top Related