


Languages
Pages
Legal


Copyright 2009, International Petroleum Technology Conference
This paper was prepared for presentation at the International Petroleum Technology Conference held in Doha, Qatar, 7–9 December 2009.
This paper was selected for presentation by an IPTC Programme Committee following review of information contained in an abstract submitted by the author(s). Contents of the paper, as presented, have not been reviewed by the International Petroleum Technology Conference and are subject to correction by the author(s). The material, as presented, does not necessarily reflect any position of the International Petroleum Technology Conference, its officers, or members. Papers presented at IPTC are subject to publication review by Sponsor Society Committees of IPTC. Electronic reproduction, distribution, or storage of any part of this paper for commercial purposes without the written consent of the International Petroleum Technology Conference is prohibited. Permission to reproduce in print is restricted to an abstract of not more than 300 words; illustrations may not be copied. The abstract must contain conspicuous acknowledgment of where and by whom the paper was presented. Write Librarian, IPTC, P.O. Box 833836, Richardson, TX 75083-3836, U.S.A., fax +1-972-952-9435.
Abstract
This paper presents a case study on the logistics and acquisition of a large, ultra high density and full wide azimuth 3D
seismic survey across the Dukhan field for Qatar Petroleum (QP), Figure 1. This survey represents a step change in seismic
data acquisition providing greatly enhanced data quality by full wide azimuth and very dense spatial sampling complemented
by good quality uphole and simultaneous 3D Vertical Seismic Profile (VSP) recording. It is expected that this survey will set
an industry standard for seismic acquisition leading to improved field redevelopment. While the 3D seismic data can always
be re-processed in the future, it is possible that future re-acquisition of the entire Dukhan field area may be difficult or
impossible to justify. Therefore one of the key driving principles behind the survey design was to ensure that QP did not
under specify the source and receiver effort so that it represented a “no regrets” case for the future.
There are several key operational elements to this survey, the complexity of terrains which vary from sand, rock and sabkha
to marine transition, busy infrastructure both residential and industrial i.e. townships, QP‟s oilfield installations and third-
party quarries and factories. All of these operational elements must be managed successfully to achieve QP‟s technical
objectives for high quality seismic data.
Introduction
The Dukhan field is a major oil field in Qatar discovered in 1939; it contains more than 750 wells producing from 4 major
reservoirs. It has a complex history of production & development strategies, starting with natural pressure depletion for more
than 20 years, followed by power water injection since 1989 and gas cap cycling since 1998. As with other large mature
Middle East oil fields, Dukhan has also witnessed significant changes in technology over the last 60 years. In order to
maximize the long term economic recovery from the field, QP is committed to applying leading edge but fit-for-purpose
technologies. New, state of the art, 3D seismic data providing updated reservoir models will enable QP to continue the
development of Dukhan field for many years to come.
Survey Planning
Justification for New Seismic
Though the existing seismic data was able to provide gross structural information for reservoir mapping and well planning, it
was failing to provide the vertical and spatial resolution and quantitative attributes needed for enhanced reservoir
characterization due to reduced frequency content, noise contamination, low fold and limited spatial coverage.
Advancements in the seismic industry led QP to believe that a new very high density, full wide azimuth 3D seismic would
provide superior data quality that could meet QP‟s quantitative interpretation needs. To test this belief, QP acquired high
resolution VSP data in two wells in 2003. The results proved that seismic data with frequencies greater than 100 Hz could be
obtained from VSPs in the Dukhan field. In 2006, QP tested whether or not the same high fidelity signal could be achieved
in surface seismic in a small pilot 3D land survey (~50 sq km). The results of the pilot survey displayed significantly better
IPTC-13616-PP
Dukhan 3D: An Ultra High Density, Full Wide Azimuth Seismic Survey for the Future Salva R Seeni, Qatar Petroleum; Scott Robinson, Qatar Petroleum; Michel Denis, CGGVeritas; Patrick Sauzedde, CGGVeritas

2 IPTC-13616-PP
imaging and higher frequency content (up to 100 Hz) than the previous 3D surveys, clearly demonstrating the benefits of a
new 3D seismic for Dukhan field. The pilot 3D survey also provided valuable information on logistics and operational issues
in managing the considerable surface infrastructure of the oilfield.
New 3D Seismic Survey Scope
The scope of the new 3D seismic acquisition project expanded on previous work by extending the acquisition boundaries so
that the entire field area would be properly imaged with full migration aperture. Additionally, other data types are acquired
to enhance the processing sequence and allow for detailed and robust reservoir calibration. Included in the scope are
acquisition and processing of approximately 860 sq km of land (including sabkha) and transition zone (shallow sea), 130 land
uphole velocity surveys and 8-9 simultaneous 3D VSPs, see Figure 2.
New 3D Geophysical Objectives
The expectation is a 3D seismic data of sufficient quality (high signal-to-noise ratio and better vertical resolution ~100 Hz or
more) that allows:
Enhanced fault imaging (down to 5m to locate bypassed oil associated with faulting),
Quantitative reservoir characterization (to control the distribution of reservoir properties away from wells by means
of seismic attributes),
Fracture identification (to delineate areas of enhanced productivity especially in tighter intervals),
Improved structural definition of deeper reservoirs
Survey Execution
HSE Aspects
During the planning stages pre-mobilization, a full HSE hazard identification and risk assessment was carried out
considering the various operational modes. Input was provided by both the contractor and QP safety organizations.
A crew HSE plan was prepared, together with a bridging document in accordance with international guidelines.
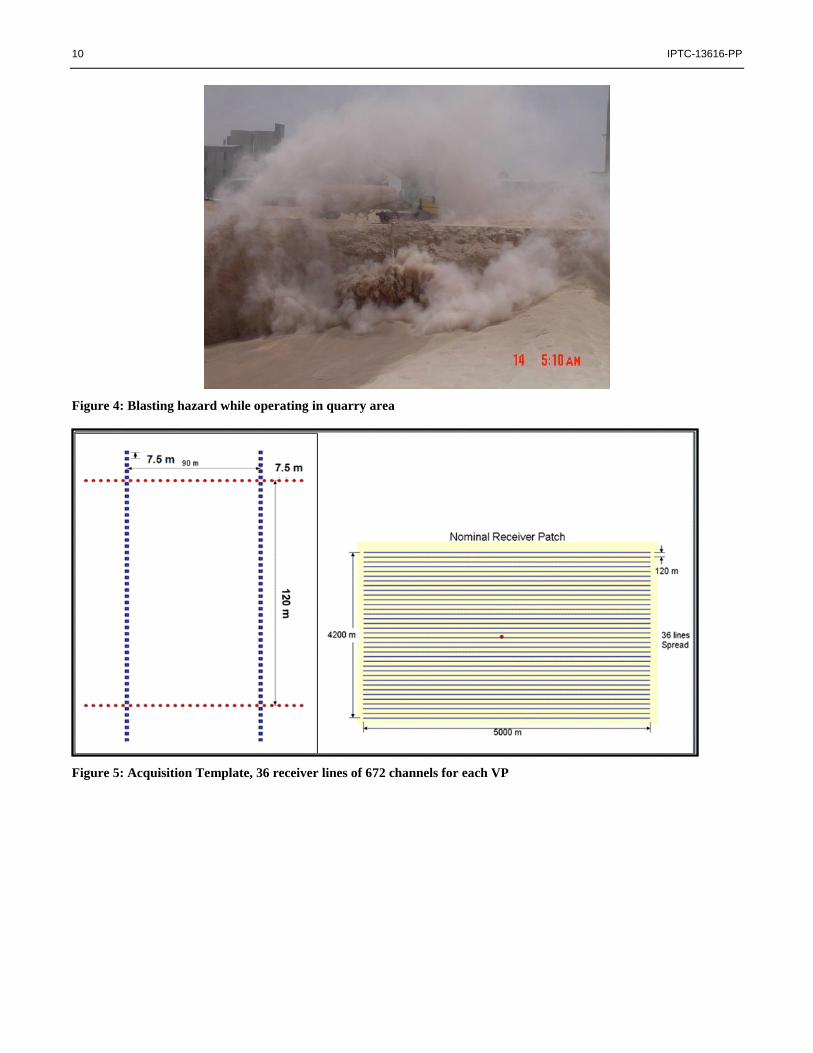
Hazards included transportation and road operations, toxic gas, cement factories (Figure 3), quarries (Figure 4) and
ordnance. Within the crew HSE management system, procedures were established, implemented and audited by QP.
To ensure safe operation, coordination with QP operations in Dukhan and external parties (e.g. police, military,
quarry operators, cement company, etc.) were planned well ahead and implemented.
To date the crew has achieved more than 1.75 million man-hours without LTI.
To reduce the exposure to road traffic, the operation was planned to be run from more than one base camp location.
Survey Design
The Dukhan Full-field 3D seismic survey is a complex and integrated project with unique design features including:
Point-source and Point-receiver acquisition
High density spatial sampling for noise de-aliasing in order to preserve high frequencies
Uniform, full wide azimuth coverage
25,000 live channels with 40,000 channels deployed on the ground
Recording and in-field processing ~3.5 terabytes of data per day
Processing capability of 700 terabytes of data through Pre Stack Time Migration (PSTM)
Different seismic sources types: vibrator, airgun and explosives
High productivity technique for vibroseis recording
Simultaneous 3D VSP recording using 100-level tool at 15 m spacing with full areal coverage
Comprehensive geophysical wireline logging program in all new wells drilled
Full areal coverage of Uphole surveys
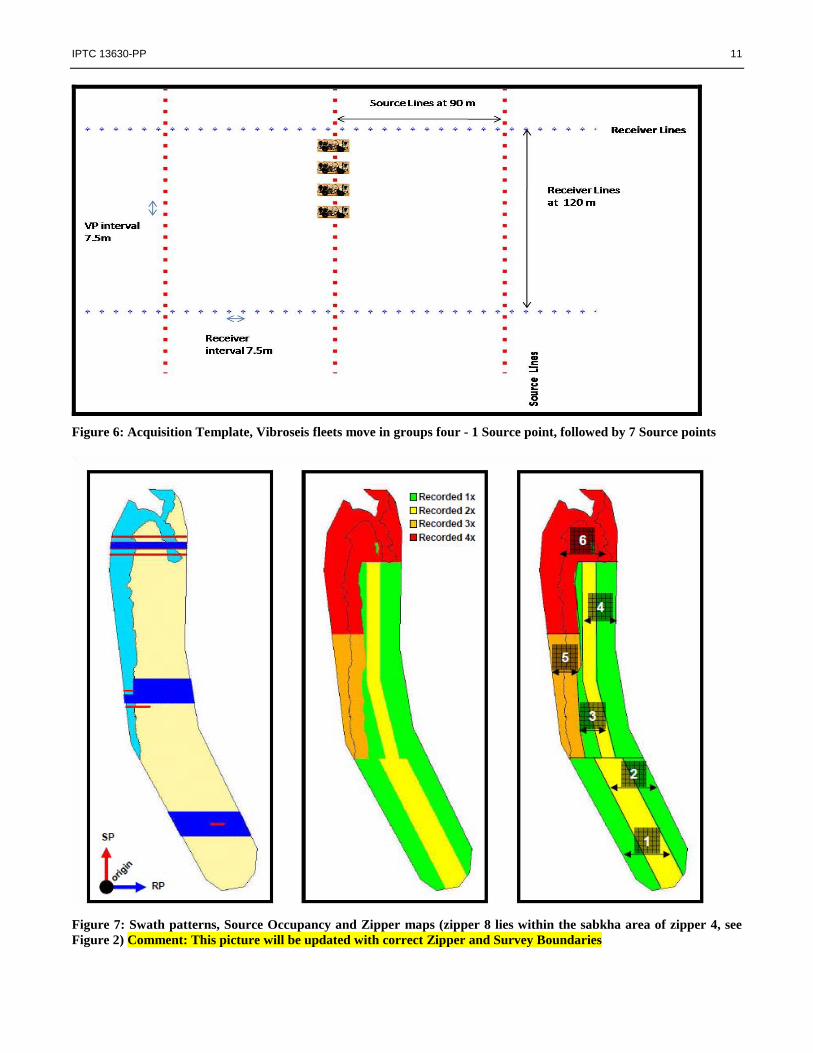
The spread consists of 36-lines with minimum 5 km receiver line length and 2 km cross-line offset. Source line interval is 90
m with a source point interval of 7.5 m along each line, yielding a source density of 1480 source locations per sq km.
Receiver line interval is 120 m with a receiver point interval of 7.5 m along each line. This high density design results in
nominal fold of 500 for a subsurface bin size of 3.75 x 3.75 m. See Figure 5 and 6 displaying the acquisition template. For
the vibrator portion of the acquisition the source points are referred to Vibration Points (VPs).
For operational logistical requirements, the survey area was divided into 8 acquisition areas [zippers] as illustrated in Figure

IPTC 13630-PP 3
7. This facilitated the most efficient deployment of the recording equipment, as it is not possible to span the full survey width
[up to 14km] with one set of equipment. To achieve full-fold coverage, it is required to significantly overlap either receiver
stations or source points. On most locations, for operational efficiency, it was elected to take re-occupy and acquire source
points in preference to re-laying receiver lines. For the complete project it is estimated that an additional 40% VPs and 15%
marine POPs will be taken to achieve the required overlap coverage. Therefore, some source points are occupied only once,
others to a maximum of 4 times. The source requirement for each zipper varies as:
Zipper 1, 2, 3, 4: Land - Vibrosies source
Zipper 5, 6, 7: Combined Land and Shallow Water – Vibroseis and Airgun Source
Zipper 8: Sabkha - Explosives Source
Receiver and Source Positioning
Receiver line is staked out with GPS geodetic dual frequency receivers using the real time kinematic method. With this
method, staking out and surveying are realized simultaneously. Staking out is driven at +/-0.5m tolerance from pre-planned
position, and the accuracy of the surveyed position is achieved to a centimeter level.
Vibroseis source point positioning uses real-time vibrator navigation. This enables a “stakeless” survey of VPs. Source Lines
are scouted to pre-plan offsets and detours due to obstructions, and the vibrator driver navigates to the required position using
an on-screen real-time display.
Integrated quality control systems are in place. The real time position of the center of gravity of each vibrator pattern is
computed, transmitted and is continuously compared with the planned position, in the recording truck. Variances are
immediately identified and the VP may be re-acquired if it is outside positioning specification.
These advanced and efficient survey techniques minimize the number of markers on the ground and minimize the number of
survey field crews. This reduces cost and decreases HSE exposure.
Vibroseis Acquisition
A great challenge in executing this survey was to ensure that the maximum possible numbers of receiver stations were
located as planned, and that the maximum number of source positions were located on, or as close as possible to the actual
survey design position. The significance of this challenge was to ensure consistent uniform coverage in the face of large
scale surface infrastructure development that exists over much of the survey area.
Previous 3D surveys of the Dukhan field had been characterized by significant data gaps due to insufficient source coverage
for oilfield and industry infrastructure as well avoidance of sabkha and marine areas. In the present survey, the crew was
mandated to acquire every possible source point within defined safety limits, including those within hydrocarbon plants and
within industrial premises.
Of the 660 sq km of vibrator area, more than 99% of the pre-plot VP locations have been occupied at least once. Careful
planning achieved 90% nominal fold coverage with good azimuthal distribution even through areas of active surface
production facilities, Figure 8 displays how coverage was successfully maintained across an area with quarries and cement
factories.
Vibroseis Source
The crew operates 24-hrs High Fidelity Vibratory Seismic [HFVS] high productivity system with 3 fleets of 4 vibrators. The
vibrators have 62,000 lb force capability, mounted on an all-terrain buggy chassis.
The HFVS method enables 4 vibrators in a group to simultaneously acquire 4 independent VPs. This is technology
innovation, affords significant acquisition efficiency benefits. The method requires vertical stack, where the stack order must
be at least equal to the number of vibrators. It is versatile and does not require the vibrators to be adjacent and does not
require the full complement of 4 units. The source separation relies on sweep phase rotations.
The acquisition sequence is to deploy each group of 4 vibrators on separate source lines. The 4 vibrators of the group are
spaced 2 source points apart. On completion of the vibrator point recording the vibrators are moved forwards alternately one
point and 8 points to provide seamless coverage. Each source point is vibrated with 4 eight second sweeps.
With 3 groups of vibrators available it is possible to deploy one group in challenging congested areas, where progress is slow
and the remaining two groups in open terrain to ensure consistently high daily production. Furthermore, the flexibility of the
HFVS system allows separation of the vibrators within a fleet, which enabled efficient acquisition of isolated points within
obstructed areas.
Integrated Quality Control systems provide vibrator performance data in real-time to the recording truck, together with the

4 IPTC-13616-PP
positioning accuracy data. This is QC-analyzed on crew timely to ensure that any points with performance out of
specification may be re-acquired into the correct receiver template.
Though the vibrator design enables access to all of the challenging terrains at Dukhan, they are also maneuverable allowing
access within residential and industrial areas. This access is critical to maintaining uniform coverage. Figure 9 displays
vibrator activity in a cement plant and Figure 10 displays vibrator activity inside a gas plant.
Shallow Water and Transition Zone Acquisition
The 160 sq km of shallow water and transition zone acquisition is planned to commence in December 2009. Because of
shallow water hazards, shallow draught vessels that can acquire seismic in 1-meter water depths will be employed. The
source will be low 500 cubic inch airgun arrays, with smaller gun arrays deployed in the shallow areas. Hydrophones will be
used, together with marsh-geophones in the transition zone.
This acquisition will take place concurrently with vibroseis acquisition in the same „zipper” on the adjacent land area. The
duration of this phase of the project is estimated at 16 months.
Operational challenges include protection of marine mammals and reefs and sea-grass plains, and navigating very shallow
bays to acquire the maximum seismic coverage.
Sabkha Acquisition
As the sabkha surface conditions will not support the weight of vibrators it is planned to utilize explosives as a source.
Parameter testing will be executed in Q4 2009 to determine optimal hole depth and explosives charge size. It is logistically
important to test well ahead of acquisition so as to clearly define what materials are needed; this is because explosive
purchase and use must be coordinated with Government agencies and private suppliers which can be a time consuming
process. Holes will be pre-drilled and maintained with plastic casing allowing for this phase to be done ahead of blasting.
Charges will only be loaded on the day they will be detonated [no pre-loading].
The crew will operate up to 5 shooting crews at the same time, working daylight hours only.
This phase will be the final stage of the project, in “zipper 8” following the shallow water acquisition and is scheduled in Q1
2011.
Recording System and Ground Equipment
The land receiver stations each consist of one single geophone per station. The geophones are fitted with spikes which are
drilled into rock where required, all planted phones are then covered with sand to reduce the impact of wind generated noise
Figure 11. Six front crew teams, each of 5 men layout the cables and “plant” the geophones.
The ground acquisition equipment connected to the recording unit consists of field Digitizing Unit (FDU) waterproof links
with 15m operating depth for both the land and the shallow water parts of the acquisition. This allows seamless transition
from land to shallow water. In hazardous areas, such as quarry cliffs, Figure 12, specially trained teams layout the cables
using safety-approved techniques which allow for a maximum number of receivers points while ensuring safe operating
conditions.
The crew is equipped with a high end 3D acquisition system, capable to record up to 40,000 channels at 2 milliseconds
sample rate. Data is recorded in a mobile recording truck that is in wireless communication to control the vibrators. Figure
13 and 14 display the recording truck, inside and out.
Data Management and Inversion
Due to the large flow of acquired data a NAS system with dual disk recording and Raid-1 mirror redundancy is used to record
the data in the seismic recorder. The disks are transferred to the QC/QA office at the base camp for data analysis and
validation. Back-Up of the data is maintained in the crew. The below chart illustrates the huge amount of data acquired,
Figure 15. For comparison, the numbers of traces recorded in one day on this project are more than the channels recorded in
some complete contemporary 3D surveys.
Data will then pass through the normal QC procedures and HFVS processing. Each vibroseis record comprises 4 sweeps and
4 “listening” periods for 4 vibrators in one acquired file where the phase of one vibrator per sweep is different than the rest,
Figure 16. This record file is convolved and HFVS–inverted into 4 individual vibrator point records. The inversion is carried
out in the in-field processing center.

IPTC 13630-PP 5
Parameter Testing
While the geophysical objectives dictated the main geometry parameters, which were defined before the contract tender
process, the vibroseis sweep parameters required to be tested at the start of operations. The explosives charge-size and depth
parameters were also tested. Source testing was designed to ensure the optimal energy levels required to meet QP‟s
objectives.
The suite of vibrator sweep parameter tests were conducted in two phases. The first phase of tests, conducted from March 7-
10, 2009 into a reduced 19-line 3D receiver template included the parameters identified in Figure 17.
Phase 2 Sweep testing followed processing and analysis of the Phase 1 tests. Two sweep parameters were selected to be
tested on a 2D line test with 2 drive levels:
Linear sweep: 4-120Hz, 8s sweep length
Tailored sweep: 6-120Hz, 8s sweep length, boost 0.05dB/Hz before correlation, see Figure 18 for a display of the
record frequency spectrum
First run @ 70% and second run @ 80% drive level.
Additionally tests included the effects of major noise sources, including the cement factory, quarries, bulldozers and
rigs drilling.
The complete acquisition parameters are detailed in Figure 19.
In-Field QC and Processing
A major challenge to be met for seismic processing was data management of handling a massive 3.5 terabytes of data per
day, through HFVS processing and all QC requirements. To ensure the integrity of the massive amount of data, an in-field
processing center was set-up on crew. The processing workflows are shown in Figure 20, where source and receiver
locations are defined, and Figure 21, where the path of the recorded data to digital array forming is defined.
Quality control is a constant and integral component of the processing sequence where a feed-back loop is maintained to
allow for multiple iterations if required to ensure data quality meets specifications, Figure 22. The quality control workflow
is shown in Figure 23 where all QC components are defined: attributes, geometry, crossing and selection. By having well
defined processes and procedures it is possible to have steady and consistent productivity while maintaining required quality
levels even in the face of regular crew changes.
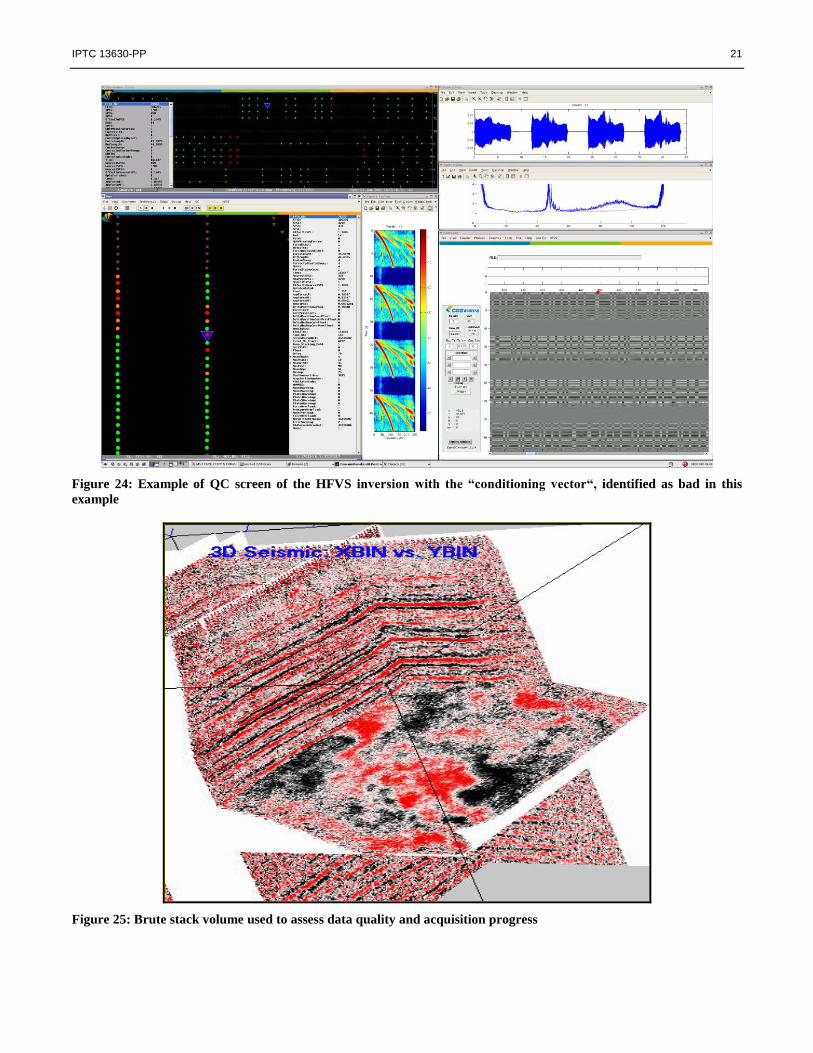
One of the key in-field processing steps is the implementation of the separation of the HFVSdata set, with the recorded
ground force for each vibrator and each sweep. Once the forces have been checked, the inversion of the mother record is
performed and the quality of the inversion is based on a QC attribute called the “conditioning vector”. Should this vector be
out of specification, the source points are flagged to be re-acquired. The distortion effect is analyzed at that stage and is
quantified with the results of the HFVS inversion, Figure 24.
Within the In-field Processing system the data is progressively processed and stacked in order to build a field “brute stack”
for data QC purpose. Source and signal attributes maps are generated on a daily basis, and become a useful visual measure of
data quality and acquisition progress, though there is nothing like a brute stack to allow a 3D investigation of the data, see
Figure 25.
Uphole Acquisition
Uphole data are crucial to defining the velocity profile of the weathered zone, and as this zone is highly variable it is
advisable to have good lateral sampling of the survey area. Previous seismic surveys collected uphole velocity surveys
however these surveys were located primarily along the central axis of the field (see Figure 26Error! Reference source not
found., new uphole locations in red). Some other uphole data existed on the flanks of the field but was unfortunately to
shallow to identify the base of the weathering layer.
The objective of the extensive uphole survey is to provide maximum near-surface velocity control. These velocities
will be required and used in the refraction statics sequence of the data processing.
A total of 130 uphole velocity surveys are planned within the Dukhan 3D project area. These survey locations have
been based upon modeling of the near-surface velocity layers, from previous work.
Upholes have been planned both on the vibroseis areas and on the sabkha zones, although those on sabkha may be
shallower.
The target drill depths are normally to 100 meters or as predicted by the modeling and site elevation, see Figure 27
for an example of an uphole well being drilled.
6 IPTC-13616-PP
To facilitate drilling the upper section of the wells were air drilled,Error! Reference source not found. and the
lower portions were drilling with water based mud.
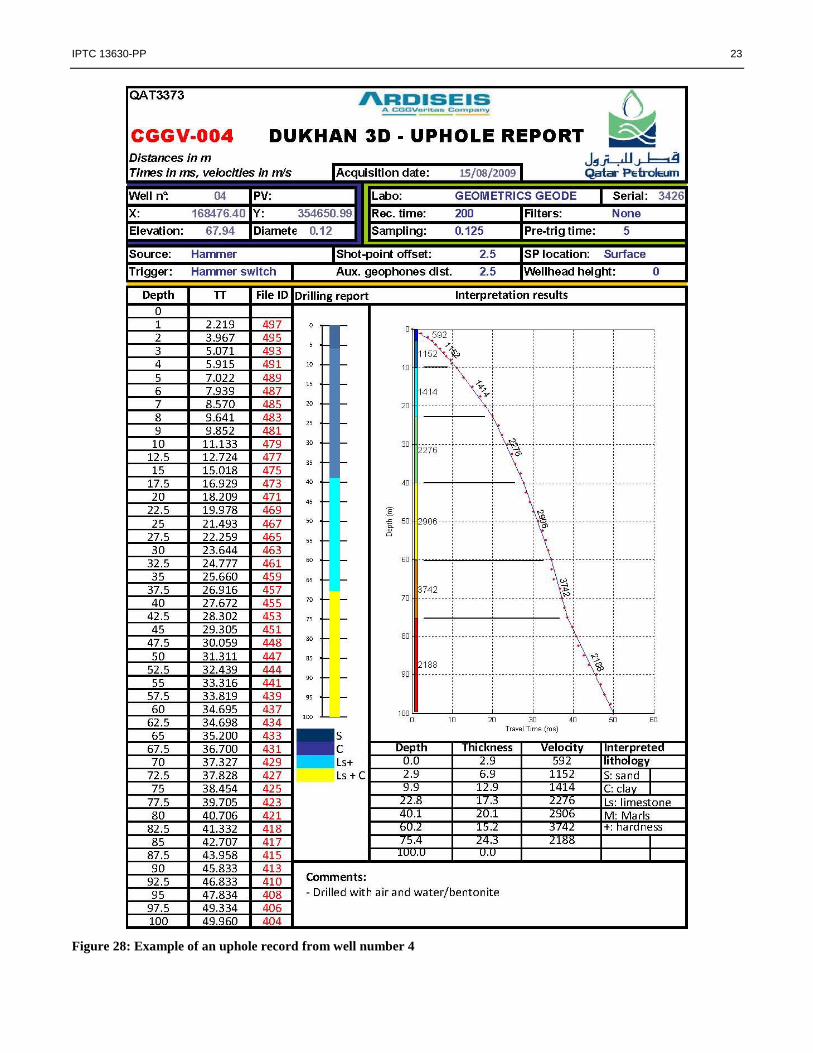
Uphole data were analyzed and recorded in a practical report, Figure 28, which included a summary of the uphole acquisition
parameters, interpretation of the velocity profile and thickness of the different velocity units. These reports also included raw
traces, a photo of the restored well site and a description of the calculation methodology.
Simultaneous 3D VSP Acquisition
This is a unique opportunity to combine an extremely high resolution land 3D seismic program with the simultaneous
acquisition of 100 tool 3D VSP‟s. Combining these two acquisitions enable:
Acquire a simultaneous 3D VSP where receivers cover 1500 feet of wellbore in a single deployment combined with
1000‟s of vibrator points from the surface seismic therein ensuring consistent source parameters for the VSP‟s and
surface seismic.
Have an optimized vertical seismic calibration data set to refine processing parameters of the 3D land project. In
particular the VSP data set allows accurate identification of inter bed multiple reflections in the surface seismic
along with very high resolution wavelet calibration and identification of thin reservoir units. VSP data are also used
for derivation of vertical-transverse-isotropy anisotropy parameters, Epsilon and Delta, and their variation with
azimuth. These VSP measured parameters serve as critical input for processing of the surface seismic data.
Collect a complete set of wireline logs, core and image log data providing a very quantifiable reservoir
characterization data suite. With calibration of the VSP data to the surface seismic data a world class opportunity is
created to extract high resolution petrophysical data from 3D seismic.
Identify fracture zones; the VSP is high resolution both vertically and horizontally, and is acquired with a fully
populated azimuthal coverage extending from 2 to 5 km from the wellhead. As the VSP is recorded across target
intervals these data can be analyzed for shear wave splitting, leading to identification of fault and fracture zones.
Using this as a calibration point, the fracture analysis can then be applied to the broader 3D surface seismic.
In order to have wells ready for acquisition QP adjusted their drilling program so that a series of vertical injection and
observation wells were drilled prior to seismic acquisition. These wells were completed with a short kill string to enable safe
operations without the need for a drilling rig. See Figure 29 displaying the VSP camp and crane deployment of a 100 tool
sting; tools displayed in Figure 30.
Initial survey plans were altered due to timing and tool availability; however because of the overlapping zipper design it was
possible to record the VSP on the north heading zipper several months later. Tool deployment was not straight forward with
the first VSP recorded (DK-678) suffering from a series of technical and mechanical challenges that reduced the amount of
data ultimately recovered. Lessons learned included the need for better cleaning of the receivers before disconnection to
eliminated brine being sucked into the tool and causing a short. The difficult start was quickly overcome and VSP
acquisition has proceeded without negative incident since.
Using rigless operations in specially designed well bores, 4 VSP surveys with their required suite of wireline logs have been
completed to date. The synchronization between the HFVS surface crew and the borehole system operated smoothly and
from the second VSP onward, each 3D VSP acquisition saw about 18,000 surface source points recorded by the 100 level
tool. Like the surface seismic data, the HFVS VSP data is separated by the in-field processing unit before shipment to
Houston where the core of the processing will be carried out. For each 3D VSP, a high frequency zero offset VSP is also
recording using a much higher sweep than the current production with a high end at 200 Hz, generating a high frequency data
set in order to have the best calibration for the surface seismic and also the most accurate velocity information from the direct
arrival times.
The VSP data will be used for its expected higher resolution, enabling a more detailed interpretation of faults and fractures,
interpretation of seismic ray-paths physics, detection of potential internal multiples, if any, calibration of inversion, etc.
The quality of the data is excellent with reflected PP and PS wave fields clearly visible (see Error! Reference source not
found.Figure 31); these quality data provide potential input for fracture studies using shear wave splitting.
Data Processing and Inversion
Processing results of data acquired to date show very encouraging results of high resolution data with an effective bandwidth
of 8-105 Hz being achieved, which combined with 7.5 m bins, provides resolution to meet the project objectives.
Improvements in computing capacity now allow processing at 7.5 m as well as the base case 15 m bins. Figure 32 and 33
show some selected seismic lines from the field brute stack volume. In these records it is possible to observe that the highest
frequency content is in the upper one second of the record; however there is still reasonable bandwidth down to the three

IPTC 13630-PP 7
second limit of these cross sections.
To face the challenge of huge data volume, innovative processing algorithms were tested and subsequently applied in
production i.e. combined 3D Fourier Regularization, Common Offset Vector and 3D HR Parabolic Radon filter. Amongst the
new technologies implemented are:
Production of massive cross-spread data subsets to apply anti-alias filter, adaptive ground roll attenuation and 3D
regularization.
Adaptive groundroll attenuation: unlike standard LNA techniques such as 3DFK, adaptive groundroll attenuation
works on irregularly sampled data and it is adaptive therefore no fixed parameterization is required. Thanks to new
developments to speed up the programs, adaptive groundroll attenuation is implemented before Digital Array
Forming (DAF). The strong groundroll is then attenuated before further processing such as Inter Array Statics for a
very accurate DAF
Intra Array Statics (Gulunay method): Automatic way of aligning traces inside the array. This new technology was
developed for this high density project. The results obtained at the production testing phase prove the robustness of
the method
Use of regular azimuth sampling to perform true 3D processing especially a pre-stack migration in 7.5m bins.
Final processing and subsequent seismic inversion still remains a product for the future. Currently the DAF processing is
actively reducing the backlog of data acquired prior to defining and approving the DAF processing sequence. Work has
started on post DAF processing, though the details such as the final processing sequence and QC steps are only just being
formalized.
In-field QC Verification
Do to the extremely complex nature of this survey combined with the enormous volumes of data generated QP chose to
pursue an aggressive QC team to help oversee and manage the data acquisition and processing. To ensure the acquisition and
data integrity, a team of in-field specialists were contracted to supervise the operations, verify the data and provide expert
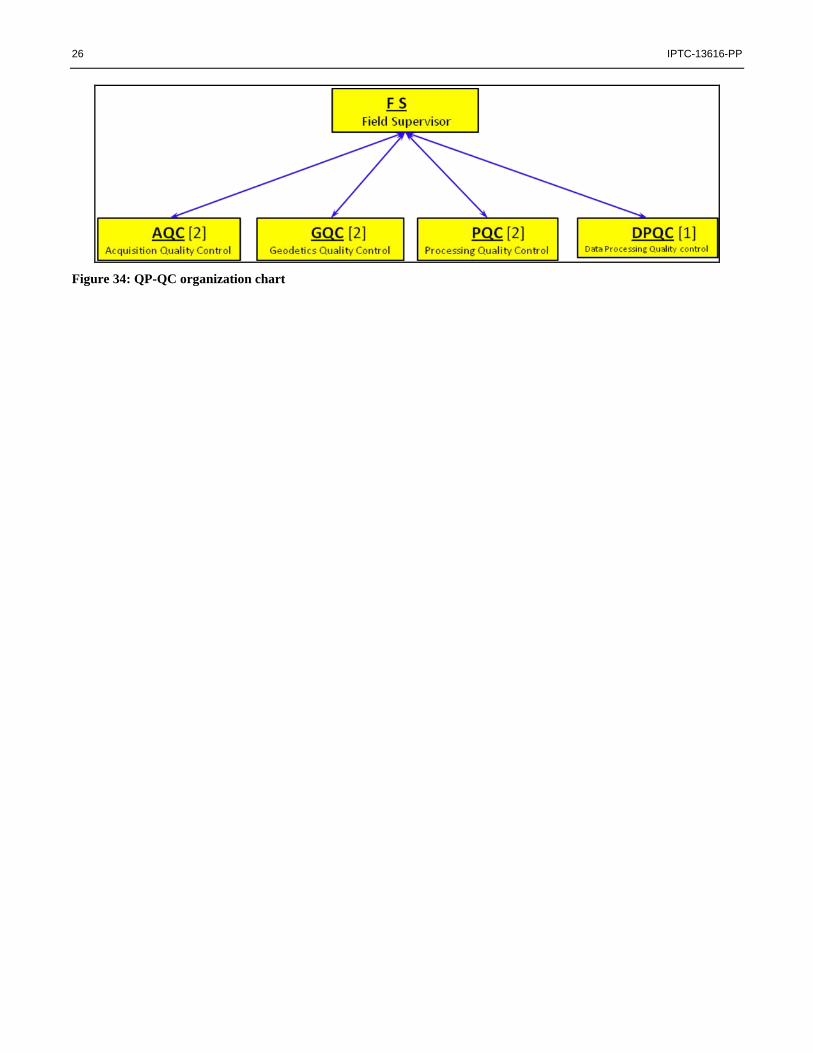
domain-specific advice to QP. The following in-field QP QC resources have been deployed (organizational chart displayed
in Figure 34):
Field Supervisor: Responsible and accountable to QP for the overall supervision, technical and operational performance of
the crew, including liaison with the Doha Processing team.
Geodetics QC [x 2]: Responsible for survey and navigation with particular emphasis on ensuring that all source and
receivers positioning within obstructed and challenging areas meet, as closely as possible, the theoretical design
requirements. Post acquisition ensures positioning data accuracy.
Acquisition QC [x 2]: Focused on data acquisition, including equipment integrity, procedures establishment and
implementation, verification of all performance QC data. One Acquisition QC is responsible for the Simultaneous 3D VSP
acquisition.
In-field Processing QC [x 2]: Working together with the contractor QC staff in pre and post-acquisition QC functions.
Initially ensures that the planning of the acquisition is the optimal design for the field conditions including all terrain types
and positioning limitations. Post-acquisition ensures that the data meets specification and in particular that the HFVS
inversion criteria are acceptable.
Data Processing QC [x 1]: Based in Doha and working together with the contractor processing geophysicist‟s implements
QC and QA procedures to ensure processing integrity. The Data Processing QC is also responsible for the processing of the
3D Simultaneous VSP data.
This specialist QC team comprised personnel from wide-ranging international backgrounds with experience in all aspects of
the complexities of the advanced technology deployed in the Dukhan 3D project. The team also provided guidance and
advice to the contractor and to QP, in additional to analyses and interpretation of various geophysical anomalies encountered
during the project.
Conclusion
The Dukhan 3D seismic survey sets a new standard in seismic data acquisition with exceptional quality data. By taking a
long term perspective on data requirements, this survey has been designed not only to give a significant immediate product,
but also to stand the test of time and to be able to be effectively reprocessed as new processing technologies evolve.

8 IPTC-13616-PP
The challenges to implement such a survey that are being successfully managed:
Maintain the coverage and azimuthal distribution within dense oilfield and industrial infrastructure by minimizing
source offsets and occupying all challenging design source locations.
Through detailed planning, and close liaison with both QP and third party contractors, ensure that all potential noise
sources in the operational area are either suspended or minimized during acquisition.
Manage on a daily basis several terabytes of data, perform a thorough QC, separate the HFVS records in individual
records and output a brute stack in “real time” with the acquisition.
Acquire thousands of VPs simultaneously on a surface spread and a 100 level borehole tool and integrate these data
into the processing and inversion sequences.
Pre-process the data in order to achieve the optimum signal-to-noise ratio with this single geophone acquisition.
Maintain data integrity during transfer from in-field processing through DAF processing and final post DAF
processing and inversion.
Deliver an extremely high quality product on time and under budget.
Acknowledgements
The authors would like to thank the Management of Qatar Petroleum for granting permission to publish this work. We also
thank our colleagues at Qatar Petroleum, Ardiseis, CGGVeritas, VSFusion, Baker and Jaguar Exploration for their
contributions and insightful discussions during the course of this work.
Figure 1: Dukhan 3D Location Map

IPTC 13630-PP 9
Figure 2: Source types location map
Figure 3: Cable-laying crews at cement factory
10 IPTC-13616-PP
Figure 4: Blasting hazard while operating in quarry area
Figure 5: Acquisition Template, 36 receiver lines of 672 channels for each VP
IPTC 13630-PP 11
Figure 6: Acquisition Template, Vibroseis fleets move in groups four - 1 Source point, followed by 7 Source points
Figure 7: Swath patterns, Source Occupancy and Zipper maps (zipper 8 lies within the sabkha area of zipper 4, see
Figure 2) Comment: This picture will be updated with correct Zipper and Survey Boundaries

12 IPTC-13616-PP
Figure 8: Fold map, all ranges, including cement quarries and cement factory
Figure 9: Vibrators operating inside cement factory area

IPTC 13630-PP 13
Figure 10: Vibrators operating inside Jaleha main degassing station
Figure 11: Geophone “planting”, electric-drill to secure spike in rock when required; all phones are covered with sand
to reduce wind noise.

14 IPTC-13616-PP
Figure 12: Cable layout in quarry, with cliff hazard evident
Figure 13: Recording truck displaying wireless communication mast

IPTC 13630-PP 15
Figure 14: Inside of the recording truck showing QC and recording management displays
Figure 15: Daily acquisition data volume

16 IPTC-13616-PP
Figure 16: Acquisition sequence illustrating HFVS, sweep phase rotation.

IPTC 13630-PP 17
Figure 17: Phase 1 sweep tests

18 IPTC-13616-PP
Figure 18: Selected sweep test: tailored sweep 6-120 Hz, 8 second period, and 70% drive level with frequency
spectrum and seismic section displayed.
RECEIVER GEOMETRY RECORDING INSTRUMENT
Spread description 3D Instrument description Sercel SN428
Receivers line spacing 120m Recording media Disk/Tape3592
Inline receiver spacing 7.5m Recording format SEG-D 8058
Receiver lines per patch 36 Correlation No
Max Inline offset 2520m HFVS Recording mode 4 records stacked
Max offset 3315m Record length 5 sec
Min offset 5.3m Sample rate 2 ms
Min receiver line length 5032m Low cut filter Out
Receiver line azimuth E-W (90deg) High cut filter 80% Nyquist
Receiver stations/line 672 Filter type Minimum phase
SOURCE GEOMETRY Notch filter Out
Source interval 7.5m Gain constant 12 dB
Source line spacing 90m Aux chan 1,2 Ref sweep 1,2
Source line azimuth N-S (180 deg) Aux chan 3,4 Ref sweep 3,4
Sources per salvo 16 Aux chan 5,6 Force sweep 1,2
VIBRATOR Aux chan 7,8 Force sweep 3,4
Vibrator description Nomad65 Aux chan 9 (500ms apart) Sum of forces
Vibrator control system SercelVE464 Max seismic chans/record 24192
Vibrator peak Force 27600 dN GEOPHONES
Vibrator hold down weight 27600 dN Geophone description SG-10
Drive level 70% Natural resonance freq. 10 Hz
Vibrator polarity SEG Dumping constant 4925 Omh Hz
Vibrator array None Sensitivity @68% Damp 22.8 V/m/sec
Vibrators per station 1 Geophone polarity SEG Normal
Number of sweeps/station 4 Geophone coupling Spike
Vibrator inline spacing 15m Geophone array 1
Vibrator cross line spacing 0 Geophones per station 1
Vibrator moveup 1 station HFVS INVERSION
Non-linear Sweep rate 0.05 dB/Hz Correlation operator Force derivative
Individual sweep length 8 sec Frequency band 0-150 Hz
Uncorrelated listen time 4 sec White noise percent 0.4
Total source signature 44 sec Re-shaping band pass 8-115Hz
Total sweep length record 48 sec Attenuation slope 30/150 dB/Oct
Sweep start freq. 6 Hz Bandwidth phase Min phase
Sweep end freq 120Hz Spectral smoothing 2Hz
Sweep start amplitude 100% PROCESSING BIN
Sweep end amplitude 100% Inline bin size 3.75m
Sweep start taper 300ms Cross line bin size 3.75m

IPTC 13630-PP 19
Sweep end taper 500ms Nominal fold 504
Taper function Blackman
Phase encode Matrix base 0,0,0,180
Force control mode Raw
Figure 19: Final acquisition parameters
Figure 20: Pre-recording in-field processing center workflow used to establish source and receiver locations.
Figure 21: Post recording in-field processing center workflow to generate data for digital array forming.

20 IPTC-13616-PP
Figure 22: General workflow, from inputs through “final data”, output to in-field processing unit.
Figure 23: Data quality control workflow
IPTC 13630-PP 21
Figure 24: Example of QC screen of the HFVS inversion with the “conditioning vector“, identified as bad in this
example
Figure 25: Brute stack volume used to assess data quality and acquisition progress

22 IPTC-13616-PP
Figure 26: Uphole coverage maps on left with existing data sites in blue and planned new acquisition sites in red (123
locations). Planned VSP locations displayed on the right, with zipper boundaries; 2 km radius superimposed for
reference.
Figure 27: Uphole drilling, here displaying air injection used while drilling the upper section of the well.
IPTC 13630-PP 23
Figure 28: Example of an uphole record from well number 4

24 IPTC-13616-PP
Figure 29: VSP recording camp set up on DK 679, note crane deployed to allow rigless operations.
Figure 30: VSP 100 receiver tool string and a single receiver with retaining arm deployed.
Figure 31: Up going PP wave field, left, and up going PS wave field, right

IPTC 13630-PP 25
Figure 32: East-West [In-Line] field Brute Stack
Figure 33: North – South [X-Line] field Brute Stack
26 IPTC-13616-PP
Figure 34: QP-QC organization chart
Top Related