


Languages
Pages
Legal


Drum –Buffer-Rope
Skorkovský
Based on : R. Holt, Ph.D., PE
Traditional Approach:
Divide and ConquerDivision of Labor breaks down linkages complex
systems into manageable chunks.
Which is harder to manage? Left or Right?
Left Right
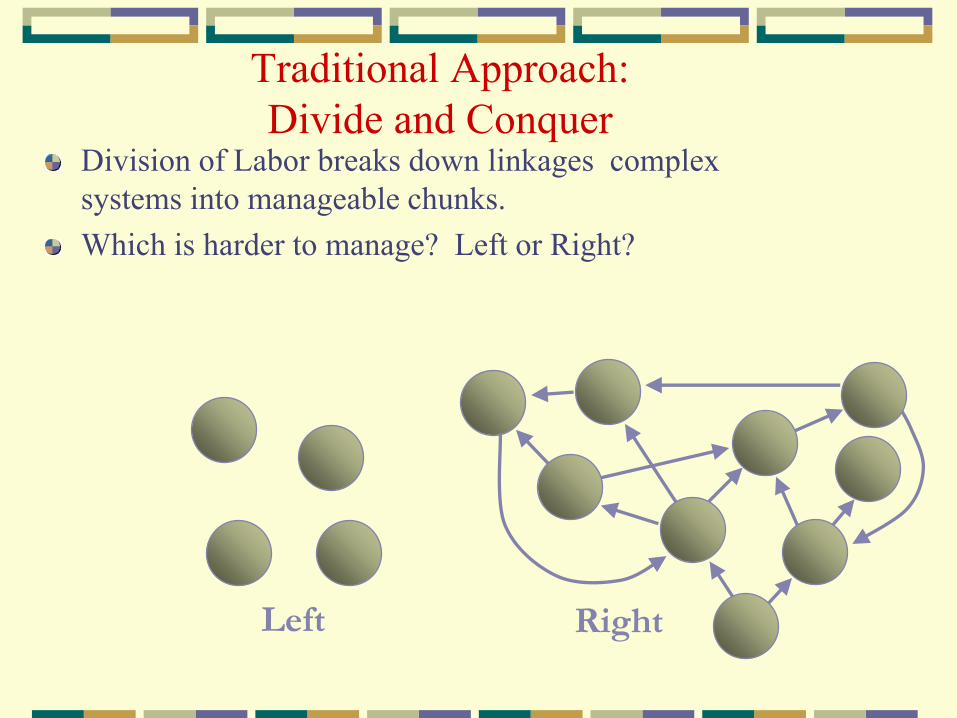
We Measure Operational Efficiency
Work flows from left to right
through processes with
capacity shown.
Process A B C D E
RM FG
Capability
Parts 7 9 5 8 6
per Day
Excellent Efficiency--Near 100%
Chronic Complainer
Too Much Overtime
Market
Request
11

Reward Based on Efficiency
Work flows from left to right.
Process A B C D E
Capability
P/D 7 9 5 8 6
Both found ways to look busy and appear to have a capacity of 5 parts/day.
RM FG
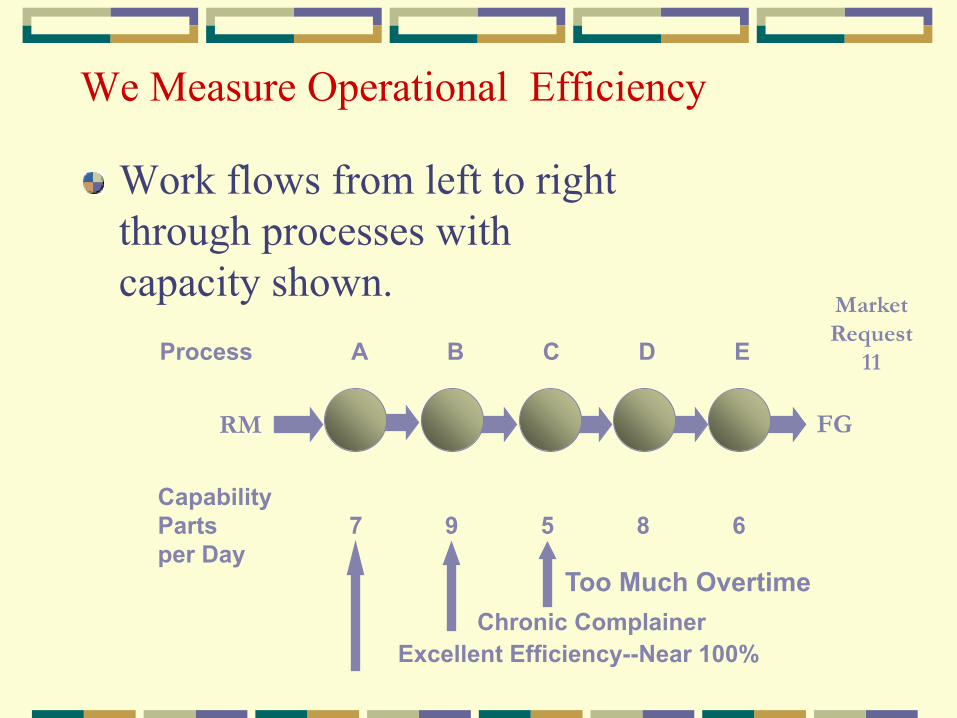
In reality...
Process A B C D E
Potential
P/D 7 9 5 8 6
Reality 5 5 5 5 5
Processes A and B won’t produce
more than Process C for long.
RM FG
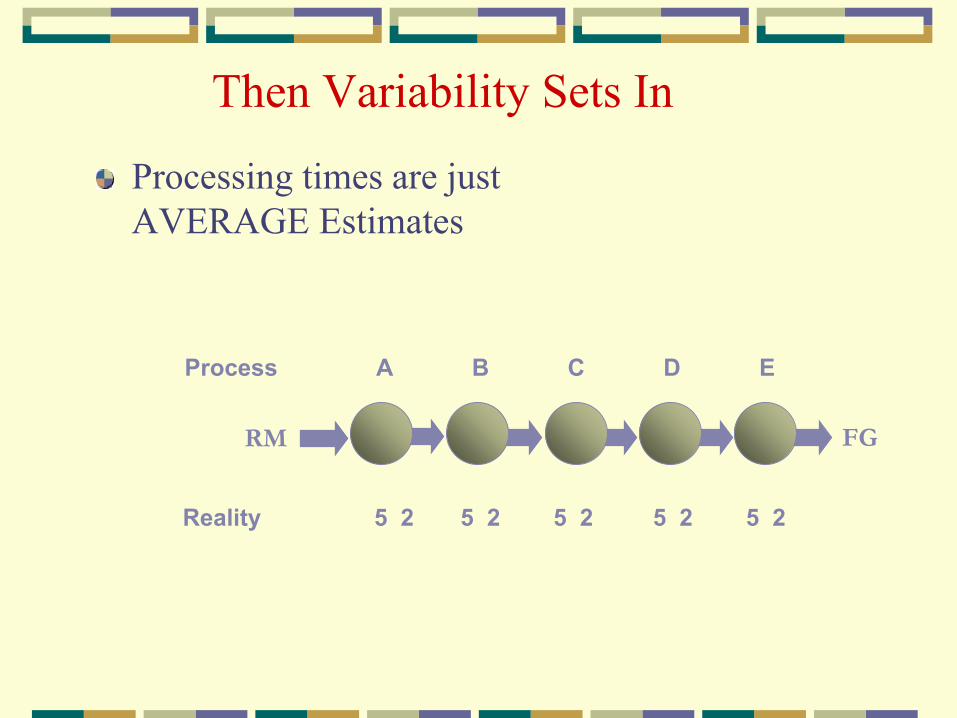
Then Variability Sets In
Processing times are just
AVERAGE Estimates
Process A B C D E
Reality 5 2 5 2 5 2 5 2 5 2
RM FG

What’s an Average? 50%
Process A B C D E
Reality 5 2 5 2 5 2 5 2 5 2
Probability 0.5 0.5 0.5 0.5 0.5
Half the time there are 5 or more per day at
each process--Half the time less
Two at a time: 0.25 0.25
Over all: 3% Chance of 5 per day
RM FG

Previous Solution: Inventory
WIP 5 5 5 5 5 Total 25
ProcessA B C D E
Variable 5 2 5 2 5 2 5 2 5 2
Process
Put a day of inventory at each process!
RM FG

System Variability Takes Over--Chaos
Variable 5 2 5 2 5 2 5 2 5 2
Process
WIP 3 0 10 8 4 Total 25
RM FG
Process A B C D E
Inventory (WIP) quickly shifts position.
Inventory manager/expediter tries to smooth it out.
Distribution problems result. Costs go up.

System Variability Takes Over--Chaos
WIP 3 0 10 8 4 Total 25
Variable 5 2 5 2 5 2 5 2 5 2
Process
Shifting work-in-process creates large queues at some
locations. This makes work wait longer to be processed.
RM FG
An Average of 5 means sometimes 3 and some times 7
Process A B C D E

System Variability Takes Over--Chaos
WIP 3 0 10 8 4 Total 25
Variable 5 2 5 2 5 2 5 2 5 2
Process
Shifting work-in-process creates large queues at some
locations. This makes work wait longer to be processed.
Other workstations can be starved for work. The work they
could be doing is delayed because it is not there. They
can’t take advantage of their extra capability. So...
RM FG
Process A B C D E

System Variability Takes Over--Chaos
WIP 3 5 10 8 4 Total 25
Variable 5 2 5 2 5 2 5 2 5 2
Process
So… Management Helps! Management puts in more work
(Inventory) to give everyone something to do!
Result: It takes longer and longer from time of release
until final shipping. More and more delay!
RM FG
Process A B C D E
X 30

Attempts to Control WIP
WIP 5 5 5 5 5 Total 25
ProcessA B C D E
Variable 5 2 5 2 5 2 5 2 5 2
Process
Just-In-Time uses Kanban Cards to limit the queues
building in the system.
No more than 5 parts are allowed at any station.
Looks good, but is it?
Use Kanban Cards-JIT
RM FG

Effects of Inventory Limits on Production
WIP 5 5 5 5 5 Total 25
ProcessA B C D E
Variable 5 2 5 2 5 2 5 2 5 2
Process
What does a Kanban card of 5 Mean?
RM FG
5+/-2
Average = 5
Before
Kanban
5+/-2
Average = 3.5
Can’t
exceed
5
After
Kanban

Operation’s Dilemma
Injection: Put a large inventory where its needed and
low everywhere else!
Manage
production
effectively
Produce a lot
Costs &
delivery in
control
Increase
work-in-
process
Decrease
work-in-
process
Assumption:
We can’t both
increase WIP and
decrease WIP at the
same time.

TOC Steps to
Continuous Improvement
Step 1. IdentifyIdentify the system’s constraint.
Step 2. ExploitExploit the system’s constraint.
Step 3. SubordinateSubordinate everything else to the above
decision.
Step 4. ElevateElevate the system’s constraint.
Step 5. If a constraint is broken (that is, relieved or
improved), go back to Step 1. But don’t allow
inertiainertia to become a constraint.

Five Steps Applied to Flow Operations
A B C D E
7 9 5 8 6
WIP Total
Step 3. Subordinate Everything Else (Rope)
Step 4. Elevate the Constraint ($?)
X 5.5
Step 5. If the Constraint Moves, Start Over
XXX
7
Five Focusing Steps
RM
Step 1. Identify the Constraint (The Drum)
FG
Step 2. Exploit the Constraint (Buffer the Drum)
12 12
FG
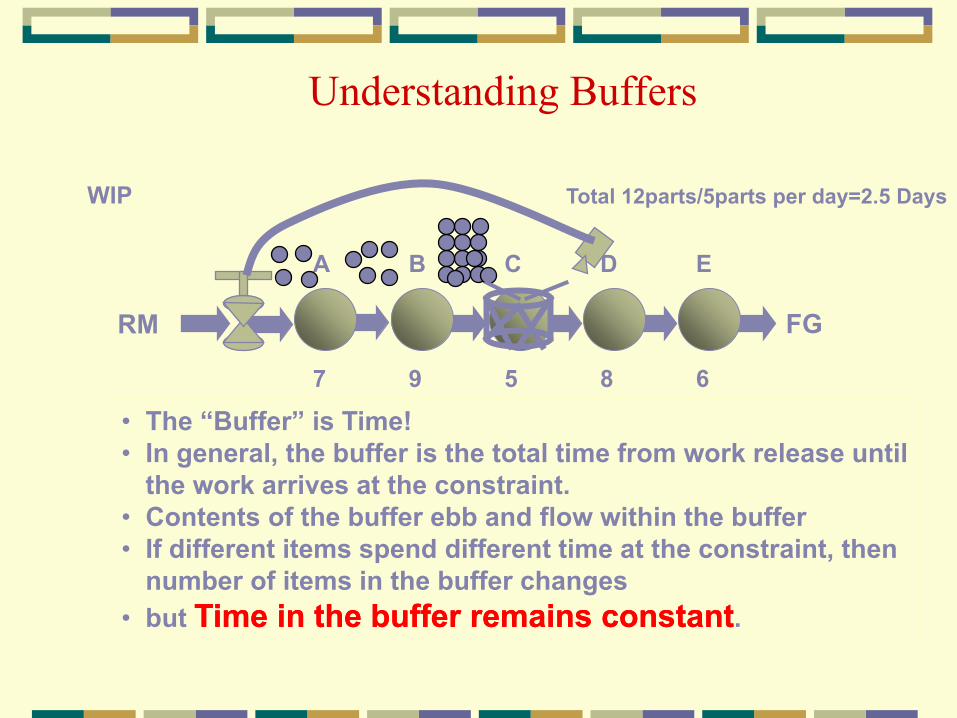
Understanding Buffers
A B C D E
7 9 5 8 6
RM
• The “Buffer” is Time!
• In general, the buffer is the total time from work release until
the work arrives at the constraint.
• Contents of the buffer ebb and flow within the buffer
• If different items spend different time at the constraint, then
number of items in the buffer changes
• but Time in the buffer remains constantTime in the buffer remains constant.
WIP Total 12parts/5parts per day=2.5 Days

We need more than one Buffer
FG
A B C D E
7 9 5 8 6
RM
There is variability in the Constraint.
To protect our delivery to our customer we
need a finished goods buffer.
Finished Goods
Buffer
There is variability in our suppliers.
We need to protect ourselves from unreliable
delivery.
Raw Material
Buffer
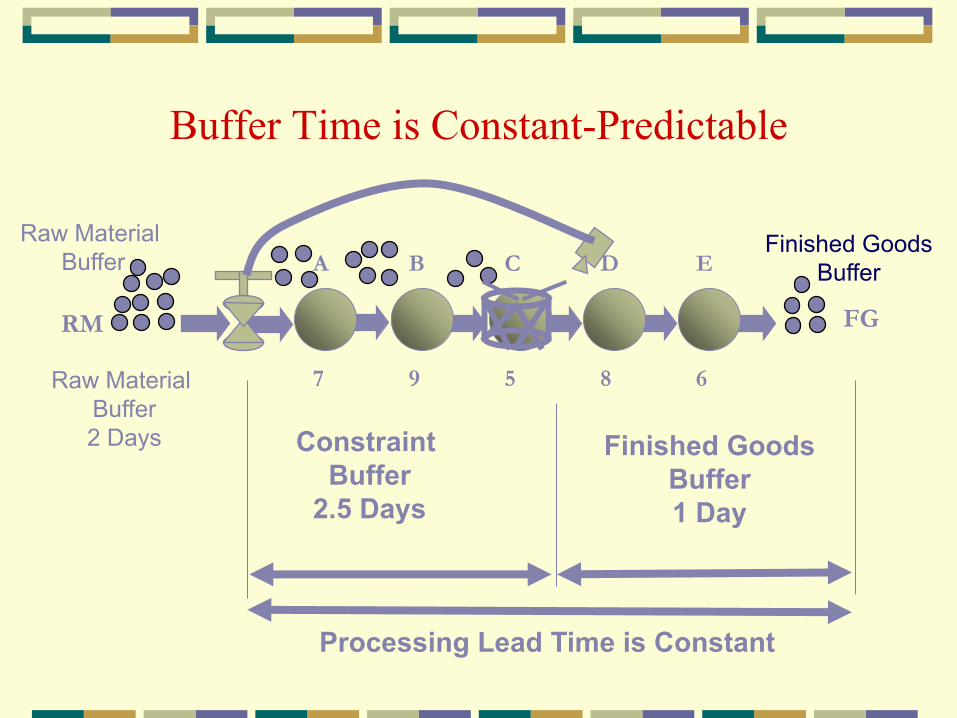
Buffer Time is Constant-Predictable
FG
A B C D E
7 9 5 8 6
RM
Finished Goods
Buffer
Constraint
Buffer
2.5 Days
Raw Material
Buffer
Finished Goods
Buffer
1 Day
Processing Lead Time is Constant
Raw Material
Buffer
2 Days

FG
Buffer Management
A B C D E
7 9 5 8 6
RM
Constraint Buffer WIP Total 12/5=2.5 Days
Time until Scheduled at Constraint
02.5 Days
WO17
WO14
WO15
WO16
WO10
WO11
WO12
WO13
WO18
WO19
• The Constraint is scheduled
very carefully
• Buffer Managed by location
• Individual activities in the
buffer are not scheduled
WO21
WO20

A B C D E
FG
Problem Identification
7 9 5 8 6
RM
Time until Scheduled at Constraint
02.5 Days
WO10
WO20 WO12
WO13WO21
WO15
WO16
WO17
WO18
WO19
Delayed
Parts
WO11
WO14
WO19
WO19 OK (GreenGreen)
Watch WO14 (YellowYellow))
Constraint schedule
is in jeopardy!
(RedRed Zone Hole)

Additional Buffers
Constraint Buffer (as we discussed)
• Protects the Constraint from running out of work
Finished Goods Buffer
• Protects customer delivery from Constraint variation
Raw Material Buffer
• Protects the Release of material from suppliers
Assembly Buffer
• Facilitates speedy flow of products

Additional Buffers
Buffer Types:
Constraint
FG
RM
AssemblyA B C D E
RM
FG
7 9 5 8 6
RM
F G H
8 7 6
Constraint
Finished goods
Raw Material
Assembly
RopesWIP
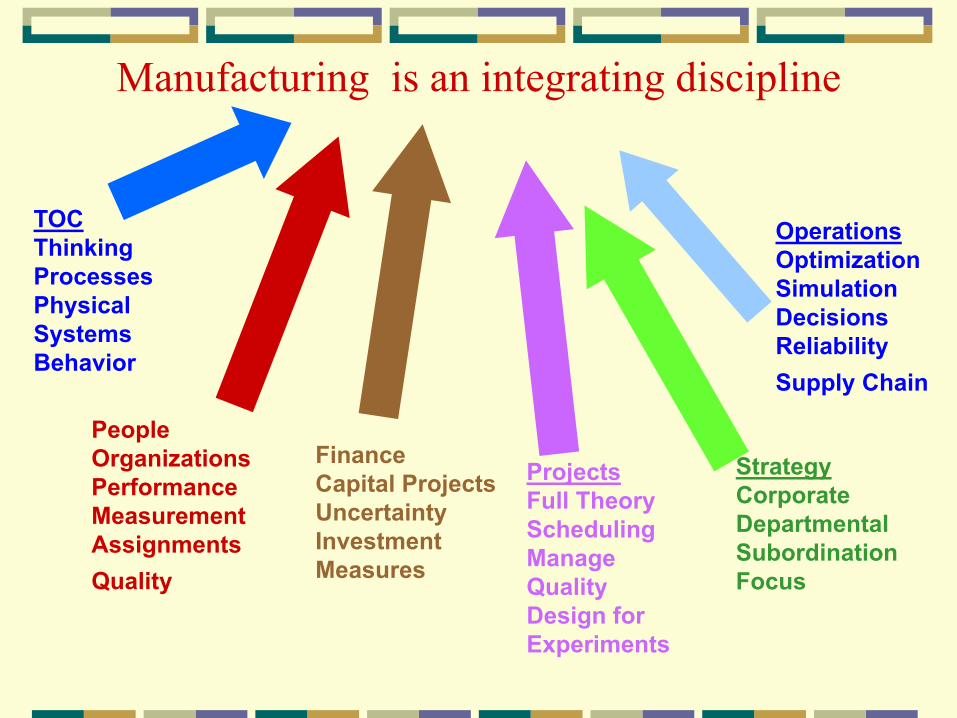
Manufacturing is an integrating discipline
People
Organizations
Performance
Measurement
Assignments
Quality
Finance
Capital Projects
Uncertainty
Investment
Measures
Projects
Full Theory
Scheduling
Manage
Quality
Design for
Experiments
Operations
Optimization
Simulation
Decisions
Reliability
Supply Chain
Strategy
Corporate
Departmental
Subordination
Focus
TOC
Thinking
Processes
Physical
Systems
Behavior
Top Related