


Languages
Pages
Legal


Does Firing the CEO Improve the Company’s Performance in the Long Run?
Yifan Zhu Washington University in St.Louis
Economics Department Honors Thesis
March 17th , 2013

Abstract
This paper investigates whether firing the CEO of a publicly traded company improves or harms
long-run stock performance. I employ a matched sample design where every company with an
involuntary CEO replacement is matched with a company without a CEO replacement in the
same 4-digit SIC industry. The regression results show a negative and statistically insignificant
relationship between CEO firing and stock return. While the lower returns for firms replacing
their CEO is insignificant, the magnitude is substantial, suggesting that the board should handle
CEO replacements with extra caution.
Acknowledgement
I would like to thank my thesis advisor, Professor Bruce Petersen, for his invaluable contributions
and kind support. Without him, I could not have completed my thesis. I would also like to thank
Professor Roni Kisin for all his assistance and much appreciated feedback, and the Business
School Librarian Ronald Allen for permitting me to have access to WRDS. Finally, I would like
to thank Professor Dorothy Petersen for coordinating this wonderful event that allows us to write
an original research paper.
1. Introduction:
The amount of CEO turnover in U.S. publicly traded companies has been high for several
decades and has increased sharply in recent years. For example, according to the article Bargain
bosses in a September 2012 issue of The Economist, in the 1970s, about 10% of the CEOs were
fired each year because of the bad performance of their respective companies. By the 2000s, the
figure had jumped to more than 15%. As a consequence, average CEO tenure declined from 8
years in the 1990s to 6 years today.
Generally, the board of directors makes the decision concerning CEO firing. Existing
literature suggests that forced termination of a CEO’s employment is usually a response to poor
organizational performance (Khurana and Nohria, 2000). When a firm’s performance
deteriorates, the board of directors is under great pressure from shareholders to make changes in
order to improve the confidence of shareholders and investors. However, most changes are likely
to take years to implement and may not be very visible to shareholders. On the other hand, firing
the CEO is something that can be done very quickly, and it is a dramatic action that is highly
visible to shareholders. So, boards’ first reaction to bad performance and shareholder pressure
may be to fire the CEO, even if the true problems facing the firm may not be a problem of
leadership. Given that it is rather expensive to replace CEOs, this naturally gives rise to the
following question: on average, does the performance of firms improve or decline following the
firing of its CEO?
Given the importance of this question, there is surprisingly little previous research on this
topic. Therefore in my thesis I explore whether the removal of a CEO has an impact on the long-
run value of the firm. I carefully construct a matched sample of firms that do not experience CEO
turnover that I use to control for changes in financial performance due to factors other than the
CEO turnover. No previous studies have employed a matched sample methodology and this
approach should provide more accurate results regarding the effect of CEO replacements. My
sample consists of 44 companies with involuntary CEO turnover from 2003-2009 together with
44 matching companies without CEO turnover. I find that the effect of firing a CEO on the
company performance, measured by stock price return, is negative and statistically insignificant.
While the different in performance between companies with and without turnovers is statistically
insignificant, the quantitative effect is not necessarily small. I am somewhat limited about how far
I can push my findings, as my sample size at this time is not that large. A larger sample would
permit more precise estimation of the CEO turnover effect, which would likely permit stronger
conclusions concerning the impact of involuntary CEO turnover on firm performance.
I believe that my findings have implications for the board of directors. When a firm gets

in trouble, one of the quickest and most dramatic actions that the board can take is to fire the CEO.
But if firing a CEO does not typically improve the company performance in the long run, then the
board of directors may need to rely more heavily on other strategies to bring about improvement
in the long-run performance of a company.
2. Motivations and Previous Research
Taylor (2010) develops a dynamic model of a rational board of directors that maximizes
shareholder value and decides at each point whether to fire or keep their current CEO. In his
model, some CEOs are more capable than others and can therefore produce higher profits for
their firms. Taylor (2010) concludes from his empirical model that boards in large firms fire
CEOs at excessive rates, and one of the possible reasons is in large, poorly performing companies,
boards use a CEO replacement as a scapegoat to protect their own benefits. Therefore, it is
possible that CEO involuntary replacement may, on average, lead to little or no improvement in
firm performance.
There are a number of papers discussing CEO turnover and their relationship to company
performance. Clayton, Hartzell and Rosenberg (2005) focus on the change in volatility in equity
returns caused by CEO turnover. They conclude (p.3) that “all types of changes in executive
leadership result in equity volatility increases”, and that the effects can last up to 2 years after the
event. They do not, however, examine whether CEO turnover leads to better or worse
performance as measured by the level of stock prices. Grusky (1963) studies the effect of
management and coaching changes on the performance of baseball teams and finds a negative
relationship between coach replacement and performance. He argues that an executive
replacement has the byproduct of a decline in company performance because of its disruptive
affect on an organization’s processes and routines. Gamson and Scotch (1964) reanalyze Grusky's
data and argue that performance is largely outside the control of managers. They find that there is
no significant relationship between turnover and performance.
The study most closely related to my investigation is Khurana and Nohria (2000), who
explore whether CEO turnover, and different types of successions, has an impact on the firm
performance. They measure firm performance with return on assets, which they adjust for
industry effects by taking the difference between the firm’s ROA and the average ROA in the 2-
digit SIC industry in which the firm resides. Their key explanatory variables are dummy variables
denoting the types succession following a turnover, which can be either an “insider” or an
“outsider.” One problem with their approach is that 2-digit SICs are very aggregated (e.g.,
chemicals, electrical machinery), and thus industry performance at the 2-digit SIC is likely to be a
very crude control. When they examine all CEO turnovers in their sample, they find that forced
turnovers generally have a quantitatively small positive, but significant effect 1-3 years after the
announcement. In addition, they report that the effect of forced turnover with outsider succession
has a statistically significant positive effect on performance while the effect of forced turnover
with insider succession is small and statistically insignificant.
This paper’s goals are to analyze the long-run effects of CEO involuntary turnover by
looking at the companies’ stock return for up to three years after the announcement of the
turnover. My study contributes to the existing literature along a couple of dimensions. First, my
paper extends the research of Khurana and Nohria (2000) by analyzing the years 2003-2009, a
period of rapidly rising CEO turnover and shortened CEO tenure. Second, I use stock returns as
my measure of performance, since shareholders care mainly about stock performance and stock
price captures both the company’s current performance and expected future performance. Third,
instead of comparing the company performance with the industry average (at the 2-digit SIC level)
as Khurana and Nohria did in their paper, I employ a matched sample approach by matching
every company with a CEO turnover in my sample with a comparable company that does not
experience a CEO turnover.
3. Data and Construction of the Sample
Data Sources and Industries
I gather CEO replacement data from the Compustat Executive Compensation Database. I
collect the data for public companies for the period 2003 to 2009. I do not consider CEO turnover
after 2009 because there is insufficient time after the turnover to explore the long-term
performance.
I limit my research to companies in the manufacturing (SIC code 2000-3999), retail (SIC
code 5000-5999) and service (SIC code 7000-7999) sectors. I do not investigate companies in the
public sector because the relatively heavier government regulation gives less freedom to the CEO
and therefore we expect to see smaller effects of changing the CEO.
Identifying Involuntary Turnovers
In my study, I focus on involuntary CEO replacements since previous studies (e.g., Zald
and Berger (1978)) have shown that involuntary turnovers have larger impact on firm
performance. My database classifies the reasons for CEO turnovers as: 1) Resigned, 2) Deceased,
3) Retired, 4) Unknown. I limit my sample to CEOs who “resigned”. To identify resignations

that are involuntary turnovers, I follow the method of Khurana and Nohria (2000). First, I delete
turnovers where the CEO is over 60 years old because they are plausibly resigning because of age
or health reasons, rather than being forced to resign. Second, I double-checked whether CEOs
who left the company took another CEO position; I exclude all cases where the departed CEO did
in fact find a CEO position elsewhere. Therefore, as Kharana and Nohria did, I conclude that the
CEO turnovers that remain in my sample are very likely to be involuntary.
Creation of a Matched Sample
Ideally, we want to study the effects CEO replacement has on company performance by
studying a situation where CEO turnover is randomly assigned; however, this obviously is not
possible in the real world. Instead, I use a matched sample design. A matched sample design has
not been used to study CEO replacement, but it has been employed in other studies in the finance
literature. For example, Megginson and Weiss (1991) explore whether VC-backed firms (who are
obviously not randomly assigned) have lower underpricing when they go public. Megginson and
Weiss (1991) match VC-backed firms going public with a non-VC backed firm in the same 4-
digit industry and of similar size. Another example is Brown (2005), who explores the impact of
VC-backing on the long-run performance of publicly traded high-tech firms. Brown (2005) also
creates a matched sample of VC-backed and non-VC-backed firms in the same industry and of
similar age and size.
In my study, I follow a similar approach as the above papers by employing a matched
sample design where the matching occurs on asset size and the 4-digit SIC code. I use four rules
to define a matching company. First, the matched firm is in the database for exactly the same
years as the firm with the turnover. Second, the matching company must be in the same (4-digit
SIC) industry of the firm with an involuntary turnover. Third, in the year of the turnover, the
matching company must fall within a ±20% range in consolidated asset size. When I have
multiple companies that fall into the range, I select the one that is closest to the turnover company
in terms of asset size. Finally, the matching company cannot have CEO turnovers 2 years before
or 4 years after the announcement date of the company with CEO replacement. I note that 4-digit
SIC industries are far less aggregated than 2-digit SIC industries, and thus should serve as better
controls than what Kharana and Nohria (2000) used.1
The logic behind employing a matched sample design is that firms in the same 4-digit
SIC industry with similar asset sizes are likely to experience similar industry demand and supply
1 For example, in manufacturing, there are only 20 2-digit SIC industries in manufacturing compared to over 400 4-digities industries.

shocks. This hopefully permits the analysis to isolate the impact of CEO turnover from other
factors that drive stock prices.
Of course, the matched sample design is not perfect. In my study, I had to drop some
firms from my sample because I couldn’t find a match for them. In addition, there are likely
unobserved differences between firms experiencing a CEO turnover and those that do not. In
particular, companies that fire their CEO are likely firms that are doing worse than the industry
average. Fortunately, this difference in the initial quality of firms is presumably capitalized in the
stock price of the firm just prior to the announcement of the turnover. That is, if CEO turnover
firms are of lower quality, that should be reflected in a lower initial stock prices. So what I hope
to capture in my research design is the improvement in stock performance after the new CEO
takes over relative to similar firms in the same industry, recognizing that matched firms may be,
on average, of higher initial quality, but that this quality difference is arguably captured by higher
initial stock prices.
Measuring Stock Returns
I use stock prices as my main measure of company performance. Stock prices are
arguably what equity investors care most about and thus this is what the board of directors should
focus on in making decisions concerning whether or not to fire the existing CEO. Stock prices are
also a forward-looking measure, and the expected future performance of the firm is already
capitalized into the stock market at the time of the CEO turnover. If the CEO improves the firm
performance, this should show up in higher stock prices, but it presumably takes time for the
CEO to impact performance and for the stock market to recognize the better performance. Hence,
I will look at future stock prices compared to the stock price just one day before the
announcement of the CEO turnover.
I use the CRSP® US Stock Database to get the daily stock price in order to calculate the
stock price return as my dependent variable. I compute stock returns as follows: I first obtain the
daily closing price one day before the announcement date, and the closing price 1, 2, and 3 years
after the announcement date respectively. I then compute the change in the stock price from the
date of the CEO turnover to n-years in the future for both the turnover firm and its matched
counterpart using the natural logarithm function.
𝑂𝑛𝑒 𝑦𝑒𝑎𝑟 𝑅𝑒𝑡𝑢𝑟𝑛 = 𝑙𝑛𝑆𝑡𝑜𝑐𝑘 𝑃𝑟𝑖𝑐𝑒!!!𝑆𝑡𝑜𝑐𝑘 𝑃𝑟𝑖𝑐𝑒!!!
The two-year and three-year returns are calculated with the same log return function. In
order to eliminate potential outliers in my sample, I deleted companies that have yearly returns
over +500% or -80%.
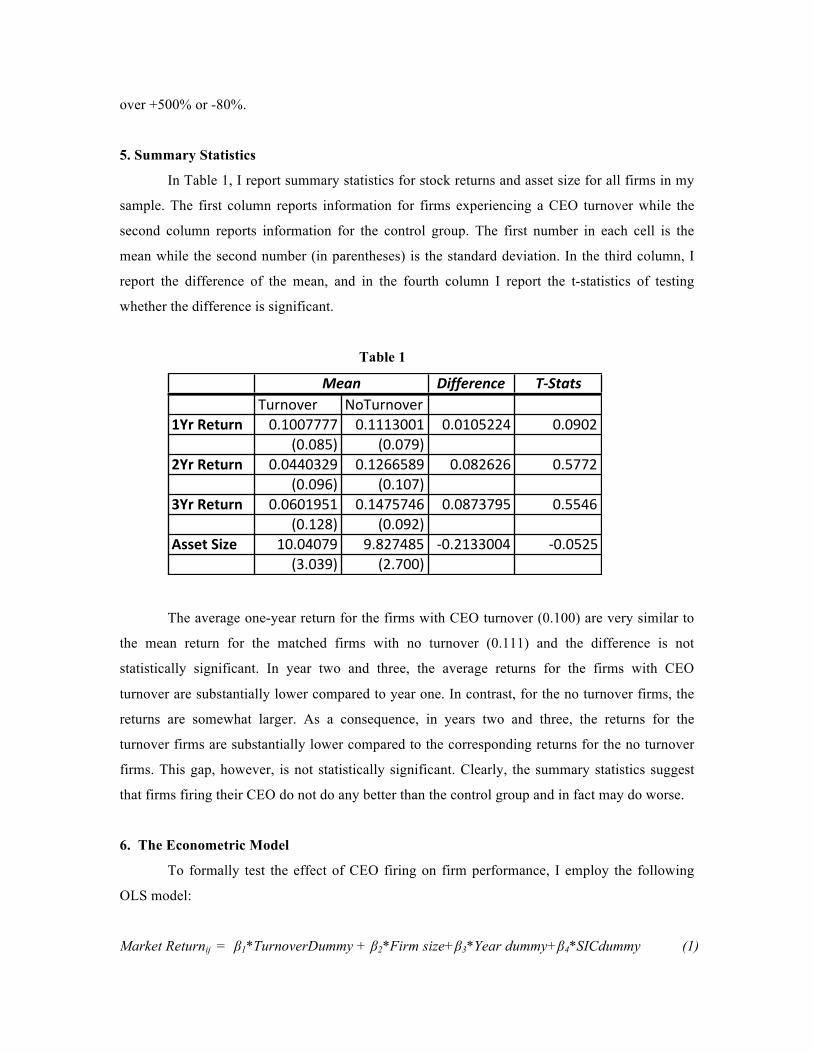
5. Summary Statistics
In Table 1, I report summary statistics for stock returns and asset size for all firms in my
sample. The first column reports information for firms experiencing a CEO turnover while the
second column reports information for the control group. The first number in each cell is the
mean while the second number (in parentheses) is the standard deviation. In the third column, I
report the difference of the mean, and in the fourth column I report the t-statistics of testing
whether the difference is significant.
Table 1
The average one-year return for the firms with CEO turnover (0.100) are very similar to
the mean return for the matched firms with no turnover (0.111) and the difference is not
statistically significant. In year two and three, the average returns for the firms with CEO
turnover are substantially lower compared to year one. In contrast, for the no turnover firms, the
returns are somewhat larger. As a consequence, in years two and three, the returns for the
turnover firms are substantially lower compared to the corresponding returns for the no turnover
firms. This gap, however, is not statistically significant. Clearly, the summary statistics suggest
that firms firing their CEO do not do any better than the control group and in fact may do worse.
6. The Econometric Model
To formally test the effect of CEO firing on firm performance, I employ the following
OLS model:
Market Returnij = β1*TurnoverDummy + β2*Firm size+β3*Year dummy+β4*SICdummy (1)
Difference T)StatsTurnover NoTurnover
1Yr$Return 0.1007777 0.1113001 0.0105224 0.0902(0.085) (0.079)
2Yr$Return 0.0440329 0.1266589 0.082626 0.5772(0.096) (0.107)
3Yr$Return 0.0601951 0.1475746 0.0873795 0.5546(0.128) (0.092)
Asset$Size 10.04079 9.827485 60.2133004 60.0525(3.039) (2.700)
Mean
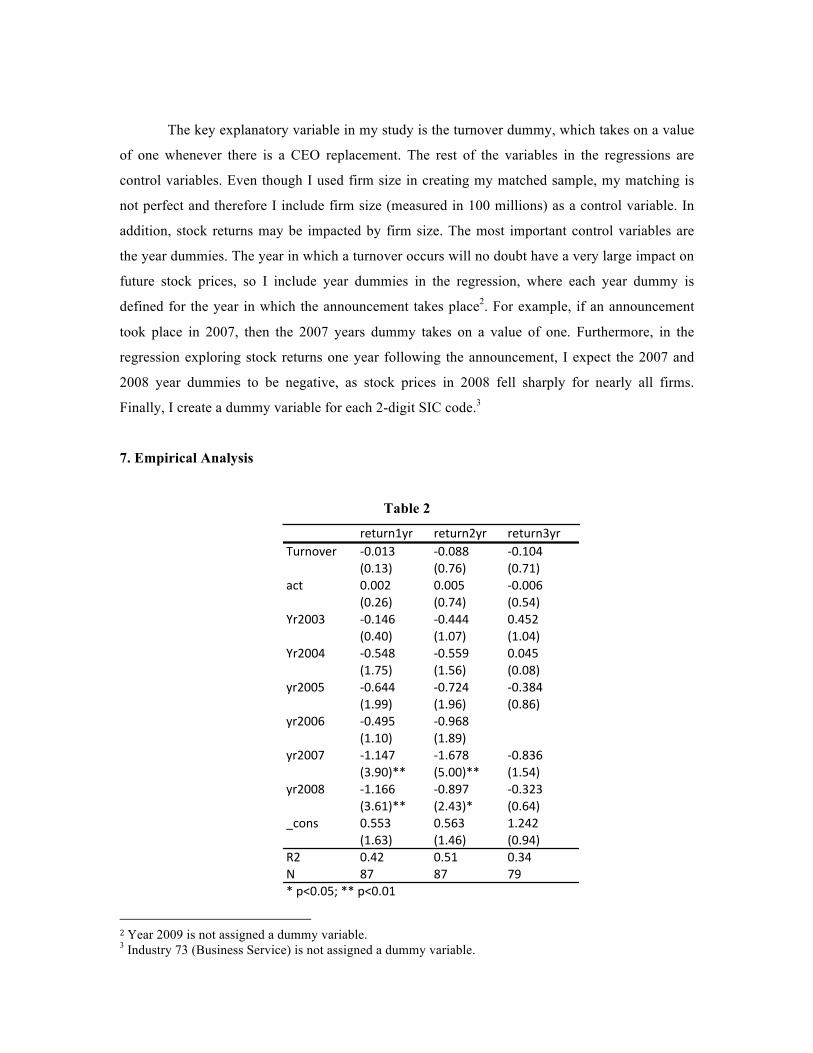
The key explanatory variable in my study is the turnover dummy, which takes on a value
of one whenever there is a CEO replacement. The rest of the variables in the regressions are
control variables. Even though I used firm size in creating my matched sample, my matching is
not perfect and therefore I include firm size (measured in 100 millions) as a control variable. In
addition, stock returns may be impacted by firm size. The most important control variables are
the year dummies. The year in which a turnover occurs will no doubt have a very large impact on
future stock prices, so I include year dummies in the regression, where each year dummy is
defined for the year in which the announcement takes place2. For example, if an announcement
took place in 2007, then the 2007 years dummy takes on a value of one. Furthermore, in the
regression exploring stock returns one year following the announcement, I expect the 2007 and
2008 year dummies to be negative, as stock prices in 2008 fell sharply for nearly all firms.
Finally, I create a dummy variable for each 2-digit SIC code.3
7. Empirical Analysis
Table 2
return1yr return2yr return3yrTurnover -0.013 -0.088 -0.104
(0.13) (0.76) (0.71)act 0.002 0.005 -0.006
(0.26) (0.74) (0.54)Yr2003 -0.146 -0.444 0.452
(0.40) (1.07) (1.04)Yr2004 -0.548 -0.559 0.045
(1.75) (1.56) (0.08)yr2005 -0.644 -0.724 -0.384
(1.99) (1.96) (0.86)yr2006 -0.495 -0.968
(1.10) (1.89)yr2007 -1.147 -1.678 -0.836
(3.90)** (5.00)** (1.54)yr2008 -1.166 -0.897 -0.323
(3.61)** (2.43)* (0.64)_cons 0.553 0.563 1.242
(1.63) (1.46) (0.94)R2 0.42 0.51 0.34N 87 87 79*@p<0.05;@**@p<0.01
2 Year 2009 is not assigned a dummy variable. 3 Industry 73 (Business Service) is not assigned a dummy variable.

In Table 2, I report results for equation (1) using three different dependent variables: 1
year, 2 years and 3 year returns. In all three regressions, the coefficient for the turnover dummy is
completely consistent with the summary statistics reported in Table 1. Since mean returns for
turnover firms are less than mean returns for non-turnover firms (in the summary statistics), I
expect a negative coefficient for the turnover dummy, and this is the case in all three regressions.
The negative coefficient is, however, in all cases statistically insignificant. With regards to
statistical significance, it is important to note that my sample is small and if I expand my sample
it may well be that these negative coefficients would be statistically significant.
It is also noteworthy that the point estimates for the turnover coefficient in the second and
third regressions are not trivial. In the second regression, the point estimate suggests that if a
company had a CEO replacement, in 2 years, the stock price return will be 8.8% lower than firms
in the matched sample. In the third regression, the point estimate suggests that in 3 years, the
stock price return will be 10.4% lower for the firms with turnover compared to their peers who
did not experience the replacement. The lower returns for turnover companies are very much in
line with the size of the gap in returns between turnover companies and the matching companies
in the summary statistics.
The asset size control variable is both statistically insignificant and quantitatively small.
All the year dummies are statistically insignificant except for 2007 and 2008 in the first and
second regressions, which have statistically significant and large negative coefficients. The large
negative coefficients in those years are expected, given the sharp declines in stock prices that
occurred in 2008 and 2009. To save space, I did not report the SIC dummies, and they are all
statistically insignificant.
8.Robustness
To test the robustness of my regression results, I use stock price one day after the
announcement instead of the price one day before the announcement when calculating the stock
return for 1, 2 and 3 year periods. Suppose the problems facing turnover firms are not fully
capitalized by the stock market because of incomplete information, firing the CEO could provide
the stock market new information that causes the price of the firm to decline immediately after
the announcement. Therefore, by comparing stock price several years after the announcement
and one day after the announcement, we will be able to analyze whether the successor CEO is
doing his job to improve the company performance once he takes office.
I run three regressions with the new dependent variable, and the results are in table 3.

Table 3
roreturn1yr roreturn2yr roreturn3yr Turnover -‐0.079 -‐0.154 -‐0.186
(0.62) (1.14) (1.07) act 0.004 0.008 -‐0.003
(0.5) (0.9) (0.24) yr2003 -‐0.245 -‐0.544 -‐0.267
(0.54) (1.13) (0.51) yr2004 -‐0.567 -‐0.578 -‐0.596
(1.45) (1.38) (0.9) yr2005 -‐0.601 -‐0.68 -‐0.96
(1.48) (1.58) (1.79) yr2006 0.12 -‐0.354
(0.21) (0.59)
yr2007 -‐1.142 -‐1.673 -‐1.451
(3.11)** (4.28)** (2.22)* yr2008 -‐1.153 -‐0.884 -‐0.929
(2.85)** (2.05)* (1.54) _cons 0.616 0.627 1.573
(1.46) (1.39) (0.99) R2 0.34 0.44 0.28 N 87 87 79
* p<0.05; ** p<0.01
The results from the robustness test are very similar to the original regressions, where the
turnover dummies are statistically insignificant and quantitatively large. It is worth noticing that
the point estimates for the turnover dummy are larger than those in the original regressions,
suggesting that the CEO replacement news will improve the stock price in a short time period
(immediately after the announcement); however, the shifted expectation cannot last into long run.
I also try tightening my criterion of defining outliers. Originally, I deleted companies that
have yearly returns over +500% or -80%, I have re-run the regressions after deleting companies
have yearly returns over +300% or -75% and have gotten very similar results.
9. Conclusions
In this paper, I seek to investigate the relationship between CEO firing and company
performance for up to three years after the announcement date. I employ a matched sample design
(matched by industry and size) to compare companies with and without CEO turnover. My
sample size, however, is limited. Through the years 2003-2009, I have 44 companies with
turnovers and 44 companies without turnovers. My OLS model uses the stock return as the
dependent variable, while the turnover dummy is my key explanatory variable. I find that the
estimated coefficient for the turnover dummy is negative in all cases and always statistically
insignificant. While the turnover dummy is statistically insignificant, the point estimates for the
turnover coefficient are quantitatively large in two of the regressions. If I were to expand my
sample, it is quite possible that the negative coefficients may become statistically significant.
At present, I cannot draw strong conclusions from my study, given the size of the sample.
However, my findings are consistent with a view that CEOs are fired at excessive rates, but not
totally consistent with Khurana and Nohria (2000), who concluded that CEO turnovers have
small but significant positive effects several years after. Nevertheless, my results are consistent
with previous studies that have concluded that firing the CEO has either an insignificant or a
negative effect on the company performance, and therefore I suggest the boards of directors
should seek other means to improve the company performance rather than firing the CEO and
hoping the successor will do a better job.
There are a number of improvements I would like to make to my research. In particular, it
is important to increase my sample size by including more CEO firings. A larger sample should
lower the standard errors and permit stronger conclusions concerning the impact of firing the
CEO on firm performance. I would use factiva.com to check the news on CEO resignations,
which should get me a more complete sample of CEO firing events.
Though limitations exist in my paper, my preliminary evidence suggests that firing CEOs
does not improve firm stock market performance. Therefore, given the high cost of replacing a
CEO, the board of directors should handle such replacement with great caution.
Reference Megginson, William L., and Kathleen A. Weiss, “Venture Capital Certification in Initial Public Offerings,” Journal of Finance, 46, 1991, pp. 879-903. Brown, James R., “Venture Capital and Firm Performance over the Long-Run: Evidence from High-Tech IPOs in the U.S.,” Journal of Entrepreneurial Finance and Business Ventures, 2005, pp. 1-33. Zald, M. N., and Berger, M. A., “Social movements in organizations: Coup d'etat, insurgency, and mass movements,” American Journal of Sociology, 83, 1978, pp. 823-861.
Grusky, O., “Managerial succession and organizational effectiveness,” American Journal of Sociology, 69, 1963, pp. 21-31.
Gamson, W. A., and Scotch, N., “Scapegoating in baseball”, American Journal of Sociology, 70, 1964 pp.69-72.
Taylor, L. A., “Why Are CEOs Rarely Fired? Evidence from Structural Estimation,” The Journal of Finance, 65, 2010, pp. 2051–2087.
Khurana, R., and Nohria, N., “The performance consequences of CEO turnover,” Working paper. 2000.
"Bargin Bosses." The Economists. September 2012. Print.

Appendix:
Complete Table 2
return1yr return2yr return3yr return4yr Turnover -‐0.013 -‐0.088 -‐0.104 0.129
(0.13) (0.76) (0.71) (0.64)
act 0.002 0.005 -‐0.006 0.010
(0.26) (0.74) (0.54) (0.71)
Yr2003 -‐0.146 -‐0.444 0.452 0.459
(0.40) (1.07) (1.04) (0.88)
Yr2004 -‐0.548 -‐0.559 0.045
(1.75) (1.56) (0.08)
yr2005 -‐0.644 -‐0.724 -‐0.384 -‐1.070
(1.99) (1.96) (0.86) (2.25)*
yr2006 -‐0.495 -‐0.968
0.087
(1.10) (1.89)
(0.13)
yr2007 -‐1.147 -‐1.678 -‐0.836 -‐0.934
(3.90)** (5.00)** (1.54) (1.85)
yr2008 -‐1.166 -‐0.897 -‐0.323
(3.61)** (2.43)* (0.64)
SIC28 0.383 0.621 -‐0.324 2.060
(0.81) (1.16) (0.24) (2.38)*
SIC20 0.340 -‐0.255
(0.35) (0.23)
SIC33 0.415 0.599 -‐0.878 1.868
(0.78) (0.98) (0.67) (2.29)*
SIC34 0.117 0.228 -‐0.795 0.596
(0.20) (0.35) (0.56) (0.58)
SIC35 0.034 0.120 -‐1.101 1.274
(0.08) (0.26) (0.73) (1.22)
SIC36 0.557 0.579 -‐0.684 1.494
(1.16) (1.06) (0.52) (1.78)
SIC38 -‐0.010 0.091 -‐1.245 0.800
(0.02) (0.15) (0.98) (1.32)
SIC39 0.093 0.384 -‐0.731 0.858
(0.18) (0.67) (0.51) (0.72)
SIC50 0.318 0.258 -‐0.995 1.661
(0.63) (0.45) (0.71) (1.85)
SIC53 -‐0.035 0.481 -‐1.694
(0.05) (0.63) (1.31)
SIC55 0.240 0.389 -‐0.823 1.369
(0.45) (0.63) (0.64) (1.64)

SIC58 0.305 0.831 -‐0.245
(0.58) (1.39) (0.18)
SIC70 0.500 -‐0.147 -‐0.726 0.810
(0.87) (0.22) (0.54) (0.82)
SIC73 0.178 0.146 -‐0.879 0.734
(0.41) (0.29) (0.65) (0.89)
_cons 0.553 0.563 1.242 -‐0.816
(1.63) (1.46) (0.94) (0.86)
R2 0.42 0.51 0.34 0.44 N 87 87 79 57 * p<0.05; ** p<0.01
Complete Table 3
roreturn1yr roreturn2yr roreturn3yr Turnover -‐0.079 -‐0.154 -‐0.186
(0.62) (1.14) (1.07) act 0.004 0.008 -‐0.003
(0.5) (0.9) (0.24) yr2003 -‐0.245 -‐0.544 -‐0.267
(0.54) (1.13) (0.51) yr2004 -‐0.567 -‐0.578 -‐0.596
(1.45) (1.38) (0.9) yr2005 -‐0.601 -‐0.68 -‐0.96
(1.48) (1.58) (1.79) yr2006 0.12 -‐0.354
(0.21) (0.59)
yr2007 -‐1.142 -‐1.673 -‐1.451
(3.11)** (4.28)** (2.22)* yr2008 -‐1.153 -‐0.884 -‐0.929
(2.85)** (2.05)* (1.54) SIC28 0.309 0.547 -‐0.04
(0.53) (0.87) (0.03) SIC20 0.03 -‐0.564
(0.02) (0.44)
SIC33 0.4 0.584 -‐0.536
(0.6) (0.82) (0.34) SIC34 0.058 0.169 -‐0.497
(0.08) (0.22) (0.29) SIC35 0.027 0.113 -‐0.749
(0.05) (0.21) (0.42) SIC36 0.509 0.531 -‐0.376

(0.85) (0.83) (0.24) SIC38 -‐0.366 -‐0.265 -‐1.246
(0.54) (0.37) (0.82) SIC39 0.079 0.37 -‐0.384
(0.13) (0.55) (0.23) SIC50 0.235 0.174 -‐0.719
(0.37) (0.26) (0.43) SIC53 -‐0.918 -‐0.403 -‐2.227
(1.09) (0.45) (1.44) SIC55 0.175 0.323 -‐0.535
(0.26) (0.45) (0.35) SIC58 0.258 0.784 0.068
(0.4) (1.13) (0.04) SIC70 0.379 -‐0.267 -‐0.493
(0.53) (0.35) (0.3) SIC73 0.13 0.098 -‐0.568
(0.24) (0.17) (0.35) _cons 0.616 0.627 1.573
(1.46) (1.39) (0.99) R2 0.34 0.44 0.28 N 87 87 79
* p<0.05; ** p<0.01
Top Related