


Languages
Pages
Legal


1
Baseline Survey of Minority Concentrated Districts
District Report
BARPETA
Study Commissioned by Ministry of Minority Affairs
Government of India
Study Conducted by
Omeo Kumar Das Institute of Social Change and Development: Guwahati
VIP Road, Upper Hengerabari, Guwahati 781036

2
ommissioned by the Ministry of Minority Affairs, this Baseline Survey was planned for 90 minority concentrated districts (MCDs)
identified by the Government of India across the country, and the Indian Council of Social Science Research (ICSSR), New Delhi coordinates the entire survey. Omeo Kumar Das Institute of Social Change and Development, Guwahati has been assigned to carry out the Survey for four states of the Northeast, namely Assam, Arunachal Pradesh, Meghalaya and Manipur. This report contains the results of the survey for Barpeta district of Assam. The help and support received at various stages from the villagers, government officials and all other individuals are most gratefully acknowledged. ■ Omeo Kumar Das Institute of Social Change and Development is an autonomous research institute of the ICSSR, New delhi and Government of Assam.
C

3
CONTENTS
INTRODUCTION........................................................................................................................ 3
METHODOLOGY........................................................................................................................ 8
TOOLS USED ............................................................................................................................... 9
BARPETA: A BRIEF PROFILE ................................................................................................ 10
1. AREA, LOCATION AND ADMINISTRATIVE SETUP............................................................................. 10 2. RESOURCE BASE .................................................................................................................................. 10
(a) Population and its Composition: ............................................................................................. 10 3. INFRASTRUCTURE................................................................................................................................ 13 4. BASIC AMENITIES................................................................................................................................ 13 5. HUMAN DEVELOPMENT INDEX AND RELATED VARIABLES ............................................................. 13 6. ECONOMY ............................................................................................................................................ 14
A PROFILE OF THE SAMPLE VILLAGES........................................................................... 15
1. POPULATION........................................................................................................................................ 15 2. FACILITIES............................................................................................................................................ 15
2.1. Electricity .................................................................................................................................... 15 2.2. Drinking water ........................................................................................................................... 15 2.3. Toilet facility.............................................................................................................................. 16 2.6. Other facility .............................................................................................................................. 16
3. VILLAGE ORGANISATION................................................................................................................... 17 4. CROP PRODUCTIVITY STATUS: ........................................................................................................... 17 5. INPUT STATUS FOR CULTIVATION:..................................................................................................... 17
5.1. Current inputs............................................................................................................................. 17 5.2. Capital inputs............................................................................................................................. 18
6. CREDIT ................................................................................................................................................. 18
6.1. Sources of credit ......................................................................................................................... 18 6.2. Households dependency on sources of credit ......................................................................... 18
7. MIGRATION ......................................................................................................................................... 19
8. EDUCATION ......................................................................................................................................... 19 9. HEALTH FACILITIES ............................................................................................................................. 19
9.1 ICDS.............................................................................................................................................. 20 10. DEVELOPMENT PROGRAMMES ......................................................................................................... 20 11. COMMON PROPERTY RESOURCES..................................................................................................... 20
RESULTS OF THE BASELINE SURVEY .............................................................................. 22
1. RELIGIOUS AND CASTE COMPOSITION............................................................................................. 22 2. MOTHER TONGUE ............................................................................................................................... 22 3. RELIGION, SEX AND AGE GROUP ...................................................................................................... 23 4. HOUSEHOLD SIZE................................................................................................................................ 23 5. MARITAL STATUS ............................................................................................................................... 24 6. EDUCATIONAL ATTAINMENT............................................................................................................. 24 7. OCCUPATION ....................................................................................................................................... 25 8. USUAL RESIDENTIAL STATUS ............................................................................................................ 26 9. LAND AND OTHER ASSETS................................................................................................................. 26
9.1 Cultivated Land: Ownership and Operational Holding ....................................................... 26
9.2 Livestock ...................................................................................................................................... 28 9.3 Ownership of Productive and other Assets ............................................................................ 28 9.4 Housing Status ............................................................................................................................ 30

4
9.5 Availability and access to safe drinking water...................................................................... 31
9.6 Sanitation and drainage facility .............................................................................................. 33 9.7 Sources of Fuel ............................................................................................................................. 34
9.8 Indebtedness ................................................................................................................................ 35 9.9 Current Educational Status (5-25 years of age)...................................................................... 37
10. FAMILY INCOME AND EXPENDITURE DURING LAST ONE YEAR.................................................... 39 11. EXPENDITURE OF THE SAMPLE HOUSEHOLDS DURING LAST ONE YEAR ..................................... 39 12. DISEASE AND HEALTH CARE............................................................................................................. 40 13. MATERNAL AND CHILD HEALTH..................................................................................................... 41
13.1 Immunisation of Children below 5 Years .............................................................................. 42
13.2 Delivery Care ............................................................................................................................. 43 14. POOR AND PDS SUPPORT ................................................................................................................ 44 15. AWARENESS AND PARTICIPATION .................................................................................................. 45
15.1 Awareness about government schemes .................................................................................. 45 15.2 Participation in the socio-political affairs........................................................................... 46
15.3 Conflict, insecurity and access to media and communication ........................................... 47 16. ASPIRATIONS..................................................................................................................................... 47
THE MAJOR DEVELOPMENT DEFICITS........................................................................... 49
LIST OF SURVEYED VILLAGES……...…………………………………………………...............52

5
LIST OF TABLES Table 2.1: Religion wise distribution of population Table 2.2: Workforce participation rate in Barpeta (per 1000 population) Table 2.3: Workers as a percentage of total population, Barpeta District Table 4.1: Distribution of sample households by religion and caste groups Table 4.2: Distribution of sample households by religion and mother tongue Table 4.3: Distribution of sample household population by religion, age and sex Table 4.4: Percentage distribution of sample household by household size Table 4.5: Marital Status as percentage of the total population by respective age group Table 4.5: Marital Status as percentage of the total population by respective age group Table 4.6: Religion and sex wise distribution of educational attainment Table 4.7: Percentage distribution of household by religion and main occupation Table 4.8: Percentage distribution of sample household population by religion, caste
and main occupation wise employment days Table 4.9: Percentage distribution of household population by religion and
residence Table 4.10: Size class wise classification of the sample households Table 4.11: Religion wise percentage distribution of households with livestock Table 4.12: Religion wise percentage distribution of households with financial assets Table 4.13: Religion and caste wise percentage distribution of housing status Table 4.14: Religion and caste wise percentage distribution of sample households
with number of rooms in the house Table 4.15: Religion and caste wise percentage distribution of lighting status in sample Table 4.16: Religion, caste wise percentage distribution of sources of drinking water Table 4.17: Religion and caste wise percentage distribution of sample households
with distance of source of drinking water Table 4.18: Religion and caste wise percentage distribution of toilets in households Table 4.19: Religion, caste wise percentage distribution of toilet types in households Table 4.20: Religion and caste wise percentage distribution for availability of
drainage facility in sample households Table 4.21: Religion, caste wise percentage distribution of sources of fuel in
households Table 4.22: Religion wise percentage distribution of indebtedness of households Table 4.24: Distribution of Sample indebted Muslim households by amount and
source of loan for single debt Table 4.25: Distribution of Sample indebted Muslim households by purpose and
amount of loan for single debt Table 4.26: Distribution of Sample indebted Hindu households by amount and
source (single debt) Table 4.27: Religion wise schooling status Table 4.28: Religion wise educational level Table 4.29: Distribution of households according to net income (during last one year) Table 4.30: Disease profile of the households with religious break-ups Table 4.31: Profile of sources of treatments for ailments Table 4.32: Percentage distribution of sample household population by religion and
place of residence

6
Table 4.33: Percentage distribution of children by agency of immunisation Table 4.34: Percentage of fully immunised children (below 5 years) by age and religion Table 4.35: Percentage distribution of reasons for not fully vaccinated children Table 4.36: Percentage distribution of children as per selected indicators Table 4.37: Percentage distribution of households by BPL status and receiving PDS Table 4.38: Percentage distribution of households by problem faced in accessing PDS Table 4.39: Percentage distribution of households by level of awareness and benefits Table 4.40: Percentage distribution of household by political and social participation Table 4.41: Percentage distribution of household by access to media

7
PART I
INTRODUCTION Issues relating to disparities across socio-religious communities have attracted much attention of the government of India of late. There is a growing realization about the relative backwardness of the religious minorities more particularly the Muslim as a religious community in India. The Sarchar Committee, which was instituted specifically to look into the relative deprivations of Muslims vis-à-vis other socio religious categories in various dimensions of development, in its report on “Social Economic and Educational Status of the Muslim Community of India”, exhibited deficits and deprivations of Muslims in all dimensions of development. Assam is among the four states with large Muslim population where according to the Committee the situation is grave. Therefore, there is a need to generate data to evaluate and address issues of Muslim backwardness in the state. In order to ensure that the benefits of schemes and programmes of government reach the relatively disadvantaged segments of society districts having a substantial minority population on the basis of backwardness parameters were identified. Based on 2001 Census, using two backwardness parameters, viz., (1) religion specific socio-economic indicators at the district level in terms of literacy rate; female literacy rate; work participation rate; and female work participation rate and (2) basic amenities indicators at the district level in terms of percentage of households with pucca walls, safe drinking water, electricity and w/c latrines, the Ministry of Minority Affairs identified 90 Minority Concentration Districts throughout the country which are falling behind the national average in these parameters. Of these 90 districts, 53 districts have both socio-economic and basic amenities below national average, 21 districts have socio-economic parameters below national average and 16 have basic amenities below national average. The basic idea is to formulate a multi-sectoral programme for the 90 MCDs which envisage for providing beneficiary oriented schemes to minorities and infrastructure development for the entire community in the districts. Against this backdrop the baseline survey in MCDs was conceived to
(a) identify how existing programmes are currently targeting these districts and on the basis of the assessment to develop special programmes to provide these facilities and ensure accessibility to them in the most backward areas in a faster way; and
(b) create socio-economic profiles of the targeted districts, and receive inputs that would help improve literacy rate, especially female literacy rate, and overall work participation rate, especially female work participation rate that have a significant impact on economic development.
The survey would more specifically try to identify the gaps in (1) availability of infrastructure like schools, health centers, ICDE centers and drinking water supply (2) housing and sanitation (3) critical linkages like rural road, ITIs, banking facilities, markets etc. and also (4) identification of artisanal income generating activities in which villagers have comparative advantage.

8
METHODOLOGY
The present survey has been confined to rural areas. Considering the availability of data Tehsil level information has been used for stratification purpose. Villages are taken as the first stage units (FSU) for the survey. However, before selection of sample villages, each district under the coverage was stratified first. All tehsils in a district were grouped into three strata in terms of minority population after arranging them in descending order of minority population. The grouping/stratification has been done in such a way so that the first stratum constitutes top 20 percent of tehsils, the second stratum constitutes middle 50 percent and the third/last stratum constitutes bottom 30 percent of tehsils in the arranged frame. The ranges vary in accordance with degree of concentration of minority population in respective districts. Depending upon the size of the district, 25 or 30 villages were selected from each district. 25 villages were chosen if the rural population of the district is below 5 lacs; otherwise 30 villages were chosen. The number of villages surveyed in each stratum was directly proportional to the share of each stratum/group of tehsils (according to population) to the district population, subject to a minimum allocation of 6 villages to each stratum. Required number of sample villages from each stratum have been selected as per the probability proportion to size (PPS) with replacement, size being total population of the village as per Census 2001. In case of household selection, complete listing of all households (by door to door visit) has been done in case of sample villages with less than 1200 population. However, in case of those villages with population 1200 or more, three or more hamlet-groups (hg’s) were formed in the village as per the practice followed by NSSO¹. From among them, a sample of 2 hg’s was selected for listing of households. The hg having maximum concentration of minority population was selected with probability 1. From among the remaining hg’s, one more hg were selected at random. The listing and sampling of households were independent for each selected hg. In each selected hg, the listed households were grouped into strata as per the minority status of the household. In other words, all Muslim households formed one second-stage stratum (SSS), all Christian households another SSS, and so on. About 30 households were selected in all from each sample village for detailed enquiry. These 30 households were allocated over 2 selected hg’s (if hg’s formed) and among the respective SSS in proportion to total number of households listed in the respective frames. A minimum of 2 households were allocated to an ultimate SSS. The required numbers of sample households from each SSS were selected by systematic random sampling without replacement (SRSWOR). In case of village having less than 30 households all the households were surveyed.

9
The rule followed by NSSO for forming hamlet-groups is Approximate present population no. of hamlet- of the village group to be formed 1200 to 1799 3 1800 to 2399 4 2400 to 2999 5 3000 to 3599 6 ……………. and so on Following the above methodology, total 30 villages of the district Barpeta were identified, and 30 households from each village was selected for the sample survey. The present report is based on the data gathered from the total 900 sample households of the district.
TOOLS USED Relevant data were collected with the help of (1) Rural Household Schedule and (2) Village Schedule. The rural household schedule tries to capture different dimensions of socio-economic and situational variables like employment, migration and occupation details, land and other assets, ownership of productive and other assets, livestock details, housing status, rural indebtedness, family income and expenditure, current educational status and skill training, aspiration of parents of current students, awareness and participation, local conflicts and loss of life and property, access to media and communication and general aspirations of the people. The village schedule tries to garner authentic data regarding the village. Information such as basic population data, facilities, village organizations, land use and land transfers, credit facilities, commuting and migration data, job and wage related information, information on individual beneficiary oriented programmes, data on education including physical facilities, health, different development programmes, common property resources, and the public distribution system prevailing in the rural areas. ■

10
PART II
BARPETA : A BRIEF PROFILE 1. Area, Location and Administrative Setup The present district of Barpeta formed an integral part of the Koch-Hajo and the Ahom Kingdom till the colonial annexation and it was carved out of erstwhile Kamrup district of Assam in July 1983. With total geographical area of 3245 square K.Ms, this district is bounded by international border i.e. Bhutan Hills in the North, Nalbari District in the East, Kamrup and Goalpara District in the South and Bongaigaon Disstrict in the West. Topographically, the district varies from low-lying plains to highland having small hillocks in the south-west corner. The climate of the district remains mild through out the year. The summer in the district is from March to May followed by monsoons till September and cool winter from October to February. The river Brahmaputra flows from east to west across the southern part of the district. The main tributaries that flow through Barpeta are Beki, Manah, Pohumara, Kaldia, Palla, Nakhanda, Bhelengietc.
Barpeta is well linked with both Bus and Railways. The nearest Railway Station is Barpeta Road, 21 K.M. from Barpeta Town. Barpeta Road is connected to all over Assam by National Highway No.31, North of the District Head quarter Town of Barpeta. Howly connects Barpeta with the National Highway which lies about 16 K.M. There are regular bus services between Barpeta and Guwahati.
The Barpeta district, headed by the Deputy Commissioner, has two sub-divisions – Barpeta and Bajali. The Barpeta sub-division, with headquarter at Barpeta town is divided into total six revenue circles while the Bajali sub-dision circle has three revenue circles. Further, the Barpeta sub-division has total 10 Rural Development Blocks to cater to the needs of total 857 villages, and the Bajali sub-division has only two Rural Development Blocks with 301 villages. The total number of Gaon Panchayat in the district is 150. Barpeta has total eight towns including Bahori (Census town) and (Sarupeta Revenue) town. While Barpeta and Barpeta Road, the two small but important towns of the district, are governed by Municipal Boards, the remaining small towns have Town Committees. 2. Resource Base (a) Population and its Composition: Barpeta ranks fourth in overall ranking among the districts population size in Assam. The present population of the district is 1647201 (Census 2001) with a density of population 508 per sq. KM. The district witnessed constantly higher decadal percentage variation in population than that of the state of Assam as a whole from 1901 to 1941.

11
Though it was lower than the state as a whole in the subsequent decades (except 1961-1971), the same for the decade 1991-2001 is 18.87. Witnessing quite a sluggish process of urbanization, the overwhelming majority of people in Barpeta live in the villages. More than 92 per cent of the total population in the district is rural as shown in Table1. In terms of religious composition, a little more than 40 per cent of the total population in the district is Hindu while the Muslim, the numerically strongest minority religious group in the district, alone constitutes more than 59 per cent of the total population. Due to historical reasons, the overwhelming majority of the urban population, however small it is, in the district, is Hindu while the Muslims constitute more than 58 per cent of the total rural population. As the table below reveals, the other minority communities constitute less than one per cent of the total population in the urban areas of the district.
Table 2.1: Religion wise distribution of population
Religion Residence Person As percentage of total population
All Religions Total 1647201 All Religions Rural 1520333 92.30 All Religions Urban 126868 7.70 Hindus Total 662066 40.19 Hindus Rural 552932 33.57 Hindus Urban 109134 6.63 Muslims Total 977943 59.37 Muslims Rural 961421 58.37 Muslims Urban 16522 1.00 Christians Total 5267 0.32 Christians Rural 4918 0.30 Christians Urban 349 0.02 Sikhs Total 258 0.02 Sikhs Rural 116 0.01 Sikhs Urban 142 0.01 Buddhists Total 194 0.01 Buddhists Rural 178 0.01 Buddhists Urban 16 0.001 Jains Total 690 0.04 Jains Rural 36 0.002 Jains Urban 654 0.04 Others Total 106 0.01 Others Rural 104 0.01 Others Urban 2 0.0001 Religion not stated Total 677 0.04 Religion not stated Rural 628 0.04 Religion not stated Urban 49 0.0030
Source: Census of India 2001
12
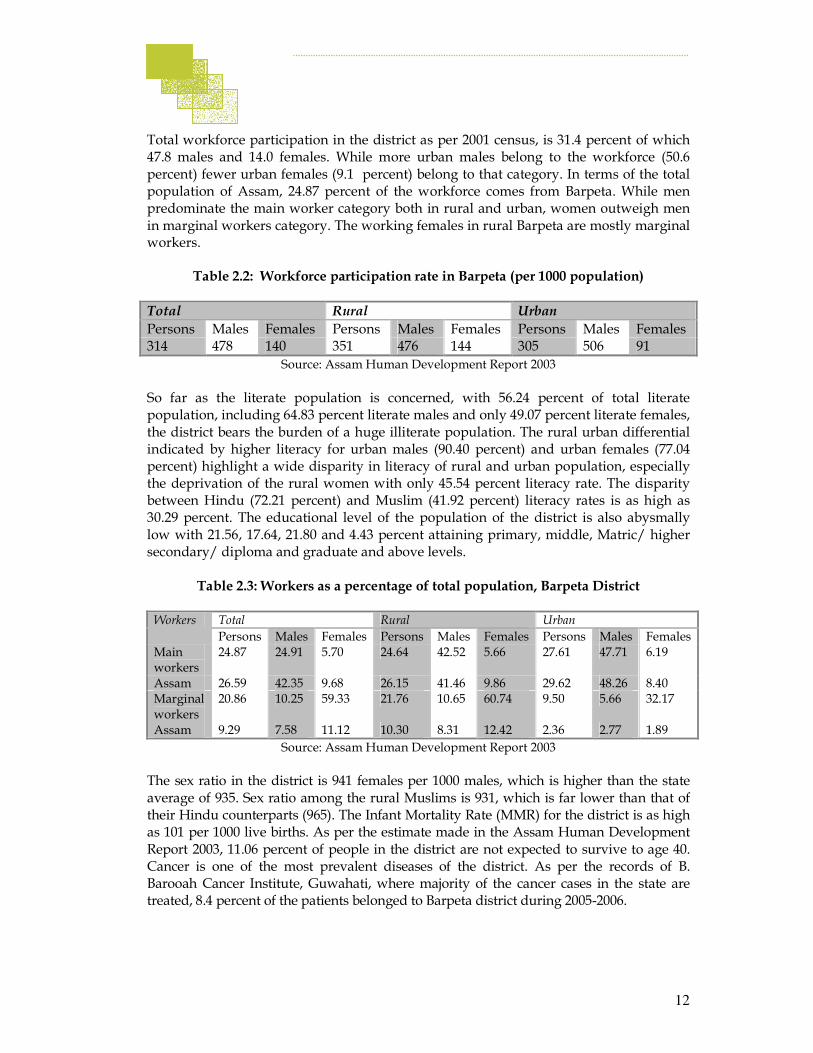
Total workforce participation in the district as per 2001 census, is 31.4 percent of which 47.8 males and 14.0 females. While more urban males belong to the workforce (50.6 percent) fewer urban females (9.1 percent) belong to that category. In terms of the total population of Assam, 24.87 percent of the workforce comes from Barpeta. While men predominate the main worker category both in rural and urban, women outweigh men in marginal workers category. The working females in rural Barpeta are mostly marginal workers.
Table 2.2: Workforce participation rate in Barpeta (per 1000 population)
Total Rural Urban
Persons Males Females Persons Males Females Persons Males Females 314 478 140 351 476 144 305 506 91
Source: Assam Human Development Report 2003
So far as the literate population is concerned, with 56.24 percent of total literate population, including 64.83 percent literate males and only 49.07 percent literate females, the district bears the burden of a huge illiterate population. The rural urban differential indicated by higher literacy for urban males (90.40 percent) and urban females (77.04 percent) highlight a wide disparity in literacy of rural and urban population, especially the deprivation of the rural women with only 45.54 percent literacy rate. The disparity between Hindu (72.21 percent) and Muslim (41.92 percent) literacy rates is as high as 30.29 percent. The educational level of the population of the district is also abysmally low with 21.56, 17.64, 21.80 and 4.43 percent attaining primary, middle, Matric/ higher secondary/ diploma and graduate and above levels.
Table 2.3: Workers as a percentage of total population, Barpeta District
Total Rural Urban Workers
Persons Males Females Persons Males Females Persons Males Females Main workers
24.87 24.91 5.70 24.64 42.52 5.66 27.61 47.71 6.19
Assam 26.59 42.35 9.68 26.15 41.46 9.86 29.62 48.26 8.40 Marginal workers
20.86 10.25 59.33 21.76 10.65 60.74 9.50 5.66 32.17
Assam 9.29 7.58 11.12 10.30 8.31 12.42 2.36 2.77 1.89
Source: Assam Human Development Report 2003
The sex ratio in the district is 941 females per 1000 males, which is higher than the state average of 935. Sex ratio among the rural Muslims is 931, which is far lower than that of their Hindu counterparts (965). The Infant Mortality Rate (MMR) for the district is as high as 101 per 1000 live births. As per the estimate made in the Assam Human Development Report 2003, 11.06 percent of people in the district are not expected to survive to age 40. Cancer is one of the most prevalent diseases of the district. As per the records of B. Barooah Cancer Institute, Guwahati, where majority of the cancer cases in the state are treated, 8.4 percent of the patients belonged to Barpeta district during 2005-2006.

13
Next to Morigaon this district has the highest number (41.2 percent) of girls getting married below age 18. So far as the maternal health is concerned, only 7.8 percent of the pregnant women received full antenatal care, 21.2 percent had institutional delivery and 28.2 percent safe delivery. As many as 24.8 percent of women who delivered a child suffered from post-delivery complications. Prevalence rates of contraception use are 59.3 percent. 3. Infrastructure The National Highway no 31 in the district covers a total length of 67 k.ms. The length covered by the PWD roads is 1400 k.m. The total length of railway lines is 47 k.m. and there are six railway stations in the district. The district has 1841 Primary (LP) schools, 225 Middle schools, 131 M.E. Madrassa, 40 M.V. schools, 160 high schools, 41 higher secondary schools, 18 government aided colleges and one each of Jawahar Navodaya Vidyalay, Kendriya Vidyalay, Vocational (ITI) and Law College. Total number of Banks in the district is 65. There are 371 SSI units, 371 Handicraft units, Agro industries 81, Industrial estate 1, Growth centre 1, and commercial estate 3. The district also has fisheries, handloom units and sericulture villages. 4. Basic Amenities As per the 2001 census 99.52 percent of the villages have access to safe drinking water. However, 26.2 percent of the villages are yet to be covered by electric power supply and only 3.90 percent of villages use electricity for agricultural purposes. While 92.09 percent of the villages have primary schools, 57.43 percent have middle schools and 30.47 and 3.42 percent of villages have secondary/senior secondary schools and colleges respectively. Altogether there are 5 hospitals,6 Community Health Centres (CHC), 9 Primary Health Centres (PHC) including MCH, 28 Mini PHC, 8 Dispensary, 1 TB chest clinic, 1 Leprosy center and 327 sub centres in the district of Barpeta. The number of hospital beds per 10,000 population is as low as 2 in the district. A close look at the villages indicates that Primary Health Centres exist in 3 percent of villages while 13.14 percent of villages have Primary Health Sub Centres. 26.19 percent of villages have post, telegraph and telephone facilities. Only 35.23 percent of the villages are connected through bus services. While approach roads are primarily mud roads, 44.66 percent of villages have paved approach roads. 5. Human Development Index and related variables With the Human Development Index of 0.396, which are below the HDI value for the state as a whole (0.407), Barpeta ranks 9th among the 23 districts in terms of capabilities to lead productive and satisfying lives. Although high in income index (6th rank), compared to the state average, its performance in education and health is abysmally low, ranking 20th and 15th among the districts. In terms of income index too the variation between the highest income district and Barpeta is 0.179. The Human Poverty Index

14
(22.83) calculated in the year 1999 indicate that a substantial number of people of this district are in human poverty, being deprived of opportunities to live a healthy and creative life. The Gender related Development Index for Barpeta in 2001 is estimated to be 0.448, which is below the state average of 0.537, ranking 10th in the state. The HDI-GDI rank (-1 rank) disparities indicate that women in this district suffer the double deprivation of low overall achievement in human development and lower achievement than men. 6. Economy The economy of the district is agrarian in nature with about 75 percent of the work force engaged in agriculture. The sectoral income share of the district shows that 71 percent of the income share accrues from agriculture. Around 67.2 percent of the total net cropped area is occupied by small and marginal farmers (SF/MF). The Agro-climatic condition of the district is conducive for growing various types of cereals, pulses, oil seeds, fiber crops, tuber crops and various types of summer and winter vegetables. Paddy, the main crop in the district, is grown in about 2.011 lakh ha area followed by mustard, pulses, wheat jute and various type of summer and winter vegetables and spices (chilli, onion etc.). The average area under HYV is about 1.343 lakh ha. which forms only 43 percent of the gross cropped area and the rate of fertilizer consumption is 34 kg./ha. This district ranks first in the state in the production of Potato and enjoys a virtual monopoly in production of rabi vegetables. Barpeta is also one of the major producers of fruits in the state. The secondary sector contributes 12 percent of the Gross District Domestic Product. The secondary sector comprises mainly the SSIs. The total number of SSIs in the district as is 1582. The district has been designated as Industrial growth centre. However, the pace of progress has been rather tardy. 82 percent of the SSI units are under handicraft while 18 percent are agro based. The district is industrially backward due to deplorable communication system, shortage in power supply and lack in marketing infrastructure etc. The district also has a fair amount of sericulture units. The district has a rich tradition of household industry comprising of bell and brass metal, pottery, wood craft, mask making, ivory carving, and traditional Assamese jewellery making which provides livelihood opportunities to some 5 percent of the working population in the district. The tertiary sector accounts for 17 percent of the Gross District Domestic Product. The comparative low share of the sector also indicates that the work force in other workers category in the district is also lower (38 percent). With 56.24 percent of total literate population, including 64.83 percent literate males and only 49.07 percent literate females, the district bears the burden of a sizeable proportion of illiterate population. The rural urban differential indicated by higher literacy for urban males (90.40) and urban women (77.04) highlight disparity in literacy of rural and urban population, especially the deprivation of the rural women with only 45.54 literacy rate. The educational level of the population of the district is also low with 21.56, 17.64, 21.80 and 4.43 percent attaining primary, middle, Matric/ higher secondary/ diploma and graduate and above levels. The sex ratio in the district is 941 females per 1000 males, which is higher than the state average of 935.

15
PART III
A PROFILE OF THE SAMPLE VILLAGES 1. Population The total population of the sample villages is 93771 with total households of 15970 as per 2001 census. The average household size of the sample villages is 5.87. The sex ratio of the sample households is estimated to be 932 females per thousand males which is less than the rural sex ratio of the district which stands at 938 females per thousand males. The percentage of scheduled caste population is 4.70 percent while ST population is 1.66 percent. 2. Facilities 2.1. Electricity Of the total 30 sample villages, 20 villages have electricity; seven villages have no electricity while three villages have been de-electrified. Although Census data reveals that 73 percent of villages in Barpeta are electrified, however, the field results of the sample findings show that only 66 percent of the sample villages have electricity. The village survey data shows that of the total houses with domestic connection in these villages, 22 percent are Muslims while rest 78 percent households are Hindus. Of the total commercial connection in the sample villages 76 percent are for Hindu establishments while share of Muslims is 24 percent. The average hours of electricity available in the villages has shown a steady increase. Average hours of electricity available in sample villages
Last year 5 years ago 10 years ago Average hours of
electricity available
8 6 5
2.2. Drinking water All the sample villages have drinking water facility. Distribution of common drinking water facilities shows that of the different sources 70 percent are private hand pumps. Tap water facilities account for only 8.4 percent of the sources. Among the Hindu households in the villages 82 percent have private tube wells and only 14 percent households fetch water from domestic tap water connection.

16
Among the Muslim households in the villages 49 percent have private hand pumps while there is no tap water connection or the Muslim households. 2.3. Toilet facility The sanitation status of the sample villages shows that 25 percent Hindu households have septic tank toilet facility while 6 percent use Kutcha latrines with tank facilities. Among the Muslim households in the villages 73 percent have soakage pit latrine and 2.3 percent have septic tank toilet facility. While 1.6 percent Muslim households have benefited under the TSC, the percentage of Hindu beneficiary household is only 0.4 percent. 2.6. Other facility
The locational status of the villages shows that 15 villages are located at an average distance of more than 5 kilometers from the Block headquarters. The survey shows that 6 villages have kutcha approach roads to block headquarter while 16 villages have pucca approach road; the rest of the 8 villages have semi pucca roads. The average distance of the nearest town from the sample villages is 13 km. 20 villages (66 percent) have pucca approach road to the villages. The connectivity status of the sample villages shows that only 3 villages reported bus services available with pucca roads. Of the 17 villages where bus services are available within a distance of 5 km.; 9 villages have pucca approach roads. Rest of the 10 villages has bus connectivity available at a distance of more than 5km from the villages, with only two villages reporting pucca approach road. None of the villages have railway connectivity, and the nearest railway station is located at an average distance of more than 10 km. The bus service is the chief mode of transportation for the sample villages. The availability of postal services in the villages has significant bearing not only on connectivity but also as a source of small saving opportunity for the village people. As reported 13 villages have post offices while for rest of the villages the postal services are available at a distance of more than 5 km. Survey shows that 2 villages have bank offices while for remaining sample villages the banks are available at an average distance of 5 km. An important factor for impoverishment of rural economy is the absence of market facilities. The survey results on availability of market facility shows that of the total sample villages 9 have regular markets within the village. For villages without regular markets the average distance was 5 km from the villages. The village mandis were available in 6 of the sample villages, 17 villages reported nearest mandi located within 5 km while for remaining 7 villages the mandis were at a distance of more than 5 km. 6 vilages were reported to have pucca approach road to the mandis. In order to ensure the food security of the rural

17
poor and vulnerable section, the PDS in the villages through fair price shops have been established. The survey shows that in as many as 28 villages fair price shops and general shops were available while for the remaining two villages the shops were available within a distance of 2 km. The location of GP offices has a direct impact o the availability of amenities within the villages. Of the total sample villages, GP offices were located in 7 villages. 3. Village Organisation The organizational activity within the village is an important determinant of overall soci-economic development. The data shows that except for political no other organization is very active in the sample villages. 4. Crop productivity status: The economy of Barpeta is agrarian with paddy as the major crop. The survey results of the sample villages indicate that paddy is the major crop produced in all the villages with 50 percent harvest share. The maximum market price fetched for paddy one year before the date of survey is Rs.1000 per quintal while the minimum price was Rs.220 among the sample villages. The district has virtual monopoly in potato production in Assam; however potato production was reported from five sample villages with 50 percent harvest share. Mustard is the other major crop produced in sample villages with 50 percent crop share. Jute which is an important cash crop is produced in 13 sample villages with a 50 percent harvest share. The maximum market price fetched for Jute is reported to be Rs. 1250. 5. Input status for cultivation: 5.1. Current inputs As reported, the sample villages have 18861 cultivators. Majority of the cultivators were found to have adopted modern agricultural practices. Of the total cultivators in the sample households, 15 percent using HYV reported adequacy of seeds supply while 1.13 percent faced inadequacy in supply. 32 percent of the cultivators using chemical fertilizer were found satisfied with the supply of fertilizers while 6.2 percent of the households complained of acute shortages during peak season. Pesticides were used by 34 percent of which 18 percent reported to shortage in supply during peak season. However, in respect of irrigation, only 0.53 percent of the households used canal irrigation and 50 percent reported acute shortage I the facility.

18
5.2. Capital inputs Investment and use of capital inputs along with other current inputs have positive impact in raising farm productivity. The village survey shows that of the total cultivators 9 percent have ownership of capital inputs while 66 percent of the cultivators use the same. Of the various inputs used, power tiller is used by the highest 40 percent of the cultivators from the sample villages. Inadequacy of irrigation facilities in the sample villages is well captured by the fact that of the total cultivators possessing some form of capital inputs, 77 percent is private pump sets used for irrigation which is used by 37 percent of the cultivators. Tractors are used 18 percent of the cultivators. The other capital inputs used are seed drill (0.40 percent), improved cattle livestock (0.25 percent) and pucca grain storage (2.4 percent). 6. Credit 6.1. Sources of credit Access and availability of timely institutional credit has been a foregone conclusion for relieving the distressed farmers from their indebtedness. Purpose wise break up of credit availed by the households in the sample villages show that 43 percent of the villages reported meeting sudden expenses as the main reason while in 37 percent villages households availed credit for both meeting sudden expenses and current cultivation cost. In only one sample village majority of the households reported availing credit for meeting current cultivation cost. Source wise distribution of credit shows that in 33 percent of the villages institutional sources along with landlords are the major sources of credit. Only in two of the sample villages, households availed loans from only institutional source. In 4 sample villages, money lenders were reported to be the only source for credit. Friends and relatives were reported to be major sources in 20 percent of sample villages. 6.2. Households dependency on sources of credit
The survey findings indicate that labours and small cultivators avail credit mostly from either money lenders or landlords mostly for meeting sudden expense and current cultivation cost. However, small farmers are also reported to have availed crop loan (current expenses) from institutional sources. The fact that the accessibility of institutional credit is concentrated in the large and medium farmers is found to be true in respect of the sample villages of the district. For artisans and other business households, institutional credit is the major source for financing their investment in machinery. The survey findings from the sample villages corroborate the same.
19
Notwithstanding the fact that concessional credit and priority sector lending over the years has increased the financial accessibility of rural households, it however remains a fact that marginal farmers and the labourers have remained outside the ambit of this financial inclusion. 7. Migration The survey data indicates that on average 1126 persons from the sample villages daily go to various places outside the village for work. Place wise distribution of work shows that majority of these persons go to either nearby villages or block headquarters or district headquarter for work. 8. Education Enrolment in the village in all the five grades is reported to be good by the village teachers. It was understood from interactions with the village teachers and other elders that enrolment in schools were much linked to the incentive of the mid-day-meal and that pupils drop out once the stage is over. The attendance data on the day of the visit was hard to be found as most of the schools had vacations after the examination. For daily commuting to the school majority of boys and girls go on foot and bicycle. While exclusive use of bus as a mode of transport was found among a small section of girls, it was absent among the boys. While most of the primary schools are located within the villages at a distance of less than 1 km, a small number of them are at a distance of 2-5 k.m. from the villages. Same is the case with the middle schools. However, high schools are often scattered, children having to travel between 2-5 km. Religious schools are also located within the villages in most of the cases. 9. Health facilities In more than half of the villages the Primary Health Sub-centres are located in less than one k.m. distance from the village, with kutchha approach roads, which are all whether roads. In half of the villages vehicle can ply to the PHSC in all whether conditions, while around one third of them are accessible by road only during the winter seasons. Most of the PHCs are located at a distance of more than 5 k.m. from the villages with kuchha approach roads. They are accessible on foot in all weather conditions but only partially accessible by vehicle during the winter months in around half of the villages. Although approach roads are pucca in case of the CHCs and Hospitals they are motorable only for a limited period of time during the winter months. Same is the case with the medicine shops, although they are better accessible than the health facilities. Thus, effectively the accessibility of the health services is severely constrained.

20
Besides the problem of accessibility inadequate facilities in the health centers were also reported. Although there are adequate numbers of ANMs in the sub center and in the PHCs, doctors were hard to be found. 9.1 ICDS
More than 70 percent of the ICDS programmes are housed in government buildings and rest are located in private buildings. Little more than quarter of the buildings is in good condition while one third of them are in bad condition and rests are average in nature. During the month prior to the survey in all these 26 villages combined, 699 mothers, 1638 children and 99 supervisors visited the facility. The level of satisfaction is stated to be satisfactory in all most all the cases. 10. Development programmes
Individual beneficiaries of the programmes during past 3 years
Type of Schemes
Hindu Muslim SC ST Total
SGRY 442 0 0 96 538
NREGA 127 293 0 0 420
PMGSY 10 0 0 0 10
IAY 121 525 24 15 656
Others 605 141 0 25 746 So far as the status of the government sponsored employment schemes during the past 12 months prior to the survey is concerned number of beneficiaries varies between the two religious communities. Altogether Rs. 6040130 was allocated under these schemes. While both men and women were reported to have earned same amount of money, men exceeded in far greater number in work participation. A substantial number of persons have received old age and widow pensions. 11. Common property resources
More the 65 percent of the villages’ forests are used but there is no specifically identified class of users. In about quarter of the villages forests are encroached. Village ponds are used in more than 70 percent of villages and mostly by the high caste population. More than 80 percent of villages report encroachment of village ponds. Pastures are also used in around 60 percent of the villages and there are almost no encroachments of these lands. Schools are used in all most all the villages and there is report of encroachment in more than 80 percent of the villages. Same is the case with the government buildings. ■
21
LIST OF THE SAMPLE VILLAGES
Village name T_HH T_P T_M T_F SC_P SC_M SC_F ST_P ST_M ST_F Pora Gaon 276 1716 844 872 0 0 0 0 0 0
Kaimari 346 2123 1064 1059 0 0 0 0 0 0
Khaira Bari 1686 9488 4963 4525 2314 1205 1109 0 0 0
Kala Bhanga 670 3549 1870 1679 693 384 309 7 4 3
Tenga Gaon 591 3129 1613 1516 0 0 0 0 0 0
Bhera 233 1361 706 655 0 0 0 0 0 0
Balapathar 549 3326 1754 1572 0 0 0 0 0 0
Chandmama Gaon
322 2070 1070 1000 0 0 0 0 0 0
Gopalpur 267 1570 811 759 0 0 0 0 0 0
Satra Kanara N.C. 3302 21531 11185 10346 352 195 157 0 0 0
Jahanar Gaon 210 1306 675 631 0 0 0 0 0 0
Citali 464 2522 1305 1217 0 0 0 0 0 0
Salekura 524 3150 1648 1502 184 92 92 0 0 0
Dakhin Godhani N.C.
386 2338 1216 1122 0 0 0 0 0 0
Itarbheta 654 3606 1884 1722 0 0 0 0 0 0
Bahmura 319 1921 996 925 202 115 87 0 0 0
Chakir Bhitha 472 2606 1351 1255 0 0 0 0 0 0
Kharadhara Pathar (Kharadhara)
297 1763 921 842 0 0 0 0 0 0
Roumari Pathar 318 1824 931 893 0 0 0 0 0 0
Burikhamar 236 1404 741 663 0 0 0 0 0 0
Barshala Bilar Pathar
38 213 107 106 0 0 0 0 0 0
Theka Gaon (Thekar Gaon)
178 887 447 440 0 0 0 0 0 0
Pipla (Piplala) 361 1948 972 976 0 0 0 0 0 0
Barbang 1011 5687 2936 2751 140 62 78 0 0 0
Bornalikuchi 300 1747 905 842 18 10 8 0 0 0
Hudukhata Pathar 199 1257 630 627 0 0 0 1014 503 511
Suk-Manah (Sukumanaha)
690 3940 2069 1871 0 0 0 0 0 0
Jalah 555 2935 1464 1471 28 16 12 533 243 290
Charna 365 2061 1060 1001 452 211 241 0 0 0
Batia Mari 151 793 393 400 20 10 10 0 0 0
Total 15970 93771 48531 45240 4403 2300 2103 1554 750 804
Source: Census, 2001

22
PART IV
PART IV
RESULTS OF THE BASELINE SURVEY 1. Religious and Caste Composition Religion as well as caste wise configuration of the 900 sample households of the district Barpeta is shown in Table 4.1. Altogether 70 per cent of the total sample households are Muslim, numerically the largest minority community in the district, while 30 per cent households are Hindu. In terms of caste, almost half of the total Hindu households belong to the general category.
Table 4.1: Distribution of sample households by religion and caste groups
Caste Religion Total
Hindu P.C. Muslims P.C. No P.C. SC 60 6.7 - - 60 6.7 ST 40 4.4 - - 40 4.4 OBC 42 4.7 - - 42 4.7
General 128 14.0 630 70 758 84.2 Total 270 30 630 70 900 100.0
2. Mother Tongue Witnessing an intrinsic relation with the religious composition, more than 54 per cent of the sample households in the district have reported Bengali as mother tongue. Nearly two-third of the total Muslim households reported Bengali as their mother tongue while about three per cent of the Hindu households responded in the same way. Assamese, the language that enjoys a dominating position in the state of Assam, is the mother tongue especially of the Hindus. Table 4.2 provides mother tongue wise distribution of the sample households in the district.
Table 4.2 Distribution of sample households by religion and mother tongue
Hindu
Muslims
Mother tongue
Total P.C. Total P.C.
Total P.C.
Assamese 204 22.7 145 16.1 349 38.8 Bengali 25 2.8 465 51.7 490 54.4 Hindi - - 2 0.2 2 0.2 Urdu 1 0.1 18 2.0 19 2.1 Others 40 4.4 - - 40 4.4 Total 270 30 630 70.0 900 100

23
3. Religion, Sex and Age Group As Table 4.3 demonstrates, 30 per cent of the sample households, the Hindus, constitute 27.6 per cent of the total population of the sample villages, while the Muslims constituting 70 per cent of the total households contribute to more than 72 per cent of the total population. If we consider the children up to the age of 10 for both the major religious categories separately, the children of this age group constitute 18.53 per cent of the total Hindu population, whereas the same for the Muslims is 26.83. This clearly indicates relatively a higher fertility rate among the Muslims of the district than that of the Hindus. Nevertheless, considering the population above the age of 55, it is 10.36 per cent for the Hindus and 7.36 per cent for the Muslims. This difference certainly indicates relatively a higher mortality rate among the Muslims, whatsoever may the causes. The situation of the Muslim women in this regard is much graver than the males if we consider the people above the age 45.
Table 4.3 Distribution of sample household population by religion, age and sex
Hindu Muslims
Sex Total Sex Total
Male Female Male Female
Count % of Total
Count % of Total
Count % of Total
Count % of Total
Count % of Total
Count % of Total
Age Upto 5 years
57 4.0% 48 3.4% 105 7.4% 264 7.1% 247 6.6% 511 13.7%
6-10 82 5.8% 76 5.4% 158 11.1% 301 8.1% 306 8.2% 607 16.3%
11-15 63 4.4% 60 4.2% 123 8.7% 253 6.8% 220 5.9% 473 12.7%
16-25 137 9.7% 133 9.4% 270 19.0% 365 9.8% 318 8.5% 683 18.3%
26-35 150 10.6% 159 11.2% 309 21.8% 308 8.3% 289 7.8% 597 16.0%
36-45 104 7.3% 90 6.3% 194 13.7% 212 5.7% 174 4.7% 386 10.4%
46-55 64 4.5% 49 3.5% 113 8.0% 130 3.5% 109 2.9% 239 6.4%
56-65 36 2.5% 45 3.2% 81 5.7% 84 2.3% 55 1.5% 139 3.7%
>65 35 2.5% 31 2.2% 66 4.7% 48 1.3% 45 1.2% 93 2.5%
Total 728 51.3% 691 48.7% 1419 100.0% 1965 52.7% 1763 47.3% 3728 100.0%
As the Census 2001 revealed, sex ratio of the district (941) is better than that of the state as a whole. However, Table 4.3 witnesses a disturbing difference. If we look at the situation of both the religious communities separately, the sample survey reveals, the sex ratio for the Hindus in the sample is 949, which is much better than the district or the state average, while the same for the Muslims is only 897. A close look at the above table would reveal that the sex ratio for the Muslims in the age group of 16 to 25 (869) and then the people above the age 45 (798) is low. The low sex ratio for the age group of more than 45 years indicates considerably higher mortality rate of the Muslim woman than that of man. 4. Household Size Table 4.4 reveals, about 53 per cent of the sample households have less than five members including a sizeable number of the Muslims. Nevertheless, more than one third of the total sample households, especially the Muslims, are relatively bigger having 6 to

24
10 members. It has been noted that nuclear families are much more conspicuous than joint families in the sample villages. The large family sizes among the Muslims corroborate the high fertility behaviour of the group. The preponderance of the child population among the Muslims is also indicative of the high fertility rate and the corresponding large family sizes among the Muslims.
Table 4.4 Percentage distribution of sample household by household size
Hindu Muslim Total Household size
<5 members 20.0 32.8 52.8 6-10 members 8.6 34.3 42.9 >11 members 1.6 2.7 4.3 Total 30.2 69.8 100
5. Marital Status As evident from Table 4.5, the practice of early marriage is more prevalent among the Muslims. Besides having considerably a high percentage of married people in the 16 to 25 age group, there are instances of divorce. The table further substantiates that the incidence of divorce and separation is higher in the minority religious community than the Hindus. Table 4.5 Marital Status as percentage of the total population by respective age group
Hindu Muslim Age
Un-married
Married Wid-owed
Divorce
Unmarried Married
Widowed Divorce
Total
11-15 20.6 78.7 0.7 100 16-25 22.1 6.1 0.1 39.9 31.2 0.2 0.4 100
26-35 9.2 24.6 0.3 7.3 58.1 0.2 0.3 100 36-45 2.8 29 1.5 0.2 1.2 63 1.6 0.7 100
46-55 0.6 27.3 4.2 65 2.6 0.3 100 56-65 28.6 8.2 0.5 54.5 8.2 100
>65 0.6 28.3 12.6 1.3 46.5 10.7 100
6. Educational Attainment Excluding the children below the school going age, though some of them go to the private schools mushrooming even in the remote villages, a little more than five per cent of the Hindu population of the sample households is illiterate while the same ratio for the Muslims is almost 22 per cent. Undoubtedly, the literacy scenario in the sample villages is found better than the district average given in the 2001 Census, it is confined mainly up to the level of matriculation. Table 4.6 provides the details of the educational scenario of the sample villages, and evidently, the situation of the minority community is worse than others.

25
Table 4.6 Religion and sex wise distribution of educational attainment
7. Occupation The occupational data of the sample households has been shown in Table 4.7. It is evident from the table that a sizeable section of the rural households in the district depends more on several production and related works than agriculture.
Table 4.7 Percentage distribution of household by religion and main occupation
Main occupation Hindu Muslims Total
Professional, Technical 2.85 2.43 5.28 Administrative 0.56 0.63 1.18 Clerical 1.74 1.04 2.78 Business 6.04 6.60 12.64 Service 4.79 2.92 7.71 Farmer - any kind 5.00 19.31 24.31 Production and related work 5.97 29.31 35.28 Not defined 1.67 7.78 9.44 Casual Labour 0.63 0.00 0.63 Domestic 0.69 0.00 0.69 Carpenter 0.07 0.00 0.07 Total 30.00 70.00 100.00
Industry wise distribution of the main workforce of the sample villages reveals that more than 35 per cent of the households earn their livelihood from several activities such as both agricultural and non-agricultural based manufacturing (13 percent), construction (more than 5 percent, especially the Muslim labourers), wholesale and retail trades (more than 6 percent), transport, storage and communication (more than 5 percent) and other similar works. Although a small fragment of the main workers reported as casual
Hindu Muslim Education level
Male Female Male Female Illiterate 1.9 3.2 9.8 11.8 Below primary 0.6 0.6 4.3 4.1 Primary 2.2 2.1 10.6 8.7 Middle 3.7 3.3 5.7 4.2 Vocational 0.03 0.2 0.2 0.3 Matriculation 3.1 2.6 4.5 3.3 HSS 1.6 1.4 1.4 0.8 Technical diploma below degree 0.1 0 0.0 0 Technical/Professional degree 0.1 0.1 0 0 Graduate (General) 1.1 0.5 0.9 0.2 Post graduate (General) 0.3 0.1 0.2 0 Others 0 0 0.1 0.1 Total 14.73 14.1 37.70 33.5

26
worker, majority of the workers put in the ‘Not defined’ (9.44 percent) category of the table can be considered as casual worker. Relatively a less prominent place occupied by agriculture as the main occupation in the district is primarily due to small size of holding. Yet, one fourth of the total households depend exclusively on agriculture. As Table 4.8 reveals, the main occupation generates less than 100 employment days in a year for more than 14 per cent of the households. Similarly, for about 12 per cent of the households, the main occupation generates between 100 t0 180 employment days. It amounts to say that underemployment is a phenomenon that deserves serious attention. Table 4.8 Percentage distribution of sample household population by religion, caste
and main occupation wise employment days
Hindu Muslim Employment days main occupation
SC ST OBC General OBC General
<100 days 0.3 0 0.3 0.7 0.1 1.9
100-180 days 0.3 1.3 1.8 1.9 0.1 11.8
181-260 days 2.4 1.7 0.9 3.9 0.1 30.3
261 days 2.5 1.5 1.9 8.9 0.1 25.6
Total 5.5 4.5 4.9 15.4 0.4 69.6
8. Usual Residential Status The overwhelming majority of the sample households are the resident of their respective villages. Only 2.5 per cent and about two per cent of the households have members who are temporary migrant (approximately 3 to 8 months out) and long term migrant (out for 9 or months) members. The figures are given in Table 4.9. Table 4.9 Percentage distribution of household population by religion and residence
Place of residence Hindu Muslims Total
Resident 25.5 69.9 95.4
Temporary migrant 1.05 1.4 2.5
Long term migrant 1.21 0.7 1.9
Daily commuters 0.28 0 0.3
9. Land and Other Assets 9.1 Cultivated Land: Ownership and Operational Holding The table below provides a synoptic view of the pattern of land distribution among the 900 sample households of the district. It has been found that nearly five per cent of the total sample households, mostly Muslims, are absolutely landless. The small homestead land they have is also not owned by them, generally government land.
27
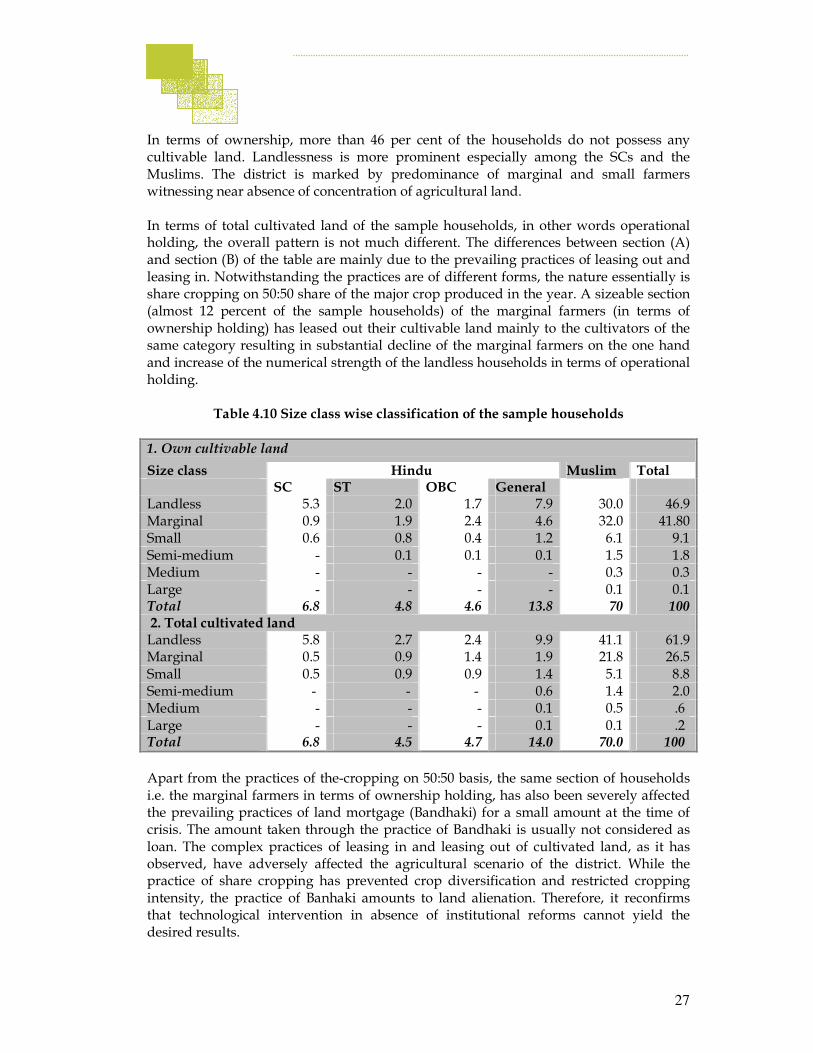
In terms of ownership, more than 46 per cent of the households do not possess any cultivable land. Landlessness is more prominent especially among the SCs and the Muslims. The district is marked by predominance of marginal and small farmers witnessing near absence of concentration of agricultural land. In terms of total cultivated land of the sample households, in other words operational holding, the overall pattern is not much different. The differences between section (A) and section (B) of the table are mainly due to the prevailing practices of leasing out and leasing in. Notwithstanding the practices are of different forms, the nature essentially is share cropping on 50:50 share of the major crop produced in the year. A sizeable section (almost 12 percent of the sample households) of the marginal farmers (in terms of ownership holding) has leased out their cultivable land mainly to the cultivators of the same category resulting in substantial decline of the marginal farmers on the one hand and increase of the numerical strength of the landless households in terms of operational holding.
Table 4.10 Size class wise classification of the sample households
1. Own cultivable land
Size class Hindu Muslim Total SC ST OBC General Landless 5.3 2.0 1.7 7.9 30.0 46.9 Marginal 0.9 1.9 2.4 4.6 32.0 41.80 Small 0.6 0.8 0.4 1.2 6.1 9.1 Semi-medium - 0.1 0.1 0.1 1.5 1.8 Medium - - - - 0.3 0.3 Large - - - - 0.1 0.1 Total 6.8 4.8 4.6 13.8 70 100 2. Total cultivated land Landless 5.8 2.7 2.4 9.9 41.1 61.9 Marginal 0.5 0.9 1.4 1.9 21.8 26.5 Small 0.5 0.9 0.9 1.4 5.1 8.8 Semi-medium - - - 0.6 1.4 2.0 Medium - - - 0.1 0.5 .6 Large - - - 0.1 0.1 .2 Total 6.8 4.5 4.7 14.0 70.0 100
Apart from the practices of the-cropping on 50:50 basis, the same section of households i.e. the marginal farmers in terms of ownership holding, has also been severely affected the prevailing practices of land mortgage (Bandhaki) for a small amount at the time of crisis. The amount taken through the practice of Bandhaki is usually not considered as loan. The complex practices of leasing in and leasing out of cultivated land, as it has observed, have adversely affected the agricultural scenario of the district. While the practice of share cropping has prevented crop diversification and restricted cropping intensity, the practice of Banhaki amounts to land alienation. Therefore, it reconfirms that technological intervention in absence of institutional reforms cannot yield the desired results.

28
9.2 Livestock The pattern of distribution of livestock among the sample households has been shown in Table IV.9. More than 77 per cent of the sample households rear cock/hen/duck and about 58 per cent of the households have milch animals. In most of the cases, the product is for household consumption.
Table 4.11 Religion wise percentage distribution of households with livestock
Hindu Muslim Total Livestock possession SC ST OBC General Total
Milch Animal 4.6 4.1 5.4 15 29.1 28.8 57.9 Draught Animal 1.8 2.8 3.4 4.9 12.9 17.6 30.5 Young Cattle 3.6 1.8 4.1 10.8 20.3 19.2 39.5 Goats 3.6 2.1 3.9 9.3 18.9 26.1 45.0 Sheep 0.3 0 0.3 0.3 0.9 9.8 10.7 Cock/Hen/Duck 2.3 4.4 4.9 8.2 19.8 57.9 77.7 Pigs 0.5 3.6 0 0.3 4.4 - 4.4
9.3 Ownership of Productive and other Assets 9.3.1 Agricultural Implements Witnessing an extremely low level of mechanization of the agriculture, the asset base of the sample households is poor. Of the total sample households, only 242 (27 percent) have reported to have plough, 32.2 per cent of them are Hindu while 67.8 per cent of the households with plough are Muslims. It appears that bullock cart is almost absent. Only a little more than one per cent of the household, mostly Hindus, have bullock cart. Out of the total 900 sample households, only two Hindu households have tractor. Only six households have power tiller, and five of them are Muslim households. Only one Muslim household, out of the total sample households, has threshing machine. Despite rigorous implementation of the Sallow Tube Well Programme in the state, only 43 households are found to have pump set and 39 of them are Muslim households. 9.3.2. Transport Bicycle is the most convenient mode of transport in the villages; altogether 67 percent of the sample households have a bicycle. About 8 per cent of the sample households have Scooter/ Motor Cycle, while only four households, three of them are Hindu, have a car. In addition, one Hindu household has Jeep and two others have truck. 9.3.3. Non-Agricultural machinery/implements: Only two non-agricultural implements are found in the sample villages. Weaving being a tradition of the Hindu Assamese women, total 87 households have handloom. The second, 28 Hindu households and 9 Muslim households have sewing machines.
29
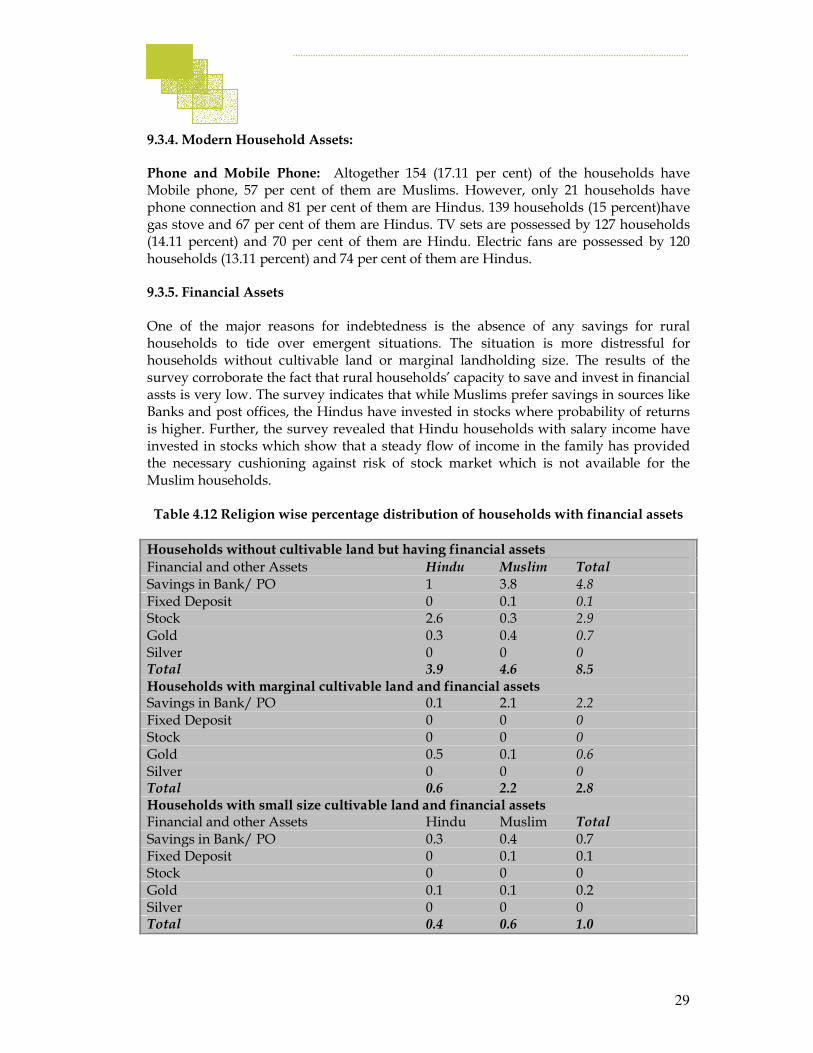
9.3.4. Modern Household Assets: Phone and Mobile Phone: Altogether 154 (17.11 per cent) of the households have Mobile phone, 57 per cent of them are Muslims. However, only 21 households have phone connection and 81 per cent of them are Hindus. 139 households (15 percent)have gas stove and 67 per cent of them are Hindus. TV sets are possessed by 127 households (14.11 percent) and 70 per cent of them are Hindu. Electric fans are possessed by 120 households (13.11 percent) and 74 per cent of them are Hindus. 9.3.5. Financial Assets One of the major reasons for indebtedness is the absence of any savings for rural households to tide over emergent situations. The situation is more distressful for households without cultivable land or marginal landholding size. The results of the survey corroborate the fact that rural households’ capacity to save and invest in financial assts is very low. The survey indicates that while Muslims prefer savings in sources like Banks and post offices, the Hindus have invested in stocks where probability of returns is higher. Further, the survey revealed that Hindu households with salary income have invested in stocks which show that a steady flow of income in the family has provided the necessary cushioning against risk of stock market which is not available for the Muslim households. Table 4.12 Religion wise percentage distribution of households with financial assets
Households without cultivable land but having financial assets
Financial and other Assets Hindu Muslim Total Savings in Bank/ PO 1 3.8 4.8 Fixed Deposit 0 0.1 0.1 Stock 2.6 0.3 2.9 Gold 0.3 0.4 0.7 Silver 0 0 0 Total 3.9 4.6 8.5 Households with marginal cultivable land and financial assets Savings in Bank/ PO 0.1 2.1 2.2 Fixed Deposit 0 0 0 Stock 0 0 0 Gold 0.5 0.1 0.6 Silver 0 0 0 Total 0.6 2.2 2.8 Households with small size cultivable land and financial assets Financial and other Assets Hindu Muslim Total Savings in Bank/ PO 0.3 0.4 0.7 Fixed Deposit 0 0.1 0.1 Stock 0 0 0 Gold 0.1 0.1 0.2 Silver 0 0 0 Total 0.4 0.6 1.0

30
The data for the households with marginal and small size cultivable land (Table 4.12) reveal that a very small proportion of the households possessing marginal and small size land holding have financial assets. The survey revealed poor agricultural income earning leavs no cash at hand for investment. This reflects the reason for increasing indebtedness among the marginal and small land holding households and distressful economic condition of these households. 9.4 Housing Status An important indicator of economic status of a household is the type of house and the facilities available. The distribution of housing status among the sample households (Table 4.13) reveals that percentage of Muslim households with house ownership is higher than the Hindus. However, majority of the households with house ownership among the Muslims live in kutcha types which reflect the poor living conditions of the community. In respect of households with ownership and living in semi-pucca houses, the share of Muslim sample households is higher across caste-wise Hindu population. However, in respect of ownership of pucca houses the survey indicates that although a higher proportion of Hindus live in pucca houses, however, most of the Hindu households belonging to backward and scheduled castes fare worse than the Muslims in respect of living in pucca houses. Although the survey indicates equal share of opportunities among the Hindus and Muslims in respect of government provided houses, the overall housing conditions of the Muslims in the sample is worse than the socially disadvantaged Hindu population.
Table 4.13 Religion and caste wise percentage distribution of housing status
Housing Status Type of House Religion/ Caste Own Govt.
provided Rented Kutcha Semi-Pucca Pucca
SC 4.9 0.9 0 4.1 1.2 0.4 ST 4.5 0 0 3.7 .7 0.1 OBC 4.7 0 0 3.1 1.1 0.4 General 14.7 0.2 0.1 6.7 3 5.4 Hindu Total 28.8 1.1 .1 17.6 6.0 6.5 Muslim 68.1 1.1 .7 61.3 6.6 2.0 Total 96.9 2.2 0.8 78.9 12.6 8.5
The availability of living space for sample households (Table 4.14) indicate that while more than 10.3 percent of the Muslims live in houses with one room which is higher than the caste wise population distribution for the Hindu however, the availability of living spaces by number of rooms per family shows that 18 percent of Hindu households live in houses with 2-3 rooms while 41.9 percent of Muslims live in houses with 2-3 rooms. The availability of living space by rooms per family is higher among the Muslims than the Hindus. This difference in the housing space is due to the large average family size among the Muslims. While majority (34.3 percent) of the Muslim households in the sample have a family size of 6-10 members, only 8.6 percent of the Hindus have family size of 6-10 members.

31
Table 4.14 Religion and caste wise percentage distribution of sample households with
number of rooms in the house
Hindu Muslim Number of rooms SC ST OBC General Total OBC General Total
1 0.6 0.6 0.7 0.9 2.8 0 10.3 10.3
2 2.2 1.6 2.5 4.4 10.7 0.3 21.8 22.1
3 1.5 1 0.9 3.9 7.3 0.1 20.1 20.2
4 0.7 0.7 0.6 2.7 4.7 0 10.8 10.8
5 0.6 0.3 0 1.9 2.8 0 3.7 3.7
5-10 0.3 0.3 0.1 1.3 2 0 2.5 25
>10 0 0 0 0 0 0 0.1 0.1
Total 5.9 4.5 4.8 15.1 30.3 0.4 69.4 69.7
Although the survey indicate higher proportion of Muslims have ownership houses and availability of living space by number of rooms per family, however, in respect of housing amenities of electrified houses only 5.1 percent of Muslims have domestic connections while the corresponding figure for Hindus is 12.5 percent. This is in consonance with census data 2001 which indicate that the use of electricity for lighting purpose is less in he Muslim households. However, a comparative picture with socially backward Hindu households reveals that only 3.2 percent of socially backward Hindu households have domestic connection. In respect of other sources of lighting, significantly enough, majority of Muslim households use oil lamps while oil lamp with other sources while the Hindus including the socially backward classes use oil lamps with other sources. The use of lantern as seen from the table (Table 4.15) as the only source of lighting is negligible among sample households which indicates that kerosene is sparingly used as a source of lighting. Table 4.15 Religion and caste wise percentage distribution of lighting status in sample
Houses electrified
Sources of lighting Religion/ Caste
Yes No Oil Lamp
Lantern Oil lamp with lantern and petromax and others
Others
Hindu Total 12.5 17.7 5.6 0.1 17.9 0.1 SC 1.7 4.1 1.2 0 4.6 0 ST 0.8 3.7 1.1 0.1 3.0 0.1
OBC 0.7 4.0 1.1 0 3.9 0 General 9.3 5.8 2.3 0 6.4 0
Muslim Total 5.1 64.7 42.7 0.1 33.4 0
9.5 Availability and access to safe drinking water Availability and access to safe drinking water has been one of the basic objectives under ACRWSP. As per the census 2001 data, 99 percent of the total villages in Barpeta district have safe drinking water. While availability is one issue, more basic concern is the access

32
to safe drinking water. The results of the household survey reveal that 90 percent of the sample households have access to safe drinking water of which 27.5 percent belong to Hindus and 62 percent are Muslims. The hand pump is the major source of drinking water for the sample households across all religious and caste group in the sample. While no Muslim households have tap water connection, a very small marginal proportion of 0.1 percent of SC household has tap water connection. The data survey indicates that in respect of provision of water supply by the government the socially disadvantaged and religious minorities (Hindu-SC and Muslims) have enjoyed equal opportunity of access. Muslims have higher access to the public water sources vis-à-vis the socially backward Hindu households. A further desegregated analysis of the data (Table 4.16) shows that of the total 10 percent of the sample households who use drinking water from unsafe sources, 7.8 percent are Muslims while only 1.8 percent are Hindus from socially backward classes. Significantly most of the households using unsafe drinking water have their own dug well left unprotected which indicate lack of awareness on health and use of safe drinking water.
Table 4.16 Religion, caste wise percentage distribution of sources of drinking water
Hindu Sources of drinking water
SC ST OBC General Total
Muslim
Tap in dwelling unit 0.1 0 0 0 0.1 0 Public stand post 0.3 0 0 0 0.3 0.3 Own hand pump 4.2 3.7 3.3 11.5 22.7 53.1 Public hand pump 0.6 0.1 0.4 1.0 2.1 5.9 Own protected dug well 0.1 0.2 0.3 1.7 2.3 1.7 Own unprotected dug well 0 0 0.2 0.4 0.6 0.4 Public protected dug well 0 0 0 0 0 1.0 Public unprotected dug well 0 0 0 0 0 0.6 Pond, river, stream 0 0 0.1 0 0.1 0.8 Others 0.4 0.5 0.6 0.4 1.9 6.0 Total 30.1 69.8
The availability of drinking water within short distance has significant bearing on time use of household women as they carry water from different sources to their houses. The survey data indicates that 73.5 percent of the sample households have drinking water sources within a distance of less than 10 m. The results indicate that 64.6 percent of the households with drinking water source of less than 10m belong to Muslims which obviously can be correlated with high proportion of the households with own hand pump among the Muslim households. However, one percent of the sample households which belong to Muslims also reported their drinking water sources at distance of 200-500 metres which shows that within the religious group itself there exists levels of discrepancy in respect of availability and distance of safe drinking water.

33
Table 4.17 Religion and caste wise percentage distribution of sample households with
distance of source of drinking water
Hindu Muslim Distance code SC ST OBC General Total OBC General Total
<10 m 1 0 1.7 4.9 7.6 0.3 64.6 64.9
10-50 m 2.1 0.7 1.7 4.9 9.4 0.3 10.1 10.4
50-100 m 0 0.7 0.3 1 2 0 3.1 3.1
100-200 m 0.3 0 0.3 0.3 0.9 0 0.3 0.3
200-500 m 0 0 0 0 0 0 1 1
Total 19.9 79.7
9.6 Sanitation and drainage facility An important requirement for sanitation is the presence of toilet facilities. Almost half the Muslim households in India lack access to toilets; this proportion is higher in rural areas. The sample results indicate that while 31 percent of the surveyed households have in house toilet facilities 69 percent use toilet facilities outside the house. Of these 31 percent, Hindu households comprise 12 percent and Muslims 19 percent. Further, 37 percent of the sampled Muslim households use pit latrine while only 5 percent of the Muslim households use sanitary latrine. Further 23 percent of Muslim households use open field for toilet facilities. A comparative picture across caste groups of SC, ST and OBC shows that access to toilet facilities is better than that of both SCs/STs and OBCs which is corroborates the trends at the national average. This may be because of greater Muslim concern for privacy, especially amongst women. Table 4.18 Religion and caste wise percentage distribution of toilets in households
Hindu Toilet Facilities
SC ST OBC General Total
Muslim
In House 1.9 1.7 1.3 6.8 11.7 19.1 Outside 3.9 2.8 3.4 8.4 18.5 50.8 Total 30.2 69.9
Table 4.19 Religion, caste wise percentage distribution of toilet types in households
Hindu Toilet Facilities SC ST OBC General Total
Muslim
Septic tank latrine 1.2 0.2 0.5 6.4 8.3 4.9 Water sealed in dwelling unit 0.1 0.1 0.1 0.9 1.3 0.1 Pit latrine 2.2 0.1 0 2.3 4.6 37.0 Covered dry latrine 0.4 0 0.7 1.6 2.7 3.4 In the field 0.8 0.9 0.7 1.4 3.9 22.9 Others 1.6 3.4 2.9 2.9 10.7 0.1 Total 30.2 69.9

34
An important determinant of hygienic living condition is availability, access and use of drainage facility. The absence of civic amenities like drainage is one of the major problems for maintaining a clean environment. The survey findings show that availability of drainage facility in the sample villages is marginal. The poor percentage of Muslim households having drainage facilities can be well explained by the fact that of the total Muslim population, 27 percent are illiterate while 37 percent are either illiterate or have education below primary level. However, desegregated data shows that socially backward Hindu households fare worse than the Muslims in respect of hygienic living conditions in the house which is mainly due to the unhygienic socio-cultural living conditions. Table 4.20 Religion and caste wise percentage distribution for availability of drainage
facility in sample households
9.7 Sources of Fuel Clean fuel for cooking is important for health. It is a serious consideration for women who, in most cases, are burdened with the task of cooking. As per Census 2001 data, just about 60 percent of all rural households in the country do not use any of the modern fuels such as LPG, electricity or even kerosene. The non-use of these fuels for cooking increases as the share of Muslims increases, more so when the village size increases as well. The results of the survey findings corroborate the national trends in the sampled minority concentrated Barpeta district. Table 4.21 Religion, caste wise percentage distribution of sources of fuel in households
Hindu Sources of Fuel SC ST OBC General Total
Muslim
Wood 0.7 0.9 1.9 2.5 6.0 34.1 Kerosene Oil 0 0 0.1 0.1 0.2 0.3 Hay/leaves 1.7 1.1 0.9 1.7 5.4 9.1 Cow dung 0 0 0 0 0 0.1 Gobar gas plant 0 0 0 0.1 0.1 0 LPG 0.9 0.8 0.6 6.0 8.3 5.1 Wood and coal 0 0 0 0 0 0.7 Wood and Kerosene oil 2.5 1.5 1.2 3.3 8.5 20.2 Kerosene oil and LPG 0.1 0.2 0 1.6 1.9 0.1 Total 30.4 69.7
Religion/
Caste Availability of drainage facility
Yes No Total
SC 0.3 5.9 6.2
ST 0.5 4.6 5.1
OBC 0.3 5.0 5.3
General 1.4 14.8 16.2
Hindu 2.5 30.3 32.8
Muslim 1.3 65.9 67.2

35
9.8 Indebtedness The incidences of indebtedness among the sample households show that 72 percent of the sample households were currently not indebted. As indicated earlier, the amount taken through Bandhaki system is not considered as loan. A religion wise examination of the total indebted households reveals that 30 percent were Hindus while 70 percent were Muslims.
Table 4.22 Religion wise percentage distribution of indebtedness of households
Number of loans Total Religion Caste
No loan One loans Two loans Three loans
SC 4.6 1.1 0.1 0.1 5.9 ST 3.3 0.9 0.1 0.1 4.5 OBC 2.9 1.8 0.0 0.0 4.7 General 11.0 3.5 0.4 0.0 14.9
Hindu
Total Hindu 21.8 7.2 0.7 0.2 30.0 OBC 0.4 0.0 0.0 0.0 0.4 General 50.4 16.3 2.1 0.8 69.6
Muslim
Total Muslim 50.9 16.3 2.1 0.8 70.0 Table Total 72.7 23.5 2.8 1.0 100.0
Source wise incidence of the indebtedness reveals while professional money lenders are the major sources of borrowing for Muslims, Hindus have availed loans from Cooperative banks and Government which indicates poor accessibility of religious minorities in availing loans from cheap sources. However, access to bank credit for Muslim indebted households gives a better picture compared to Muslims.
Table 4.24 Distribution of Sample indebted Muslim households by amount and source of loan for single debt
Source Less than 5000
5001 to 10000
10001 to 20000
More than 20000
Total
Muslim Households Government 0.49 0.49 1.94 2.92 Commercial Bank 0.49 1.94 0.49 0.97 3.4 Gramin Bank 0.97 0.49 1.94 2.43 Cooperative bank 1.46 1.46 0.49 1.95 Insurance 0.49 0.49 SHG/NGO 6.80 1.94 0.49 2.43 Traders 1.94 0.97 0.97 0.97 2.91 Professional money lenders 13.59 9.71 1.94 3.88 15.53 Agrl. Money lender 1.94 0.97 0.97 Landlord/Employer 0.49 0.49 0.49 0.98 Friends/Relatives 1.94 2.43 1.94 0.49 4.86 Others 0.97 0.97

36
Hindu Households Government 0.50 1.00 1.5 Commercial Bank 2.40 2.4 Gramin Bank 0.50 1.00 1.5 Cooperative bank 4.90 1.00 1.00 0.50 7.4 Provident fund 0.5 1 1.5 SHG/NGO 5.80 1.00 6.8 Traders 0 Professional money lenders 1.50 0.50 0.50 2.5 Agrl. Money lender 0.50 0.5 Friends/Relatives 1.00 2.40 1.50 1.00 5.9 Others 0.50 0.5 1
Purpose wise incidence of indebtedness among sample households reveal that while Muslims incur debt for farm business and medical treatment, for the Hindus, the major reason for indebtedness is medical treatment and other household expenditure.
Table 4.25 Distribution of Sample indebted Muslim households by purpose and amount of loan for single debt
Purpose Less than 5000
5001 to 10000
10001 to 20000
More than 20000
Total
Capital expenditure in farm business
3.86 4.83 1.45 2.90 13.04
Capital expenditure in non-farm business
0.48 4.35 0.48 2.90 8.21
Purchase of land/house 1.45 1.45 - 1.45 4.35 Repairs of Residential house 2.90 0.48 - 1.45 4.83 Marriage and other social events 1.93 2.42 1.45 - 5.8 Education - 0.48 0.48 - 0.96 Medical treatment 9.18 2.90 1.93 1.93 15.94 Repayment of old debt 0.97 - 0.48 0.48 1.93 Other household expenditures 7.73 1.93 0.48 - 10.14 Purchase of consumer durables - 0.48 - - 0.48 Purchase of livestocks 0.48 0.97 - - 1.45 Others 0.97 - 0.48 0.48 1.93

37
Table 4.26 Distribution of Sample indebted Hindu households by amount and source
(single debt)
Purpose Less than 5000
5001 to 10000
10001 to 20000
More than 20000
Total
Capital expenditure in farm business
1.00 0.50 1.40 2.9
Capital expenditure in non-farm business
0.50 0.50 1.00 2
Purchase of land/house 1.00 0.50 1.00 2.5 Repairs of Residential house 0.50 1.00 1.5 Marriage and other social events
2.40 1.00 0.50 0.50 4.4
Education 0.50 0.5 Medical treatment 3.90 1.00 0.50 5.4 Other household expenditures
3.90 1.00 0.50 0.50 5.9
Purchase of consumer durables
0.50 1.00 1.5
Purchase of livestock 0.50 0.50 1 Financial investment 0.50 0.50 1 Others 1.00 0.50 1.00 0.50 3
Size class wise distribution of indebtedness show that there exist no difference between Muslims and the Hindus and majority of indebted households have loan size of less than Rs.5000. This clearly indicates the gap in access to cheap rural credit for minorities from cooperatives and government agencies and financial inclusion of Muslims therefore is critical particularly for farm investment. The relatively high incidence of indebtedness for medical treatment indicates that absence of critical government support for curative treatment has added to the distressful situation among the rural households particularly the Muslims. It has been found that only 2.8 per cent and one per cent of the indebted households have taken second and third respectively. The sources, amount, purposes of the subsequent loan are same with that of the first one. 9.9 Current Educational Status (5-25 years of age) 9.9.1 Details of Students Out of the total population belonging to the age group 6 to 25 (total 1763), the table below provides schooling status. The drop out rate after enrolment is high among the Muslims. It is worth noting that nearly 88 per cent of the students are found to be in the government school and regular.

38
Table 4.27 Religion wise schooling status
Schooling status Hindu Muslim Total
Left after enrolment 1.2 2.6 3.8 Enrolled but does not go to school
0.8 1.9 2.7
Goes to informal institution
0.2 0.7 0.9
Enrolled in govt. school and is regular
19.1 68.8 87.9
Goes to private school
2.0 1.9 3.9
Others 03 0.5 0.8 Total 23.6 76.4 100.0
As Table 4.27 reveals, the level of educational attainment is highly concentrated at the primary and the middle level. It is therefore, evident that there is a considerably high drop out at these levels, and it is more conspicuous among the Muslims. More than 50 per cent of the drop out is primarily for work at home and need to earn. For eight per cent, drop out is due to failure in exams. However, it is worth noting that for more than 20 per cent cases, fees and other cost involved in education is the primary cause. The government assistance received, including response of the drop outs, is mainly books and mid-day meal. There are a very few instances of scholarship confined only to the Hindu students.
Table 4.28 Religion wise educational level
Level of education Religion Total
Hindu Muslim Below primary 1.4 10.5 11.9 Primary 7.0 34.8 41.9 Middle 8.5 17.8 26.3 Management/commercial school 0.8 0.8 Metric/HE school /Secondary 4.1 8.5 12.6 HSS/Pre-university/Intermediate 2.0 1.8 3.8 Pre-graduate diploma or certificate below degree
0.1 0.1 0.1
Degree equivalent to graduation 0.3 0.6 0.9 Post graduate degree/Diploma 0.3 0.3 0.6 Technical degree 0.1 0.1 Total 24.1 75.9 100.0

39
10. Family Income and Expenditure during Last One Year Income level of the sample households during last one year has been shown in Table 4.29. It is evident from the table that more than 58 per cent of the sample households can be considered as the people below the poverty line with net annual income less than 22801. About 53 per cent of the total Hindu Households can be characterized as BPL, while nearly 59 per cent of the Muslim households can be considered as the same. Only 5 per cent of the Hindu households belonging to the general caste group have relatively higher net annual income. Table 4.29 Distribution of households according to net income (during last one year)
Net Income Hindu Muslim
SC ST OBC General OBC General
Less than 19200
2.2 1.8 2.6 4.3 0.2 21.7
192001-22801 1.1 0.9 1.3 1.8 19.6 22801-28800 0.4 0.1 0.2 1.6 0.2 10.3 28801-36000 0.6 0.2 0.1 1.0 6.8 36001-48000 0.7 0.3 0.2 1.3 5.7 48001-72000 0.8 1.1 0.2 5.0 5.5
In case of the overwhelming majority, the major source of income for the households is their main occupation agriculture. It has, nevertheless, been found that agriculture in the district has been marked predominantly by the traditional practices, and therefore, this occupation has not been considerably remunerative. 11. Expenditure of the Sample Households during Last One Year The summary of expenditure of the sample households except for expenditure on food items i.e. cereals and pulses, and vegetables, milk, meat, spices, sugar etc. are given in below. A little more than 11 per cent of the sample households spent less than Rs. 6000 on cereals and pulses during last one year while 67 per cent of the households spent more than Rs. 9000 for the same. Variation between the two main religious communities is not much, yet, considerably a high percentage of the Hindu households spend more on cereals and food than the Muslims because of the food habit. It has been found that average consumption of cereals among the Hindus is usually higher than the Muslims. Expenditure during last one year on vegetables, milk, meat, spices, and sugar etc for more than 91 per cent of the households was more than Rs. 9000, and there is no remarkable difference between the two religious communities. Expenditure of the households on medical has been found to be low. About 19 per cent of the households spent less than Rs.500 on medical and about 12 per cent spent more than Rs.2100. Expenditure for about 8 per cent of the households on electricity and gas during last one year has been up to Rs.1000 while such expenditure for less than one per cent of the household is more than Rs.20000. Expenditure on telephone for about 82 per cent of the

40
households during last one year has been up to Rs.1000, while the same for about three per cent of the households is more than Rs.24000.
12. Disease and health care Common ailments and their treatment are very crucial for addressing the issue of development, particularly of the poor and the marginalised. Ailments not only affect life and livelihood of the rural poor by directly reducing the man-days of work. It also drains away substantial portion of limited income of the households. The burden of health care thus hinders the development approach and is therefore one of the crucial development issues which the state must recognise. Off late there has been a growing consensus about health as a right of the people. All these entail health as a vital component of the present survey. Fever is the most prevalent disease reported by both Hindu and Muslim households. Next in order of high prevalence rates are fever, malaria, stomach pain, TB, and diarrhoea, pregnancy related diseases, cough and cold and so on. What is worrisome is that except ear disease and jaundice in all other ailments Muslims outweigh the Hindus. Striking difference is seen in case of Malaria, fever and diarrhoea.
Table 4.30 Disease profile of the households with religious break-ups
Percentage distribution of the households reporting diseases*
Diseases Hindu Muslim Total (Rank)
Hindu-Muslim percentage differences
Diarrhea 1.39 7.64 9.03(4) -6.25 Ear disease 0.93 0.46 1.39(11) 0.47 Stomach pain 3.47 7.87 11.34(3) -4.4 Female diseases 0.69 4.4 5.09(7) -3.71 Dysentery 2.08 2.55 4.63(8) -0.47 Pregnancy related
1.85 6.25 8.10(5) -4.4
TB 0.69 2.08 2.78(10) -1.39 Jaundice 1.85 1.62 3.47(9) 0.23 Cough & Cold 3.01 4.63 7.64(6) -1.62 Fever 10.65 18.52 29.17 (1) -7.87 Malaria 3.01 14.35 17.36(2) -11.34 Total 70.37 29.62 99.99
* 703 households reported about disease prevalence

41
Table 4.31 Profile of sources of treatments for ailments
Percentage distribution of the households receiving treatment for ailments Treatment received Hindu Muslim Total
(Rank) Hindu-Muslim percentage differences
Government hospital
18.3 30.0 48.4 -11.7
Pvt. Medical practitioner
10.7 21.7 32.5 -11.0
Govt. & Pvt. Both 3.3 6.9 10.2 -3.6 Traditional 0.7 2.4 3.1 -17 Homeopathy 0.1 0.3 0.4 -0.2 NGO health worker
0.1 0.1 -0.1
Home treatment 2.0 2.0 -2.0 Quake 0.1 0.1 -0.1 Others 1.7 0.3 2.0 1.4 Total 34.8 63.7 98.8
It could be seen that government hospitals are the main source of treatment for both Hindus and Muslims but Muslims also rely on traditional treatments, home treatments and also quacks. Table 4.32 Percentage distribution of sample household population by religion and
place of residence
Place of residence Hindu Muslims Total
Resident 25.5 69.9 95.4
Temporary migrant 1.05 1.4 2.5
Long term migrant 1.21 0.7 1.9
Daily commuters 0.28 0 0.3
13. Maternal and Child Health Ever since the Independence, the Government of India has been seriously attempting to improve the maternal and child health conditions and services in the country. The programmes targeted towards this end date back to the First Five Year Plan (1951-56) which include a widely diversified array of benefits and services for people, particularly for the rural poor. The Ministry of the Health and Family Welfare is also sponsoring various specific projects under the Maternal and Child Health Programme, including Oral Re-hydration Therapy (ORT) programme, Universal Immunisation Programme, Polio Eradication Programme, Maternal and Child Health Supplement Programmes. In 1996 all these programme components were merged into single Reproductive and Child Health Programme (RCH). Besides, in 1976, the Department of Women and Child Welfare, under the Ministry of Human Resource and Development launched Integrated

42
Child Development (ICDS) Programmes. Under the ICDS scheme, anganwadi centres were supposed to provide children with health, nutrition and education services from birth to six years of age and a nutritional and health related services to pregnant and breastfeeding mothers. 13.1 Immunisation of Children below 5 Years Immunisation of children against the six vaccine-preventable diseases, namely tuberculosis, diphtheria, whooping cough, tetanus, polio and measles is vital for child health as it reduces infant and child mortality rates. Differences in vaccination coverage among population subgroups based on different characteristics including religion are useful for programme planning and targeting resources to areas most in need. Besides, this is particularly useful for evaluating the Expanded Programmes on Immunisation (EPI) in the state.
Table 4.33 Percentage distribution of children by agency of immunisation
Religion Agency Total
Govt. agency Private
Hindu 22.14 22.14 Muslim 77.10 0.76 77.86
Total 99.24 0.76 100.00
Children who receive one dose of BCG and measles and three doses of DPT and Polio, excluding Polio dose 0 are considered as fully immunised. The present baseline survey shows that percentage of children fully immunised is very marginal in the sample population. The coverage ratio is below the national average of 44 percent (NFHS-3, 2005-06). It is also lower than the state average of 14 percent (for all) and 12.3 percent for rural (NFHS 2, Assam, 1998-99). It also goes to show almost no improvement in the situation so far as the immunisation coverage is concerned. It would be worthwhile to recall that the National Family Health Survey 2, Assam State Report 1998-99 observed and expressed concern over the decline in the rate of vaccination coverage from 19 to 14 percent during the period of 1992-93 and 1998-99. It is also significant that across religion, the coverage is lower in case of Muslims than Hindu. This however is in conformity with the national trend which reveals that coverage is 36.3 percent in case of Muslims compared to 44.4 percent for Hindus. Another interesting fact to note is a few cases of faulty administration of vaccines as a few children were found to be given all vaccines before the age of 4 months, which indicates a serious lack so far the quality of service delivery and administration is concerned.
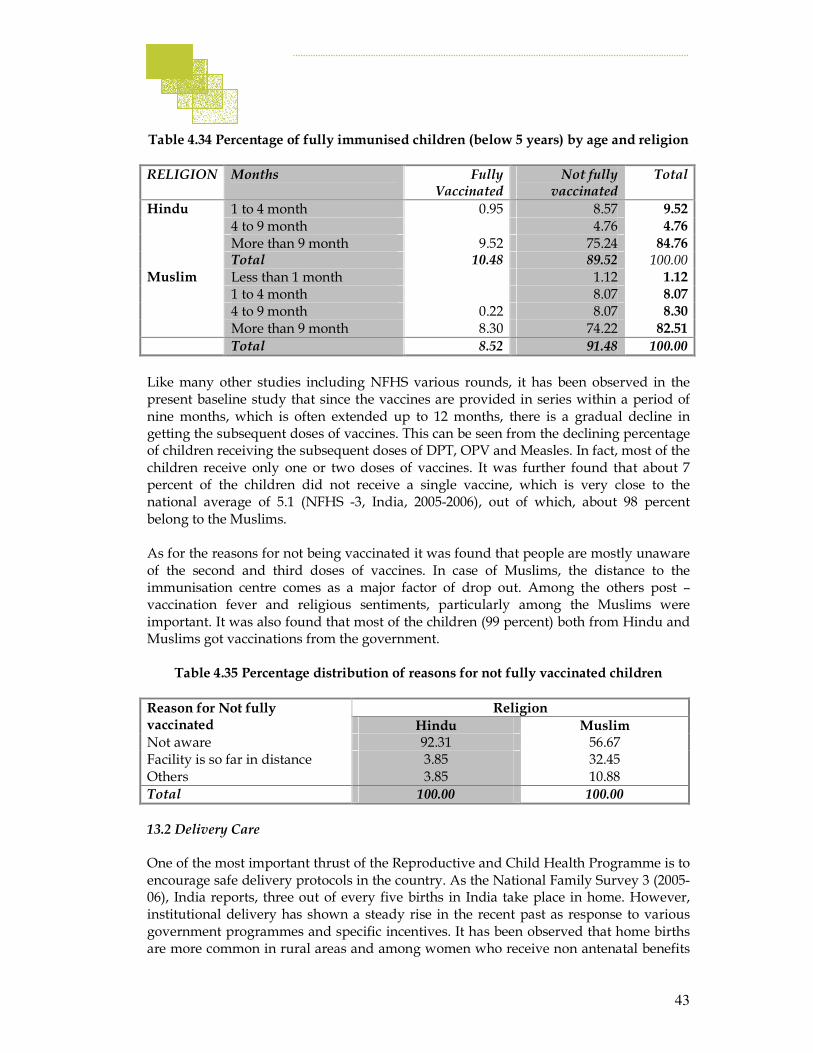
43
Table 4.34 Percentage of fully immunised children (below 5 years) by age and religion
RELIGION Months Fully Vaccinated
Not fully vaccinated
Total
Hindu 1 to 4 month 0.95 8.57 9.52
4 to 9 month 4.76 4.76
More than 9 month 9.52 75.24 84.76 Total 10.48 89.52 100.00 Muslim Less than 1 month 1.12 1.12 1 to 4 month 8.07 8.07 4 to 9 month 0.22 8.07 8.30
More than 9 month 8.30 74.22 82.51
Total 8.52 91.48 100.00
Like many other studies including NFHS various rounds, it has been observed in the present baseline study that since the vaccines are provided in series within a period of nine months, which is often extended up to 12 months, there is a gradual decline in getting the subsequent doses of vaccines. This can be seen from the declining percentage of children receiving the subsequent doses of DPT, OPV and Measles. In fact, most of the children receive only one or two doses of vaccines. It was further found that about 7 percent of the children did not receive a single vaccine, which is very close to the national average of 5.1 (NFHS -3, India, 2005-2006), out of which, about 98 percent belong to the Muslims. As for the reasons for not being vaccinated it was found that people are mostly unaware of the second and third doses of vaccines. In case of Muslims, the distance to the immunisation centre comes as a major factor of drop out. Among the others post –vaccination fever and religious sentiments, particularly among the Muslims were important. It was also found that most of the children (99 percent) both from Hindu and Muslims got vaccinations from the government.
Table 4.35 Percentage distribution of reasons for not fully vaccinated children
Religion Reason for Not fully vaccinated Hindu Muslim Not aware 92.31 56.67 Facility is so far in distance 3.85 32.45 Others 3.85 10.88
Total 100.00 100.00
13.2 Delivery Care One of the most important thrust of the Reproductive and Child Health Programme is to encourage safe delivery protocols in the country. As the National Family Survey 3 (2005-06), India reports, three out of every five births in India take place in home. However, institutional delivery has shown a steady rise in the recent past as response to various government programmes and specific incentives. It has been observed that home births are more common in rural areas and among women who receive non antenatal benefits

44
and care and with no education. Safe motherhood requires increase in the institutional births, access to trained and qualified birth attendants and increase in educational status and wealth entitlement of the rural people.
Table 4.36 Percentage distribution of children as per selected indicators
Indicator Religion
Hindu Muslim
Govt. Hospital 8.37 9.57 Private Hospital 3.35 2.15
Where born last child
At Home 8.13 68.42 Doctor 11.72 12.44 Trained Midwife/ASHA
1.44 4.31
Untrained Dai 6.22 60.05
Who assisted in the delivery
Others 0.48 3.35 Yes 15.48 49.52 Was pre and post natal care
provided No 4.76 30.24 Yes 5.44 31.70 Whether benefited from ICDS
No 24.40 38.46
The present baseline indicates that in most of the cases deliveries are taking place at home. This is particularly high in Muslim families. This trend is in conformity with the findings of the NFHS 3 (2005-2006). In the case of sample families home delivery is found to be above the national average of 51.3 percent. In Assam, as reported by the NFHS 2, 1998-99 the institutional delivery is about 12 percent, which is almost same as the present baseline. As such dependency on untrained dais is evident from the study. Similarly very few women were seen to receive pre and post natal care. The benefits of the ICDS scheme are found to be utterly insignificant. People also feel that the benefits of the ICDS have remained inaccessible as only a few are benefiting from the scheme. On further analysis it was found that the home delivery is significantly higher in case of families with relatively poor asset endowments and among women with low level of educational attainment. This has been found true for both Hindu as well as Muslim families. 14. Poor and PDS Support Targeting the poor in the process of socio-economic development has always been at the high priority in all government programmes. An effective public distribution system (PDS) is seen as one of the prime requirements in making poor families food secure. Provisioning of essential commodities at a fair price, special provisions for BPL families and various support programmes specifically meant for the poor like green card and yellow cards are viewed and reviewed as major instruments of upward social mobility of the poor. It may however be mentioned that about 7.4 percent Hindu household belonging to the BPL do not posses the BPL card, while 26.9 percent Muslim households were found not having BPL card.

45
Table 4.37 Percentage distribution of households by BPL status and receiving PDS
Religion BPL HH Having BPL Card HH receiving PDS
Hindu 9.9 8.3 24.1 Muslim 41.2 23.8 54.5
Total 51.1 32.1 78.6
Table 4.38 Percentage distribution of households by problem faced in accessing PDS
RELIGION Problem
Hindu Muslim
Total
Insufficient quantity 0.21 2.69 2.90 Bad Quality 0.21 0.21 Dishonesty in measurement 0.62 0.62 Non-availability in item 1.86 4.97 6.83 Irregular supply 3.11 2.90 6.00 Others 0.21 4.14 4.35 Insufficient quantity and Irregular supply 6.83 1.04 7.87 Non-availability in item and Supply irregular 9.94 5.59 15.53 Insufficient quantity, Bad quality and Item not available 0.62 0.62 Insufficient quantity, Bad quality and Irregular supply 0.21 2.28 2.48 Insufficient quantity, Dishonesty and Item not available 0.41 6.42 6.83 Qty insufficient, Non-availability in item and Supply irregular
6.63 34.58 41.20
Bad quality, Item not available and Irregular supply 1.45 1.04 2.48 Dishonesty, Item not available and Irregular supply 2.07 2.07
Total 30.85 69.15 100.00
For effective functioning of the PDS as a support system, it is important that major bottlenecks are properly identified and removed. The present baseline has found that almost half of the households (51.1 percent) are BPL households. Out of these, most (41.2 percent) belongs to Muslims. Among them only 32.1 percent households possess BPL ration cards. The Importance of the PDS become evident from the fact about 89 percent of the households gets essential commodities from through the PDS, including the BPL households. It is important to note that most of them (65.1 percent) report that they receive all the items through PDS. Those who were not getting enough from the PDS reported lack of money and inadequacy of PDS supply as major problem in accessing the PDS support. 15. Awareness and Participation 15.1 Awareness about government schemes It has been argued for long that level of awareness and participation are two important aspects of development approach. The Government of India has been initiating several specific programmes targeting the poor. The benefits of these programmes to a large

46
extent depend on the level of awareness of the people about the programme. At the same time, any leakages in the process are to be properly identified for designing effective implementation. The present baseline clearly indicates that people who are aware of various schemes also gets benefit from them. So far the level of awareness at the community level is concerned, Hindu households, on the whole found to be little ahead of the Muslim households, expect the NREGA. It could also be seen that in terms of benefits, the Muslims got more benefits under the NREGA than the Hindu households. This variation, however, may be due to the relatively greater proportion of Muslims in the constituent sample. Individual scheme wise, however, Old age and widow pension, SSA and IAY are mostly known to both the communities. Table 4.39 Percentage distribution of households by level of awareness and benefits
Schemes Aware Received benefit Hindu Muslim Total Hindu Muslim Total SGSY 22.60 45.30 67.90 2.40 3.20 5.60 NREGA 18.90 51.00 69.80 0.90 4.70 5.60 IAY 29.20 65.80 95.10 2.70 2.00 4.80 TSC/ Swajaldhara 14.50 28.10 42.60 0.50 0.10 0.70 ARWSP 21.60 34.20 55.80 0.50 4.10 4.60 SSA 27.70 63.10 90.80 3.90 25.50 29.50 ICDS 28.20 63.40 91.60 1.80 23.30 25.10 Old age/ Widow pension 28.50 67.00 95.60 28.50 67.00 95.60 Maternity Benefit 25.60 64.60 90.10 1.10 5.10 6.20
In terms of benefits, old age pension and widow pension appear to be most beneficial for both the communities, while TSC is found to be the least beneficial of all the schemes. Besides, SSA and ICDS were found relatively more beneficial schemes from the above table. In case of selection of beneficiaries for most of the schemes, GP secretary and Block Development officials were found overwhelmingly prominent. So far as the commission is concerned mixed responses were observed. In the perception of the people NREGA and SGSY emerged as the two most useful schemes. 15.2 Participation in the socio-political affairs Recent development debates envisage a pro-active role from the people at the grassroots for successful democratic decentralisation, which in turn accelerates the process of growth and development. The 73rd and 74th amendments of the Constitution further the scope of democratic decentralisation in the country by putting local governance Institutions at the centre-stage. The process of democratic decentralisation can be most potent source of ushering development, particularly in rural areas, when people participate in the process.

47
Table 4.40 Percentage distribution of household by political and social participation
Voted in Hindu Muslim Total
Panchayat 30.70 65.30 96.00 Assembly 29.40 69.20 98.70 Parliament 31.70 67.10 98.80 Member of Panchayat 0.60 1.50 2.10 SHG 6.40 6.70 13.00 Social/Religious organisation 4.20 3.20 7.40
The baseline shows that the level of political participation is quite high among the sample households at all levels. This is more so among the Muslims. It may be tangentially referred to the fact that the Muslims in Assam, given the political considerations feel, in general, tempted to exercise their voting rights. 15.3 Conflict, insecurity and access to media and communication Problems and losses related to conflicts, communal or otherwise and the sense of insecurity is absent among the sample households. However, majority (88.4 percent) people feel that during the period of conflict and communal clashes, the role of the state should be cooperative.
Table 4.41 Percentage distribution of household by access to media
Media source Hindu Muslim Total
Read Newspaper 7.30 4.60 11.90 Listen to Radio 9.50 12.60 22.10 Watch TV 9.30 3.40 12.70
As far as the access to media and communication is concerned, the baseline indicates an overall low level of access to media across the communities. Comparatively, access to radio is more common. Low level of access to media is partly explained by access to education and economic conditions of the households. 16. Aspirations The baseline also tried to fathom the level of aspirations of people in the sample villages. Three most important facilities that people think are lacking in their villages were found as good road and communication facilities (52.0 percent out of which 38 is Muslim), electricity (22.9 percent out of which 15.8 percent Muslim) and drinking water (10.3 percent out of which 5.8 percent Muslim). These indicate that the most of the minority villages lack basic amenities in the district.
48
In terms of relative deprivation, people feel that they were mostly deprived of land, housing, health and education and employment. It was revealed from the baseline that the Muslims were mostly deprived of health and housing facilities. Therefore, major aspirations emerge from the survey in terms of better communication and connectivity, improved electricity, safe drinking water, better health-care education and employment opportunities. People do feel that access to these basic services would provide necessary momentum towards their economic betterment and progress. Their urge for these facilities upon the government can be considered as well justified and well articulated. The urgency of providing these to the minority concentrated areas can be stressed given their relative backwardness and poverty. ■

49
PART V
THE MAJOR DEVELOPMENT DEFICITS Despite a high income index compared to the state of Assam, especially education and health scenario of rural Barpeta is considerably poor. The rural population constitutes more than 92 per cent of the total district population. More than 63 per cent of the total rural population of the district is Muslim. The main rural workforce in the district is numerically smaller than the state average, and as the Human Poverty Index (calculated in 1999) indicated, a substantial number of people in the district are in human poverty. The deficits in respect of three broad categories of indicators have been calculated from the household survey and are shown in the table below.
Developmental Deficits in Barpeta District and Their Priority Ranking
Sl. No.
Indicators Survey Result
Estimate for India
Deficit Priority Ranking attached
Socio-economic indicators
1 Rate of literacy 73.30 67.30 6.00 9
2 Rate of female literacy 68.24 57.10 11.14 10
3 Work participation rate 43.20 38.00 5.20 8
4 Female work participation rate 29.31 21.50 7.81 7
Basic amenities indicators
5 Percentage of pucca houses 8.50 59.40 -50.90 2
6 Percentage of households with access to safe drinking water 62.00 87.90 -25.90 5
7 Percentage of households with sanitation facilities 17.60 39.20 -21.60 6
8 Percentage of electrified households 4.90 67.90 -63.00 1
Health indicators
9 Percentage of fully vaccinated children 11.23 43.50 -32.27 4
10 Percentage of institutional delivery 12.71 38.70 -25.99 3
The other deficits in the district are as follows.
� The sample survey indicates relatively a higher fertility rate among the Muslims than the Hindus, and a poor sex ratio among the former. Although the rate of literacy is better than the state average, the level of educational attainment is confined mainly to the primary level of education because of high dropout rate due to several factors including poverty. The overall scenario of higher education is poor and difference between the Hindus and the Muslim in this regard is
50
prominent. More importantly, the level of educational attainment of the females, especially among the Muslims is a matter of serious concern. � More than one-fourth of the households depend mainly on agriculture, almost all of them are marginal farmers and many of them supplement their income as share cropper on 50:50 basis. In absence of appropriate institutional reforms, despite several legislations, the technological reforms initiated in the state have little impacts. Almost near absence of modern agricultural implement with the farming households clearly witnesses wide prevalence of traditional practices in the villages. Agricultural development in few pockets of the district is quite prominent, but does not reflect the overall situation. � Absence of modern household assets clearly indicates a low living standard, especially of the Muslims. It has been noted that the overall housing conditions of the Muslims is worse than the socially disadvantaged Hindu population. It is worth noting that 10 per cent of the sample households do not have access to safe drinking water, and almost eight per cent of them are Muslims. Similarly, almost one-third of the Muslim households does not have any toilet facility and go to the field. � It has been noted that the Muslims households for poor accessibility to institutional credit often approach the professional money lenders with a considerably high rate of compound interest. Accessibility to bank credit facility, therefore, is a matter of serious concern from the development intervention point of view. A relatively high incidence of indebtedness of the Muslim for medical treatment also indicates a critical gap in terms of government medical support. The deprivation leads a good number of Muslim households to a more distressful situation. � It has already been pointed out that the incidence of drop out after enrolment is of much higher intensity among the Muslim children than their Hindu counterpart. The common reasons are work at home and need to earn. This is supported by the finding that nearly 59 per cent of the Muslim households can be considered as BPL households while the same for the Hindus is 53 per cent. Having a direct relation with income level, expenditure of the Muslim households on food items has also been found much lower than that of the Hindus. � Witnessing a poor health scenario, in case of most of the ailments Muslims outweigh the Hindus. Striking difference is noted especially in case of malaria, fever and diarrhoea. The present survey shows that percentage of children fully immunised is marginal. Across religion, the coverage has been lower in case of the Muslims than that of the Hindus. The important reasons are lack of awareness and distance to the immunization centre. The survey also clearly

51
indicates that in most of the cases, deliveries are taking place at home especially due to lack of accessibility to the hospitals. This is particularly high among the Muslims and superstitions play an important role besides the problem of accessibility. � Further witnessing poor social security measure, a sizeable section of the BPL families has been found not having the BPL card. Although the PDS is week, its importance can be judged from the fact that more than 65 per cent of the sample households are getting their essential commodities trough the PDS. The major problem with the PDS, however, is inadequate supply of the essential commodities. � Lack of awareness, especially among the Muslims, about the available government schemes has been found to be a matter of serious concern. It prevents a sizeable section of the people from getting the necessary support. � In terms of relative deprivation, common perception of the people is that they are deprived of land, housing, health, education and employment. The major aspirations of the people that have emerged through the survey are communication and connectivity, safe drinking water, better heath care, education and employment facilities. ■

52
LIST OF SURVEYED VILLAGES Sl. No. VILLAGE
1 Pipla
2 Bornalikuchi
3 Jalah
4 Borchala bilor pathar
5 Hudu kheda pathar
6 Gopalpur
7 Burikhamar
8 Satrakanara
9 Sukmanah
10 Batia Mari
11 Bahmora
12 Charna
13 Kharadhara pathar
14 Barbang
15 Teka gaon
16 Jahanar Gaon
17 Citali
18 Roumari pathar
19 Chakir Bhita
20 Bala pathar
21 Salekura
22 Bheragaon
23 Dakhin Godhani
24 Chandmama
25 Itar Bhita
26 Khairabari
27 Kawimari
28 Pora gaon
29 Tenga gaon
30 Kalah bhanga
Top Related