


Languages
Pages
Legal


The University of Manchester Research
Controllable Aligned Nanofiber Hybrid Yarns withEnhanced Bioproperties for Tissue EngineeringDOI:10.1002/mame.201900089
Document VersionAccepted author manuscript
Link to publication record in Manchester Research Explorer
Citation for published version (APA):Liu, C., Li, B., Mao, X., Zhang, Q., Sun, R., Gong, R. H., & Zhou, F. (2019). Controllable Aligned Nanofiber HybridYarns with Enhanced Bioproperties for Tissue Engineering. Macromolecular Materials and Engineering, [1900089].https://doi.org/10.1002/mame.201900089
Published in:Macromolecular Materials and Engineering
Citing this paperPlease note that where the full-text provided on Manchester Research Explorer is the Author Accepted Manuscriptor Proof version this may differ from the final Published version. If citing, it is advised that you check and use thepublisher's definitive version.
General rightsCopyright and moral rights for the publications made accessible in the Research Explorer are retained by theauthors and/or other copyright owners and it is a condition of accessing publications that users recognise andabide by the legal requirements associated with these rights.
Takedown policyIf you believe that this document breaches copyright please refer to the University of Manchester’s TakedownProcedures [http://man.ac.uk/04Y6Bo] or contact [email protected] providingrelevant details, so we can investigate your claim.
Download date:03. Dec. 2021
1
DOI: 10.1002/ ((please add manuscript number))
Article type: Full Paper
Controllable aligned nanofiber hybrid yarns with enhanced bioproperties for tissue
engineering
Chengkun Liu,* Boyu Li, Xue Mao, Qing Zhang, Runjun Sun, R Hugh Gong, Fenglei Zhou
Prof. C. Liu, Dr. X. Mao, Mr. Q. Zhang, Prof. R. Sun
School of Textile Science and Engineering
Xi'an Polytechnic University
Xi'an Shaanxi 710048, China
Email: [email protected]
Dr. B. Li
School of Materials Science & Engineering
Materials Institute of Atomic and Molecular Science
Shaanxi University of Science and Technology
Xi’an Shaanxi 710021, China
Prof. C. Liu, Prof. R. H. Gong, Prof. F. Zhou
The School of Materials
The University of Manchester
Manchester M13 9PL, UK
Prof. F. Zhou
Center for Imaging Sciences
Revised Manuscript
1 2 3 4 5 6 7 8 9 10 11 12 13 14 15 16 17 18 19 20 21 22 23 24 25 26 27 28 29 30 31 32 33 34 35 36 37 38 39 40 41 42 43 44 45 46 47 48 49 50 51 52 53 54 55 56 57 58 59 60 61 62 63 64 65
2
The University of Manchester
Manchester M13 9PL, UK
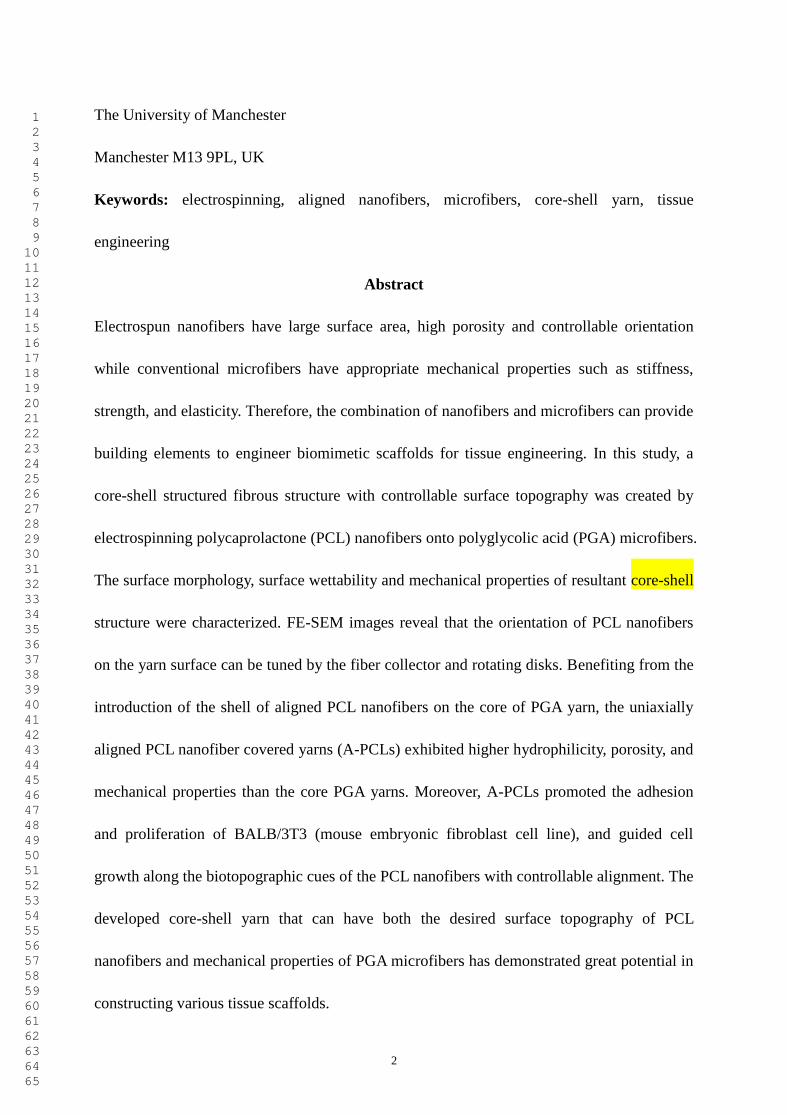
Keywords: electrospinning, aligned nanofibers, microfibers, core-shell yarn, tissue
engineering
Abstract
Electrospun nanofibers have large surface area, high porosity and controllable orientation
while conventional microfibers have appropriate mechanical properties such as stiffness,
strength, and elasticity. Therefore, the combination of nanofibers and microfibers can provide
building elements to engineer biomimetic scaffolds for tissue engineering. In this study, a
core-shell structured fibrous structure with controllable surface topography was created by
electrospinning polycaprolactone (PCL) nanofibers onto polyglycolic acid (PGA) microfibers.
The surface morphology, surface wettability and mechanical properties of resultant core-shell
structure were characterized. FE-SEM images reveal that the orientation of PCL nanofibers
on the yarn surface can be tuned by the fiber collector and rotating disks. Benefiting from the
introduction of the shell of aligned PCL nanofibers on the core of PGA yarn, the uniaxially
aligned PCL nanofiber covered yarns (A-PCLs) exhibited higher hydrophilicity, porosity, and
mechanical properties than the core PGA yarns. Moreover, A-PCLs promoted the adhesion
and proliferation of BALB/3T3 (mouse embryonic fibroblast cell line), and guided cell
growth along the biotopographic cues of the PCL nanofibers with controllable alignment. The
developed core-shell yarn that can have both the desired surface topography of PCL
nanofibers and mechanical properties of PGA microfibers has demonstrated great potential in
constructing various tissue scaffolds.
1 2 3 4 5 6 7 8 9 10 11 12 13 14 15 16 17 18 19 20 21 22 23 24 25 26 27 28 29 30 31 32 33 34 35 36 37 38 39 40 41 42 43 44 45 46 47 48 49 50 51 52 53 54 55 56 57 58 59 60 61 62 63 64 65
3
1. Introduction
Tissue engineering, also known as regenerative medicine, is based on biological and
engineering disciplines, and it mainly refers to the preparation of human tissue substitutes to
promote the repair of human injury tissue or organ.[1] Extracellular matrix (ECM) primarily
containing some polysaccharides and proteins is a micro-nanoscale network of
macromolecules distributed on the cell surface or among cells.[2] ECM can provide a suitable
microenvironment for cell behavior, and affect the cell shape, metabolism, function,
migration, proliferation and differentiation through the biophysical and biochemical signal.[3,4]
One of the main research contents of tissue engineering is to generate the biocompatible
scaffold that will imitate ECM and three-dimensional (3D) structure of diverse tissues.
Recently, some properties of the 3D bioengineered scaffold including strength, porosity and
configuration have been examined to improve diverse ECM platforms.[5,6] In particular, there
have been numerous reports on cell growth and related behavior of 3D scaffolds which
possessed aligned biotopographical cues due to the regular organization of most of the
structures of native tissues.[7-9] For example, skeletal muscle tissue is composed of aligned
myofibers, and blood vessel is made up of aligned vascular endothelial cells along the axial
direction. Various methods such as freeze-drying,[10] molecular self-assembly,[11]
photo-lithography,[12] micro-grooving,[13] 3D printing[14] have been employed for the
preparation of 3D well-organized tissue scaffolds. However, in clinical and commercial
considerations, these methods involve complex process, expensive cost, or low resolution,
and are difficult to adapt to the complexity of the size, configuration, and strength of the
target tissue/organ.
1 2 3 4 5 6 7 8 9 10 11 12 13 14 15 16 17 18 19 20 21 22 23 24 25 26 27 28 29 30 31 32 33 34 35 36 37 38 39 40 41 42 43 44 45 46 47 48 49 50 51 52 53 54 55 56 57 58 59 60 61 62 63 64 65
4
The application of textile materials in tissue repair can be traced back to 5000 BC when
the ancients used cotton or flax to suture the wound.[15] At present, different textile structures
including woven, knitted and nonwoven fabrics have been used as supports for tissue/organ
repairing/regeneration, such as 3D woven cartilage scaffold, nonwoven scaffolene® and 3D
knitted cardiac scaffold.[16,17] They have 3D structures and can be served as guiding and ECM
mimicking structures for soft tissue, ligament or cartilage. However, cells cultured on
conventional scaffolds made of macroscale fiber or yarn materials lack sufficient contact
guidance so that cells cannot effectively deposit ECM mimics to generate a micro-nanoscale
environment that can promote growth, differentiation, and migration.[18] Electrospinning is a
well-established technology for the production of nanofibers, which was first reported by
Formhals.[19] Besides low cost and simple operation, some of the known features of
electrospun fibers include a large specific surface area, nano-sized diameter, and high
porosity.[20,21] Aligned electrospun fibers or yarn prepared by the modified electrospinning
process can provide improved mechanical properties and effective biotopographic cues
highly desired by anisotropic tissue scaffolds such as tendon, ligament and cardiac
tissues.[22,23] It was also found that aligned electrospun nanofibers could promote adhesion
and growth of some cells (nerve, smooth muscle cells, and myofiber, etc.). [24-27] Electrospun
aligned nanofibers with sufficient mechanical strength can be used as scaffolds alone or
combined with textile technologies such as weaving, knitting or braiding to engineer 3D
nanofiber scaffolds. The resultant scaffolds can effectively simulate the microstructure of
ECM to a great extent, including simulation of the 3D structure of heart,[28,29] muscle,[30-32]
vascularization,[33] nerves,[34,35] and cartilage.[36-37] However, pure electrospun fibers remain
1 2 3 4 5 6 7 8 9 10 11 12 13 14 15 16 17 18 19 20 21 22 23 24 25 26 27 28 29 30 31 32 33 34 35 36 37 38 39 40 41 42 43 44 45 46 47 48 49 50 51 52 53 54 55 56 57 58 59 60 61 62 63 64 65
5
challenging to process into 3D structures due to low mechanical properties, and therefore
limit their practical uses. For example, the tensile strength of nanofiber yarn scaffolds for
skeletal muscle tissues reported by Wang et al.[30] was less than ~ 5 cN (1 MPa), which failed
to meet the requirement in the repair of tendons and ligaments that usually have tensile
strength from 15 to 100 MPa.[38] To overcome this limitation, the concept of core-shell yarns
has been conceived and tested on a specially designed electrospinning setup.[39] This method
combines conventional bio-braided fibers acting as the core materials to provide the required
strength for post processing, with aligned electrospun nanofibers serving as the shell to
provide biotopographic cues.
In this study, core-shell yarns with tunable nanofiber orientations on the surface were
developed and their effects on hydrophilicities, mechanical properties, and in vitro biological
performance as tissue scaffolds were assessed. Aligned polycaprolactone (PCL) nanofibers
beneficial to the promotion of cell adhesion and growth were electrospun onto polyglycolic
acid (PGA) yarns, which were biocompatible and could provide an excellent mechanical
strength and a stable size. The morphological structure of the scaffolds composed of aligned
PCL nanofiber covered yarns (A-PCLs) was analyzed by SEM, and the BALB/3T3 (mouse
embryonic fibroblast cell line) cells were cultured on these scaffolds. The effect of nanofiber
arrangement on performance of the scaffolds in terms of cell morphology, adhesion, and
growth was also evaluated. Results showed that the scaffolds with controllable aligned
nanofibers possessed controllable guidance for cell growth, and the mechanical properties of
the scaffolds reached practical level (372 MPa) for weaving or other post-treatments. Aligned
PCL nanofibers on the surface could also improve the hydrophilicity (surface contact angle
1 2 3 4 5 6 7 8 9 10 11 12 13 14 15 16 17 18 19 20 21 22 23 24 25 26 27 28 29 30 31 32 33 34 35 36 37 38 39 40 41 42 43 44 45 46 47 48 49 50 51 52 53 54 55 56 57 58 59 60 61 62 63 64 65
6
reduced from 134° to 94°) and porosity (increased from 19% to 90%) of the scaffolds. This
type of nanofiber covered yarn can potentially be used in the biomedical textiles such as 3D
scaffolds for diverse tissue engineering applications.
2. Experimental Section
Materials: The PGA yarn sized 2 (~0.5 mm diameter) was purchased from Shandong
WeiGao Group Medical Polymer Co., Ltd., China. PCL (Mn=80000) (Sigma-Aldrich, MO,
USA) solution with the concentration of 10 wt% was prepared by dissolving it in 60/40 (v/v)
mixture of dichloromethane (DCM) and N,N-dimethylformamide (DMF) (Tianjin Kermel
Chemical Reagents Co., Ltd., China). PGA yarn and PCL were chosen as raw materials,
because PGA yarn exhibits good biocompatibility and is often used as the suture, and PCL
shows good biocompatibility and biodegradability. DCM and DMF were used without further
purification. BALB/3T3 cells were obtained from the Cell Bank of the Chinese Academy of
Sciences (Shanghai, China). Medium and other reagents for cell culture were purchased from
Hyclone (USA).
Fabrication of nanofiber covered yarn scaffolds: The electrospinning setup comprises of a
syringe pump (Zhejiang Smith Medical Instrument Co., Ltd., China), a high voltage power
supply (Dalian ZhiDian Electronic Technology Co., Ltd.,China), a grounded collector
(consisted of two parallel aluminum flakes), and two rotating disks with two rotating rollers.
In the electrospinning process, PCL solution in a 20 mL syringe was pushed by a syringe
pump at an infusion rate of 0.8 mL h-1 to a spinneret with the inner diameter of 1.65 mm. Two
parallel aluminum flakes (length of 20 cm, span distance of 3 cm) were used as the grounded
collectors below the spinneret. A voltage of 15 kV was applied between the spinneret and the
1 2 3 4 5 6 7 8 9 10 11 12 13 14 15 16 17 18 19 20 21 22 23 24 25 26 27 28 29 30 31 32 33 34 35 36 37 38 39 40 41 42 43 44 45 46 47 48 49 50 51 52 53 54 55 56 57 58 59 60 61 62 63 64 65
7
grounded collector. The distance between the spinneret tip and the upper edges of collector
was 15 cm. When aligned PCL nanofibers were suspended over the edges of the two parallel
aluminum flakes, PGA yarn was conveyed at a controlled speed into the spinning zone by an
unwinding roller. Meanwhile, two disks were rotated at the same speed and direction to allow
the aligned PCL nanofibers to uniformly cover the PGA yarn and form a core-shell structure.
This electrospinning process was carried out at 20±2 °C and 65±5 RH%. All prepared
scaffolds were kept in a ventilated environment for 24 h to allow any residual organic solvent
to evaporate completely.
Characterization of scaffolds: The morphology of scaffolds was characterized by a field
emission scanning electron microsope (FE-SEM) (Quanta-450-FEG, FEI, England). FE-SEM
images were analyzed using Smileview (JEOL) software to determine fiber diameter and
pore diameter through the selection of five random fields of each image. Optical images of
the prepared yarns were recorded by a digital camera (HDR-SR11E, SONY, Japan). Modified
Fast Fourier Transform (MFFT) technique was employed to characterize the alignment of
nanofibers from the FE-SEM images.[40,41] The porosity of scaffolds was measured according
to the liquid displacement method.[42] Before test, scaffolds were placed in a desiccator
(Shanghai SuoPu Instrument Co., Ltd., China) for drying 2 h and were then put into
measuring cylinders that were filled with a certain volume of ethanol. The porosity (P) of
scaffolds was calculated as follows:
%100(%)32
31
VV
VVP (1)
1 2 3 4 5 6 7 8 9 10 11 12 13 14 15 16 17 18 19 20 21 22 23 24 25 26 27 28 29 30 31 32 33 34 35 36 37 38 39 40 41 42 43 44 45 46 47 48 49 50 51 52 53 54 55 56 57 58 59 60 61 62 63 64 65
8
Where V1 is the volume of ethanol in a measuring cylinder, V2 refers to the volume of ethanol
and scaffold; V3 is the volume of remaining ethanol after the scaffold was taken out.
Mechanical properties of scaffolds were evaluated by an electronic strength tester (5565,
Instron, USA). All scaffolds for testing were cut into 15 cm and pulled at a speed of 10 mm
min-1. To study the hydrophilicity of scaffolds, water contact angle was measured with 2 μL
water using a contact angle analyzer (OCA15EC, Dataphysics, Germany) at ambient
temperature. The morphology of water drops at randomly distributed positions of the
scaffolds was recorded and then analyzed. Wicking height (W) was utilized to evaluate water
absorption capacity of scaffolds by a wicking property tester (YG(B)871, China). The
average value of W was calculated as follows:
n
w
W
n
i
i 1
(2)
Where w is the height of the water along the fiber.
Biological assessment in vitro: BALB/3T3 cells were cultured in DMEM culture medium
with 10% FBS and 1% antibiotics. All prepared scaffolds were placed in the bottom of
24-well tissue culture plate (TCP), washed 3 times with PBS, sterilized for 12 h under UV
radiation, and subsequently incubated with DMEM for 24 h before cell seeding. Cells were
detached by trypsin/EDTA when cells were grown to 90% confluency. A hemocytometer was
used to count the viable cells and then cells were seeded onto scaffolds at a density of 1×10⁴
cells/well. Afterwards, cells were cultured in the standard culture condition (37 °C, 5% CO2,
and 95% humidity). The medium was refreshed every 48 h. To study the cell proliferation on
different scaffolds, viable cells were determined by using methylthiazol tetrazolium (MTT)
1 2 3 4 5 6 7 8 9 10 11 12 13 14 15 16 17 18 19 20 21 22 23 24 25 26 27 28 29 30 31 32 33 34 35 36 37 38 39 40 41 42 43 44 45 46 47 48 49 50 51 52 53 54 55 56 57 58 59 60 61 62 63 64 65
9
assay. After 1, 3, and 5 days of cell seeding in a 24-well plate, cells were washed with PBS
and incubated in 400 μL MTT solution. After incubation at the standard culture condition for
3 h, the MTT solution was removed from each well and 400 μL DMSO was appended. The
plate was gentlely shaked for 20 min in order to dissolve the formazan precipitate. A
spectrophotometric plate reader was used to measure the absorbance of the content of each
well at 492 nm. Cells grown on the 24-well TCP was used as the control. The morphology of
cells on scaffolds was examined by FE-SEM. After 3 days culture, cell-scaffolds were
washed with PBS and fixed with 3% glutaraldehyde for 2 h, followed by dehydrating through
gradient ethanol solution (30, 50, 70, 90, 100% v/v) and drying 12 h at room temperature.
Completely dried cell-scaffolds were coated with gold for the analysis of cell morphology.
The elongation of BALB/3T3 cells on prepared scaffolds was measured by aspect ratio,
which was evaluated by the longest and shortest length of cell on FE-SEM images. Confocal
laser scanning microscope (CLSM) (FV1200, Olympus, Japan) was used to visualize cell
cytoskeletal structure and distribution on the scaffolds. The process can be briefly described
as follows: cell-scaffolds were washed three times with PBS, fixed with 4%
paraformaldehyde for 60 min, permeabilized with 1mL 0.1% Triton X-100 (AMRESCO USA)
for 10 min after culture of 3 days. The cells on scaffolds were stained for 30 min with
FITC-Phalloidin and then stained by DAPI for 5 min after being washed another three times
with PBS. The nuclei and cytoskeletons of cells were finally visualized by CLSM. The
alignment of cells was determined from CLSM images by MFFT technique.
1 2 3 4 5 6 7 8 9 10 11 12 13 14 15 16 17 18 19 20 21 22 23 24 25 26 27 28 29 30 31 32 33 34 35 36 37 38 39 40 41 42 43 44 45 46 47 48 49 50 51 52 53 54 55 56 57 58 59 60 61 62 63 64 65
10
Statistical analysis: Results were presented as mean value and standard deviation (SD).
Statistical analysis was performed by one-way analysis of variance (ANOVA). P<0.05 were
considered statistically significant.
3. Results and discussion
3.1 Morphology and characterization of the prepared scaffolds
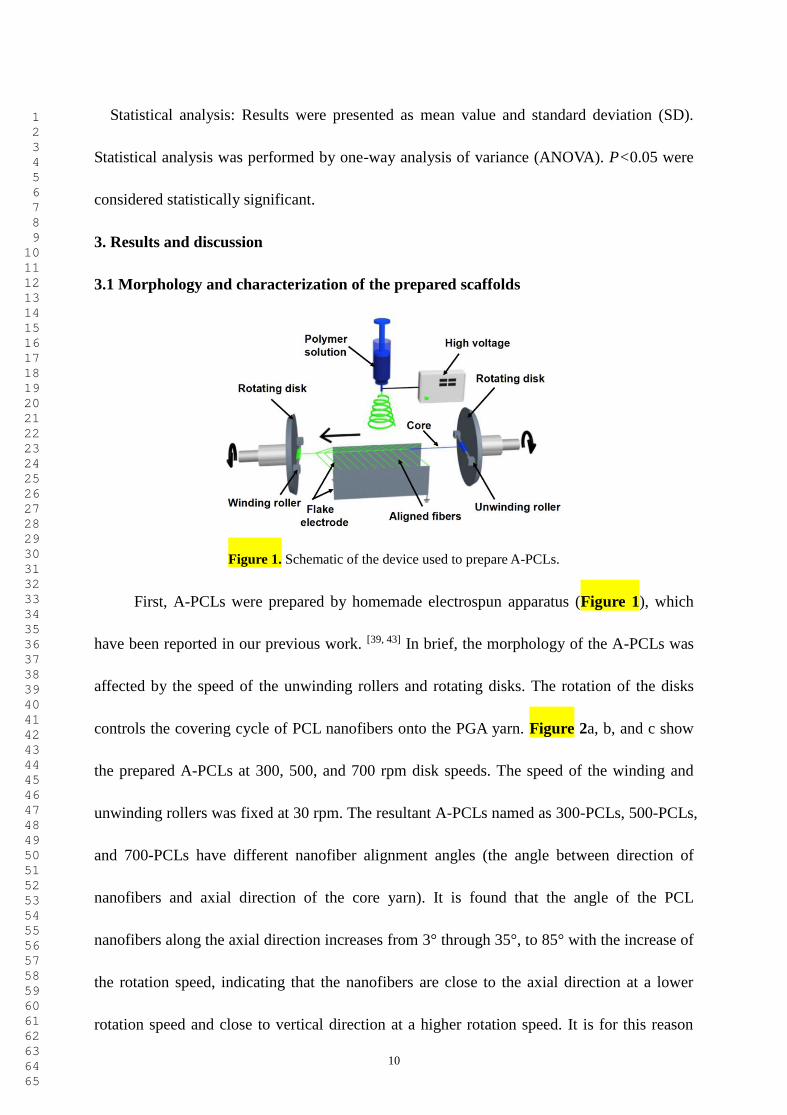
Figure 1. Schematic of the device used to prepare A-PCLs.
First, A-PCLs were prepared by homemade electrospun apparatus (Figure 1), which
have been reported in our previous work. [39, 43] In brief, the morphology of the A-PCLs was
affected by the speed of the unwinding rollers and rotating disks. The rotation of the disks
controls the covering cycle of PCL nanofibers onto the PGA yarn. Figure 2a, b, and c show
the prepared A-PCLs at 300, 500, and 700 rpm disk speeds. The speed of the winding and
unwinding rollers was fixed at 30 rpm. The resultant A-PCLs named as 300-PCLs, 500-PCLs,
and 700-PCLs have different nanofiber alignment angles (the angle between direction of
nanofibers and axial direction of the core yarn). It is found that the angle of the PCL
nanofibers along the axial direction increases from 3° through 35°, to 85° with the increase of
the rotation speed, indicating that the nanofibers are close to the axial direction at a lower
rotation speed and close to vertical direction at a higher rotation speed. It is for this reason
1 2 3 4 5 6 7 8 9 10 11 12 13 14 15 16 17 18 19 20 21 22 23 24 25 26 27 28 29 30 31 32 33 34 35 36 37 38 39 40 41 42 43 44 45 46 47 48 49 50 51 52 53 54 55 56 57 58 59 60 61 62 63 64 65
11
that this method allows us to design different scaffold materials which have different
topographic cues as needed. We can also change the raw polymer materials or add drugs into
the nanofibers according to requirements through this process. Random PCL nanofiber
membranes (R-PCLs) were manually wrapped on the core yarn at the same electrospinning
time and used as the control scaffold (Figure S1a). The surface morphology of R-PCLs is
shown in Figure S1b.
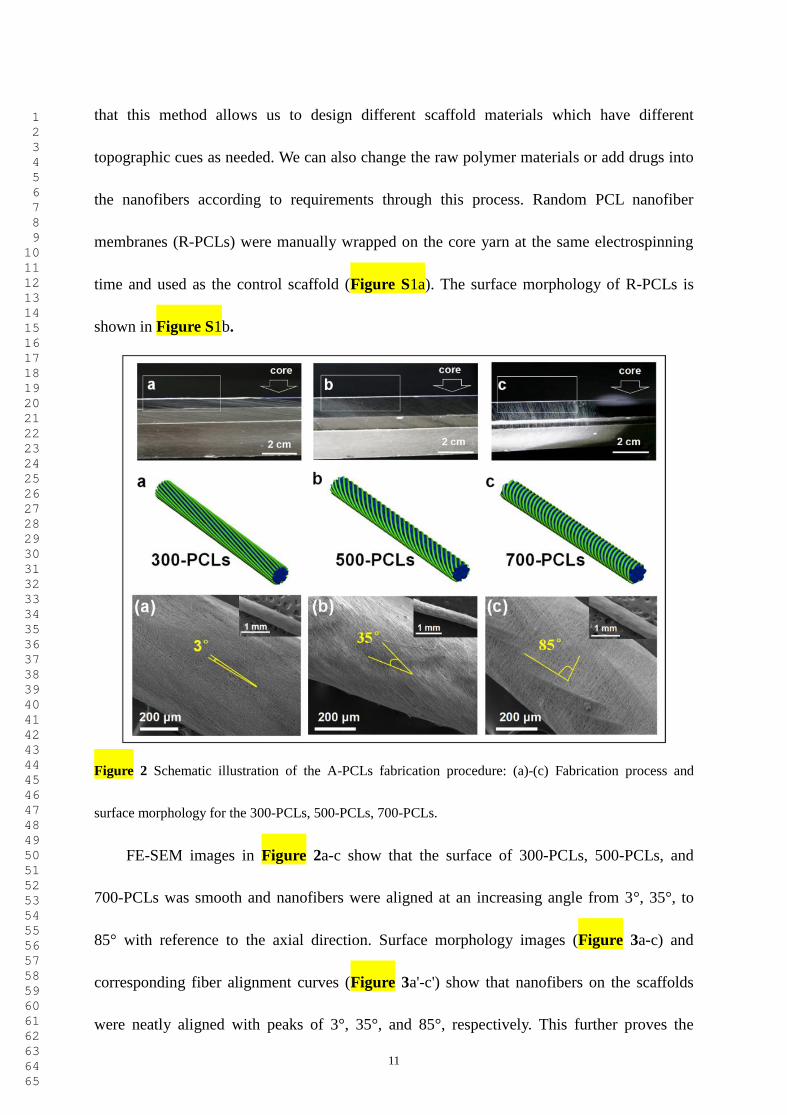
Figure 2 Schematic illustration of the A-PCLs fabrication procedure: (a)-(c) Fabrication process and
surface morphology for the 300-PCLs, 500-PCLs, 700-PCLs.
FE-SEM images in Figure 2a-c show that the surface of 300-PCLs, 500-PCLs, and
700-PCLs was smooth and nanofibers were aligned at an increasing angle from 3°, 35°, to
85° with reference to the axial direction. Surface morphology images (Figure 3a-c) and
corresponding fiber alignment curves (Figure 3a'-c') show that nanofibers on the scaffolds
were neatly aligned with peaks of 3°, 35°, and 85°, respectively. This further proves the
1 2 3 4 5 6 7 8 9 10 11 12 13 14 15 16 17 18 19 20 21 22 23 24 25 26 27 28 29 30 31 32 33 34 35 36 37 38 39 40 41 42 43 44 45 46 47 48 49 50 51 52 53 54 55 56 57 58 59 60 61 62 63 64 65
12
change in the fiber alignment angle on the surface of A-PCLs prepared at different disk
rotating speeds. As shown in Figure 3d, nanofibers on R-PCLs are randomly arranged, and
the fiber arrangement curve (Figure 3d') exhibits a profile different from those in Figure S1
where peaks are present. The fiber diameter, pore size and porosity of these scaffolds have
also been characterized and regarded as important parameters for regulating cell proliferation
and differentiation.[44] As shown in Table 1, the mean fiber diameter of R-PCLs (444±59 nm)
is slightly larger than that of 300-PCLs (388±33 nm), 500-PCLs (415±31 nm), and 700-PCLs
(349±43 nm). The reason might be the stretching of the aligned nanofibers during the
covering process at a high rotation speed. However, the difference of average fiber diameter
among these scaffolds was not obvious, which might be due to the similarity of polymer jet
instability under the same electrospinning condition. The pore size of 300-PCLs (2281±836
nm), 500-PCLs (1914±773 nm), and 700-PCLs (2194±640 nm) has been greatly improved
compared with that of R-PCLs (1482±334 nm). This may be attributed to the aligned state of
nanofibers deposited on the core yarn. The porosity of these scaffolds shows basically
consistent. Moreover, the porosity of A-PCLs is significantly increased compared with that of
the core yarn. This is because the small size of nanofibers has improved the porosity of
scaffolds significantly. In comparison to the previous study,[45] the A-PCLs not only have a
higher porosity but also controllable-alignment topographic cues.
1 2 3 4 5 6 7 8 9 10 11 12 13 14 15 16 17 18 19 20 21 22 23 24 25 26 27 28 29 30 31 32 33 34 35 36 37 38 39 40 41 42 43 44 45 46 47 48 49 50 51 52 53 54 55 56 57 58 59 60 61 62 63 64 65
13
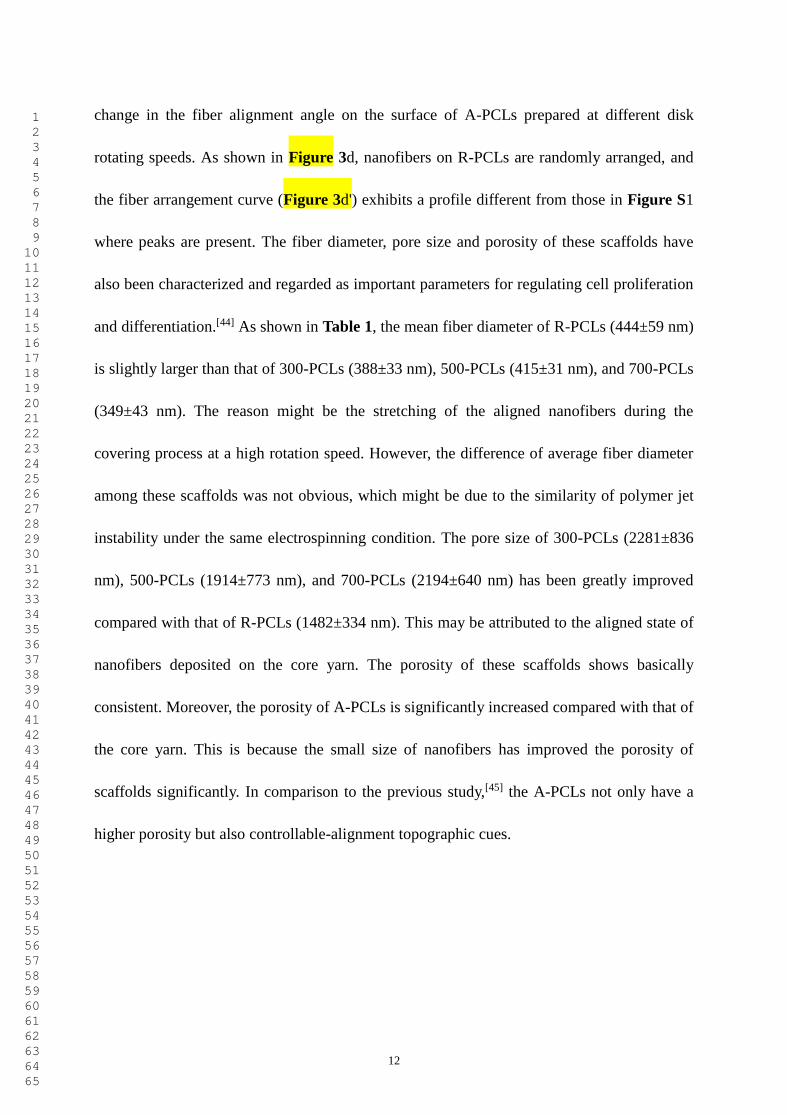
Figure 3 FE-SEM images of different scaffolds at a high magnification (a)-(d) and corresponding curves
of fiber arrangement on the surface of different scaffolds (a')-(d').
Table 1 Fiber diameter, pore diameter and porosity of different scaffolds.*, p<0.05.
Substrate Fiber diameter (nm) Pore diameter (nm) Porosity (%)
Core - - 19.01±3.89*
R-PCLs 443.5±59 1482±334 76.38±5.73
300-PCLs 387.7±33 2281±836 89.97±6.74
500-PCLs 414.8±31 1914±773 85.66±7.07
700-PCLs 348.6±43 2194±640 84.28±7.16
3.2 Effect of nanofiber arrangement on hydrophilicity of different scaffolds
Hydrophilicity of the scaffold is the key issue for cell adhesion and proliferation,
because hydrophilicity can affect the adhesion of serum proteins.[46] Figure 4 presents the
1 2 3 4 5 6 7 8 9 10 11 12 13 14 15 16 17 18 19 20 21 22 23 24 25 26 27 28 29 30 31 32 33 34 35 36 37 38 39 40 41 42 43 44 45 46 47 48 49 50 51 52 53 54 55 56 57 58 59 60 61 62 63 64 65
14
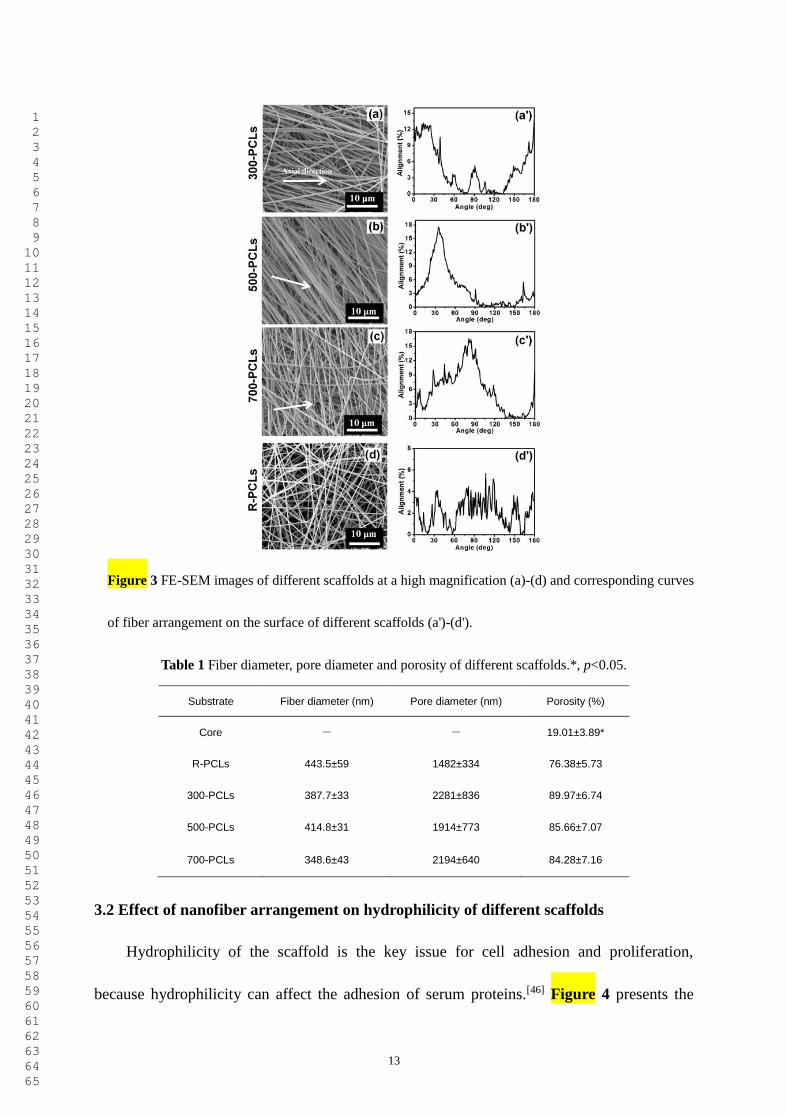
hydrophilicity of different scaffolds including surface contact angle analysis and wicking
effect measurement. The water contact angle of 300-PCLs, 500-PCLs, and 700-PCLs is
94±5°, 97±7°, and 109±6°, respectively, which are significantly lower than that of R-PCLs
(134±8°; P<0.05) shown in Figure 4a. Wicking effect is usually used in the textile field to
characterize the hydrophilicity of fibers or yarns. Figure 4b gives the wicking height of
different scaffolds. It is evident that the wicking property of the core yarn improved
significantly when the yarn surface were covered with aligned nanofibers. Wicking height of
300-PCLs (10.4±0.7 cm), 500-PCLs (9.3±0.8 cm), and 700-PCLs (9.0±0.8 cm) exhibit a
slight decrease but they are all higher than that of R-PCLs (8.3±0.6 cm). The reason behind
this result can be explained as wicking effect according to our previous study.[39] More
capillaries formed between aligned nanofibers are beneficial to water diffusion . The increase
of alignment angle results in a more inclined route and greater resistance to water diffusion.
However, R-PCLs have more inefficient capillaries because of random fiber arrangement.
Figure 4 Effect of arrangement of surface PCL nanofibers on water contact angle (a) and wicking height
(b) for the different scaffolds.
3.3 Effect of nanofiber arrangement on mechanical properties of different scaffolds
Figure 5a shows the stress-strain curve and Young’s modulus of different scaffolds. It is
illustrated that the Young's modulus of different scaffolds remains unchanged at the initial
elastic region. However, tensile strength and break strain of 300-PCLs (372 MPa; 28%),
1 2 3 4 5 6 7 8 9 10 11 12 13 14 15 16 17 18 19 20 21 22 23 24 25 26 27 28 29 30 31 32 33 34 35 36 37 38 39 40 41 42 43 44 45 46 47 48 49 50 51 52 53 54 55 56 57 58 59 60 61 62 63 64 65
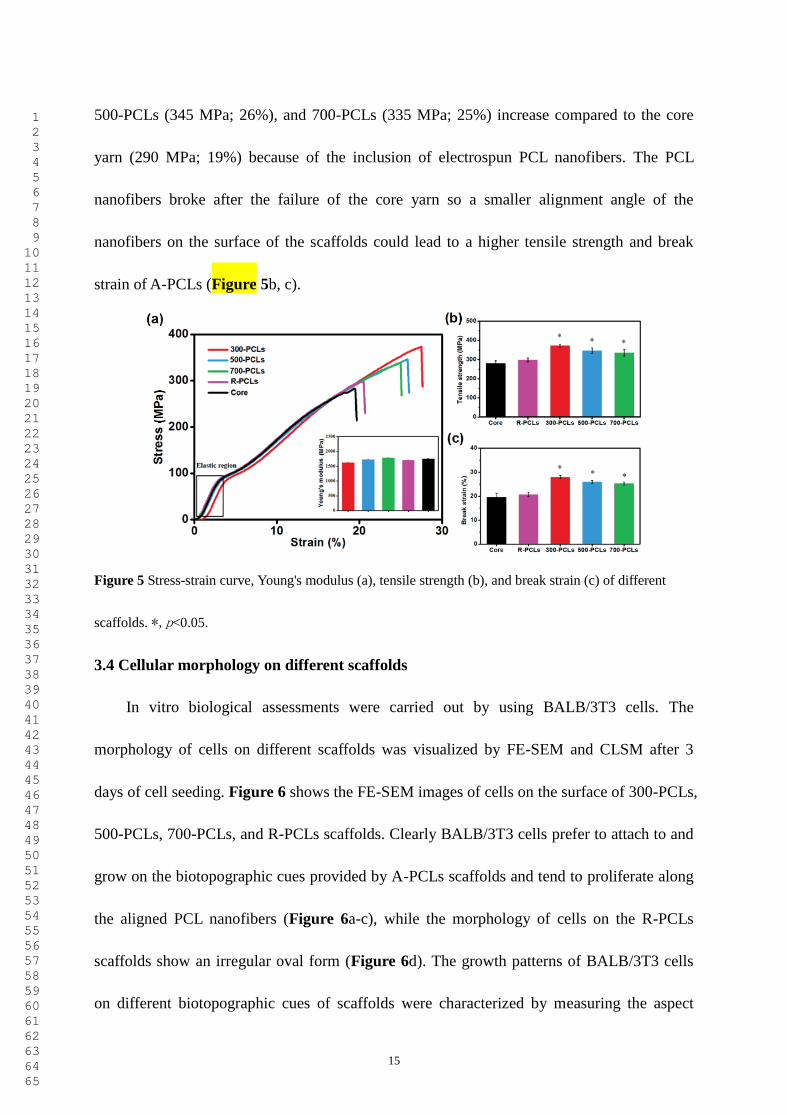
15
500-PCLs (345 MPa; 26%), and 700-PCLs (335 MPa; 25%) increase compared to the core
yarn (290 MPa; 19%) because of the inclusion of electrospun PCL nanofibers. The PCL
nanofibers broke after the failure of the core yarn so a smaller alignment angle of the
nanofibers on the surface of the scaffolds could lead to a higher tensile strength and break
strain of A-PCLs (Figure 5b, c).
Figure 5 Stress-strain curve, Young's modulus (a), tensile strength (b), and break strain (c) of different
scaffolds. *,p<0.05.
3.4 Cellular morphology on different scaffolds
In vitro biological assessments were carried out by using BALB/3T3 cells. The
morphology of cells on different scaffolds was visualized by FE-SEM and CLSM after 3
days of cell seeding. Figure 6 shows the FE-SEM images of cells on the surface of 300-PCLs,
500-PCLs, 700-PCLs, and R-PCLs scaffolds. Clearly BALB/3T3 cells prefer to attach to and
grow on the biotopographic cues provided by A-PCLs scaffolds and tend to proliferate along
the aligned PCL nanofibers (Figure 6a-c), while the morphology of cells on the R-PCLs
scaffolds show an irregular oval form (Figure 6d). The growth patterns of BALB/3T3 cells
on different biotopographic cues of scaffolds were characterized by measuring the aspect
1 2 3 4 5 6 7 8 9 10 11 12 13 14 15 16 17 18 19 20 21 22 23 24 25 26 27 28 29 30 31 32 33 34 35 36 37 38 39 40 41 42 43 44 45 46 47 48 49 50 51 52 53 54 55 56 57 58 59 60 61 62 63 64 65
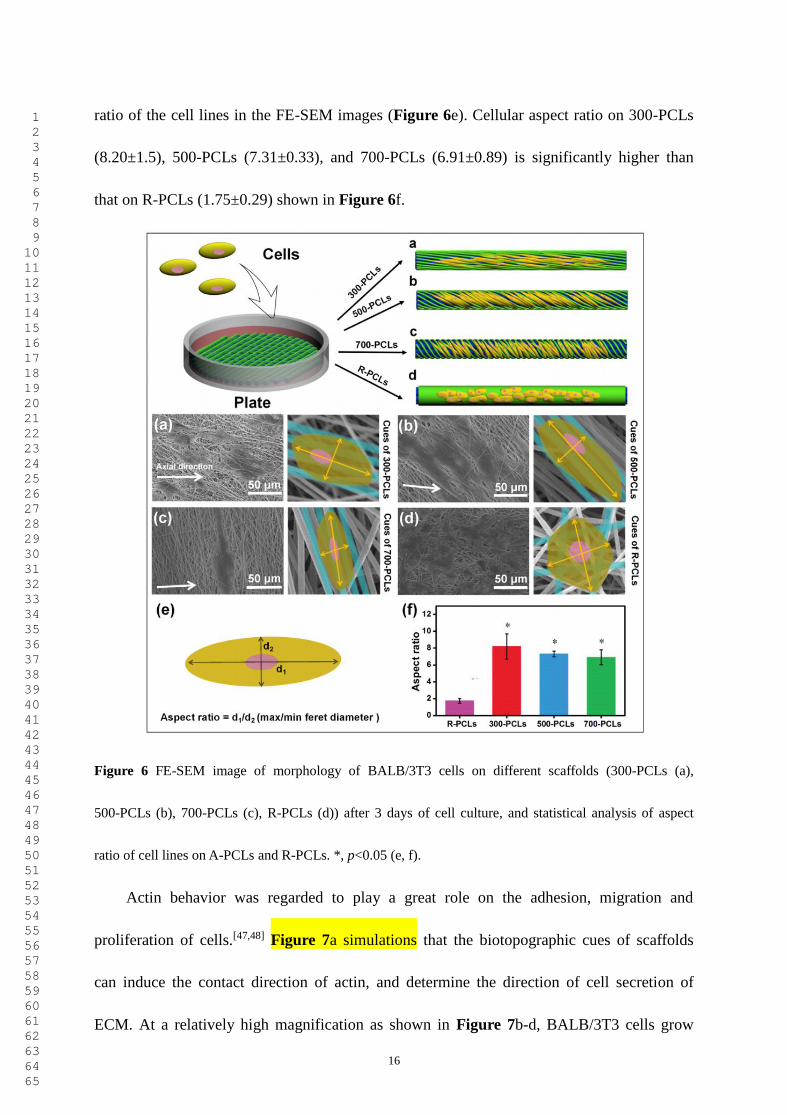
16
ratio of the cell lines in the FE-SEM images (Figure 6e). Cellular aspect ratio on 300-PCLs
(8.20±1.5), 500-PCLs (7.31±0.33), and 700-PCLs (6.91±0.89) is significantly higher than
that on R-PCLs (1.75±0.29) shown in Figure 6f.
Figure 6 FE-SEM image of morphology of BALB/3T3 cells on different scaffolds (300-PCLs (a),
500-PCLs (b), 700-PCLs (c), R-PCLs (d)) after 3 days of cell culture, and statistical analysis of aspect
ratio of cell lines on A-PCLs and R-PCLs. *, p<0.05 (e, f).
Actin behavior was regarded to play a great role on the adhesion, migration and
proliferation of cells.[47,48] Figure 7a simulations that the biotopographic cues of scaffolds
can induce the contact direction of actin, and determine the direction of cell secretion of
ECM. At a relatively high magnification as shown in Figure 7b-d, BALB/3T3 cells grow
1 2 3 4 5 6 7 8 9 10 11 12 13 14 15 16 17 18 19 20 21 22 23 24 25 26 27 28 29 30 31 32 33 34 35 36 37 38 39 40 41 42 43 44 45 46 47 48 49 50 51 52 53 54 55 56 57 58 59 60 61 62 63 64 65
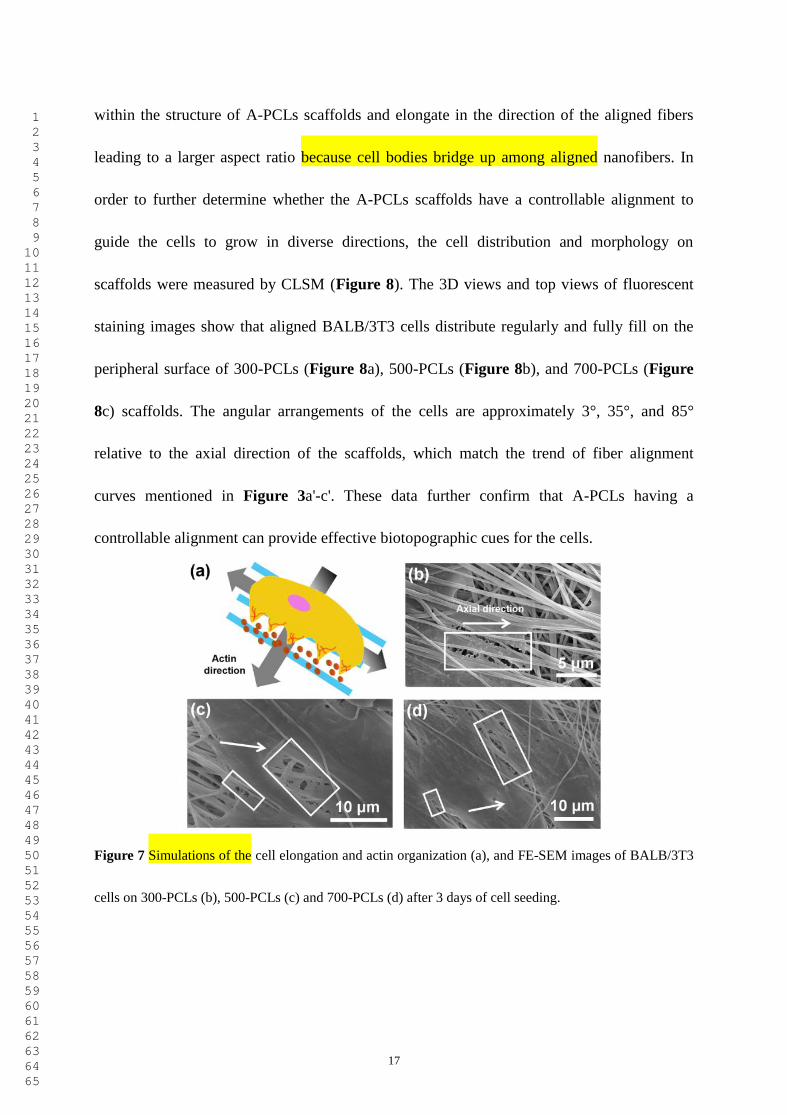
17
within the structure of A-PCLs scaffolds and elongate in the direction of the aligned fibers
leading to a larger aspect ratio because cell bodies bridge up among aligned nanofibers. In
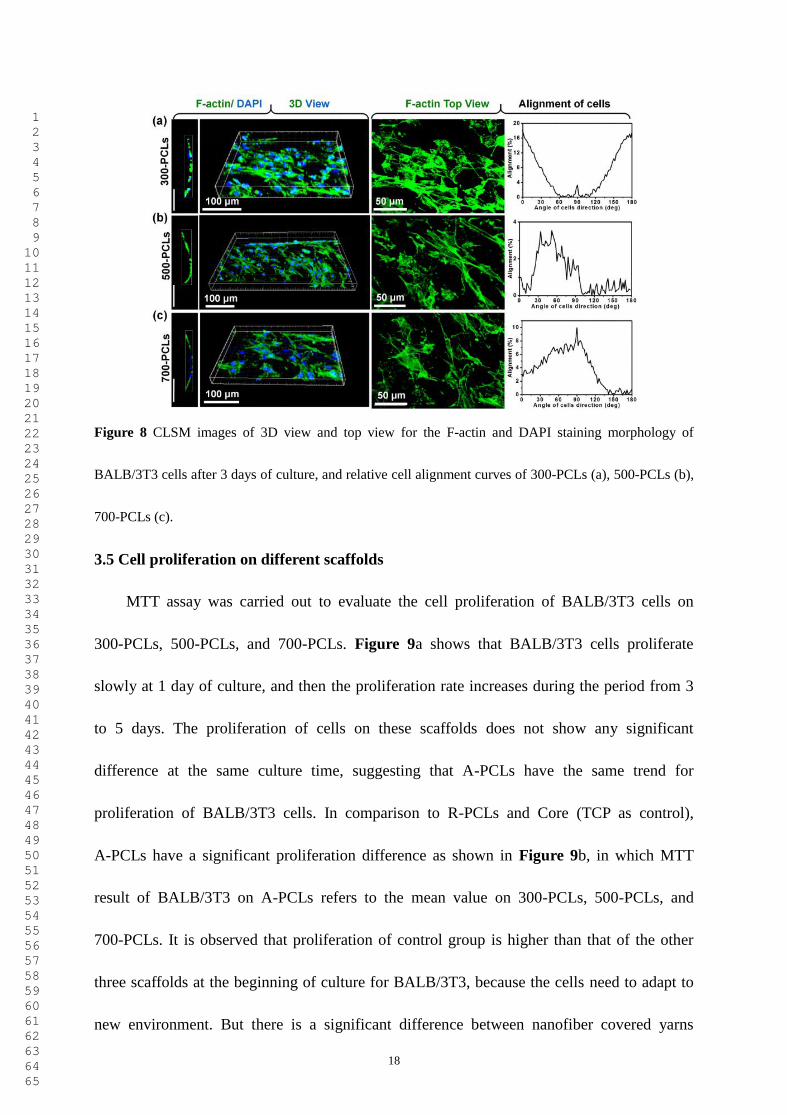
order to further determine whether the A-PCLs scaffolds have a controllable alignment to
guide the cells to grow in diverse directions, the cell distribution and morphology on
scaffolds were measured by CLSM (Figure 8). The 3D views and top views of fluorescent
staining images show that aligned BALB/3T3 cells distribute regularly and fully fill on the
peripheral surface of 300-PCLs (Figure 8a), 500-PCLs (Figure 8b), and 700-PCLs (Figure
8c) scaffolds. The angular arrangements of the cells are approximately 3°, 35°, and 85°
relative to the axial direction of the scaffolds, which match the trend of fiber alignment
curves mentioned in Figure 3a'-c'. These data further confirm that A-PCLs having a
controllable alignment can provide effective biotopographic cues for the cells.
Figure 7 Simulations of the cell elongation and actin organization (a), and FE-SEM images of BALB/3T3
cells on 300-PCLs (b), 500-PCLs (c) and 700-PCLs (d) after 3 days of cell seeding.
1 2 3 4 5 6 7 8 9 10 11 12 13 14 15 16 17 18 19 20 21 22 23 24 25 26 27 28 29 30 31 32 33 34 35 36 37 38 39 40 41 42 43 44 45 46 47 48 49 50 51 52 53 54 55 56 57 58 59 60 61 62 63 64 65
18
Figure 8 CLSM images of 3D view and top view for the F-actin and DAPI staining morphology of
BALB/3T3 cells after 3 days of culture, and relative cell alignment curves of 300-PCLs (a), 500-PCLs (b),
700-PCLs (c).
3.5 Cell proliferation on different scaffolds
MTT assay was carried out to evaluate the cell proliferation of BALB/3T3 cells on
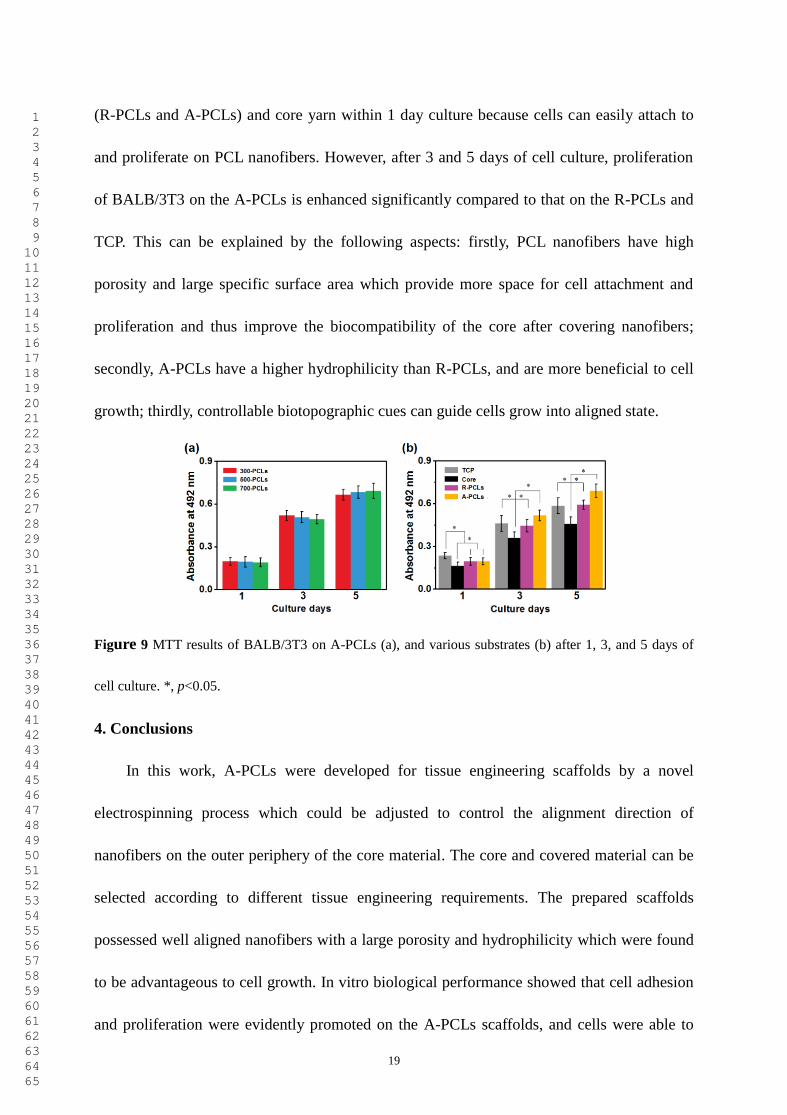
300-PCLs, 500-PCLs, and 700-PCLs. Figure 9a shows that BALB/3T3 cells proliferate
slowly at 1 day of culture, and then the proliferation rate increases during the period from 3
to 5 days. The proliferation of cells on these scaffolds does not show any significant
difference at the same culture time, suggesting that A-PCLs have the same trend for
proliferation of BALB/3T3 cells. In comparison to R-PCLs and Core (TCP as control),
A-PCLs have a significant proliferation difference as shown in Figure 9b, in which MTT
result of BALB/3T3 on A-PCLs refers to the mean value on 300-PCLs, 500-PCLs, and
700-PCLs. It is observed that proliferation of control group is higher than that of the other
three scaffolds at the beginning of culture for BALB/3T3, because the cells need to adapt to
new environment. But there is a significant difference between nanofiber covered yarns
1 2 3 4 5 6 7 8 9 10 11 12 13 14 15 16 17 18 19 20 21 22 23 24 25 26 27 28 29 30 31 32 33 34 35 36 37 38 39 40 41 42 43 44 45 46 47 48 49 50 51 52 53 54 55 56 57 58 59 60 61 62 63 64 65
19
(R-PCLs and A-PCLs) and core yarn within 1 day culture because cells can easily attach to
and proliferate on PCL nanofibers. However, after 3 and 5 days of cell culture, proliferation
of BALB/3T3 on the A-PCLs is enhanced significantly compared to that on the R-PCLs and
TCP. This can be explained by the following aspects: firstly, PCL nanofibers have high
porosity and large specific surface area which provide more space for cell attachment and
proliferation and thus improve the biocompatibility of the core after covering nanofibers;
secondly, A-PCLs have a higher hydrophilicity than R-PCLs, and are more beneficial to cell
growth; thirdly, controllable biotopographic cues can guide cells grow into aligned state.
Figure 9 MTT results of BALB/3T3 on A-PCLs (a), and various substrates (b) after 1, 3, and 5 days of
cell culture. *, p<0.05.
4. Conclusions
In this work, A-PCLs were developed for tissue engineering scaffolds by a novel
electrospinning process which could be adjusted to control the alignment direction of
nanofibers on the outer periphery of the core material. The core and covered material can be
selected according to different tissue engineering requirements. The prepared scaffolds
possessed well aligned nanofibers with a large porosity and hydrophilicity which were found
to be advantageous to cell growth. In vitro biological performance showed that cell adhesion
and proliferation were evidently promoted on the A-PCLs scaffolds, and cells were able to
1 2 3 4 5 6 7 8 9 10 11 12 13 14 15 16 17 18 19 20 21 22 23 24 25 26 27 28 29 30 31 32 33 34 35 36 37 38 39 40 41 42 43 44 45 46 47 48 49 50 51 52 53 54 55 56 57 58 59 60 61 62 63 64 65
20
identify the biotopographic cues provided by the surface aligned nanofibers. Furthermore, the
A-PCLs had sufficient mechanical properties for weaving or other post-treatments. Therefore,
these core-shell structure of A-PCLs scaffolds have significant potential for constructing
different 3D tissue bioengineered structures.
Supporting Information
Supporting Information is available from the Wiley Online Library or from the author.
Acknowledgments
This work was supported by grants from National Natural Science Foundation of China
(51503168), Shaanxi Innovation Talent Promotion Program-Project for Youth New Star of
Science and Technology (2017KJXX-23), China Scholarship Council (201708610031),
Disciplinary Construction Fund for Textile Science and Engineering of Xi'an Polytechnic
University (10709-0821), Xi'an Polytechnic University Innovation Fund for Graduate
Students (CX201729), and Special Funding for Postdoctoral Innovation Project in Shandong
Province (201504).
Conflict of Interest
The authors declare no conflict of interest
References
[1] R. Langer, J. P. Vacanti, Science 1993, 260, 920.
[2] R. O. Hynes, Science 2009, 326, 1216.
[3] E. H. Sage, J. Clin. Invest. 2001, 107, 781.
[4] D. H. Kim, P. P. Provenzano, C. L. Smith, A. Levchenko, J. Cell Biol. 2012, 197, 351.
[5] L. L. Qiu, C. Choong, Tissue Eng. Part B 2013, 19, 485.
1 2 3 4 5 6 7 8 9 10 11 12 13 14 15 16 17 18 19 20 21 22 23 24 25 26 27 28 29 30 31 32 33 34 35 36 37 38 39 40 41 42 43 44 45 46 47 48 49 50 51 52 53 54 55 56 57 58 59 60 61 62 63 64 65
21
[6] D. Dado, S. Levenberg, Semin. Cell Dev. Biol. 2009, 20, 656.
[7] D. Phu, L. S. Wray, R. V. Warren, R. C. Haskell, E. J. Orwin, Tissue Eng. Part A 2011, 17,
799.
[8] V. Chaurey, F. Block, Y. H. Su, P. C. Chiang, E. Botchwey, C. F. Chou, N. S. Swami,
Acta Biomater. 2012, 8, 3982.
[9] L. H. Han, X. Tong, F. Yang, Adv. Mater. 2014, 26, 1757.
[10] A. Autissier, V. C. Le, C. Pouzet, F. Chaubet, D. Letourneur, Acta Biomater. 2010, 6,
3640.
[11] T. Paulraj, N. Feoktistova, N. Velk, K. Uhlig, C. Duschl, D. Volodkin, Macromol. Rapid
Comm. 2014, 35, 1408.
[12] T. M. Hsieh, C. W. Ng, K. Narayanan, A. C. Wan, J. Y. Ying, Biomaterials 2010, 31,
7648.
[13] S. Chen, T. Nakamoto, N. Kawazoe, G. Chen, Biomaterials 2015, 73, 23.
[14] F. Pati, D. H. Ha, J. Jang, H. H. Han, J. W. Rhie, D. W. Cho, Biomaterials 2015, 62, 164.
[15] C. A. Lawrence, Woodhead Pubulishing, UK 2014.
[16] H. G. S. Ayaz, A. Perets, H. Ayaz, K. D. Gilroy, M. Govindaraj, D. Brookstein, P. Lelkes,
Biomaterials 2014, 35, 8540.
[17] F. T. Moutos, L. E. Freed, F. Guilak, Nat. Mater. 2007, 6, 162.
[18] T. A. Desai, Med. Eng. Phys. 2000, 22, 595.
[19] A. Formhals, 1934, USA Patent 1975504.
[20] T. Subbiah, G. S. Bhat, R. W. Tock, S. Parameswaran, S. S. Ramkumar, J. Appl. Polym.
Sci. 2005, 96, 557.
1 2 3 4 5 6 7 8 9 10 11 12 13 14 15 16 17 18 19 20 21 22 23 24 25 26 27 28 29 30 31 32 33 34 35 36 37 38 39 40 41 42 43 44 45 46 47 48 49 50 51 52 53 54 55 56 57 58 59 60 61 62 63 64 65
22
[21] E. D. Boland, G. E. Wnek, D. G. Simpson, K. J. Pawlowski, G. L. Bowlin, J. Macromol.
Sci. A 2001, 38, 1231.
[22] H. Cao, K. Mchugh, S. Y. Chew, J. M. Anderson, J. Biomed. Mater. Res. A 2010, 93,
1151.
[23] J. Radhakrishnan, A. A. Kuppuswamy, S. Sethuraman, J. Biomed. Nanotechnol. 2015, 11,
512.
[24] K. J. Aviss, J. E. Gough, S. Downes, Eur. Cells Mater. 2010, 19, 193.
[25] S. Y. Chew, R. Mi, A. Hoke, K. W. Leong, Biomaterials 2008, 29, 653.
[26] C. Y. Xu, R. Inai, M. Kotaki, S. Ramakrishna, Biomaterials 2004, 25, 877.
[27] J. Chen, J. Ge, B. Guo, K. Gao, P. X. Ma, J. Mater. Chem. B 2016, 4, 2477.
[28] S. Wu, B. Duan, X. Qin, J. T. Butcher, Acta Biomater. 2017, 51, 89.
[29] Y. Wu, L. Wang, B. Guo, P. X. Ma, ACS Nano 2017, 11, 5646.
[30] L. Wang, Y. Wu, B. Guo, P. X. Ma, ACS Nano 2015, 9, 9167.
[31] P. A. Mouthuy, N. Zargar, O. Hakimi, E. Lostis, A. Carr, Biofabrication 2015, 7,
025006.
[32] L. Li, J. Ge, L. Wang, B. Guo, P. M. Ma, J. Mater. Chem. B 2014, 2, 6119.
[33] J. Wu, C. Huang, W. Liu, A. Yin, W. Chen, C. He, H. Wang, S. Liu, C. Fan, G. L. Bowlin,
X. Mo, J. Biomed. Nanotechnol. 2014, 10, 603.
[34] D. Li, X. Pan, B. Sun, T. Wu, W. Chen, C. Huang, Q. Ke, H. A. EI-Hamshary, S. S.
Al-Deyab, X. Mo, J. Mater. Chem. B 2015, 3, 8823.
[35] F. Zamani, M. Amanitehran, M. Latifi, M. A. Shokrgozar, A. Zaminy, J. Biomed. Mater.
Res. A 2014, 102, 506.
1 2 3 4 5 6 7 8 9 10 11 12 13 14 15 16 17 18 19 20 21 22 23 24 25 26 27 28 29 30 31 32 33 34 35 36 37 38 39 40 41 42 43 44 45 46 47 48 49 50 51 52 53 54 55 56 57 58 59 60 61 62 63 64 65
23
[36] S. Liu, J. Wu, X. Liu, D. Chen, G. L. Bowlin, L. Cao, J. Lu, F. Li, X. Mo, C. Fan, Mater.
Res. A 2015, 103, 581.
[37] J. Chen, M. Yu, B. Guo, P. X. Ma, Z. Yin, J. Colloid Interf. Sci. 2018, 514, 517.
[38] R. B. Martin, D. B. Burr, N. A. Sharkey, D. P. Fyhrie, New York: Springer, 1998.
[39] C. K. Liu, H. J. He, R. J. Sun, Y. Feng, Q. S. Wang, Mater. Des. 2016, 112, 456.
[40] J. Pu, K. Komvopoulos, Acta Biomater. 2014, 10, 2718.
[41] C. E. Ayres, B. S. Jha, H. Meredith, J. R. Bowman, G. L. Bowlin, S. C. Henderson, D. G.
Simpson, J. Biomater. Sci. Polym. Ed. 2008, 19, 603.
[42] B. B. Manda, S. C. Kundu, Biomaterials 2009, 30, 2956.
[43] B. Li, C. Liu, F. Zhou, X. Mao, R. Sun, Biotechnol. Lett. 2018, 12, 4287.
[44] W. J. Li, C. T. Laurencin, E. J. Caterson, R. S. Tuan, F. K. Ko, J. Biomed. Mater. Res. A
2002, 60, 613.
[45] A. Thorvaldsson, H. Stenhamre, P. Gatenholm, P. Walkenström, Biomacromolecules
2008, 9, 1044.
[46] L. Wang, Y. Wu, T. Hu, B. Guo, P. X. Ma, Acta Biomater. 2017, 59, 68.
[47] T. D. Pollard, J. A. Cooper, Science 2009, 326, 1208.
[48] M. Emmert, P. Witzel, D. Heinrich, Soft Matter 2016, 12, 4287.
1 2 3 4 5 6 7 8 9 10 11 12 13 14 15 16 17 18 19 20 21 22 23 24 25 26 27 28 29 30 31 32 33 34 35 36 37 38 39 40 41 42 43 44 45 46 47 48 49 50 51 52 53 54 55 56 57 58 59 60 61 62 63 64 65

Supporting Information
Click here to access/downloadSupporting Informationsupport information.doc

Click here to access/downloadProduction Data
Production data.rar
Top Related