


Languages
Pages
Legal


Child Adjustment and Parent Efficacy Scale –
Developmental Disability (CAPES-DD)
First psychometric evaluation of a new child and parenting
assessment tool for children with a developmental disability
Theresa Emser
HFCC, Banff, 3 February 2016

Agenda
1) Developmental Disabilities
2) Existing measures and CAPES-DD
3) Results
4) Conclusions and outlook

Overall prevalence rate: about 14% for children aged 3 – 17 years
(Boyle et al., 2011)
Developmental Disabilities
Emotional and behavioural problems
3 to 4 times elevated risk (Einfeld & Tongue, 1996)
mental disorders in children and/or adolescents with
ID: comorbidity rates of 30 to 50% (Einfeld, Ellis & Emerson, 2011)
higher frequency of any diagnosed ICD-10 disorder (Emerson, 2003)
Increase the risk of parental stress (Roberts, Mazzucchelli, Taylor, & Reis, 2003)
Parenting
programs
such as
SSTP

Existing measures
&
CAPES-DD

Child Behavior Checklist for Ages
6-18 (CBCL)
(Achenbach & Rescorla, 2001)
No norms for children with a DD
Very long and time-consuming
Incurs a fee
The Strengths and Difficulties Questionnaire (SDQ)
(Goodman, 1997)
Limited access for online use
Developed for typically developing children
Some subscales lack a satisfying internal consistency
The Developmental Behaviour Checklist (DBC)
(Einfeld & Tonge, 2002)
Developed for children with an intellectual disability

• In the public domain, relatively brief
• Sensitive to change, reliable and valid
• Assesses different behaviour domains
• Suitable for children aged 2 to 16
• Appropriate for a range of respondents (parents, carers, teachers)
Need for an economical instrument that
• Assesses emotional and behavioural problems of children with DD
• Is change sensitive
• Has good psychometric properties
• Is in the public domain
CAPES
-DD
+ scale assessing parental self-efficacy
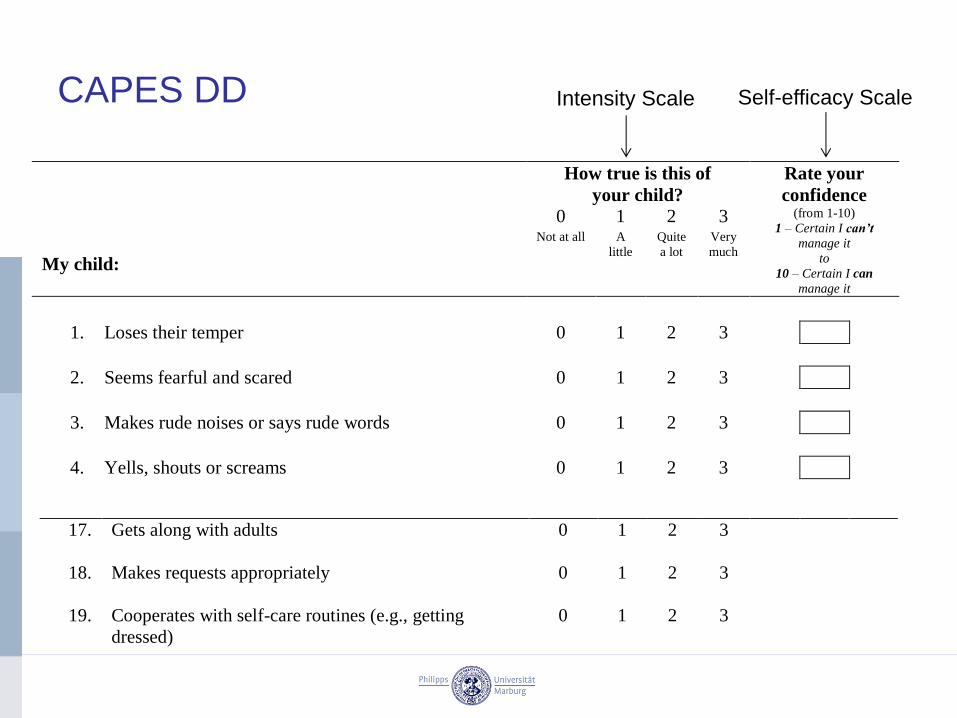
CAPES DD
How true is this of
your child?
Rate your
confidence
0 1 2 3 (from 1-10)
1 – Certain I can’t
manage it
to
10 – Certain I can
manage it
My child:
Not at all A
little
Quite
a lot
Very
much
1. Loses their temper 0 1 2 3
2. Seems fearful and scared 0 1 2 3
3. Makes rude noises or says rude words 0 1 2 3
4. Yells, shouts or screams 0 1 2 3
5. Demands attention 0 1 2 3
6. Hurts me or others (e.g., hits, bites, scratches, pinches,
pushes) 0 1 2 3
7. Becomes upset over changes to routines or
surroundings 0 1 2 3
8. Breaks or destroys things 0 1 2 3
9. Whines or complains 0 1 2 3
10. Does not cooperate with requests 0 1 2 3
11. Cries easily for no apparent reason 0 1 2 3
12. Is overactive or restless 0 1 2 3
13. Seems unhappy or sad 0 1 2 3
14. Hurts themselves (e.g., hits, bites, scratches, pinches) 0 1 2 3
15. Becomes upset when separated from familiar people 0 1 2 3
16. Fusses over food or refuses to eat 0 1 2 3
How true is this of
your child?
0 1 2 3
My child:
Not at all A
little Quite
a lot Very
much
17. Gets along with adults 0 1 2 3
18. Makes requests appropriately 0 1 2 3
19. Cooperates with self-care routines (e.g., getting
dressed)
0 1 2 3
How true is this of
your child?
Rate your
confidence
0 1 2 3 (from 1-10)
1 – Certain I can’t
manage it
to
10 – Certain I can
manage it
My child:
Not at all A
little
Quite
a lot
Very
much
1. Loses their temper 0 1 2 3
2. Seems fearful and scared 0 1 2 3
3. Makes rude noises or says rude words 0 1 2 3
4. Yells, shouts or screams 0 1 2 3
5. Demands attention 0 1 2 3
6. Hurts me or others (e.g., hits, bites, scratches, pinches,
pushes) 0 1 2 3
7. Becomes upset over changes to routines or
surroundings 0 1 2 3
8. Breaks or destroys things 0 1 2 3
9. Whines or complains 0 1 2 3
10. Does not cooperate with requests 0 1 2 3
11. Cries easily for no apparent reason 0 1 2 3
12. Is overactive or restless 0 1 2 3
13. Seems unhappy or sad 0 1 2 3
14. Hurts themselves (e.g., hits, bites, scratches, pinches) 0 1 2 3
15. Becomes upset when separated from familiar people 0 1 2 3
16. Fusses over food or refuses to eat 0 1 2 3
How true is this of
your child?
0 1 2 3
My child:
Not at all A
little Quite
a lot Very
much
17. Gets along with adults 0 1 2 3
18. Makes requests appropriately 0 1 2 3
19. Cooperates with self-care routines (e.g., getting
dressed)
0 1 2 3
Intensity Scale Self-efficacy Scale

RESULTS OF THE
PSYCHOMETRIC EVALUATION

My Say Survey
(n = 559)
Curtin Study
(n = 77)
Age (M) own 38
6
41
6.5 child
% %
Gender child Male 73.6 67.5
Female 26.4 32.5
Relationship to child Mother 91.9 87.7
Father 3 8.2
Working status Fulltime 15.3 21.1
Part time 20.5 39.4
Not in paid employment 46.7 32.4
Household Original family 72.4 80.8
Step family 3.9 1.4
Sole parent family 18 9.6
Marital status Married 69.4 74
Divorced/separated 11 13.7
Single 9.8 2.7
Cohabiting/de facto 8.5 8.2
Socio-demographic characteristics
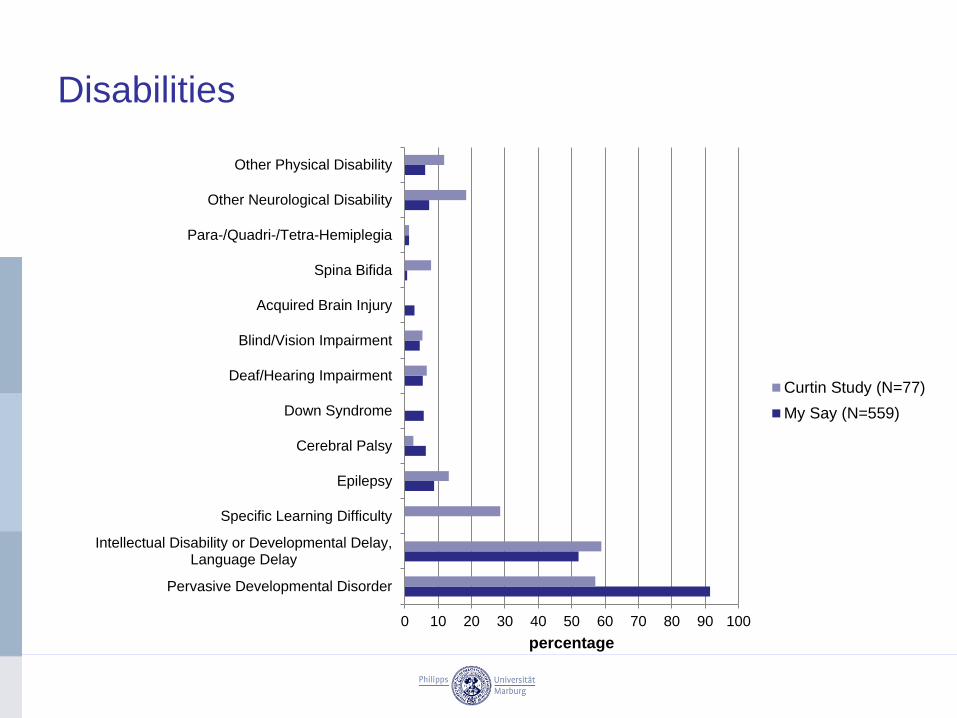
Disabilities
0 10 20 30 40 50 60 70 80 90 100
Pervasive Developmental Disorder
Intellectual Disability or Developmental Delay,Language Delay
Specific Learning Difficulty
Epilepsy
Cerebral Palsy
Down Syndrome
Deaf/Hearing Impairment
Blind/Vision Impairment
Acquired Brain Injury
Spina Bifida
Para-/Quadri-/Tetra-Hemiplegia
Other Neurological Disability
Other Physical Disability
percentage
Curtin Study (N=77)
My Say (N=559)

Item properties - Intensity scale
Item mean difficulty
part-whole
corrected
discriminatory
power
In_1 1.5 50.000 0.609 0.670
In_2 1.13 37.667 0.357 0.374
In_3 0.8 26.667 0.436 0.505
In_4 0.52 17.333 0.457 0.438
In_5 0.67 22.333 0.406 0.363
In_6 0.59 19.667 0.416 0.475
In_7 1.08 36.000 0.456 0.502
In_8 1.4 46.667 0.643 0.683
In_9 0.93 31.000 0.380 0.371
In_10 1.38 46.000 0.577 0.631
In_11 1 33.333 0.605 0.614
In_12 1.49 49.667 0.557 0.610
In_13 0.86 28.667 0.566 0.596
In_14 1.42 47.333 0.396 0.421
In_15 1.17 39.000 0.513 0.569
In_16 0.29 9.667 0.240 0.246
In_17 1.46 48.667 0.547 0.536
In_18 0.82 27.333 0.553 0.586
In_19 1.29 43.000 0.599 0.624
In_20 0.65 21.667 0.504 0.549
Item mean difficulty
part-whole
corrected
discriminatory
power
In_21 1.57 52.333 0.319 0.464
In_22 1.21 40.333 0.468 0.643
In_23 1.58 52.667 0.470 0.549
In_24 1.51 50.333 0.341 0.449
In_25 1.12 37.333 0.381 0.560
In_26 2.02 67.333 0.307 0.528
In_27 1.28 42.667 0.462 0.613
In_28 1.24 41.333 0.424 0.635
In_29 0.87 29.000 0.500 0.548
In_30 1.39 46.333 0.470 0.595
“Is inactive, listless”
reversed
Good:
• Difficulty: 20 < P < 80
• Discriminatory power: 0.4 < rit(i) < 0.7

Item properties/ Self-efficacy scale
item mean difficulty part-whole corrected
discriminatory power
con_1 6.76 64.000 0.606
con_2 7.46 71.778 0.516
con_3 7.46 71.778 0.623
con_4 7.16 68.444 0.644
con_5 7.56 72.889 0.563
con_6 7.52 72.444 0.651
con_7 7.08 67.556 0.700
con_8 6.38 59.778 0.722
con_9 7.27 69.667 0.546
con_10 6.66 62.889 0.684
con_11 6.34 59.333 0.635
con_12 6.68 63.111 0.752
con_13 6.65 62.778 0.684
con_14 6.68 63.111 0.550
con_15 6.79 64.333 0.727
con_16 7.86 76.222 0.552
con_17 6.19 57.667 0.747
con_18 6.94 66.000 0.743
con_19 6.65 62.778 0.731
con_20 7.07 67.444 0.676
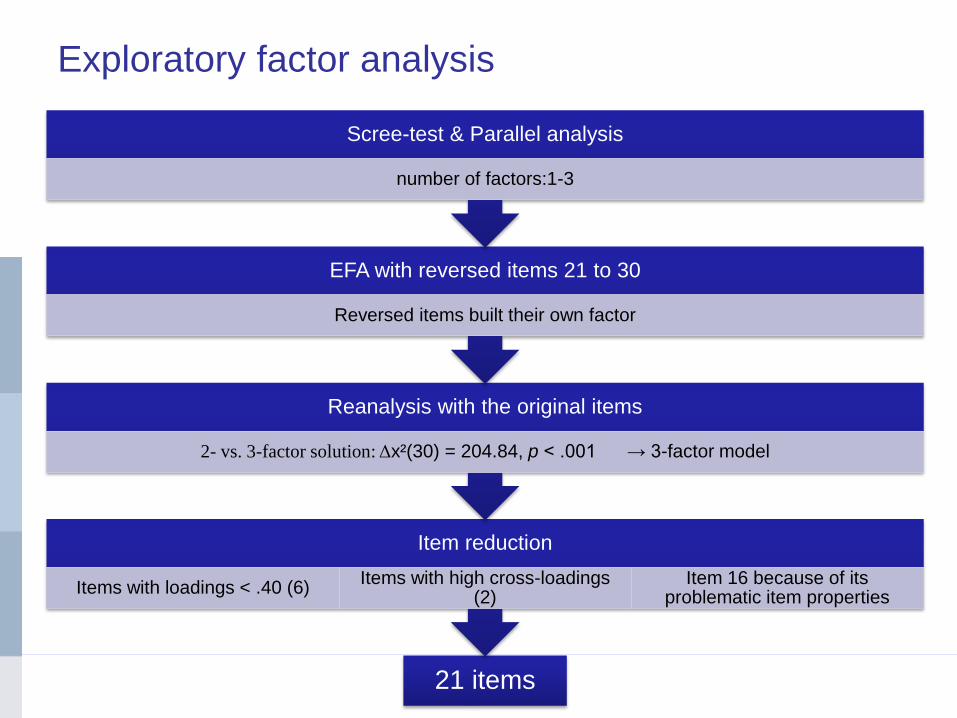
21 items
Item reduction
Items with loadings < .40 (6) Items with high cross-loadings
(2) Item 16 because of its
problematic item properties
Reanalysis with the original items
2- vs. 3-factor solution: Δx²(30) = 204.84, p < .001 → 3-factor model
EFA with reversed items 21 to 30
Reversed items built their own factor
Scree-test & Parallel analysis
number of factors:1-3
Exploratory factor analysis

Exploratory factor analysis - Intensity scale
Item Factor 1 Factor 2 Factor 3 1 .89 -.03 .10 6 .58 .02 .13 8 .79 .02 -.01 10 .66 .18 .03 11 .72 -.09 -.09 13 .63 -.13 -.02 15 .54 .34 .02 17 .58 .07 -.14 19 .65 .18 -.03 3 .23 .48 -.01 12 .54 .17 .01 18 .36 .50 -.10 20 .40 .49 .02 21 .05 -.18 .57 22 -.01 -.21 .66 24 .01 -.27 .46 25 -.09 .04 .67 26 -.02 -.00 .58 27 -.23 .11 .62 28 .00 -.01 .71 30 -.19 -.01 .60
RMSEA: 0.06
CFI: 0.92
TLI: 0.88
SRMR: 0.04
Good (satisfying) fit: RMSEA ≤ .05 (.08) CFI/TLI ≥ .95 (.90) SRMR ≤ .08
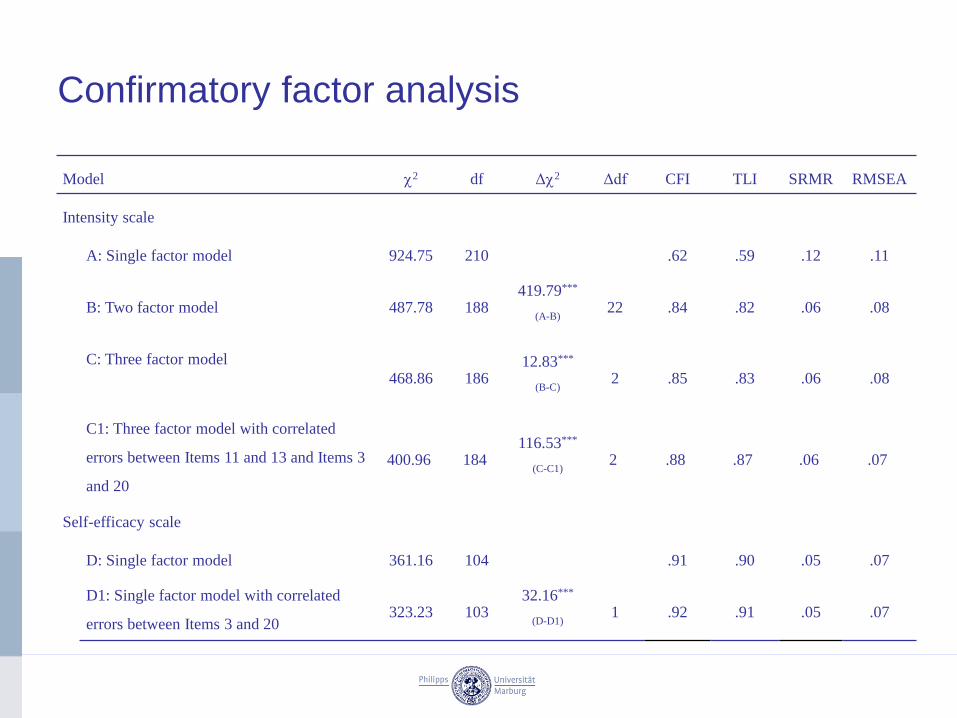
Confirmatory factor analysis
Model 2 df Δ2 Δdf CFI TLI SRMR RMSEA
Intensity scale
A: Single factor model 924.75 210 .62 .59 .12 .11
B: Two factor model 487.78 188
419.79***
(A-B) 22 .84 .82 .06 .08
C: Three factor model
468.86 186
12.83***
(B-C) 2 .85 .83 .06 .08
C1: Three factor model with correlated
errors between Items 11 and 13 and Items 3
and 20
400.96 184 116.53***
(C-C1) 2 .88 .87 .06 .07
Self-efficacy scale
D: Single factor model 361.16 104 .91 .90 .05 .07
D1: Single factor model with correlated
errors between Items 3 and 20 323.23 103
32.16***
(D-D1) 1 .92 .91 .05 .07

.461***
.718***
-.393***
.379***
.729***
.686***
.561***
.584***
.511***
.663***
Figure 3. Factor structure of the Intensity scale with one correlated error term, intercorrelations of the factors and standardised
estimates. **p < .05 ***p < .001. Numbers according to item numbers in the final version of the CAPES-DD (Appendix B)
.413***
.874***
-.470**
.765***
.564***
.797***
.671***
.683***
.597***
.601***
.696***
.556***
.608***
.459***
.611***
.488***
1. Loses their temper
3. Makes rude noises or says rude
words
5. Demands attention
6. Hurts me or others (e.g., hits, bites,
scratches, pinches, pushes)
7. Becomes upset over changes to
routines or surroundings
2. Seems fearful and scared
13. Seems unhappy or sad
4. Yells, shouts or screams
12. Is overactive or restless
11. Cries easily for no apparent reason
9. Whines or complains
10. Does not cooperate with requests
8. Breaks or destroys things
17. Expresses feelings appropriately
14. Gets along with adults
19. Comforts others who are upset or
hurt
15. Makes requests appropriately
20. Shares with others
21. Gets along with peers
16. Cooperates with self-care routines
(e.g., getting dressed)
Emotional
problems
Prosocial
behaviour
Behavioural
problems
18. Keeps busy without adult attention
3 additional items:
- Hurts themselves [e.g., hits, bites, scratches, pinches]
- Becomes upset when separated from familiar people
- Fusses over food or refuses to eat

Internal consistency
Cronbach’s α
Model 1
Intensity Scale .91
Externalising subscale .88
Internalising subscale .81
Model 2
Total problems scale* .90
Behavioural problems scale .89
Emotional problems scale .71
Prosocial behaviour scale .82
Self-efficacy scale, original .94
Self-efficacy scale, abridged version* .94
Note. *including the 3 additional items

Concurrent validity 1 2 3 4 5 6 7 8 9 10 11
1. CAPES-DD
Total problems -
2. CAPES-DD
Behavioural problems .96** -
3. CAPES-DD
Emotional problems .75** .59** -
4. CAPES-DD
Prosocial behaviour -.34** -.34** -.19** -
5. DBC-P
TBPS .85** .80** .62** -.37** -
6. DBC-P
Disruptive/antisocial .83** .85** .57** -.30** .87** -
7. DBC-P
Self-absorbed .64** .61** .39** -.36** .87** .61** -
8. DBC-P
Communication
disturbance
.63** .59** .48** -.19** .81** .61** .66** -
9. DBC-P
Anxiety .68** .52** .65** -.16** .71** .56** .47** .58** -
10. DBC-P
Social relating .58** .50** .55** -.35** .71** .50** .57** .59** .57** -
11. DBC-U4
TBPS .86** .85** .58** -.38** N/A N/A N/A N/A N/A N/A -

Predictive validity 1 2 3 4 5 6 7 8 9 10 11 12 13
1. CAPES-DD
Total problems -
2. CAPES-DD
Behavioural problems .96** -
3. CAPES-DD
Emotional problems .75** .59** -
4. CAPES-DD
Prosocial behaviour -.34** -.34** -.19** -
5. CAPES-DD
Self-efficacy -.50** -.48** -.42** .35** -
6. PAFAS parenting
Parental consistency .16** .16** .06 -.21** -.28** -
7. PAFAS parenting
Coercive parenting .39** .42** .29** .00 -.39** .25** -
8. PAFAS parenting
Positive encouragement -.13* -.10* -.08 -.12* -.10 .14** -.01 -
9. PAFAS parenting
Parent-child relationship .11* .16** .03 -.20** -.24** .13* .34** .33** -
10. PAFAS family adjustment
Parental adjustment .32** .31** .28** -.25** -.41** .21** .36** .02 .29** -
11. PAFAS Family adjustment
Family relationships .35** .33** .29** -.14* -.31** .21** .36** .08 .23** .44** -
12. PAFAS family adjustment
Parental teamwork .29** .29** .20** -.10 -.17** .23** .24** -.02 .14* .49** .55** -
13. DBC-P
TBPS -.37** N/A N/A N/A N/A N/A N/A N/A -

• Economical length (24 items; 10 beh, 3 emo, 8 pro )
• Good psychometric value
• Provides a comprehensive picture
• Additional scale assessing parental self-efficacy
Conclusions
• Expansion of the sample
• Informants other than mothers
• Older age groups
• Different disablity types
• Development of norms
Outlook
Top Related