


Languages
Pages
Legal


SANDIA REPORTSAND2001–1989 Unlimited Release Printed July 2001
Canaveral ODMDS Dredged Material Erosion Rate Analysis
ENVIRONMENTAL PROTECTION AGENCY, REGION 4
Rich Jepsen, Jesse Roberts, Amy Lucero, and Mike Chapin
Prepared by Sandia National Laboratories Albuquerque, New Mexico 87185 and Livermore, California 94550
Sandia is a multiprogram laboratory operated by Sandia Corporation, a Lockheed Martin Company, for the United States Department of Energy under Contract DE-AC04-94AL85000.
Approved for public release; further dissemination unlimited.

Issued by Sandia National Laboratories, operated for the United States Department of Energy by Sandia Corporation.
NOTICE: This report was prepared as an account of work sponsored by an agency of the United States Government. Neither the United States Government, nor any agency thereof, nor any of their employees, nor any of their contractors, subcontractors, or their employees, make any warranty, express or implied, or assume any legal liability or responsibility for the accuracy, completeness, or usefulness of any information, apparatus, product, or process disclosed, or represent that its use would not infringe privately owned rights. Reference herein to any specific commercial product, process, or service by trade name, trademark, manufacturer, or otherwise, does not necessarily constitute or imply its endorsement, recommendation, or favoring by the United States Government, any agency thereof, or any of their contractors or subcontractors. The views and opinions expressed herein do not necessarily state or reflect those of the United States Government, any agency thereof, or any of their contractors.
Printed in the United States of America. This report has been reproduced directly from the best available copy.
Available to DOE and DOE contractors from Office of Scientific and Technical Information P.O. Box 62Oak Ridge, TN 37831
Prices available from (703) 605-6000 Web site: http://www.ntis.gov/ordering.htm
Available to the public from National Technical Information Service U.S. Department of Commerce5285 Port Royal RdSpringfield, VA 22161
NTIS price codes Printed copy: A04 Microfiche copy: A01

SAND 2001-1989Unlimited ReleasePrinted July, 2001
Canaveral ODMDS Dredged MaterialErosion Rate Analysis
ENVIRONMENTAL PROTECTION AGENCY,REGION 4
Rich Jepsen, Jesse Roberts, Amy Lucero, and Mike Chapin Carlsbad Programs Group
Soil and Sediment Transport Lab Sandia National Laboratories
P.O. Box 5800 Albuquerque, NM 87185-1395
Abstract In this study, the erosion properties of four sediments related to the Canaveral Ocean Dredged Material Disposal Site have been determined as a function of density, consolidation, and shear stress by means of a high shear stress sediment erosion flume at Sandia National Laboratories. Additional analysis was completed for each sediment to determine mineralogy, particle size, and organic content. This was done to support numerical modeling efforts, aid in effective management, and minimize environmental impact. The motivation for this work is based on concerns of dredged material transporting beyond the designated site and estimates of site capacity.
This work was supported by the Environmental Protection Agency under Contract DW-89-94586401-0
3
Contents
Section Page
1. Introduction..................................................................................................................... 92. Experimental Procedures .............................................................................................. 11
2.1 Description of the High Shear Stress Sediment Erosion Flume.............................. 112.2 Hydrodynamics........................................................................................................ 122.3 Core Preparation ...................................................................................................... 142.4 Measurements of Sediment Erosion Rates .............................................................. 142.5 Measurements of Critical Shear Stress for Erosion................................................. 152.6 Measurements of Sediment Bulk Properties ........................................................... 16
3. Results for Laboratory Consolidation and Erosion Tests ............................................. 193.1 Bulk Properties ........................................................................................................ 193.2 Erosion Rates........................................................................................................... 203.3 Critical Shear Stress................................................................................................. 22
4. Discussion of Results.................................................................................................... 234.1 Consolidation Properties.......................................................................................... 234.2 Bulk Properties ........................................................................................................ 234.3 Erosion Properties.................................................................................................... 244.4 Comparison with Other Natural Sediments............................................................. 25
5.0 Summary and Concluding Remarks ........................................................................... 26References......................................................................................................................... 28
4

LIST OF TABLES
Table Page
Table 1. Shear Stresses and Corresponding Mean Velocities ............... 29Table 2. Summary of all Sediment Bulk Properties ............................... 29Table 3. Constants for Equation 3.1 for the four composite sediments 30Table 4. Summary of Sediment Failure Modes during Erosion Tests . 30
5

LIST OF FIGURES
Figure Page
Figure 1. High Shear Stress Flume schematic. ........................................ 31
Figure 2. Particle size distribution for all Canaveral composites. ......... 32
Figure 3a. Bulk density as a function of depth and consolidation time (2, 10, 30, 60, and 90 days) for CDS-1 composite..................................... 33
Figure 3b. Bulk density as a function of depth and consolidation time (2, 10, 30, 60, and 90 days) for CDS-2 composite…………………………..26
Figure 3c. Bulk density as a function of depth and consolidation time (2, 10, 30, 60, and 90 days) for CH-EC-S-1 composite………………….27
Figure 3d. Bulk density as a function of depth and consolidation time (2, 10, 30, 60, and 90 days) for CHB-2 composite………………………28
Figure 4a. Erosion rate vs. bulk density and shear stress for CDS-1 composite. Shear stresses of 0.5, 1.0, 2.0 and 4.0 N/m2 are shown. ....... 37
Figure 4b. Erosion rate vs. bulk density and shear stress for CDS-2 Composite. Shear stresses of 0.5, 1.0, 2.0 and 4.0 N/m2 are shown…….30
Figure 4c. Erosion rate vs. bulk density and shear stress for CH-EC-S-1 Composite. Shear stresses of 0.5, 1.0, 2.0 and 4.0 N/m2 are shown…….31
Figure 4d. Erosion rate vs. bulk density and shear stress for CHB-2 Composite. Shear stresses of 0.5, 1.0, 2.0 and 4.0 N/m2 are shown…….32
Figure 5a. Erosion rate vs. depth for CDS-1 at 2 day consolidation. Shear stresses of 0.5, 1.0, 2.0 and 4.0 N/m2 are shown. ........................... 41
Figure 5b. Erosion rate vs. depth for CDS-1 at 10 day consolidation. Shear stresses of 0.5, 1.0, 2.0 and 4.0 N/m2 are shown………………….34
Figure 5c. Erosion rate vs. depth for CDS-1 at 60 day consolidation. Shear stresses of 0.5, 1.0, 2.0 and 4.0 N/m2 are shown………………….35
6

Figure 6a. Erosion rate vs. depth for CDS-2 at 2 day consolidation. Shear stresses of 0.5, 1.0, 2.0 and 4.0 N/m2 are shown. ........................... 44
Figure 6b. Erosion rate vs. depth for CDS-2 at 10 day consolidation. Shear stresses of 0.5, 1.0, 2.0 and 4.0 N/m2 are shown………………….37
Figure 6c. Erosion rate vs. depth for CDS-2 at 60 day consolidation. Shear stresses of 0.5, 1.0, 2.0 and 4.0 N/m2 are shown………………….38
Figure 7a. Erosion rate vs. depth for CH-EC-S-1 at 2 day consolidation. Shear stresses of 0.5, 1.0, 2.0 and 4.0 N/m2 are shown. ........................... 47
Figure 7b. Erosion rate vs. depth for CH-EC-S-1 at 10 day consolidation. Shear stresses of 0.5, 1.0, 2.0 and 4.0 N/m2 are shown….40
Figure 7c. Erosion rate vs. depth for CH-EC-S-1 at 60 day consolidation. Shear stresses of 0.5, 1.0, 2.0 and 4.0 N/m2 are shown
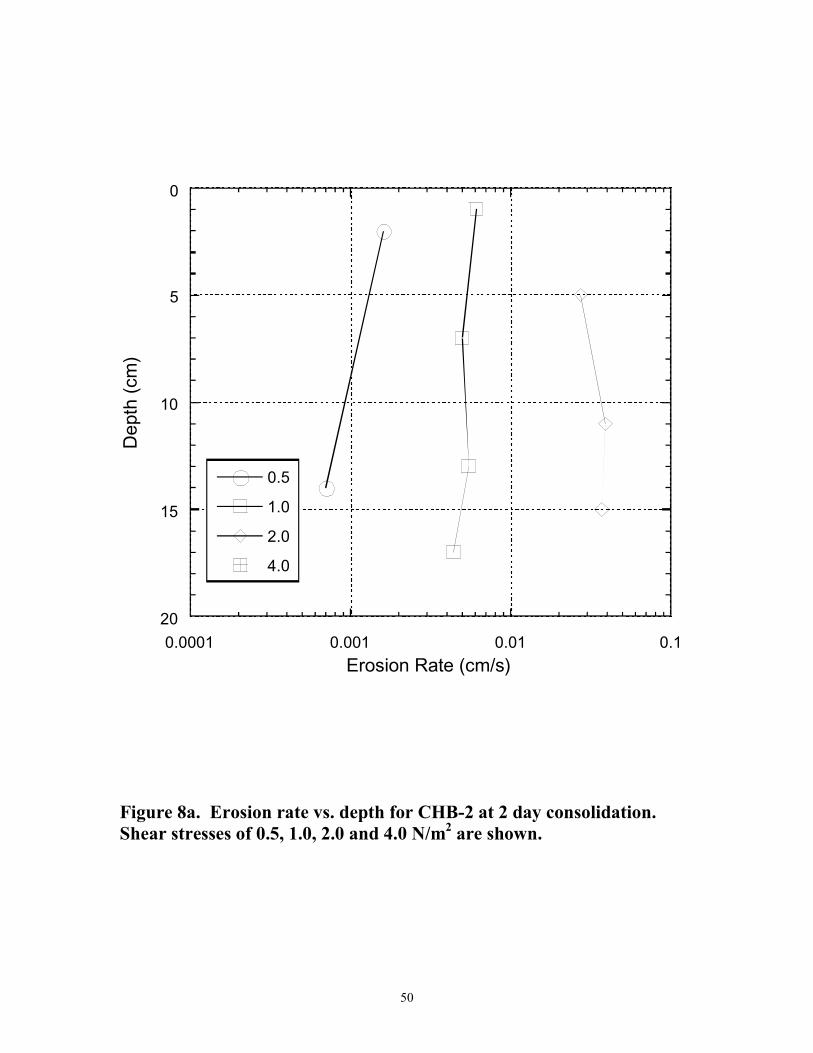
Figure 8a. Erosion rate vs. depth for CHB-2 at 2 day consolidation. Shear stresses of 0.5, 1.0, 2.0 and 4.0 N/m2 are shown. ........................... 50
Figure 8b. Erosion rate vs. depth for CHB-2 at 10 day consolidation. Shear stresses of 0.5, 1.0, 2.0 and 4.0 N/m2 are shown………………….43
Figure 8c. Erosion rate vs. depth for CHB-2 at 60 day consolidation. Shear stresses of 0.5, 1.0, 2.0 and 4.0 N/m2 are shown………………….44
Figure 9a. Critical shear stress as a function of bulk density for CDS-1. ....................................................................................................................... 53
Figure 9b. Critical shear stress as a function of bulk density for CDS-2…………………………………………………………………………….46
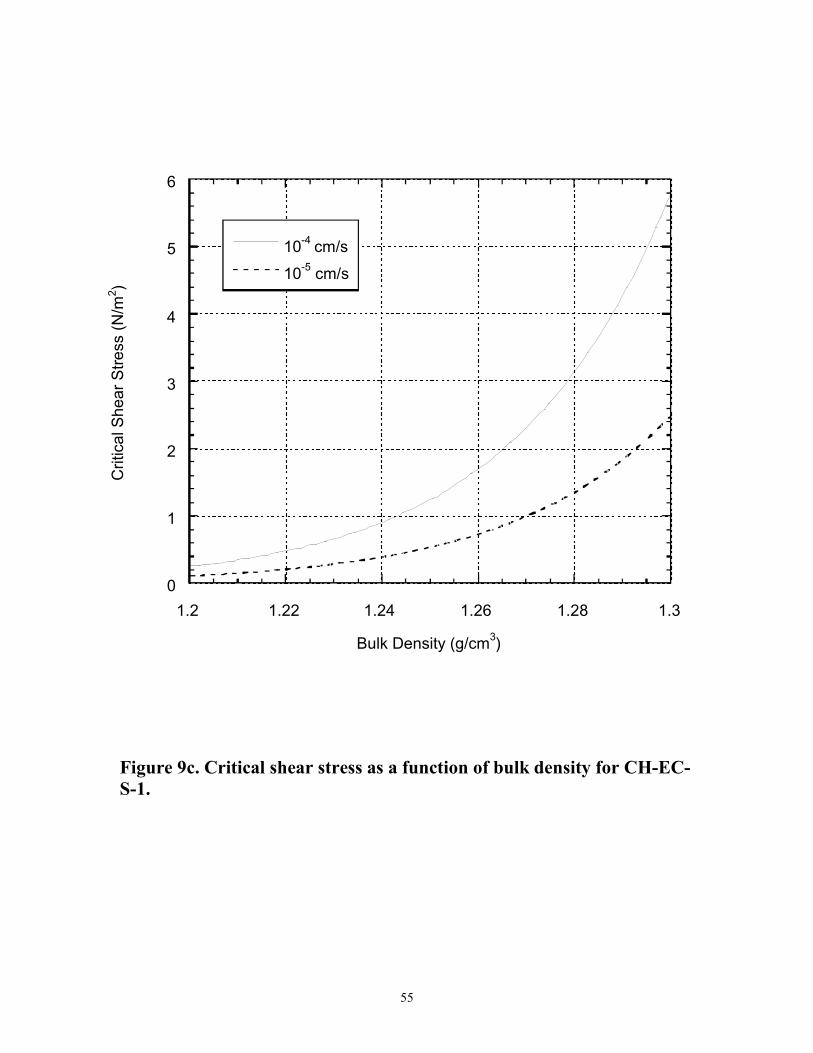
Figure 9c. Critical shear stress as a function of bulk density for CH-EC-S-1………………………………………………………………………….47
Figure 9d. Critical shear stress as a function of bulk density for CHB-2……………………………………………………………………………48
7
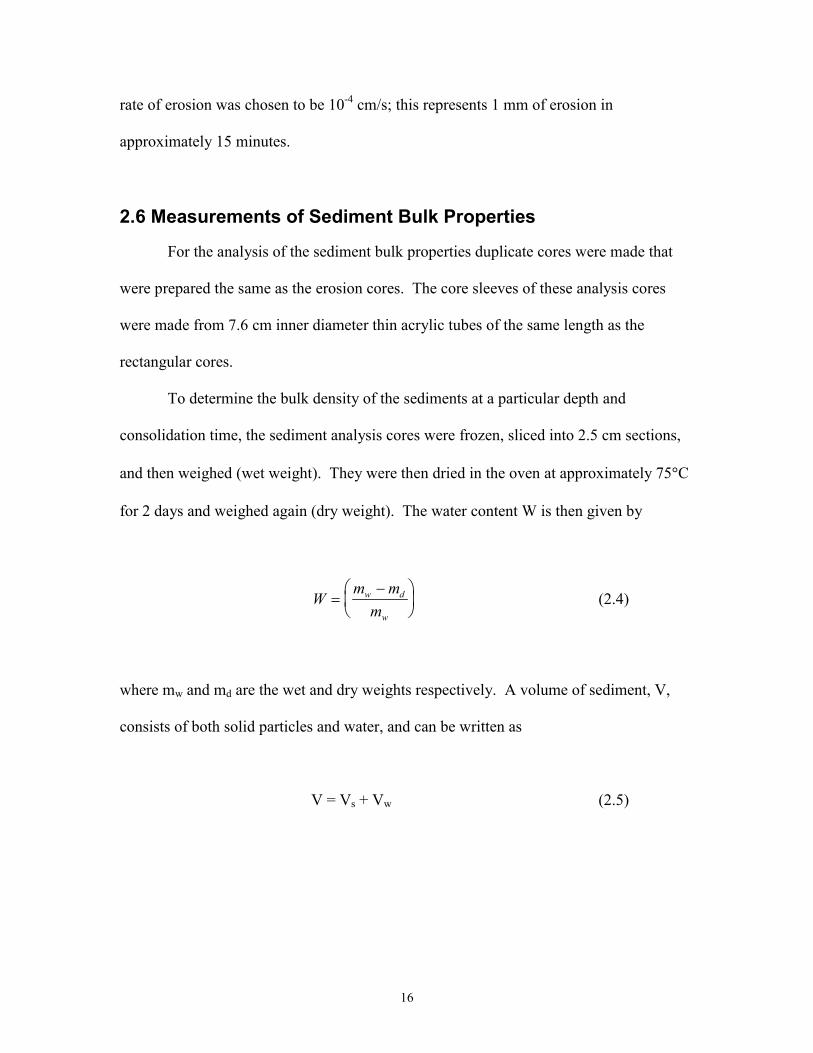
Figure 10. Erosion rate vs. bulk density at 1.6 N/m2 for several naturalsediments...................................................................................................... 57
8

1. Introduction
The U.S. Environmental Protection Agency (EPA) has the responsibility under
Section 102 of the Marine Protection Research and Sanctuaries Act (MPRSA) for the
management and monitoring of Ocean Dredged Material Disposal Sites (ODMDS). The
Canaveral ODMDS was designated by EPA in 1990 for disposal of dredged material
from the U.S. Navy Trident Basin and Entrance Channel, the Port of Canaveral facilities,
and the Corps of Engineers Civil Works Projects at Canaveral. Concurrent with the site
designation in 1990 a Site Management and Monitoring Plan (SMMP) was developed.
This plan is currently in the process of revision. A main component of site monitoring is
the determination of the short-term and long-term fate of materials disposed in the marine
environment. Concern has been raised regarding the magnitude and extent of disposed
dredged material dispersal outside of the ODMDS boundaries and the potential for
disposed dredged material impacting potential future offshore sand sources for beach
renourishment. Additionally, a quantitative analysis is needed to provide an estimate of
the long term capacity of the disposal site. Close to 1 million cubic yards of material are
disposed of at the Canaveral ODMDS every year. A significant portion of this material
comes from the entrance channel where the sediments have been classified as stiff clays
and silts, with horizons of very fine silty sand, shell fragments, and organics.
Numerous studies prior and subsequent to site designation have indicated that the
ODMDS is a dispersive site for fine grained material and as a result, dredged material
may extend well beyond the designated site boundaries. However, adequate site specific
information is not available to allow for a conclusive and quantitative statement regarding
sediment transport from the ODMDS. In order to address this issue, this work is intended
9

to collect site specific information regarding the erodibility of dredged material disposed
at the Canaveral ODMDS. Parameters calculated from this work can be used in existing
numerical models to provide quantitative estimates of the sediment transport occurring
within and near the ODMDS. This in turn can be used to effectively manage the
Canaveral ODMDS to minimize environmental impact.
In this study, the erosion rates of four reconstituted sediments, two from the
Canaveral ODMDS and two from the Canaveral Harbor, have been determined as a
function of density and shear stress by means of the High Shear Stress Sediment Erosion
Flume at Sandia National Laboratories. For all cores, bulk density was determined as a
function of depth and consolidation time. Sediment cores were eroded to determine
erosion rates as a function of density and shear stress. In addition, each sediment was
analyzed for particle size, mineralogy, and organic content.
In the following section, descriptions of the high shear stress sediment erosion
flume and experimental procedures are given. The results of laboratory studies for the
reconstituted sediments are presented in section 3. The fourth section discusses the
results for the consolidation, bulk parameter, and erosion properties, and the summary
and concluding remarks are given in the final section.
10

2. Experimental Procedures
The information in this section is partially based on the articles by Jepsen, et al.
(1997a), and Roberts, et al. (1998).
2.1 Description of the High Shear Stress Sediment Erosion Flume
A schematic of the High Shear Stress Sediment Erosion Flume is shown in Figure
1 and is essentially a straight flume, which has a test section with an open bottom through
which a rectangular cross-section coring tube containing sediment can be inserted. The
main components of the flume are the coring tube; the test section; an inlet section for
uniform, fully developed, turbulent flow; a flow exit section; a water storage tank; and a
pump to force water through the system. The coring tube, test section, inlet section, and
exit section are made of clear acrylic or polycarbonate so that the sediment-water
interactions can be observed. The coring tube has a rectangular cross-section, 10 cm by
15 cm, and can be up to 1 m in length.
Water is pumped through the system from a 120 gallon storage tank, through a 5
cm diameter pipe, and then through a flow converter into the rectangular duct shown.
This duct is 5 cm in height, 10 cm in width, and 200 cm in length; it connects to the test
section which has the same cross-sectional area and is 15 cm long. The flow converter
changes the shape of the cross-section from circular to the rectangular duct. The flow is
regulated by a three-way valve so that part of the flow goes into the duct while the
remainder returns to the tank. Also, there is a small valve in the duct (not shown)
11

immediately downstream from the test section which is opened at higher flow rates to
keep the pressure in the duct and over the test section at atmospheric conditions.
At the start of each test, the coring tube is filled with reconstructed sediments.
The procedure for preparing the reconstructed sediments in the laboratory will be
described in Section 2.3. The coring tube and the sediment it contains are then inserted
into the bottom of the test section. An operator moves the sediment upward using a
piston which is inside the coring tube and is connected to a mechanical jack and then
driven by a variable-speed controller. By this means, the sediments can be raised and
made level with the bottom of the test section. The speed of the jack movement can be
controlled at a variable rate in measurable increments as small as 0.25 mm.
Water is forced through the duct and the test section over the surface of the
sediments. The shear produced by this flow causes the sediments to erode. As the
sediments in the core erode, the core is continually moved upwards by the operator so
that the sediment-water interface remains level with the bottom of the test and inlet
sections. The erosion rate is recorded as the upward movement of the sediments in the
coring tube over time.
2.2 Hydrodynamics
For the flow rates of interest, it can be shown that fully developed turbulent flow
exists in the test section. Turbulent flow through pipes has been studied extensively, and
empirical functions have been developed which relate the mean flow rate to the wall
shear stress. In general, flow in circular cross-section pipes has been investigated.
However, the relations developed for flow through circular pipes can be extended to non
12

UD l1 é ù = 2 0log . - 0 8 .ê
ëúûl n
circular cross-sections by means of a shape factor. An implicit formula relating the wall
shear stress to the mean flow in a pipe of arbitrary cross-section can be obtained from
Prandtl's Universal Law of Friction (Schlichting, 1979). For a pipe with a smooth
surface, this formula is
(2.1)
where U is the mean flow speed, n is the kinematic viscosity, l is the friction factor, and
D is the hydraulic diameter defined as the ratio of four times the cross-sectional area to
the wetted perimeter. For a pipe with a rectangular cross-section, or duct, the hydraulic
diameter is
D = 2hw/(h + w) (2.2)
where w is the duct width and h is the duct height. The friction factor is defined by
8t l =
U2 r (2.3)
where r is the density of water and t is the wall shear stress. Inserting Eqs. (2.2) and
(2.3) into Eq. (2.1) then gives the wall shear stress t as an implicit function of the mean
flow speed U. For the above equations, h is 5 cm, w is 10.5 cm, r is 1 g/cm3, and n is
0.01 cm2/s. Table 1 shows mean velocities, U, and their corresponding shear stresses.
13

For shear stresses in the range of 0.1 to 10 N/m2, the Reynolds numbers, UD/n,
are on the order of 104 to 105. These values for Reynolds numbers are sufficient for
turbulent flow to exist for the stresses of interest in this study. For flow in a circular pipe,
turbulent flow theory suggests that the transition from laminar to turbulent flow occurs
within 25 to 40 diameters from the entrance to the pipe. Since the hydraulic diameter of
the duct pipe is 6.8 cm, this suggests an entry length of approximately 170 to 270 cm.
The length of the duct leading to the test section is 180 cm and is preceded by a 20 cm
flow converter and several meters of inlet pipe. These arguments along with direct
observations indicate that the flow is fully turbulent in the test section.
2.3 Core Preparation
To gain insight on how sediment consolidation parameters (namely bulk density
or water content of the sediment) affect erosion rates, reconstituted sediments were
prepared in the laboratory. To obtain different bulk densities, sediment cores were
prepared as follows. Approximately 20 gallons of wet sediments were placed in 35
gallon cylindrical tanks and mixed until the sediment-water mixture was homogeneous.
The sediment mixtures were then poured into at least five 30 cm coring tubes. These
cores were allowed to consolidate for 2, 10, 30, 60, and 90 days.
2.4 Measurements of Sediment Erosion Rates
The procedure for measuring the erosion rates of the sediments as a function of
shear stress and depth was as follows. The sediment cores were prepared as described
above and then moved upward into the test section until the sediment surface was even
14

with the bottom of the test section. A measurement was made of the depth to the bottom
of the sediment in the core. The flume was then run at a specific flow rate corresponding
to a particular shear stress. Erosion rates were obtained by measuring the remaining core
length at different time intervals, taking the difference between each successive
measurement, and dividing by the time interval.
In order to measure erosion rates at several different shear stresses using only one
core, the following procedure was generally used. Starting at a low shear stress, the
flume was run sequentially at higher shear stresses with each succeeding shear stress
being twice the previous one. Generally about three shear stresses were run sequentially.
Each shear stress was run until at least 5 mm but no more than 4 cm were eroded. Also,
each shear stress was run for a minimum of 20 seconds and a maximum of 15 minutes.
This defines the minimum and maximum erosion rates measured by the high shear stress
sediment erosion flume to be about 1.0 x 10⁻⁴ and 0.1 cm/s respectively. The time
interval was recorded for each run with a stop watch. The flow was then increased to the
next shear stress, and so on until the highest shear stress was run. This cycle was
repeated until all of the sediment had eroded from the core. If after three cycles a
particular shear stress showed a rate of erosion less than 10-4 cm/s, it was dropped from
the cycle; if after many cycles the erosion rates decreased significantly, a higher shear
stress was included in the cycle.
2.5 Measurements of Critical Shear Stress for Erosion
A critical shear stress can be quantitatively defined as the shear stress at which a
very small, but accurately measurable, rate of erosion occurs. In the present study, this
15
md ö÷ø
æ -mwW çè
= mw
rate of erosion was chosen to be 10-4 cm/s; this represents 1 mm of erosion in
approximately 15 minutes.
2.6 Measurements of Sediment Bulk Properties
For the analysis of the sediment bulk properties duplicate cores were made that
were prepared the same as the erosion cores. The core sleeves of these analysis cores
were made from 7.6 cm inner diameter thin acrylic tubes of the same length as the
rectangular cores.
To determine the bulk density of the sediments at a particular depth and
consolidation time, the sediment analysis cores were frozen, sliced into 2.5 cm sections,
and then weighed (wet weight). They were then dried in the oven at approximately 75°C
for 2 days and weighed again (dry weight). The water content W is then given by
(2.4)
where mw and md are the wet and dry weights respectively. A volume of sediment, V,
consists of both solid particles and water, and can be written as
V = Vs + Vw (2.5)
16

where Vs is the volume of solid particles and Vw is the volume of water. If the sediment
particles and water have densities rs and rw respectively, the water content of the
sediment can be written as
r Vw wW = rV
(2.6)
where r is the bulk density of the sediments. A mass balance of the volume of sediment
gives
rV = rsVs + rwVw (2.7)
By combining Eqs. (2.5), (2.6), and (2.7), an explicit expression can be
determined for the bulk density of the sediment, r, as a function of the water content, W,
and the densities of the sediment particles and water. This equation is
r rs w r =
r + (r - r )Ww s w
(2.8)
For the purpose of these calculations, it has been assumed that rs = 2.6 gm/cm3 and rw =
1.0 gm/cm3.
Particle sizes and particle size distributions were determined by use of a Malvern
Mastersizer S particle sizing package for particle diameters between 0.05 and 900 mm.
All sediment samples had particle sizes less than 900 mm. Approximately 5 to 10 grams
17

of sediment were placed in a beaker containing about 500 mL of water and mixed by
means of a magnetic stir bar/plate combination. Approximately 1 mL of this solution
was then inserted into the sizers sampling system and further disaggregated as it is re
circulated through the sampling system by means of a centrifugal pump. The sample was
allowed to disaggregate for five minutes on the stir plate and an additional five minutes in
the recirculating pump sampling system before analysis by the sizer. To ensure complete
dissagregation and sample uniformity the sediment samples were analyzed multiple times
and repeated in triplicate. From these measurements, the distribution of grain sizes and
mean grain sizes as a function of depth were obtained.
The dry sediment was crushed into powder and then weighed. Approximately 5
mL of 10% hydrochloric acid was added to every 1 gram of dry sediment (Tye et al.
1996). The sample was again dried in the oven at 75°C, and analyzed in an UIC, Inc.
Model CM5014 CO2 Coulometer to determine the total organic carbon content of the
sediment.
The mineralogies of the sediments were determined by means of X-ray powder
diffraction using a Bruker, AXS Model D8 Advance X-ray Diffractometer. Samples
were crushed to a size of about 10 mm before being measured by X-ray diffraction.
18

3. Results for Laboratory Consolidation and Erosion Tests
Tests were done to determine erosion properties for four sediments retrieved from
the Canaveral ODMDS and Harbor with respect to consolidation and bulk density. The
sites are identified as CDS-1, CDS-2, CHB-2, and CH-EC-S-1. CDS-1 and CDS-2 are
from the ODMDS. CH-B-2 is from the West Turning Basin of the Canaveral Harbor and
CH-EC-S-1 was a composite of samples collected from a disposal barge with sediments
dredged from the Canaveral Harbor Entrance Channel.
3.1 Bulk Properties
Particle size, bulk density, organic content, and mineralogy of each of the four
composite sediment mixtures were measured. The size distributions for each composite
are shown in Figure 2. The mean particle size was 52.2, 92.2, 27.1, and 23.3 mm for the
CDS-1, CDS-2, CH-EC-S-1, and CHB-2 sediments respectively. The organic content for
the composite mixture was 3.21 % for CDS-1, 2.23 % for CDS-2, 4.37% for CH-EC-S-1,
and 3.57% for CHB-2. The mineralogy of each composite and a summary of all sediment
properties are shown in Table 2. Particle size, organic content, and mineralogy were
constant with depth for each composite core. Bulk density was the only parameter that
was a variable in each core.
Bulk density was determined as a function of depth for 30 cm core lengths.
Consolidation times were between 2 and 90 days for each core. Densities were
determined by measuring the water content of each core in 2.5 cm increments. Sediment
bulk densities are shown in Figure 3a-d for CDS-1, CDS-2, CH-EC-S-1, and CHB-2
19

sediments respectively. For all cores, the bulk density generally increases with depth and
consolidation time.
3.2 Erosion Rates
Erosion rates as a function of shear stress and depth were obtained for all
sediments at consolidation times of 2, 10 and 60 days. Erosion rates were measured for
shear stresses of 0.5, 1.0, 2.0, and 4.0 N/m2. The erosion rates for the lower shear stress
of 0.5 N/m2 could only be reasonably measured for the upper portion of the cores and for
short consolidation times (i.e., low densities). This is because erosion either did not
occur or was so slow that it would have taken hours to days to erode a measurable
amount of sediment. Likewise, the 4.0 N/m2 shear could not be tested at all depths
because it eroded low bulk density areas too fast for the operator to accurately measure
erosion rates.
All of the data for erosion rates as a function of bulk density for shear stresses of
0.5, 1.0, 2.0, and 4.0 N/m2 are shown for each sediment in Figures 4a-d. Erosion rates vs.
depth for each sediment and consolidation time is shown in Figures 5a-c for CDS-1, 6a-c
for CDS-2, 7a-c for CH-EC-S-1, and 8a-c for CHB-2. A large decrease in erosion rate as
the bulk density increases can be seen at all shear stresses. A smaller decrease in erosion
rates was seen as a function of depth for each consolidation time. In general, the data can
be approximated by an equation of the form
n mE = At r (3.1)
20

where E is the erosion rate (cm/s), t is the shear stress (N/m2), r is the bulk density
(g/cm3), and n, m, and A are constants. The constants are shown in Table 3 for each
composite sediment. For each shear stress, the erosion rate as a function of bulk density is
shown as a straight line which demonstrates that the above equation represents the data
quite well and also that the erosion rate is a unique function of shear stress and bulk
density. This relationship (with different constants) has been shown successfully to
describe many other natural and synthetic sediments (Jepsen et al, 1997a, 1997b and
1998, and Roberts et al, 1998).
There were fewer data obtained for the CH-EC-S-1 and CHB-2 sediments
compared to the CDS-1 and CDS-2 sediments. The CH-EC-S-1 and CHB-2 sediments
were much finer in particle size and more cohesive than the other sediments and
generally eroded as 1 to 2 cm aggregates rather than as individual particles or smaller
millimeter sized aggregates. This erosion behavior required larger depth intervals (~3 to 4
cm) to obtain accurate erosion rate data. In addition, at shear stresses of 2.0 N/m2 and
consolidation times greater than 10 days, the sediments would occasionally develop a
horizontal fracture at depths up to 5 cm in which an entire section of the sediment would
lift out of the core and into the test section. This failure mode from the lift forces on the
surface of the cohesive sediments is difficult to quantify and is not included in the plots
showing the erosion rate as a function of density. Table 4 summarizes the depth
consolidation time, and dept at which these large failures occurred.
21

1 -m
né E ù t cr = êëA ûú
r n
3.3 Critical Shear Stress
The critical shear stress can also be determined as a function of bulk density.
From Eq. (3.1), the shear stress, t, can be defined as the critical shear stress, tcr, by
setting the erosion rate, E, to 10-4 cm/s. Solving for tcr as a function of bulk density gives
(3.2)
By substituting 10-4 cm/s for the erosion rate and the constants n, m, and A for
each sediment into the above equation, one obtains a general relation for the critical shear
stress. Substituting the constants listed in Table 3 for each sediment shows that the
critical shear stress increases rapidly with small increases of bulk density.
Since tests were done for most of the shear stresses at erosion rates down to 10-4
cm/s , Eq. (3.2) is well supported by experimental data. However, Eq. (3.2) can also
approximate the data for erosion rates less than the defined 10-4 cm/s erosion rate for the
critical shear stress. Although erosion rates less than 10-4 cm/s may be difficult to
measure accurately, the curves plotted in Figures 4a-d that are described by Eq. (3.1)
could be extrapolated to lower erosion rates. This would allow the critical shear stress to
be predicted for an erosion rate of 10-5 cm/s as well. For example, Figures 9a-d show the
critical shear stress (calculated for erosion rates of 10-4 and 10-5 cm/s) as a function of
bulk density as determined from Eq. (3.2) each composite.
22

4. Discussion of Results
4.1 Consolidation Properties
The consolidation of all sediments generally show an increase in density with
time and depth. The sediments that consolidated slowly and had lower densities (CH-EC-
S-1, CHB-2, and CDS-1) showed more density variation with time rather than depth. The
sediments from CDS-2 consolidated quickly and reached steady state between 30 and 60
days with the majority of consolidation occurring between 2 and 10 days. The other three
sediments reached a quasi-steady state at about 60 to 90 days. In addition, the CDS-2
sediments were significantly more dense than the other sediments. This was probably due
to the larger grain size of CDS-2 and its ability to expel the pore water quickly. Since the
sediments that consolidated to a lower density were fine-grained and cohesive, they are
less permeable and the pore water has difficulty escaping to the surface.
4.2 Bulk Properties
The bulk properties showed that all the sediments were similar in mineralogy.
However, the CH-EC-S-1 and CHB-2 sediments were also somewhat similar in particle
size, organic content, and density. CDS-1 and CDS-2 contained a significant amount of
sand sized material mixed with fine-grained silts and clay-sized material. However, the
majority of CDS-2 was sandy and CDS-1 was about half sand and half silt.
It should be noted that although all of the sediments had a significant size fraction
less than 10 mm, no clays were evident in any of the sediments. Depsite the absence of
clays, the two sediments with the smallest particle size (CH-EC-S-1 and CHB-2) were
very cohesive. The lack of clays does not necessarily preclude sediments from behaving
23

in a cohesive manner. Roberts et al. 1998 demonstrated that pure quartz behaves in a
cohesive manner at sizes of 5 to 125 mm.
Finally, there is a clear relationship between particle size, organic content, and
density. The sediment with the lowest density, CH-EC-S-1 also had the smallest particle
size and highest organic content while the sediment with the highest density CDS-2 had
the largest particle size and lowest organic content. This relationship was true for all four
sediments with respect to density, particle size and organic content.
4.3 Erosion Properties
There was a strong dependence on bulk density for the erosion rates of all the
sediments. The dependence on bulk density was greatest for CHB-2 and CH-EC-S-1.
This can be demonstrated by the magnitude of the slope of m for r from Eq. (3.1). These
two sediments were also fine-grained and the dependence on density can be used as a
qualitative measure of their cohesiveness. The dependence on density for the CDS-1 and
CDS-2 sediments was approximately a factor of two less than that for the finer-grained
sediments.
Erosion rates can also be compared to consolidation time. The sediments from
CDS-1 and CDS-2 were the most erosion resistant for short times (Figures 3a,b and
Figures 4a,b). However, at 60 days, the sediments from CH-EC-S-1 and CHB-2 had
similar erosion rates at the same shear stresses as CDS-1 and CDS-2. Extrapolating the
data to higher densities for each sediment shows that CH-EC-S-1 and CHB-2 would
become more difficult to erode than the larger-grained sediments at the same density.
However, these sediments do not appear to exist at higher densities since they seem to be
24

at a steady state in 60 days (Figures 3a-d). This demonstrates that more cohesive
sediments may be less erosion resistant at short and perhaps all consolidation times
because of the inability to expel the pore water.
4.4 Comparison with Other Natural Sediments
From Figure 10 it can be seen that the density range and erosion properties are
unique for each natural sediment. In general, sediments containing more sand or coarse-
grained material have higher density ranges and less dependence on bulk density while
the fine-grained, silty sediments have lower density ranges and greater dependence on
density. The CDS-1 and CDS-2 sediments were qualitatively similar to other sediments
found in near shore areas or harbors. These types of sediments generally contain some
fraction of sand as did CDS-1 and CDS-2. CDS-1 was similar to sites H06 and Ward1B
from the New York Harbor dumpsite. CDS-2 was similar in density range to A30NE
from the New York Harbor dumpsite, but the relationship between density and erosion
rates was quite different as shown by the difference in slope between these two
sediments.
The CHB-2 and CH-EC-S-1 sediments were more similar to the fine-grained
sediments found in river systems such as the Grand River, MI or the Fox River, WI.
Their density range was lower than any sediment previously tested. However, they did
have a similar relationship between erosion rate and density as shown by the steep slope
which is also present with the fine-grained riverine sediments.
25

5.0 Summary and Concluding Remarks
By means of the experiments described here, the effects of sediment bulk density
on erosion rates were measured for four composite sediments from the Canaveral
ODMDS. From these experiments, the following was determined. (1) The bulk density
of the sediments generally increases with depth and time. (2) For each sediment and shear
stress, the erosion rate is a unique function of bulk density and decreases as the bulk
density increases. (3) For each sediment, the erosion rate can be approximated as
n mE=At r (Eq. 3.1) where, A, n, and m are sediment specific, experimentally determined
constants. The relationship between erosion rate, bulk density, and shear stress also
allows one to predict erosion at any depth and consolidation time for the entire range of
density for each sediment using the data plotted on Figures 3a-d and Eq.( 3.1). Overall,
the CDS-2 sediment was the most erosion resistant at all consolidation times, whereas
CH-EC-S-1 and CHB-2 were the least erosion resistant.
In addition, each sediment was analyzed for bulk density, particle size,
mineralogy, and organic content. The mineralogy of each sediment was similar for all
sediments tested. The particle size and bulk density was alike for CH-EC-S-1 and CHB
2, and dissimilar for the other two sediments. Finally, the organic content ranged from 2
to 4% for all sediments.
It should be emphasized that the results reported here determine the effects of
bulk density and consolidation time on erosion for each individual sediment. These and
other tests have indicated that there is at least a qualitative relationship between other
bulk properties such as mineralogy, particle size and size distribution, and organic
content. Since the measurements of sediment bulk properties are standard and can be
26

determined relatively easily, it would be useful if sediment erosion rates could be
predicted from knowledge of the sediment bulk properties. At present, this cannot be
done. However, from experiments such as these, it is hoped that this will soon be
accomplished.
27

References
Jepsen, R., J. Roberts, and W. Lick, 1997a. Effects of Bulk Density on Sediment Erosion Rates, Water, Air, and Soil Pollution. Vol. 99, pp. 21-31.
Jepsen, R., J. Roberts, and W. Lick, 1997b. Long Beach Harbor Sediment Study, Report Submitted to the U.S. Army Corps of Engineers, DACW09-97-M-0068
Jepsen, R., Roberts, J., W. Lick, Gotthard, D., and Trombino, C, 1998. New York Harbor Sediment Study, Report Submitted to the U.S. Army Corps of Engineers, New York District.
Roberts, J., Jepsen, R., Gotthard, D., and Lick, W. 1998. Effects of Particle Size and Bulk Density on Erosion of Quartz Particles. Journal of Hydraulic Engineering. 124(12): 1261-1267.
Schlichting, H., 1979. Boundary-Layer Theory. Seventh ed, McGraw-Hill.
Tye, R., R. Jepsen, and W. Lick, 1996. Effects of Colloids, Flocculation, Particle Size, and Organic Matter on the Adsorption of Hexachlorobenzene to Sediments, Environmental Toxicology and Chemistry. Vol. 15, No. 5, pp. 643–651.
28

Table 1. Shear Stresses and Corresponding Mean Velocities
Shear Stress (N/m2) Mean Velocity (cm/s) 0.1 16.3 0.5 40.9 1 60.5 2 89.4 4 131.8 6 165.2 8 194.0
10 219.6
Table 2. Summary of all Sediment Bulk Properties
Sediment Name Bulk Density Range (g/cm3)
Mean Particle Size (mm)
Mean Organic Content (% by mass)
Mineralogy (Minerals listed in descending amount)
CDS-1 1.33-1.44 52.2 3.21 Quartz, Muscovite, Albite, Microcline
CDS-2 1.55-1.65 92.2 2.23 Quartz, Muscovite, Albite, Microcline
CH-EC-S-1 1.20-1.25 23.3 4.37 Quartz, Albite, Microcline, Muscovite
CHB-2 1.21-1.27 27.1 3.57 Quartz, Microcline, Muscovite, Albite
29

Table 3. Constants for Equation 3.1 for the four composite sediments
Sediment n m A CDS-1 2.32 -43.9 1055 CDS-2 2.71 -66.8 3.35X10¹⁰
CH-EC-S-1 2.73 -107.1 1.33X10⁶
CHB-2 2.51 -105.2 4.85X10⁶
Table 4. Summary of Sediment Failure Modes during Erosion Tests
Identity Consolidation Time (days)
Depth (cm) Where Failure Occurred
CHB-2 10 7.5-9.5 CHB-2 10 11.5-13.0 CHB-2 60 5.5-10.0 CHB-2 60 11.5-15.5
CH-EC-S-1 2 8.5-11.0 CH-EC-S-1 10 11.0-14.0 CH-EC-S-1 10 17.0-19.0 CH-EC-S-1 60 7.5-12.5
30

Inlet 5 cm Flow
Pump
Figure 1. High Shear Stress F
Side View
Outlet
Core
Jack
Test Section
Piston
lume schematic.
31

0
2
4
6
8
10
% V
olum
e
CDS-1
CDS-2 CH-EC-S-1
CHB-2
0.1 1 10 100 1000 Particle Size (xm)
Figure 2. Particle size distribution for all Canaveral composites.
32

Dep
th (c
m)
0
5
10
15
20
25
30
2 10
30 60 90
1.3 1.35 1.4
Bulk Density (g/cm3)
1.45
Figure 3a. Bulk density as a function of depth and consolidation time(2, 10, 30, 60, and 90 days) for CDS-1 composite.
33

Bulk Density (g/cm3)
1.54 1.56 1.58 1.6 1.62 1.64 1.66
Bulk Density (g/cm3)
Dep
th (c
m)
0
5
10
15
20
25
30
2 10
30 60 90
Figure 3b. Bulk density as a function of depth and consolidation time(2, 10, 30, 60, and 90 days) for CDS-2 composite.
34

0
Dep
th (c
m )
5
10
15
20
25
301.18 1.2 1.22 1.24 1.26
Bulk Density (g/cm3)
2 10 30 60 90
Figure 3c. Bulk density as a function of depth and consolidation time(2, 10, 30, 60, and 90 days) for CH-EC-S-1 composite.
35

Bulk Density )1.2 1.22 1.24 1.26 1.28
3Bulk Density (g/cm3)
0
5
10
15
20
25
30
)D
epth
(cm
2 10 30 60 90
Figure 3d. Bulk density as a function of depth and consolidation time(2, 10, 30, 60, and 90 days) for CHB-2 composite.
36

10-5
0.01
0.1
/s)
0.0001
0.001
Eros
ion
Rat
e (c
m
0.5
1.0
2.0
4.0
1.3 1.35 1.4
Bulk Density (g/cm3)
1.45
Figure 4a. Erosion rate vs. bulk density and shear stress for CDS-1composite. Shear stresses of 0.5, 1.0, 2.0 and 4.0 N/m2 are shown.
37

10-5
(/s
)
0.0001
0.001
0.01
0.1
Eros
ion
Rat
ecm
0.5 1.0 2.0 4.0
1.54 1.56 1.58 1.6 1.62 1.64
Bulk Density (g/cm3)
Figure 4b. Erosion rate vs. bulk density and shear stress for CDS-2 Composite. Shear stresses of 0.5, 1.0, 2.0 and 4.0 N/m2 are shown.
38

10-5
0.01
0.1
(/s
)
0.0001
0.001
Eros
ion
Rat
e cm
0.5 1.0
2.0
4.0
1.18 1.2 1.22 1.24 1.26
Bulk Density (g/cm3)
Figure 4c. Erosion rate vs. bulk density and shear stress for CH-EC-S-1 Composite. Shear stresses of 0.5, 1.0, 2.0 and 4.0 N/m2 are shown.
39

Eros
ion
Rat
e (c
m/s
)
0.1
0.01
0.001
0.0001
10-5
0.5 1.0 2.0 4.0
1.2 1.22 1.24 1.26
Bulk Density (g/cm3)
1.28
Figure 4d. Erosion rate vs. bulk density and shear stress for CHB-2Composite. Shear stresses of 0.5, 1.0, 2.0 and 4.0 N/m2 are shown.
40

0
Dep
th (c
m)
5
10
15
200.0001 0.001 0.01
Erosion Rate (cm/s)
0.1
0.5
1.0 2.0
4.0
Figure 5a. Erosion rate vs. depth for CDS-1 at 2 day consolidation.Shear stresses of 0.5, 1.0, 2.0 and 4.0 N/m2 are shown.
41

0
Dep
th (c
m)
5
10
15
200.0001 0.001 0.01
Erosion Rate (cm/s)
0.1
0.5
1.0
2.0
4.0
Figure 5b. Erosion rate vs. depth for CDS-1 at 10 day consolidation.Shear stresses of 0.5, 1.0, 2.0 and 4.0 N/m2 are shown.
42

0
) mc
h (
Dep
t
5
10
15
20
0.0001 0.001 0.01
Erosion Rate (cm/s)0.1
0.5
1.0
2.0
4.0
Figure 5c. Erosion rate vs. depth for CDS-1 at 60 day consolidation.Shear stresses of 0.5, 1.0, 2.0 and 4.0 N/m2 are shown.
43

0
Dep
th (c
m)
5
10
15
20
0.0001 0.001 0.01
Erosion Rate (cm/s)0.1
0.5
1.0
2.0
4.0
Figure 6a. Erosion rate vs. depth for CDS-2 at 2 day consolidation. Shear stresses of 0.5, 1.0, 2.0 and 4.0 N/m2 are shown.
44

0
5
10
15
20
)D
epth
(cm
0.0001 0.001 0.01
Erosion Rate (cm/s)
0.1
0.5
1.0
2.0
4.0
Figure 6b. Erosion rate vs. depth for CDS-2 at 10 day consolidation.Shear stresses of 0.5, 1.0, 2.0 and 4.0 N/m2 are shown.
45

0
5
10
15
20
)D
epth
(cm
0.5
1.0
2.0
4.0
0.0001 0.001 0.01
Erosion Rate (cm/s)0.1
Figure 6c. Erosion rate vs. depth for CDS-2 at 60 day consolidation.Shear stresses of 0.5, 1.0, 2.0 and 4.0 N/m2 are shown.
46

0
5
10
15
20
)D
epth
(cm
0.5
1.0
2.0
4.0
0.0001 0.001 0.01
Erosion Rate (cm/s)
Figure 7a. Erosion rate vs. depth for CH-EC-S-1 at 2 day consolidation. Shear stresses of 0.5, 1.0, 2.0 and 4.0 N/m2 are shown.
47
0.1

0
5
10
15
20
)D
epth
(cm
0.0
0.5
1.0
2.0
4.0
001 0.001 0.01
Erosion Rate (cm/s)0.1
Figure 7b. Erosion rate vs. depth for CH-EC-S-1 at 10 day consolidation. Shear stresses of 0.5, 1.0, 2.0 and 4.0 N/m2 are shown.
48

0
5
10
15
20
)D
epth
(cm
0.
0.5
1.0
2.0
4.0
0001 0.001 0.01
Erosion Rate (cm/s)
0.1
Figure 7c. Erosion rate vs. depth for CH-EC-S-1 at 60 day consolidation. Shear stresses of 0.5, 1.0, 2.0 and 4.0 N/m2 are shown.
49
0
Dep
th (c
m)
5
10
15
20
0.0001 0.001 0.01
Erosion Rate (cm/s)0.1
0.5
1.0
2.0
4.0
Figure 8a. Erosion rate vs. depth for CHB-2 at 2 day consolidation. Shear stresses of 0.5, 1.0, 2.0 and 4.0 N/m2 are shown.
50

0
Dep
th (c
m)
5
10
15
200.0001 0.001 0.01
Erosion Rate (cm/s)0.1
0.5
1.0
2.0
4.0
Figure 8b. Erosion rate vs. depth for CHB-2 at 10 day consolidation. Shear stresses of 0.5, 1.0, 2.0 and 4.0 N/m2 are shown.
51

0
5
10
15
20
Dep
th (c
m)
0.0001 0.001 0.01
Erosion Rate (cm/s)
0.1
0.5
1.0
2.0
4.0
Figure 8c. Erosion rate vs. depth for CHB-2 at 60 day consolidation. Shear stresses of 0.5, 1.0, 2.0 and 4.0 N/m2 are shown.
52

0
0.5
1
1.5
2
2.5
iti2 )
Cr
cal S
hear
Stre
ss (N
/m
1.3 1.35 1.4 1.45
Bulk Density (g/cm3)
1.5
10-4 cm/s
10-5 cm/s
Figure 9a. Critical shear stress as a function of bulk density for CDS-1.
53

0
0.5
1
1.5
2
2.5
iti2 )
Cr
cal S
hear
Stre
ss (N
/m
1.5 1.55 1.6 1.65
Bulk Density (g/cm3)
1.7
10-4 cm/s 10-5 cm/s
Figure 9b. Critical shear stress as a function of bulk density for CDS-2.
54
0
1
2
3
4
5
6
iti2 )
Cr
cal S
hear
Stre
ss (N
/m
1.2 1.22 1.24 1.26 1.28
Bulk Density (g/cm3)
1.3
10-4
10-5 cm/scm/s
Figure 9c. Critical shear stress as a function of bulk density for CH-EC-S-1.
55

Crit
ical
She
ar S
tress
(N/m
2 )
3.5
3
2.5
2
1.5
1
0.5
01.2 1.22 1.24 1.26 1.28
Bulk Density (g/cm3)
1.3
10-4 cm/s
10-5 cm/s
Figure 9d. Critical shear stress as a function of bulk density for CHB-2.
56

0.1
Eros
ion
Rat
e (c
m/s
)
0.01
0.00
0.000
10-5
Erosion vs Bulk Density for Natural Sediments
(Shear Stress of 1.6 N/m 2)
Goleta Fox Long
ADetroit
H06
30NE Grand Ward1B Boston Harbor Boston Harbor
Canaveral Canaveral Canaveral Canaveral
1.2 1.3 1.4 1.5 1.6 1.7 1.8 Bulk Density (g/cm3)
1.9
Figure 10. Erosion rate vs. bulk density at 1.6 N/m2 for several natural sediments.
57

DISTRIBUTION
External Christopher J. McArthur, P.E. U.s. Environmental Protection Agency Region 4 Wetlands, Coastal and NonPoint Source Branch 61 Forsyth Street, S.W. Atlanta, GA 30303
US Army Corps of Engineers (2) Coastal and Hydraulics Laboratory CEWES-CC-C 3909 Halls Ferry Rd Vicksburg, MS 39180 Attn: J. Gailani
Internal
MS Org. 0771 6800 M. Chu 1395 6820 P.E. Shoemaker 1395 6822 F.D. Hansen 1395 6822 R. Jepsen 1395 6822 J. Roberts 1395 6822 M. Chapin 1395 6822 A. Lucero 1395 6820 F.C. Allan (6) 0755 6251 M. Hightower 0734 6803 L. Bustard 9018 8495-1 Central Technical Files 0899 9616 Technical Library (2) 0612 9612 Review and Approval Desk
for DOE/OSTI 0161 11599 Patent & Licensing Office
Distribution - 1
Top Related