


Languages
Pages
Legal


Claremont Colleges Claremont Colleges
Scholarship @ Claremont Scholarship @ Claremont
Pomona Senior Theses Pomona Student Scholarship
2019
Can Uber and Lyft Save Public Transit? Can Uber and Lyft Save Public Transit?
Emily Zheng
Follow this and additional works at: https://scholarship.claremont.edu/pomona_theses
Part of the Econometrics Commons, Economic Policy Commons, Environmental Policy Commons,
Policy Design, Analysis, and Evaluation Commons, Public Affairs Commons, Public Economics Commons,
Public Policy Commons, Science and Technology Policy Commons, Science and Technology Studies
Commons, Transportation Commons, and the Urban Studies Commons
brought to you by COREView metadata, citation and similar papers at core.ac.uk
provided by Keck Graduate Institute
Can Uber and Lyft save Public Transit?
Emily Zheng
Pomona College Claremont, California
April 26, 2019
Presented to:
Bowman Cutter Associate Professor of Economics, Pomona College
Jennifer Ward-Batts
Lecturer in Economics, Pomona College
Submitted in partial fulfillment of the requirements for a Bachelor of Arts degree with a major in Economics/Public Policy Analysis

Acknowledgements
Thank you to my readers, Bowman Cutter and Jennifer Ward-Batts, for their advising and guidance throughout the thesis writing process. I would also like to thank Warren Lee and Sebastian Hack for their valuable feedback and coding expertise. Finally, a big thank you to my family for their continuous, unwavering support over the years.

Table of Contents
SECTION I: INTRODUCTION 1
CHAPTER 1: LITERATURE REVIEW 4 NATIONAL RIDERSHIP TRENDS 4 SHARED MOBILITY, TECHNOLOGY, AND TRANSIT RIDERSHIP 9 CONCLUSION 10
SECTION II: HOW TNCS CURRENTLY AFFECT PUBLIC TRANSIT RIDERSHIP 12
CHAPTER 2: THEORY 13 CHAPTER 3: DATA 16 COMPARING SAMPLE GROUPS 21 CHAPTER 4: WHO USES TNCS AND PUBLIC TRANSIT 26 CHAPTER 5: RESULTS AND DISCUSSION 29
SECTION III: HOW TNCS INCREASE TRANSIT RIDERSHIP THROUGH POLICY 35
CHAPTER 6: MONROVIA, CALIFORNIA 38 THE CITY 38 THE POLICY 38 WHY LYFT? 41 ENACTORS AND IMPLEMENTERS 41 PRICING STRUCTURE 42 FUNDING SOURCES 44 CURRENT STATE AND FUTURE IMPLICATIONS 46 CHAPTER 7: LOS ANGELES METRO 49 THE TRANSIT AGENCY 49 THE POLICY 49 POLICY CREATION 52 CURRENT STATE AND FUTURE IMPLICATIONS 55 CHAPTER 8: CLAREMONT, CALIFORNIA 56 THE CITY 56 BACKGROUND 56 THE POLICY 57
SECTION IV: KEY TAKEAWAYS 59
WORKS CITED 62 APPENDIX 65

Tables and Figures
TABLES
TABLE 1: SUMMARY STATISTICS FOR DUMMY VARIABLES 17 TABLE 2: SUMMARY STATISTICS FOR CONTINUOUS VARIABLES 18 TABLE 3: FAMILY INCOME FREQUENCIES 19 TABLE 4: EDUCATION LEVEL FREQUENCIES 19 TABLE 5: INDUSTRY FREQUENCIES 20 TABLE 6: OCCUPATION FREQUENCIES 20 TABLE 7: SUMMARY STATISTICS BEFORE AND AFTER TNC BEGAN OPERATION 21 TABLE 8: FAMILY INCOME FREQUENCIES BEFORE AND AFTER TNC BEGAN OPERATION 22 TABLE 9: EDUCATION LEVEL FREQUENCIES BEFORE AND AFTER TNC BEGAN OPERATION 23 TABLE 10: INDUSTRY FREQUENCIES BEFORE AND AFTER TNC BEGAN OPERATION 23 TABLE 11: OCCUPATION FREQUENCIES BEFORE AND AFTER TNC BEGAN OPERATION 24 TABLE 12: TNC’S SIGNIFICANCE AFTER DEMEANING VARIABLES 25 TABLE 13: REGRESSIONS ON THE PROBABILITY OF RIDING PUBLIC TRANSIT 29 TABLE 14: GOMONROVIA PROGRAM TIMELINE 42
FIGURES
FIGURE 1: FAMILY INCOME X TNC COEFFICIENTS 31 FIGURE 2: GOMONROVIA COVERAGE AREA 39 FIGURE 3: GOMONROVIA LYFT USAGE SINCE LAUNCH, 2018 STATISTICS 46 FIGURE 4: LYFT USAGE BY TIME OF DAY 47 FIGURE 5: LYFT USAGE BY TRIP LENGTH 47 FIGURE 6: ARTESIA SERVICE AREA 51 FIGURE 7: EL MONTE SERVICE AREA 52 FIGURE 8: NORTH HOLLYWOOD/BURBANK SERVICE AREA 52

1
Section I: Introduction
In 2015, the average American commuter traveling to and from an urban center spent 42
hours in traffic every year. Compare this to 2000 when the time spent in traffic was 37 hours, and
1982 when the number was merely 18 (Crow 2018). This congestion is largely due to America’s
car-centric travel: in 2017, 82.6 percent of trips nationwide were made by private vehicle, 10.5
percent by bike or foot, and only 2.5 percent by public transit (McGuckin and Fucci 2018, 30).
A potential solution to this traffic congestion is public transit, since it transports more
people than a private vehicle while using less road space per capita. Public transit is defined as
transportation by bus, rail, or similar conveyance that is provided for the public on a regular basis
(Glenn 1994, 22). However, transit ridership has been consistently declining nationwide. In
2017, the number of rides taken on a public transit system fell in 31 of 35 major United States
metropolitan areas. Transit planners such as Jarrett Walker, who is redesigning Houston’s bus
network to curb declining ridership, consider this trend an emergency because “when we don’t
share space efficiently, we get in each other’s way. And that is a problem for the livelihood, the
viability, the livability and the economy of a city... It means more traffic, more congestion”
(Siddiqui 2018).
However, Transportation Network Companies (TNCs) – ride-sharing service companies
like Uber and Lyft – have changed how people commute in recent years. In major cities, 21% of
adults use TNCs, and 24% of these riders use TNCs on a weekly or daily basis. College-educated
and affluent Americans have adopted these new services at a faster rate than less educated, lower
income populations. 7% of users cite parking as the main reason why they use TNCs instead of
driving themselves. Among those who use TNCs, 38% use them to travel to bars and parties,
24% to restaurants and cafés, and 11% for shopping and services (Clewlow et al. 2017, 4).

2
There is presently no consensus in the literature on TNCs’ effects on public transit
ridership, likely because these services are still new: Uber was founded in 2009 and Lyft was
founded in 2012. One survey on travel behavior in seven major metro areas by the UC Davis
Institute of Transportation Studies suggests that TNCs are substitutes for public transit. Over half
of trips taken using TNCs either would not have occurred or passengers would have used public
transit, biking, or walking if TNCs did not exist (Badger 2017). On the other hand, Manville,
Taylor, and Blumenberg (2018) suggest that TNC and transit are not substitutes: since “the
typical TNC user does not resemble the typical transit rider, the typical TNC trip does not occur
when and where most transit trips occur, and most TNC users report no change in their travel by
other modes” (Manville, Taylor, and Blumenberg 2018, 9). These two studies exemplify the lack
of consensus about the relationship between TNCs and public transit.
Despite this, cities like Philadelphia, Oakland, and Tampa have explored potential
synergies by directly connecting TNCs to commuters through subsidies so commuters can access
public transit systems more effectively. These subsidies encourage passengers to take TNCs to
public transit stops and target potential public transit riders who are discouraged or limited by
their distance from public transit systems (the “first mile / last mile” problem). The potential
benefits to these cities and their transit agencies include increased ridership and lower overall
public transit costs. TNC subsidies have been particularly favorable for Tampa, FL, which
discontinued a bus line that connected the suburb of East Lake to the city of Tampa, and replaced
it with TNC subsidies. The bus line cost the transit agency $16 per rider to operate but charged
commuters only $2.25, which created a $13.75 deficit per passenger per ride. County residents
can now ride TNCs anywhere in the county or from the nearest bus stop, and the transit authority
contributes $5 per passenger for ride’s cost. This saves the transit agency $8.75 per passenger per

3
ride (Business Insider Intelligence 2016). However, the number of commuters in the region may
increase because of this subsidy, so the transit agency’s total costs may substantially increase if
enough additional people were motivated to travel. Commuters may prefer having an additional
bus line over the subsidy if riding the bus were more affordable than riding a combination of
subsidized TNCs and public transit. Also, the potentially widespread use of TNCs may increase
congestion and vehicle miles traveled, exacerbate environmental harms, and worsen mobility
issues for communities underserved by TNCs such as disabled and low-income riders.1 Thus,
policies connecting TNCs to public transit have potential to increase public transit ridership, but
the results are currently inconclusive and the use of TNCs may create negative consequences.
Therefore, I examine whether transportation network companies (TNCs) like Uber and
Lyft can help increase public transit ridership. In Section II, I investigate if TNCs are currently
substitutes or complements for public transit. I find that TNCs do not have a statistically
significant effect on public transit ridership overall, but are complements of public transit for
certain populations. In Section III, I investigate how city governments and transit agencies can
help TNCs become (stronger) complements of public transit through policy. For instance,
policies that give discounts for TNC rides taken to and from transit stops could help solve the
first mile / last mile problem, which would increase transit ridership.
1 Since TNC drivers often operate their personal vehicles, riders do not usually have access to Americans with Disabilities Act (ADA)-compliant vehicles when they request TNC rides. Further, TNC fares are too costly for low-income riders to benefit from their services, since their prices are typically more expensive than alternative modes of transportation like walking, biking, and riding public transit.

4
Chapter 1: Literature Review
Most literature on public transit ridership includes the same variables, but results vary.
Common explanatory variables include private vehicle access, transit service quality and
efficiency, public funding for transit, employment levels, transit fares, population and housing
density per acre, and attractiveness of driving (measured by traffic congestion, gasoline price,
and parking availability and cost). Taylor and Fink (2009) note that common problems across
many studies’ models are multicollinearity and endogeneity, which involve correlation between
variables that are assumed to be independent, potentially biasing results. For instance, some
transit agencies may point to service expansions as the reason for increased ridership, although
the increase in service is usually in response to rising demand. Despite these limitations,
understanding the influence of these variables on ridership is central to public policy debates
over public transit. This literature review will discuss research on nationwide ridership trends
from the past 30 years and how the rise of new technologies has changed strategies to increase
public transit ridership. Then, I will discuss applications of this literature to my research
question. Overall, the studies agree that access to private vehicles is the single most important
variable affecting public transit ridership, and creating mobility options through technology can
reduce car ownership and consequently increase public transit ridership.
National Ridership Trends
Ridership variables are typically divided into external and internal factors. External
factors occur outside the control of transit agencies, such as the region’s employment levels.
Internal factors can be controlled by transit agencies, such as fares and service levels.

5
External Factors
The most significant variables influencing transit use are private vehicle access and
employment variables. These variables change commuting patterns of traditional transit riders,
who are typically employed persons of color with lower incomes (Clark 2017, 4). Other
important factors include demographics, spatial factors, and extent of public funding.
Costs for gasoline, purchasing cars, and parking are examples of variables related to
private vehicle access. The availability and convenience of personal automobiles most
significantly influence ridership because transit often functions as an inferior substitute (Taylor
and Fink 2009, 7) for private vehicles (Dickens and Cromwick 2018, 12). Taylor and Fink
(2009) observe that transit use decreases with increasing household incomes, and increases with
higher unemployment and higher costs of car ownership. Dickens and Cromwick (2018) note
that the rise of auto loans, which returned to pre-recession levels in 2018, has spurred the decline
of private vehicle costs because lower-income transit users are becoming increasingly able to
take low credit score (sub-prime) loans and become car owners. Though the price of gasoline
was included in many models as being positively correlated with ridership, Chen, Varley, and
Chen (2011) find the relationship is statistically significant but small because gasoline is only a
small fraction of total car ownership costs. Further, the timing of ridership decline often does not
align with fuel prices: Manville, Taylor, and Blumenberg (2018) observe that “per capita transit
use in Southern California has been mostly falling since 2007,” even when fuel prices were
rising. Out of all private vehicle variables, studies agree that the costs and availability of parking
are most influential on transit ridership (Taylor and Fink 2009, 9).
Employment influences travel patterns, which affect transit ridership. A one percent
decrease in Boston’s number of central city jobs between 1970 and 1990 correlated with a 1.24

6
to 1.75 percent decrease in ridership (Taylor and Fink 2009, 8). This study finds a greater
concentration of employment helps increase ridership since “transit works best when a large
number of people are traveling to and from concentrated nodes of activities” (Taylor and Fink
2009, 10). Therefore, housing and employment density per acre, physical region size, and
distance between stations are also important variables. Another factor decreasing ridership is
telecommuting, which is working from home through the Internet, email, and telephone. The
percentage of people working from home has increased from 9 percent of workers in 1995 to 32
percent in 2006 to 37 percent in 2015 (Mallett 2018, 10). In the 2016 National Study of
Employers, 40 percent of employers stated they allow working from home regularly while 66
percent allow working from home occasionally, which is a 20-percentage point increase from ten
years prior (Dickens and Cromwick 2018, 4–5). Riders commuting to and from work make up a
large portion of regular transit users (49 percent in 2017), so this shift towards telecommuting
decreases ridership and overall use of transportation, including cars (Clark 2017, 5).
The market for transit riders has shifted over time as regional demographics change.
Markets that have grown since the 90s include travelers with limited access to private vehicles –
such as children, the elderly, the disabled, and the poor – and “commuters to large employment
centers” such as “downtowns with limited and/or expensive parking” (Taylor and Fink 2009, 7).
On the other hand, many immigrants start as frequent users of transit soon after moving into the
country often because of driver’s license eligibility and socio-economic constraints (Misra 2017),
but decrease their use over time (Mallett 2018, 13). Researchers speculate that this phenomenon,
combined with the declining number of immigrants allowed into the country, is contributing to
decreasing public transit ridership (Mallett 2018, 13). Other markets that have shrunk are
traditional transit riders, since the increased affordability of private vehicles incentivize them to
7
purchase cars instead of riding transit. This behavior is perpetuated by the increased costs of
urban living, which displaces traditionally transit dependent communities to more affordable and
less transit-oriented areas, forcing these groups to choose travel options other than public transit
(Dickens and Cromwick 2018, 5).
Finally, federal and state funding allows transit agencies to invest in transportation
projects, but public funding’s dearth often prevents these agencies from meeting ridership goals.
Many agencies do not have sufficient funds to meet rising demand because they cannot even
cover current operating costs, which presents a major obstacle to increasing ridership (Taylor and
Fink 2009, 6). When funding is available, Dickens and Cromwick (2018) find that “large
investments in new rail systems [have] been successful in attracting riders” and is “increasingly
becoming preferred to bus travel,” with total bus ridership decreasing by nearly 16 percent from
2000 to 2017 and rail ridership increasing by 43 percent. However, buses still provide more than
half of all trips in 2016 and twice as many trips as rail services nationally, excluding New York
City (Mallett 2018, 7). Major limitations for rail include its large capital maintenance and state of
good repair issues, which “hold back rail’s reliability and potential growth” (Dickens and
Cromwick 2018, 4). Mallett (2018) suggests that federal funding should focus on buses that last
10 years, rather than constructing new rail systems that last for over 30 years. While rail can
transport many passengers while using little road space (Mallett 2018, 17), the flexibility of
buses would allow transit agencies to address the uncertainty of autonomous vehicles’ and
TNCs’ impact on transit ridership (Mallett 2018, 2). Either way, transit agencies should be
strategic and conscious as to where they are investing their funds. New rail service can often be
detrimental to existing bus networks since resources are shifted toward the new rail lines. Some

8
have suggested that this focus on rail and the restructuring of bus routes in response has
contributed to lower ridership in Los Angeles (Mallett 2018, 7–8).
Internal Factors
Many studies include transit fare prices in their models. Though fares play a role in
influencing ridership, most studies agree that reducing fares is far less effective at increasing
transit ridership than other solutions. Litman (2004) observes that “higher decreases in transit
fares would be needed to attract the same number of transit riders than if automobile costs were
increased” (Chen, Varley, and Chen 2011, 1896). However, deep discounting of fares can
significantly increase ridership when they are targeted towards specific market segments, such as
students through university partnerships (Taylor and Fink 2009, 11).
Customer service, safety, and service frequency are highlighted as the most important
internal factors in attracting riders (Taylor and Fink 2009, 12), though distance from someone’s
home or workplace to a transit stop and service times are also associated with how often a
commuter will use transit (Mallett 2018, 11). There is some limited evidence that riders feeling
unsafe on transit vehicles in recent years may have contributed to the ridership decline
(Manville, Taylor, and Blumenberg 2018, 8). Overall, the convenience for riders to use transit in
easily accessible locations, throughout the day, and without long wait times would incentivize
people to use transit more often. Mallett (2018) notes, “the greater the supply, the greater the
demand for transit.” Taylor and Fink (2009) agree, finding that reducing fares is less effective at
increasing ridership than increasing service.
9
Shared Mobility, Technology, and Transit Ridership
The literature finds that creating a large network of mobility options through technology
will help reduce car ownership and increase public transit ridership, though existing research
concerning the interaction among shared mobility, technology, and transit ridership is still very
limited. Schwieterman and Livingston (2018) find in their study of TNCs in Chicago that
“passengers are five times more likely to opt for ridesharing when they perceive the experience
of using transit as unfavorable than when it is perceived as favorable” even though TNC-only
trips are generally $6 to $16 more than riding public transit, because TNC trips are estimated to
be 10 to 22 minutes faster (Schwieterman and Livingston 2018, 8–11). The authors point to the
lack of integration between different modes of transportation as a “missed opportunity to
improve mobility and enhance the effectiveness of public transit,” and offer recommendations
such as offering discounts on ridesharing trips to and from select rail stations when bus service is
weak (Schwieterman and Livingston 2018, 19).
Murphy and Feigon (2016) conducted in-depth interviews with transportation officials
and surveyed more than 4,500 shared mobility users from Austin, Boston, Chicago, Los Angeles,
San Francisco, Seattle, and Washington, D.C., and found that the more people that use shared
modes of transportation such as public transit, bike sharing through companies like Lime and
Spin, car sharing through companies like Zipcar, and ride sharing through companies like Uber
and Lyft, the more likely they are to own fewer cars and spend less money on transportation
overall. They find that shared modes2 are not substitutes for public transit because they serve
different trip types. Rideshares are usually used for social trips between 10 pm and 4 am when
2 In this sentence, I am talking about shared modes other than public transit, since I am investigating the relationship between other types of shared modes in relation to public transit.

10
transit service is infrequent or unavailable, and for commuting to work on occasion. Rather,
Murphy and Feigon (2016) conclude that ridesharing substitutes for private automobile trips. If
ridesharing were not available, 34 percent of respondents reported they would drive alone or
with a friend instead. Therefore, ridesharing gives private automobile owners more opportunities
to “leave [their] car at home more often” (Murphy and Feigon 2016, 18).
Transportation Network Companies (TNC) like Uber and Lyft have changed how people
are commuting, though the literature has no consensus on their effects on ridership because they
are so new. Manville, Taylor, and Blumenberg (2018) suggest that TNC and transit are not
substitutes since TNC users and trips do not replace transit users and trips, which aligns with
Murphy and Feigon (2016)’s findings. Mallett (2018) notes that TNCs can actually make
commuting on transit easier by providing first mile and last mile service for transit users,
allowing people to live car-free because they are able to get to and from transit stops easily.
However, Dickens and Cromwick (2018) observe that TNCs may be converting traditional
transit users into private vehicle owners if they drive for the company. TNCs “assist drivers with
owning or leasing a vehicle,” and the revenue made from driving can help fulfill car payments
(Dickens and Cromwick 2018, 5).
Conclusion
In this literature review, I examined possible reasons why public transit ridership has
declined in recent years and how emerging technologies and policies may help remedy this issue.
Changing travel patterns, especially the rise of private vehicle access and ownership, has
decreased public transit ridership nationwide. However, TNCs can help reverse this trend if they
are complements of public transit. Relatively little research to date has empirically investigated

11
whether TNCs and public transit are substitutes or complements, or determined how policy could
be created to encourage their collaboration. Therefore, my thesis will examine whether TNCs
can help increase public transit ridership.
12
Section II: How TNCs Currently Affect Public Transit Ridership
The rapid adoption of TNCs pose “significant challenges” for cities and transportation
agencies because “there is limited information and data about how these services affect
transportation decisions and travel patterns” (Clewlow et al. 2017, 4). Past research finds
conflicting conclusions as to how TNCs influence public transit ridership and overall consumer
transportation choices, which place policy makers in a difficult position as they attempt to
address mobility, congestion, and environmental issues surrounding transportation. Therefore,
this data section aims to clarify the relationship among individual commuters, public transit, and
TNCs to determine if TNCs are complements or substitutes of public transit.
In this section, I first outline the theoretical framework behind my regression analysis.
My regression focuses on a consumer’s choice among different modes of transportation. Then, I
describe my data from the American Time Use Survey, which covers United States metropolitan
areas from the years 2005 to 2017. Next, I examine whether certain demographics are more
likely to ride public transit after TNCs begin service in their metropolitan areas. Finally, I run my
regressions and determine if TNCs are complements or substitutes of public transit. I find that
TNCs do not have a statistically significant effect on public transit ridership overall, but are
complements of public transit for certain populations.

13
Chapter 2: Theory
This chapter describes the regression model I built to investigate the relationship between
TNCs and public transit ridership.
My dependent variable is the probability that an individual uses public transit. My key
independent variable is whether TNCs are in operation. If this probability increases after TNC
services start being offered, then there is a positive correlation between TNCs and public transit
ridership, which implies that they are complements.
My independent variables are divided into four categories: family, work, individual
characteristics, and external controls. The family and work categories affect how much time and
money an individual has, which influences whether they take public transit. The other two
categories primarily serve as controls for consumer characteristics and external factors (Barff,
Mackay, and Olshavsky 1982, 371).
I include two variables under the Family category. The number of young children (under
13 years old3) in the household is the first variable, because children decrease an individual’s
availability of time. Children attend school, participate in extracurricular activities like soccer
practice, need to be looked after and taken care of, and more. Having children increases not only
day-to-day responsibilities, but also an individual’s need for convenient modes of transportation
because unexpected events may occur. For instance, if a child falls ill and needs to be picked up
from school, then having a more flexible mode of transportation like a personal car may be more
practical than waiting for the next bus or train, which may not even go directly to the child’s
3 Teenagers are generally more capable of taking care of themselves than children under 13 years old. For instance, most parents can trust teenagers to walk home by themselves, while parents may be more hesitant for younger children. Older teenagers also have opportunities to acquire drivers’ licenses, which give them even more autonomy.

14
school. I therefore hypothesize a negative correlation between the number of young children and
public transit ridership. The second variable is the presence of a spouse or unmarried partner in
the household, which I believe increases an individual’s availability of time because the spouse
or partner could help complete household tasks and look after any children they may have. Thus,
I predict a positive correlation between the presence of a spouse and public transit ridership.
Income, hours worked per week, industry, and occupation are the four variables in the
Work category. Individuals with higher incomes can afford multiple modes of transportation. I
measure income by using family income rather than the individual’s salary, since it is more
representative of the overall wealth the person can access. For instance, someone may be a
homemaker and not earn any income. However, it would be incorrect to state that they have no
income if they have access to their spouse’s salary and use that money to fund expenditures.
Income also serves as a proxy for the value of travel time and has a strong, positive correlation
with automobile ownership (Barff, Mackay, and Olshavsky 1982, 377). Therefore, I predict a
negative correlation between income and public transit ridership. The second Work variable is
hours worked per week. I predict that individuals who work longer hours have less free time.
Thus, I hypothesize that someone with a longer work day would prefer a more convenient mode
of transportation, and would therefore be less likely to ride public transportation. Industry and
Occupation control for job characteristics that also affect a worker’s availability of time and
money. For instance, certain industries like business services may have more opportunities for
employees to work remotely – perhaps during the employee’s commute, which would make
traveling on public transportation more convenient – while other industries like construction may
place a higher emphasis on employees working on-site. This flexibility varies based on an
15
employee’s occupation, as well: an engineer designing the construction site could work remotely
more easily than a construction worker.
The final two categories are controls for individual characteristics and external factors.
Individual characteristics include sex, age, education level, and metropolitan area. The
metropolitan area variable controls for region characteristics and the modes of transportation
available to commuters (Barff, Mackay, and Olshavsky 1982, 378). I examine transportation
choices made on weekdays, because an individual’s commuting behavior likely differs on the
weekend. For instance, an individual may ride the bus every day to work, but may drive a car
during the weekend for longer trips outside of the city.
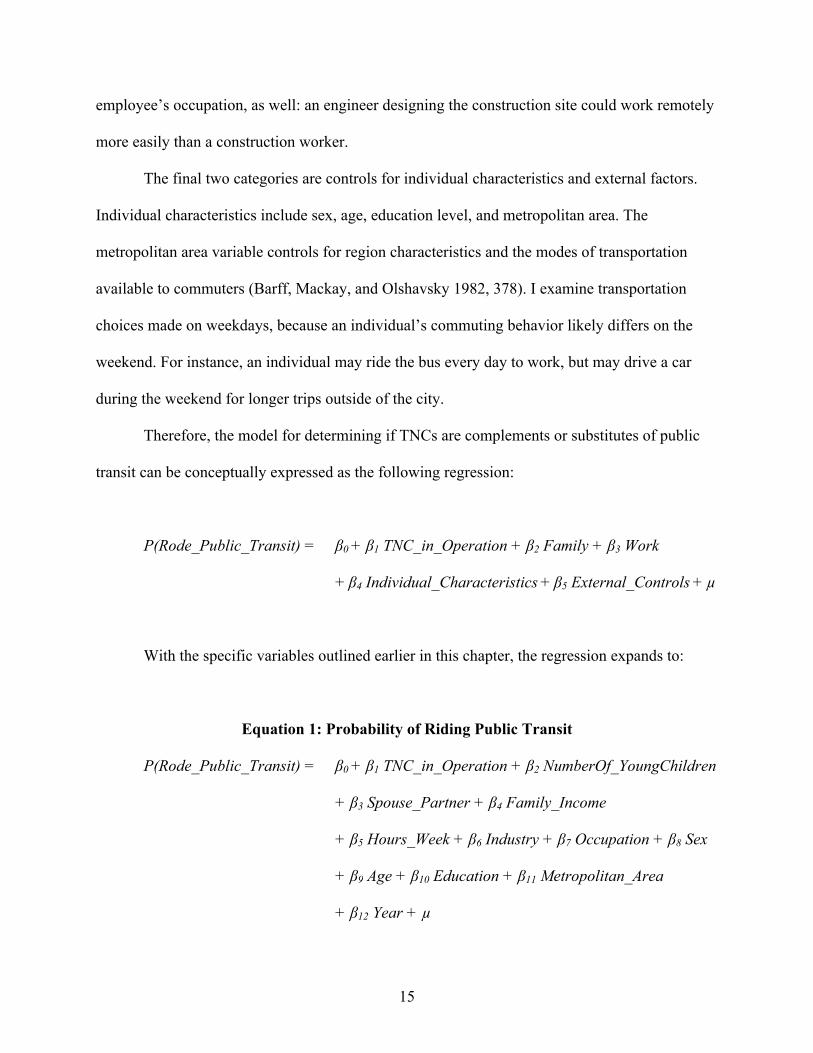
Therefore, the model for determining if TNCs are complements or substitutes of public
transit can be conceptually expressed as the following regression:
P(Rode_Public_Transit) = β0 + β1 TNC_in_Operation + β2 Family + β3 Work
+ β4 Individual_Characteristics + β5 External_Controls + µ
With the specific variables outlined earlier in this chapter, the regression expands to:
Equation 1: Probability of Riding Public Transit
P(Rode_Public_Transit) = β0 + β1 TNC_in_Operation + β2 NumberOf_YoungChildren
+ β3 Spouse_Partner + β4 Family_Income
+ β5 Hours_Week + β6 Industry + β7 Occupation + β8 Sex
+ β9 Age + β10 Education + β11 Metropolitan_Area
+ β12 Year + µ
16
Chapter 3: Data
I use individual-level repeated cross-sectional data from the American Time Use Survey
(ATUS) to determine if TNCs are complements or substitutes for public transit. The ATUS is
sponsored by the Bureau of Labor Statistics (BLS) and conducted by the U.S. Census Bureau.
The survey provides annual, nationally representative estimates of “how, where, and with whom
Americans spend their time” (Bureau of Labor Statistics 2018c). Its data includes information
from 190,000 interviews conducted from 2003 to 2017. One respondent per household is
randomly selected from a subset of households that recently completed the Current Population
Survey (CPS). All ATUS data is collected using computer-assisted telephone interviewing. The
interview is a combination of structured questions and open-ended conversations, and covers
topics including the respondent’s household roster and time diary. The time diary outlines how
the respondent spent their time starting at 4 AM the previous day and ending at 4 AM on the
interview day. For each activity, the interviewer asks how long the activity lasted, who was in
the room or accompanied the respondent, and where the activity took place (Bureau of Labor
Statistics 2018a, 18). The data in this paper ranges from 2005 to 2017: 2017 is the most recent
year-long data available as of this writing, and 2005 predates Uber and Lyft’s founding dates
(2009 and 2012, respectively) and comes after ATUS’ survey design change, which occurred
between 2003 and 2004.
The dependent variable, Rode Public Transit, is a dummy variable that indicates whether
the respondent took public transit on the diary day. The aggregate data from this variable reflects
the probability of an individual using public transit. This variable is derived from the ATUS’
mode of transportation variables, which include categories like taxi/limousine service4; car,
4 TNCs are categorized under taxi/limousine service.
17
truck, or motorcycle; walking; bus; subway/train; bicycle; boat/ferry; airplane; and other mode of
transportation (Bureau of Labor Statistics 2018b, 28). Rode Public Transit is 1 if the individual
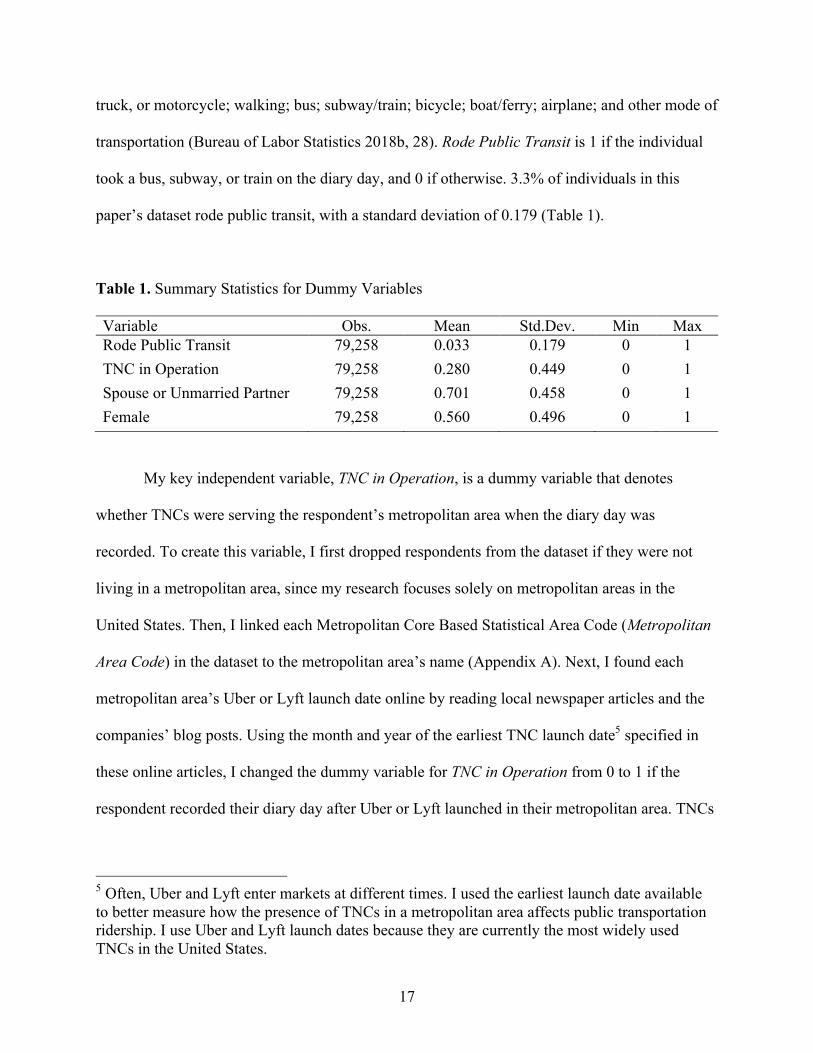
took a bus, subway, or train on the diary day, and 0 if otherwise. 3.3% of individuals in this
paper’s dataset rode public transit, with a standard deviation of 0.179 (Table 1).
Table 1. Summary Statistics for Dummy Variables
Variable Obs. Mean Std.Dev. Min Max Rode Public Transit 79,258 0.033 0.179 0 1 TNC in Operation 79,258 0.280 0.449 0 1 Spouse or Unmarried Partner 79,258 0.701 0.458 0 1 Female 79,258 0.560 0.496 0 1
My key independent variable, TNC in Operation, is a dummy variable that denotes
whether TNCs were serving the respondent’s metropolitan area when the diary day was
recorded. To create this variable, I first dropped respondents from the dataset if they were not
living in a metropolitan area, since my research focuses solely on metropolitan areas in the
United States. Then, I linked each Metropolitan Core Based Statistical Area Code (Metropolitan
Area Code) in the dataset to the metropolitan area’s name (Appendix A). Next, I found each
metropolitan area’s Uber or Lyft launch date online by reading local newspaper articles and the
companies’ blog posts. Using the month and year of the earliest TNC launch date5 specified in
these online articles, I changed the dummy variable for TNC in Operation from 0 to 1 if the
respondent recorded their diary day after Uber or Lyft launched in their metropolitan area. TNCs
5 Often, Uber and Lyft enter markets at different times. I used the earliest launch date available to better measure how the presence of TNCs in a metropolitan area affects public transportation ridership. I use Uber and Lyft launch dates because they are currently the most widely used TNCs in the United States.

18
were in operation for 28% of the respondents in this dataset, with a standard deviation of 0.449
(Table 1). In addition to creating TNC in Operation, the Metropolitan Area Code variable
controls for types of transportation options available, frequency of public transportation,
population density, and other characteristics that vary among metropolitan areas.
56% of respondents are female, with a standard deviation of 0.496, and 70.1% have a
spouse or unmarried partner, with a standard deviation of 0.458 (Table 1). On average,
respondents are 43.477 years old, with a standard deviation of 16.389, and have 0.744 children
under 13 years old living in their household with a minimum of 0 children, maximum of 9, and
standard deviation of 1.026 (Table 2). Respondents work an average of 25.595 hours per week,
ranging from 0 to 160 hours with a standard deviation of 21.733 (Table 2).
Table 2. Summary Statistics for Continuous Variables
Variable Obs. Mean Std.Dev. Min Max Number of Children (<13 y/o) 79,258 0.744 1.026 0 9 Work Hours per Week 79,258 25.595 21.733 0 160 Age 79,258 43.477 16.389 15 85
Family Income is a categorical variable that ranges from 1 to 16. The variable represents
the combined income of all family members during the last 12 months, and includes money from
jobs, dividends, net income from business, rent, interest, and Social Security payments
(American Time Use Survey 2018, 17). The average income of the sample is $83,8806 with a
standard deviation of 70,261. Table 3 outlines each family income’s frequency in the dataset.
6 To find average income, I took the midpoint of each income category and calculated the weighted average of all the midpoints.

19
Table 3. Family Income Frequencies
Variable Family Income Frequency Percent 1 Less than $5,000 1,398 1.76 2 $5,000 to $7,499 934 1.18 3 $7,500 to $9,999 1,086 1.37 4 $10,000 to $12,499 1,597 2.01 5 $12,500 to $14,999 1,522 1.92 6 $15,000 to $19,999 2,718 3.43 7 $20,000 to $24,999 3,530 4.45 8 $25,000 to $29,999 3,922 4.95 9 $30,000 to $34,999 4,210 5.31 10 $35,000 to $39,999 3,857 4.87 11 $40,000 to $49,999 6,370 8.04 12 $50,000 to $59,999 6,644 8.38 13 $60,000 to $74,999 8,839 11.15 14 $75,000 to $99,999 11,444 14.44 15 $100,000 to $149,999 11,781 14.86 16 $150,000 and over 9,406 11.87
Education Level is another categorical variable that represents the respondents’ highest
level of school completed or the highest degree received. The variable ranges from 0 to 2. The
average education level is 1.401 with a standard deviation of 0.575. Table 4 outlines each
education level’s frequency in the dataset.
Table 4. Education Level Frequencies
Variable Education Level Frequency Percent 0 Less than High School 3,580 4.52 1 High School or Some College 40,334 50.89 2 Associate Degree and above 35,344 44.59
Industry is also a categorical variable that represents the industry of the respondent’s
main job. The variable ranges from 0 to 13. Table 5 outlines each industry’s frequency in the
dataset.

20
Table 5. Industry Frequencies
Variable Industry Frequency Percent 0 None (No Job) 28,091 35.44 1 Agriculture, forestry, fishing, and hunting 460 0.58 2 Mining 158 0.20 3 Construction 2,881 3.63 4 Manufacturing 5,267 6.65 5 Wholesale and retail trade 6,358 8.02 6 Transportation and utilities 2,303 2.91 7 Information 1,319 1.66 8 Financial activities 4,091 5.16 9 Professional and business services 6,500 8.20 10 Educational and health services 13,011 16.42 11 Leisure and hospitality 3,796 4.79 12 Other services 2,444 3.08 13 Public Administration 2,579 3.25
Occupation is a categorical variable that represents the occupation of the respondent’s
main job. The variable ranges from 0 to 3. Blue Collar occupations (Occupation = 1) involve
manual labor and include jobs in construction and maintenance. Pink Collar occupations
(Occupation = 2) involve personal service and include jobs in administrative support and sales.
White Collar occupations (Occupation = 3) are often based in an office and include jobs in
computer science and financial operations. Table 6 outlines each occupation’s frequency in the
dataset.
Table 6. Occupation Frequencies
Variable Occupation Frequency Percent 0 None (No Job) 28,091 35.44 1 Blue Collar (Manual Labor) 11,441 14.44 2 Pink Collar (Service) 21,488 27.11 3 White Collar (Office) 18,238 23.01

21
Comparing Sample Groups
I compared the dataset before and after TNC began operation to confirm that the two
sample groups are similar. Otherwise, any effects I observe in the regression may be more
reflective of the sample’s composition rather than influences from the variables. In Tables 7, 8,
9, 10, and 11, respondents who were surveyed before TNCs started operating are listed in the 0
columns, while those surveyed after TNCs started operating are listed in the 1 columns.
First Sample Group Test: Mean Differences
I conducted mean differences tests with each continuous variable to determine if the
samples before and after TNC began operation are different. The null hypothesis is that the
difference between each variable’s means before and after TNC began operation is zero, which is
what we want. The alternative hypothesis posits that the null hypothesis is untrue. We can either
reject the null if the hypothesis test’s p-value is small (less than or equal to 0.05), or fail to reject
the null if otherwise. Results are listed in the p-value columns of Tables 7, 8, 9, 10, and 11.
Table 7. Summary Statistics before and after TNC began operation7
Variable Mean Std.Dev. Min Max 0 1 p-value 0 1 0 1 0 1 Rode Public Transit 0.029 0.044 0*** 0.168 0.204 0 0 1 1
Number of Children (<13 y/o) 0.765 0.692 0*** 1.038 0.995 0 0 9 8
Spouse or Unmarried Partner 0.698 0.710 0.0010*** 0.459 0.454 0 0 1 1
Work Hours per Week 25.736 25.232 0.0033*** 21.736 21.720 0 0 160 120
Female 0.564 0.551 0.0011*** 0.496 0.497 0 0 1 1
Age 42.921 44.902 0*** 16.226 16.716 15 15 85 85
*** p<0.01, ** p<0.05, * p<0.1
7 The number of observations for before and after TNC began operation are 57,029 and 22,229, respectively.

22
All continuous variables (Number of Children <13 y/o, Work Hours per Week, and Age)
and dummy variables8 (Rode Public Transit, Female, and Spouse or Unmarried Partner) have a
p-value that is less than 0.05 so we reject the null (Table 7).
For categorical variables (Family Income, Education Level, Industry, and Occupation), I
conducted proportion difference tests for each category. For Family Income, families earning
less than $5,000 have a p-value of 0.5054, and families earning between $7,500 and $9,999 have
a p-value of 0.0706, so we fail to reject the null. For all other Family Income categories, the p-
value is less than 0.05 so we reject the null (Table 8). For Education Level, respondents who
never went to high school have a p-value of 0.1370 so we fail to reject the null. We reject the
null for all other Education Level categories (Table 9).
Table 8. Family Income Frequencies before and after TNC began operation
TNC in Operation 0 1 Family Income Frequency % Frequency % p-value Less than $5,000 1,017 1.78 381 1.71 0.5054 $5,000 to $7,499 744 1.30 190 0.85 0*** $7,500 to $9,999 808 1.42 278 1.25 0.0706* $10,000 to $12,499 1,213 2.13 384 1.73 0.0003*** $12,500 to $14,999 1,138 2.00 384 1.73 0.0135** $15,000 to $19,999 2,019 3.54 699 3.14 0.0060*** $20,000 to $24,999 2,665 4.67 865 3.89 0*** $25,000 to $29,999 2,976 5.22 946 4.26 0*** $30,000 to $34,999 3,140 5.51 1,070 4.81 0.0001*** $35,000 to $39,999 2,886 5.06 971 4.37 0*** $40,000 to $49,999 4,767 8.36 1,603 7.21 0*** $50,000 to $59,999 4,955 8.69 1,689 7.60 0*** $60,000 to $74,999 6,586 11.55 2,253 10.14 0*** $75,000 to $99,999 8,338 14.62 3,106 13.97 0.0197** $100,000 to $149,999 8,108 14.22 3,673 16.52 0*** $150,000 and over 5,669 9.94 3,737 16.81 0*** Total 57,029 100% 22,229 100%
*** p<0.01, ** p<0.05, * p<0.1
8 For each dummy variable, I conducted proportion difference tests. The null hypothesis is that the difference between the proportions before and after TNC began operation is zero.

23
Table 9. Education Level Frequencies before and after TNC began operation
TNC in Operation 0 1 Education Level Frequency % Frequency % p-value Less than High School 2,615 4.59 965 4.34 0.1370 High School or Some College 30,045 52.68 10,289 46.29 0*** Associate Degree and above 24,369 42.73 10,975 49.37 0*** Total 57,029 100% 22,229 100%
*** p<0.01, ** p<0.05, * p<0.1
We fail to reject the null for seven industries: Mining (p-value=0.4061), Transportation
and utilities (0.0910), Information (0.0910), Financial Activities (0.9892), Educational and health
services (0.5235), Leisure and hospitality (0.1749), and Public Administration (0.2785). We
reject the null for seven industries: Agriculture, forestry, fishing, and hunting; Construction;
Manufacturing; Wholesale and retail trade; Professional and business services; Other services;
and None (No Job) (Table 10). We reject the null for all occupations (Table 11).
Table 10. Industry Frequencies before and after TNC began operation
TNC in Operation 0 1 Industry Frequency % Frequency % p-value None (No Job) 19,967 35.01 8,124 36.55 0*** Agriculture, forestry, fishing, and hunting 354 0.62 106 0.48 0.0166** Mining 109 0.19 49 0.22 0.4061 Construction 2,131 3.74 750 3.37 0.0142** Manufacturing 3,900 6.84 1,367 6.15 0.0005*** Wholesale and retail trade 4,774 8.37 1,584 7.13 0*** Transportation and utilities 1,693 2.97 610 2.74 0.0910* Information 970 1.70 349 1.57 0.0910 Financial activities 2,944 5.16 1,147 5.16 0.9892 Professional and business services 4,401 7.72 2,099 9.44 0*** Educational and health services 9,332 16.36 3,679 16.55 0.5235 Leisure and hospitality 2,768 4.85 1,028 4.62 0.1749 Other services 1,806 3.17 638 2.87 0.0300** Public Administration 1,880 3.30 699 3.14 0.2785 Total 57,029 100% 22,229 100%
*** p<0.01, ** p<0.05, * p<0.1

24
Table 11. Occupation Frequencies before and after TNC began operation
TNC in Operation 0 1 Occupation Frequency % Frequency % p-value None (No Job) 19,967 35.01 8,124 36.55 0*** Blue Collar (Manual Labor) 8,505 14.91 2,936 13.21 0*** Pink Collar (Service) 15,832 27.76 5,656 25.44 0*** White Collar (Office) 12,725 22.31 5,513 24.80 0*** Total 57,029 100% 22,229 100%
*** p<0.01, ** p<0.05, * p<0.1
Second Sample Group Test: Demeaning Variables
From the mean differences test, I find that a large portion of variables are significant.
This may be because American demographics are changing over time, and these changes vary
depending on the metropolitan area. The mean differences test did not consider yearly and
regional differences, so I run a second test controlling for these two factors by demeaning
variables through regressions. I regress every variable on TNC, Metropolitan Area, and Year,
which are the regressions’ three independent variables (Equation 2). The Metropolitan Area and
Year variables control for regional and yearly effects on the dependent variable. I use fixed
effects (FE) rather than linear variables, because I do not want to assume that Metropolitan Area
and Year have linear effects on public transit ridership. After running the regression, if the TNC
variable is not significant, then the samples before and after TNC began operation are similar,
which is preferable. If the TNC variable is significant, then the samples are different.
Equation 2: Demeaning Variables Example
P(Rode_Public_Transit) = β0 + β1 TNC_in_Operation + β2 Metropolitan_Area_FE
+ β3 Year_FE + µ
25
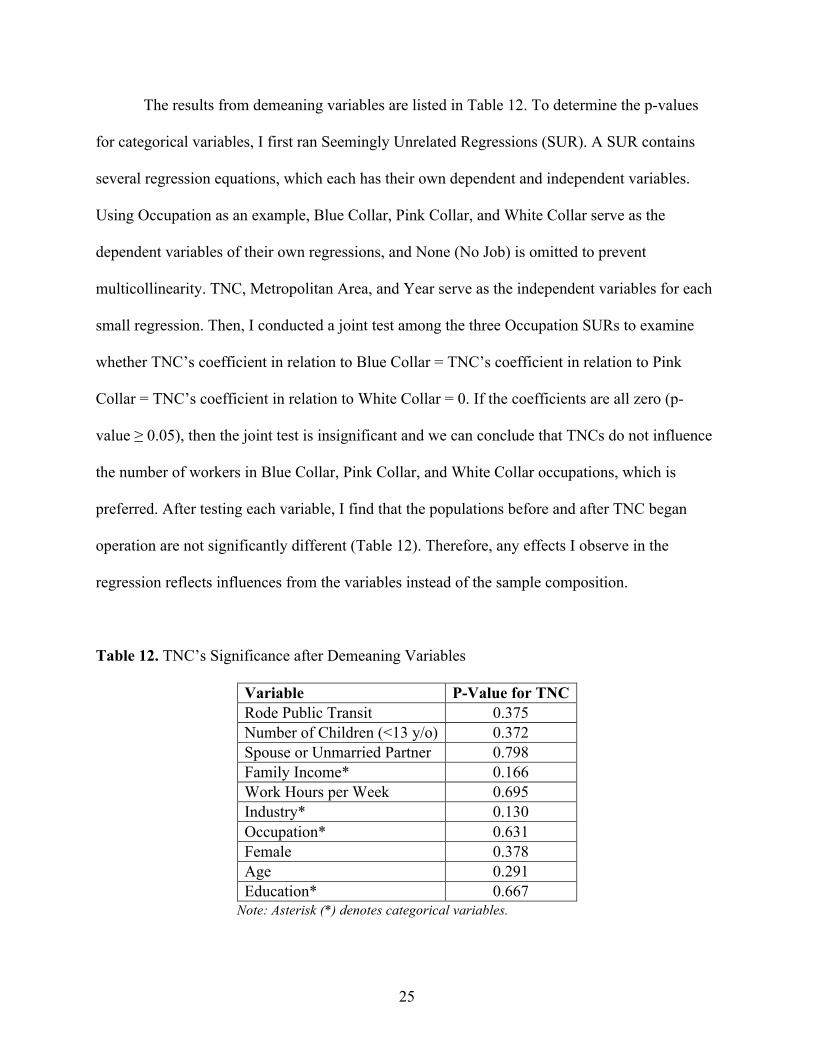
The results from demeaning variables are listed in Table 12. To determine the p-values
for categorical variables, I first ran Seemingly Unrelated Regressions (SUR). A SUR contains
several regression equations, which each has their own dependent and independent variables.
Using Occupation as an example, Blue Collar, Pink Collar, and White Collar serve as the
dependent variables of their own regressions, and None (No Job) is omitted to prevent
multicollinearity. TNC, Metropolitan Area, and Year serve as the independent variables for each
small regression. Then, I conducted a joint test among the three Occupation SURs to examine
whether TNC’s coefficient in relation to Blue Collar = TNC’s coefficient in relation to Pink
Collar = TNC’s coefficient in relation to White Collar = 0. If the coefficients are all zero (p-
value ≥ 0.05), then the joint test is insignificant and we can conclude that TNCs do not influence
the number of workers in Blue Collar, Pink Collar, and White Collar occupations, which is
preferred. After testing each variable, I find that the populations before and after TNC began
operation are not significantly different (Table 12). Therefore, any effects I observe in the
regression reflects influences from the variables instead of the sample composition.
Table 12. TNC’s Significance after Demeaning Variables
Variable P-Value for TNC Rode Public Transit 0.375 Number of Children (<13 y/o) 0.372 Spouse or Unmarried Partner 0.798 Family Income* 0.166 Work Hours per Week 0.695 Industry* 0.130 Occupation* 0.631 Female 0.378 Age 0.291 Education* 0.667
Note: Asterisk (*) denotes categorical variables.
26
Chapter 4: Who Uses TNC and Public Transit
In this chapter, I investigate if TNCs affect certain groups of people more than others
when it comes to changing transportation behavior. These findings can help guide policy creation
regarding the relationship between TNCs and public transit ridership by identifying groups of
people who are more likely to begin riding public transit after TNC services become available
(“sensitive groups”). First, I outline the relationship among sensitive groups, TNCs, and public
transportation. Then, I discuss how TNCs’ flexibility makes the service more valuable, because
having an additional, on-demand transportation option gives individuals far more flexibility than
solely relying on public transit. Finally, I discuss which sensitive groups I have identified, which
will be tested in the following Results section.
TNCs are not drastically different than personal automobiles, since both take
approximately the same amount of travel time and use the same mode of transportation. Though
TNC riders do not have to drive their own vehicles, TNC rides are generally less convenient and
more expensive than driving a personal automobile. Therefore, it seems less likely that people
who currently use personal automobiles and transit together would switch automobiles for TNCs.
Sensitive groups, on the other hand, are interested in riding public transit and have a high
option value for TNCs because of the flexibility they provide. Option value means that a person
places value on having an option to do something, even if they may never actually use it. The
concept exists because having an option to do something affects what choices someone makes.
For instance, someone may be interested in commuting with public transit because it is a cheaper
mode of transportation, but worry that they may need their personal automobile in emergency
situations. Their child may get sick from school so they would need a car to pick up the child at a
moment’s notice, or they may have a job that requires working past public transit operation hours

27
on occasion so they drive their car to work every day to prevent being stranded at the office.
TNCs allow these people to use public transit for most of their trips, but give them the option to
get where they need when unexpected events occur. In addition, people who have time
constraints and can get work done during their public transit commute may be more incentivized
to switch to public transit, because they can begin working before arriving in the office, which
would not be possible if they drove their own vehicle.
Another example of option value is people who take infrequent, discretionary trips. These
individuals use TNCs and transit in conjunction to travel to places where transit lacks flexibility.
For example, public transit may only be able to take someone to a transit hub instead of their
destination. TNCs allow these individuals to take transit for most of their trip and complete their
journey with a TNC ride. Without the availability of TNCs, these individuals may have driven a
car to the location or not gone at all. An additional benefit for these riders is that TNCs are less
expensive than owning a personal vehicle if discretionary trips are infrequent and if they live in
high cost cities where vehicle ownership costs – such as parking – is expensive.9
With this background, I identify three sensitive groups: women with children,10 white
collar occupations, and longer work hours. First, women with children may drive a personal
automobile because they want to be available if their children need to be picked up from school
at a moment’s notice. TNCs give mothers the option to take these discretionary trips when
needed, so they can use public transit for regular commutes. Second, people in white collar
9 Would anyone subtract transit trips due to the availability of TNCs? This scenario seems unlikely, because TNCs just provide an additional option and are significantly more expensive than transit. Thus, these individuals would be more likely to substitute transit with private automobiles than TNCs. 10 I assume women are primary caretakers of children in the household even if they are working, which has historically been the case for most households in the United States.

28
occupations can work during their public transit commute, unlike those in service or manual
labor occupations, so they have an incentive to ride public transit. TNCs also provide a flexible
transportation option in special circumstances, such as occasional off-site meetings. Third,
workers who work long hours and may occasionally go into the office early or leave late to
complete their work can use TNCs when public transit is not operating.
As I run regressions in the Results section, I will add controls for these sensitive groups
to determine their relationship with public transit ridership and TNCs through data. These
controls will appear as interaction terms between the sensitive group and TNC variable. For
example, for the “white collar occupation” sensitive group I will add “White Collar Occupation
x TNC in Operation” as a variable in my regression. I will add separate interaction terms in
separate regressions for each sensitive group.

29
Chapter 5: Results and Discussion
Table 13. Regressions on the Probability of Riding Public Transit
(1) (2) (3) (4) (5) TNC in Operation 0.0068 -0.0009 0.0107* 0.0027 8.59e-05 (0.0044) (0.0065) (0.0061) (0.0046) (0.0053) Number of Children (<13 y/o) -0.0158*** -0.0159*** -0.0125*** -0.0158*** -0.0158*** (0.0011) (0.0011) (0.0016) (0.0011) (0.0011) Spouse or Unmarried Partner -0.0358*** -0.0358*** -0.0359*** -0.0359*** -0.0359*** (0.0027) (0.0027) (0.0027) (0.0027) (0.0027) Work Hours per Week -0.0003*** -0.0003*** -0.0004*** -0.0003*** -0.0004*** (9.73e-05) (9.72e-05) (9.78e-05) (9.73e-05) (0.0001) White Collar Occupation 0.0169*** 0.0169*** 0.0167*** 0.0118*** 0.0168*** (0.0032) (0.0032) (0.0032) (0.0034) (0.0032) Female -0.0142*** -0.0143*** -0.0093*** -0.0142*** -0.0142*** (0.0026) (0.0026) (0.0034) (0.0026) (0.0026) Age -0.0018*** -0.0018*** -0.0018*** -0.0018*** -0.0018*** (9.15e-05) (9.16e-05) (9.18e-05) (9.14e-05) (9.15e-05) Less than High School 0.0399*** 0.0399*** 0.0398*** 0.0400*** 0.0399*** (0.0071) (0.0071) (0.0071) (0.0071) (0.0071) Associate Degree and above -0.0022 -0.0021 -0.0020 -0.0021 -0.0021 (0.0021) (0.0021) (0.0021) (0.0021) (0.0021) Female x No. of Children x TNC -0.0015 (0.0045) Female x No. of Children -0.0049** (0.0021) Female x TNC -0.0046 (0.0064) No. of Children x TNC -0.0009 (0.0035) White Collar x TNC 0.0173*** (0.0060) Work Hours x TNC 0.00027** (0.0001) Constant 0.123*** 0.123*** 0.121*** 0.124*** 0.124*** (0.0153) (0.0172) (0.0151) (0.0153) (0.0153) Observations 39,385 39,385 39,385 39,385 39,385 R-squared 0.09211 0.092 0.092 0.092 0.092
Notes: Robust standard errors in parentheses. Family Income, Industry, other Occupation categories, Metropolitan Area, and Year are additional control variables that are included in all models. *** p<0.01, ** p<0.05, * p<0.1
11 Because this data is from individuals and one diary day, behavior is hard to predict. Other studies that use individual-level data like ATUS have similar R-squared values.

30
Table 13 outlines the five regressions I ran to test whether TNCs are substitutes or
complements of public transit, and the variables’ coefficients.12
Regression 1 is based on Equation 1 from the Theory chapter. I used fixed effects (FE)
for each categorical variable because I do not want to assume linear effects (Equation 2). In this
regression as well as Regressions 4 and 5, the coefficient for TNC in Operation – the key
variable – shows a positive effect on the probability of riding public transportation, although it is
not statistically significant. This means that we cannot conclude whether TNCs and public transit
are complements or substitutes, which is consistent with the lack of consensus in the literature.
Equation 2: Probability of Riding Public Transit with Fixed Effects
P(Rode_Public_Transit) = β0 + β1 TNC_in_Operation + β2 NumberOf_YoungChildren
+ β3 Spouse_Partner + β4 Family_Income_FE
+ β5 Hours_Week + β6 Industry_FE + β7 Occupation_FE
+ β8 Sex + β9 Age + β10 Education_FE
+ β11 Metropolitan_Area_FE + β12 Year_FE + µ
In Regression 2, I added interaction terms for each Family Income category with TNC to
measure how an individual’s income level influences their probability of riding public transit
once TNCs are introduced. The Family Income category for individuals whose households earn
between $100,000 to $149,999 a year is dropped from the equation to prevent multicollinearity. I
12 To verify the validity of this linear regression model, I also ran probit and logit regressions. Probit and logit are often used if the dependent variable is a dummy variable or acting as a proxy for probability, which is the case for this paper. The results confirm that all three models have similar implications.

31
chose this category because it contains the highest concentration of individuals from the dataset.
The coefficients are depicted in Figure 1.
Figure 1. Family Income x TNC Coefficients
Three coefficients are statistically significant: individuals whose households earn less
than $5,000, between $12,500 to $14,999, and between $20,000 to $24,999 a year. The Family
Income interaction term coefficients are not jointly significant (Prob>F=0.2743). Individuals
with incomes between $12,500 to $14,999 and between $20,000 to $24,999 a year have the
largest effects, which makes sense. Those with low incomes cannot afford TNC rides, so their
coefficients are near zero. Those with high incomes are less affected by the availability of TNCs
because they could afford similar services (like taxis) before TNCs started operating, so their
coefficients are also near zero. The first Family Income category (less than $5,000) seems to be
an outlier, because the coefficient implies that the availability of TNCs shifted their
transportation behavior away from public transit. One possible explanation is that these
-0.060
-0.040
-0.020
0.000
0.020
0.040
0.060
1 2 3 4 5 6 7 8 9 10 11 12 13 14 15
Coefficient
FamilyIncomeCategory
32
individuals began driving for TNCs in order to supplement their income, which aligns with the
findings of Dickens and Cromwick (2018), especially since TNCs “assist drivers with owning or
leasing a vehicle,” and the revenue made from driving can help fulfill car payments (Dickens and
Cromwick 2018, 5).
The inclusion of Family Income interaction terms makes the TNC coefficient negative, so
individuals are 0.088 percentage points less likely to ride public transit. This suggests that the
insignificant though positive effect observed in Regression 1’s TNC coefficient may be primarily
driven by family income.
Regression 3 examines the women with children sensitive group. To measure the total
effect of TNCs on a woman with young children, I conducted a F test using three interaction
terms: Female x No. of Children x TNC, Female x No. of Children, and Female x TNC. The
results show that three coefficient terms are jointly insignificant (Prob>F=0.4902), which means
that TNCs do not have a conclusive differential effect on women with young children’s
probability of riding public transit. My hypothesis on this sensitive group did not hold.
Though TNCs do not have a conclusive effect on this sensitive group, controlling for
their effects turned the TNC coefficient positive, statistically significant, and economically
significant. Individuals are 1.07 percentage points more likely to ride public transit once TNCs
are introduced, which suggests that TNCs may be complementary to public transit for the general
population, excluding women with children.
It is also interesting to note that Number of Children (<13 y/o) and Female x No. of
Children are negatively associated with public transit ridership, which makes intuitive sense
because having more children means women have less free time and flexibility because they
have more responsibilities. Having an additional child makes a woman 1.74 percentage points

33
less likely to ride public transit. The coefficients are statistically significant and economically
significant.
Regression 4 examines the White Collar Occupations sensitive group. From the
interaction term’s coefficient, we can see that those in White Collar occupations are 1.73
percentage points more likely to ride public transit once TNCs are introduced, relative to those in
other types of occupations. This result is statistically and economically significant. This supports
my hypothesis that TNCs are complements for public transit for this sensitive group. The White
Collar Occupation variable on its own is also statistically and economically significant. Those in
White Collar occupations are 1.18 percentage points more likely to ride public transit than those
in other occupations, which makes sense since they are more likely to be able to work remotely
during their public transit commute due to the nature of their jobs, and therefore have greater
time flexibility.
Regression 5 examines the Long Work Hours sensitive group. From the interaction
term’s coefficient, we can see that working an additional 10 hours per week makes someone 0.27
percentage points more likely to ride public transit once TNCs are introduced, which is
statistically and economically significant. This supports my hypothesis that TNCs are
complements for public transit for this sensitive group. The Work Hours variable on its own is
also statistically and economically significant. Working an additional hour makes someone 0.04
percentage points less likely to ride public transit, which makes sense since the individual would
have less free time to travel. Taken together, these results indicate that availability of TNCs
reduce the negative effect of long work hours on the probability of using public transit.
From the five regressions, one of the most interesting conclusions is that the TNC
coefficients are consistently centered around zero, though their values and statistical significance

34
change. This suggests that the introduction of TNCs do not have much influence over an
individual’s probability of riding public transit for the general population, though white collar
workers and workers with long hours see a complementary relationship. We also see some
positive effects for some income groups.

35
Section III: How TNCs Increase Transit Ridership Through Policy
City governments and transit agencies are starting to embrace the idea that partnering
with TNCs can “enhance mobility” and “resolve transportation challenges,” especially in areas
with inadequate transit options and parking availability (Schwieterman, Livingston, and Van Der
Slot 2018). TNCs can complement public transit because their flexibility fills in service gaps and
provides greater cost efficiency for cities and transit agencies. To examine if policies that
incentivize the use of TNCs in conjunction with public transit increase transit ridership, I
conducted case studies of public-private TNC partnerships in Los Angeles County. Through
these case studies, I aim to contextualize my larger-scale data analysis and provide an in-depth
understanding of how TNC and public transit partnerships are created, advantages and
disadvantages of such policies, funding mechanisms, and implementation hurdles. These
findings can provide useful context for transit agencies and cities that have seen a decline in
transit ridership and are considering partnering with TNCs to address this problem.
Discounts on ridesharing trips in Los Angeles County are offered by Monrovia, the Los
Angeles County Metropolitan Transportation Authority (“Metro”), and Claremont. The three
programs serve as my case studies. They each have different transportation problems, models for
increasing public transit ridership, and theories on people’s transportation behavior, but share a
common goal of using TNCs to alleviate transportation problems in their region.
Monrovia is a small city in the suburb of Los Angeles County. The city’s goal in
partnering with Lyft is to reduce their citizens’ reliance on automobiles. Their partnership grew
out of Monrovia’s need to provide more viable transportation options other than private
automobiles, since the area is transit poor and popular shopping, dining, and public
transportation areas have limited parking. Monrovia currently offers any rider in its service area

36
discounted Lyft rides across the city. The Lyft subsidy is funded by money previously allocated
to Monrovia’s Dial-a-Ride program, which has been declining over time. Most notably, with the
same amount of money, Monrovia is now serving 27 times more people with the Lyft partnership
compared to their previous Dial-a-Ride offering, which is a win-win for the city and its residents.
Metro is collaborating with a TNC called Via for three of its transit stations. All rides
must begin or end at one of these stations. Metro’s main goals for this partnership are to address
first mile/last mile difficulties with riding public transit, increase public transit ridership on their
Metro lines, and make the benefits of TNCs more accessible to low-income riders and the
disabled. They are more directly focused on increasing public transit ridership than Claremont or
Monrovia, but also seem less interested in altering people’s travel behaviors. Rather, they are
trying to incentivize more people to travel to and from the transit station, but do not have bigger
aims like Monrovia’s goal to decrease private automobile usage.
Claremont’s partnership with Lyft is inspired by Monrovia’s, but differs in its
motivations. The city needs to address parking limitations in its popular downtown shopping and
dining area, which will soon welcome a new light rail station that will increase visitors to the city
by tenfold. Their primary goal is to decrease congestion in high-traffic areas, mainly by
incentivizing people to travel using TNC rides instead of private automobiles. However, their
plans may increase congestion if TNC usage increases vehicle miles traveled, especially during
peak times. They draw from Dial-a-Ride funding like Monrovia but have not scaled down the
former program, which gives them less funding in comparison to Monrovia for TNC subsidies.
These case studies primarily rely on interviews and local newspaper articles. I conducted
one in-person interview with Colin Tudor, who is the Assistant City Manager of Claremont and
spearheaded the city’s partnership with Lyft. I also conducted three phone interviews with Oliver
37
Chi, Cari Dillman, and Emma Huang. Oliver Chi is the City Manager of Monrovia. He helped
conceive of and finalized the details for Monrovia’s partnership with Lyft, and currently oversees
the program’s implementation at a high level. Cari Dillman is a Management Analyst in the
Transit Services Department in Claremont. She is currently the lead for the city’s partnership
with Lyft since many transit-related projects fall under her domain. Emma Huang is a
Transportation Planner in the Office of Extraordinary Innovation of Metro. She led Metro’s
partnership with Via from the beginning, even before Via was chosen as the official TNC for the
partnership.

38
Chapter 6: Monrovia, California
The City
Monrovia is a suburb of Los Angeles County, California. According to the 2010 Census,
Monrovia has a population of 36,590, with 2,689.5 residents per square mile and 13.71 total
square miles of land. 88.5% of residents graduated from high school, 37.7% of residents have a
Bachelor’s degree or higher, and 70.3% of residents are in the labor force. The mean travel time
to work for workers over 16 years of age is 31.6 minutes, and the median household income in
2017 dollars is $71,373 (U.S. Census Bureau 2018b).
The Policy
GoMonrovia is a multi-modal transportation program in partnership with Lyft and
LimeBike13 that aims to provide “fast and affordable transportation all throughout Monrovia” so
residents would rely less on personal automobiles (City of Monrovia 2019b). Currently, residents
drive cars everywhere because public transportation options are limited. By introducing a
subsidy for Lyft rides, Monrovia hopes to shift people’s travel behavior towards walking, biking,
and shared modes of transportation like Lyft, light rail, and bus.
The program’s launch in March 2018 made Monrovia the first city in the United States to
have a long-term partnership with TNCs (Pimentel 2018). Anyone in the GoMonrovia service
area can take a Lyft ride at a reduced rate. The service area includes the cities Monrovia,
Bradbury, and Arcadia; unincorporated areas of Los Angeles County that are adjacent to
Monrovia; and a Target store in Duarte that is a designated transfer point for riders to take buses
13 I will be focusing on the city’s partnership with Lyft because my thesis concerns TNCs, which do not include bike sharing companies.

39
from Duarte Transit, a local transit agency. The program also applies to passengers who have
medical appointments at the local hospital called City of Hope, or physician’s offices within
three miles of Monrovia’s city limits (City of Monrovia 2019b). GoMonrovia is currently the
most used city program in Monrovia, with over 18,749 residents signed up for the program.
Figure 2. GoMonrovia Coverage Area (Source: Lyft app)
GoMonrovia’s goal is to “create an affordable transportation program that [is] so easy to
use that the broader community might seriously consider public transit in Monrovia as a real
option” (City Manager’s Office 2018). Currently the city is “transit poor,” says City Manager
Oliver Chi, because “there are not many high-quality transit routes outside of the Gold Line.”
The Metro Gold Line is a light rail service that serves 50,000 individual rides per day, with
approximately 1,200 riders boarding or getting off at Monrovia’s Gold Line station (Chi 2019).
The only other public transportation alternatives are two bus lines from Foothill Transit, which is

40
a local transit agency that serves the San Gabriel Valley, and the city’s Dial-a-Ride shuttle bus
program (City of Monrovia 2019c). Far fewer residents take the bus compared to light rail, and
the historical Dial-a-Ride program served “only a very narrow range of public transit users,” was
“inconvenient for general everyday use,” and was “an incredibly costly way to move people
around” (City Manager’s Office 2018). Monrovia is required by Los Angeles County to provide
some variant of a Dial-a-Ride program for its citizens. Dial-a-Ride costed $1 million but
provided only 30,000 rides every year. Now, for about the same price, Monrovia’s partnership
with Lyft provides between 65,000 and 70,000 rides per month (Chi 2019). Said another way,
Monrovia is now serving 27 times more people with the Lyft partnership compared to Dial-a-
Ride, without needing to drastically change their budget. Partnering with a TNC allowed the city
to use their existing infrastructure in conjunction with TNCs’ effective new transportation model
to better serve their community (American Public Transportation Association 2018, 3).
Monrovia was also motivated to revamp its mobility options because of the city’s
expected future growth. There are over 2,200 proposed multi-family units in the housing
development pipeline, over 2,000 new jobs added over the past three years (2015 to 2018), and
Southern California’s population is expected to grow by over 4 million people in the next 25
years (City of Monrovia 2019a). If the city’s mobility constraints remain unaddressed, then
residents will have steadily worsening parking and traffic problems. GoMonrovia aims to
address the city’s transit deficit by providing additional transportation options that are faster and
more convenient, and subsidizing trips to public transit stations to encourage their use.

41
Why Lyft?
Monrovia chose to partner with Lyft to take advantage of the speed and convenience of
their service, and because the company’s goal is to use their ride-sharing platform “to
complement existing public transportation services, not replace them” (City Manager’s Office
2018). It was important for Monrovia to “build collaborative partnerships” so the city and TNC
could “build a shared vision and work alongside on challenges and solutions,” and Lyft stood out
as a company that is willing to work through the details with a city (American Public
Transportation Association 2018, 3).
One concern that arises when public entities collaborate with private companies is data
privacy. All data shared with cities is public information, and Lyft did not want to release
specific details on trips because that information could be traced back to individuals and used to
recreate their rider-driver matching algorithm, which is a core part in their business model. As a
compromise, Lyft shares data in an “aggregated and anonymous level” with the city to protect
user privacy and their business interests, while also giving cities useful information about how
residents use the GoMonrovia program (American Public Transportation Association 2018, 3).
Enactors and Implementers
The primary enactor and implementer of GoMonrovia is the City Manager’s office.
Specifically, the City Manager, Assistant City Manager, Deputy City Manager, and the Assistant
to the City Manager were integral in creating and executing the program. The process from
creating the idea to implementing the full program took less than eight months, which is
highlighted in Table 14 (American Public Transportation Association 2018, 2). Currently, the
42
Assistant to the City Manager oversees the day-to-day administration of the program. Public
Works continues to run Dial-a-Ride (Chi 2019).
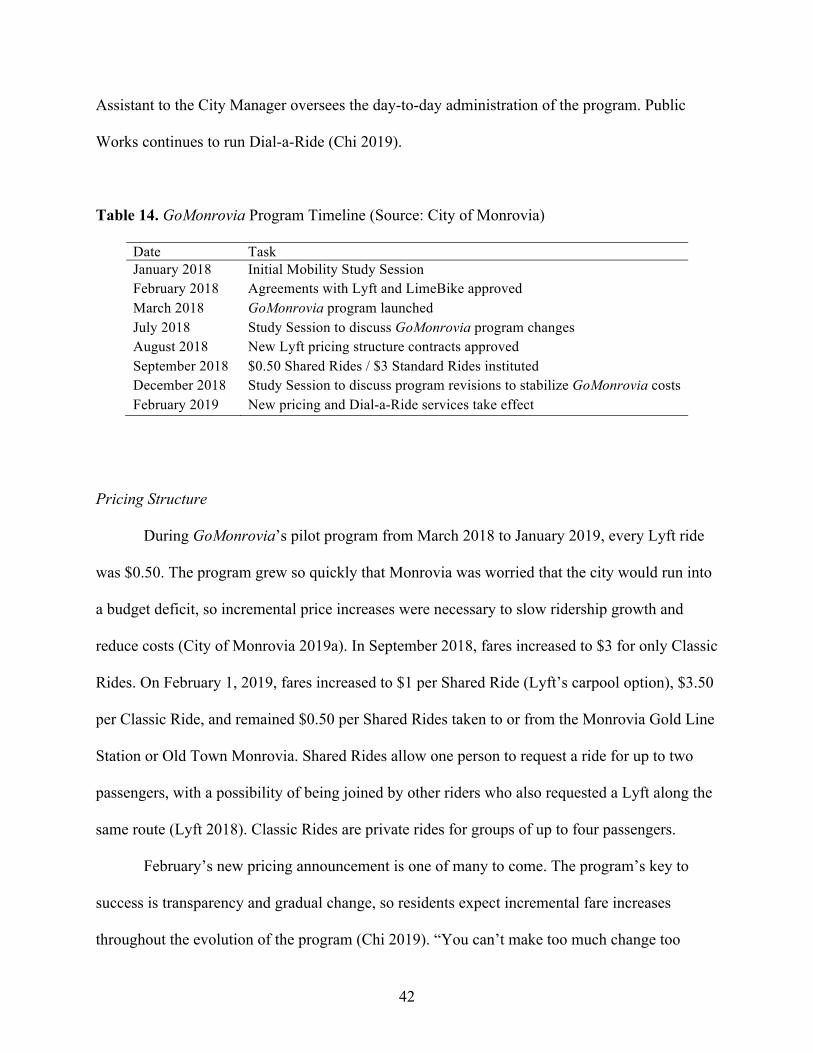
Table 14. GoMonrovia Program Timeline (Source: City of Monrovia)
Date Task January 2018 Initial Mobility Study Session February 2018 Agreements with Lyft and LimeBike approved March 2018 GoMonrovia program launched July 2018 Study Session to discuss GoMonrovia program changes August 2018 New Lyft pricing structure contracts approved September 2018 $0.50 Shared Rides / $3 Standard Rides instituted December 2018 Study Session to discuss program revisions to stabilize GoMonrovia costs February 2019 New pricing and Dial-a-Ride services take effect
Pricing Structure
During GoMonrovia’s pilot program from March 2018 to January 2019, every Lyft ride
was $0.50. The program grew so quickly that Monrovia was worried that the city would run into
a budget deficit, so incremental price increases were necessary to slow ridership growth and
reduce costs (City of Monrovia 2019a). In September 2018, fares increased to $3 for only Classic
Rides. On February 1, 2019, fares increased to $1 per Shared Ride (Lyft’s carpool option), $3.50
per Classic Ride, and remained $0.50 per Shared Rides taken to or from the Monrovia Gold Line
Station or Old Town Monrovia. Shared Rides allow one person to request a ride for up to two
passengers, with a possibility of being joined by other riders who also requested a Lyft along the
same route (Lyft 2018). Classic Rides are private rides for groups of up to four passengers.
February’s new pricing announcement is one of many to come. The program’s key to
success is transparency and gradual change, so residents expect incremental fare increases
throughout the evolution of the program (Chi 2019). “You can’t make too much change too
43
quickly to a program people love,” explains Chi. The city informed the public since the
beginning that the program’s initial $0.50 fare for all rides would not be permanent because that
price is financially unsustainable for the city. Rather, the city promised that fares to the Gold
Line station and Old Town Monrovia would never increase, and all other ride fares will
gradually increase over time, usually by $0.50 increments.
Monrovia places great importance on keeping fares low for trips to the Gold Line Station
because the city’s leadership wants to deliberately “influence behavioral change” so their
residents will be less reliant on single occupancy vehicles and more reliant on shared mobility
options like Lyft (Chi 2019). For example, take a Monrovia resident who rides the Gold Line to
commute to work every day, and drives a car from their home to the transit station since that is
the only viable way of getting there. With Lyft, this resident can now commute to the transit
station on-demand for only $0.50 per ride. This person may not even need to own a personal
vehicle anymore if they do not use it for other purposes, since Lyft provides the mobility they
need.
To further incentivize ridership on the Gold Line, fares to the Gold Line Station will
permanently remain at $0.50 because Metro will soon begin charging $3 per day for parking at
any Gold Line Station parking structure. If GoMonrovia increased their prices to $1, for instance,
then taking Lyft would cost $2 per day while driving a personal vehicle would cost $3. Chi
worries that the $1 difference between the two transportation options would not be enough
incentive for drivers to switch to Lyft. By keeping round trip fares at $1, Chi hopes that Lyft’s
more competitive pricing would encourage more people to use GoMonrovia instead of driving to
travel to and from the Gold Line Station. As of February 2019, an average of 20,000 rides every
month travel to and from the Gold Line station. Trips to and from the station make up 30% of all

44
Lyft trips (City of Monrovia 2019a). 56% of all Gold Line rides from the Monrovia station use
Lyft to get to and from the station.14
Fares will also remain low for trips to Old Town Monrovia, the city’s downtown area.
Though Old Town has many restaurants and entertainment options, it does not have many
parking spaces. Lyft gives residents the option of traveling to the area at an affordable price
without needing to worry about finding parking. Further, Old Town Monrovia includes a Foothill
Transit bus stop, which is an additional incentive for using public transit. As of February 2019,
16% of all GoMonrovia Lyft trips were taken to Old Town (Chi 2019).
Funding Sources
Monrovia relies on three funding sources for the Lyft subsidy: revenue from
transportation sales tax ballot measures, cost deductions by collaborating with Lyft, and
contributions from neighboring areas who are serviced by GoMonrovia.
First, Monrovia has access to four different revenue streams from four different Los
Angeles County transportation sales tax ballot measures. These measures increase the sales tax
and use the revenue for only transportation-related purposes (American Public Transportation
Association 2018, 4). Before GoMonrovia, all the $1 million of funding that Monrovia received
from the sales tax revenue was used to fund the city’s Dial-a-Ride program. The city reallocated
most of this funding to GoMonrovia instead. To ensure that GoMonrovia had a transportation
option for passengers with disabilities, the city partnered with Access Services to more
efficiently provide paratransit services. Access Services is run by Los Angeles County and
14 20,000 rides every month travel to and from the Gold Line station ÷ (1,200 riders boarding or getting off at Monrovia’s Gold Line station per day * 30 days per month) = 55.56%
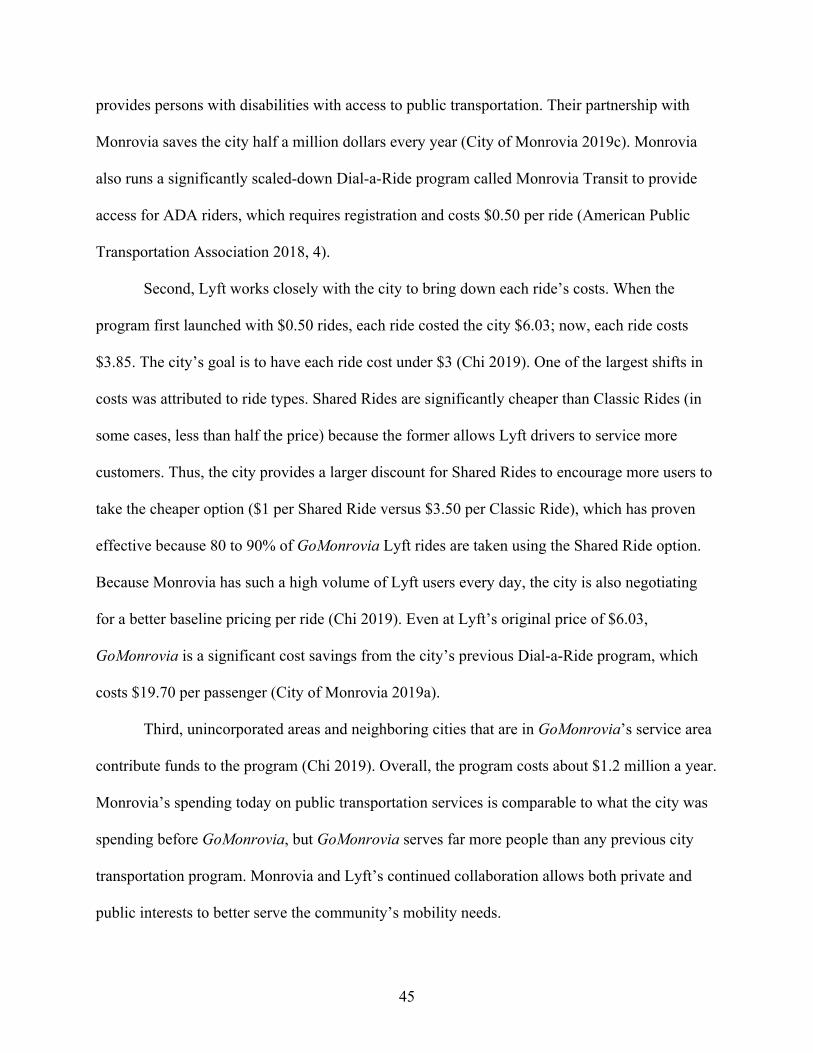
45
provides persons with disabilities with access to public transportation. Their partnership with
Monrovia saves the city half a million dollars every year (City of Monrovia 2019c). Monrovia
also runs a significantly scaled-down Dial-a-Ride program called Monrovia Transit to provide
access for ADA riders, which requires registration and costs $0.50 per ride (American Public
Transportation Association 2018, 4).
Second, Lyft works closely with the city to bring down each ride’s costs. When the
program first launched with $0.50 rides, each ride costed the city $6.03; now, each ride costs
$3.85. The city’s goal is to have each ride cost under $3 (Chi 2019). One of the largest shifts in
costs was attributed to ride types. Shared Rides are significantly cheaper than Classic Rides (in
some cases, less than half the price) because the former allows Lyft drivers to service more
customers. Thus, the city provides a larger discount for Shared Rides to encourage more users to
take the cheaper option ($1 per Shared Ride versus $3.50 per Classic Ride), which has proven
effective because 80 to 90% of GoMonrovia Lyft rides are taken using the Shared Ride option.
Because Monrovia has such a high volume of Lyft users every day, the city is also negotiating
for a better baseline pricing per ride (Chi 2019). Even at Lyft’s original price of $6.03,
GoMonrovia is a significant cost savings from the city’s previous Dial-a-Ride program, which
costs $19.70 per passenger (City of Monrovia 2019a).
Third, unincorporated areas and neighboring cities that are in GoMonrovia’s service area
contribute funds to the program (Chi 2019). Overall, the program costs about $1.2 million a year.
Monrovia’s spending today on public transportation services is comparable to what the city was
spending before GoMonrovia, but GoMonrovia serves far more people than any previous city
transportation program. Monrovia and Lyft’s continued collaboration allows both private and
public interests to better serve the community’s mobility needs.
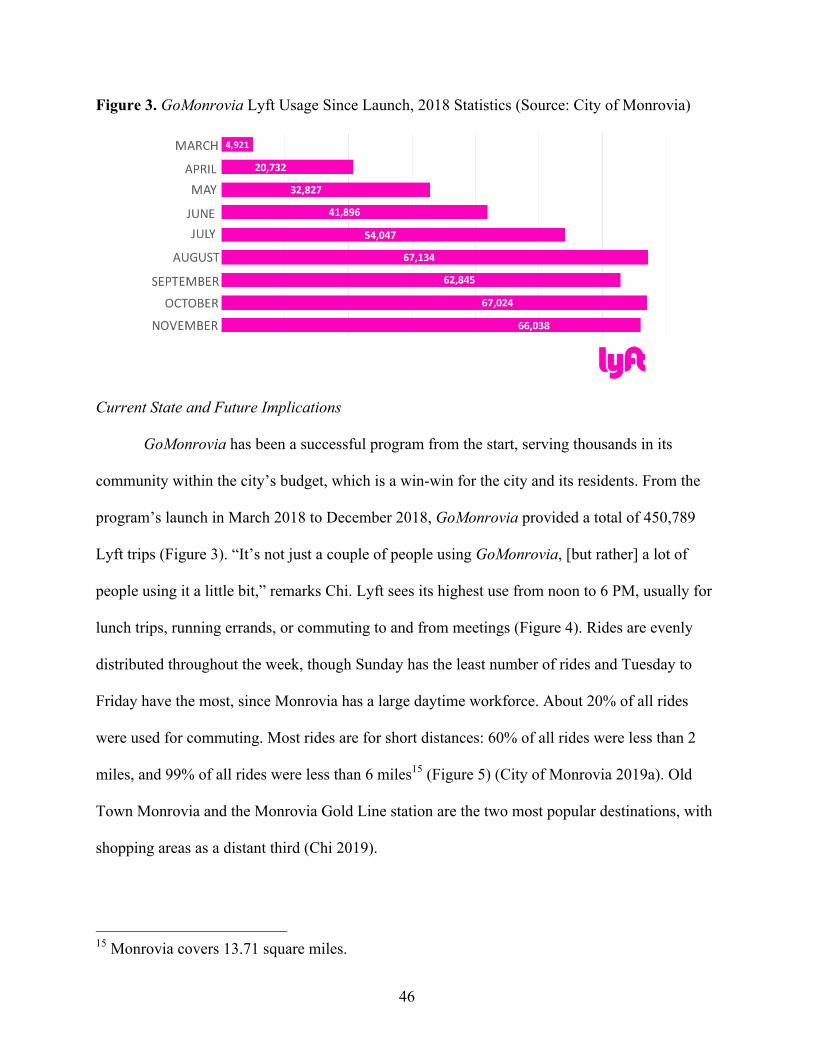
46
Figure 3. GoMonrovia Lyft Usage Since Launch, 2018 Statistics (Source: City of Monrovia)
Current State and Future Implications
GoMonrovia has been a successful program from the start, serving thousands in its
community within the city’s budget, which is a win-win for the city and its residents. From the
program’s launch in March 2018 to December 2018, GoMonrovia provided a total of 450,789
Lyft trips (Figure 3). “It’s not just a couple of people using GoMonrovia, [but rather] a lot of
people using it a little bit,” remarks Chi. Lyft sees its highest use from noon to 6 PM, usually for
lunch trips, running errands, or commuting to and from meetings (Figure 4). Rides are evenly
distributed throughout the week, though Sunday has the least number of rides and Tuesday to
Friday have the most, since Monrovia has a large daytime workforce. About 20% of all rides
were used for commuting. Most rides are for short distances: 60% of all rides were less than 2
miles, and 99% of all rides were less than 6 miles15 (Figure 5) (City of Monrovia 2019a). Old
Town Monrovia and the Monrovia Gold Line station are the two most popular destinations, with
shopping areas as a distant third (Chi 2019).
15 Monrovia covers 13.71 square miles.

Figure 4. Lyft Usage by Time of Day (Source: City of Monrovia)
Figure 5. Lyft Usage by Trip Length (Source: City of Monrovia)
Major benefits that have resulted from the Lyft partnership include bridging first mile/last
mile connections, significantly changing residents’ mobility behavior, substantial savings from
the city’s previous Dial-a-Ride model, reducing parking demand, reducing greenhouse gas
emissions16, and increasing public transit ridership, especially since Shared Rides are considered
as public transit by Monrovia (City of Monrovia 2019a). When asked about how the residents of
Monrovia feel about the program, Chi responded, “I cannot express how much people have
appreciated this program. [...] Feedback from the community is incredible, and people are using
this constantly. [...] We don’t get complaints that there aren’t enough parking spaces anymore.”
(Chi 2019). No residents have complained about February’s fare increase either, which Chi
attributes to the city’s transparency about fares and the incremental increases in price.
In the future, Monrovia hopes to partner with Lyft to make TNCs more environmentally
friendly (American Public Transportation Association 2018, 5). Lyft does prioritize reducing
greenhouse gas emissions: for instance, the company has committed to purchasing carbon offsets
for every ride, making rides carbon neutral17 (American Public Transportation Association 2018,
16 Every Lyft ride is carbon-neutral. 17 Lyft purchases carbon offsets to ensure that all rides are carbon neutral.
17%
35%37%
10%AMPeak
Midday
PMPeak
LateNight
60%
33%
6% 1%
0-2miles2-4miles4-6miles

48
3). Future additions could include decreasing driver idling time when waiting for their next ride,
and introducing more incentives to increase the percentage of shared rides (City of Monrovia
2019a). Monrovia will be conducting a study in the near future to determine whether Lyft is
increasing or decreasing Vehicle Miles Traveled (VMT) in the service area, strategize how to
work with employers to increase the use of GoMonrovia for commutes, determine how to make
the program financially sustainable in the long term, and decide if dedicated Lyft pick-up and
drop-off locations are necessary for high traffic areas like Old Town Monrovia and schools (City
of Monrovia 2019a).

49
Chapter 7: Los Angeles Metro
The Transit Agency
Metro is a quasi-governmental regional transportation planning agency that was
established in 1993. Metro is the primary transportation agency in Los Angeles County, which
has an area of 4,084 square miles, a population of 10.16 million, and 88 cities and
unincorporated areas. Los Angeles County is plagued with a variety of transportation issues. For
instance, its commuters are stuck in traffic 81 hours a year on average, and only 6.8% of
residents ride public transit (Metro 2019b).
Metro directly operates bus and rail services, and funds and plans transportation projects.
The agency currently has 13,978 bus stops along its 165 bus routes, and 93 rail stations for its 4
light rail lines and 2 subway lines. Metro also oversees 219 miles of HOV carpool lanes and over
2,000 miles of bikeways. 9,817 people currently serve on Metro’s full-time staff (Metro 2019a).
The Policy
Metro launched their partnership with Via on January 28, 2019 to provide on-demand
rides to and from three transit stations. Via’s service is intended to be “quick, easy, and
inexpensive” to use and accessible to all (Korosec 2019). Metro as a transit agency has
significant interest in increasing public transit ridership, so the year-long pilot program aims to
“solve the first- and last-mile problem that makes it challenging to get to and from public transit
stations” and “combat decreasing public transit ridership” that Metro partially attributes to the
rise in TNC usage (Korosec 2019). Metro also hopes to increase the accessibility of TNCs to
low-income riders and the disabled through this partnership by offering rides that cost less than
50
TNCs typically charge on ADA-compliant vehicles, which companies like Uber and Lyft do not
offer (Huang 2018).
Riders can book a shared carpool ride on Via’s iPhone or Android app18 anytime from
Monday to Friday between 6 am and 8 pm. Each ride must take place within the service area
(outlined in Figures 6, 7, and 8) and begin or end at Metro’s North Hollywood/Burbank, El
Monte, or Artesia stations. Each station has a designated Via pickup area to increase the
service’s efficiency, since drivers can pick up multiple riders from one location. Fares are a flat
rate per ride: Metro LIFE (Low Income Fare Program)19 participants ride for free, TAP card20
holders pay $1.75 per ride, and all other rides are $3.75 (Metro 2019d).
Metro selected the North Hollywood/Burbank, El Monte, and Artesia stations based on
the following criteria (Huang 2018):
1. Equity and access for vulnerable populations. Metro identified communities that
have not had as many opportunities to benefit from ride sharing services, such as low
income and minority populations.
2. Geographic diversity. The three stations serve different geographic areas in Los
Angeles County.
18 For riders without smartphones, a call center is available to help book rides. Bank accounts are not needed to use Via because payment is accepted by credit, debit, or pre-paid card (Hymon 2019). 19 LIFE stands for Low-Income Fare is Easy. To be eligible for this Metro program, a rider’s annual household income must fall under a certain threshold depending on their household size. For example, a rider is eligible if they live in a household of 1 and earn $33,950 or less in annual income, or if they live in a household of 4 and earn $48,450 or less (Metro 2018a). 20 TAP is a reusable card that holds stored values and Metro passes. A rider boarding a bus or train pays their fare by tapping their card on a card reader machine (Metro 2018b). To be eligible for a lower Via fare, riders must input their TAP card number into Via’s app.
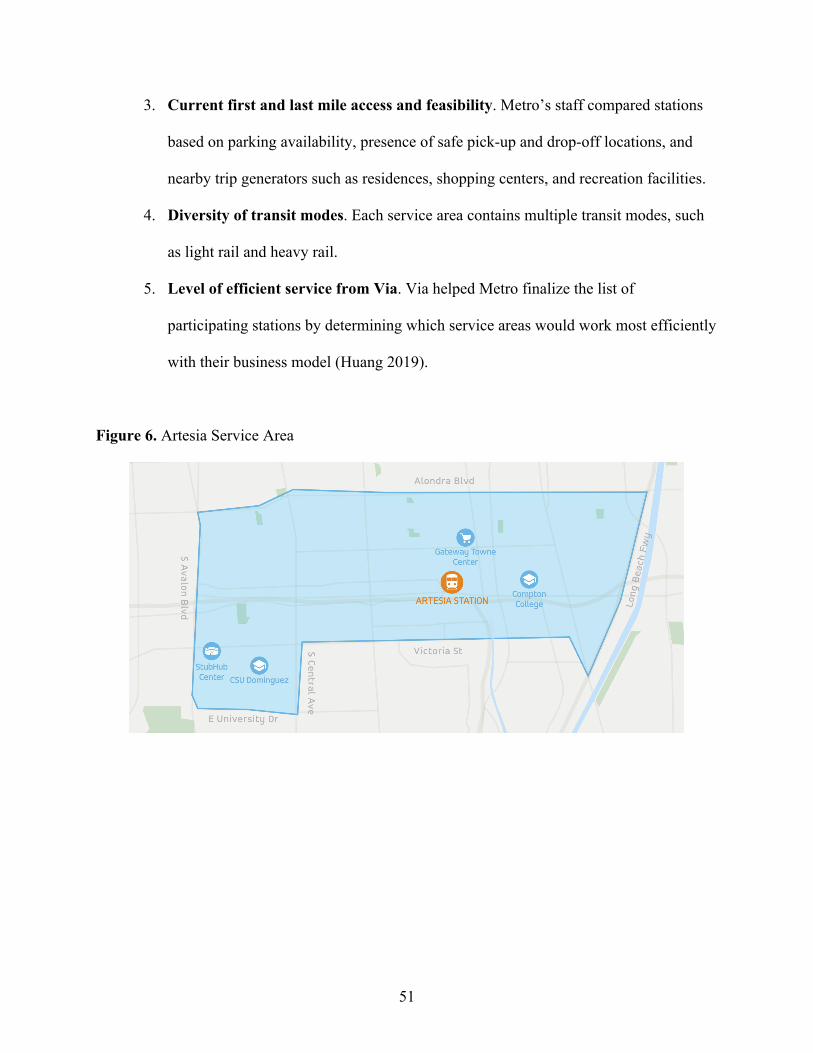
51
3. Current first and last mile access and feasibility. Metro’s staff compared stations
based on parking availability, presence of safe pick-up and drop-off locations, and
nearby trip generators such as residences, shopping centers, and recreation facilities.
4. Diversity of transit modes. Each service area contains multiple transit modes, such
as light rail and heavy rail.
5. Level of efficient service from Via. Via helped Metro finalize the list of
participating stations by determining which service areas would work most efficiently
with their business model (Huang 2019).
Figure 6. Artesia Service Area

52
Figure 7. El Monte Service Area
Figure 8. North Hollywood/Burbank Service Area
Policy Creation
Metro’s Office of Extraordinary Innovation (OEI) oversees the transit agency’s
partnerships with TNCs. OEI was created in 2015 to improve mobility in Los Angeles County by
finding and testing new ideas (Metro 2019c). OEI conceives of projects through unsolicited
53
proposals from private companies working on transportation innovations; implementing Metro
Vision 2028, which is the transit agency’s “big picture plan to improve mobility in Los Angeles
County”; and researching innovations that other transit agencies and cities are piloting (Metro
2019c). OEI oversees the Via program because the partnership deals with new mobility services.
The Metro-Via partnership lead is Emma Huang, a Transportation Planner in OEI. She was
involved since the beginning and continues to oversee its implementation today.
The idea for the partnership was conceived because of the Federal Transit Administration
(FTA)’s Mobility on Demand Sandbox program, which grants money to transit agencies so they
can leverage “on-demand information, real-time data, and predictive analysis to provide travelers
with transportation choices that best serve their needs and circumstances” and provide “better
mobility options for everyone” (Federal Transit Administration 2016). Metro applied for this
grant because the agency was “really interested in taking the benefits that TNCs offer, but
wanted to expand them to a wider audience,” and was chosen as a recipient (Huang 2019).
Initially, Metro was considering 8 different TNCs. Lyft was one of the front runners, but
Metro decided not to partner with the company because Metro wanted to work with a TNC that
would be able to provide wheelchair-accessible vehicles and give Metro access to detailed data
so the agency can learn about riders’ travel behavior. Lyft was unwilling to provide either
request, so Metro decided to work with a different company (Huang 2019).
After approximately 13 months of negotiation, Via agreed to Metro’s requests and
officially partnered with the transit agency. Founded in 2012, Via is “an on-demand transit
system that takes multiple passengers heading in the same direction and books them into a shared
vehicle” (Via 2018). Unlike Uber and Lyft, Via offers only a corner-to-corner service, so drivers
pick up and drop off their riders within a couple blocks of their exact requested location in order

54
to decrease overall trip time. Because of this business model, the company likens themselves to
an on-demand bus service and tends to partner with public transit agencies and cities to provide
transit services (Via 2018).
To reach a data sharing agreement with Via, Metro first considered which variables
related to the Via user experience that the agency would be interested in, such as where the trip
originated and terminated, how long it took for the rider to be picked up, and how long the ride
took. Then, Metro negotiated with Via for permission to use this data internally. Their agreement
allows Metro to have access to trip-level data for five years, but Metro must aggregate the data to
a significantly higher level before publishing any findings. Data privacy is such a big concern for
TNCs because someone could easily reverse engineer the data to recreate the company’s driver-
rider matching algorithm, which forms the foundation of their business (Huang 2019).
Metro based the Via fare structure on their TAP system. Originally, the transit agency
envisioned full integration between the TAP and Via systems so riders could transfer onto Via
for free after taking public transit. However, that idea never came to fruition because it was too
costly and time intensive for both parties. As a compromise, Metro offers a lower fare for people
who input their TAP card number into Via’s app so the agency can track how people travel from
public transit to Via. Even so, Via’s fare is currently higher than most bus and train fares for all
riders except LIFE participants. Metro is planning on lowering fares later in 2019 to create
greater incentives for riders to change their commuting behavior. At the current fare, riders
would have to pay more to use Via than drive their personal vehicle, because parking at these
transit stations currently costs $2 a day, which is cheaper than paying $3.50 round trip21 for Via
(Huang 2019).
21 Assuming that the rider is charged the TAP card fare of $1.75 per ride.
55
Current State and Future Implications
The year-long partnership will cost $2.5 million, $1.35 million of which is funded by the
FTA grant (Korosec 2019). The rest of the costs are funded by local dollars from transportation
sales tax ballot measures. Metro ended up choosing three stations for its pilot program because of
the amount of funding available, but may expand the program to more stations in the future
(Huang 2019).
Metro does not currently have a vision for this program’s future because they are still in
the experimenting and testing stage. “At this point it’s really too soon to tell what is next,” says
Huang. “We’ll see what the data shows.” Potential additions include increasing the availability
of accessibility services and integrating TAP into the Via software. Metro would also like to
investigate if TNCs add to congestion or help mitigate it. The agency partnered with university
research centers like University of California, Los Angeles’ Center for Transportation, which
will be examining the data for ridership trends and environmental implications (Huang 2019).
56
Chapter 8: Claremont, California
The City
Claremont is a suburb of Los Angeles County, California. According to the 2010 Census,
Claremont has a population of 34,926, with 2,616.6 residents per square mile and 13.35 total
square miles of land. 94.2% of residents graduated from high school, 55.9% of residents have a
Bachelor’s degree or higher, and 60.8% of residents are in the labor force. The mean travel time
to work for workers over 16 years of age is 27.2 minutes, and the median household income in
2017 dollars is $96,923 (U.S. Census Bureau 2018a).
Background
Claremont’s downtown Village is a hub for dining, shopping, and entertainment. Parking
congestion has become an increasingly prominent problem in the area as businesses grow
economically (Schultz 2018). This issue will be intensified when the Claremont Gold Line
begins offering rides from the Village’s train station.22 The station’s current passenger rail
provider, Metrolink, transports approximately 200 riders to and from Claremont every day. The
Gold Line is expected to transport 2,000 riders a day, which increases the number of people
going through the Village by 10 times (Tudor 2019). To address these concerns, Claremont’s
leadership decided to develop a comprehensive Parking Management Plan for the Village, which
includes a Lyft Subsidy Program.
22 The Gold Line was scheduled to begin service in Claremont in 2026. However, on November 12, 2018 Metro announced that the Gold Line’s planned extension to the cities of Pomona, Claremont, and Montclair will be delayed by at least two years due to considerable construction cost increases. The project’s cost estimate, which was calculated two years ago, is short $570 million. However, Metro announced in a press release that the Gold Line may still be completed on time if funding is secured before 2021 (Metro 2018c).

57
Initially, this Parking Management Plan included a Paid Parking System, which would be
implemented through a pay by plate system. The proposed rate for non-residents was $3 for the
first two hours and $1 for each additional hour for up to four hours, and for residents was $2 for
the first two hours and $0.50 for each additional hour for up to four hours. Annual revenue was
estimated between $2.9 million and $3.3 million, which would have been the fourth highest
revenue generator in the city (Schultz 2018). However, “there was a lot of public pushback on
the paid parking,” recounts Assistant City Manager Colin Tudor. Thus, the city abandoned those
efforts and instead focused on their partnership with Lyft to help alleviate the Village’s parking
problems (Tudor 2019).
The Policy
Claremont’s Lyft Subsidy Program will be launched in Summer 2019. The city’s primary
goal is to decrease congestion and increase parking availability in high-traffic areas by
incentivizing people to take TNCs instead of private automobiles to and from those areas.
Claremont chose to partner with Lyft because of the example GoMonrovia set, and Lyft’s
willingness to cooperate with the local government. The city government also considered Uber,
but after a couple of interactions concluded that “Uber doesn’t really want to play nice with
anybody” and is “more set on the disrupter model” (Tudor 2019). Similar to how Monrovia’s
program provides additional savings on Old Town Monrovia and their Gold Line station,
Claremont’s program provides subsidies for rides only to and from the Village, which includes
the city’s future Gold Line station. The initial rate structure is $1.50 per Lyft ride (maximum four
passengers) and $3.00 per Lyft Plus ride (maximum six passengers), which is similar pricing to
58
what people would have paid for parking and Dial-a-Ride services. Each person can take a
maximum of 20 rides per month (Schultz 2018).
Claremont plans to designate pick up and drop off locations in the Village because its
streets are narrow. Currently, TNCs stop in the middle of the street to drop off or pick up riders,
which worsens congestion. Rather than adding to this problem, the city hopes that these
designated zones will be an effective prevention measure (Tudor 2019). However, TNCs may
still end up increasing vehicle miles traveled and congestion in the Village if the subsidy
substantially increases the number of people visiting the popular shopping and dining area.
Funding for this partnership comes from transportation sales tax ballot measure funds that
are designated for transportation uses like Dial-a-Ride, which are funding sources similar to the
previous partnerships covered in this section. Because the city’s Dial-a-Ride usage has been
decreasing for the last five years, the city is able to maintain that service at its current capacity
and spend the remaining funds to the subsidy (Tudor 2019). This approach is different than
Monrovia’s, which significantly scaled down the city’s Dial-a-Ride program and allocated most
funding towards the Lyft partnership. Claremont plans to spend $50,000 in the partnership’s first
year, which will fund about 3,500 to 5,000 rides. If successful, Claremont plans to commit up to
$100,000 for the subsidy (Schultz 2018).
The partnership is still in its early stages. “We’ve really only just started to see what kind
of opportunities there might be,” says Tudor, though he anticipates that there will be support for
the program because funding is not an issue (Tudor 2019). The primary implementer of this
partnership is the Community Services Department, which oversees transit operations like Dial-
a-Ride (Dillman 2019). If successful, Claremont may offer Lyft subsidies to other shopping
centers in the area and Wilderness Park, a popular hiking destination in Claremont (Tudor 2019).
59
Section IV: Key Takeaways
I find that TNCs do not have a statistically significant effect on public transit ridership
overall, but are complements of public transit for white collar workers and workers with long
work hours. These sensitive groups are more likely to change their transportation behavior and
begin riding public transit once TNC services are available because of the flexibility TNCs offer.
This complementary relationship can be further strengthened through policy: three Los Angeles
County TNC partnerships with cities and transit agencies display how public and private
interests can collaborate to increase public transit ridership.
The three policy models are based on fundamentally different motivations and theories on
people’s transportation behavior, but all reveal valuable insights that cities and transit agencies
can use when creating their own partnerships with TNCs to increase public transit ridership.
The most outstanding benefit is from Monrovia’s policy: their partnership costs about the
same as their historic Dial-a-Ride program, but the city is now able to serve significantly more
people in their community by scaling down Dial-a-Ride and reallocating these funds to Lyft.
This politically popular program has made it possible for Monrovia to better address their
residents’ mobility needs without overextending their budget.
All three partnerships provide discounted rides to popular destinations like shopping
areas and transit stations. The pricing for these discounted TNC trips largely depend on prices of
related items, such as parking and public transit ride fares. Linking popular destinations to transit
stations seems like a good model to increase public transit usage, because people may be more
incentivized to ride public transit if they can easily run errands like picking up groceries on their
way home by using TNCs, rather than relying on a personal vehicle to make these multi-stop

60
trips because public transit by itself is not flexible enough. Such policies strengthen the
complementarity of TNCs and public transit.
Also notable was Los Angeles Metro’s ability to negotiate a greater data sharing plan
than Monrovia and Claremont could receive. Los Angeles Metro, despite being a public entity,
has access to trip-level data but does not have to disclose all its data publicly. The transit agency
was able to receive this valuable data because they agreed to release only aggregate data
publicly. Even with this constraint, Los Angeles Metro can inform their future public
transportation and TNC decisions by using this data to examine how their commuters use TNCs
to travel to and from transit stations.
Some limitations of this paper include the type of data studied. If I had more time, I
would examine aggregate data in conjunction with individual-level data to determine if both
show similar results. Since the individual-level data from ATUS is based on one diary day of
someone’s life, the data presents noisy information so transit behavior is hard to predict. In
addition, the TNC partnerships that I studied are quite new, so it is difficult to conclude whether
the proposed projects are economically sustainable and can provide benefits over the long term. I
would revisit these case studies in the future to see if the TNC partnerships actually change
transit behavior.
Opportunities for future research include investigating the environmental impact of TNCs
with and without policy incentives, and other modes of transportation that can help increase
public transit ridership. A worry that policymakers share about TNC subsidies is whether they
will increase vehicle miles traveled in high-traffic areas, the number of vehicles idling on streets
as drivers wait for new customers, and congestion. All these potential effects negatively impact
the environment by releasing car emissions because of the increase in TNC usage. However, a
61
potential way to decrease these worries is by incentivizing modes of transportation other than
TNCs. For instance, cities and transit agencies that adopt TNC subsidies can also look into how
these policies can work in conjunctions with campaigns to get people to walk and bike more
instead of relying on personal automobiles. If fully incorporated in their lifestyles, residents
could rely on only one family car and embrace using multiple modes of transportation in their
daily lives, which will ultimately be better for their health and the environment.
62
Works Cited
American Time Use Survey. “American Time Use Survey (ATUS) Data Dictionary: 2003-17 ATUS-CPS File,” July 2018.
American Public Transportation Association. “Case Study of City of Monrovia: Leveraging Emerging Ridesharing Services to Expand Mobility Options,” 2018.
Badger, Emily. “Is Uber Helping or Hurting Mass Transit?” The New York Times, October 20, 2017, sec. The Upshot.
Barff, Richard, David Mackay, and Richard W. Olshavsky. “A Selective Review of Travel-Mode Choice Models.” Journal of Consumer Research 8, no. 4 (1982): 370–80.
Binkovitz, Leah. “Why Are Fewer People Riding the Bus?” Houston Chronicle, August 24, 2017.
Bureau of Labor Statistics. “American Time Use Survey,” June 28, 2018. https://www.bls.gov/tus/.
Bureau of Labor Statistics. “American Time Use Survey (ATUS) Data Dictionary: Interview Data,” June 2018.
Bureau of Labor Statistics. “American Time Use Survey User’s Guide,” 2018, 116. Business Insider Intelligence. “Some Cities Are Subsidizing Uber Rides to Cut Public
Transportation Costs.” Business Insider, December 15, 2016. Chen, Cynthia, Don Varley, and Jason Chen. “What Affects Transit Ridership? A Dynamic
Analysis Involving Multiple Factors, Lags and Asymmetric Behaviour.” Urban Studies 48, no. 9 (July 2011): 1893–1908. https://doi.org/10.1177/0042098010379280.
Chi, Oliver. City Manager of Monrovia. Phone Interview, February 8, 2019. City Manager’s Office. “City of Monrovia Set to Launch a New Model for Suburban Mobility
through Partnerships with Lyft and LimeBike.” City of Monrovia, March 14, 2018. City of Monrovia. “GoMonrovia,” February 2019. https://www.cityofmonrovia.org/your-
government/public-works/transportation/gomonrovia. City of Monrovia. “GoMonrovia: Curbside Asset Management Forum.” January 30, 2019. City of Monrovia. “Transportation,” February 2019. https://www.cityofmonrovia.org/your-
government/public-works/transportation. Clark, Hugh M. “Who Rides Public Transportation.” American Public Transportation
Association, January 2017. Clewlow, Regina R, Gouri Shankar Mishra, Regina Clewlow, and Stephen Kulieke. “Disruptive
Transportation: The Adoption, Utilization, and Impacts of Ride-Hailing in the United States.” UC Davis Institute of Transportation Studies, October 2017, 38.
Crow, Sarah. “Here’s How Many Hours You’ll Spend Stuck in Traffic.” MSN, September 18, 2018.
DeLoach, Stephen B., and Thomas K. Tiemann. “Not Driving Alone: Commuting in the Twenty-First Century.” Elon University Department of Economics Working Paper Series, 2010, 23.
Dickens, Matthew, and MacPherson-Hughes Cromwick. “Understanding Recent Ridership Changes: Trends and Adaptations.” American Public Transportation Association, April 2018.
Dillman, Cari. Management Analyst in the Community Services Department of Claremont. Phone Interview, February 11, 2019.

63
Federal Transit Administration. “Mobility on Demand (MOD) Sandbox Program.” Text. Federal Transit Administration, April 20, 2016. https://www.transit.dot.gov/research-innovation/mobility-demand-mod-sandbox-program.
Friedman, Ann. “Will Women Ever Feel Completely Safe on Mass Transit?” CityLab (blog), March 27, 2014. http://www.theatlanticcities.com/commute/2014/03/will-women-ever-feel-completely-safe-mass-transit/8728/.
Glenn, Peggy. “Glossary of Transit Terminology.” American Public Transportation Association, July 1994.
Huang, Emma. “Stations Selected for Mobility on Demand Pilot Program.” The Source (Metro’s blog), July 16, 2018. https://thesource.metro.net/2018/07/16/stations-selected-for-mobility-on-demand-pilot-program/.
Huang, Emma. Transportation Planner and Via Partnership Lead in the Office of Extraordinary Innovation at the Los Angeles Metropolitan Transportation Authority. Phone Interview, March 4, 2019.
Hoffmann, Katherine, Panos Ipeirotis, and Arun Sundararajan. “Ridesharing and the Use of Public Transportation.” Proceedings of the 37th International Conference on Information Systems (ICIS), 2016, 11.
Hymon, Steve. “Metro Launches Partnership with Via for On-Demand Rides at Three Stations.” The Source (Metro’s blog), January 28, 2019. https://thesource.metro.net/2019/01/28/metro-launches-partnership-with-via-for-on-demand-rides-at-three-stations/.
Kimbrough, Gray. “Measuring Commuting in the American Time Use Survey.” University of North Carolina at Greensboro Economics Working Papers, June 16, 2014, 27.
Korosec, Kirsten. “Los Angeles Is Using Ride-Hailing Startup Via to Shuttle People to Public Transit.” TechCrunch (blog), January 28, 2019. http://social.techcrunch.com/2019/01/28/ los-angeles-is-using-ride-hailing-startup-via-to-shuttle-people-to-public-transit/.
Koziarz, Jay. “Transit Advocacy Group Offers Solutions to Reverse Chicago’s Slipping Bus Ridership.” Curbed Chicago (blog), November 8, 2017.
Los Angeles County Metropolitan Authority. “About Metro.” Accessed February 28, 2019. https://www.metro.net/about/about-metro/.
Los Angeles County Metropolitan Authority. “Facts at a Glance.” Accessed February 28, 2019. https://www.metro.net/news/facts-glance/.
Los Angeles County Metropolitan Authority. “Foothill Gold Line from Glendora to Montclair: Project Procurement Update Fact Sheet and Frequently Asked Questions,” November 12, 2018.
Los Angeles County Metropolitan Transportation Authority. “Low-Income Fare Is Easy (LIFE),” 2018. https://www.metro.net/projects/life/.
Los Angeles County Metropolitan Transportation Authority. “Measure M: Metro’s Plan to Transform Transportation in LA.” The Plan, 2019. http://theplan.metro.net.
Los Angeles County Metropolitan Transportation Authority. “Office of Extraordinary Innovation,” 2019. https://www.metro.net/projects/oei/.
Los Angeles County Metropolitan Transportation Authority. “Organizational Charts: July 1, 2018 to June 30, 2019,” 2018.
Los Angeles County Metropolitan Transportation Authority. “Ride with Via.” Accessed February 18, 2019. https://www.metro.net/projects/mod/.
Los Angeles County Metropolitan Transportation Authority. “TAP User Guide,” July 2018.
64
Lyft. “About Shared Rides.” Lyft Help, 2018. http://help.lyft.com/hc/en-us/articles/115013078848-About-Shared-rides.
Mallett, William J. “Trends in Public Transportation Ridership: Implications for Federal Policy.” Congressional Research Service, March 26, 2018.
Manville, Michael, Brian D. Taylor, and Evelyn Blumenberg. “Falling Transit Ridership: California and Southern California.” Southern California Association of Governments, January 2018.
McGuckin, N., and A. Fucci. “Summary of Travel Trends: 2017 National Household Travel Survey.” U.S. Department of Transportation Federal Highway Administration, July 2018.
Misra, Tanvi. “Why Immigrants Are Ditching Public Transit.” CityLab, January 5, 2017. Murphy, Colin, and Sharon Feigon. “Shared Mobility and the Transformation of Public Transit.”
Washington, D.C.: American Public Transportation Association, March 2016. https://doi.org/10.17226/23578.
Pimentel, Joseph. “This Lyft Partnership Program May Change City Transportation.” Bisnow, July 9, 2018. https://www.bisnow.com/los-angeles/news/neighborhood/lyfts-partnership-program-with-monrovia-may-change-how-city-transportation-90408.
Schrank, David, Bill Eisele, and Jim Bak. “2015 Urban Mobility Scorecard.” Texas A&M Transportation Institute, August 2015.
Schultz, Tara. “Potential Congestion Relief and Revenue Generation Through Active Parking and Mobility Management in the Village, Presented to the Future Financial Opportunities Committee by Claremont’s City Manager,” October 22, 2018.
Schwieterman, Joseph P., Mallory Livingston, and Stijn Van Der Slot. “Partners in Transit: A Review of Partnerships between Transportation Network Companies and Public Agencies in the United States.” Chaddick Institute for Metropolitan Development at DePaul University, August 1, 2018.
Schwieterman, Joseph P., and Mallory Livingston. “Uber Economics: Evaluating the Monetary and Nonmonetary Tradeoffs of TNC and Transit Service in Chicago, Illinois.” Chaddick Institute for Metropolitan Development at DePaul University, May 10, 2018, 32.
Siddiqui, Faiz. “Falling Transit Ridership Poses an ‘Emergency’ for Cities, Experts Fear.” Washington Post, March 24, 2018.
Taylor, Brian D., and Camille N. Y. Fink. “The Factors Influencing Transit Ridership: A Review and Analysis of the Ridership Literature.” Working Paper, UCLA Department of Urban Planning, 2009, 17.
Tudor, Colin. Assistant City Manager of Claremont. In Person Interview, January 28, 2019. U.S. Census Bureau. “U.S. Census Bureau QuickFacts: Claremont, California,” July 1, 2018.
https://www.census.gov/quickfacts/fact/table/claremontcitycalifornia/PST045218. U.S. Census Bureau. “U.S. Census Bureau QuickFacts: Monrovia, California,” July 1, 2018.
https://www.census.gov/quickfacts/monroviacitycalifornia. Via. “What Is Via?” Via Help Center, 2018. http://support.ridewithvia.com/hc/en-
us/articles/360002366392-What-is-Via-.
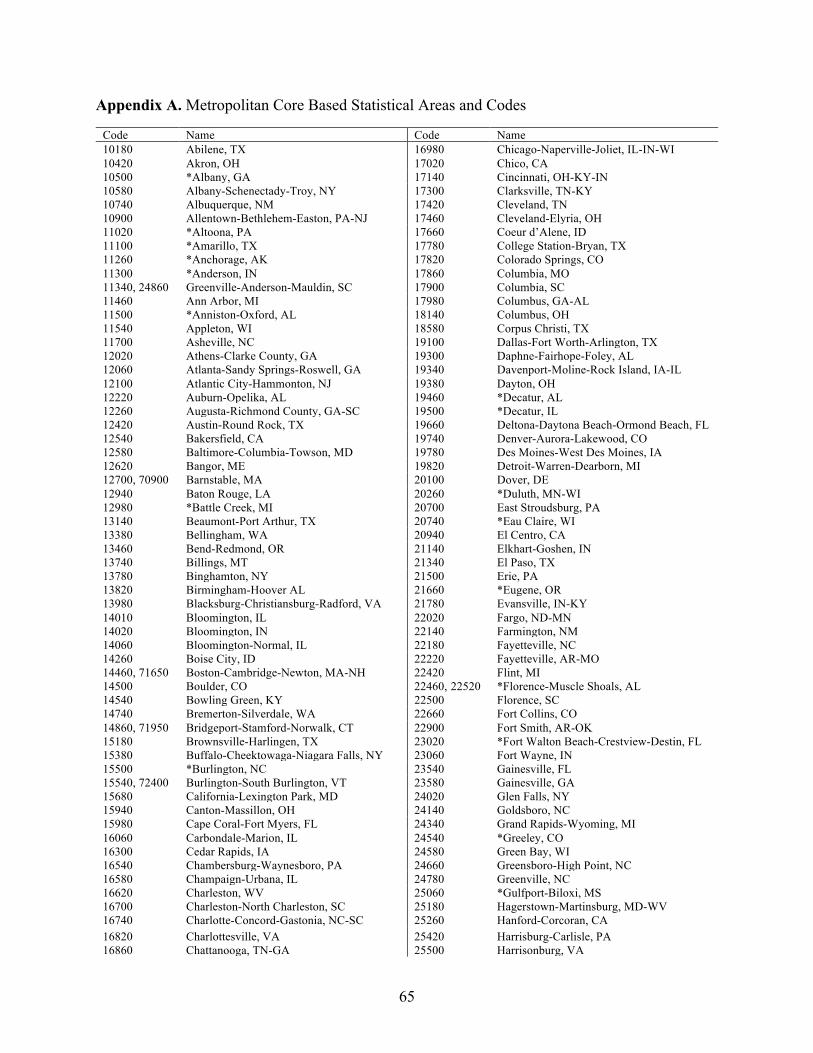
65
Appendix A. Metropolitan Core Based Statistical Areas and Codes
Code Name Code Name 10180 Abilene, TX 16980 Chicago-Naperville-Joliet, IL-IN-WI 10420 Akron, OH 17020 Chico, CA 10500 *Albany, GA 17140 Cincinnati, OH-KY-IN 10580 Albany-Schenectady-Troy, NY 17300 Clarksville, TN-KY 10740 Albuquerque, NM 17420 Cleveland, TN 10900 Allentown-Bethlehem-Easton, PA-NJ 17460 Cleveland-Elyria, OH 11020 *Altoona, PA 17660 Coeur d’Alene, ID 11100 *Amarillo, TX 17780 College Station-Bryan, TX 11260 *Anchorage, AK 17820 Colorado Springs, CO 11300 *Anderson, IN 17860 Columbia, MO 11340, 24860 Greenville-Anderson-Mauldin, SC 17900 Columbia, SC 11460 Ann Arbor, MI 17980 Columbus, GA-AL 11500 *Anniston-Oxford, AL 18140 Columbus, OH 11540 Appleton, WI 18580 Corpus Christi, TX 11700 Asheville, NC 19100 Dallas-Fort Worth-Arlington, TX 12020 Athens-Clarke County, GA 19300 Daphne-Fairhope-Foley, AL 12060 Atlanta-Sandy Springs-Roswell, GA 19340 Davenport-Moline-Rock Island, IA-IL 12100 Atlantic City-Hammonton, NJ 19380 Dayton, OH 12220 Auburn-Opelika, AL 19460 *Decatur, AL 12260 Augusta-Richmond County, GA-SC 19500 *Decatur, IL 12420 Austin-Round Rock, TX 19660 Deltona-Daytona Beach-Ormond Beach, FL 12540 Bakersfield, CA 19740 Denver-Aurora-Lakewood, CO 12580 Baltimore-Columbia-Towson, MD 19780 Des Moines-West Des Moines, IA 12620 Bangor, ME 19820 Detroit-Warren-Dearborn, MI 12700, 70900 Barnstable, MA 20100 Dover, DE 12940 Baton Rouge, LA 20260 *Duluth, MN-WI 12980 *Battle Creek, MI 20700 East Stroudsburg, PA 13140 Beaumont-Port Arthur, TX 20740 *Eau Claire, WI 13380 Bellingham, WA 20940 El Centro, CA 13460 Bend-Redmond, OR 21140 Elkhart-Goshen, IN 13740 Billings, MT 21340 El Paso, TX 13780 Binghamton, NY 21500 Erie, PA 13820 Birmingham-Hoover AL 21660 *Eugene, OR 13980 Blacksburg-Christiansburg-Radford, VA 21780 Evansville, IN-KY 14010 Bloomington, IL 22020 Fargo, ND-MN 14020 Bloomington, IN 22140 Farmington, NM 14060 Bloomington-Normal, IL 22180 Fayetteville, NC 14260 Boise City, ID 22220 Fayetteville, AR-MO 14460, 71650 Boston-Cambridge-Newton, MA-NH 22420 Flint, MI 14500 Boulder, CO 22460,22520 *Florence-Muscle Shoals, AL 14540 Bowling Green, KY 22500 Florence, SC 14740 Bremerton-Silverdale, WA 22660 Fort Collins, CO 14860, 71950 Bridgeport-Stamford-Norwalk, CT 22900 Fort Smith, AR-OK 15180 Brownsville-Harlingen, TX 23020 *Fort Walton Beach-Crestview-Destin, FL 15380 Buffalo-Cheektowaga-Niagara Falls, NY 23060 Fort Wayne, IN 15500 *Burlington, NC 23540 Gainesville, FL 15540, 72400 Burlington-South Burlington, VT 23580 Gainesville, GA 15680 California-Lexington Park, MD 24020 Glen Falls, NY 15940 Canton-Massillon, OH 24140 Goldsboro, NC 15980 Cape Coral-Fort Myers, FL 24340 Grand Rapids-Wyoming, MI 16060 Carbondale-Marion, IL 24540 *Greeley, CO 16300 Cedar Rapids, IA 24580 Green Bay, WI 16540 Chambersburg-Waynesboro, PA 24660 Greensboro-High Point, NC 16580 Champaign-Urbana, IL 24780 Greenville, NC 16620 Charleston, WV 25060 *Gulfport-Biloxi, MS 16700 Charleston-North Charleston, SC 25180 Hagerstown-Martinsburg, MD-WV 16740 Charlotte-Concord-Gastonia, NC-SC 25260 Hanford-Corcoran, CA 16820 Charlottesville, VA 25420 Harrisburg-Carlisle, PA 16860 Chattanooga, TN-GA 25500 Harrisonburg, VA

66
25540, 73450 Hartford-West Hartford-East Hartford, CT 33460 Minneapolis-St Paul-Bloomington, MN-WI 25860 Hickory-Morgantown-Lenoir, NC 33660 Mobile, AL 25940 Hilton Head Island-Bluffton-Beaufort, SC 33700 Modesto, CA 26100 *Holland-Grand Haven, MI 33740 Monroe, LA 26180 Urban Honolulu, HI 33780 Monroe, MI 26380 *Houma-Bayou Cane-Thibodaux, LA 33860 Montgomery, AL 26420 Houston-Baytown-Sugar Land, TX 34060 Morgantown, WV 26580 Huntington-Ashland, WV-KY-OH 34580 Mount Vernon-Anacortes, WA 26620 Huntsville, AL 34740 Muskegon-Norton Shores, MI 26820 Idaho Falls, ID 34820 Myrtle Beach-Conway, SC-NC 26900 Indianapolis, IN 34900 Napa, CA 26980 Iowa City, IA 34940 Naples-Immokalee-Marco Island, FL 27100 Jackson, MI 34980 Nashville-Davidson-Murfreesboro, TN 27140 Jackson, MS 35300, 75700 New Haven, CT 27260 Jacksonville, FL 35380 New Orleans-Metairie, LA 27340 Jacksonville, NC 35620 NY-Northern NJ-Long Island, NY-NJ-PA 27500 Janesville-Beloit, WI 35660 Niles-Benton Harbor, MI 27740 Johnson City, TN 35840 North-Port-Sarasota-Bradenton, FL 27780 Johnstown, PA 35980, 76450 Norwich-New London, CT-RI 27900 *Joplin, MO 36100 Ocala, FL 27980 Kahului-Wailuku-Lahaina, HI 36140 Ocean City, NJ 28020 Kalamazoo-Portage, MI 36260 Ogden-Clearfield, UT 28100 Kankakee-Bradley, IL 36420 Oklahoma City, OK 28140 Kansas City, MO-KS 36500 *Olympia, WA 28420 Kennewick-Richland, WA 36540 Omaha-Council Bluffs, NE-IA 28660 Killeen-Temple-Fort Hood, TX 36740 Orlando, FL 28700 Kingsport-Bristol, TN-VA 36780 Oshkosh-Neenah, WI 28740 *Kingston, NY 37100 Oxnard-Thousand Oaks-Ventura, CA 28940 Knoxville, TN 37340 Palm Bay-Melbourne-Titusville, FL 29100 *La Crosse, WI-MN 37460 Panama City, FL 29180 Lafayette, LA 37860 Pensacola-Ferry Pass-Brent, FL 29200 Lafayette-West Lafayette, IN 37900 Peoria, IL 29340 Lake Charles, LA 37980 Philadelphia-Camden-Wilmington, PA-NJ-DE 29460 Lakeland-Winter Haven, FL 38060 Phoenix-Mesa-Scottsdale, AZ 29540 Lancaster, PA 38220 Pine Bluff, AR 29620 Lansing-East Lansing, MI 38300 Pittsburgh, PA 29700 Laredo, TX 38860, 76750 Portland-South Portland, ME 29740 Las Cruces, NM 38900 Portland-Vancouver-Hillsboro, OR-WA 29820 Las Vegas-Paradise, NV 38940 Port St. Lucie-Fort Pierce, FL 29940 Lawrence, KS 39100 *Poughkeepsie-Newburgh-Middletown, NY 30020 *Lawton, OK 39140 Prescott, AZ 30340 Lewiston-Auburn, ME 39300, 77200 Providence-Warwick, RI-MA 30460 Lexington-Fayette, KY 39340 Provo-Orem, UT 30700 Lincoln, NE 39380 *Pueblo, CO 30780 Little Rock-North Little Rock, AR 39460 Punta Gorda, FL 30980 Longview, TX 39540 Racine, WI 31080, 31100 Los Angeles-Long Beach-Santa Ana, CA 39580 Raleigh -Cary, NC 31140 Louisville, KY-IN 39740 Reading, PA 31180 Lubbock, TX 39820 Redding, CA 31340 *Lynchburg, VA 39900 Reno-Sparks, NV 31420 Macon, GA 40060 Richmond, VA 31460 Madera, CA 40140 Riverside-San Bernardino-Ontario, CA 31540 Madison, WI 40220 Roanoke, VA 31700 Manchester-Nashua, NH 40380 Rochester, NY 32580 McAllen-Edinburg-Pharr, TX 40420 Rockford, IL 32780 *Medford, OR 40900 Sacramento--Arden-Arcade–Roseville, CA 32820 Memphis, TN-MS-AR 40980 Saginaw-Saginaw Township North, MI 32900 *Merced, CA 41060 *St. Cloud, MN 33100 Miami-FortLauderdale-WestPalmBeach, FL 41100 St. George, UT 33140 Michigan City-La Porte, IN 41180 St. Louis, MO-IL 33260, 36220 Odessa, TX and Midland, TX 41420 Salem, OR 33340 Milwaukee-Waukesha-West Allis, WI 41500 Salinas, CA

67
41540 Salisbury, MD 46140 Tulsa, OK 41620 Salt Lake City, UT 46220 *Tuscaloosa, AL 41700 San Antonio, TX 46340 Tyler, TX 41740 San Diego-Carlsbad-San Marcos, CA 46540 Utica-Rome, NY 41860 San Francisco -Oakland -Fremont, CA 46660 *Valdosta, GA 41940 San Jose-Sunnyvale-Santa Clara, CA 46700 Vallejo-Fairfield, CA 42020 San Luis Obispo-Paso Robles, CA 46940 Vero Beach, FL 42060 Santa Maria-Santa Barbara, CA 47020 *Victoria, TX 42100 Santa Cruz-Watsonville, CA 47220 Vineland-Bridgeton , NJ 42140 Santa Fe, NM 47260 VA Beach-Norfolk-Newport News, VA-NC 42220 Santa Rosa-Petaluma, CA 47300 Visalia-Porterville, CA 42260 Sarasota-Bradenton-Venice, FL 47380 Waco, TX 42340 Savannah, GA 47580 Warner Robins, GA 42540 Scranton--Wilkes-Barre, PA 47900 Washington-Arlington, DC-VA-MD-WV 42660 Seattle-Tacoma-Bellevue, WA 47940 Waterloo-Cedar Falls, IA 43300 Sherman-Dennison, TX 48060 *Watertown-Fort Drum, NY 43340 *Shreveport-Bossier City, LA 48140 Wausau, WI 43620 *Sioux Falls, SD 48540 *Wheeling, WV-OH 43780 South Bend-Mishawaka, IN-MI 48620 Wichita, KS 43900 Spartanburg, SC 48660 Wichita Falls, TX 44060 Spokane-Spokane Valley, WA 48700 Williamsport, PA 44100 Springfield, IL 49020 Winchester, VA-WV 44140 Springfield, MA-CT 49180 Winston-Salem, NC 44180 Springfield, MO 49340 Worcester, MA-CT 44220 Springfield, OH 49420 *Yakima, WA 44700 Stockton-Lodi, CA 49620 York-Hanover, PA 45060 Syracuse, NY 49660 *Youngstown-Warren-Boardman, OH-PA 45220 Tallahassee, FL 49740 Yuma, AZ 45300 Tampa-St. Petersburg-Clearwater, FL 72850 Danbury, CT 45460 Terre Haute, IN 74500 *Leominster-Fitchburg-Gardner, MA 45780 Toledo, OH 75550 *New Bedford, MA 45820 Topeka, KS 77350 Rochester-Dover, NH-ME 45940 Trenton, NJ 78700 Waterbury, CT 46060 Tucson, AZ Notes: The asterisk (*) means that Uber or Lyft was not serving the metropolitan area before the end of 2017, or that the code was no longer in use for that metropolitan area when Uber or Lyft started service. Some areas have multiple codes because the CPS changed their code definitions during the period examined (2005-2017).
Top Related