


Languages
Pages
Legal

THE DETERMINANTS OF LIGHT DIESEL PRICES IN KENYA
By
PATRICK KIBURI KILEMI
\ research paper submitted to (he School of Kconomics in partial fulfillment or Ihc requirem ents
>f the aw ard of a M asters of Arts Degree in economics of the University of Nairobi
j •an**'s*'*”
m m
November, 2008

D ECLA RA TIO N
This research paper is my original work and has not been presented for any degree award in any other
Diversity.
igned........ e ............. Date
KILEMI PATRICK KIBURI
Ihis research paper has been presented for examination with our approval as university supervisors
Dr Nelson H.W. Wawirc
Signed
Prof. Peter Kimuyu

DEDICATION
To my wife Dr Lydia Nkirotc and my children Mutuma and Nkatlia.
in

ACKNOWLEDGMENTS
1 wish lo thank the University o f Nairobi. School o f Economics for the opportunity to pursue a
master's degree in economics. Many thanks to the staff and the administration for the support and
enabling environment accorded to pursue this degree.
Special thanks to my supervisors Dr Nelson N.W. Wawirc and Prof. Peter Kimuyu to whom I am truly
indebted. Your guidance in developing the research problem and support with reading references is
appreciated. Your patience with my limitations and encouragement lo pursue grey area o f research is
graciously acknowledged. Your generosity with academic knowledge is truly evident in the quality of
this research paper. Thank you.
I To Dr Sichei, for getting out o f his way many times to bail me out on econometric modeling and
supporting my study with many resourceful materials. To Jane Kibiru, my classmate for mastering
e-views early and generously sharing the knowledge with me. To my other classmates, you were of
great academic support, importantly, you were friends, and we were like a family. In particular. Grace.
Helen, kirgit Kittony, Tich. Lomuto. Kibe. Korir. Kinoti. Magati. Beth. Owango, Steve and Eunice,
thank you for your support. Team work made obviously very' challenging tasks look simple and fun to
solve.
lo my family for supporting me through out the course period and understanding the many days I
spent away and missed many family occasions. I truly hope that you will later find this effort
worthwhile.
Phe author takes full responsibility for any errors, omissions or misrepresentations in this paper.
iv

TABLE OF CONTENTS
... .......................................................................................................................................................................1
Declaration................................................................................................................................................... “
Dedication....................................................................................................................................................
Acknowledgements..................................................................................................................................... iv
Table of contents..........................................................................................................................................v
List o f tables.................................................................................................................................................vii
List o f figures...............................................................................................................................................viii
Operational definition o f terms.................................................................................................................. ix
List o f abbreviations und acronyms............................................................................................................x
Abstract......................................................................................................................................................... xi
CHAPTER ONE: INTRODUCTION........................................................................................................ I
1.1 Background o f the study................................................................................................................ I
1.1.1 Overview o f the global oil industry.............................................................................................. I
1.1.2 The Kenya petroleum market and industry structure................................................................ 4
1.1.3 Petroleum storage and infrastructure in Kenya..........................................................................10
1.2 Statement o f the problem...............................................................................................................15
1.3 Study objectives..............................................................................................................................18
1.4 Justification and significance o f study......................................................................................... 19
1.5 The scope and organi7ation o f the study..................................................................................... 21
CHAPTER TWO: LI TERATURE REVIEW
2.1 Introduction........................................................................................................................................22
2 2 Theoretical literature review............................................................................................................22
2.3 Empirical literature review.............................................................................................................27
2.4 Overview o f literature..................................................................................................................... 40
CHAPTER THREE: METHODOLOGY
3-1 Introduction........................................................................................................................................ 41
3-2 The Econometric model................................................................................................................... 41
v
.42
..44
.45
.45
.46
47
47
47
CHAPTER FOUR: EMPIRICAL FINDINGS
4.1 Introduction..................................................................................................................................... 48
4.2 Trends in the variables................................................................................................................... 48
4.3 Descriptive statistics.......................................................................................................................50
4.4 Correlation matrix.......................................................................................................................... 51
4.5 Time series properties................................................................................................................... 52
4.6 Diagnostic tests.............................................................................................................................. 54
4.7 Regression results, interpretation and discussion......................................................................56
CHAPTER FIVE: SUMMARY. CONCLUSIONS AND POLICY IMPLICATIONS
5.1 Summary.....................................................................................................................615.2 Conclusions......................................................................................................................................62
5.3 Policy implications..........................................................................................................................62
5.4 Limitations oi' the study................................................................................................................. 65
REFERENCES.....................................................................................................................66
APPENDICES........................................................................................................................................... 68
3 3 Model specification......................................
3 4 Definition anJ measurements o f variables.
3.5 Estimation techniques..................................
3.5.1 Unit root test.................................................
3.5.2 Cointegration analysis................................
3 .5.3 Diagnostic tests............................................
3.6 Data type and sources...................................
3.7 Data analysis.................................................
LIST OF TABLES
Tabic 1.1 Automotive diesel use in Kenya per sector in 2006................................................................ 7
Table I .2 Ownership o f storage depots and loading facilities in Kenya................................................12
Table 1.3 Ownership and distribution o f retail outlets............................................................................. 14
Table 4.1 Descriptive statistics...................................................................................................50
Table 42 Correlation matrix......................................................................................................................... 52
Tabic 4.3 Unit root test results..................................................................................................................... 53
Tabic 4.4 Diagnostic test results..................................................................................................................54
Table 4.5 Fm>r correction model results....................................................................................................56
Table A 1 Data used for the analysis...........................................................................................................68
Table A 2 Market shares 2006..................................................................................................................... 69
Table A 3 Sample price build up ex Mombasa.......................................................................................... 70
Table A 4 Sample price build up basis plaits..............................................................................................71
Table A 5 Unit root test for the ccm............................................................................................................74
Table A 6 Cointegration regression results.................................................................................................74
VII
LIST OF FIGURES
I Fig 1.1 Trend o f world crude oil prices from 1947-2007...........................................................................3
Fig 1.2 Market shares in Kenya in pre price deregulation period in 1995..................................................8
Fig 1.3 Market shares in Kenya in post deregulation period in 2006.........................................................9
Fig 1.4 Petroleum supply structure in Kenya................................................................................................ 10
Fig 41 Trends o f crude oil. Pump prices o f diesel, exchange rates and tax.............................................48
Fig 4.2 Cusum at 5 percent significance........................................................................................................55
Fig A I Tax at levels........................................................................................................................................ 72
Fig A 2 Tax at first difference.........................................................................................................................72
I Fig A 3 Retail price at levels..........................................................................................................................72
I Fig A 4 Retail price at first difference.......................................................................................................... 72
Fig A 5 Crude price at levels..........................................................................................................................73
Fig A 6 Crude oil prices at first dif ference.................................................................................................... 73
Fig A 7 Exchange rates at levels......................................................................................................................73
Fig A 8 Exchange rates at first difference......................................................................................................73
Fig A 9 Normality test o f the F.CM................................................................................................................ 75
VIII
OPERATIONAL DEHNATION OF TERMS
Barrel:
Biomass fu e l
Black Products:
Economic Profits:
Super normal profits:
Competitive market:
PucI cycle:
Hospitality':
Refers to a measure o f quantities o f crude oil traded between countries
and constitutes o f 159 litres o f crude oil or refined fuel and 91 kg of
gas.
Refers to organic traditional sources o f energy mostly firewood and
charcoal.
Refers to by products o f the refinery process and includes products like
fuel oil. industrial diesel and lubricants.
Refers to super normal profits enjoyed by oligopolistic and
monopolists in a restricted market.
Also called economic rent or abnormal profits or excess profits charged
above the opportunity cost of labour and capital in an oligopolistic or
monopolistic market.
A market place with many buyers and sellers with free entry and
free movement o f goods and services.
Refers to total petroleum products development cycle that includes
exploration, identification and assessment, production or extraction,
separation or improvement, conversion, transformation and refinement.
Storage, transportation, distribution and use.
Refers to an arrangement between oil marketers who have loading
facilities to allow small oil marketers to use their facility at a charge.
Independent oil companies Refers to oil marketing companies with less than five percent
market share, independent o f the multinational influence w ith mostly
domestic shareholding.
Jatroplta: Refers to a plant known to produce biofuel.
Majors: Oil marketing companies with more than five percent market share.
White products: Refers to diesel, kelrol. kerosene & aviation gas. products derived from
crude oil through the refinery process.
70:30 rule : A energy requirement that all the oil marketers at least process 30
percent of their share at the Mombasa refinery.
E-10: Refers to ethanol-gasoline blend with a 10 percent ethanol for every litre
of gasoline.
Herfindahl• Hirshm an Index (Hill) measures the level of concentration in an industry ami is generated
from the summation of squares of market shares for all the firms participating in
that industry.
x
ABBREVIATIONS AND ACRONYMS
AGO: Automotive gas. oil/ Automotive dicscl/Light diesel
ADB: Africa development bank.
COMPS A: Common markets for Fust and Southern Africa
ECM: Error correction model
FOB: Free on board
IE A: International energy agency
IMC: Industry managed cost
KOI Kipevu oil terminal
KOSF: Kipevu oil storage facility
KPRL: Kenya petroleum refinery limited
KPC: Kenya pipeline company limited
I.PO: Liquidified petroleum gas
MOE: Ministry of Energy
MJT: Mombasa joint depot
NOCK: National oil corporation o f Kenya
NJI): Nairobi joint depot
SF.K: Swendish Kroner
PDF: Petroleum development levy
PLATTS: A global provider o f energy information who tracks daily crude oil cost
movements and gives monthly averages for use as base costs in pricing.
XI
ABSTRACT
Ihis study was motivated by the important role diesel energy plays in the modem economy and the
persistent increase in pump prices over the past decade. Automotive diesel is a quintessential
commodity in the modem economy playing a critical role as input product in transport and many other
productive processes and therefore a causal factor lor economic growth. Increases in the price of
automotive diesel poses inflationary pressure to the economy whose effects to the productive segments
o f the economy is negative. Frequents draughts, lack o f alternative sources o f energy in Kenya.
constrained foreign exchange earnings and the oligopolistic nature o f petroleum market have made
petroleum prices a stable topic in every day discussions. Diesel continues to be a major source of
commercial energy in Kenya given the lack of potential economically viable substitutes with no
known crude oil reserves and the high costs involved in exploration, extraction and refinery.
This study sought to answer the important questions o f what actually determines the pump price of
diesel and how this pump prices reacts to changes in primary input components o f crude oil, foreign
exchange and taxes The study used an error correction model in analyzing changes in diesel pump
prices given dynumism in the input components and the ensuing price making mechanism. The study-
established a strong relationship between cost o f inputs and pump prices o f diesel and a strong price
adjustment process as measured by the error correction term. These findings are important because
they lay bare the specific vulnerability the country faces in terms o f dependence on imported crude oil
and the market inefficiencies which don’t encourage price competitions and therefore, the findings
forms a strong foundation for the development of appropriate policies in management and regulation
° l petroleum pricing in the country.
XII
CHAPTER ONE
INTRODUCTION
j j Background to the study
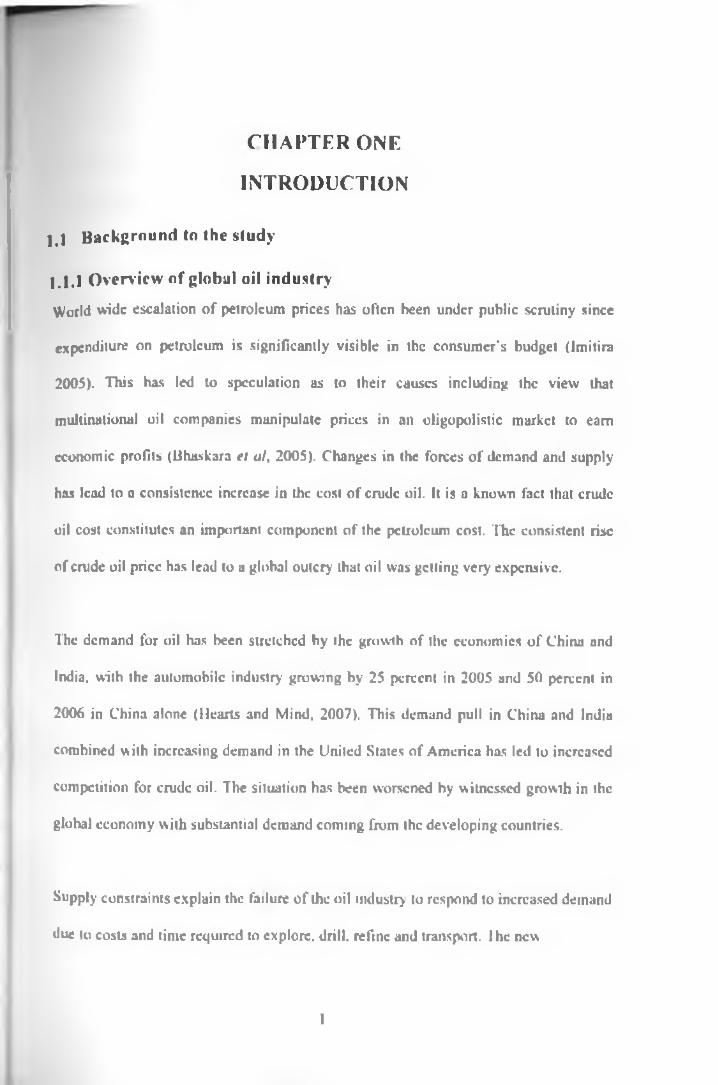
1,1,1 Overview of global oil industry
World wide escalation o f petroleum prices has often been under public scrutiny since
expenditure on petroleum is significantly visible in the consumer’s budget (Imitira
2005). This has led to speculation as to their causes including the view that
multinational oil companies manipulate prices in an oligopolistic market to earn
economic profits (Bhaskara el ul, 2005). Changes in the forces o f demand and supply
has lead to a consistence increase in the cost o f crude oil. It is a known fact that crude
oil cost constitutes an important component o f the petroleum cost. The consistent rise
of crude oil price has lead to u global outcry that oil was getting very expensive.
The demand for oil has been stretched by the growth o f the economics o f China and
India, with the automobile industry growing by 25 percent in 2005 and 50 percent in
2006 in China alone (Hearts and Mind, 2007). This demand pull in China and India
combined w ith increasing demand in the United States o f America has led to increased
competition for crude oil. The situation has been worsened by witnessed growth in the
global economy with substantial demand coming from the developing countries.
Supply constraints explain the failure o f the oil industry to respond to increased demand
due to costs and time required to explore, drill, refine and transport. Ihe new
1

environmental requirements have made it almost impossible to put up a new refinery
(Hearts and Mind. 2007)
Global political instability has contributed to geopolitical tensions which have resulted
in global production disruptions with big effects to the cost o f a barrel. The Iraq
invasion, the Nigerian abductions, the Venezuelan stand off and the Iran nuclear
ambitions arc recent indicators of how unstable the global market (Hearts and mind.
2007).
2
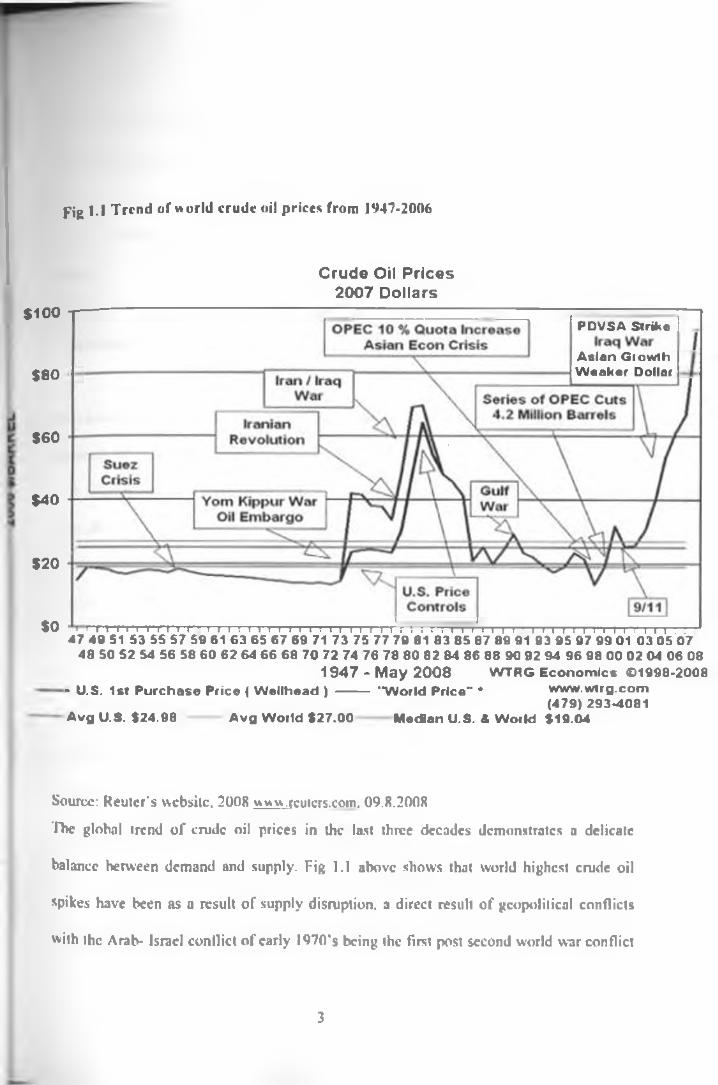
pig i . l Trend of world crude oil prices from 1947-2006
C r u d e Oil P r i c e s 2 0 0 7 D o lla rs
$100 T -
$8 0
PDVSA Strike
Asian Growth Weaker Dollar
$6 0
$4 0
$20
$0 rTTTTTTTTTTTTTTTTTTTTTTTrTTTTTTTTTTTTTTTTTTTTrrTTTTi I TTT . .47 49 51 53 55 57 59 61 63 65 67 69 71 73 75 77 79 81 83 85 87 89 91 93 95 97 99 01 03 05 07
48 50 52 54 56 58 60 62 64 66 68 70 72 74 76 78 80 82 8-1 86 88 90 92 94 96 98 00 02 04 06 081 9 4 7 - M a y 2 0 0 8 W TR G Econom ics ©1998-2008
- U.S. 1st Purchase Price ( Wellhead ) --------- "W orld Price" * www.wtrg.com(479) 293-4081
A vg U.S. $24.98 A vg World $27.00 Median U.S. & World $19.04
Source: Reuier's website, 2008 www.rcutcrs.com. 09.8.2008
The global trend o f crude oil prices in the last three decades demonstrates a delicate
balance between demand and supply. Fig l . l above shows that world highest crude oil
spikes have been as a result o f supply disruption, a direct result o f geopolitical conflicts
with the Arab- Israel conflict o f early I97ft’s being the First post second world war conflict
3
to greatly affect the global crude oil supplies. The Iranian revolution of 1979 and the Iraq-
Iraq war o f 1 1 show record new crude oil price highs o f 65 dollars per barrel. The Gulf
wur o f the early 1990’s, the Asian financial crisis and the September 11 incident in the
United States started the current price rally that has seen the world procure a barrel at 150
dollars in May 2008. a record by any measure. From the graph above, it can be appreciated
that the global price o f crude oil has over time increased unabated and that geopolitics lias
contributed to the biggest spikes recorded so far.
Price liberalization in many African countries was faced with similar problems. Consumers
generally perceived higher prices as detrimental to their interest and hence higher prices
with liberalization faced public resistance. This was worse in countries with high inflation
rates. In addition, lack o f competitive environment and deregulation meant benefiting a few
od companies rather than the consumers. (Karekezi. el al 1996). Little (1993) hypothesized
that petroleum end use prices would go down in a competitive market environment free of
exogenous factors as long as a country was not going through an inflationary period.
1.1.2 The Kenya petroleum market and industry structure
Petroleum in Kenya is a major source o f commercial energy and has over the years
accounted for over 80 percent o f the country commercial energy requirements (Mccheo el
al. 2003). The Transport, Manufacturing, Agriculture and the Power generation sectors are
all dependent on petroleum products. Senga el al (1980), while reviewing the trends in
Kenya for petroleum consumption established that the Transport industry consumes 70
percent of the petroleum products used in the country This trend has been maintained w ith
L4
the transport sector being the dominant consumer o f petroleum products. Petroleum
products are the most important source o f commercial energy in Sub Saharan Africa
accounting for 72 percent as o f 1990 requirements with coal electricity and gas meeting the
rest o f the demand (Schloss. 1992).
The overall petroleum policy o f the government o f Kenya is to ensure a secure, reliable and
least cost supply o f petroleum products to the domestic economy. Consistent with this
policy and in tandem with other reforms in other sectors o f the economy, the petroleum
industry was liberalized in 1994 allowing marketers to determine distribution and their
pricing strategies. The government partially retained control o f the supply side by operating
an open tender system ran by the Ministry o f Energy where every month, all licensed oil
marketers submit bids for the supply o f the industry for the incoming month. It has also set
in the 70-10 rule where all marketers arc supposed to process at least 70 percent o f there
requirements through the Mombasa refinery to support the local liquidificd petroleum
gas(LPCi) market and sustain the Refinery which was considered inefficient hut important
to the Mombasa economy (Indetie, 2002).
Deregulation was aimed at enhancing operational efficiencies and offer better prices to the
market by introducing competitiveness in the oil marketing. The elimination o f the market
distortions attracted new investments in the petroleum marketing with independents
invading and disturbing the long held status quo o f dominance by multi nationals. Nyoike
and Okech. (1996) noted that the post deregulation period was characterized by significant
price increases which the marketers blamed on higher offshore costs, depreciation in
5
exchange rates and inflation, yet they were slow' in reducing the prices when the world
crude oil price declined.
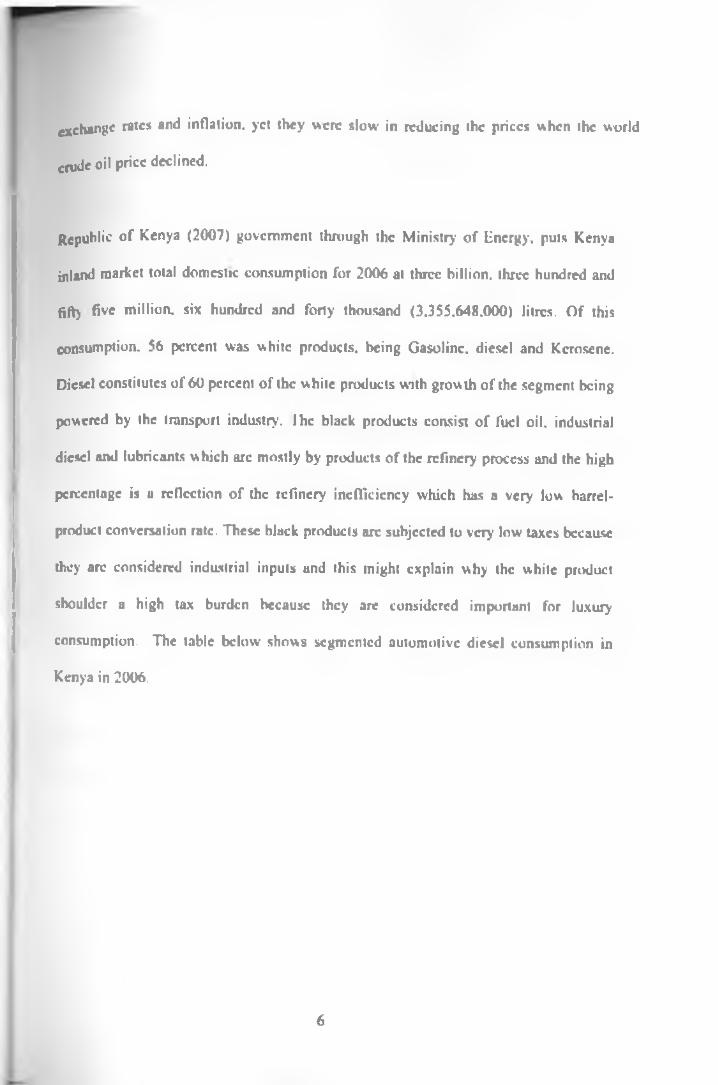
Republic o f Kenya (2007) government through the Ministry o f Energy, puts Kenya
inland market total domestic consumption for 2006 at three billion, three hundred and
fifty five million, six hundred and forty thousand (3.355.648.000) litres. O f this
consumption. 56 percent was white products, being Gasoline, diesel and Kerosene.
Diesel constitutes o f 60 percent of the white products with grow th of the segment being
powered by the transport industry. I he black products consist o f fuel oil. industrial
diesel and lubricants which are mostly by products o f the refinery process and the high
percentage is a reflection o f the refinery inefficiency which has a very low barrel-
product conversation rate. These black products urc subjected to very low taxes because
they arc considered industrial inputs and this might explain why the white product
shoulder a high tax burden because they are considered important for luxury
consumption. The table below shows segmented automotive diesel consumption in
Kenya in 2006.
6
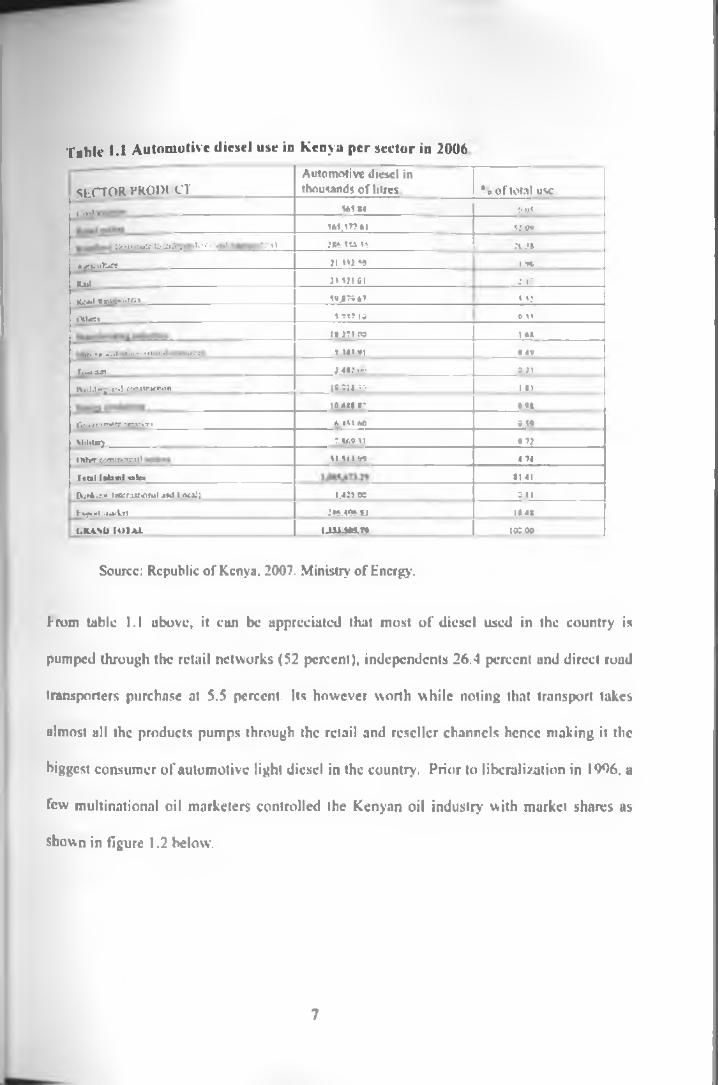
Table 1.1 Automotive diesel use in Kenya per sector in 2006
S E C T O R P R O D U C T
A u t o m o t i v e d i e s e l i n
t h o u s a n d s o f l i l i e s . % o f t o t a l u s e
O w l — 5 6 1 X 4 6 0 5
5 6 5 .1 7 7 61 5 2 0 9
D u i r i l o t t K » u > * ? w l < i ' - - »»> n i f c a . i
A a u u k u r e
3X 6 1 5 6 16
3 1 J 1 I 16
___________ 2 4 3 1
1 %
K u l 3 1 .5 3 1 01 3 .1 7
K o » l « i u h *» i Io > 5 V ,I? V 6 T 1 53
O l h e n 5 ,6 1 7 16 4 51
1 1 .3 7 1 0 6 1 6X
0 4 1 * 1 6 4V
T n g y n ; . 4 « ; 0 6 0 3 J ____
l i i i l i l x g . n I « i M i r « n . i n | « . « l t > 6 1 >1
1 0 .6 4 * *T M X
G n t f P U M n i j < r v c r » 6 4 5 1 6 0 6 5«
X l i l l p Q 7 l / i 9 *1 0 7 }
o t h e r c i r o m r i c u l S U M 9 9 4 74
r i a l l * b m l u l n X I 41
f r j f i i : . I lC e n u l iO M l 1M ] l fX » ! | 1 .4 3 5 .0 6 6 1 1
F t# * * ! i m i U i J 4 6 .4 W .X J 1 1 4 1
C m X B T O U L ____________________________________________ U M J W . 1 I ______________________________ 1 0 6 .0 0 ____________________
Source: Republic of Kenya. 2007. Ministry of Energy.
f rom table 1.1 above, it cun be appreciated that most o f diesel used in the country is
pumped through the retail networks (52 percent), independents 26.4 percent und direct road
transporters purchase at 5.5 percent. Its however worth while noting that transport takes
almost all the products pumps through the retail and reseller channels hence making it the
biggest consumer o f automotive light diesel in the country. Prior to liberalization in 1906. a
few multinational oil marketers controlled the Kenyan oil industry with market shares as
shown in figure 1.2 below.
7
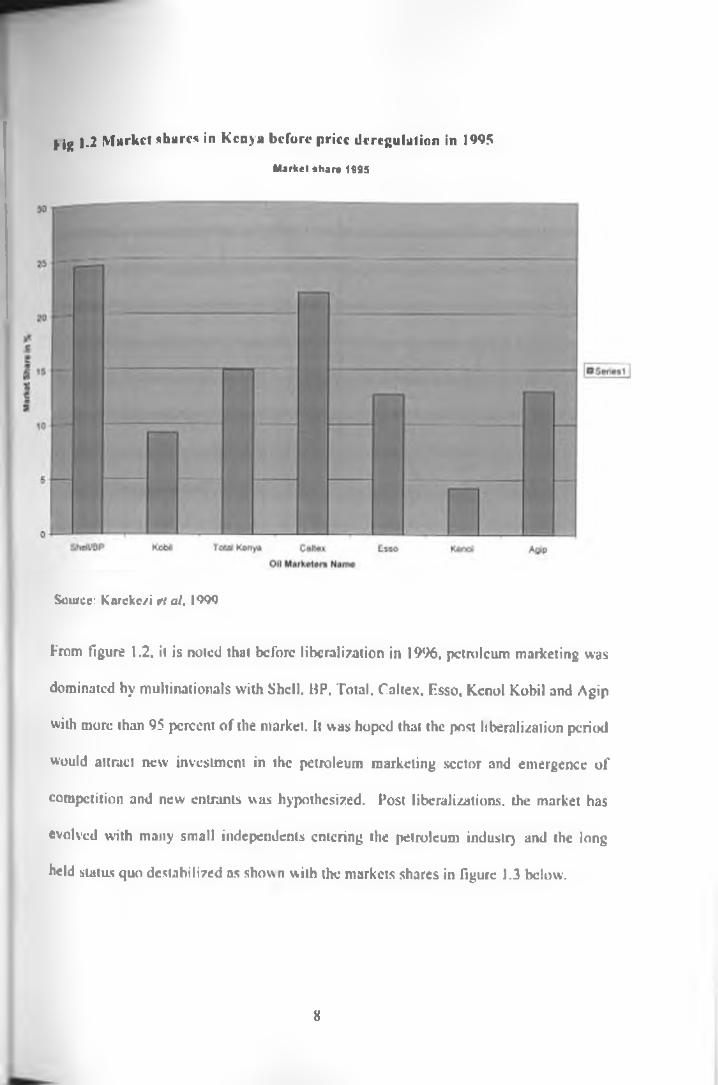
f iR |.2 M arket shares in Kenya before price d r regulation in 1995
Market share 1995
Source: Kareke/i trl ul. 1999
From figure 1.2. it is noted that before liberalization in 1996, petroleum marketing was
dominated by multinationals with Shell. BP. Total. Caltex. Esso. Kcnol Kobil and Agip
with more than 95 percent of the market. It was hoped that the post liberalization period
would attract new investment in the petroleum marketing sector and emergence o f
competition and new entrants was hypothesized. Post liberalizations, the market has
evolved with many small independents entering the petroleum industry and the long
held status quo destabilized ns shown with the markets shares in figure 1.3 below.
8
Market Share 2006
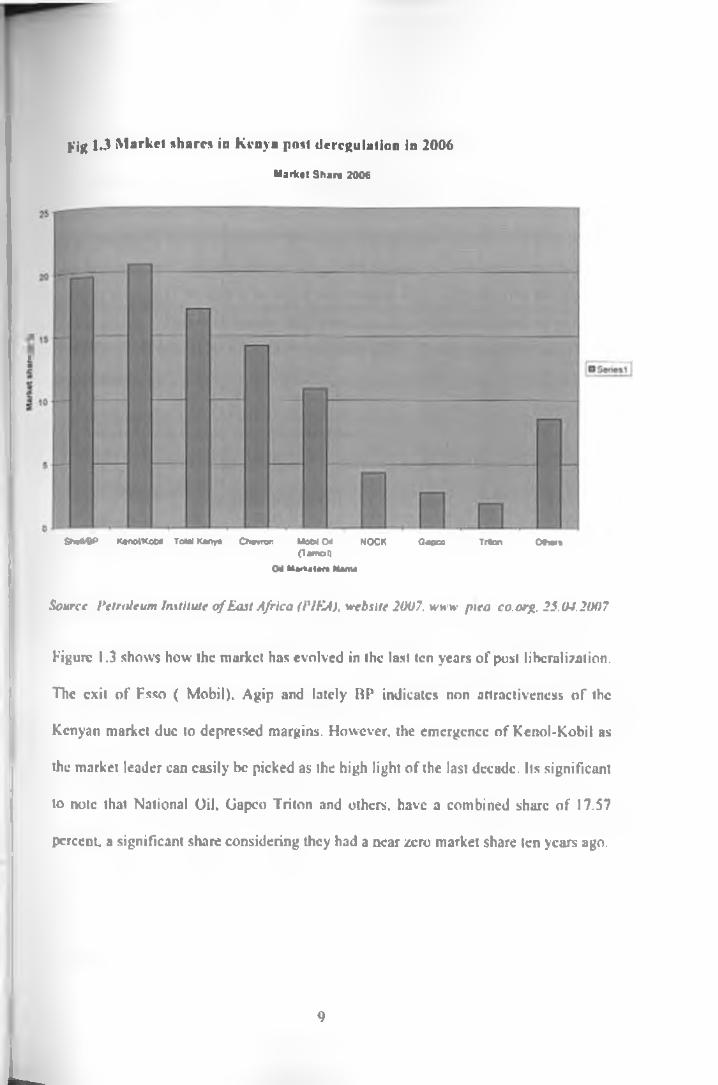
pig 1J Market shares in Kenya post deregulation in 2006
Sns*W> KanofttoM T a t* * * * * Oemjn MoWO* NOCK Oapco Trton O r » »(tainot)
ON H iitn im Mama
Source Petroleum Institute o f East Africa (I'lKA), website 2007. www piea co.org. 25.04.2007
Figure 1.3 shows how the market has evolved in the last ten years o f post liberalization.
The exit o f Fsso ( Mobil). Agip and lately Bl' indicates non attractiveness o f the
Kenyan market due to depressed margins. However, the emergence o f Kenol-Kobil as
the market leader can easily be picked as the high light o f the last decade. Its significant
to note that National Oil, Gapco Triton and others, have a combined share of 17.57
percent, a significant share considering they had a near zero market share ten years ago.
L
9
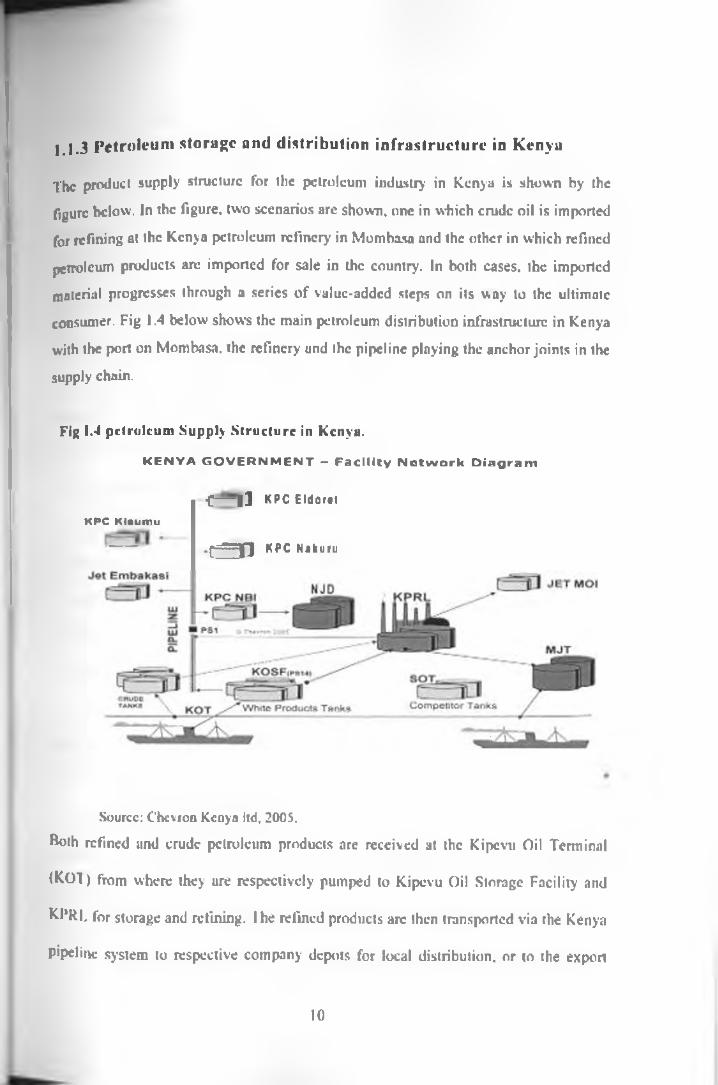
The product supply structure for the petroleum industry in Kenya is shown by the
figure below. In the figure, two scenarios are shown, one in which crude oil is imported
for refining at the Kenyu petroleum refinery in Mombasa and the other in which refined
petroleum products are imported for sale in the country. In both cases, the imported
material progresses through a series o f value-added steps on its way to the ultimate
consumer. Fig 1.4 below shows the main petroleum distribution infrastructure in Kenya
with the port on Mombasa, the refinery and the pipeline playing the anchor joints in the
supply chain.
1.1.3 Petroleum storage and distribution infrastructure in Kenya
Fig 1.4 petroleum Supply S tructure in Kenya.
K E N Y A G O V E R N M E N T - F a c i l i t y N e t w o r k D i a g r a m
•c— |J KPC EldoretKPC Klsumu
• e n KPC Nakuru
Source: Chevron Kenya ltd, 2005.
Both refined and crude petroleum products are received at the Kipcvu Oil Terminal
(KOI ) from where they are respectively pumped to Kipcvu Oil Storage Facility and
^1‘RL for storage and refining. I he refined products arc then transported via the Kenya
pipeline system to respective company depots for local distribution, or to the export
10
market through the Kenya Pipeline managed storage depots in Kisumu, Lldoret and
Nakuru. The Kenya Pipeline Company (KPC). a wholly Government owned company,
manages a 14 inch 450 KM pipeline from Mombasa to Nairobi. The company also
manages another 446 KM long pipeline comprising an 8-inch Nairobi to Kisumu
jegment and a 6-inch Nakuru-FIdoret branch (PIF.A 2006). The pipeline tariffs for all
products except jet fuel in Nairobi and Mombasa international airports arc Ksh.I.53/MJ
to Nairobi, 2.105/M1 to Nakuru, 2.706/M3 to Lldoret and 2.703/M’ in Kisumu. From
the storage depots, petroleum products are then transported by road tankers to bulk
consumers, domestic retail stations and export destinations. Plans arc however
underway to extend the oil pipeline from Lldoret to Kampala in order to serve the
export market more efficiently (KPC, 2007)
Crude oil and refined petroleum products arc mainly imported from Middle Fast
through a monthly-centralized tender system organized by the oil industry- but
coordinated by the Ministry o f Fnergy. Despite entry o f new petroleum traders after
liberalization, their participation in the tender process has been very- low due to
prohibitive costs. To deliver an economic crude oil cargo o f about 80,000 Metric Tones
at the prevailing international crude oil price of about I !S$ 100 per barrel would require
about USS75 Million. New entrants in the industry who are mainly small are unable to
raise this kind o f money and offer any meaningful competition in cnide oil supply. I his
business segment has therefore remained with the well-entrenched firms. As a result, of
the 32 crude oil lenders awarded in the period 2004/2005. 19 (59.4 percent) were won
by Kobil, 6 (18.8 percent) by Shell. 4 (12.5 percent) by Total. 2 (6.3 percent) by Caltex
II
mid I (3.1 percent) by Triton. Similarly, over the period 2002-2005. large oil companies
accounted for about 82 percent o f total refined products cargo deliveries while the
combined independent operators account for only about 18 percent. In 2006 and 2007.
there have been changes with the entry o f some high worth players namely Triton.
Addax and Gulf Energy.
Kenya's downstream oil distribution infrastructure mainly comprises storage depots,
loading facilities, transportation trucks and retail dispensing stations. Asset ownership
in this market segment is also heavily skewed in favour o f the large operators as shown
by table 1 .2 below.
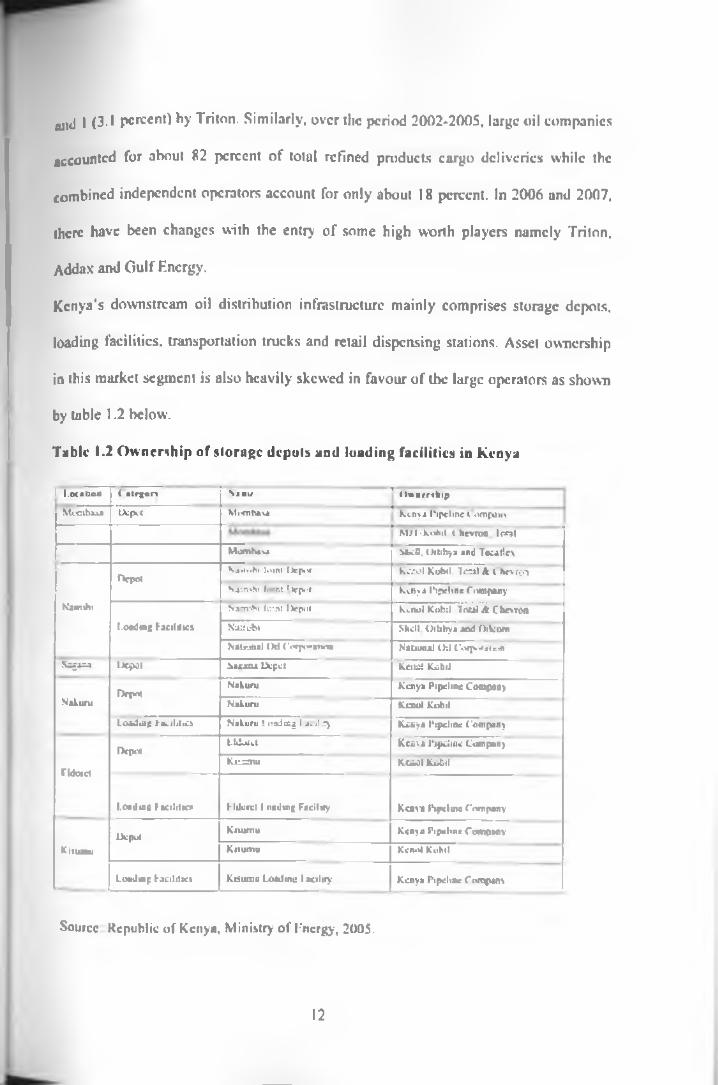
Table 1.2 Ownership of storage depots and loading facilities in Kenya
1 1.M i l i e u ( » i f n o n N » r „ ( l u n a r . t u p
M o m b a s a D e p o t M o e n h a e a K e n y a I N p c lm e C o m p a n y
M J T - K o b i l . < 'h e v r o n . T o o l
M o m h u a S b e U . O i h b y a a n d T e ta f l e x
D e p o tS a i t o h i J o in t D e p o t K c ik <I K o b i l , T o o l A C h o r e a l
N js n s h i h u n t D e p o t K e n y a 1’i p e l in e C iw n p a n y
M a in ih i S d i r o h i J o in t D e p o t K c n o l K o Im I, T o u l A C h e v r o n
t .o o d i o g f a c i l i t i e s N i m o M S h e l l . O l h h y a a n d O i lc o m
N a t io n a l O U C c a p o e a u c o N a t i o n a l O i l C o r p o r a t io n
N i g j a a D e p o t b i c a c u D e p o t K c ilO t K o b i l
O f p n tN a k u n i K e n y a P ip e l in e C o m p a n y
N i l u n i N a k u r u K c n o l K o b i l
L o i d m e f u t i l i t i e s N a k u n i L o a d in g 1 a . i l u y K e n y a P ip e l in e C o m p a n y
O c p r ti i M o K t K e n s * P ip e l in e C o m p a n y
r w e dR is u tn u K c n o l K o b i l
1.c o d m e fa c i li t ie s * f 'ld c a c l 1 o a i l m f F a c i l i t y K e n y a P ip e l in e C .■ an p an y
D c p .i lK m i n t u K e n y a P ip e l in e C o m p a n y
K i tu i m i K t t u m u K c n o l K o h i!
L o n d ia j : f a c i l i t i e s K i i u m u L o a d m u 1 a a l i t y K e n y a P ip e l in e C m r j v m s—Source Republic of Kenya, Ministry of Energy, 2005.
12
It is apparent fn»n table 1.2 above that the major oil companies and the Government
through the KPC and the National Oil Corporation (NOCK) predominantly control the
entire network of storage depots and loading facilities. Ownership, geographical
distribution and access to these facilities arc considered a critical bottleneck to entry
and effective competition in Kenya's petroleum industry. In Western Kenya,where
KPC manages efficient common-user loading facilities, competition at the retail level
has been vibrant and market share profiles have substantially changed over the last four
years (Imitira (2005). This is because the loading facilities have leveled the playing
field by allowing all the firms easy access to their products at standardized charges.
However, Nairobi and Mombasa markets, which respectively comprise about 60
percent and 20 percent o f the entire petroleum market in Kenya, are still rigid due to
inadequacy or absence o f efficient loading arms. On the other hand, ownership of the
retail network in the country has over time since liberalization evened out with the
major oil companies and new entrants splitting the ownership on an almost 50:50 basis
as shown below;
13
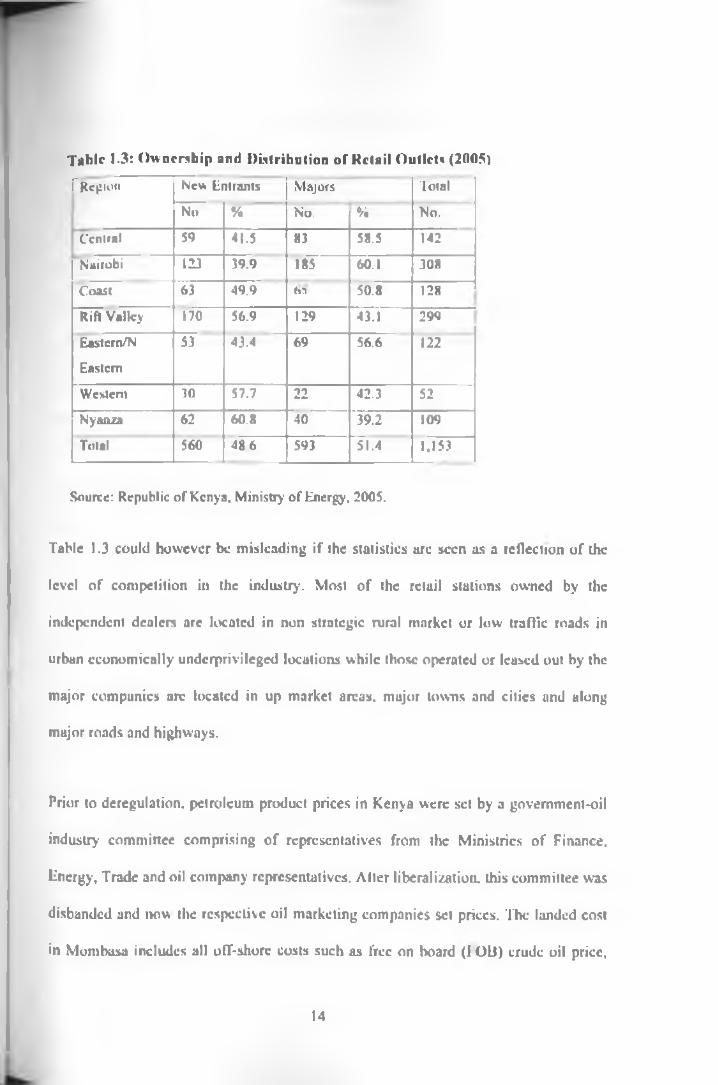
Tabic 1.3: Ownership and Distribution of Retail Outlets (2005)
(~ Region New Entrants Majors Total
No % No. % No.
Central 59 41.5 83 58.5 142
Nairobi 123 39.9 185 60.1 308
Coast 63 49.9 to 50.8 128
Rift Valley 170 56.9 129 43.1 299
Eastern/N
Eastern
53 43.4 69 56.6 122
Western 30 57.7 22 42.3 52
Nyanza 62 60.8 40 39.2 109
Total 560 486 593 51.4 1.153
Source: Republic of Kenya. Ministry of Energy. 2005.
Table 1.3 could however be misleading if the statistics arc seen as a reflection o f the
level o f competition in the industry. Most o f the retuil stations owned by the
independent dealers arc located in non strategic rural market or low traffic roads in
urban economically underprivileged locations while those operated or leased out by the
major companies are located in up market areas, major towns and cities and along
major roads and highways.
Prior to deregulation, petroleum product prices in Kenya were set by a government-oil
industry committee comprising o f representatives from the Ministries o f Finance,
linergy. Trade and oil company representatives. After liberalization, this committee was
disbanded and now the respective oil marketing companies set prices. The landed cost
in Mombasa includes all off-shore costs such as free on board (1013) crude oil price.
14
freight and premium, insurance premium, war risk premium, letter o f credit, pre-
shipment inspection fees, wharfage and ocean losses. Other costs such as refining and
storage charges, refinery usage, industry managed costs (IMC), company profit margin
and taxes and levies arc included to arrive at the wholesale price in Mombasa. Inclusion
o f pipeline and rail transport tariff from Mombasa generates landed costs in other towns
(Nairobi. Nakuru. Eldoret and Kisumu), while a town delivery cost by road tankers and
a dealer margin arc included to arrive at the retail pump price in Ksh/litre. fable A 3
and A 4 demonstrates the price build-up method for Automotive Diesel in the country.
The most common strategy by the oil marketer is to adopt the ex refinery pricing when
international prices are going down and plaits when international prices arc going up to
eater for replacement. This by a large extent explains why price drops arc slow and
increases arc fast as orticuluted by Bacon (1991) rockets and leathers phenomena.
1.2 The statement of the problem
It has been noted in the background that oil is a quintessential commodity in the modem
economy with its most important role as a liquid fuel for transportation. Energy is a
critical input in many productive processes and therefore a causal factor for economic
growth. The sharp increase in the price of petroleum prices has presented a unique
challenge to the net oil importers in the developing world w ith the prospects of slowing
down economic progress (ADR. 2006). In the Kenyan ease, tlic problem has been
worsened by frequent droughts which have stilled hydro power generation capacity and
increased the countries dependence on oil for power generation
IS
Various explanations have been given to justify the pricing regime witnessed in Kenya.
There is suspicion o f price asymmetry between the crude oil prices and the pump prices
which explains the rigidity of prices coming down when the crude oil prices are
downward bound
Imitira (2005 >. The other argument is incompleteness o f foreign exchange pass through
which the slowness o f any benefits trickling to the pump price can be explained. The
third argument has been lack o f competition and cartel like actions by the
multinationals. Kimuyu (1088) noted that to the extent that the oil industry is
oligopolistic and the power sector is monopolistic, then the commercial energy market
in Kenya is imperfect. The fourth argument has been petroleum prices are taxed at
various levels and thus the pump price is a reflection o f the exorbitant taxation regime
applied by the Government.
The high price o f light diesel which is predominantly used in the transport und the
industrial sectors presents a problem o f cost inflation us a result of high energy price.
The African Development Bank (ADR) projected a rise o f inflation o f 1.3 percent and
2.6 percent in the net oil importing countries in 2005 and 2006 respectively, as a result
of the high oil prices (ADB, 2006).
The short- run demand for light diesel is inelastic and therefore shift in consumption
would be expected to pay for high energy bills (Imitira, 2005). This reduction in
consumption stifles aggregate demand and in effect slows national productivity. This in
effect reduces the speed and intensity o f national investment. Reduction in consumption
and investment slows down economic growth.
16
The high cost o f light diesel reduces the profitability o f the transport and the industrial
sectors thereby reducing the public revenue tax base. The reduction in government
revenue exerts a heavy toll on the budget and is worsened by reduced employments as a
result o f thinner profits in the diesel consuming sectors. Thus the high cost of diesel has
a double effect o f eroding government revenue and reducing general employment in the
country. Iltc high diesel prices causes a higher transport cost which increase
commuting costs especially for an agriculture dependent country like Kenya, it
becomes expensive to get products from the farms to the market, therefore eroding their
profits and stilling agricultural production. Ihc high transport cost distorts agriculture
marketing by widening disconnect between supply and demand.
All alternative sources o f energy pursued by the government are diesel dependent with
Independent Power Producers, Geothermal and Cogeneration, all needing massive
supplies of diesel for them to run. The price o f diesel therefore becomes an important
component in the energy pricing in the country. The price of diesel is kept relatively
low by the government in view o f its importance to the economy in comparison to
gasoline by applying discriminatory fiscal regime. The importance o f light diesel in the
economy will continue to grow with the expansion o f industrial and transport sectors o f
the economy . and this is not likely to change because at the present and in the near
future, there exist no feasible substitutes to this fuel (Sasia. 1987). Advanced
exploratory techniques in crude oil search, geothermal potential in the rill valley basin
and global biofuel research may, however, change this opinion.
17
This research aimed at evaluating the price making mechanism o f light diesel in the
country with a view o f deducing optimal pricing policy given the dynamism of the cost
components. Ilte research sought to answer the following research questions;
a) What are the determ inants o f automotive diesel prices in Kenya?
b) Do domestic prices o f automotive diesel relate to changes in crude oil. exchange
rates and taxes?
1.3 The objectives of the Study
This research sought to establish the determinants of automotive light diesel prices in
Kenya with a view o f establishing price build up mechanism o f diesel in the country .
I he specific objectives of the study were:
a) l o establish the determinants o f automotive diesel prices in Kenya
b) To examine the relationship between domestic prices o f automotive
diesel prices and changes in the price o f crude oil. foreign exchange
rates and government taxes.
c) Suggest appropriate policy recommendations on the management and
regulation of the petroleum pricing in the country.
18
This study contributes to existing literature on pricing under different market structures.
In particular, existing literature focuses on gasoline, the premium products in the first
world, while this study analyses pricing o f diesel, an input product in many productive
processes This research will helps policy makers in the energy sector to formulate
appropriate pricing policies not only in petroleum marketing but also in petroleum
dependent segments like transport, power and manufacturing.
The study o f diesel pricing was justified by the following facts; that although the
industrial revolution was initially powered by coal, since its discovery in Pennsylvania
in 1869. oil has gained increasing prominence in terms o f its share o f the world primary
energy supply accounting to ^7 percent share in 2001 ( IF A. 2005). Lnergy is the most
important part o f international trade with oil alone being the most important item in
world trade. In Kenya, oil import bill is the biggest consumers o f foreign exchange
hence a critical component of the balance of payments matrix.
Scnga el ul (1980) slated that Kenya will continue to rely on petroleum products as a
source o f commercial energy because of lack o f potential economically viable
substitutes, limited potential for production o f electricity energy and the use o f thermal
power which is dependent on petroleum products. The hydro power potential is
exhausted, the country has no known crude oil reserves and the only frontiers left for
expansion arc thermal and power generation by the independent power producers.
1.4 Justification and significance o f study
19
These energy sources require massive supplies o f automotive diesel and therefore diesel
prices play a significant role in power pricing in the country. This study assists power
economist in their planning and pricing o f power given the inconsistence rain patterns
in the country’.
In Kenya, the tourism industry. Transport. Manufacturing and Agro business arc diesel
dependent either for transport, source o f energy or as raw materials. According to Stern
and Cleveland (2004). energy is a critical input in many productive processes and
therefore a causal factor for economic growth. Economic growth stimulates
consumption o f fuel by house holds and hence it*s a complete circle linking demand
and supply. The IMF estimates a sustained increase o f crude prices by 10 percent would
lead to a loss o f 1.5 percent to 3 percent o f the GDP in net oil importing countries of
sub Saharan Africa (IF.A, 2004) . High diesel prices arc therefore a challenge to the
government stated objective o f achieving high economic growth rates and therefore this
study assists planners in mitigating this challenge.
Overall, this study assists government planners, oil marketers, petroleum consumers and
the general public in understanding downstream diesel pricing and assist in evaluating
market performance o f the oil industry and developing an optimal pricing and
marketing policy.
20
Hiis research paper has used Nairobi retail automotive prices as anchor price because
Nairobi constitutes more than 60 percent o f the oil market in Kenya and automotive
diesel again constitute more than 60 percent o f the white products used. 1 he study
analyzed quarterly time series data from 1996 to 2006, restricting the study to the post
deregulation period.
The first chapter of the study introduced the local oil market and industry, linking its
performance with the global oil market and its challenges. It illustrated the oil market
infrastructure and demonstrated the importance o f petroleum as a source of commercial
energy in Kenya. The second chapter introduced pricing in economic theory, discussed
relevant literature in price making mechanism, reviews empirical studies taken in the
petroleum pricing, highlighting their strengths and weaknesses and indicated gaps to be
filled by future research. I he third chapter details the theoretical framework, introduces
the methodology, specifies the model, and states the working hypothesis, data sources
and the estimation technique. Chapter four presents empirical findings, analysis and
discussions of the results. Chapter five presents policy implications and
recommendations deduced from the study results usable by the government in pursuit
of stable energy policy.
1.5 Scope and organization of the study
21
CHAPTER TWO
LITERATURE REVIEW
2.1 IntroductionThis chapter presents a review o f literature on the determinants o f automotive light
diesel prices in the world, it highlights studies carried out in both developed and
developing countries as well as different views and policies suggested and adopted in
the areas o f the energy sector especially pricing o f petroleum products.
2.2 Theoretical literature review
Ihe theoretical underpinning o f this study was epitomized by Kimuyu. (1988) when it
was noted that to the extent that the oil industry is oligopolistic and the power sector is
monopolistic, then the commercial energy market in Kenya is imperfect.
One o f the important determinants o f how society resources are used is how the
markets are organized. In a perfect competition, the polar case which seldom occurs,
economic theory assumes there are many buyers and sellers, dealing with a
homogeneous produet with free mobility o f resources. Prices in a perfectly competitive
market equal the marginal cost o f the product. In a monopolist market, there is only one
seller which is not the case in Kenya petroleum market. A close resemblance would be
a monopolistic competitive market where there are many sellers with differentiated
products In Kenya branding o f petroleum products is a new phenomenon with
consumer perception transfixed at the homogeneity o f the products.
22
In an oligopolistic market, the key characteristic is interdependence, actual or perceived
between firms. Nyoike and Oketch (1999) stated that oligopolistic market becomes a
cartel if there exist arrangement amongst at least a few larger sellers. Economic theory
associates oligopolistic markets with a number o f pricing behaviors which includes
price leadership. Ihc market leader announces prices and the rest o f the market follow-
suit almost immediately. Shell. Total, Chevron and Kcnol have played this role
interchangeably since deregulation o f the petroleum industry.
The multiplicity and predictive limitations o f oligopoly pricing theories arc well
documented and appreciated. Grant (1982) argued that competition between two sellers
will result in a monopoly price, u competitive price, a determinate price intermediate
between them, a perpetually oscillating price, and no price at all because the problem is
impossible. This range of predictions corresponds to the range o f pricing behavior
prevalent in the manufacturing industry. The major limitation is that no single theory is
robust enough to capture all the pricing behaviors' observable both across different
industries and in the same industry over time.
To circumvent the inherent weaknesses o f oligopoly theory, industrial economists have
evolved a less formal approach to the analysis of oligopoly pricing based upon
plausible assumptions on corporate motivations and behavior, and the observation of
patterns of pricing behaviour in a number of industries. I his approach is analytically
informal in that it docs not seek to develop an empirical model o f oligopoly pricing
23
such as the Cournot model, hut focuses on Use factors that influence the extent of
collusion and competition in a given market.
The extent to which oligopoly price exceeds the long-run competitive price in a given
market is a function o f the ability o f firms to have a synchronized product pricing
policy. However, certain factors should prevail for this to happen. These include
similarity of collusion motivations, recognition o f interdependence by firms, and the
ability to achieve and successfully maintain matched prices above the competitive
level.
The incentive to avoid competition is the latent potential to rake in monopoly windfall.
According to Grant (1982). the ubility to extract monopoly premiums is however
dependent on the price elasticity o f demand, extent and intensity o f entry barriers in an
industry and the similarity o f cost structure and technology between firms in that
industry, Similarity o f costs and technology between firms makes collusive pricing
practices attractive. Similarly, the extent to which firms appreciate the gains of matched
pricing depends on the apparent interdependence o f their pricing-output decisions This
insight is in turn a function o f seller concentration levels and the cross-price elasticity
of demand between the outputs of the colluding firms. Cross-price elasticity o f demand
is usually high where product differentiation is difficult to accomplish, as is the case
with petroleum products. Grant (1982) further argued that successful pricing
synchronization in an industry is primarily a communication issue. Ease of
communication among firms is premised on the number o f films in the industry, and
24
history o f past collaboration and communication in the industry. Finally, the ability to
raise and maintain prices above the competitive level by oligopoly firms depends on
their ability to frustrate competitive initiatives from within and without.
Competition from new firms is usually subdued through entry barriers. Prices in
collusive oligopoly cannot exceed the long-run perfectly competitive price by more
than the enormity o f entry barriers in that industry. On the other hand, competition from
the colluding firms would be triggered by the incentive for each firm to undermine the
oligopoly price in order to expand its market share and increase profitability. If this
strategy is pursued by all firms, the results in lower profits. Colluding firms will pursue
this pricing behaviour if there arc large buyers in the industry that induce the offer of
large discounts, or a fall in short-run marginal costs relative to the average cost and
industry price. The tender prices for the independent power producers (IPP's) therefore,
offer the best competitive pricing o f petroleum products in Kenya
In general, due to the desire by colluding firms to adjust prices to rctlcct different
circumstances in different sectors o f the market and avoid competitive price-cutting
where possible, price competition among oligopoly firms mainly take the form of
credits and rebate (Grant. 1982). In addition, the balance offerees lor coordination and
competition in oligopoly is unlikely to generate a stable equilibrium price in the long
run. The tendency to retaliate against competition from any firms results in a process of
cumulative price-cutting, which could degenerate into a price war. Since both the
incentive to gain sales by undercutting the oligopoly price and the potential for
25
retaliation against competition arc dependent upon cross price elasticity o f demand, it is
feasible that the oligopoly price will be unstable if the product is homogeneous.
Imitira (2005) noted that petroleum costs represent a small share o f total motoring costs
(including servicing, maintenance, parking charges and purchase costs o f automobiles)
and due to absence o f substitutes, the price elasticity o f demand for petroleum products
is usually very low. However, due to the relative homogeneity o f petroleum products as
a result o f widespread adoption o f international quality standards, and limited scope for
product differentiation, the cross-price elasticity o f demand for petroleum products is
very high. Low price elasticity and high cross-elasticity o f demand generally
discourage price undercutting as a means o f increasing sales and provides a conducive
environment for collusive pricing in the petroleum industry.
In addition, the forward and vertical integration in the petroleum industry in Kenya
constitute a significant entry harrier. Most o f the petroleum products in Kenya arc sold
through company managed or Icased-out retail stations owned by the major firms.
Usually, these stations a a* located on high-traffic (hence relatively more expensive)
locations such as major roads, highways and cities relative to the independent stations
that arc situated in peripheral locations where sales volumes are low. This implies that
the prime petroleum markets in Kenya are foreclosed from new entrants. Moreover, the
petroleum industry is highly vertically integrated and the domineering grip o f the
product supply chain by the majors restricts products supply to the new entrants. Due to
inadequacy or absence o f efficient common user loading facilities in Nairobi and
26
Mombasa respectively, new entrants in these petroleum market have had to rely on
hospitality from the major oil firms. Mostly this hospitality is often denied or granted nt
premiums that diminish any possibility o f price undercutting at the retail level.
2.3 Empirical literature review
A thorough understanding o f the pricing mechanism o f any fuel requires knowledge of
the fuel cycle which begins at the source o f energy and goes towards the end use
(Dclucia and Associates. I WO). It includes exploration, identification and assessment,
production or extraction, separation or improvement, conversion, transformation and
refinement, storage, transportation, distribution and use. Costs incurred at different
stages are considered in the final pricing.
Bacon (1991). in reference to gasoline price movements in Britain from 1965 to 1990
likened gasoline price rises to rockets and price falls to leathers and made an early
attempt to lest price asymmetry statistically, using biweekly data from June 1982 to
January 1990. Bacon used an adjustment model where it was assumed that traders at the
various levels of the oil distribution chain set their target prices to closely reflect their
costs and a profit margin. The difference between the prices they actually receive at a
given time and their target prices provide them with incentives to adjust their prices
towards their preferred level. The speed o f this price adjustment cun then be measured
to determine whether price changes occur asymmetrically.
27

Bacon concluded that all petroleum price changes in Britain were eventually fully
passed on to the consumer (amount symmetry), hut noted a high prevalence o f pattern
asymmetry . However, the asymmetry was so short lived that British gasoline market
could still be considered a highly competitive market. In addition, the author argued
that price asymmetry is difficult to define and model, but is doable, and that short
frequency data sets yielded more binding conclusions.
Karrenbrock. (1991), distinguished three types o f possible price asymmetries, namely
pattern, amount and combination asymmetry. Pattern asymmetry means that an increase
in price is passed through from an upstream price, i.c. wholesale to retail price, faster
titan a decrease in price is passed through. Amount asymmetry on the other hand
estimates whether upstream price increases or decreases arc eventually reflected at the
downstream level regardless o f the timing involved. Finally, the study defined
combination asymmetry to reflect both pattern and amount asymmetries. I
I Jnlike Bacon, Karrenbrock used a partitioning model on monthly wholesale price data
from January 1983 to December 1990 The model found pattern asymmetry as
wholesale price increases were initially passed through to the retail level much faster
than wholesale price decreases. But there was no amount asymmetry from wholesale
price to retail price because all wholesale price increases or decreases were completely
reflected at the retail level within two months after the shock. I he study found that if
wholesale gasoline prices rose by 10 cents per gallon in one month, retail gasoline
prices would rise by 6.8 cents in the same month and 3.5 cents in the following month.
28
Conversely, if wholesale gasoline prices reduced by 10 cents per gallon in one month,
retail prices would reduce by only 3 cents in the same month but will fall by 6.9 cents
in the following month. The study concluded that in spite o f the asymmetric price
movements, the total lag length for complete retail price pass through was about the
same (2 months) whether wholesale prices were rising or falling.
Ndungu (1996) Concluded that exchange rates and domestic price level are important
variables in the macro economic stability o f a country. The conclusions were derived
from an exchange rate pass through study for Kenya using quarterly time series data
from 1970 to 1993. Ihc study concluded that inflation and exchange rales drove each
other. Examination o f asymmetric gasoline price movements requires a careful analysis
at many possible markets.
Nyoike el al (1994). did not establish any evidence of curtcl in the petroleum sub
sector in Kenya. In providing evidence for existence o f oligopoly market in the country,
they noted that significant control o f service stations is held by eight firms, an
observation valid even in 2007 with Shell and Kenol controlling more than 40 percent
o f the market share. Total. Chevron and Oil libya combined controls up to 40 percent of
the market share, meaning the five largest oil marketing companies have over 80
percent o f the market share. An herfmdahl Hirsman index ( IIIII) done by the for 1994
and 1995 market shares indicated an index o f 1.780 and 1.720 respectively, market
concentration indexes associated with oligopolistic competition. Nyoike el al noted the
existences o f vertical integration as witnessed locally and internationally in the
29
petroleum sub sector. The following fiscal and non fiscal barriers to entry were noted;
capital intensiveness which characterizes investment in the sector, non provision of
hospitality services by majors to independents. Requirements for line fill quantities,
requirement for crude oil processing agreement with Kenya refinery and seventy-
percent crude oil processing at the refinery to support the local liquidified petroleum
gas.
Borenstcin ei al. (1997) undertook a detailed analysis o f numerous levels o f gasoline
prices. Ihcy constructed a partial adjustment model to examine weekly or biweekly
gasoline prices at the national level from March 1986 to December 1992 and used their
model to examine various relationships in the gasoline market chain. They searched for
asymmetric price movements between crude oil to spot gasoline prices, crude oil to
retail prices, spot gasoline to terminal prices, crude oil to terminal prices and terminal
to retail prices. They encountered price asymmetry at the level o f crude oil prices to
spot gasoline prices, and from wholesale gasoline price changes to retail price changes.
They attributed some o f the asymmetry to inventory adjustment lags and market power
of some firms. I
I he authors modeled an empirical test lor the common belief that retail gasoline prices
adjusted more quickly to increases than to decreases in crude oil prices. To estimate the
rate at which gasoline prices adjust to crude oil price changes, the study assumed a
simple linear long-run relationship between retail gasoline price and crude oil prices
such that:
30
R =o +u,C + c
Where:
R is the retail gasoline price
C is the crude oil price
r. is the error term
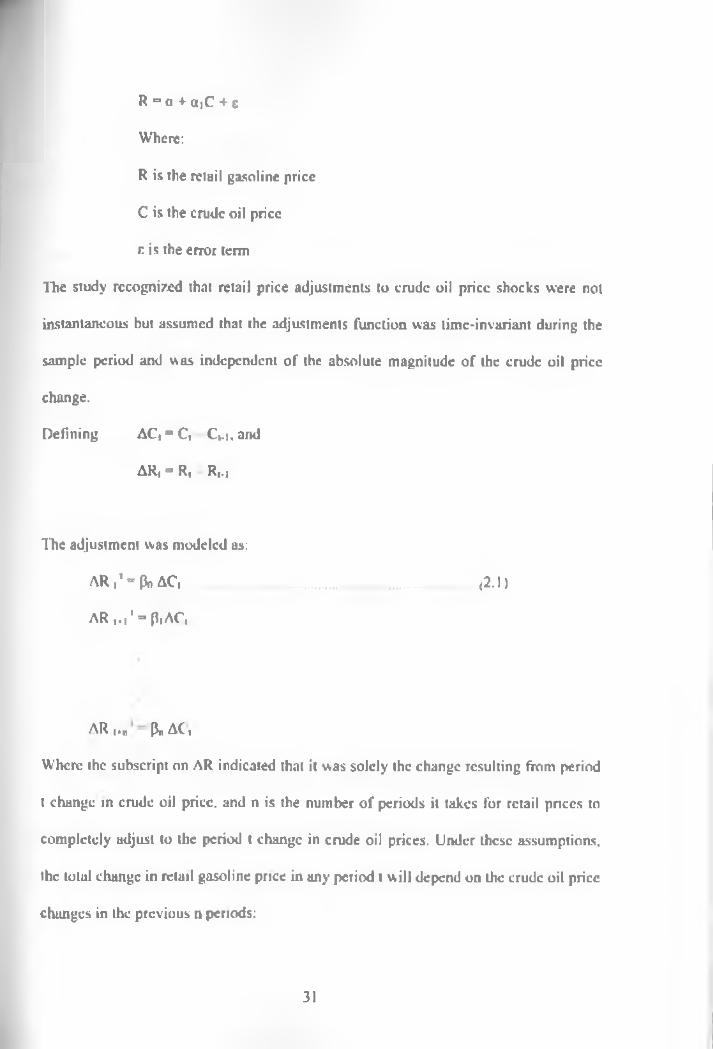
The study recognized that retail price adjustments to crude oil price shocks were not
instantaneous but assumed that the adjustments function was time-invariant during the
sample period and was independent o f the absolute magnitude o f the crude oil price
change.
Defining AC, ■ C, Cm , and
A R .-R , R,.,
The adjustment was modeled us:
A R .'-P o A C ,
AR | . | 1 = PiAC,
<2.1)
AR ,>n pn AC ,
Where the subscript on AR indicated that it was solely the change resulting from period
t change in crude oil price, and n is the number o f periods it takes for retail pnees to
completely adjust to the period t change in crude oil prices. Under these assumptions,
the total change in retail gasoline price in any period t will depend on the crude oil price
changes in the previous n periods:
31
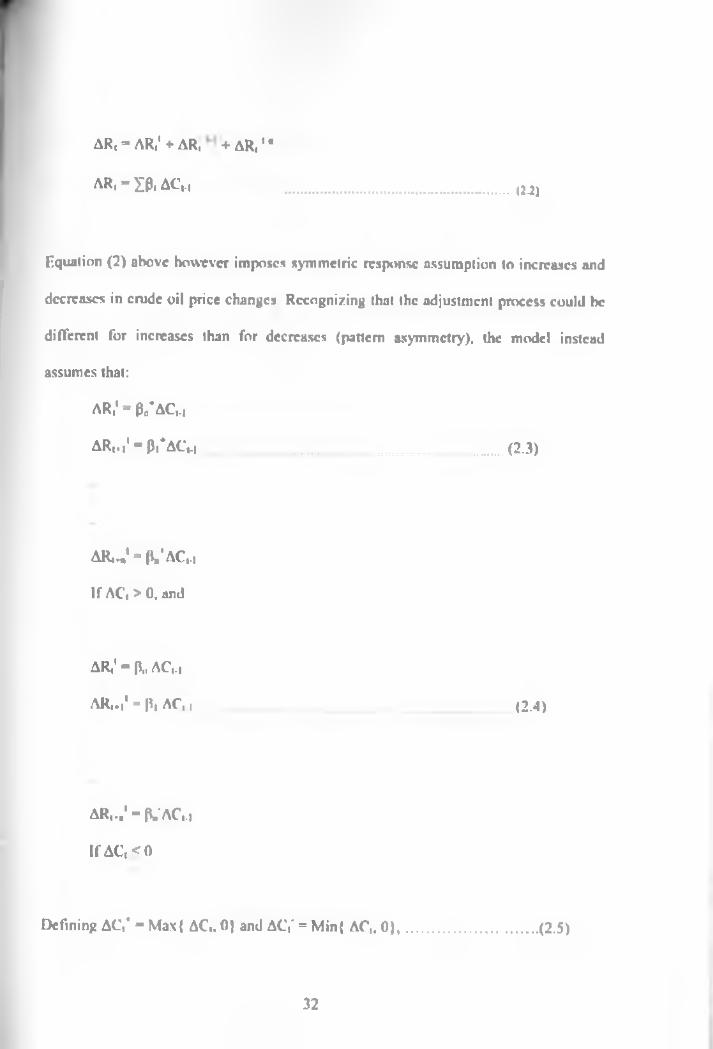
AR, = AR,' + AR, + AR,, B
AR, = IP , AC,.,(2-2)
fquation (2) above however imposes symmetric response assumption to increases and
decreases in crude oil price changes Recognizing that the adjustment process could be
different for increases than for decreases (pattern asymmetry), the model instead
assumes that:
AR,' * Po*AC,.,
AR,./D Pi*AC,., _ ____ ... ...(2.3)
A R ,J “ |V A C „
If AC, > 0, and
AR,' - ft, AC,.,
AR,.,1 - |I, AC, i (2.4)
AR,.q‘ = |V AC,.i
If AC, < 0
Defining AC,’ = Max{ AC,. 0} and AC,' = Min{ AC,. 0}...................................... (2.5)
32
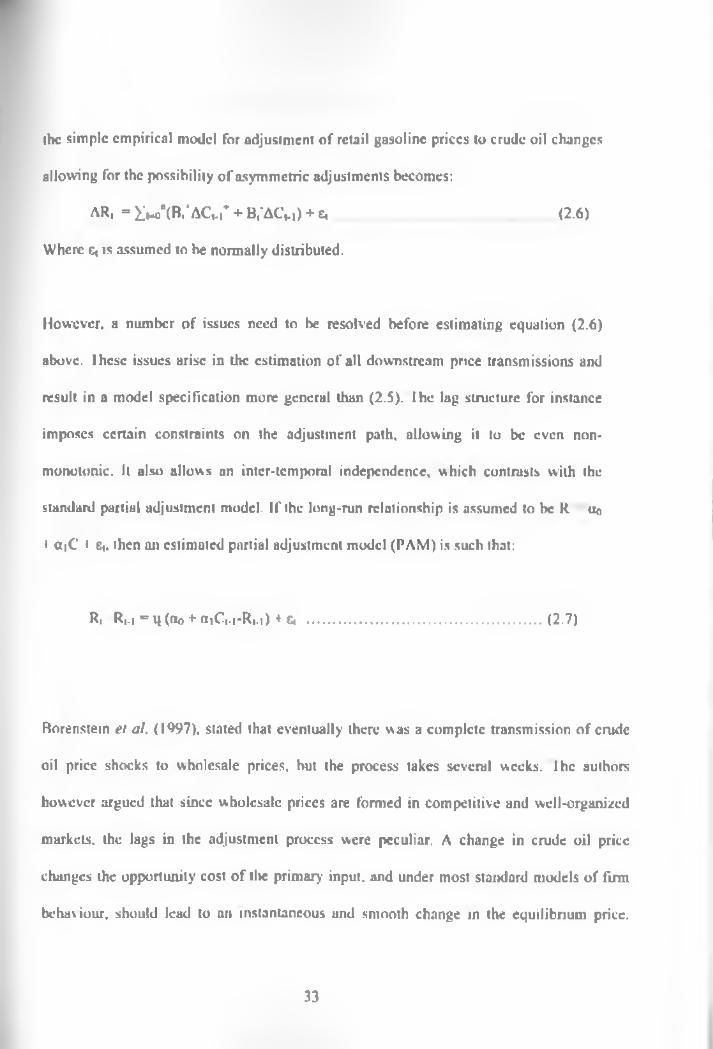
the simple empirical model for adjustment o f retail gasoline prices to crude oil changes
allowing for the possibility o f asymmetric adjustments becomes:
AR, = Iw>"(B,*AC\.r + Bf ACH ) + e, ..................(2 .6)
Where e, is assumed to be normally distributed.
However, a number o f issues need to be resolved before estimating equation (2.6)
above, lhcsc issues arise in the estimation o f all downstream price transmissions and
result in a model specification more general than (2.5). I'hc lag structure for instance
imposes certain constraints on the adjustment path, allowing it to be even non
monotonic. It also allows an inter-temporal independence, which contrasts with the
standard partial adjustment model. If the long-run relationship is assumed to be R u<)
* aiC * e,. then mi estimated partial adjustment model (PAM) is such that:
R, Ri.i = q (a o + a,C|.i-Ri.i) * U (2.7)
Rorenstein et at. (1997). stated that eventually there was a complete transmission o f crude
oil price shocks to wholesale prices, but the process takes several weeks, lhc authors
however argued that since wholesale prices are formed in competitive and well-organized
markets, the lags in the adjustment process were peculiar. A change in crude oil price
changes the opportunity cost o f tlie primary input, and under most standard models of firm
behaviour, should lead to an instantaneous and smooth change m the equilibrium price.
33
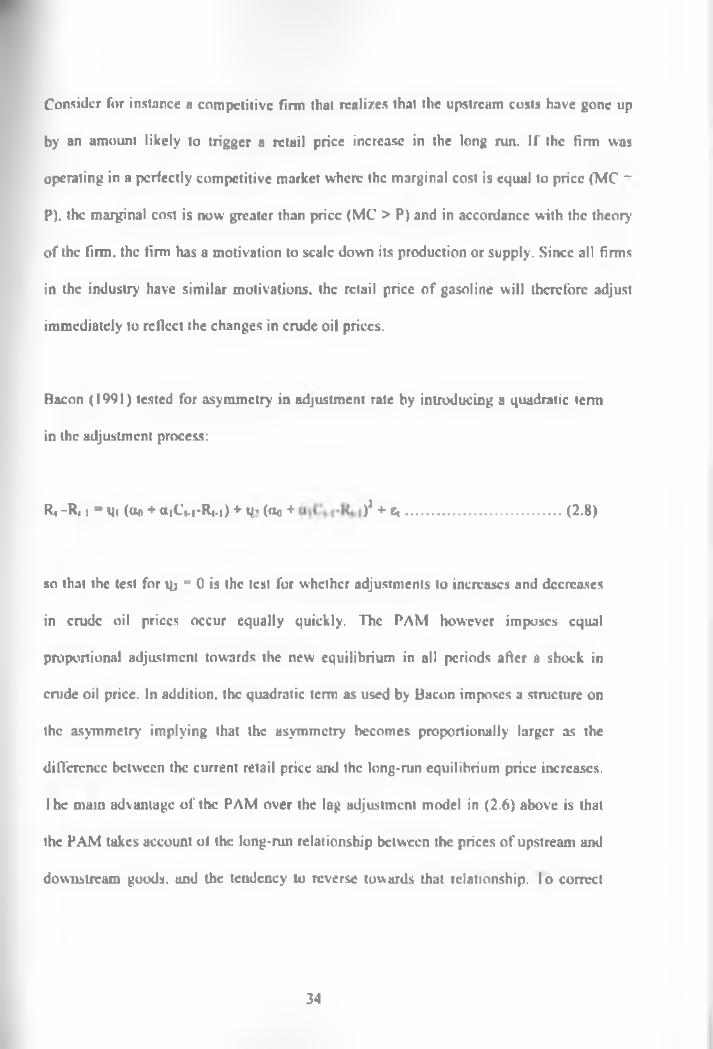
Consider for instance a competitive firm that realizes that the upstream costs have gone up
by an amount likely to trigger a retail price increase in the long run. If the firm was
operating in a perfectly competitive market where the marginal cost is equal to price (MC ~
P). the marginal cost is now greater than price (MC > P) and in accordance with the theory
o f the firm, the firm has a motivation to scale down its production or supply. Since all firms
in the industry have similar motivations, the retail price o f gasoline will therefore adjust
immediately to rcllect the changes in crude oil prices.
Bacon (1991) tested for asymmetry in adjustment rate by introducing a quadratic term
in the adjustment process:
R,-Ri i ■ qi (ao + aiCVi-R|.i) + q» («o + )2 + e , .......................................... (2.8)
so that the test for ifc = 0 is the test for whether adjustments to increases and decreases
in crude oil prices occur equally quickly. The PAM however imposes equal
proportional adjustment towards the new equilibrium in all periods after a shock in
crude oil price. In addition, the quadratic term as used by Bacon imposes a structure on
the asymmetry implying that the asymmetry becomes proportionally larger as the
difference between the current retail price and the long-run equilibrium price increases.
I he main advantage o f the PAM over the lag adjustment model in (2.6) above is that
the PAM takes account ol the long-run relationship between the prices o f upstream and
downstream goods, and the tendency to reverse towards that relationship. I o correct
34
this, equation (2 .6) is estimated with an error correction term, which is a one period
lagged residual from the relationship R, ao ̂<i|C|. The model then becomes:
Ri -Ri i = £iV ,({VAC|.|,+(VAC1.|') + t|i(R|.|* no aiCi) + et
.............................. (2.9)
A concern for the above model is the possibility o f endogeneity o f upstream prices.
Crude oil prices could be correlated with the error term in equation (2.9) if unobserved
determinants of the retail price were also correlated with crude oil price.
Borcnslcin und Shepard (2000) argued that if supply adjustment costs arc high, firms
usually prefer to absorb upstream cost shocks over multiple periods in order to reduce
the impact o f the shocks on their cash flow. Because adjusting levels of production is
costly, economic agents stagger the adjustment over time. A slump in crude oil price
for instance implies a long-run increase in the supply o f gasoline. However, due to
supply adjustment costs that arc directly proportional to the absolute size o f adjustment
per period, firms opt to absorb the shocks gradually, ultimately attaining the full
quantity' adjustment commensurate with the cost decline. The other explanation
enumerated in the study stems from a large literature on industrial organi7ations and
microeconomics and focuses on the difference between market clearing prices and spot
transaction prices. Hie concern in these models is why changes in spot transaction
prices do not strictly correlate with changes in market clearing prices, and various
35
reasons have been given lo explain this behavior such as menu costs that make
changing transaction prices costly, information imperfections and demand inelasticity.
Major weakness o f the Borenstein el al model is the specification and estimation o f the
price adjustment equation. They have used fixed time lag structure in their dynamic
short run equation which is not consistent with the underlying data generating process.
Asplund el al. (2000) on their part analyzed the passthrough of costs to retail petroleum
prices in the Swedish gasoline market. They used daily data lo examine price responses
in the Swedish gasoline market to changes in the Rotterdam Spot price, exchange rate
and taxes. The autliors argued dial the relationship between prices and costs in the
Swedish gusolinc market portray a pattern regarded as typical for many products; the
price remains fixed for some period o f time, and when adjusted is in the direction
motivated by the underlying cost. The study emphasized that for a fuller understanding
of price adjustments, it was necessary to examine the data sets where the sample
frequency at least matches that o f price adjustments. In addition, data with shorter
frequencies generated more credible results. The study tests various symmetries such as
downward and upward ilexibility o f prices, symmetry in response to exchange rates,
spot market prices and taxes.
I he study used data on retail prices o f leaded premium gasoline in Sweden for the
period January 1980 to December 1996. Ilic authors argued that the gasoline market in
Sweden was vertically integrated where gasoline was sold almost exclusively through
36
branded stations, and therefore retail prices arc determined by the list prices o f the retail
chains (firms). The study focused on the retail price list o f Shell, which through out the
period was either the largest or second largest firm with a market share ranging
between 17 percent and 21 percent. The behaviour of shell’s retail segment was
therefore assumed to closely reflect those o f other firms in the industry. The general
form of the model estimated was:
ARP = /(ASP, An. AMC, WAGE, T AX)
Where:
RP is the retail list price o f one litre o f premium leaded gasoline (excluding VAT);
SP is the Rotterdam Spot market price of gasoline in US$;
F is the exchange rate o f Swedish Kroner to US dollar (SEK/IJSS);
MC is the marginal cost of gasoline which is also denoted SP*E; and.
AW AGE is an index o f nominal wage rate.
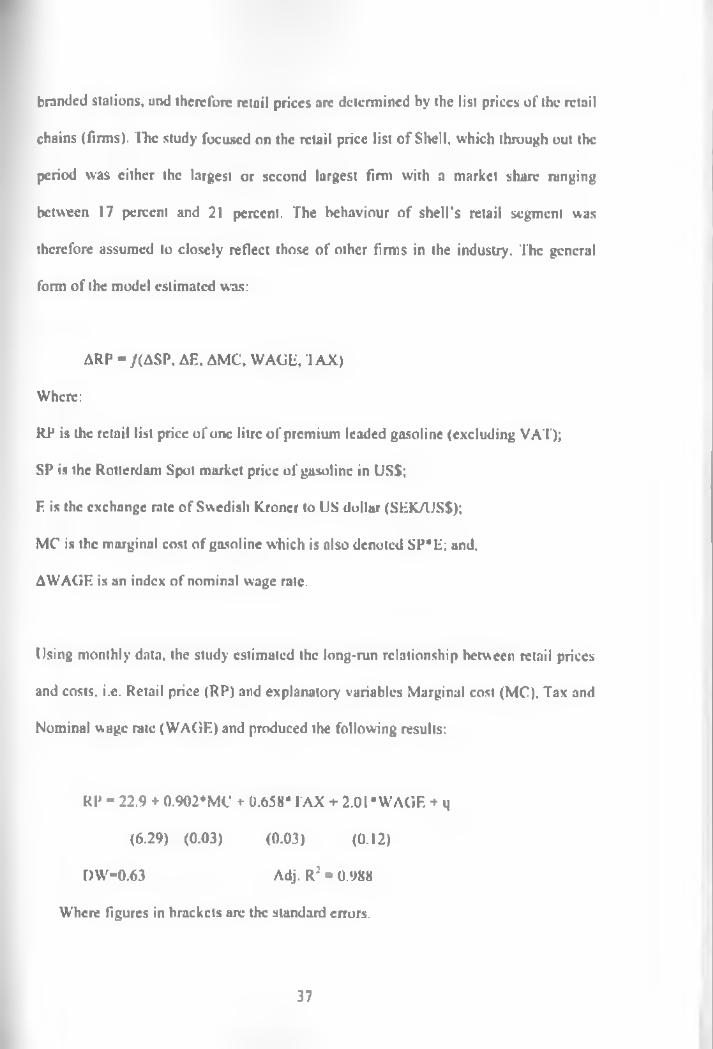
Using monthly data, the study estimated the long-run relationship between retail prices
and costs, i.c. Retail price (RP) and explanatory variables Marginal cost (MC). Tax and
Nominal wage rate (WAGE) and produced the following results:
RP « 22.9 + 0.902*MC + 0.658* 1AX + 2.01* WAGE + m
(6.29) (0.03) (0.03) (0.12)
DW -0.63 Adj. R 7 • 0.988
Where figures in brackets are the standard errors.
37
A non-ncgativc relationship between recent cost changes and price adjustment was
expected. However, sometimes the price moves in one direction when the marginal cost
moves in another (unexpected sign) due to omitted variables or hedging opportunities
and inventory situation. The study argued that the explanation for the large number of
wrong signs was a gradual adjustment pattern. If the lirm lor some reason wished to
avoid large price changes, this may result in occasional violation o f the monotone
relationship between cost changes and price adjustment.
To capture the probability that price adjustments partly reflect previous changes in
costs, lagged variables were included in the subsequent econometric analysis and
estimated the relationship between all the price adjustments and the preceding changes
in marginal cost and taxes, flic coefficient for change o f marginal cost was found to be
greater (0.28) for price rises than for price cuts (0.19), indicating presence of pattern
asymmetry in price adjustment.
Imitira (2005) motivated mainly by the unrelenting agitation for reintroduction o f price
controls in the petroleum market in Kenya premised on the view' that gasoline retail
prices do not respond to the market fundamentals. The study undertook a price
passthrough analysis to ascertain presence o f amount asymmetry (whether upstream
cost changes are not fully transmitted to the retail levels and pattern asymmetry
(whether crude oil price increases are transmitted faster and more efficiently than crude
oil price decreases). The study found no evidence o f amount asymmetry but pattern
38
asymmetry was found to be prevalent. Indeed retail gasoline prices in Nairobi rise
faster than they fall.
Ye el al, (2005) documented that petroleum products change hands severally on the
supply chain from the point o f production to the ultimate consumer. Each firm
participating in the supply and marketing chain incurs some costs and wishes to make
some mark-up; hence petroleum price usually increases with each intermediate sale.
Consequently, any change in price at any intermediate point o f sale is expected to affect
prices at each successive sale. This process is called pass-through in economic
literature.
Bhaskara f t al (2005) tested asymmetric relationship between crude oil and gasoline
prices in Fiji and confirms asymmetry in price adjustments with respect to crude prices.
My using two models, the Granger two steps and l.SF Hendry Approaches, the study
derives identical findings testifying presence o f asymmentry.
Kiplui (2006) assessed the extent to which exchange rate affect consumer's prices in
Kenya. Using two different approaches, the unrestricted VAR and the Johansen
framework o f multivariate cointcgration. he show that a 10 percent increase in
exchange rates leads to 4 percent increase in consumer prices. This study confirmed a
significant effect o f import prices on inflation in Kenya at a pass through of 0.7 o f
import prices to consumer prices.
39
2.4 Overview of literature
From the above literature, it was appreciated (hat a petroleum pricing had received a
fair amount of research with interest being restricted on the relationship between crude
oil and gasoline prices, the dominant product in the United States and Europe. From
Bacon’s pioneer work in 1991 to Bhaskara et al (2005) Fiji research, empirical test
have shown resistant o f marketers to adjust prices downwards while extreme alacrity
have been shown to the opposite giving credence to Racon’s Rockets und Feathers
hypothesis.
In Kenya, literanire available is limited to lmitira (2005) analyzing asymmetry or lack
of it in relationship between crude oil prices and Nairobi gasoline prices. Indeed the
study findings indicated no amount asymmetry but showed pattern asymmetry was
prevalent. Ibis study will incorporate other input cost components o f tax and foreign
exchange to determine the price making mechanism in automotive diesel.
I his study adopted the Bhaskara t7 a l (2005) approach o f testing relationship between
gasoline prices and cost components because of two reasons: One. the study
incorporated the relationship between the cost variables of crude oil , taxes, foreign
exchange and refinery cost, Two, Fiji as a developing country represented a close
resemblance to the Kenyan macro economy because it’s dependent on imported oil,
limited foreign exchange and use o f fiscal policy in petroleum to attain redistribution of
wealth as in all developing countries.
40
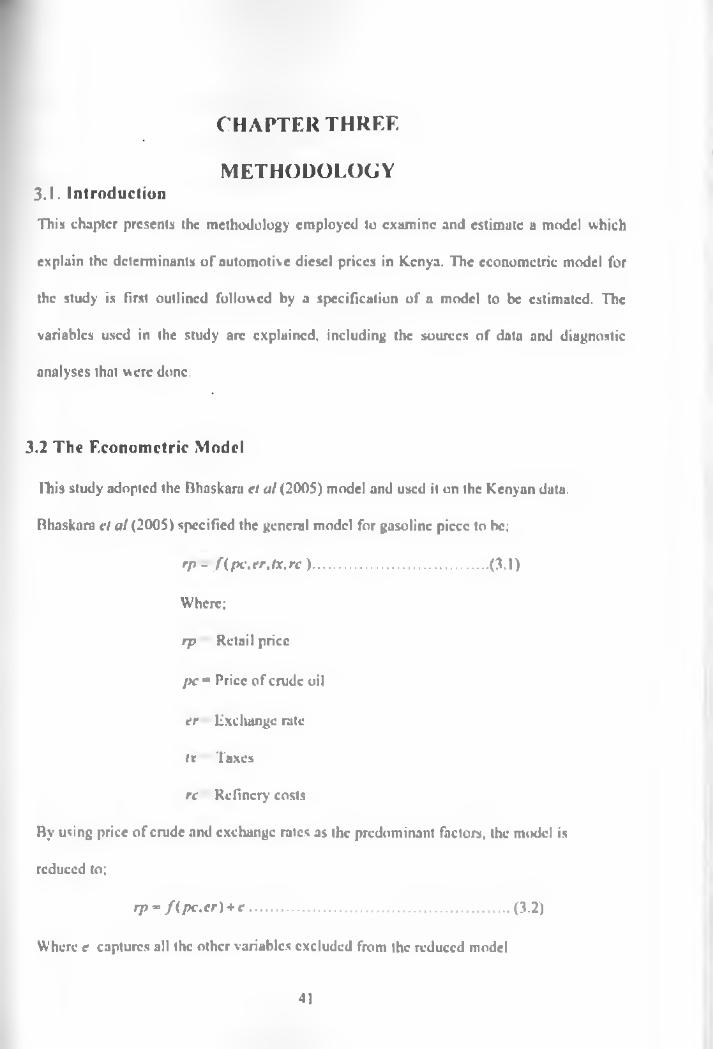
CHAPTER THREE
METHODOLOGY3.1. Introduction
This chapter presents the methodology employed to examine and estimate a model which
explain the determinants o f automotive diesel prices in Kenya. The econometric model for
the study is first outlined followed by a specification o f a model to be estimated. The
variables used in the study are explained, including the sources o f data and diagnostic
analyses that were done.
3.2 The Econometric Model
Ibis study adopted the Bhaskara el al (2005) model and used it on the Kenyan data.
Rhaskaru el a l{ 2005) specified the general model for gasoline piece to be;
r p - fip c .e r .lx .r c )................................................(3.1)
Where;
rp Retail price
j k ■ Price o f crude oil
er Exchange rate
lx Taxes
re Refinery costs
By using price o f crude and exchange rates as the predominant factors, the model is
reduced to;
rp = f(p c .c r ) + e .......................................................................(3.2)
Where e captures all the other variables excluded from the reduced model
41
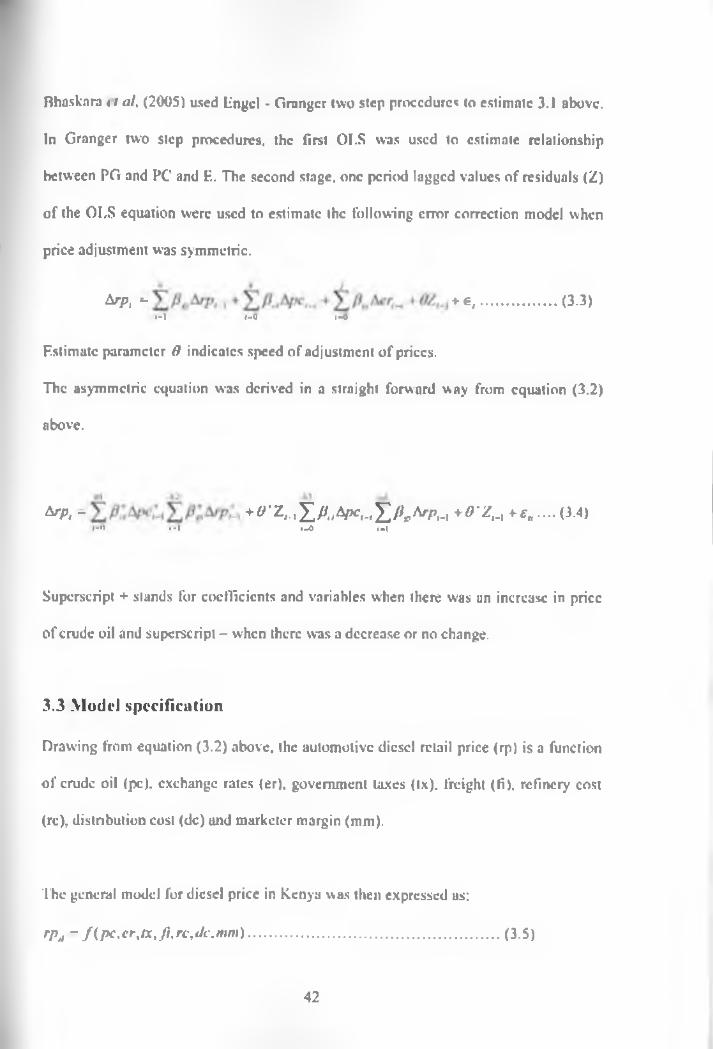
Bhaskara * i al, (2005) used lingcl - Granger two step procedures to estimate 3.1 above.
In Granger two step procedures, the first OLS was used to estimate relationship
between PG and PC and F.. The second stage, one period lagged values o f residuals (Z)
o f the OLS equation were used to estimate the following error correction model when
price adjustment was symmetric.
toPi * - + e , .................... (3.3)l - l f-0 1-0
Estimate parameter 0 indicates speed o f adjustment o f prices.
The asymmetric equation was derived in a straight forward way from equation (3.2)
above.
topi - + 0 'Z M Y,P„Apcl. , '£ l0 lc,Arp;.l + 0 'Z _ l + s„ .... (3.4)t-W l - l i - 0 i- l
Superscript + stands for coefficients and variables when there was an increase in price
o f crude oil and superscript - when there was a decrease or no change.
3.3 Model specification
Drawing from equation (3.2) above, the automotive diesel retail price (rp) is a function
o f crude oil (pc), exchange rates (er). government taxes (lx), freight (ti). refinery cost
(re), distribution cost (dc) and marketer margin (mm).
The general model for diesel price in Kenya was then expressed as:
rp j - /(p c ,e r ,tx , /} ,re,dc,m m ) ................................................................................ (3 .5 )
42
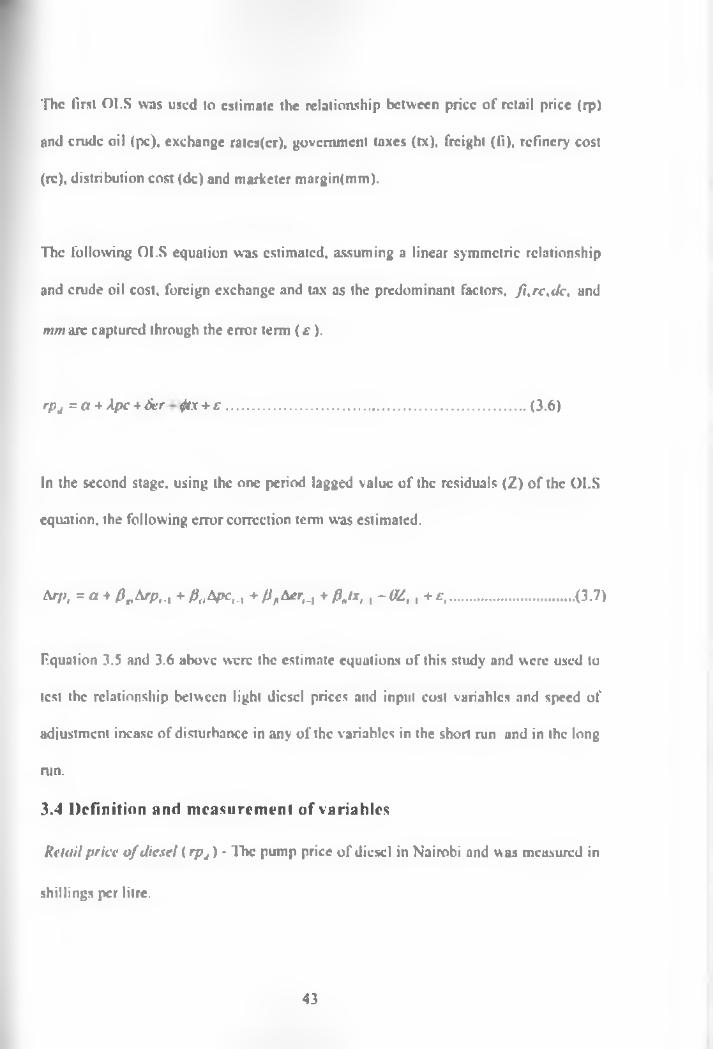
The first OI.S was used to estimate the relationship between price o f retail price (rp)
and crude oil (pc), exchange ratcs(cr), government taxes (tx). freight (fi), refinery cost
(re), distribution cost (dc) and marketer margin(mm).
The following OI.S equation was estimated, assuming a linear symmetric relationship
and crude oil cost, foreign exchange and tax as the predominant factors, fi.rc .dc, and
mm arc captured through the error term (£ ) .
rpj =Ct + Ape + tier f i x + £ ..................................................................................(3.6)
In the second stage, using the one period lagged value o f the residuals (Z) o f the OI.S
equation, the following error correction term was estimated.
Arp, = a ■» p v Arp,.x + 0 (lApc,_, + ffA er ,_ t + /?„/*„, -0 Z , , + £ ,.................................. (3.7)
Fquation 3.5 and 3.6 above were the estimate equations o f this study and were used to
test the relationship between light diesel prices and input cost variables and speed of
adjustment incase of disturbance in any o f the variables in the short run and in the long
run.
3.4 Definition and measurement of variables
Retail price o f diesel ( rpu) - The pump price o f diesel in Nairobi and was measured in
shillings per litre.
43
Crude oil cost ( / * • ) - lhis was the cost of procuring a barrel o f crude in the
international market free on hoard and was measured in dollars per barrel.
Exchange rate (er )- This was the exchange rate o f Kenya shillings to the US Dollar
and was measured in shillings per dollar.
Tax rate (lx) - These were all fiscal payments loaded in pump prices per litre and
includes import duties, excise, levies and value added taxes and Were be measured in
shillings per litre.
Freight and insurance ( f t ) • These were cost o f transporting products from source to
the port of Mombasa and insurance while at high seas. They were measured in dollars
per metric tone.
Refinery cost ( r c ) - These are product processing cost at refinery and were measured
in dollars per metric tone.
Distributions costs ( d c ) - These are the cost o f transferring product from the refinery to
the serv ice stations and were measured in shillings per litre.
Marketers Margin ( mm) was the profit made by oil marketers and was measured in
shillings per litre.
Change in retail price o f diesel ( Arp) was measured by differencing the retail price at
the previous period (rp,.j) from the retail price in the current period (rp,).
Change o f crude oil cost (Ape) was measured in dollars per barrel, by differencing the
cmdc cost at the previous period (pc,.|) from the crude cost in the current period (pc,).
44
Change in foreign exchange rale (Aer) was measured in Kenya shilling to the US
dollar.and was measured by differencing the exchange rate at the previous period (cre.i)
from the exchange rate in the current period (cr,).
Change in lax rates (A lx) - This was measured by differencing the tax rate at the
previous period (txM) front the tax rate in the current period (tx,).
3.5 Estimation techniques
liquation (3.6) and (3.7) was estimated using ordinary least squares (OLS) estimation
method. Before carrying out estimation, diagnostic tests wore conducted on the lime series
variables. A specification associated with error correction model (F.CM) was applied. This
involved testing stationarity and the order o f coiniegration o f each variable using the
Augmented Dickey fuller unit root tests (ADF). This is because lime series data exhibits
non-stationary characteristics. 1 lie ADF test assumed that the data generating process was
autoregressive. An autoregressive process is one that considers only one period such that
observation at time t depends only on the observation at time L,. F.ither way. there may be
autocorrelation in the error term which biases the test, lo overcome this problem, the study
used (ADF) test.
3.5.1 Unit root tests for stationarity of data
Time series data may exhibit a trend of unit root(s) over time. It the mean and variance do
not vary systematically over time, then it becomes a stationary series. A stationary
stochastic process implies that the underlying stochastic process that generated the series
wus invariant with lime.
45
Economic lime series with the presence o f unit roots muy be trended to remove the non-
slutionarity trend in it. it requires differencing to ensure that any autocorrelation is removed
and the error term is white noise. This was done to the series before the regressions was ran
3.5.2 Cointegration analysis
Granger ( l ‘>87) argued that a linear combination o f two or more non-stationary scries may
yield a stationary scries. If such a linear combination exists, then the non-stationary series
are said to be cointegrated. This means that the non-stationary series move closely together
over time, and the difference between them is stable. This will result in a linear combination
known as co integrating equation, and it may be interpreted as a long-run relationship
between the variables.
The study performed tests for cointegration using the Augmented Dickcy-Fullcr (ADF) in
testing stationarity o f the variables. The results showed that all the variables were non
stationary and integrated o f order one. ITiis meant that all the variables had to be differenced
once to render them stationary. After establishing the order o f integration, the study further
checked whether the non-stationary variables were cointegrated. This was aimed at further
establishing whether there existed a long run relationship amongst non stationary' variables.
This was done by generating residuals from the long-run equation of the non-stationary
variables, which were then tested for stationarity using the ADF test. 1 he result showed that
the test statistics were lesser than the critical values implying that there was no unit root
hence the model used lor estimation incorporated error correction term to capture long run
relationship.
46
3.5.3 Diagnostic tests
A battery o f tests was carried out to indicate the model inadequacy or failure. For example,
in the ease o f the linear regression model estimated by OI.S, a series of diagnostic tests were
used to indicate whether any o f the assumptions required for OI.S to be the best linear
unbiased estimator (BLUE) appeared to be violated These assumptions included a serially
uncorrclatcd and homoscedastic error term, absence o f correlation between the error term
and the regressors and correct specification o f the model. This study carried out various
diagnostic tests such as autocorrelation residuals, the white test for heteroscedastic errors
and normality test for the distribution of residuals.
3.6 Data type and sources
The data consisted o f annual observations o f the variables that included monthly cnide oil
cost, retail prices o f automotive diesel, government taxes and monthly doliar-shilling
exchange rates as captured and published by the Kenya Bureau o f Statistics (KBS).
3.6 Data analysis
Descriptive statistics o f all the variables were analyzed nnd the trends in the data are
presented. This was followed by the first ordinary linear regression in order to establish the
long run relationship between automotive diesel and its determinants The second stage
involved using the lagged variables o f the residuals o f the first regression to estimate the
error correction model. The error correction model was used to examine the relationship in
the short-term between diesel prices and changes in crude oil prices, exchange rates and
government taxes. The regressions were earned out using the E-views econometric
software.
47
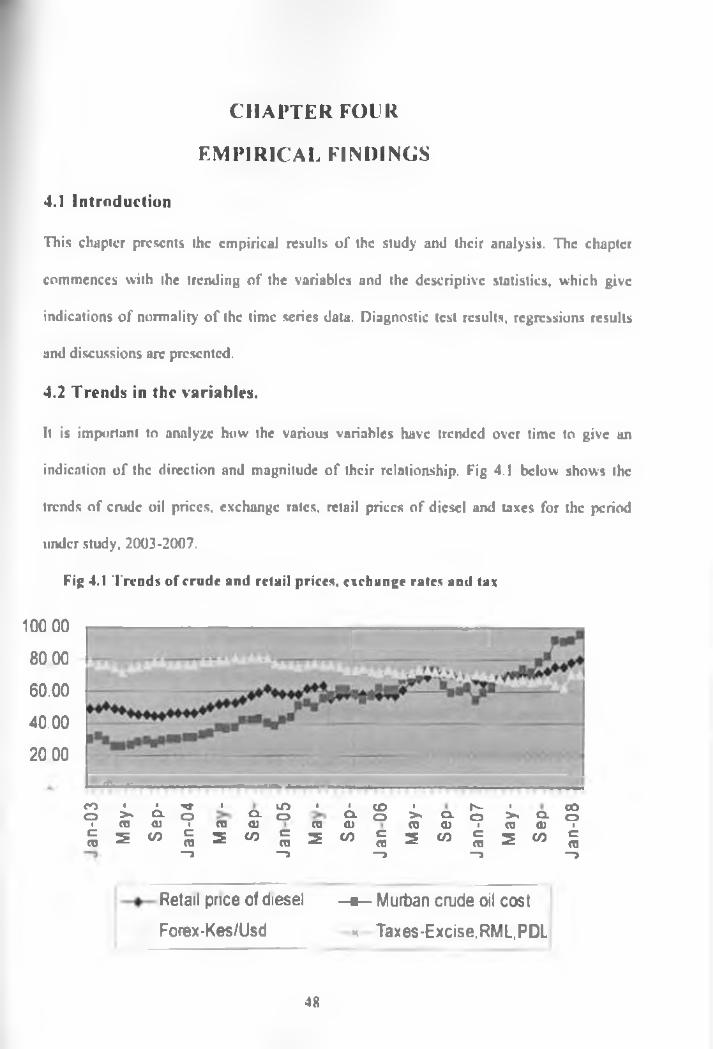
CHAPTER FOUR
EMPIRICAL FINDINGS
4.1 Introduction
This chapter presents the empirical results o f the study and their analysis. The chapter
commences with the trending o f the variables and the descriptive statistics, which give
indications o f normality o f the time series data. Diagnostic test results, regressions results
and discussions arc presented.
4.2 Trends in the variables.
It is important to analyze how the various variables have trended over time to give an
indication o f the direction and magnitude o f their relationship. Fig 4.1 below shows the
trends o f crude oil prices, exchange rates, retail prices o f diesel and taxes for the period
under study, 2003-2007.
Fig 4.1 T rends o f crude and retail prices, exchange rates and tax
100 00
80 00
60.00
40.00
20 00
Retail price of diesel - a — Murban crude oil cost
Forex-Kes/Usd «. Taxes-Excise.RML.PDL
H Hco i 1 rr • L O 1 a co a r - 1 coo >N C l o ex o C L o >. C L o >» ex o1 TO <D § TO <u TO <D TO a> • TO 0) 1cTO 2 CO c
TO—>
2 CO cTO
—>2 CO c
TO—>
2 CO cTO—y
2 CO cTO“5
48
From the trend graph 4.1 above, it can be deduced that foreign exchange has oscillated
between the 60-80 marks for the last live years. This can be attributed to stable macro
economic environment, and more so, the monetary policy pursued by the central bank.
Moreover, Foreign exchange inflows have been boosted by a vibrant tourism sector and
stability in the traditional earners o f agriculture export in horticulture, tea and coffee.
Remittances from Kenyans living in diaspora have also contributed to this stability.
Ironically, Import o f crude oil has been the single largest consumer o f foreign exchange und
increases in the cost o f the barrel have put unprecedented pressure on the Kenya shilling.
The cost o f Murban crude has consistently increased over the period under study from a low
of slightly above 40 US dollars per barrel to 82 dollars per barrel in December 2007. By-
April 2008. the cost of crude hit a record high o f 147 dollars per banrel. setting o ff a global
outcry that the cost of energy could bnng down many economics. Many explanations have
been given to explain this pnee rocketing scenario, but the market forces o f demand and
supply gives a fundamental explanation as to why. Ihe positive growth o f global economies
experienced in the last decade has put a lot o f pressure on oil supply with India and China
alone showing unsatiliable demand for oil. Geopolitical tensions and the cartel behavior of
the OPFC have not helped in any way. Rapid industrialization in the developing world and
immense motorization world over has made global demand for oil outstrip supply. I he high
cost o f explore , find, drill and refine process has made it difficulty for producers to respond
to escalating global demand as demonstrated by consistent crude oil cost increases in Graph
4.1 above.
49
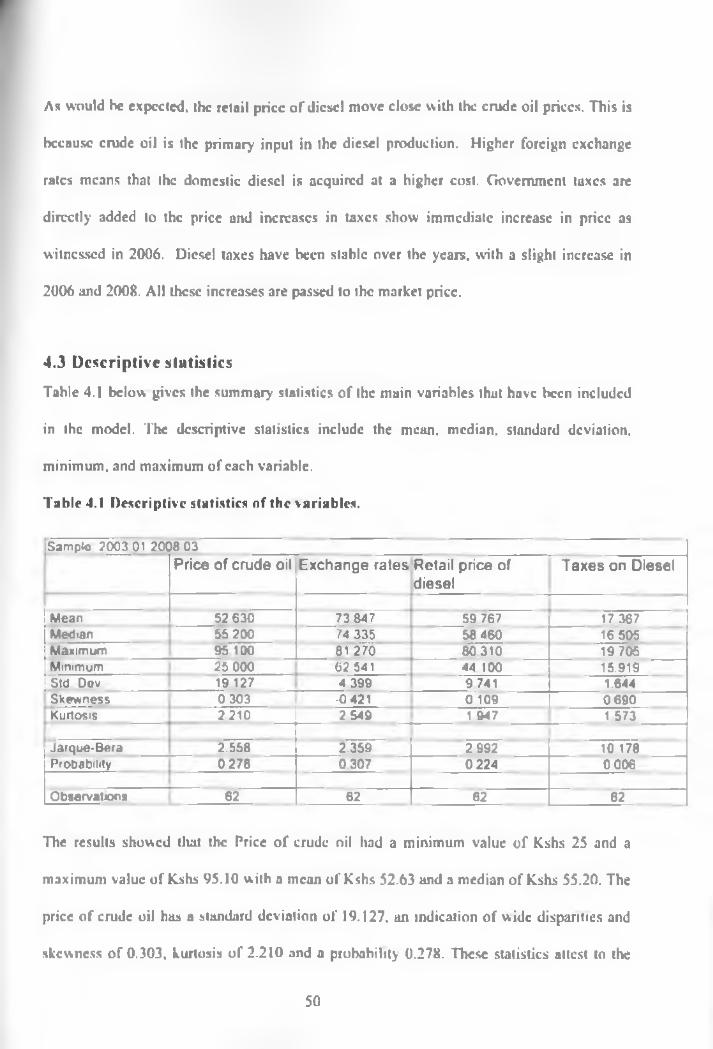
As would he expected, the retail price o f diesel move close with the crude oil prices. This is
because crude oil is the primary input in the diesel production. Higher foreign exchange
rates means that the domestic diesel is acquired at a higher cost. Government taxes are
directly added to the price and increases in taxes show immediate increase in price as
witnessed in 2006. Diesel taxes have been stable over the years, with a slight increase in
2006 and 2008. All these increases are passed to the market price.
4.3 Descriptive statistics
Table 4.1 below gives the summary statistics o f the main variables that have been included
in the model. The descriptive statistics include the mean, median, standard deviation,
minimum, and maximum of each variable.
Table 4.1 Descriptive statistics of the variables.
ISampIo 2003 01 2008 03
Price o f crude oil Exchange rates Retail price o f diesel
Taxes on Diesel
I Mean 52 630 73 847 59 767 17 367Median 55 200 74 335 58 460 16 505Maximum 95.100 81.270 80 310 19 705Minimum 25 000 62 541 44 100 15.919
|_Std Dov 1 9127 4 399 9 741 1.644Skewness 0 303 •0 421 0 109 0 690Kurtosis 2 2 1 0 2 549 1 947 1 573
Jarque-Bera 2.558 2.359 2 9 9 2 10.178Probability 0 278 0 307 0 224 0 006
Observations 62 62 62 62
The results showed tluit the Price o f crude oil had a minimum value o f Kshs 25 and a
maximum value of Kshs 95.10 with a mean o f Kshs 52.63 and a median of Kshs 55.20. The
price o f crude oil has a standard deviation o f 19.127. an indication of wide disparities and
skewness o f 0.303. kurtosis of 2.210 and a probability 0.278. These statistics attest to the
50
erratic nature o f international crude oil prices, mainly due to the fragile balance between
supply and demand.
Exchange rates have a maximum o f 81.270 and a minimum o f 62.541. with a mean of
73.847 and a median o f 74.335. Exchange rales have a standard deviation o f 4.399. more
stable than crude oil price, with a skewness o f -0.421, kurtosis 2.549 and a probability of
0.307. Movements in foreign exchange rates were attributed to imbalances o f payments
position.
Retail price o f diesel has a maximum value o f 80.31 and a minimum value o f 44.10, a mean
o f 59.767 and a median o f 58.46. Retail price has a standard deviation o f 9.741 as a result of
the price disparities. The skewness is 0.109 and kurtosis o f 1.947 with a probability of
0.224. These numbers can be explained by the many adjustments done on the retail prices o f
diesel as a result of changes in the international prices of diesel. Tax has a maximum value
o f 19.705 and a minimum o f 15.919, a mean o f 17.367 and a median o f 16.505. The
standard deviation of tax is 1.644. an indication o f the minimal variations noted over the
study period. The kurtosis is given by 1.573, skewness is 0.69 and has a probability o f
0.006. From the close relationship between crude oil and retails prices of diesel, it was safe
to attribute these changes to changes in the international in the cost of crude.
4.4 Correlation matrix
Correlation matrix is an important indicator o f the linear association between explanatory
variables and help in determining the strength of association o f the variables in the model.
51
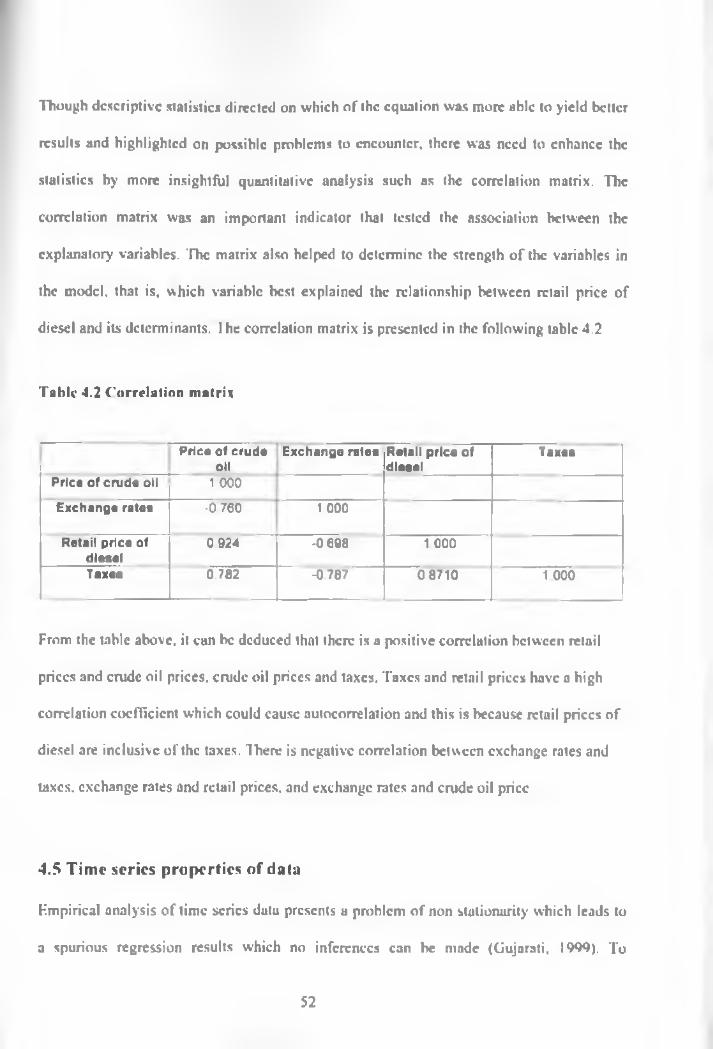
Though descriptive statistics directed on which of the equation was more able to yield better
results and highlighted on possible problems to encounter, there was need to enhance the
statistics by more insightful quantitative analysis such as the correlation matrix. The
correlation matrix was an important indicator that tested the association between the
explanatory variables. The matrix also helped to determine the strength o f the variables in
the model, that is. which variable best explained the relationship between retail price of
diesel and its determinants. I hc correlation matrix is presented in the following table 4.2
Table 4.2 Correlation matrix
P rico o f c ru d e o il
E xchango ra tes R ota ll p r ic o o f d iosot
Taxes
P rice o f c ru d e o il 1 000
E xchange rates •0 760 1 000
R eta il p rico o f d iese l
0 924 -0 698 1 000
Taxes 0.782 -0.787 0 8710 1.000
From the table above, it can be deduced that there is a positive correlation between retail
prices and crude oil prices, crude oil prices and taxes. Taxes and retail prices have a high
correlation coefficient which could cause autocorrelation and this is because retail prices o f
diesel are inclusive o f the taxes. There is negative correlation between exchange rates and
taxes, exchange rates and retail prices, and exchange rates and crude oil price
4.5 Time series properties of data
Empirical analysis of time series data presents a problem o f non stationurily which leads to
a spurious regression results which no inferences can he made (Gujarati, 1990). To
52
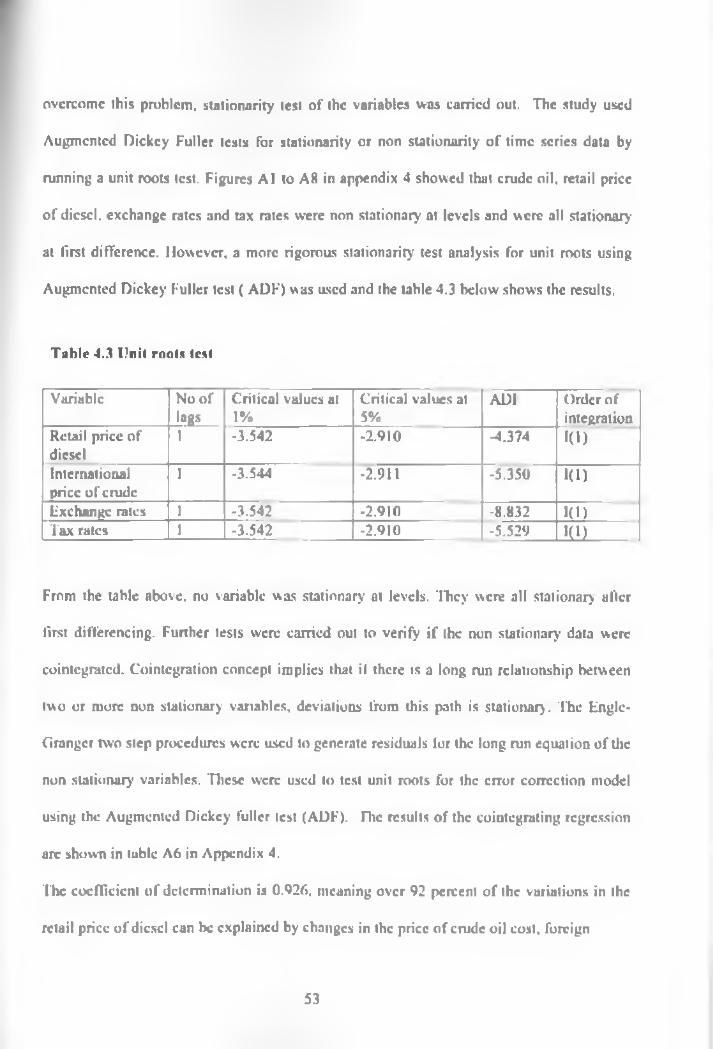
overcome this problem, stalionarity test o f the variables was carried out. The study used
Augmented Dickey Fuller tests for stationurity or non stationurity o f time scries data by
running a unit roots test. Figures A1 to A8 in appendix 4 showed that crude oil. retail price
o f diesel, exchange rates and tax rates were non stationary at levels and were all stationary
at first difference. However, a more rigorous stationarity test analysis for unit roots using
Augmented Dickey Fuller test ( ADF) was used and the table 4.3 below shows the results.
Table 4.3 Unit roots test
Variable No o f lags
Critical values at 1%
Critical values at5%
ADI Order of integration
Retail price o f diesel
1 -3.542 -2.910 -4.374 l(D
International price o f crude
1 -3.544 -2.911 -5.350 1( 1 )
Exchange rates 1 -3.542 -2.910 -8.832 KDTax rates 1 -3.542 -2.910 -5.529 m ______
From the table above, no variable was stationary at levels. They were all stationary after
first differencing. Further tests were carried out to verify i f the non stationary data were
cointegrated. Cointegration concept implies that if there is a long run relationship between
two or more non stationary variables, deviations from this path is stationary . The Engle-
Granger two step procedures were used to generate residuals lor the long run equaiion of die
non stationary variables. These were used to test unit roots for the error correction model
using the Augmented Dickey fuller test (ADF)- Die results of the cointegrating regression
are shown in table A6 in Appendix 4.
The coefficient o f determination is 0.926. meaning over 92 percent o f the variations in the
retail price o f diesel can be explained by changes in the price of crude oil cost, foreign
53
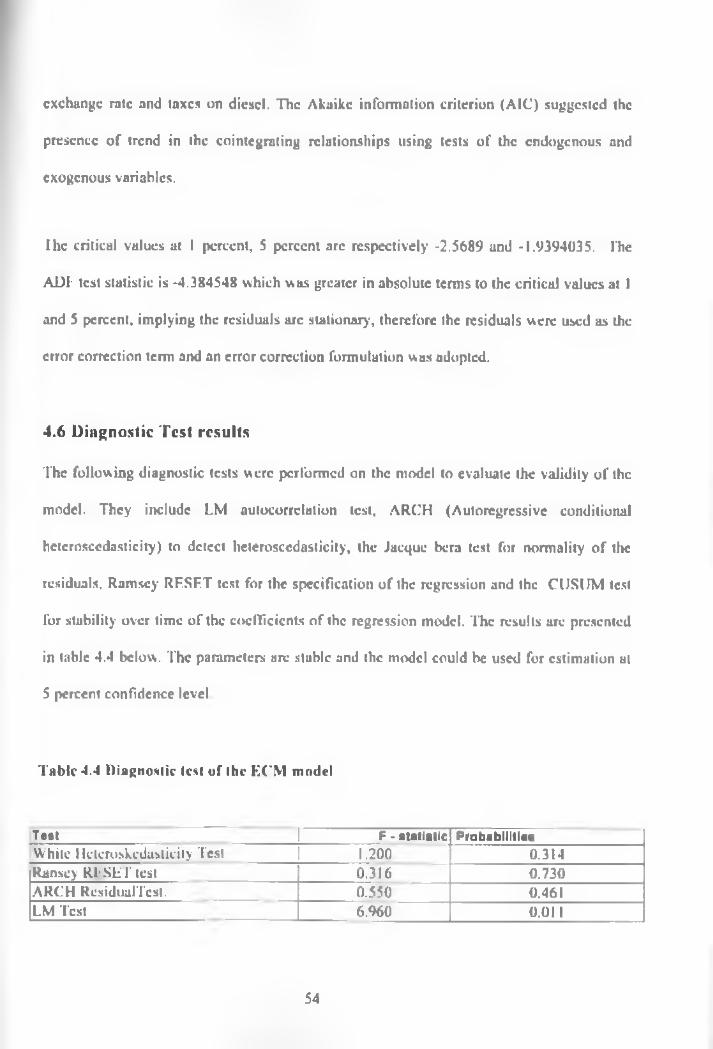
exchange rate and taxes on diesel. The Akaike information criterion (AIC) suggested the
presence o f trend in the cointegrating relationships using tests of the endogenous and
exogenous variables.
I he critical values at 1 percent, 5 percent are respectively -2.5689 and -1.9394035. The
ADI- test statistic is -4.384548 which was greater in absolute terms to the critical values at I
and 5 percent, implying the residuals arc stationary, therefore the residuals were used as the
error correction term and an error correction formulation was adopted.
4.6 Diagnostic Test results
The following diagnostic tests were performed on the model to evaluate the validity o f the
model. They include LM autocorrelation lest, ARCH (Autoregressive conditional
hctcrosccdasticity) to detect hcterosccdasticity, the Jacquc bera test for normality o f the
residuals, Ramsey RFSFT test for the specification of the regression and the CUSUM test
for stability over time o f the coefficients o f the regression model. The results are presented
in table 4.4 below. The parameters are stable and the model could be used for estimation at
5 percent confidence level
Table 4.4 Diagnostic lest of Ihc ECM model
Teat F - s ta tis tic P ro b a b ilitie sWhite Hetcroskcduslicity Test 1.200 0.314Ranscy Rl-SF T lest 0.316 0.730ARCH RcsidualTcst. 0.550 0.461LM Test 6.960 0.011
54
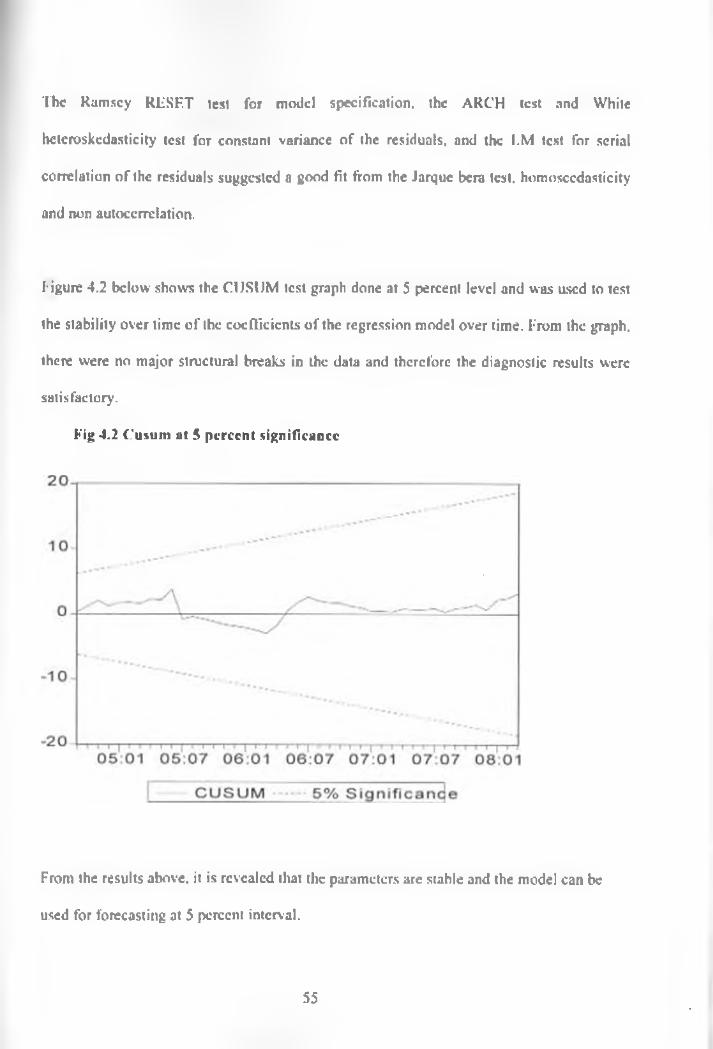
The Ramsey RliSFT lest for model specification, the ARCH test and White
heteroskcdasticity test for constant variance o f the residuals, and the I.M test for serial
correlation o f the residuals suggested a good fit from the Jarque bera test, homosccdasticity
and non autocorrelation.
Figure 4.2 below shows the CIJSIJM test graph done at 5 percent level and was used to test
the stability over time o f the coefficients o f the regression model over time. From the graph,
there were no major structural breaks in the data and therefore the diagnostic results were
satisfactory.
Fig 4.2 Cusum at 5 percent significance
From the results above, it is revealed that the parameters are stable and the model can be
used for forecasting at 5 percent interval.
55
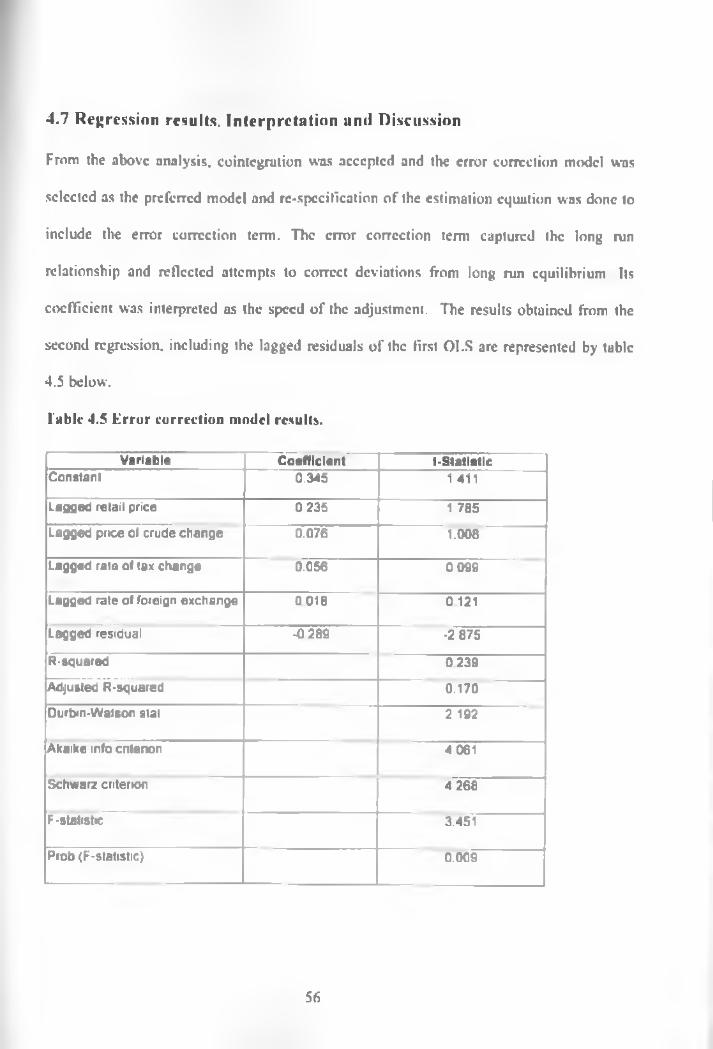
4.7 Regression results. Interpretation anil Discussion
From the above analysis, cointegration was accepted and the error correction model was
selected as the preferred model and rc-spccitication o f the estimation equation was done to
include the error correction term. The error correction term captured the long run
relationship and reflected attempts to correct deviations from long run equilibrium Its
coefficient was interpreted as the speed o f the adjustment. The results obtained from the
second regression, including the lagged residuals o f the first OI.S are represented by table
4.5 below.
fab le 4.5 E rro r correction model results.
Variab lo C o e ffic ie n t t-S ta tls ticConstant 0.345 1 411
Lagged retail price 0235 1 785
Lagged price of crude change 0.076 1.008
Lagged rate of tax change 0.056 0 099
Lagged rate of foreign oxchango 0018 0 121
Lagged residual -0 289 -2 875
R-squared 0239
Adjusted R-squared 0.170Durbin-Watson stat 2 192
Akaike info entenon 4 061
Schwarz criterion 4 268
F-statistic 3.451
Prob(F-statistic) 0.009
56
All variables had the expected signs. From table 4.5 above, the previous period price o f
diesel had a positive sign in the short run. with a one unit change in previous period prices
o f diesel leading to 0.23 changes in the current prices. ITtis implies that current prices have
a memory o f the previous price and one may infer that cost transfers are not complete in
their first period, rhese findings are consistent with Boreinstein (1997), Bacon (1991) and
Bhaskhara (2005).
Changes o f crude oil prices on retail prices o f diesel were positively related with a one unit
change in crude oil resulting to a 0.07 unit change in the retail price o f diesel in tlte short
run. In the long run however, a one unit increase in the price o f crude will lead to 0.36 unit
increase in the retail price o f diesel us shown on table A6 of the long run cointegration
results. This shows that month to month, complete transfer of increases in the prices o f
cnidc oil is not complete and probably is spread over the consequent periods. The findings
arc consistent with Boreinstein (1997), Bacon (1991) and Bhaskhara (2005). Imitira (2006)
and Asplaund (2000).
Tax and retail price of diesel are positively related with a one unit change in taxes leading to
0.056 unit change in the price of retail diesel in the short run. In the long run. a one unit
change in taxes leads to 2.96 unit change in retail price of diesel, indicating a significant
pass through o f taxes to the pump price over and above the actual increase. 1 his shows that
marketers take advantage o f increases o f taxes to pass through other cost to the pump price
57
Foreign exchange is positively related to the price o f retail diesel with a one unit increase in
the rate o f foreign exchange leading to 0.018 unit change in the retail price o f diesel in the
short run. In the long run. a one unit change in the rate o f foreign exchange will lead to a
0.52 unit change in the retail price o f diesel.
From table 4.5, the adjusted R ' is 17 percent implying crude oil prices, foreign exchange
rates and level o f taxation, significantly influence the retail price o f automotive diesel. This
means that 17 percent of the changes in the retail price o f diesel can be explained by
changes in the lugged retail prices o f diesel in the previous period, crude oil price, foreign
exchange rate and taxes on diesel. The F- statistic was 3.451 and statistically significant at
five percent, implying if combined together, crude oil prices, foreign exchange rates and
taxes, expluin the retail price o f automotive diesel strongly.
The error correction coefficient had the expected sign, i.c negative with u value o f 0.289.
The negative sign confirms the model will converge to the long run equilibrium and the
speed o f adjustment is represented by the value 0.289. From the study, 28.90 percents o f the
shocks are adjusted within the first month. Ihis confirms the hypothesis o f transmission of
cost to the retail prices o f diesel.
Ihe t-statistie arc 1.411, 1.785. 1.008.0.099 and 0.121 for constant, lagged variable o f retail
price, crude price, tax rate and foreign exchange respectively meaning the variables arc
significant for the model. I he F-statistic measures the overall significance of the regression
used and tlie value 3.451 shows that the equation has the validity in fitting the data.
58

The probability o f 0.009 shows that out o f 100 variables, there is a chance that 9 will be
zero, therefore rejecting null hypothesis that all the regression coefficients arc zero.
Durbin Watson statistic is 2.192. which is closer to 2. confirming that there is no serial
correlation between the coefficients. The akaike information criterion has a value o f 4.061,
satisfying the criterion for a measure o f goodness o f fit of an estimate statistical model,
same as the Schwarz criterion with a low value o f 4.268.
From the above analysis, it was established that pump price o f diesel is determined not
only by the current price, but also the previous periods prices o f crude oil. exchange rates
and prevailing taxation regime. The relationship between the pump prices is positively
related to crude oil. tax und foreign exchange. The price adjustment process is at less than
30 percent per period, implying minimal competition between the oil marketers in terms of
pricing, a dominant characteristic in an oligopolistic market.
High diesel prices present negative welfare implications because o f its high importance in
manufacturing and transport sectors. The high petroleum prices causes cascading effects to
the productive sectors o f the economy because it is a critical input in the productive process.
Kenya depends fully on imports for its petroleum needs. Out o f the white products
consumed in the country, 56 percent is automotive diesel. The high import bill presents a
balance o f payment challenges to the country and makes the local prices highly dependent
on international crude oil cost. With the transport sector being the biggest consumer of
diesel in the country, the on going mechanization o f agriculture and lack of alternative
59
power generations mean more diesel powered generators will he required further
constraining the demand o f diesel in the country.
I he revenue the government collects from petroleum products is very significant. Taxation
policies in place affect the pump price and this is cascaded to the other productive sectors
dependent on diesel. Government o f Kenya uses taxation to influence demand and supply
with a strict licensing and regulation procedures in place to control and encourage local
participation in the petroleum industry.
The government of Kenya policy o f deregulation is highly dependent on the macro
economic stability with low inflation rates and stable foreign exchange rates. Deregulation
without a framework to encourage competition will only lead to substitution from state
monopoly to oligopolistic competition as affirmed by Imitiru (2006) and Nyioke e l al
( 1994) Herfindhal-llirshman index results.
In conclusion, government plays a significant role in the importation, processing and
distribution with a 50 percent ownership o f the refinery and 100 percent ownership of the
pipeline. Importantly, it is the government responsibility to maintain a conducive
macroeconomic environment where competition thrives, inflation is low and foreign
exchange rates are stable.
60
CHAPTER FIVE
SUMMARY, CONCLUSIONS AND POLICY IMPLICATIONS
5. 1 SummaryPersistent increases in pump prices have led to increases in the cost ol' living and
infiationary pressure m the Kenyan economy. This study was motivated by lack of current
specific literature on the determinants of diesel prices in Kenya. 1 here was need to establish
the relationship between the pump prices o f diesel and the input cost components o f crude
oil, tax and foreign exchange. The study had three specific objectives, establish the
determinants o f the light diesel prices in Kenya, examine the relationship between the retail
prices and crude oil price, foreign exchange rates and taxes on Diesel and make appropriate
policy recommendations.
The study provides evidence o f empirical relationship between the pump prices of
automotive diesel and the price o f crude oil. foreign exchange rates and taxes on diesel. The
study used monthly data for a period o f 62 months for the period between January 2003 and
March 2008. fhe data was sourced front the Kenya national bureau o f statistics leading
economic indicators published monthly. The study used Angle Granger two step error
correction methodology as adopted by Bhaskara in his study of Fiji gasoline prices. Unit
root tests were performed with the objective o f ensuring non spurious results.
61
5.2 Conclusions
The results from the study showed that retail prices o f automotive light diesel was
significantly influenced by the previous periods prices, international crude oil prices,
government taxes on diesel and foreign exchange o f the US dollar to the Kenya shilling.
The short term model showed that the speed o f adjustment in the case of changes in the
price o f crude oil, foreign exchange rates and taxes, was significant with a convergence
tendency to the long-run equilibrium.
From the results, the influence o f crude oil on local prices was found to be positive and
significant. It was found that changes in the foreign exchange rates and taxation rates
significantly changed the retail price o f automotive diesel.
5.3 Policy implications
The results o f this study lead to the following policy recommendations that would entrance
petroleum policy planning, price monitoring and evaluation and petroleum market
development.
Because crude oil is traded in the international market, its demand is such tluit it cannot
influence, in any way, the initial price. The Kenya government should therefore look at
internal factors playing as escalator variables in the crude price determination. Low inflation
and stable exchange are important in price determination mechanism which helps in
reducing price fluctuations and create conducive environment for undertaking long term
62
investment in petroleum industry. The regional integration initiative o f the Fast African
Community or even COMliSA can be used as a vehicle to jointly source und procure crude
oil such that they create a critical volume base whose joint demand is able to attract
discounted prices thereby mitigating the escalating world crude oil prices.
The government o f Kenya should review the law governing competition in the country. The
current law has not been effective in controlling and encouraging competitive conditions in
the petroleum sector. There is an urgent call for repeal of the law to set up institutional
framework to monitor and encourage entry, investment and competition in the petroleum
sector. In particular detection o f anti competition laws, restrictive business practices and
outright monopoly practices should be defined such that litigation and penalty process are
efficient and practical. It is time a national energy policy document is produced to set the
guidelines for development and regulation o f the petroleum sector. The government should
implement policies that make it easier for investors to enter the petroleum industry by
removing existing entry barriers like minimum processing quantities, dead stock quantities.
70-30 rule and eliminate expensive hospitality charges by owners o f loading facilities in
Mombasa and Nairobi. Importantly, the national oil corporation should further be
strengthened to be an active participant not only in the marketing but also in availing joint
loading facilities to the smaller local oil marketers.
Other than using taxation to increase its revenue, the government should further pursue the
equity objective by shitting the lower income groups from biomass fuel to kerosene and
FPG by encouraging investment in the petroleum sector in the rural areas. The government
63
should extend tax incentive to the oil marketers to venture into rural ureas o f l l > ^ . country.
lliis is because as stated in section 1.1.3 o f this study, most o f the investment is __- en tered in
urban areas and as such little or no competition is encountered in those a re a & crcal' nB
equivalents o f geographical monopolies where only one supplier exists. To this ■«»» , prudent
use o f the Petroleum Development Levy (PDL). which was introduced in 1901, -should be
seen to perpetuate development in the petroleum sector especially in d i s t r i h ^ ^ ^ d io n anc*
marketing o f the petroleum products.
The government should pursue local search for petroleum substitutes to crude o i I imports
with increased investment, not only to crude oil explorations, but also blend o p t ^ ^ *ons vvilh
ethanol gasoline blend ratios o f 9:1, globally called the K-IO; offering the .AiJar cane
producing farmers expanded markets and supporting agro-industries. This wi l * ^ release
significant foreign exchange earning for competing use. Brazil, a developing e c o n e y like
Kenya has recorded enormous success in this Etlumol field. Further more, with t |)e ^ . .«-• limited
potential for hydro-power, alternate sources o f power should be pursued. Coal been
known world over as a cheap source o f power and the government should increase ^ funding
towards its exploration. Further more, the government should support investm ent. 3 ' n
biofuel global initiative and take advantage o f the country's potential to grow- Jatr<. an
important producer o f biofuel.
M
5.4 I.imitiitiuns of the study and areas of further research
The study used published data by Kenya Bureau o f Statistics which may have contained
weaknesses o f price averaging and collection defects. The study only used the variables
crude oil. foreign exchange and taxes, as the possible determinants o f pump prices while in
actual world, many oilier variables play a role in the price making mechanism.
A study incorporating all the major products diesel, gasoline, kerosene and fuel oil would be
ideal as the cost allocation at refinery level determines the input cost presented to the
market. Inclusion o f symmetry and asymmetry characteristics would shed more light in the
local feathers and rockets scenario.
65
References
Africa Development Hank Group, (2006), High oil prices and the African Economy; Concept
paper prepared for the AGM. Burkina Faso
Asplund M., R Eriksson and R. Friberg (2000), “Price Adjustment by a Gasoline Rclnil
Chain." Scandinavian Journal o f Economics, 102(1). 101-/21
Bacon R.W.. (1991), Rockets and Feathers: The Asymmetric Speed of Adjustment of U K
Retail Gasoline Prices to Cost Changes. Energy Economies. XIII211-2IS
Bhaskara B. R.. and Gyaneshwar R.(2005), Crude Oil and Gasoline Prices in Fiji: Is the
relationship Asymmetric? The University of South Pacific, EconWPA microeconomic
series no 0510004
Borenstein S.. A. C. Cameron and R. Gilbert (1997), Do Gasoline Prices Respond
Asymmetrically to Crude Oil Price Changes? Quarterly Journal o f Economics. 112.
305-339
Borenstein, S. and Shepard, A. (2000). Sticky Prices, Inventories and Market Power in
Wholesale Gasoline Markets. National Bureau of Economic Research. Working Paper
No. 037
Dcl.ucia and associates. Inc., (1990). Energy Pricing. An issue of importance for Sector and
non sector specialist; Perspectives. Discussion, and Policy reform cases. Office of
Energy . Bureau of Science and Technology. USAID
Energy Information Administration of the United States (EIA). 2005, Energy balances of the
OECD Countries and the non OECD Countries.
Grant R M., (1982). Pricing Behaviour in UK Wholesale Market for Petrol: A Structure
Conduct Analysis, The Journal o f Industrial Economics. Vol 30 No.3, 271-292
Gujarati. D., (1999), Essentials o f Econometrics. New Delhi. MeGraw Hill International.Second Edition.
Engle. R.F and Granger C.W.J (1987), Co-Integration and error correction Representation,
estimation and testing. Economeirica. 55. 251-76
Hearts and Mind (2006); What drives the price of gasoline. Chevron global marketing
publications, 3"' Quarter issue, 2006.pp 5-9.
Karrenbroek. J.D (1991). I he behaviour of Retail Gasoline Prices: Symmetric or Not? Federal
Reserve Bank o f Si l.uis 73. 19-29
Karckcri Stephen cl al (1996). Petroleum marketing in Africa: Issues in pricing, taxation and
investment. AEREPREN
66
Kimuyu, P.K (1988), Demand for Commercial Energy in Kenya; 1963-1985, A structural
investigation, PHD T hesis, University of Nairobi.
Kiptui. I..K (2006); Exchange rates pass through to domestic prices in Kenya, 1972*2004
MA thesis, University of Nairobi
International Energy Agency. (IEA) (2004), Analysis of the Impact o f High Oil Prices on the
Global Economy. May 2004
International Monetary Fund, (IMF) 2000, The impact of Higher Oil Prices on the Global
Economy. IMP research department. December 2000.
Imitira, K. J (2006) Sticky Prices and Market Power in Gasoline Market in Nairobi
MA thesis. University of Nairobi
Indetie , L , (2002) “Emergence of Independent Petroleum Dealers in Kenya
Institute of Public Analysis and Research. (IPAR) Special Report Series.
l ittle A D.. (1993), Petroleum Market Structure and Pricing Study for Kenya
Mcchco. J. Omiti. J. (2002) Petroleum Market Structure and Pricing following Deregulation.
Institute of Policy Analysis and Research. (IPAR). Discussion Papers.
Ndungu. N, (1996); Price and exchange rnlc dynamics in Kenya, empirical investigations 1970-
1993. AERC Research papers series. No 58
Republic of Kenya, (2003-2008). Leading economic indicators, various issues.
Government printers.
Republic of Kenya. (2003-2008) Economic surveys, various issues. Government printers.
Stem. D.I; CTevcrland. C. J (2004) Energy and Economic Growth Rensselaer Working Papers
in Economics 0410.
Okccli B.A and P M Nyoike, (1996), Finance and Markets in the petroleum Sub sector:
Conceptual and policy issues. AEREI’REM working paper No 146 Nairobi
Senga, W; Manundu. H W; Manundu M (1980) Assessment of commercial energy supply and
demand in Kenya; Institute of development studies. University of Nairobi
Schloss, M (1992) Docs petroleum trade matter? Policies to secure and rationalize oil supplies
in sub Saharan Africa. World Dank report
Yc M., J. /yren. J. Shore, and M. Burdette, (2005). "Regional Comparisons, Spatial
Aggregation, And Asymmetry of Price Pass-through in U.S. Gasoline Markets,”
Adanlic Economic Journal, 33, 179-192
67
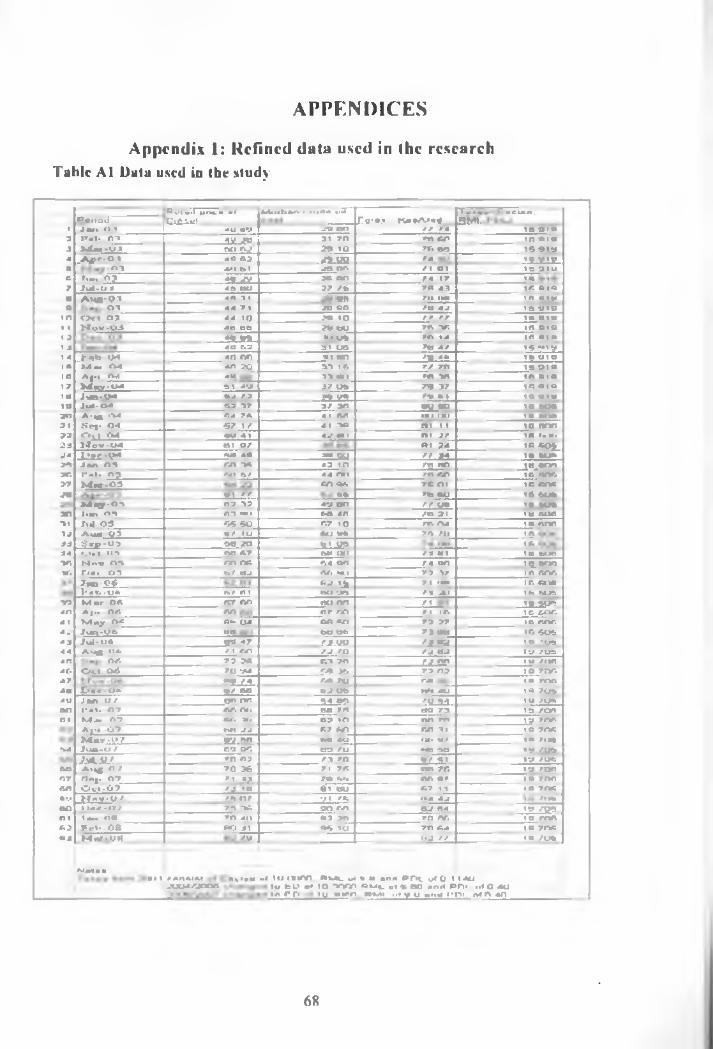
APPENDICES
Appendix 1: Refined data used in the researchTable A1 Data used in the study
PgftodH v t J p n c . «< t2l£2L«t
MultlkA . 111114 «»4ro -v , KbWJUS
T acUv.n u fi
1ft 3191 J - i - n i 40 ov - 'J no 77 743J
!*>». n i AV 3B 31 70 rr. r4i in 0 1 aM — OJ oo n j » IO »•'. 66 15919
4ftr.y•o
.A pr-O I 4 0 A? . r t .u a 74 y».v»g03 *•• b l rfft or. 71 Ol 1ft 910
»—i o? •*6 w rr. no r . it ini J - 0 5 4ft no 3 7 /6 7ft 43 1ft Q1<1
A M -91 4ft *11 ns '•* • - 1ft U1\lO l 44 >1 -rtl Oft /O 4-- '5 9'®
in 11 1 2 i j1 41 ft
<>C» O? 44 IQ ■•n tO r r , r in o ioN * » -0 3 40 Oft ?6 60 rr. ift 1ft 916
iSJBL. »■ V» r n «4 Ift ■(«40 S.3 31 US >6 4 / 16 *.i-3
J- * 1 6 «>* 40 gri *• *n 7f» 4ft 1 . 610.A*. <v1 40 JO 31 If. 77 70 13 OIO
to17in19
Aj.» 0-1 4U 3*1 Mil .« V. IO ■(«N t.y -o a ________ fti 4y 3? 06 7? J7 1ft 91 aJ . m - V * • 4 77 »6 V* '• 7 * 1 - 16 010Jval-04 S3 37 37 3ft W3 60 _________'6 .603
7n71772 *•>*3S3T.>7
a*
m!M3733
A-.* .X ft4 7ft 4 1 Ml •«> •«> .« mm?•>,. 04 *? i / 41 7Q m i l in nnn0 .1 04 " O 4•* «*• m 37 in . . h.lJfov-O4 Ol 07 n i 24 in 60J_
J2 * a d t« '« * « ~ S Q ______" f T 1 0 tu cJ«n O l no >6 4 3 in ,o r r _10_503!'•». OJ 'a t •>/ 44 nri 7 0 r r \ ir. 74ir.
M — 05 ftn *>s 7ft Ol ir. m ft
_________ “ • / , 6 . ,6 CO 16 606»vt«y-oi «2 37 49 OO r r v * 16 603IlM Oft 0*1 ••• r-ft 4ft ,o ,1 1 0 softr>.i 03 rA 60 ft7 10 rr. 04 i r. r.nnA « O S * ' IU « J *7* 70 ,0 IA
g « p -o > 90 30 e i V9 *6J4 OM t»ft on 7.7 ftt* (Ml / J u> IO ftOftnr.■Wi
M..v n i on nr. 7,4 Oft f 4 Oft 'i^nrmr>»i 07 6 / O.- ft7i ati 73 V in nepfi7w»-0» 63 1J[ 7 1 IM ir. rr-jni'«b.OA a / n i bU 9ft 7 3 .XI If? ftOft
394 n41 4- 4 J 44
M »r-0« « r nn " 'i on J 1 >• « *A | •• Oft on n r no 7 1 If. ir. softM ny - Oft Al. 04 Ml ftO 73 37 ir. ro/*.Jv».yc»___________ “» w Oft T3 «> •0 606Jul-O* *»'J 4 r !*3.W 'y «rf 19 713%a s«e or. 7 1 fO / J 7n , 4 OJ 19./US
404f.47404Van
or. 7 7 3« r o 7ft ___________u .™ 1 0 ,imO n M ro -_»4 5*. * . 73 03 19 7 Oft
“ V-Ci. AO 70 f4 19 700£»•« -Oft O, oo o-i Oft W 40 19 706J«n o r nr. nr. M 0fl iUJUL '» ' V *!'•». 07 f7. n». SO 7ft 0*7 73 19 70S
Ol
•*4
K4.»« 07 74*. «». r.3 in nn rn 19 7 nr.A|»* -0"7 ^ -r-r 07 60 on 1 1 19 7 OftM .r-M 7 SV .rr Ml 4*J 14. u / 14 ,I4>Jun-O / c ’j or. 0*3 70 **> ftO 16 ,0 6J4 ..U 2 70 07 „ ,n U, 61 iy /oo
on Ay* O / 70 36 71 7ft r r r r . 19 7 Oftr.r6a*'.»oo
rtup 0 7 7 1 ftl r n .... rr . u i 19 7000 v i-0 7 / J 1 0 6 ’ oo A? 11 IO 7OftH - y - V ' . 7̂ j n r if! /r* . . 4 4 j /!»♦»l>«r.-ty/ 7r. *v; OO 771 03 S4 1'3 703
Ol62UM
»•.. on 70 40 • 7 70 rn nr. IU TOO»=-l.-©8 **:■ »i a s .<j 70 A4 IO 7Oft> 4 w W ,o «.j 7 7 in ,0 6
Nm ■ ■m« iij »«mn. k m c wtb u «nrt PCX. vfO i 1 4 U _______________|
AW4/*J005 tv t=L» of IO TfW> r/M t vt^OO an/l POt .dO 4Uto rr» iu anon . P ftQ ..r9 o «f»4 i*o i M f \ 40
68
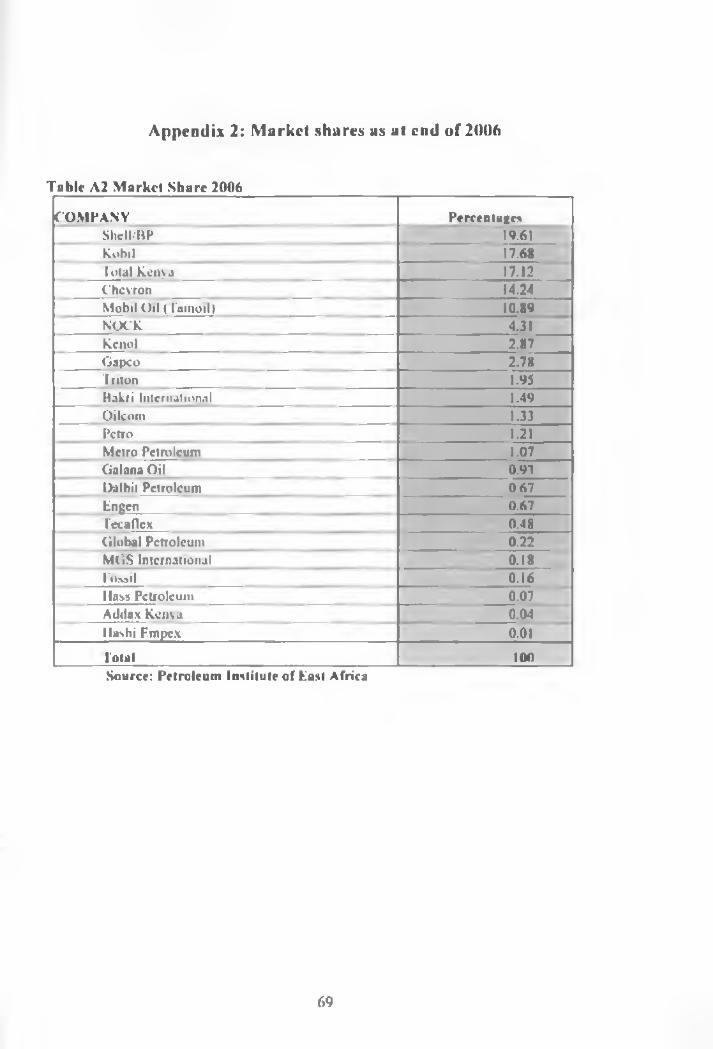
Appendix 2: Market sh a res as at end o f 2006
Table A2 M arket Share 2006
COMPANY PercentagesShell/BP 19.61Kobil 17.68Total Kenya 17.12Chevron 14.24Mobil Oil (Tamoil) 10.89NOCK 4.31Kenoi 2.87Gapco 2.78Triton 1.95Bakri International 1.49Oilcom 1.33Petro 1.21Metro Petroleum 1.07Galana Oil 0.93Dalbit Petroleum 067fcngen_ 0.67Tecadex 0.48Cilobal Petroleum 0.22MGS International 0.18Fossil 0.16Hass Petroleum 0.07Adilax Kenya 0.041 lashi Lmpex 0.01Total 100Source: Petroleum Institute of Past Africa
69
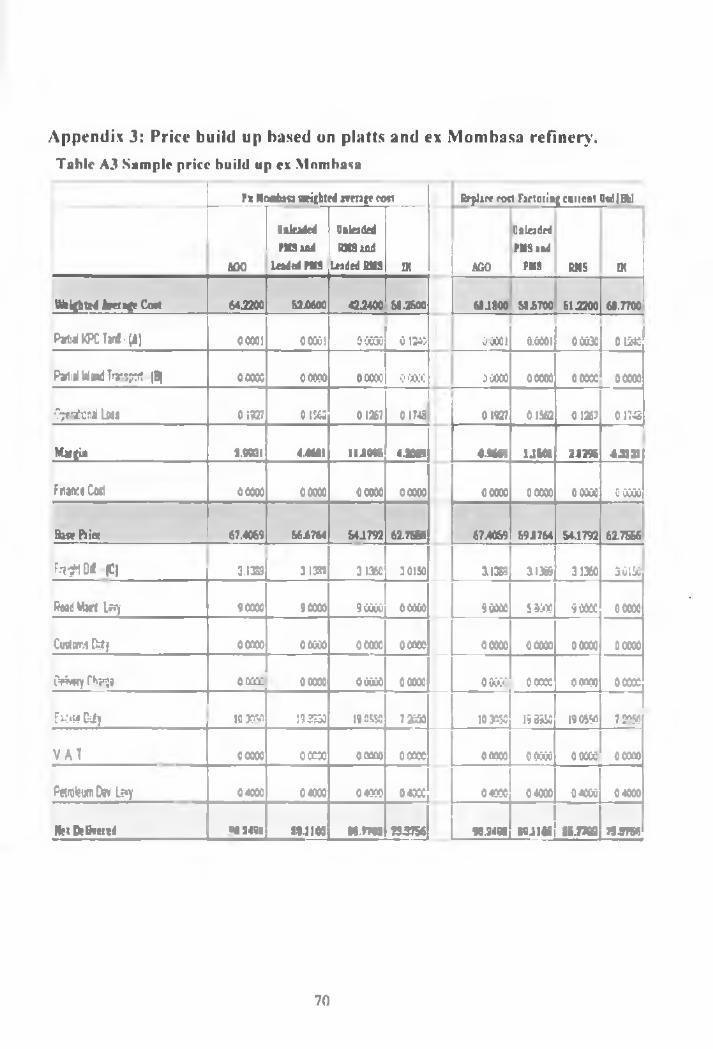
Appendix 3: Price build up based un platts and ex Mombasa refiner)'.Tabic A3 Sample price build up cx Mombasa
P x N o o b a o w e iy h te d i T n a j e c o s t R ep lace r o s t F a r t o t i n j c u i i e o t O sd lB b l
O a lr a d td U n lead ed U Q lttd rd
P U S a n d R M S a a d P M S a a d
AGO L ead ed P U S le a d e d SM S IK AGO PMS RMS IX
W e t t e d h a i f e C o r t 6 4 2 2 0 0 6 2 .0 6 0 0 4 2 2 4 0 0 S8.2SOO 6 I J 8 O 0 S I 6 7 0 0 S I 2 2 0 0 6 1 .7 7 0 0
P * t i j l K P C T » r t l - ( ! ) OCOOl 0 0 0 0 1 0 0 0 3 0 0 1 M > 0 0 0 0 1 0.0001 0 0 0 3 3 0 1 2 4 0
Partial W ard T ra r sp tt t (B) o o o o o o o o o o OOOOO OOOOO o o o o o o o o o o OOOOO OCCOO
OperaCionsI L oss 0 1 9 2 7 0 1 5 6 3 0 1 2 6 7 0 1 7 4 8 0 1 9 2 7 0 1 5 6 2 0 1 2 6 7 0 1 ? «
M a r g i i 2 .9 9 3 I 4 .4 6 0 1 1 1 .1 0 % 4 .2 0 6 9 0 .9 6 6 9 1 J M 1 2 -1 2 9 6 6 2 1 3 1
Fr.ar» :e Co*t o « x » 0 0 0 0 5 o o o o o 0 0 0 0 3 o o o o o 0 0 3 0 0 o o o o o 0 OCOOj
B i « P tic c 6 7 .4 0 6 9 S 6 6 7 6 4 S 4 J 7 9 2 6 2 .7 5 S 6 6 7 .4 0 6 9 S 9 J 7 6 4 S 4 .1 7 9 2 6 2 .7 S S 6
F m g M O lf |C ) 3.1369 3 1 3 8 9 3 1 3 5 0 3 0 1 5 0 3 1 3 6 9 3 1 3 8 9 3 1 3 6 0 3 0 1 5 0
R ead M a r t Levy 9 0 0 0 0 9 0 0 0 0 9 0 0 0 0 0 0 0 0 3 9 0 0 0 3 S 9000 s o c c c o o c c o
C u sJa r.1 D t t f 0CCO3 o o o » o c c o o OOOOO OOOOO 0 0 3 0 3 o c c o o 30CO3
O riw ry C barje 0 0 0 0 0 o o c c c o o o o o OOOOO o o o o o o o o o o o c c o o OOOCC
E ic is a Duty 1 0 X 6 0 198950 190550 7 2 3 5 0 10 3050 196950 1 90650 7 2050
V A T o o o o o o o o o o OOOOO o o o o o 0 oooo o o o o o o o o c c OCCOO
Petro leum D w Le*y 0 4 ( 0 0 0 4 X 0 0 4 0 0 3 0 4 3 X 0 4 0 3 0 0 4 0 0 3 0 4 0 0 0 0 4 0 0 0
N e t D r l iv e te d 0 0 2 4 9 S * 9 .1 1 0 0 IS .7 7 0 2 7 3 2 7 5 6 9 0 .2 4 9 * * 9 .1 1 0 3 I S .7 7 0 2 7 3 2 7 5 6
70
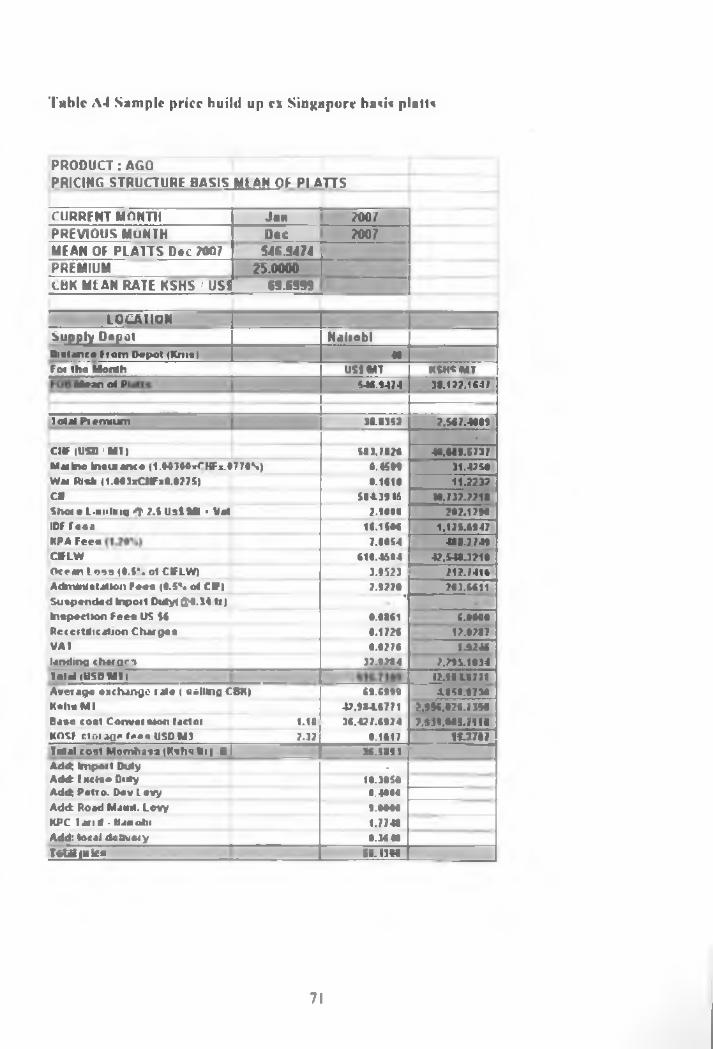
Table A4 Sample price build up ex Singapore basis plaits
PR O D U C T : AGO
PRICING STRUCTURE BASIS M I AN OF PI ATTS
CURRENT MONTI! Jan 7007PREVIOUS MONTH Doc ?007MEAN OF PLATTS Dee ?007 546.9474PREMIUM 25.0000 LCBK MEAN RATE KSHS / USS 69.6999
LOCATIONS u p p ly D o p o l N a iio b lDistance fro m Dopol <Km«) 40For the Month US1MT KSHS MT
Moan of Pi ___________ 540.5474 3I.177.104/
to ta l Prem ium 36.015? 7.50 7.4005-
C l* (USO 'M i l 603.7070 40.605.5737Marino Insurance (1.00100xCNFx.0770N) 0 .B M 31.4750War Risk 11.003x0**0.02751 0.1010 11.7737c * 504.3545 IO.737.771lShot e L .xi.ln.u .J* 2.5 U e l M t • Vat 7.5000 207.1756io r r o o t 10.1500 1,175.6547KPA Fees 7.0054 400.7 749Clf-LW (10.4504 47,540.3210Ocean Loss |0.5". of C»LW) 3.0523 717.7410A d m W Iili l lo ii Fees <0.5*. of C * | 7.0770 703.0011Suspended Inport Dutyt j f . H ti> *
Inspection Fees US U 0.0101 0.0000Rc<edification Chargee 0.1720 17.0707VAI 0.0270 1.5740landing charges 32.5704 7.795.1034lo ta l (U S D M il 17.51107/1Average exchange rate ( selling CBK| 05.0555 4.050.0710Kelts M l 47,504.6771 2.596.070./ 350Base cost C onversion factor 1.H 30.477.6974 7.515.003.7110KOSF s lo t age fe e s USD M3 7.37 0.1017 1 « W »Total cost Mombasa (Kshs tt i > -B 1 10.5051Add: Im port Duty -A d d rlxc le e Dtity 10.3050Add: Petro. Dev l evy 0.4000Add: Road Mamt. Levy 5.0000KPC la n d - Nairobi 1.7740Add: local delivery 0.30 40I f M i M k e _____________________ 51.1300
71
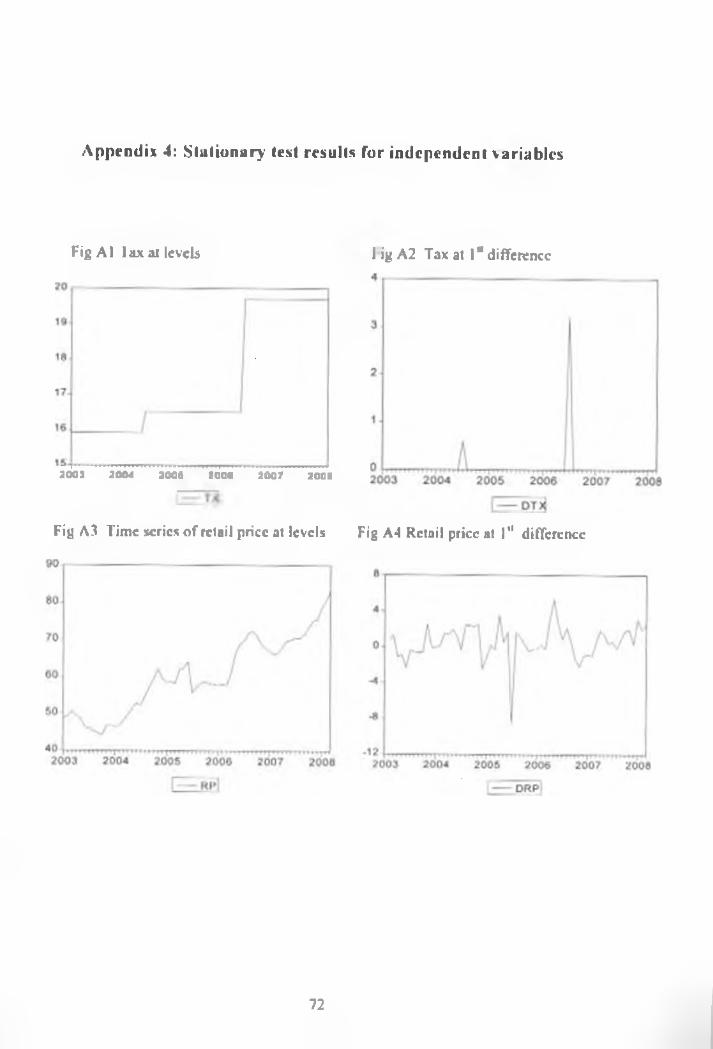
Appendix 4: Stationary test results for independent variables
F igA l lax at levels
2003 2004 2005 2006 2 0 0 ? 2006
Fig A3 Time series o f retail price at levels
l ig A2 Tax at 1“ difference
Fig A4 Retail price at P 1 difference
72
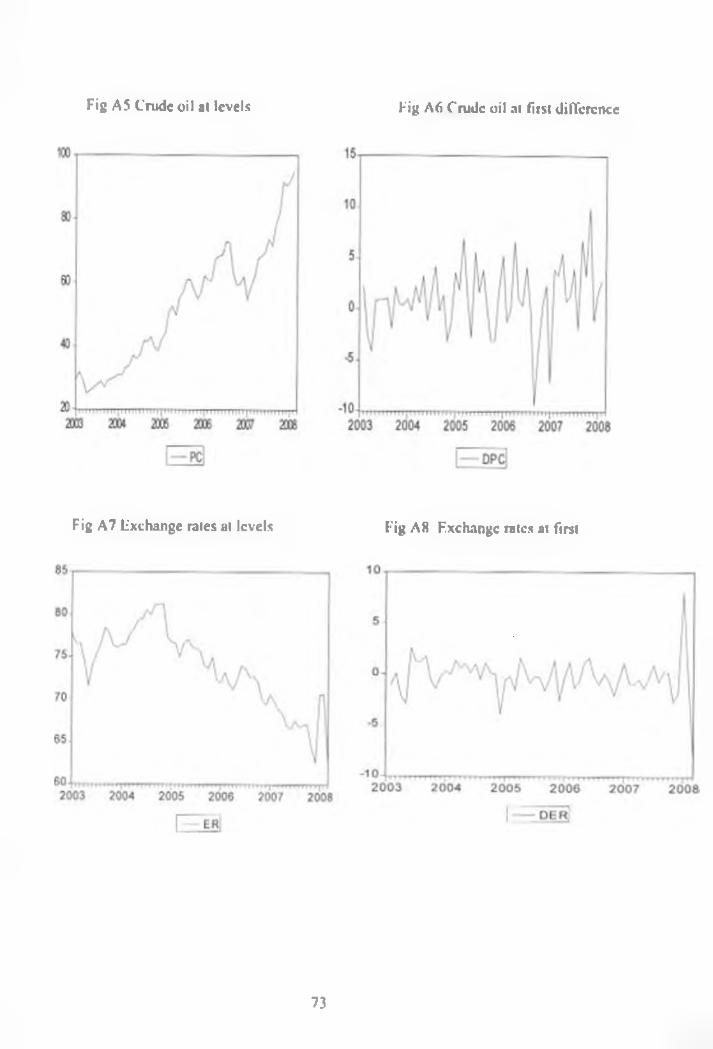
Fig A5 Crude oil at levels Fig A6 Crude oil at first difference
Fig A7 Exchange rates at levels Fig A8 Exchange rates at first
73
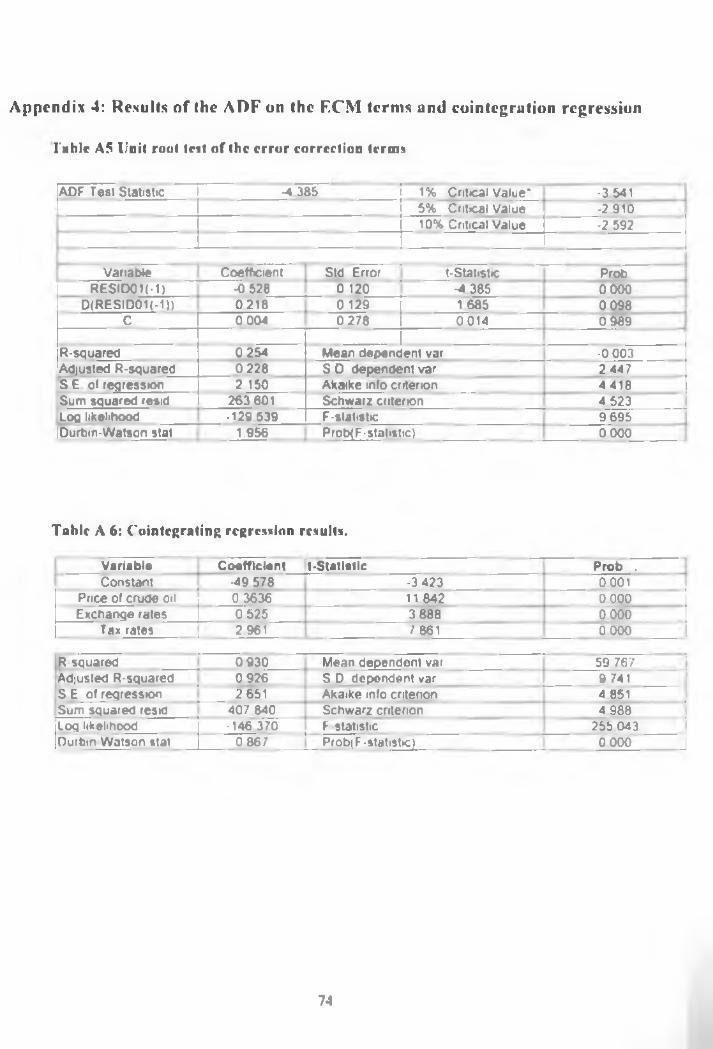
Appendix 4: Results of the A D F on the E C M terms and cointegration regression
Table A5 Unit root test of the error correction terms
ADF Test Statistic I -4.385 I 1% Cnticat Value* -35415% Critical Value -2.91010% Critical Value -2 592
Variable Coefficient Std Error | t-Statistc ProbRESID0H-1) -0 528 0 120 -4 385 0 000
D(RESID01(-1)) 0218 0.129 1 685 0 098C 0 004 0 278 0 014 0 989
R-squared 0254 Mean dependent var -0 003Adjusted R-squared 0.228 S D dependent var 2 447S E of regression 2 150 Akaike info criterion 4418Sum squared resid 263 601 Schwarz criterion 4 523Log likelihood •129 539 F-statistic 9695IDurbin-Watson stat 1.956 Prob^F-statutic) 0 000
Table A 6: Cointegrating regression results.
Variable Coefficient ft-Statistic Prob .Constant -49 578 -3 423 0 001
Price of crude oil 0.3636 11.842 0 000Exchange rates 0 525 3 888 0000
Tax rates 2 961 7 861 0 000
R-squared 0 930 Mean dependent var 59.767Adjusted R-squared 0 926 S D dependent var 9 741S E of regression 2651 Akaike info criterion 4 851Sum squared resid 407 840 Schwarz entenon 4 988Log likelihood -146.370 F-statistic—1 ■ ■ - 255 043Durbin Watson stat 0 867 Prob(F-statistic) 0 000 J
74
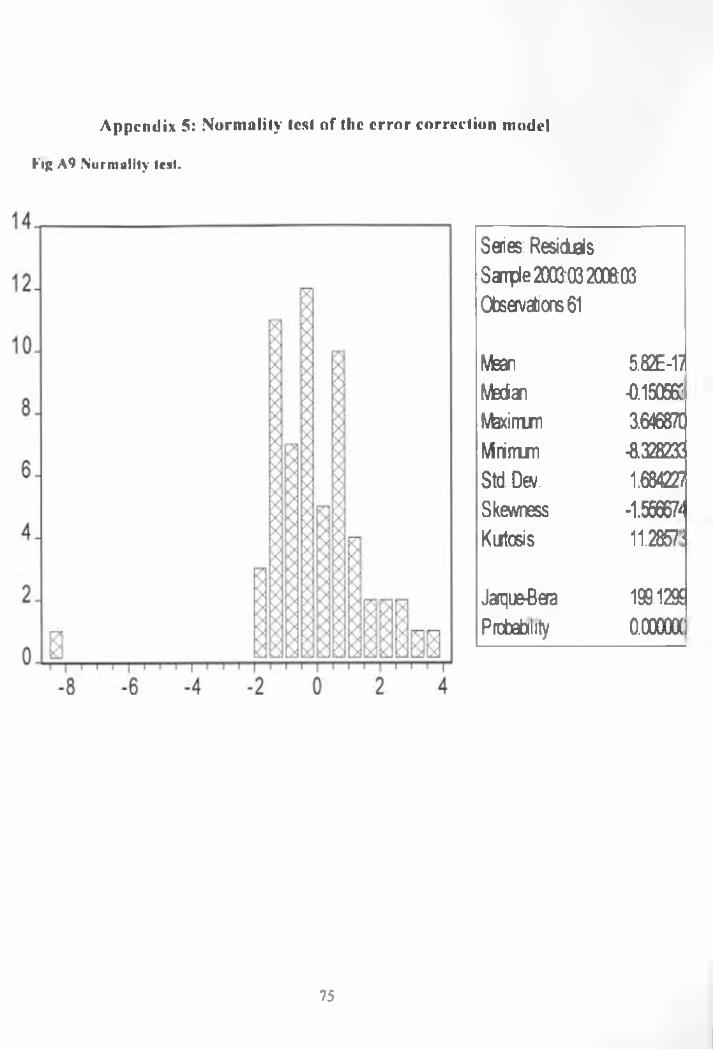
Appendix 5: Normality test of the error correction model
Fir A9 Normality test.
Series: Residuals Sample 2003:03 2008:03 Observations 61
MeanMedianMaximmMrimmStd. Dew.SkewnessKutosis
JarqueBaaProbability
5.82E-17-0.1505623.646870
-8.328233I. 684227
-1.558$
I I . 2857-
199.1295o.oooooc
75
Top Related