


Languages
Pages
Legal


“Safe Harbor” Forward Looking Statements
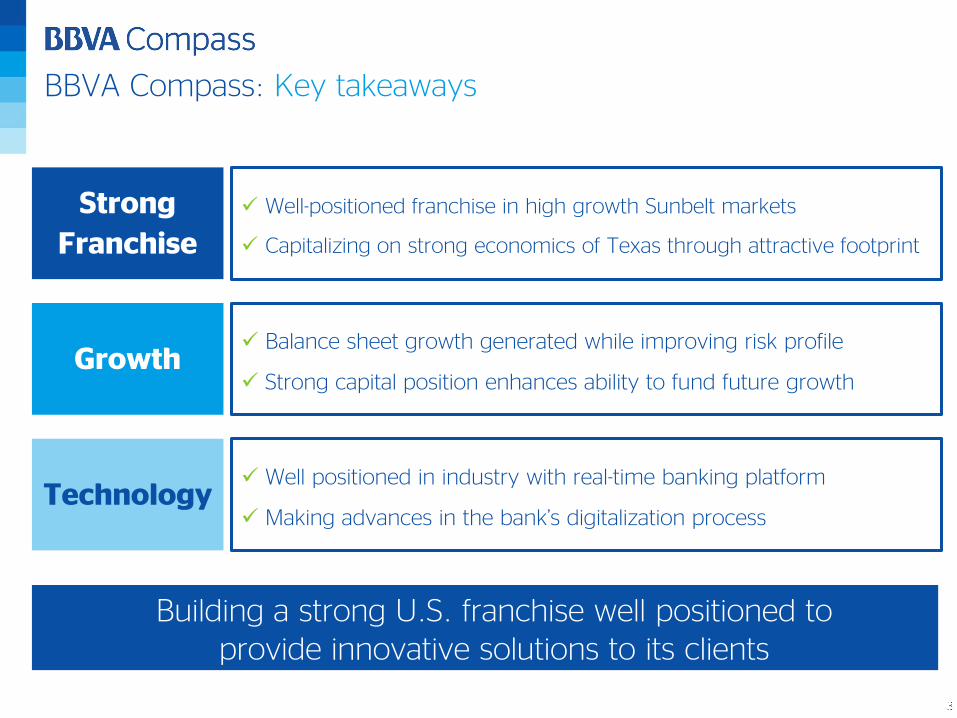
BBVA Compass: Key takeaways
Strong
Franchise
Well-positioned franchise in high growth Sunbelt markets
Capitalizing on strong economics of Texas through attractive footprint
Growth Balance sheet growth generated while improving risk profile
Strong capital position enhances ability to fund future growth
Technology Well positioned in industry with real-time banking platform
Making advances in the bank’s digitalization process
Building a strong U.S. franchise well positioned to provide innovative solutions to its clients
1
Appendix: BBVA and Reconciliations
2 Financial Performance
3Balance Sheet and Funding Profile4
Asset Quality
5 Capital Position
7
Regulation and Ratings
BBVA Compass Overview
6
Sections
BBVA Compass
Overview

BBVA Legacy
BBVA Puerto Rico
1968
BBVA New York
1987
Bancomer Transfer Services
1994
2006 2007 20092005
TodayTexas Leadership in the Sunbelt
BBVA Compass: The culmination of a deliberate strategy…
...to leverage BBVA’s proven customer-centric businessmodel and build a franchise that...
2014

… has resulted in a strong U.S. bank that is well-positioned…
Data as of 2Q14
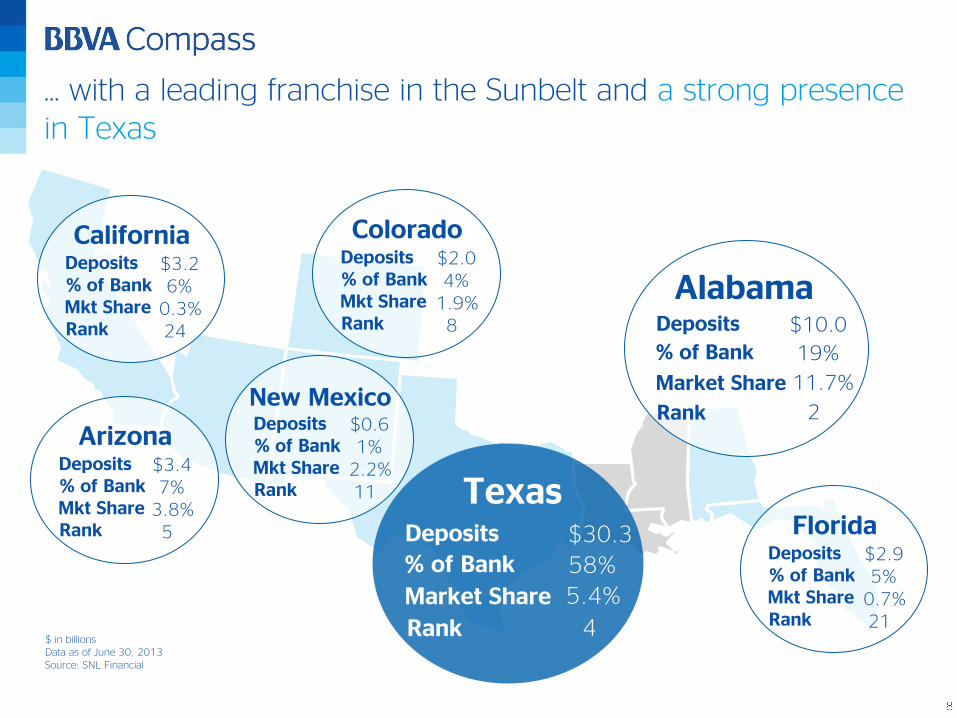
TexasDeposits
% of Bank
Market Share
Rank
$30.3
58%
5.4%
4
AlabamaDeposits
% of Bank
Market Share
Rank
$10.0
19%
11.7%
2
ColoradoDeposits% of BankMkt ShareRank
$2.04%
1.9%8
FloridaDeposits% of BankMkt ShareRank
$2.95%
0.7%21
New MexicoDeposits% of BankMkt ShareRank
$0.61%
2.2%11
ArizonaDeposits% of BankMkt ShareRank
$3.47%
3.8%5
CaliforniaDeposits% of BankMkt ShareRank
$3.26%
0.3%24
… with a leading franchise in the Sunbelt and a strong presence in Texas
$ in billionsData as of June 30, 2013Source: SNL Financial
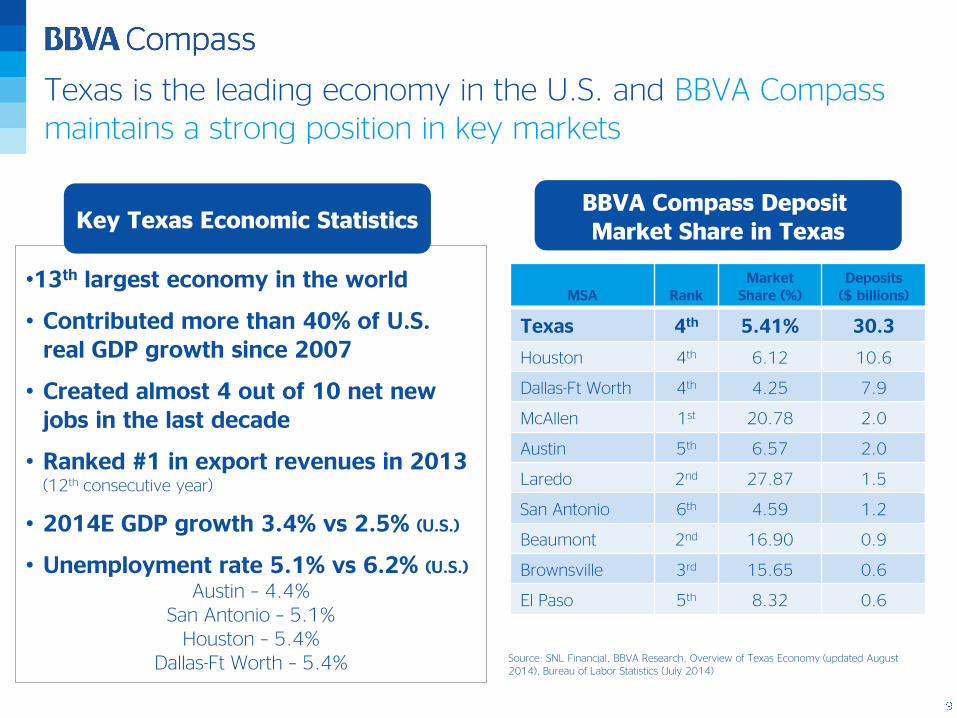
Texas is the leading economy in the U.S. and BBVA Compass maintains a strong position in key markets
BBVA Compass Deposit Market Share in Texas
MSA RankMarket
Share (%)Deposits
($ billions)
Texas 4th 5.41% 30.3
Houston 4th 6.12 10.6
Dallas-Ft Worth 4th 4.25 7.9
McAllen 1st 20.78 2.0
Austin 5th 6.57 2.0
Laredo 2nd 27.87 1.5
San Antonio 6th 4.59 1.2
Beaumont 2nd 16.90 0.9
Brownsville 3rd 15.65 0.6
El Paso 5th 8.32 0.6
Source: SNL Financial, BBVA Research, Overview of Texas Economy (updated August 2014), Bureau of Labor Statistics (July 2014)
•13th largest economy in the world
• Contributed more than 40% of U.S. real GDP growth since 2007
• Created almost 4 out of 10 net new jobs in the last decade
• Ranked #1 in export revenues in 2013 (12th consecutive year)
• 2014E GDP growth 3.4% vs 2.5% (U.S.)
• Unemployment rate 5.1% vs 6.2% (U.S.)
Austin – 4.4%San Antonio – 5.1%
Houston – 5.4%Dallas-Ft Worth – 5.4%
Key Texas Economic Statistics
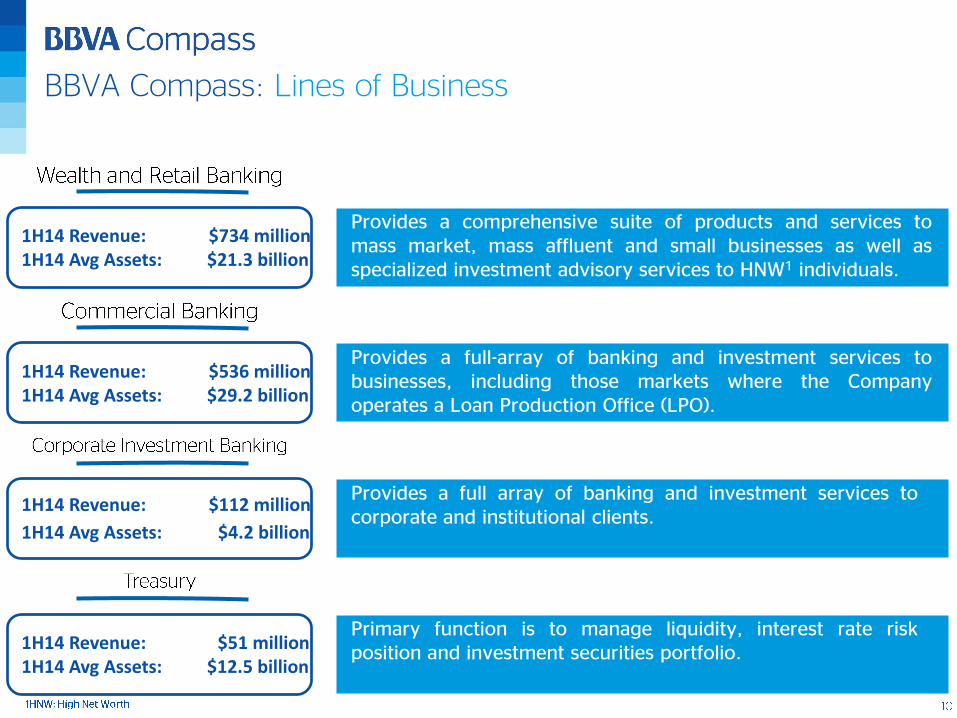
BBVA Compass: Lines of Business
1H14 Revenue: $734 million1H14 Avg Assets: $21.3 billion
Provides a comprehensive suite of products and services tomass market, mass affluent and small businesses as well asspecialized investment advisory services to HNW1 individuals.
1H14 Revenue: $536 million1H14 Avg Assets: $29.2 billion
Provides a full-array of banking and investment services tobusinesses, including those markets where the Companyoperates a Loan Production Office (LPO).
1H14 Revenue: $112 million
1H14 Avg Assets: $4.2 billion
Provides a full array of banking and investment services tocorporate and institutional clients.
1H14 Revenue: $51 million1H14 Avg Assets: $12.5 billion
Primary function is to manage liquidity, interest rate riskposition and investment securities portfolio.
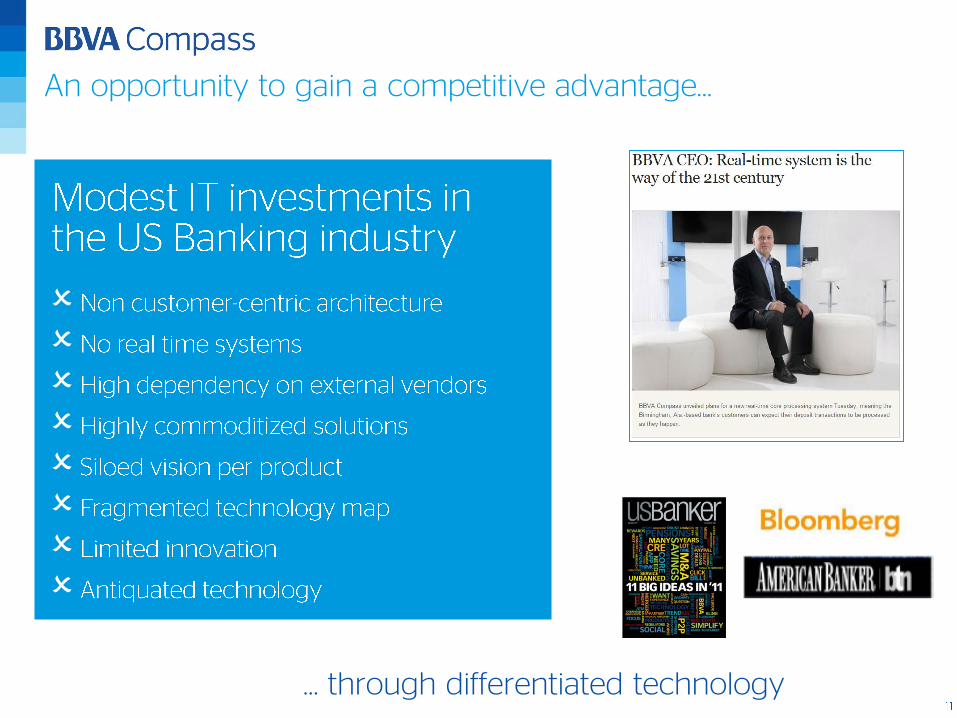
… through differentiated technology
An opportunity to gain a competitive advantage…
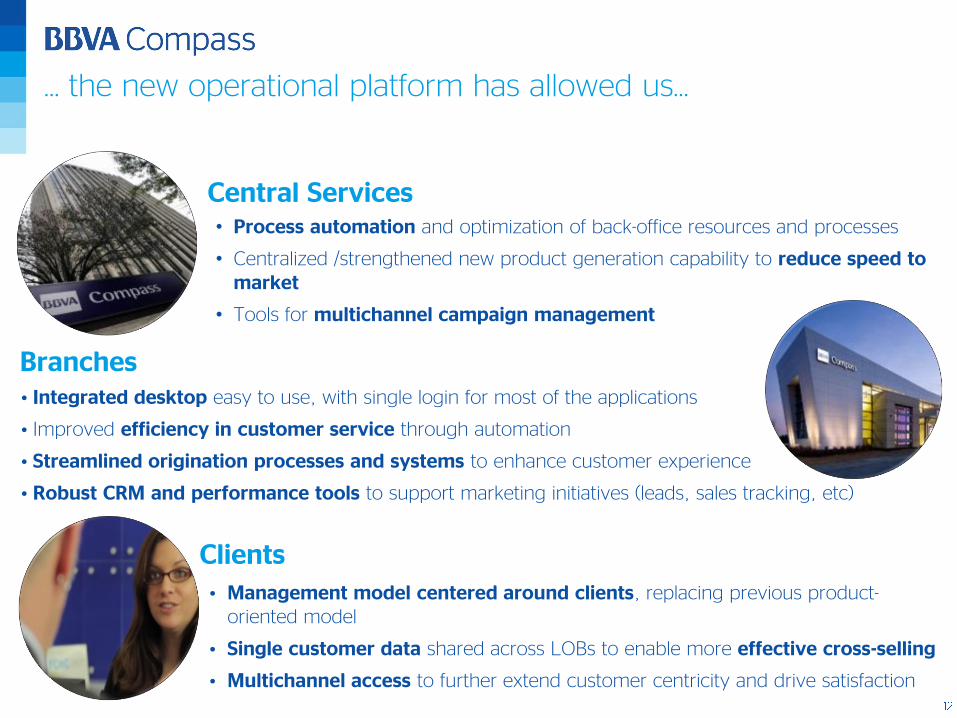
• Process automation and optimization of back-office resources and processes
• Centralized /strengthened new product generation capability to reduce speed to market
• Tools for multichannel campaign management
Central Services
• Integrated desktop easy to use, with single login for most of the applications
• Improved efficiency in customer service through automation
• Streamlined origination processes and systems to enhance customer experience
• Robust CRM and performance tools to support marketing initiatives (leads, sales tracking, etc)
Branches
Clients
• Management model centered around clients, replacing previous product-oriented model
• Single customer data shared across LOBs to enable more effective cross-selling
• Multichannel access to further extend customer centricity and drive satisfaction
… the new operational platform has allowed us…

2013 Best in Mobile Functionality Award in Javelin Strategy & Research's sixth annual Mobile Banking Financial
Institution Scorecard
BBVA Compass offers one of the largest mobile platforms in the U.S.

The acquisition of Simple is part of BBVA’s strategy…

#1 in American Banker’s annual reputation survey
Source: 2014 American Banker/Reputation Institute Survey of Bank Reputations
Financial
Performance
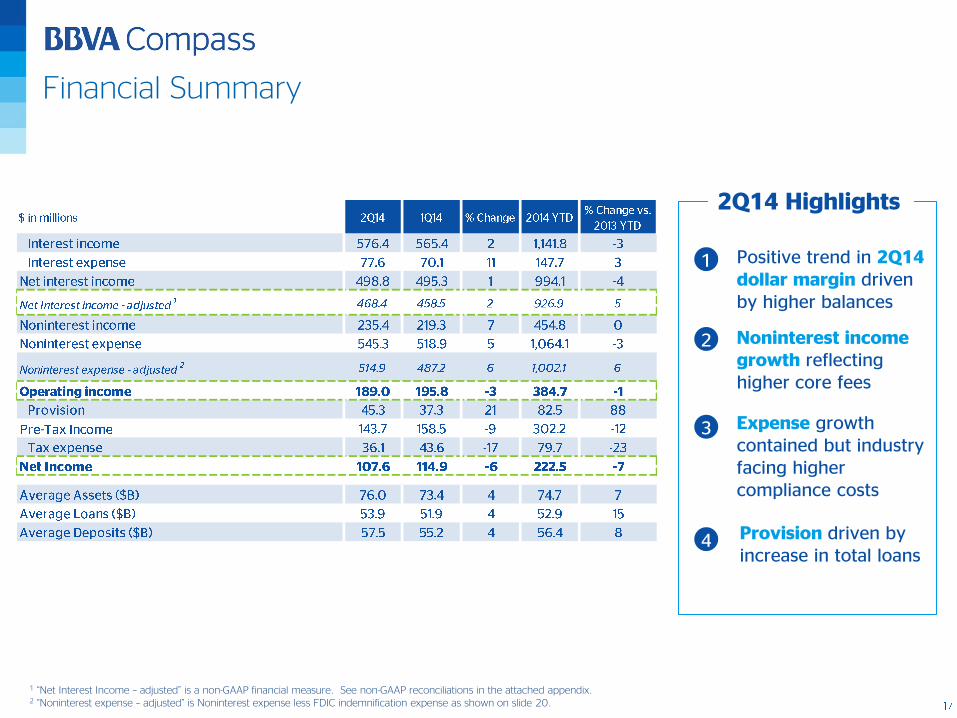
Financial Summary
Positive trend in 2Q14 dollar margin driven by higher balances
Provision driven by increase in total loans
Noninterest income growth reflecting higher core fees
2Q14 Highlights
Expense growth contained but industry facing higher compliance costs
1
2
3
4
1 “Net Interest Income – adjusted” is a non-GAAP financial measure. See non-GAAP reconciliations in the attached appendix. 2 “Noninterest expense – adjusted” is Noninterest expense less FDIC indemnification expense as shown on slide 20.

Stabilizing margin trends excluding Guaranty Bank Impact
Moderating headwind from Guaranty Bank purchased loan portfolio
Percent margin appears to be bottoming
2Q14 Highlights
Adjusted Dollar margin up 5% YTD
1
2
3
Recent margin trends encouraging despite continued pressure
from low rate environment
1
2 Adjusted Margin is a non-GAAP financial measure. See non-GAAP reconciliations in the attached appendix.
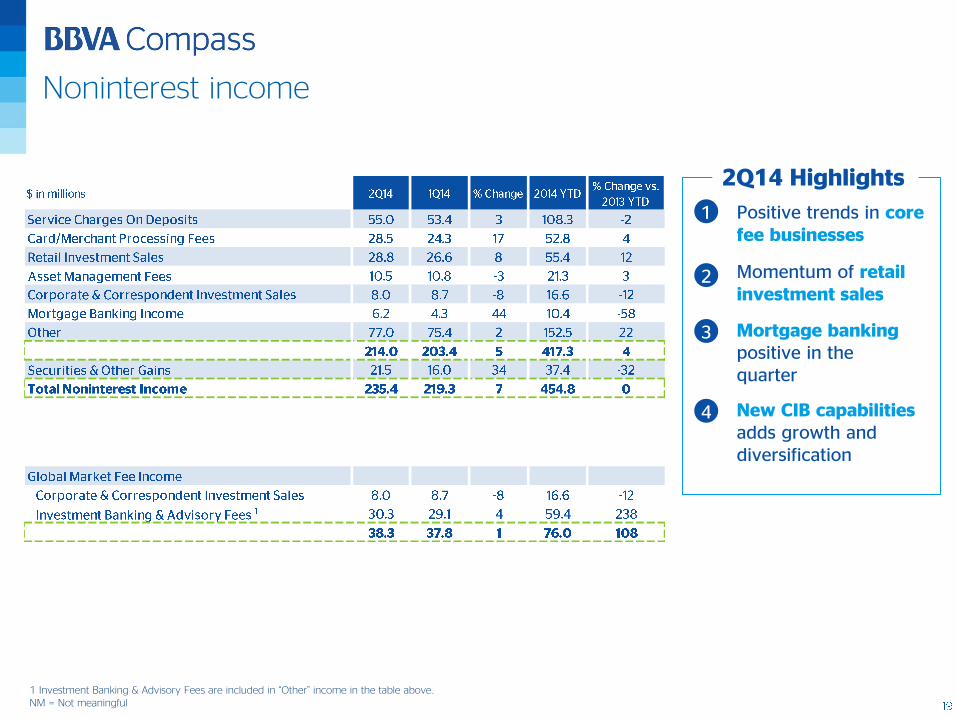
Noninterest income
• Positive trends in core fee businesses
• New CIB capabilitiesadds growth and diversification
• Momentum of retail investment sales
c
2Q14 Highlights
• Mortgage banking positive in the quarter
1 Investment Banking & Advisory Fees are included in “Other” income in the table above.NM = Not meaningful
1
2
3
4
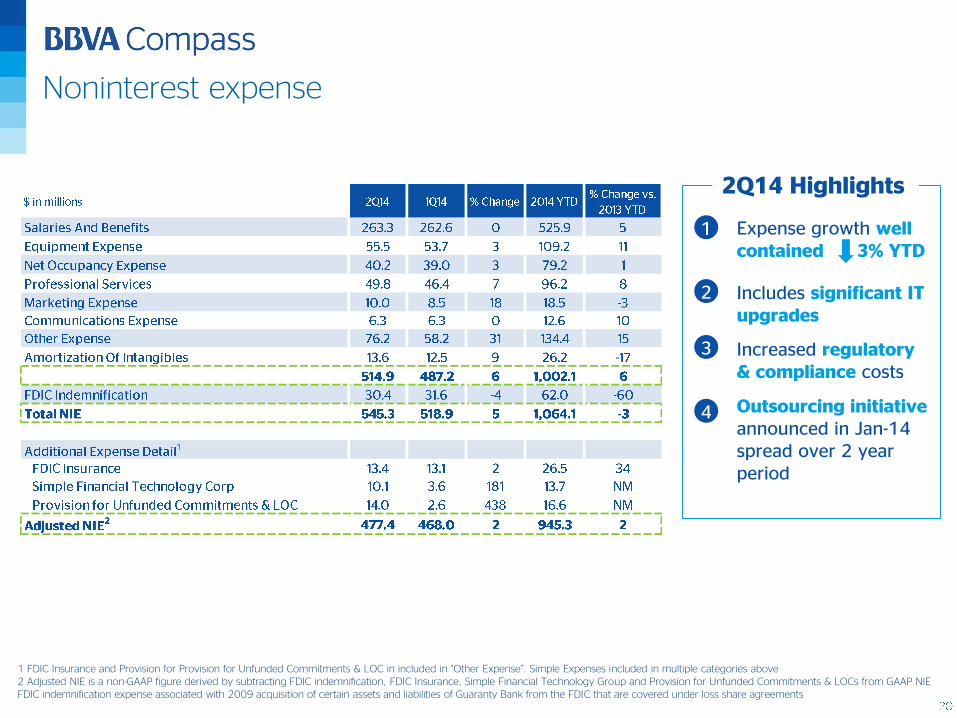
Noninterest expense
• Expense growth well contained 3% YTD
• Outsourcing initiativeannounced in Jan-14 spread over 2 year period
• Includes significant IT upgrades
c
2Q14 Highlights
• Increased regulatory & compliance costs
1 FDIC Insurance and Provision for Provision for Unfunded Commitments & LOC in included in “Other Expense”. Simple Expenses included in multiple categories above2 Adjusted NIE is a non-GAAP figure derived by subtracting FDIC indemnification, FDIC Insurance, Simple Financial Technology Group and Provision for Unfunded Commitments & LOCs from GAAP NIEFDIC indemnification expense associated with 2009 acquisition of certain assets and liabilities of Guaranty Bank from the FDIC that are covered under loss share agreements
1
2
3
4
Asset Quality
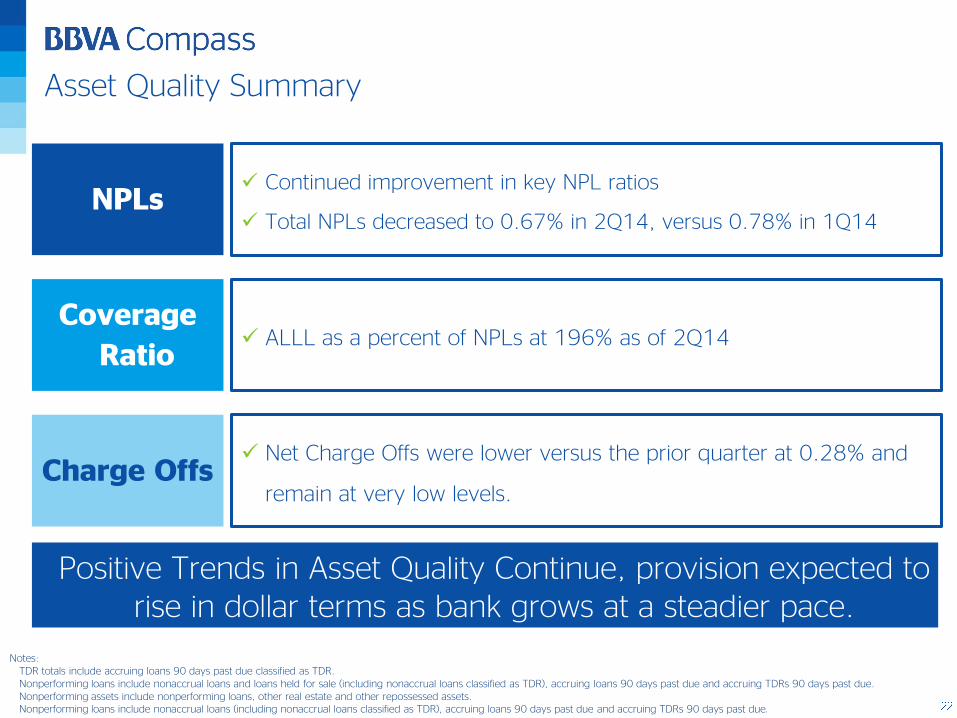
Asset Quality Summary
NPLs Continued improvement in key NPL ratios
Total NPLs decreased to 0.67% in 2Q14, versus 0.78% in 1Q14
Coverage
Ratio ALLL as a percent of NPLs at 196% as of 2Q14
Charge Offs Net Charge Offs were lower versus the prior quarter at 0.28% and
remain at very low levels.
Positive Trends in Asset Quality Continue, provision expected to rise in dollar terms as bank grows at a steadier pace.
Notes:TDR totals include accruing loans 90 days past due classified as TDR.Nonperforming loans include nonaccrual loans and loans held for sale (including nonaccrual loans classified as TDR), accruing loans 90 days past due and accruing TDRs 90 days past due.Nonperforming assets include nonperforming loans, other real estate and other repossessed assets.Nonperforming loans include nonaccrual loans (including nonaccrual loans classified as TDR), accruing loans 90 days past due and accruing TDRs 90 days past due

Solid improvement in virtually all credit metrics
Balance Sheet
and Funding
Profile

Commercial CRE Mortgages Other consumer Covered loans
Loan Portfolio Historical
$ in Billions. Period-end balances
YTD Loan Growth
Loan Portfolio
Demonstrated ability to transform and grow the loan portfolio
while maintaining a strong risk profile
Total Loans
Commercial
Residential Mtgs
Commercial Mtgs
Indirect auto
Other
$ in Millions. Period-end balances. Residential Mtgs include loans held for sale

Commercial Loan Portfolio
Commercial Portfolio Historical Perspective
4Q10 4Q11 4Q12 4Q13 1Q14 2Q14
$10.6
$13.7
$16.9
$20.2
$21.7$22.4
$ in Billions. Period-end balances• Solid C&I loan growth as the bank
migrated from CRE dominant business model
• New markets – expansion into California and new LPO markets
• Corporate Investment Banking now centered in Houston, and represents new capabilities and customer base
Key Points
• Build out of Specialty Lines to bolster the bank’s in-footprint C&I lending business
Instilling a relationship-based Commercial focus has resulted
in positive loan and deposit growth
1
2
3
4
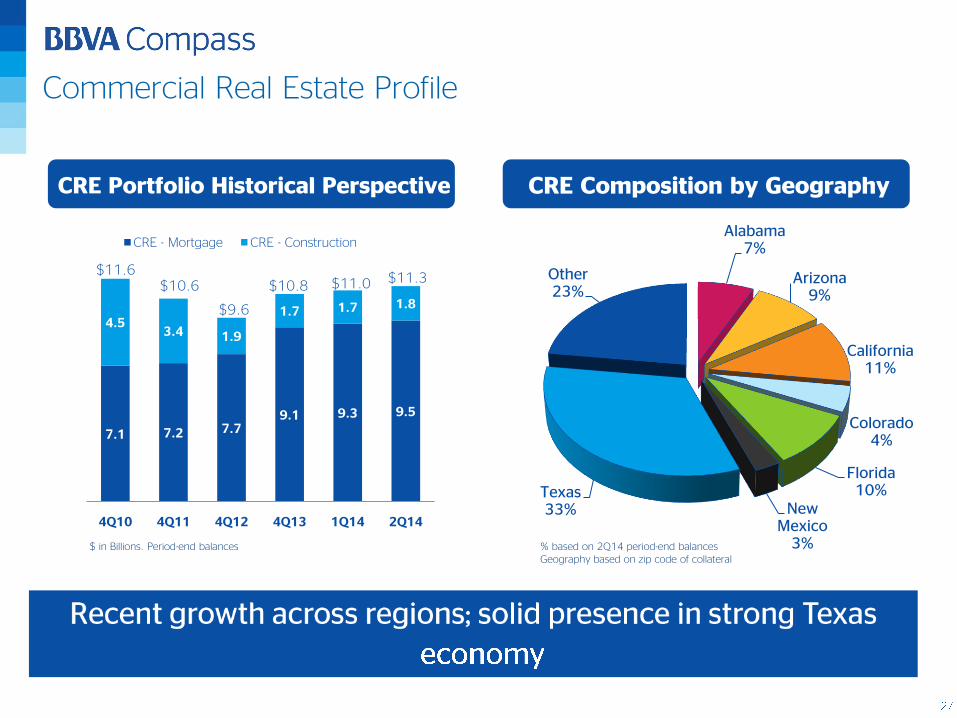
CRE Composition by Geography
Commercial Real Estate Profile
Alabama7%
Arizona9%
California11%
Colorado4%
Florida10%
New Mexico
3%
Texas33%
Other23%
7.1 7.2 7.79.1 9.3 9.5
4.53.4 1.9
1.7 1.7 1.8
4Q10 4Q11 4Q12 4Q13 1Q14 2Q14
CRE - Mortgage CRE - Construction
$11.3$10.8
$9.6
$11.6$10.6 $11.0
CRE Portfolio Historical Perspective
$ in Billions. Period-end balances % based on 2Q14 period-end balancesGeography based on zip code of collateral
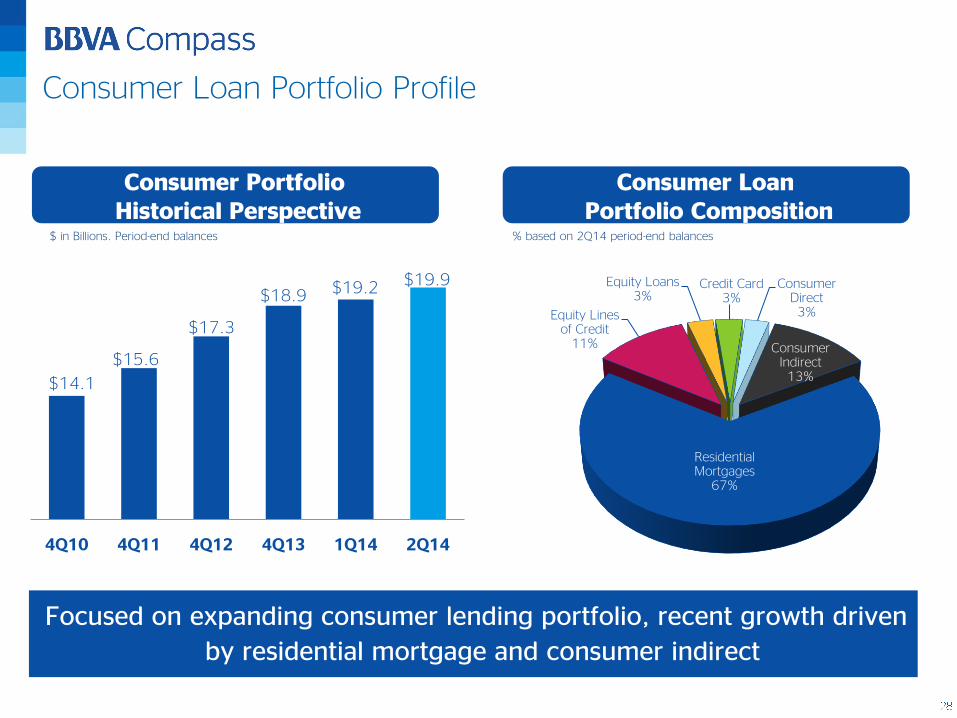
Consumer Loan Portfolio Composition
Residential Mortgages
67%
Equity Lines of Credit
11%
Equity Loans3%
Credit Card3%
Consumer Direct3%
Consumer Indirect13%
Consumer Portfolio Historical Perspective
4Q10 4Q11 4Q12 4Q13 1Q14 2Q14
$18.9 $19.2 $19.9
$17.3
$15.6
$14.1
$ in Billions. Period-end balances % based on 2Q14 period-end balances
Consumer Loan Portfolio Profile
Focused on expanding consumer lending portfolio, recent growth driven
by residential mortgage and consumer indirect

$14.4 $15.4 $16.3 $16.3
$18.3 $19.3 $20.6 $21.5
$12.1 $12.0$12.6 $13.1
$6.7$7.7
$7.4 $7.2
2012 2013 1Q14 2Q14
Non-interest DDA Savings & Money Market Time Deposits
Interest Bearing DDA Foreign Office Deposits
Deposit Mix
Historical Deposit Mix
$ in Billions. Period-end balances
• Attractive deposit mix• 28.1% are noninterest bearing• 77.3% are transaction accounts
• New IT platform enhances our ability to come to market faster with products designed to meet our customer’s evolving needs
Better than peer average growth*• 11% vs 3% total deposits• 13% vs 8% noninterest bearing
Key Points
• Deposit gathering is a primary focus in building customer relationships
* Growth percentages based on 2Q14 vs 2Q13 period-end balances
3
2
1
4

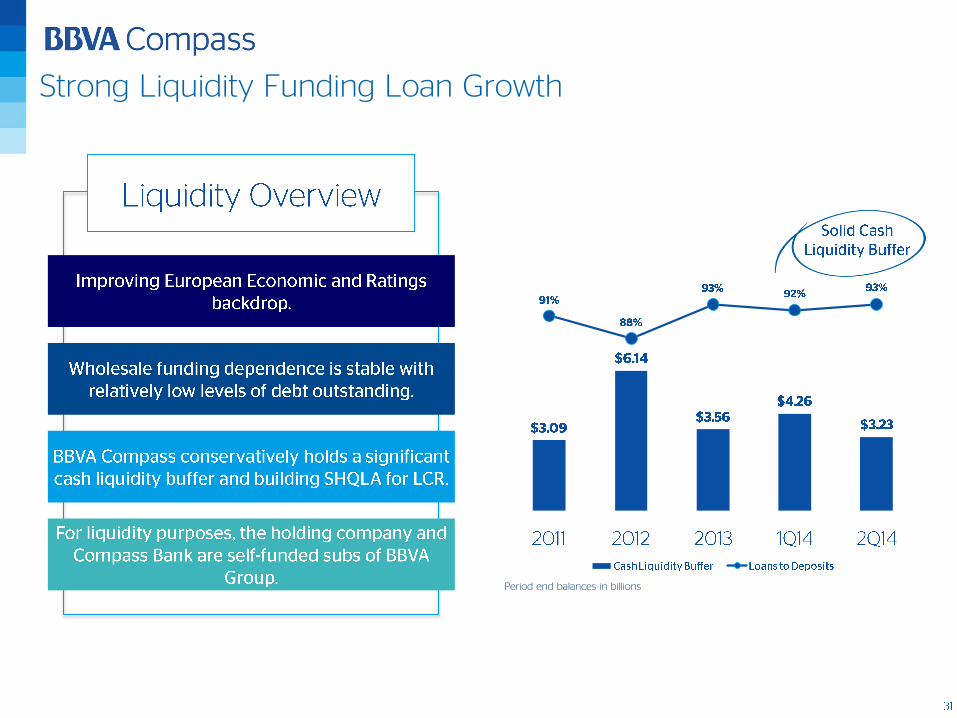
Stable Wholesale Funding Levels
Presented Wholesale Funding Figures are based on data from publicly filed Call Report
Stable levels of wholesale funding, small levels of debt
outstanding.
Period end balances in billions
60%
65%
70%
75%
80%
85%
90%
95%
$0.00
$1.00
$2.00
$3.00
$4.00
$5.00
$6.00
$7.00
$8.00
$9.00
Strong Liquidity Funding Loan Growth
Period end balances in billions
Capital
Position

Subject to CCAR: Bank bolstered Capital Planning and Adequacy
Tier 1 Leverage Ratio (%)
Tier 1 Common Equity Ratio (%)
Tier 1 Capital Ratio (%)
c
Significant Improvements to the Capital Planning Process:
Board awareness and preparation to conduct effective challenge
Implementation of enhanced stress testing loss forecasting models
Formalization of capital buffer methodology
Implementation of new data and model validation controls
Improvements in the overall capital planning governance
Key Takeaways
Period End - Holding Company
Period End - Holding Company
Period End - Holding Company
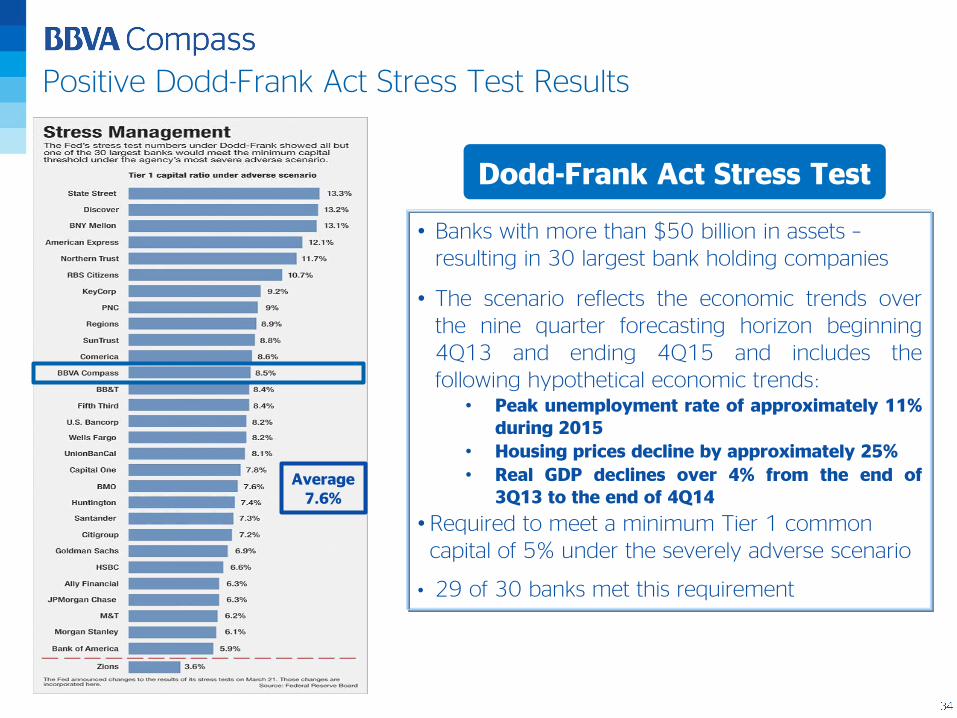
Positive Dodd-Frank Act Stress Test Results
Dodd-Frank Act Stress Test
• Banks with more than $50 billion in assets –resulting in 30 largest bank holding companies
• The scenario reflects the economic trends overthe nine quarter forecasting horizon beginning4Q13 and ending 4Q15 and includes thefollowing hypothetical economic trends:
• Peak unemployment rate of approximately 11%during 2015
• Housing prices decline by approximately 25%
• Real GDP declines over 4% from the end of3Q13 to the end of 4Q14
• Required to meet a minimum Tier 1 common capital of 5% under the severely adverse scenario
• 29 of 30 banks met this requirement
Average 7.6%
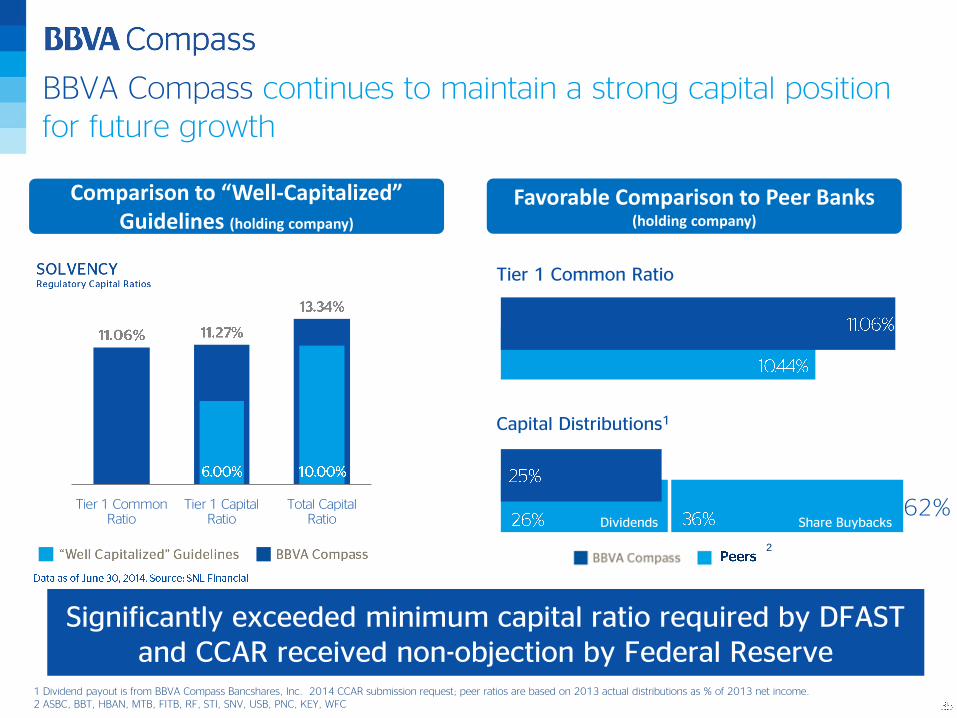
Favorable Comparison to Peer Banks (holding company)
Comparison to “Well-Capitalized” Guidelines (holding company)
BBVA Compass continues to maintain a strong capital position for future growth
Significantly exceeded minimum capital ratio required by DFAST and CCAR received non-objection by Federal Reserve
Tier 1 Common Ratio
Tier 1 Capital Ratio
Total Capital Ratio
2
1 Dividend payout is from BBVA Compass Bancshares, Inc. 2014 CCAR submission request; peer ratios are based on 2013 actual distributions as % of 2013 net income. 2 ASBC, BBT, HBAN, MTB, FITB, RF, STI, SNV, USB, PNC, KEY, WFC
Tier 1 Common Ratio
Capital Distributions1
Dividends Share Buybacks62%

Capital Ratio Targets
Ratios well above target levels in addition to levels prescribed by Basel
III, current Well Capitalized and prescribed DFAST minimums

Regulation and
Ratings
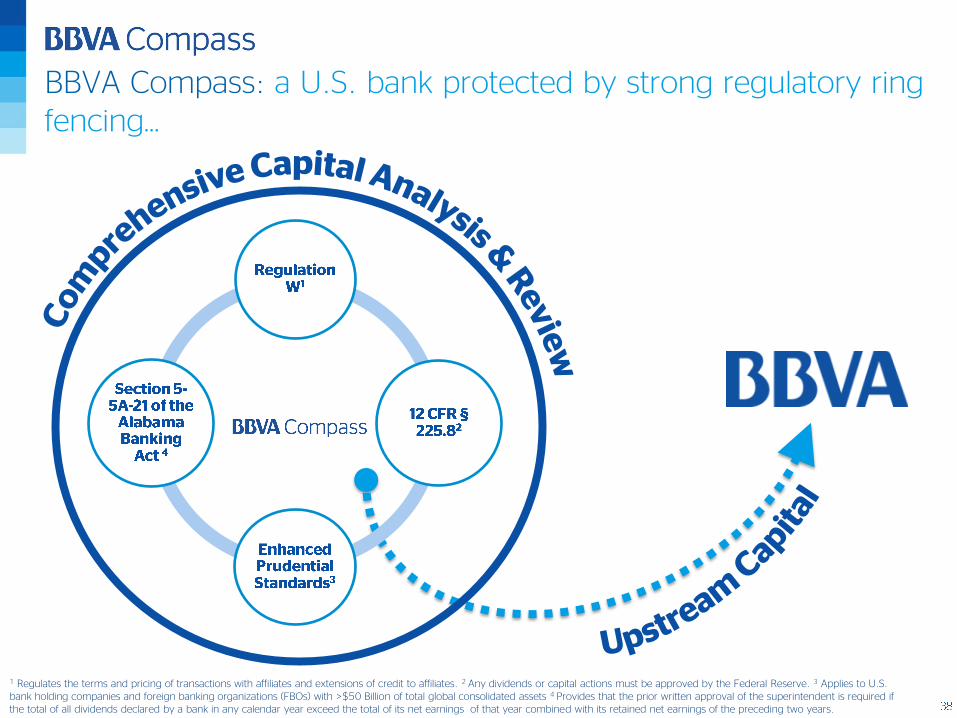
1 Regulates the terms and pricing of transactions with affiliates and extensions of credit to affiliates. 2 Any dividends or capital actions must be approved by the Federal Reserve. 3 Applies to U.S. bank holding companies and foreign banking organizations (FBOs) with >$50 Billion of total global consolidated assets 4 Provides that the prior written approval of the superintendent is required if the total of all dividends declared by a bank in any calendar year exceed the total of its net earnings of that year combined with its retained net earnings of the preceding two years.
BBVA Compass
Bancshares
BBVA Compass: a U.S. bank protected by strong regulatory ring fencing…

Subsidiaries are separate legal entities that are incorporated locally in the
countries in which they operate. “Think globally but act locally”
BBVA: utilizes a decentralized management model for managing liquidity and capital
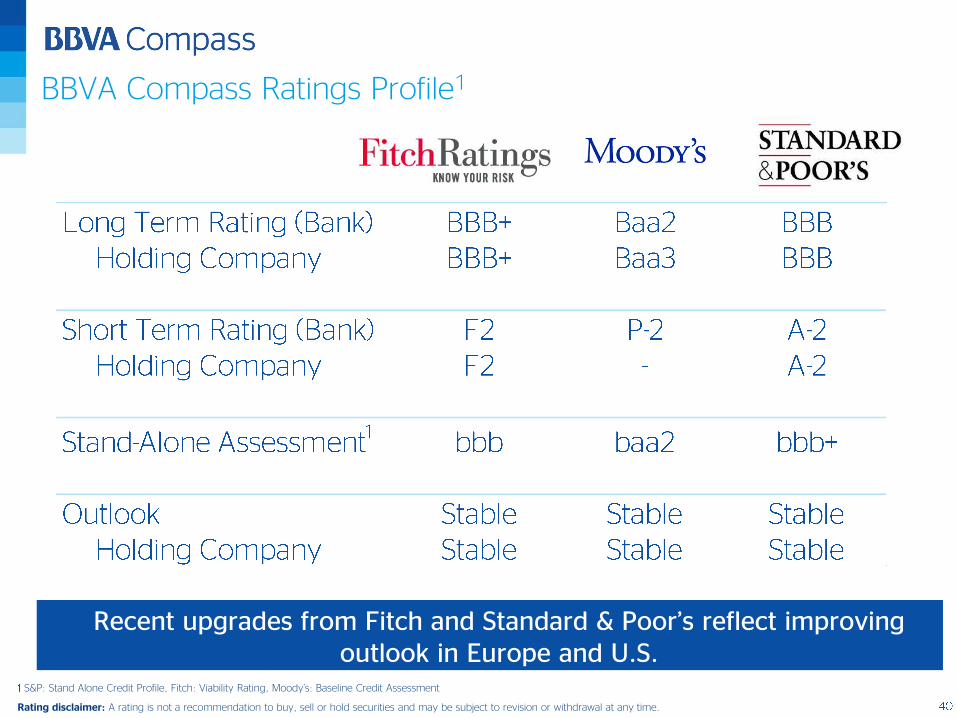
BBVA Compass Ratings Profile1
S&P: Stand Alone Credit Profile, Fitch: Viability Rating, Moody’s: Baseline Credit Assessment
Rating disclaimer: A rating is not a recommendation to buy, sell or hold securities and may be subject to revision or withdrawal at any time.
Recent upgrades from Fitch and Standard & Poor’s reflect improving outlook in Europe and U.S.
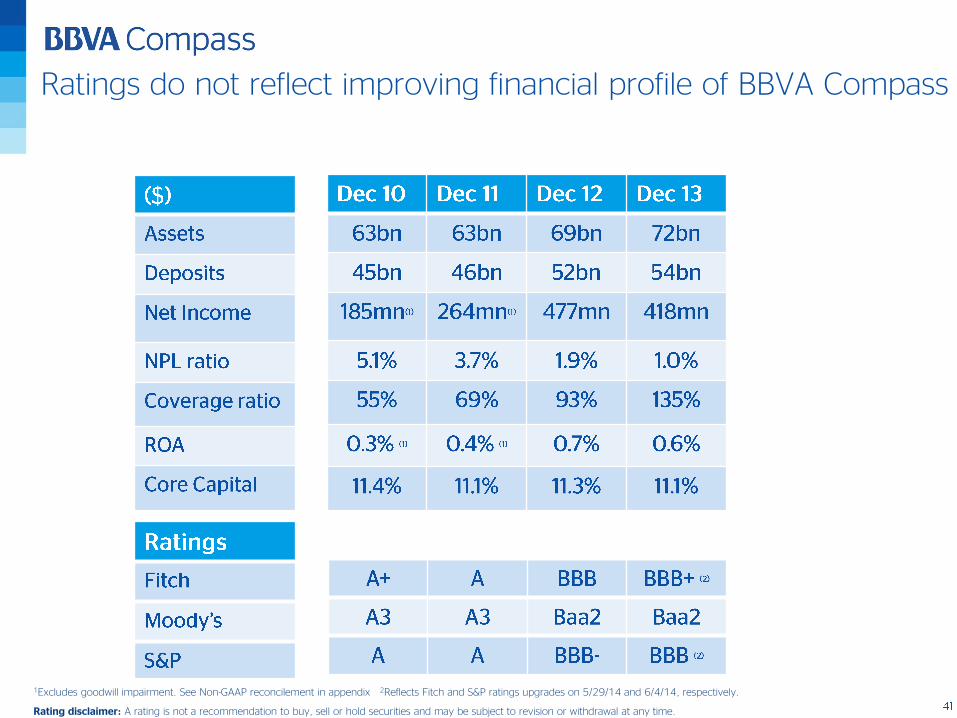
Ratings do not reflect improving financial profile of BBVA Compass
1Excludes goodwill impairment. See Non-GAAP reconcilement in appendix 2Reflects Fitch and S&P ratings upgrades on 5/29/14 and 6/4/14, respectively.
Rating disclaimer: A rating is not a recommendation to buy, sell or hold securities and may be subject to revision or withdrawal at any time.
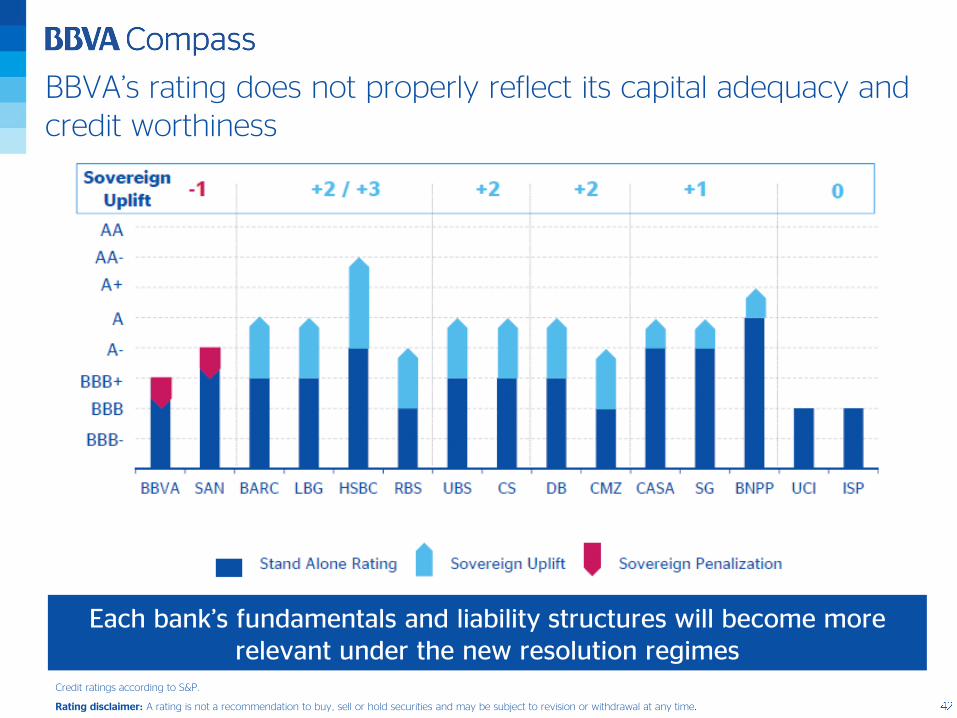
BBVA’s rating does not properly reflect its capital adequacy and credit worthiness
Each bank’s fundamentals and liability structures will become more relevant under the new resolution regimes
Credit ratings according to S&P.
Rating disclaimer: A rating is not a recommendation to buy, sell or hold securities and may be subject to revision or withdrawal at any time
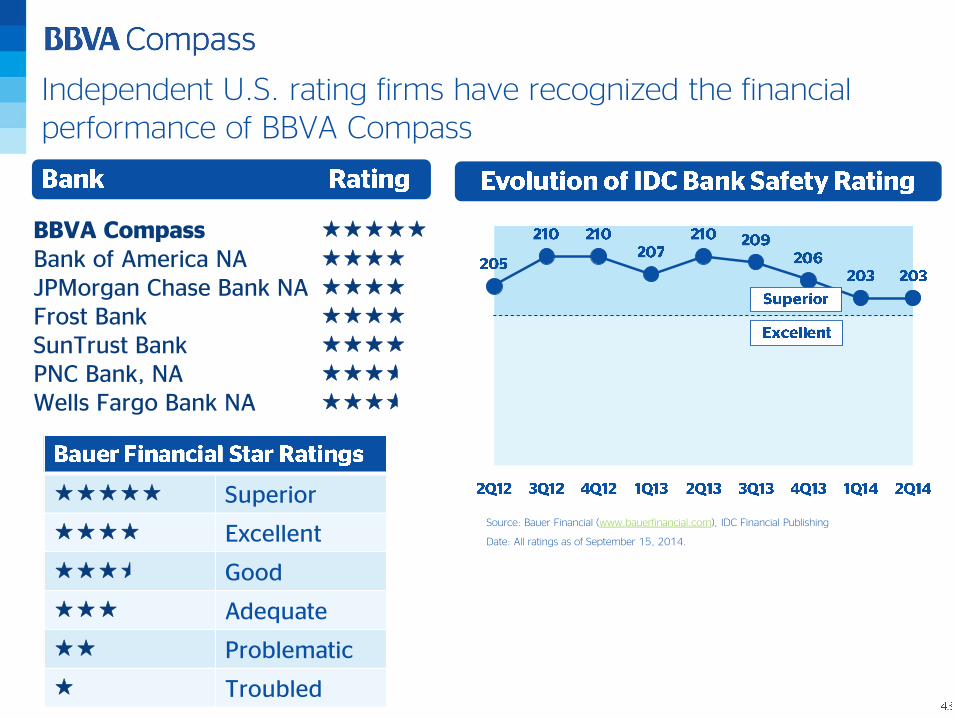
Independent U.S. rating firms have recognized the financial performance of BBVA Compass
Source: Bauer Financial (www.bauerfinancial.com), IDC Financial Publishing
Date: All ratings as of September 15, 2014.
Superior
Excellent
Good
Adequate
Problematic
Troubled
BBVA Compass
Bank of America NA
JPMorgan Chase Bank NA Frost Bank
SunTrust Bank
PNC Bank, NA
Wells Fargo Bank NA

Appendix: BBVA
and
Reconciliations

BBVA: a customer-centric global financial group with …

… leading franchises and a well-diversified revenue base
Gross income breakdown 1H14
Market Share Ranking%
31%
3%
9%29%
22%
4% 2%
Spain
AsiaTurkey
South America
Mexico USA
Rest of Europe
Eurasia
DepositRanking
Deposits
Spain
Mexico
South America excl. Brazil
USA (Sunbelt)
China (Citic Bank)
Turkey (Garanti Bank)
13.2%
30.3%
11.0%
N.A.
11.8%
24.9%
11.0%
6.2%
3rd
1st
4th
9.9% stake (7th)
25% stake (2nd)
Loans
Eurasia
2nd*-5th
Emerging
Weight 57%
Cum. YOYGrowth
+15%
Developed
Weight 43%
Cum. YOYGrowth +1%
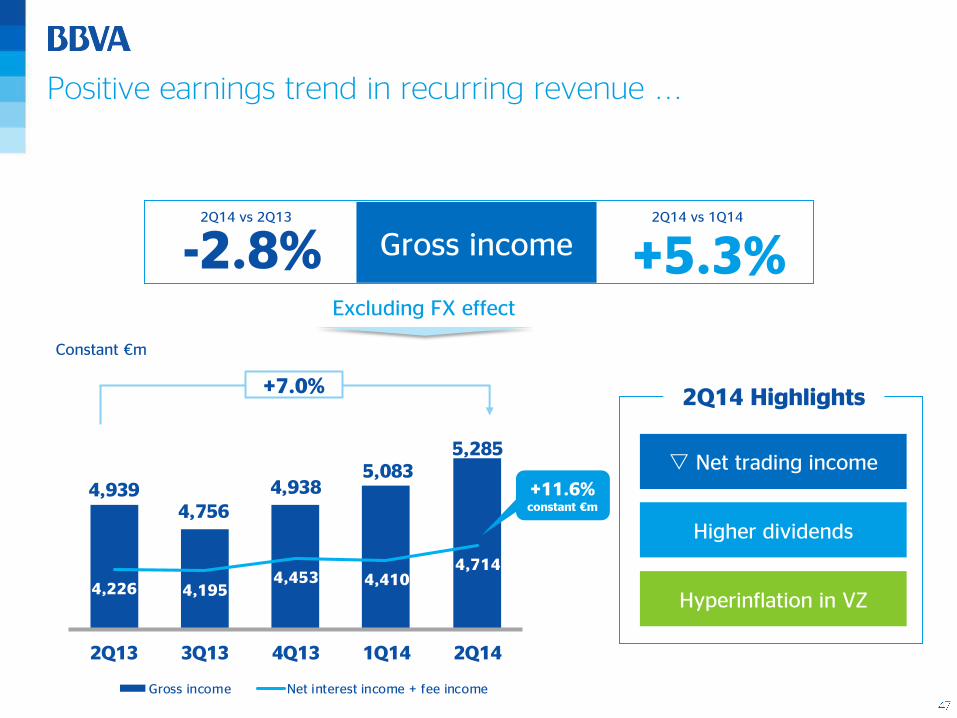
Positive earnings trend in recurring revenue ...
+7.0%
Constant €m
Excluding FX effect
+5.3%-2.8% Gross income2Q14 vs 2Q13 2Q14 vs 1Q14
2Q14 Highlights
Net trading income
Higher dividends
Hyperinflation in VZ
4,9394,756
4,9385,083
5,285
4,226 4,1954,453 4,410
4,714
2Q13 3Q13 4Q13 1Q14 2Q14
Gross income Net interest income + fee income
+11.6% constant €m
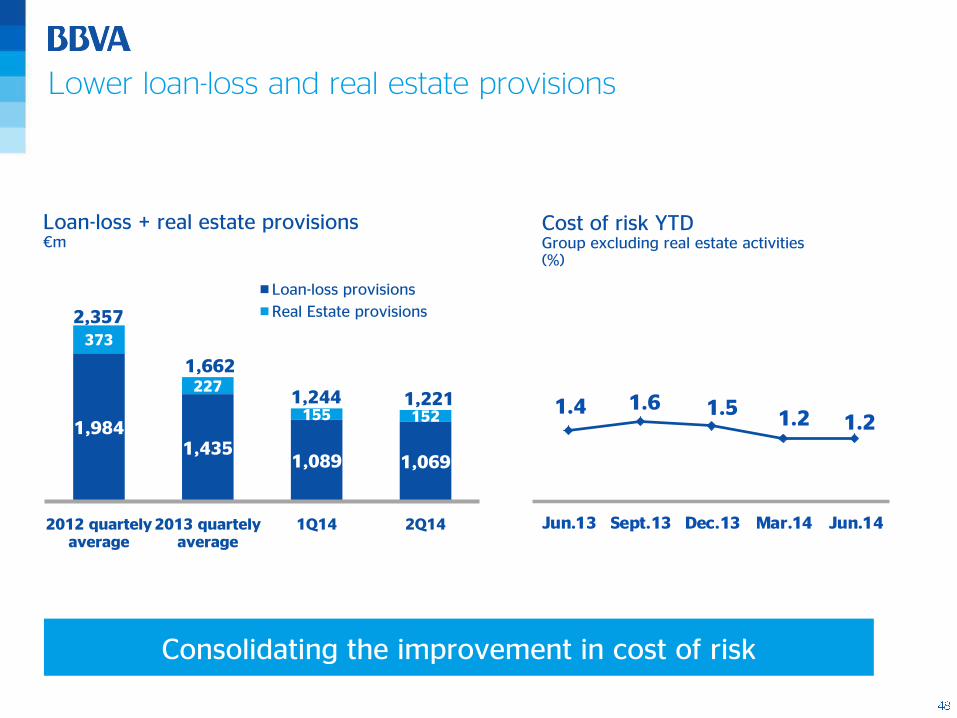
1,9841,435
1,089 1,069
373
227
155 152
2,357
1,662
1,244 1,221
2012 quartely average
2013 quartely average
1Q14 2Q14
Loan-loss provisions
Real Estate provisions
Lower loan-loss and real estate provisions
Loan-loss + real estate provisions€m
Consolidating the improvement in cost of risk
1.4 1.6 1.5 1.2 1.2
Jun.13 Sept.13 Dec.13 Mar.14 Jun.14
Cost of risk YTDGroup excluding real estate activities(%)
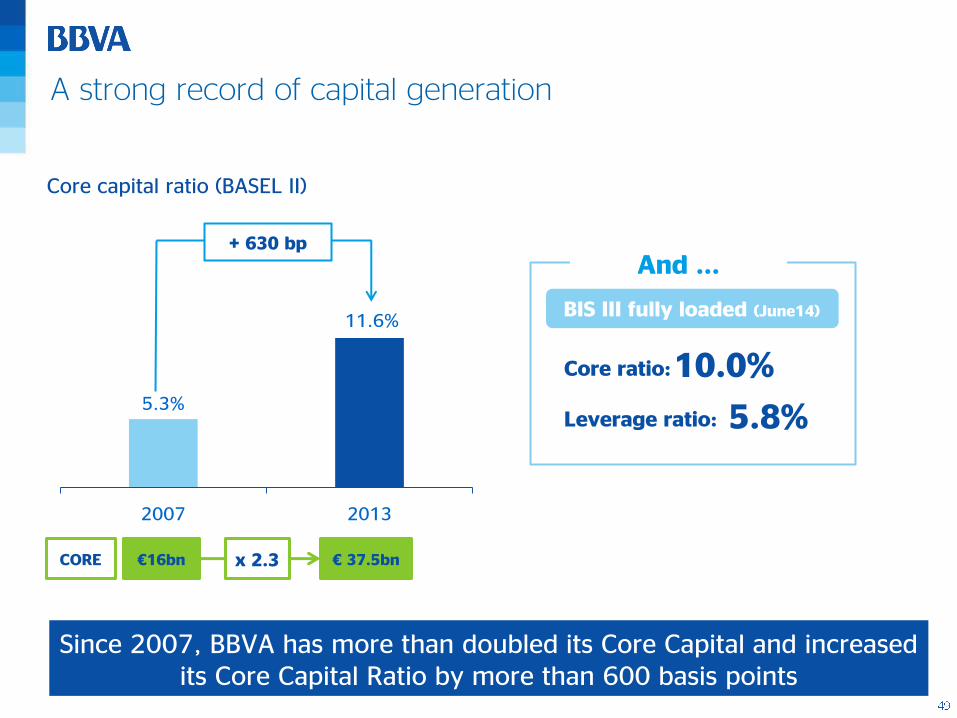
+ 630 bp
Core capital ratio (BASEL II)
CORE €16bn € 37.5bnx 2.3
Since 2007, BBVA has more than doubled its Core Capital and increased its Core Capital Ratio by more than 600 basis points
5.3%
11.6%
2007 2013
Leverage ratio: 5.8%
And ...
Core ratio:10.0%
BIS III fully loaded (June14)
A strong record of capital generation

BBVA: Improving Ratings and Outlook
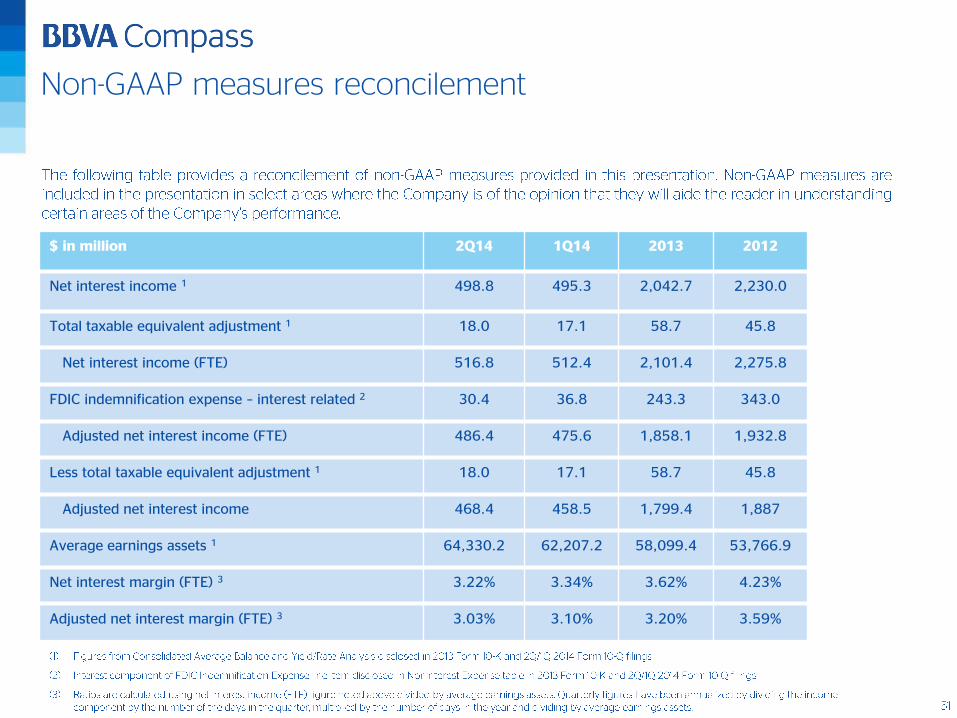
Non-GAAP measures reconcilement
$ in million 2Q14 1Q14 2013 2012
Net interest income 1 498.8 495.3 2,042.7 2,230.0
Total taxable equivalent adjustment 1 18.0 17.1 58.7 45.8
Net interest income (FTE) 516.8 512.4 2,101.4 2,275.8
FDIC indemnification expense – interest related 2 30.4 36.8 243.3 343.0
Adjusted net interest income (FTE) 486.4 475.6 1,858.1 1,932.8
Less total taxable equivalent adjustment 1 18.0 17.1 58.7 45.8
Adjusted net interest income 468.4 458.5 1,799.4 1,887
Average earnings assets 1 64,330.2 62,207.2 58,099.4 53,766.9
Net interest margin (FTE) 3 3.22% 3.34% 3.62% 4.23%
Adjusted net interest margin (FTE) 3 3.03% 3.10% 3.20% 3.59%
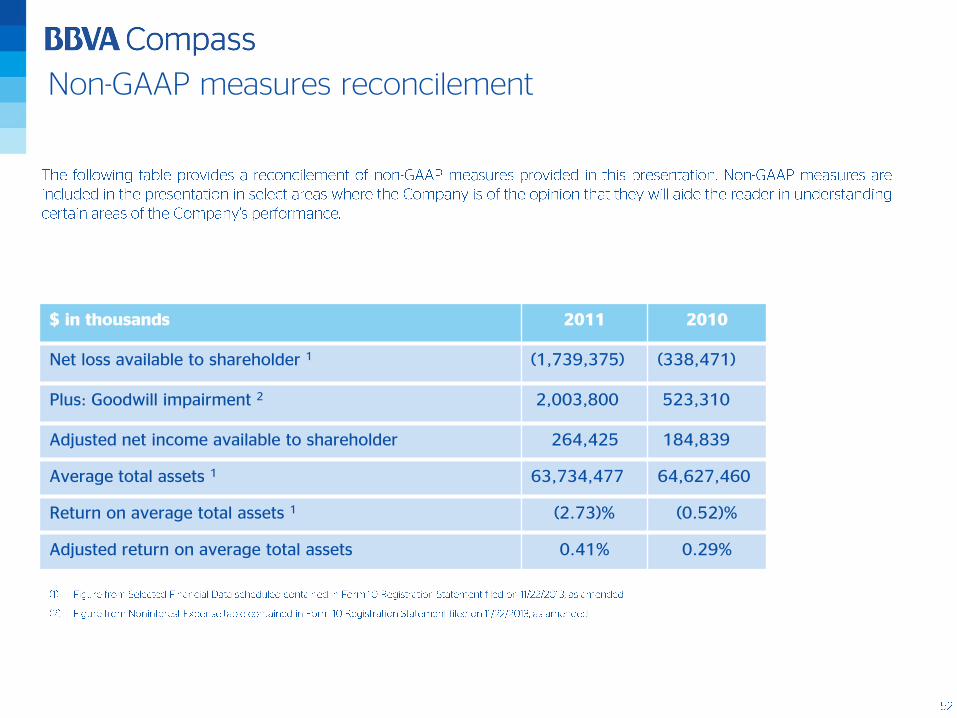
Non-GAAP measures reconcilement
$ in thousands 2011 2010
Net loss available to shareholder 1 (1,739,375) (338,471)
Plus: Goodwill impairment 2 2,003,800 523,310
Adjusted net income available to shareholder 264,425 184,839
Average total assets 1 63,734,477 64,627,460
Return on average total assets 1 (2.73)% (0.52)%
Adjusted return on average total assets 0.41% 0.29%

US Investor Relations
Ed BilekEVP, Investor Relations
205.297.3331
Contact
New BBVA US Investor Relations AppGives investors mobile access to the latest news, SEC Filings,
presentations, videos, fact sheets and other company information from BBVA Compass Bancshares, Inc.

Top Related