


Languages
Pages
Legal

Louisiana State UniversityLSU Digital Commons
LSU Master's Theses Graduate School
July 2019
Assessment of Excess Thyroid Cancer RiskFollowing a Hypothetical Radiological Incident inLouisiana and Best-Case Risk Reduction Achievedby Thyroid BlockadeGarrett A. OtisLouisiana State University and Agricultural and Mechanical College, [email protected]
Follow this and additional works at: https://digitalcommons.lsu.edu/gradschool_theses
Part of the Environmental Health and Protection Commons, and the Other Physics Commons
This Thesis is brought to you for free and open access by the Graduate School at LSU Digital Commons. It has been accepted for inclusion in LSUMaster's Theses by an authorized graduate school editor of LSU Digital Commons. For more information, please contact [email protected].
Recommended CitationOtis, Garrett A., "Assessment of Excess Thyroid Cancer Risk Following a Hypothetical Radiological Incident in Louisiana and Best-Case Risk Reduction Achieved by Thyroid Blockade" (2019). LSU Master's Theses. 4972.https://digitalcommons.lsu.edu/gradschool_theses/4972
ASSESSMENT OF EXCESS THYROID CANCER RISK FOLLOWING A HYPOTHETICAL RADIOLOGICAL INCIDENT IN LOUISIANA AND BEST-CASE RISK
REDUCTION ACHIEVED BY THYROID BLOCKADE
A Thesis
Submitted to the Graduate Faculty of the Louisiana State University and
Agricultural and Mechanical College in partial fulfillment of the
requirements for the degree of Master of Science
in
The Department of Physics and Astronomy
by Garrett Otis
B.S., Louisiana State University, 2015 August 2019
ii
Acknowledgements
Foremost, I thank my friend Dr. Charles Wilson and my graduate advisor Dr. Wei-
Hsung Wang for introducing me to the field of Health Physics several years ago; without
them, I would not have written this thesis. Additionally, ever since I’ve been enrolled in
Louisiana State University’s Medical Physics and Health Physics program, Dr. Kenneth
Matthews has consistently proven to be approachable and respectful to prospective and
enrolled students.
Second, I thank my committee, consisting of Dr. Wei-Hsung Wang, Dr. Kenneth
Matthews, and Dr. Jeffrey Blackmon, for their feedback on my thesis. The iterative
process of refinement through review and discussion is what creates quality work, and I
appreciate their contribution to that process.
Third, I thank those who were not on my committee, yet still provided their insight on
matters regarding my thesis when I sought them out. In particular, I thank Dr. Wayne
Newhauser, Dr. Charles Wilson, Mr. Amin Hamideh, Mr. Jabari Robinson, and my peers
in the Medical Physics and Health Physics program.
Lastly, I thank my family for being emotionally supportive of my decision to return to
school and change my career path. I also thank them for their desire to always want
what’s best for my well-being, because otherwise I would not be where I am.
This work was supported in part by a graduate fellowship from the Nuclear Regulatory
Commission.
iii
Table of Contents Acknowledgements ......................................................................................................... ii Abstract ...........................................................................................................................iv Chapter 1. Introduction .................................................................................................... 1
1.1. Motivation and Scope ............................................................................................ 1
Chapter 2. Background and Review ................................................................................ 3 2.1. Dimensions of Risk ................................................................................................ 3 2.2. Communication of Risk .......................................................................................... 4 2.3. Radioactive Iodine ................................................................................................. 6
Chapter 3. Methods and Materials ................................................................................ 13 3.1. Source Term ........................................................................................................ 13 3.2. Environmental Transport ...................................................................................... 16 3.3. Population Exposure Factors ............................................................................... 20 3.4. Conversion to Dose and Risk .............................................................................. 22 3.5. Reduction of Risk ................................................................................................. 26
Chapter 4. Results and Discussion ............................................................................... 28 4.1. Thyroid Absorbed Dose ....................................................................................... 31 4.2. Thyroid Cancer Risk ............................................................................................ 33 4.3. Risk Reduction ..................................................................................................... 35 4.4. Limitations and Future Work ................................................................................ 36 4.5. Conclusion ........................................................................................................... 38
Appendix A. Percentile Data of Dose, ERR, and LAR ................................................... 39 References .................................................................................................................... 41
Vita ................................................................................................................................ 46
iv
Abstract
Radioactive isotopes of iodine are produced by nuclear power plants as a byproduct
of nuclear fission reactions. If these isotopes are released into the environment, such as
during a breach of containment, they constitute a health risk to exposed individuals. To
mitigate the risk of thyroid cancer due to exposure to radioactive iodine, “iodide
prophylaxis,” also known as “thyroid blockade,” can be used, usually by administration of
potassium iodide (KI). In some areas of the world, KI has been provided to the general
public by their governments as a precautionary measure against potential nuclear power
plant incidents. However, in the state of Louisiana, only evacuation and sheltering of the
general public are the planned response to such incidents. The question of whether
Louisiana’s government should provide KI to the public is a question of risk
management. This project’s risk assessment provides a framework for determining
radiation risk from radioiodine release from a nuclear power plant, enabling an
assessment of the potential benefit of providing KI to the general public in Louisiana. In
this assessment, a hypothetical radiological incident of similar severity to the Fukushima
accident was modeled for a nuclear power plant in Louisiana. Environmental transport of
discharged radioactive iodine was modeled with a Gaussian plume model. Thyroid dose
was calculated using representative parameters from International Commission on
Radiological Protection Publication 71. Age- and sex-specific values of excess relative
risk, lifetime attributable risk, and excess lifetime thyroid cancers were calculated. Lastly,
the number of excess lifetime thyroid cancers mitigated by thyroid blockade was
estimated through two separate approaches. This assessment found that a plume
traveling over highly populated parishes near the power plant could result in
v
approximately 200 excess lifetime thyroid cancers over all age groups. The largest
number would likely occur in females exposed as children. Thyroid blockade could
potentially mitigate 80 or more of the excess cancers. These results suggest that more
comprehensive assessments of KI distribution in Louisiana may be warranted.
1
Chapter 1. Introduction
1.1. Motivation and Scope
Louisiana’s Peacetime Radiological Response Plan (Louisiana Department of Health
2016) states that “During an accident at a fixed nuclear facility, the State of Louisiana will
consider recommending the use of thyroid protective drug potassium iodide (KI) within
the affected area for emergency workers, and also for institutionalized persons who are
unable to evacuate quickly.” Providing the thyroid-protective drug KI to the general public
as a whole, rather than to only institutionalized persons, is not within the scope of the
policy, either before or after such an accident. Rather, sheltering-in-place and evacuation
are considered or recommended based upon the anticipated total effective dose
equivalent or thyroid committed dose equivalent to affected members of the general
public. However, governments in other areas of the world have recently distributed, or
expressed an interest in distributing, KI pills to their general public as a precautionary
measure against nuclear power plant accidents. For example, Luxembourg undertook a
preventive KI distribution campaign in 2014 which made KI pills freely available to all of
its inhabitants (Luxembourg 2014). Similar campaigns were conducted in Switzerland in
2014 (Switzerland 2014), Netherlands in 2017 (Netherlands 2017), and Belgium in 2018
(Belgium 2018). Given this trend of governments providing KI pills to their citizens as a
precautionary measure against nuclear power plant accidents, should Louisiana consider
doing so as well?
The decision for Louisiana to provide KI pills to its general public depends on several
factors. These factors include financial cost; benefit regarding thyroid cancer risk
mitigation; logistics of storage, distribution, and re-stocking of KI pills; legal issues of

2
widespread administration; and psychosocial ramifications of implementing such a
policy. The purpose of this thesis was to provide a conservative estimation of thyroid
cancer risk mitigation provided by KI prophylaxis, which is only one of the factors in
determining whether KI pills should be provided to Louisiana’s general public.
The first goal of this assessment was to model a hypothetical worst-case exposure
scenario due to an unintended discharge at a nuclear facility in Louisiana, and thereby
estimate the excess thyroid cancer risk posed to the general public as a result of the
incident. The second goal is to estimate the potential thyroid cancer risk reduction
provided by KI prophylaxis, assuming the general public has prompt access to KI pills.
Chapter 2, “Background and Review,” provides a review of relevant terminology and
concepts that are necessary to interpreting the results of this assessment. Chapter 2
also provides a detailed discussion of radioactive iodine, with an overarching emphasis
on toxicological effects as a result of exposure. Chapter 3, “Methods and Materials,”
details how this assessment was performed and includes justifications of the
assumptions and quantitative values that were used in calculations. Chapter 4, “Results
and Discussion,” presents plots and tables representing the results, interpretation of the
results and their implications, a discussion of the limitations associated with this
assessment, suggestions for future work, and lastly, the assessment’s conclusions.

3
Chapter 2. Background and Review
2.1. Dimensions of Risk
For radiological risk assessment, risk is a function of source terms, environmental
transport, exposure factors, conversion to dose, and conversion of dose to risk (Till
2008). The “source term” is the quantity of radioactive material released into the
environment. The source term is used to derive radionuclide concentrations at locations
other than the source’s location. In cases of retrospective analysis of a radiological
incident, such as an unintended discharge from a nuclear plant, downwind monitoring
stations and field measurements are used to estimate the source term. A hypothetical
incident was considered for this assessment, so estimates of a plausible source term
were derived from historical accidents (see Chapter 3).
“Environmental transport” refers to the dispersion of radionuclides into the
environment after emission from the source. Environmental transport models are specific
to the scale of analysis; for example, macroscale atmospheric modeling involves
transport over several thousand kilometers and considers weather fronts, pressure
gradients, and rotation of the earth in addition to other large-scale factors. Mesoscale
and microscale atmospheric modeling consider more granular factors, such as
convective activity of the Earth’s surface (for mesoscale; ~100 km transport), or surface
roughness and building wake (for microscale; <~1 km transport).
“Exposure factors” refer to parameters of the exposed population that are necessary
to calculate dose and risk. Examples of exposure factors are breathing rate, time spent
outdoors per day or week, and consumption of particular foods. The exposure factors

4
should be as representative of the exposed individuals as possible to minimize
uncertainties in dose and risk calculations.
“Conversion to dose” involves calculating radiation dose from either external
exposure or intake of radionuclides. For example, dose coefficients from the International
Commission on Radiological Protection (ICRP) allow calculation of committed effective
or equivalent dose for a given amount of intake. (The ICRP is a non-governmental
organization that develops recommendations for government agencies regarding
radiological protection.) The dose coefficients depend upon the pathway of intake and
the form of the radionuclide. Generally, such coefficients have a large amount of
uncertainty due to variability of relevant biological factors among individuals in a
population.
“Conversion of dose to risk” involves converting calculated dose into an estimate of
risk for a chosen endpoint. For this assessment, the calculated risk pertained to
radiation-induced cancer. Using data from atomic bomb survivors, atomic weapons
testing, nuclear power plant accidents, and nuclear medicine, the Biological Effects of
Ionizing Radiation (BEIR) committee has developed risk models for radiation-induced
cancers (National Research Council 2006). The BEIR committee’s cancer risk models
are chiefly dependent upon dose, sex, age at exposure, time since exposure, and age at
risk determination (attained age). The cancer risk models are also dependent upon the
type of cancer. This assessment used the model for thyroid cancer (see Section 2.2).
2.2. Communication of Risk
For reporting the results of this assessment, several different metrics are used to
communicate risk. Absolute risk (AR) describes the rate of disease in a population.
5
Relative risk (RR) is a ratio of two rates of disease (two ARs) in a population, where the
two rates differentiate between an exposed group (ARe) and a non-exposed or reference
group (ARn). Mathematically, RR = ARe/ARn.
Excess relative risk (ERR) is the fractional increase of the exposed group’s rate of
disease when compared to the reference group; alternatively, if multiplied by 100, the
ERR is the percentage increase over the reference group’s rate of disease.
Mathematically, ERR = RR – 1 if not expressed as a percentage. If the ERR is greater
than zero, then the exposed group has an elevated risk.
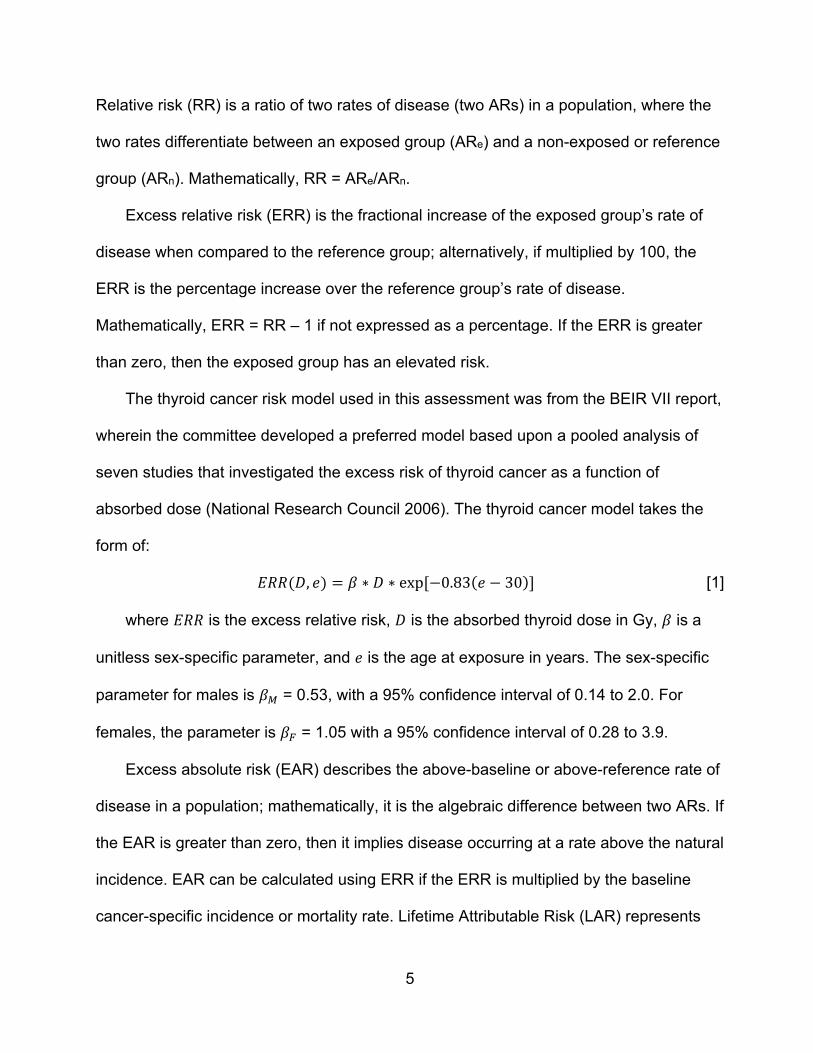
The thyroid cancer risk model used in this assessment was from the BEIR VII report,
wherein the committee developed a preferred model based upon a pooled analysis of
seven studies that investigated the excess risk of thyroid cancer as a function of
absorbed dose (National Research Council 2006). The thyroid cancer model takes the
form of:
𝐸𝑅𝑅 𝐷, 𝑒 𝛽 ∗ 𝐷 ∗ exp 0.83 𝑒 30 [1]
where 𝐸𝑅𝑅 is the excess relative risk, 𝐷 is the absorbed thyroid dose in Gy, 𝛽 is a
unitless sex-specific parameter, and 𝑒 is the age at exposure in years. The sex-specific
parameter for males is 𝛽 = 0.53, with a 95% confidence interval of 0.14 to 2.0. For
females, the parameter is 𝛽 = 1.05 with a 95% confidence interval of 0.28 to 3.9.
Excess absolute risk (EAR) describes the above-baseline or above-reference rate of
disease in a population; mathematically, it is the algebraic difference between two ARs. If
the EAR is greater than zero, then it implies disease occurring at a rate above the natural
incidence. EAR can be calculated using ERR if the ERR is multiplied by the baseline
cancer-specific incidence or mortality rate. Lifetime Attributable Risk (LAR) represents

6
the risk of cancer incidence or mortality over a lifetime. LAR is a summation of EAR over
a lifetime, with each term of the sum weighted by the probability of surviving to
subsequent ages up to a specified age. Calculation of LAR depends on several
variables, and the values used in its equation depend on available data, so detailed
discussion of the LAR calculation is deferred to Section 3.4.
2.3. Radioactive Iodine
2.3.1. Synthesis
Of all isotopes of iodine, only 127I is stable; all others are radioactive (referred to as
radioiodines). Radioiodines occur in nature in only trace amounts formed by cosmic
bombardment (Knolls Atomic Power Lab 2010). One additional natural source of
radioiodines is the exceptionally rare event of a naturally occurring self-sustaining
uranium fission reactor, such as the Oklo reactor in Africa over one billion years ago,
which produces radioiodines as fission products (Gauthier-Lafaye 1996).
The presence of substantial amounts of radioiodines on Earth are due to man-made
synthesis, such as in atomic weapons testing, nuclear power plant accidents, and fuel
reprocessing (Prăvălie 2014, Hou 2003). Of the radioiodines produced by such
reactions, the most relevant isotope regarding toxic effects in humans is 131I due to its
high uranium fission yield of 2.89% and half-life of 8.023 days (Knolls Atomic Power Lab
2010). The high fission yield of 131I allows it to be produced in large quantities per
kilowatt of thermal energy produced, and its half-life is long enough for it to be dispersed
into the environment. Such characteristics of 131I make it a consistent threat after nuclear
power plant incidents involving a breach of containment.

7
2.3.2. Exposure to Humans, Flora, and Fauna
There are many different pathways for exposure to radioiodoines. Radioiodine can
exist as a particulate, a vapor, or as a solution with the iodine dissolved in water.
Radioiodines can pose an external threat and/or an internal threat depending on
concentration of, distance from, time spent near, and shielding around the source. For
the Chernobyl accident which occurred in 1986, the prominent pathway through which
the general public was exposed to 131I and other radioiodines was by ingestion of
contaminated food and drink (mostly milk) (Higley 2006). However, in the modern United
States the most likely pathway for exposure to radioiodines immediately after a nuclear
incident is inhalation of a radioiodine-containing plume rather than ingestion of
contaminated food and drink; this is due to food testing and interdiction procedures that
would halt the distribution of contaminated food and drink in the event of such an
incident. Such limits are discussed in Section 2.3.3.
Non-human animals can be exposed to radioiodines through the same pathways as
humans, although they are more susceptible to intake by ingestion due to an inability to
prevent them from ingesting contaminated food or drink after deposition of radioiodine
onto vegetation or bodies of water in affected areas. Additionally, at sufficient
concentrations, radioiodines can pose a threat to flora if deposited onto soil near plants
or onto trees. Because the emissions of radioiodines includes gamma rays and beta
particles, they present an external hazard to the flora upon which they are deposited. For
example, in the exclusion zone of Chernobyl where large amounts of radioactive cesium
and iodine were deposited, coniferous trees were killed and deciduous trees suffered
partial damage as a result of acute external irradiation (Alexakhin 1994).
8
2.3.3. Exposure Limits
Because 131I and other radioiodines are radioactive, they can contribute to an
exposed individual’s cumulative radiation dose over a period of time. Methodologies
have been developed to approximate an acceptable limit of exposure based upon a
radionuclide’s properties and route of exposure.
The derived air concentration (DAC) is used to approximate a limit on the average
air concentration of a specific radionuclide (ICRP 2015). The DAC depends on an
assumed breathing rate, number of working hours in a year, dose coefficient
representing either committed effective dose per unit intake or effective dose due to
submersion in a radioactive cloud, and some annual effective dose limit. The DAC
separately considers internal radiation dose from inhalation vs. external dose from
submersion within a radioactive cloud. The Nuclear Regulatory Commission (NRC)
imposes a limit for inhalation DAC of 740 Bq/m3 for 131I (CFR 2019). Such limits are
radionuclide-specific.
The Safe Drinking Water Act, imposes an effective dose limit due to beta particles
and gamma photon emission (which therefore includes any radioiodines) present in
drinking water at 4 mrem/year (CFR 2002). Assuming no other man-made radionuclides
present, an ingestion of 2 liters of drinking water per day for 365 days, and an ingestion
dose coefficient of 2.2 µrem/Bq for 131I (ICRP 2012), that dose limit translates to a
concentration limit or Maximum Contaminant Level (MCL) of 2.5 Bq/L.
The Food and Drug Administration (FDA) provides recommendations called Derived
Intervention Levels (DILs) which are based upon the consumption of radionuclide-
contaminated food that, without intervention, would potentially lead to a committed
9
effective dose established by a Protective Action Guideline (PAG) (FDA 2005). A PAG is
a projected dose to an individual from a release of radioactive material at which a
specific protective action to reduce or avoid that dose is recommended (EPA 2017). For
131I, the FDA recommends a DIL of 170 Bq per kg of a diet. Like other limits, this is
radionuclide-specific.
A Derived Response Level (DRL) is a level of radioactivity in an environmental
medium that would be expected to produce a dose equal to its corresponding PAG (EPA
2017). The DRL’s intended use is to provide a recommendation for making quick
decisions during time-critical scenarios involving accidental radiological releases (EPA
2017). As a “default” DRL for various radionuclides in drinking water, the EPA
recommends that radionuclide levels are assumed to be constant (i.e. replenished) to
provide greater assurance of conservatism. Assuming one year of constant exposure,
the DRL for 131I in drinking water corresponds to 820 pCi/L for pregnant women, nursing
women, and children of age 15 and younger (100 mrem PAG). For the general
population (500 mrem PAG), the DRL for 131I in drinking water is 10,000 pCi/L.
2.3.4. Biotransformation and Toxic Effects
Radioactive iodine and stable iodine are metabolized identically. Upon intake by
humans, dietary iodide is absorbed through the small intestine, transported into blood,
and either absorbed by the thyroid gland to be used in the synthesis of thyroid hormones
or excreted through urine (Leggett 2017). With the iodide in blood, a thyroid follicular cell
(thyrocyte) uses a sodium-iodide symporter to actively transport the iodide into the cell.
Once inside the cell, the iodide is moved into the colloid (viscous fluid in the central
cavity of a thyroid follicle) via the anion transport protein pendrin. In the colloid, thyroid

10
peroxidase (TPO) performs several critical steps in the creation of thyroid hormones (Ruf
2006). TPO oxidizes the absorbed iodide and adds the oxidized iodide to the amino acid
tyrosine to create monotyrosine (MIT) and diiodotyrosine (DIT). TPO either couples MIT
and DIT to create the thyroid hormone triiodothyronine (T3), or couples two DIT to create
the thyroid hormone thyroxine (T4). T3 is also produced from T4 via 5'-deiodinase in
peripheral tissues, which is the more prominent mode of T3 synthesis (Kimura 1987).
The hormones T3 and T4 are released into circulation and subsequently bind to
nuclear receptors at various peripheral tissue cells, which lead to increases in
metabolism and protein synthesis. As a consequence, if radioactive iodine is absorbed
instead of stable iodine, the thyroid gland and the peripheral tissues where T3 and T4
are circulated are subject to beta particle and gamma radiation. Due to the thyroid
gland’s very slow transference of organic iodine (as T3 and T4) to blood relative to other
organs (Leggett 2017), the thyroid gland is the target tissue that receives the most dose
from accumulation of radioiodine. The most substantial toxic effect as a result of
inhalation, ingestion, or absorption of radioiodines is development of thyroid cancer
(National Research Council 2006). At very high doses (several hundred Gy), the most
relevant toxic effect is hypothyroidism rather than thyroid cancer due to the loss of
thyroid cell population that accompanies such high doses.
2.3.5. Epidemiological Studies
Most large-scale studies of external exposure to radioiodines involved concurrent
exposure to other radionuclides (National Research Council 2006). For example, studies
of atomic bomb survivors included concurrent exposure to not only several radionuclides
of differing physical forms, but also neutrons. The same applies to studies of nuclear

11
power plant accidents. Additionally, when radioiodines are located outside of one’s body,
there is no organ specificity. As a result, identifying an effect that is specific to external
exposure of radioiodines (and yet not applicable to external ionizing-radiation sources of
similar emission spectra in general) is not meaningful.
Data concerning risk of thyroid cancer as a result of internal exposure to
radioiodines, mainly 131I, come mostly from therapeutic and diagnostic scenarios/studies.
Such studies mostly consist of internal exposure of adults receiving doses from 0.5 Gy
up to as high as 100 Gy; these studies don’t provide substantial evidence of increases in
thyroid cancer incidence (for non-childhood exposure) due to a lack of consistent results
between different studies (National Research Council 2006). Environmental exposure
studies such as those focused on weapons testing at Nevada Test Site (Kerber 1993),
Bikini Atoll / Marshall Island (Conard 1984), and the Hanford Site production facility
(Davis 2004), showed a similar lack of consistency in findings.
In contrast to the comparatively murky data for adult exposure to radioiodines,
follow-up studies on the Chernobyl accident showed a marked increase in thyroid cancer
incidence among those exposed as children (Mettler 1996, Williams 2003, Kikuchi 2004).
2.3.6. Protective Measures
“Iodide/Iodine prophylaxis” or “thyroid blockade” is a prophylactic method that
protects the thyroid gland against radioiodines by redirecting the radioiodines away from
the target organ and into the kidneys where they are subsequently excreted in urine. To
accomplish this, a thyroid-saturating dose of stable iodide is ingested such that the
activity of the sodium-iodide symporter used by thyroid follicular cells decreases to a
level where a large majority of any further ingested iodide is simply routed to the kidneys
12
and excreted rather than absorbed by the thyroid (Hosten 2012). Timed appropriately,
this prophylactic measure can prevent a large percentage of thyroid dose that would
otherwise be received (Blum 1967).
To represent thyroid blockade when calculating absorbed dose due to internal
exposure to radioiodines, the latest available iodine biokinetic model by Leggett reduces
the value of a transference coefficient that represents the organification of iodide in the
thyroid, which has a baseline age-independent value of 95 day-1 (Leggett 2017). For
modeling complete thyroid blockade, the transference coefficient is set to zero. Under
such parameters, modeling shows that thyroid blockade reduces radioiodine dose to all
affected organs except the stomach, for which there is a moderate increase in dose
(Leggett 2017). Thyroid blockade is usually incorporated by use of the stable compound
Potassium Iodide (KI); this is colloquially referred to as “KI Prophylaxis.”
Because dietary levels of iodine affect the activity of the sodium-iodide symporter in
thyroid follicular cells, the effectiveness of thyroid blockade at a fixed prophylactic dose
can vary depending on the pre-exposure dietary levels of iodine. When dietary levels of
iodine are insufficient for production of T3 and T4, the thyroid enlarges and absorbs
more iodine from the blood compared to conditions of euthyroidism. As a consequence,
thyroid blockade is less protective at a fixed prophylactic dose if dietary levels of iodine
are low prior to exposure (Zanzonico 2000).

13
Chapter 3. Methods and Materials
3.1. Source Term
Because this assessment involves risk of thyroid cancer and its potential reduction,
relevant radioisotopes under consideration are those whose target organ is the thyroid.
Iodine and its isotopes all target the thyroid, and all isotopes except 127I are radioactive.
Radioactive iodines are the most significant regarding potential thyroid dose from a
radiological release involving fission of heavy atoms, as was especially seen at
Fukushima (IAEA 2015). Table 3.1. summarizes characteristics of several radioactive
isotopes of iodine that are produced by nuclear fission.
Table 3.1. Characteristics of radioactive isotopes of iodine produced by nuclear fission (Knolls Atomic Power Lab 2010, MIRD 1975).
Only one radioisotope of iodine, 131I, was considered for this assessment as the
principle hazard. Other isotopes of iodine could be included, but only 131I has substantial
dispersion and uptake potential due to its long half-life and moderately high fission yield.
Its 235U fission yield guarantees that it is produced in moderate quantities inside of 235U
fission reactors operating for commercial power production.
The basis for the magnitude of 131I release as the source term was rooted in
historical radiological incidents in which there were substantial releases of radioactive
Mass Number Half-life 235U Fission Yield (%)Thyroid Absorbed Dose per Unit Cumulated Activity in the Thyroid (rad/μCi-hr)
125 59.4 d 0.03 3.00E-03126 12.89 d 0.06 1.80E-02129 1.57E+07 y 0.54 7.10E-03130 12.36 h 1.81 3.90E-02131 8.023 d 2.89 2.20E-02132 2.283 h 4.31 6.00E-02133 20.8 h 6.70 4.60E-02
Characteristics of Fission-Produced Radioactive Iodine Isotopes
14
iodine from a nuclear power plant. Historical radiological incidents established a
plausible magnitude of 131I release for the proposed release scenario of this assessment.
The historical incidents considered here were those that occurred at Chernobyl and
Fukushima. The Chernobyl accident, while certainly a substantial release of 131I, does
not wholly represent the scenario of a release in Louisiana due to differences of design
between United States’ reactors and Chernobyl’s RMBK-type reactor (National Research
Council 2004); Chernobyl’s RMBK-type reactor used flammable graphite as a neutron
moderator and did not have a containment vessel (NRC 1987). The Fukushima accident
is more relevant because the power plant’s general design is similar to that of United
States’ reactors, in that both use water as a neutron moderator and have a containment
vessel (IAEA 2015). The magnitude of core inventory release from Fukushima could
plausibly occur at a United States facility if a similarly low-probability beyond-design-
basis event were to occur.
For this assessment, a nuclear power plant in Louisiana was selected as the release
location. Three nuclear power plants are located in or immediately adjacent to Louisiana:
River Bend, Waterford 3, and Grand Gulf. Of those three, River Bend is the only power
plant whose reactor is the same type as Fukushima’s (boiling water reactor); it also is
located near the highly populated Baton Rouge metropolitan area. Having the release
point located near a high-population area enables a worst-case conservative model
regarding numbers of potentially exposed individuals. Therefore, the reactor building at
River Bend was chosen as the release point.
With bases selected for the magnitude and location of release, the source term (i.e.
the release magnitude and rate) was established by assuming the same severity as the
15
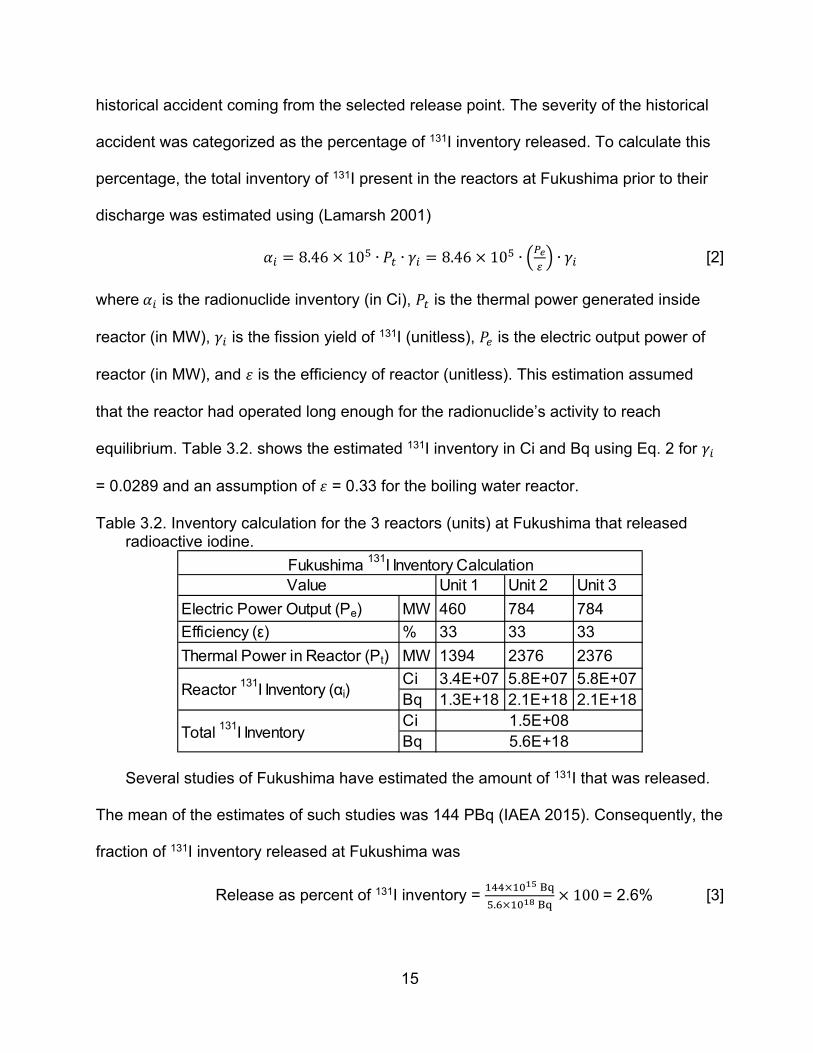
historical accident coming from the selected release point. The severity of the historical
accident was categorized as the percentage of 131I inventory released. To calculate this
percentage, the total inventory of 131I present in the reactors at Fukushima prior to their
discharge was estimated using (Lamarsh 2001)
𝛼 8.46 10 ∙ 𝑃 ∙ 𝛾 8.46 10 ∙ ∙ 𝛾 [2]
where 𝛼 is the radionuclide inventory (in Ci), 𝑃 is the thermal power generated inside
reactor (in MW), 𝛾 is the fission yield of 131I (unitless), 𝑃 is the electric output power of
reactor (in MW), and 𝜀 is the efficiency of reactor (unitless). This estimation assumed
that the reactor had operated long enough for the radionuclide’s activity to reach
equilibrium. Table 3.2. shows the estimated 131I inventory in Ci and Bq using Eq. 2 for 𝛾
= 0.0289 and an assumption of 𝜀 = 0.33 for the boiling water reactor.
Table 3.2. Inventory calculation for the 3 reactors (units) at Fukushima that released radioactive iodine.
Several studies of Fukushima have estimated the amount of 131I that was released.
The mean of the estimates of such studies was 144 PBq (IAEA 2015). Consequently, the
fraction of 131I inventory released at Fukushima was
Release as percent of 131I inventory =
. 100 = 2.6% [3]
Unit 1 Unit 2 Unit 3
Electric Power Output (Pe) MW 460 784 784
Efficiency (ε) % 33 33 33
Thermal Power in Reactor (Pt) MW 1394 2376 2376
Ci 3.4E+07 5.8E+07 5.8E+07Bq 1.3E+18 2.1E+18 2.1E+18CiBq
Fukushima 131I Inventory CalculationValue
Reactor 131I Inventory (αi)
Total 131I Inventory1.5E+085.6E+18
16
For River Bend operating at its licensed capacity of 3091 MW thermal (NRC 2018),
the corresponding hypothetical fractional release was calculated using (Lamarsh 2001)
𝑄 𝛼 ∙ 𝑓 8.46 10 ∙ 𝑃 ∙ 𝛾 ∙ 𝑓 [4]
where 𝑄 is the total 131I emission (in Ci), 𝛼 is the radionuclide inventory (in Ci), 𝑃 is the
thermal power generated inside reactor (in MW), 𝛾 is the fission yield of radionuclide
(unitless), and 𝑓 is the fraction of inventory released (unitless). The total emission 𝑄 was
equal to 7.3 10 Bq.
Assuming that the total emission is released over an amount of time similar to the
period over which a majority of Fukushima’s inventory was released, approximately 4
days, then the hypothetical emission rate 𝑄 was 1.8 10 Bq/day, or 2.1 10 Bq/s.
The emission rate 𝑄 was the source term for the hypothetical accident scenario
modeled in this assessment, representing the release rate of 131I from River Bend. The
emission rate was assumed to be constant for purposes of environmental transport (see
Section 3.2). When calculating dose, this value was subdivided to account for the
proportion of gaseous iodine to particle iodine (see Section 3.4).
3.2. Environmental Transport
Because the duration of the emission is assumed to be 4 days, this hypothetical
scenario represented an acute, short-term release. Additionally, the potential transit time
of emitted effluent was short (hours) compared to the duration of the emission (days)
based upon local wind speed data that is discussed later in this section. Transit time of
the effluent, relative to the duration of its emission, is important to identify prior to
selecting an environmental model because it determines whether the release is a puff or

17
plume. Generally, if the release duration of the effluent is short compared to the transit
time, then it’s a puff; otherwise, it’s a plume (Pasquill 1984, Till 2008).
Because the potential transit time of the effluent was short compared to the duration
of the emission, a Gaussian plume model was an appropriate choice for a transport
model. An additional advantage of using a Gaussian plume model was that it provided
results that were obtainable without significant computational power. The Gaussian
plume model used in this assessment was (Till 2008)
𝐶𝑄
2𝜋𝜇𝜎 𝜎exp
12
𝑦𝜎
exp12
𝑧 ℎ𝜎
exp12
𝑧 ℎ𝜎
exp .
/𝑥 [5]
where 𝐶 is concentration in air, 𝑄′ is the source term or emission rate, μ is wind speed,
ℎ is effective stack height, T / is the 131I half-life, 𝑥 is downwind distance, 𝑦 is
crosswind distance, 𝑧 is vertical distance (fixed height at which concentration is
calculated), and 𝜎 and 𝜎 are the standard deviations of a Gaussian distribution in the
crosswind and vertical directions, respectively. Eq. 5 assumes that the concentration is
reflected into the atmosphere when it encounters the ground (Till 2008). The last
exponential term of Eq. 5 accounts for radioactive decay of 131I. Values of terms in the
Gaussian plume model are summarized in Table 3.3.
The emission rate, 𝑄′, is the source term that was calculated previously (see Section
3.1). The height at which concentration in air was calculated, 𝑧, was 1.5 meters (5 feet)
because human intake of the radionuclide occurs near head-height.
For the effective stack height, ℎ , a constant value of 100 m was based upon
evaluations of the Fukushima accident, where the stack height ranged from

18
approximately 20 to 150 meters depending on the mode of release (Korsakissok 2013).
For the 20 to 150 m range of stack height, the value of 100 m used for ℎ was somewhat
arbitrary because the transport model was insensitive to changes in effective stack
height. This was determined by holding other transport variables constant, varying the
effective stack height within a 20 to 150 m range, and observing changes in transport.
Table 3.3. Summary of values used for the Gaussian plume model.
*For an assumed atmospheric stability category.
For the wind speed, μ, a constant value of 6 m/s was chosen based upon 2018
climatology data from the National Oceanic and Atmospheric Administration (NOAA
2018). This value represented a wind speed that was higher than typical monthly
averages for the Louisiana area. In 2018, monthly average wind speeds ranged from ~3
m/s to ~5 m/s (NOAA 2018). A higher-than-monthly-average wind speed was used to
compensate for two factors. The first factor was the Gaussian plume model’s assumption
of steady-state conditions for a constant atmospheric stability. For steady-state
conditions and constant atmospheric stability, lower wind speeds generated higher
concentrations for a given downwind distance but resulted in excessive travel of the
plume to distances where the model, in its simplest form here, is unlikely to be reliable.
The second factor was the height of approximately 1.5 meters from which the NOAA
wind data was measured (NOAA 2018). Determination of the increase in wind speed at
Term Description Value UnitQ' Emission rate 2E+11 Bq/sμ Wind speed 6 m/s
hp Effective stack height 100 m
T1/2131I half-life 8.023 day
z Observation height 1.5 m
σy Crosswind standard deviation
σz Vertical standard deviation
Dependent on downwind distance*
m

19
the plume’s stack height of 100 meters, relative to the wind speed measurement height
at 1.5 meters, was estimated using a wind profile power law relationship that depended
principally on an assumed “atmospheric stability category” that is discussed later in this
section. For the wind profile power law relationship detailed in the EPA’s Industrial
Source Complex 3 (ISC3) dispersion model (EPA 1995), a 4 m/s wind speed at a height
of 1.5 m corresponded to 6 m/s at 100 m. A wind speed of 6 m/s was adequately
representative of the area under consideration based upon local climatology data and
the requisite increase in wind speed at the stack release height relative to the height of
wind speed measurement.
The dispersion coefficients 𝜎 and 𝜎 were calculated using equations from the
EPA’s ISC3 dispersion model (EPA 1995), which contain equations that have been fitted
to measured and extrapolated plume dispersion data from Pasquill (Pasquill 1961). The
fitted equations for 𝜎 and 𝜎 depend on the “atmospheric stability category” of the
Pasquill curves. Atmospheric stability categories depend on wind speed range and sun
insolation during daytime or cloudiness during nighttime. Moderate or strong sun
insolation during daytime was assumed, as both resulted in the same atmospheric
stability category. For a 6 m/s wind speed and moderate or strong sun insolation during
daytime, corresponding to atmospheric stability category C (Pasquill 1961), the
equations for 𝜎 and 𝜎 were
𝜎 465.11628𝑥 ∗ tan 0.017453293 12.5 1.0857 ln 𝑥 [6]
and
𝜎 61.141𝑥 . for 𝜎 5000 [7]
20
where 𝑥 is downwind distance (in km), and 𝜎 and 𝜎 are dispersion coefficients (in m).
The dispersion coefficients from Pasquill were for an approximate 10-minute averaging
time (Pasquill 1961), which is less than this hypothetical release’s duration of 96 hours.
The coefficients could have been adjusted to compensate for that difference by using an
empirical formula (Gifford 1982), but that adjustment would have resulted in further
diffusion of the plume. It was a conservative approach to exclude the empirical
adjustment because, by excluding it, the resultant plume covered a larger area. The
Gaussian plume model used in this assessment was calculated with the software
MATLAB R2018a by MathWorks.
3.3. Population Exposure Factors
The plume of 131I was assumed to travel along a worst-case path, which was defined
as the straight-line path from the radionuclide release point that results in the largest
potential risk to the exposed population. This assessment defined a metric called
cumulative susceptibility to excess risk (CSER) to determine which populations near the
radionuclide release point were most susceptible to excess risk due to 131I exposure. The
CSER for a population P was defined as
CSER ∑ 𝛼 𝛽 , ∑ 𝛼 𝛽 , [8]
where CSER is cumulative susceptibility to excess risk for population P, 𝛼 is ERR per
Gy of thyroid dose for demographic 𝑖 of population P, and 𝛽 is the size of demographic 𝑖
(i.e. number of people). The CSER does not account for varying population density
within a given area or that doses received by individuals within the population vary
according to several factors.

21
The demographic categories for this assessment comprised age groups from <5
years to 39 years of age at exposure. Individuals over this age were not included in the
population because the risk of radiation-induced thyroid cancer, the risk endpoint for this
assessment, is low (National Research Council 2006). In older individuals, the principal
risk is destruction of thyroid tissue rather than thyroid cancer. This is illustrated by the
FDA’s recommendations of KI prophylaxis as a thyroid protective measure, whereby the
intervention level is a projected thyroid dose of ≥500 cGy for those over 40 years old
versus ≥10 cGy for those aged 18 to 40 years at the time of exposure (FDA 2001).
The sizes of the demographics, 𝛽 , in the Louisiana parishes surrounding the River
Bend nuclear power plant were calculated from 2017 demographic estimates derived
from 2010 census data (ACS 2018). Population density within each parish was assumed
to be uniform. Demographics were defined for 8 age groups for both males and females;
the age groups were <5, 5-9, 10-14, 15-19, 20-24, 25-29, 30-34, and 35-39 years old.
For determining the ERR per Gy for each demographic, 𝛼 , the BEIR VII committee’s
risk model for thyroid cancer was used (National Research Council 2006). 𝛼 was
calculated as
𝛼 ,15
0.53 ∗ exp 0.083 𝑒 30∈
[9]
for males and
𝛼 ,15
1.05 ∗ exp 0.083 𝑒 30∈
[10]
for females, where the 𝑒 are the ages at exposure in years within each demographic.

22
3.4. Conversion to Dose and Risk
As discussed in Section 2.3.2, inhalation dose is the dominant pathway for exposure
following a release of 131I from a nuclear power plant; the ingestion pathway is
constrained by interdiction procedures that halt distribution of contaminated food and
drink (see Section 2.3.2). Consequently, only the inhalation pathway was included in
calculation of dose.
To determine the amount of 131I inhaled by exposed populations, ventilation
parameters and time expenditures (hours spent per day at some level of physical
activity) from ICRP Publication 71 were used (ICRP 1995). Because this assessment
modeled a worst-case scenario where no evacuation or sheltering occurs, it was
assumed that populations are exposed for 24 hours per day, totaling to 96 hours of
exposure over the scenario’s release duration of 4 days. The total intake of 131I for each
demographic was calculated as
𝐼 𝐵𝑅 𝑇𝐸 𝐻𝐸 𝐶 [11]
where 𝐼 is the total intake of 131I for demographic 𝑖 (in Bq), 𝐵𝑅 is the breathing rate for
demographic 𝑖 (in m3/hr), 𝑇𝐸 is the normalized time expenditure for demographic 𝑖
(unitless), 𝐻𝐸 is the exposure time (in hours), and 𝐶 is the concentration of 131I in air (in
Bq/m3).
For relating inhalation of 131I to dose, 80% of the emitted iodine was assumed to be
in the form of elemental iodine as a gas, and 20% was an aerosol with a 1 µm activity
median aerodynamic diameter (AMAD), which is similar to observations at Fukushima
(IAEA 2015). Both forms of iodine were assumed to transport identically with regard to
the environmental transport model because gravitational settling and deposition effects,

23
which are the principal differences between atmospheric transport of particles and gases
(Brenk et. al 1983), were not incorporated into the transport model. This assumption
likely overestimated airborne concentrations due to a lack of removal of iodine from the
plume as it was transported (Lakes 2019).
Sex-averaged committed equivalent dose coefficients from ICRP Publication 71
were used to calculate thyroid committed equivalent dose for the 131I inhalation pathway.
Because 131I emits only photons and beta particles (Knolls Atomic Power Lab 2010),
whose radiation weighting factors are equal to 1 (ICRP 2007), the thyroid committed
equivalent dose given by the dose coefficients in Sv was equal to the thyroid absorbed
dose in Gy. This conversion was necessary because the appropriate unit for the thyroid
cancer risk model used in this assessment is Gy, not Sv (National Research Council
2006). Dose coefficients used for each demographic are summarized in Table 3.4. Dose
was calculated identically for males and females; the dose to males and females per
intake are about the same because both intake and body mass are about 20% lower for
females (ICRP 1995). Additionally, iodine retention does not appear to differ substantially
between sexes (Leggett 2017).
Table 3.4. Dose coefficients used for each demographic (ICRP 1995).
CohortAge Range (Years)
Median Age (Years)
Gaseous Thyroid Dose Coeff. for Median Age (Gy/Bq)
Aerosol (AMAD=1µm) Thyroid Dose Coeff. for Median Age (Gy/Bq)
1 <5 2 3.20E-06 1.40E-062 5-9 7 1.90E-06 7.30E-073 10-14 12 9.50E-07 3.70E-074 15-19 17 6.20E-07 2.20E-075 20-24 22 3.90E-07 1.50E-076 25-29 27 3.90E-07 1.50E-077 30-34 32 3.90E-07 1.50E-078 35-39 37 3.90E-07 1.50E-07

24
Because the Gaussian plume model can calculate radionuclide concentrations down
to arbitrarily small values, a cutoff value was needed to define the plume boundary.
Louisiana’s Peacetime Radiological Response Plan states that evacuation is
recommended for areas where the exposed population is anticipated to receive a thyroid
committed dose equivalent (CDE) ≥5000 mrem (Louisiana Department of Health 2016).
The plume boundary concentration (BC) was calculated using the concentration of 131I
(80% gaseous and 20% 1 µm AMAD) that resulted in a thyroid CDE of 5000 mrem (0.05
Sv) for a person <5 years of age engaged in light exercise for the entirety of the
hypothetical release (4 days, or 96 hours). The BC was calculated as
BC
[12]
and when parameters from ICRP Publication 71 (ICRP 1995) were applied,
BC0.05 Sv
3.23 10 ∗ 0.8 1.4 10 ∗ 0.2 SvBq
1
0.35 mhr ∗ 96 hr
520 Bq/m
which was rounded down to 500 Bq/m3 for convenience, to become the cutoff value that
defined the plume boundary.
Parish-specific uniform population densities were assumed when calculating thyroid
absorbed dose, ERR, and Lifetime Attributable Risk (LAR, see Section 2.2). Because of
that assumption, values of dose and risk were calculated for every potential location
within the plume. Thyroid absorbed dose was calculated using the ICRP dose
coefficients shown in Table 3.4. ERR was calculated using the BEIR VII thyroid cancer
risk model from Eq. 1. Values of ERR from this assessment were plotted as averages
over 5-year age range groups and included the expected value, upper bound, and lower
bound for each data point.

25
LAR was calculated as
𝐿𝐴𝑅 𝐷, 𝑒 ∑ 𝐸𝑅𝑅 𝐷, 𝑒 𝜆 𝑎 [13]
where 𝐸𝑅𝑅 is the excess relative risk, 𝐷 is the absorbed dose, 𝑎 is the attained age, 𝑒 is
the age at exposure, 𝐿 is the latent period (assumed to be 5 years), 𝜆 𝑎 is the age- and
sex-specific cancer incidence rate, 𝑆 𝑎 is the probability of surviving to age 𝑎, and 𝑆 𝑒
is the probability of surviving to age 𝑒. The fraction is the probability of surviving to
age 𝑎 conditional on survival to age 𝑒.
Values of 𝜆 𝑎 were obtained from 2011-2015 Surveillance, Epidemiology, and
End Results (SEER) registries for all stages (malignant) of thyroid cancer (NAACCR
2018). Louisiana-specific thyroid cancer incidence, when not suppressed, was used.
When Louisiana-specific incidence was suppressed, the United States average was
used. For females aged less than one-years old, both the Louisiana and United States
average incidence was suppressed, so a value of 0.01 per 100,000 was assumed. This
assumption was intended to represent a non-zero incidence rate; for comparison to other
rates, the assumed incidence rate was lower than all other demographic incidence rates,
with the closest being 0.02 per 100,000 for males aged two-years old (NAACCR 2018).
Because the incidence rates from SEER registries are given over a range of ages
rather than for single years of age, linear interpolation was used to determine incidence
rates for single years of age. For ages 85 and up, linear interpolation was not used, and
instead the constant incidence rate for ages 85 and up (given by SEER data) was used.
Values of S(a) and S(e) for single years of age were obtained from 2015 Life Tables
(Arias 2018). Values of LAR from this assessment were plotted as averages over 5-year
26
age range groups and included the expected value, upper bound, and lower bound for
each data point.
Excess lifetime thyroid cancers were calculated by multiplying percentile values of
the demographic-specific LAR distribution by the total number of exposed people within
a given demographic. To calculate the total number of exposed people, the assumed
parish-specific uniform population densities were multiplied by the area of plume
coverage over the affected parishes. The area of plume coverage for each parish was
approximated by dividing the plume into 60 rectangular segments and then summing the
area of segments located within the parish of interest. To calculate the total number of
exposed people within each demographic, parish-specific proportions of each
demographic were assumed to hold constant over the plume area. For example, if 3% of
a parish’s population was males aged 10-14, then it was assumed that 3% of the
population within an exposed area of that same parish was males aged 10-14.
3.5. Reduction of Risk
For modeling thyroid cancer risk reduction by KI prophylaxis, the thyroid absorbed
dose was multiplied by a reduction constant. The value of the constant was determined
by two approaches.
The first approach, termed the “ideal model,” used results from a biokinetic model for
iodine in humans (Leggett 2017), where the thyroid was considered blocked during the
entirety of exposure to 131I. To model complete thyroid blockade, a transference
coefficient of the biokinetic model that represents the organification of iodide in the
thyroid was set to zero. Reduction of thyroid dose was calculated from the ratio of thyroid
27
CDE per Bq with complete thyroid blockade versus without thyroid blockade for
intravenous injection of 131I into an adult male (Leggett 2017).
The second approach, termed the “Poland model,” used results from an evaluation
of approximately 17.5 million individuals in Poland who were administered KI in response
to the Chernobyl accident (Nauman 1993). In the evaluation, thyroid doses to the
exposed population were reconstructed, and the dose reduction due to thyroid blockade
was estimated in consideration of ingestion and inhalation pathways and the timing of KI
administration relative to exposure to 131I (Nauman 1993).
28
Chapter 4. Results and Discussion
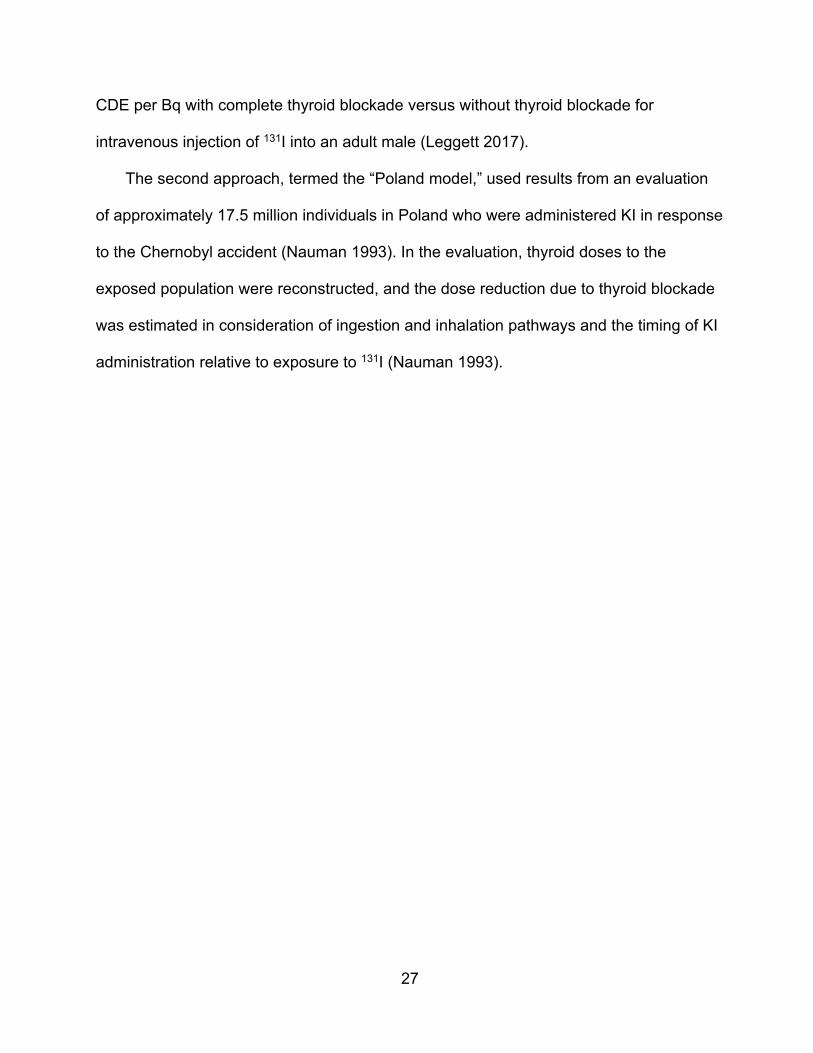
Figure 4.1. shows the downwind and crosswind concentration of airborne 131I from a
release point located at the origin of the plot. Figure 4.1. was generated using MATLAB
R2018a by MathWorks, and the resolution of the plot is 25 meters (i.e. there is one data
point of concentration every 25 meters).
Figure 4.1. Steady-state concentration of airborne 131I for a wind speed of 6 m/s, at an
observation height of 1.5 m, due to an emission rate of 2*1011 Bq/s.
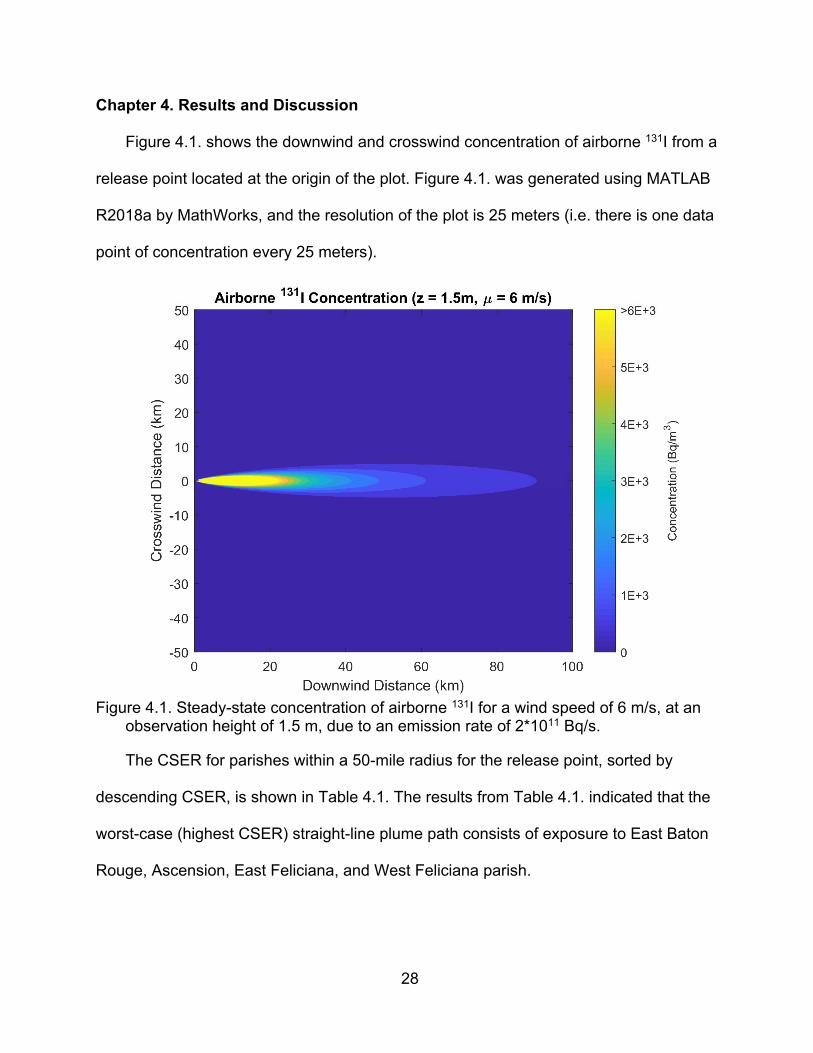
The CSER for parishes within a 50-mile radius for the release point, sorted by
descending CSER, is shown in Table 4.1. The results from Table 4.1. indicated that the
worst-case (highest CSER) straight-line plume path consists of exposure to East Baton
Rouge, Ascension, East Feliciana, and West Feliciana parish.
29
Table 4.1. CSER of Louisiana parishes that are within a 50-mile radius of the reactor building of River Bend Nuclear Station.
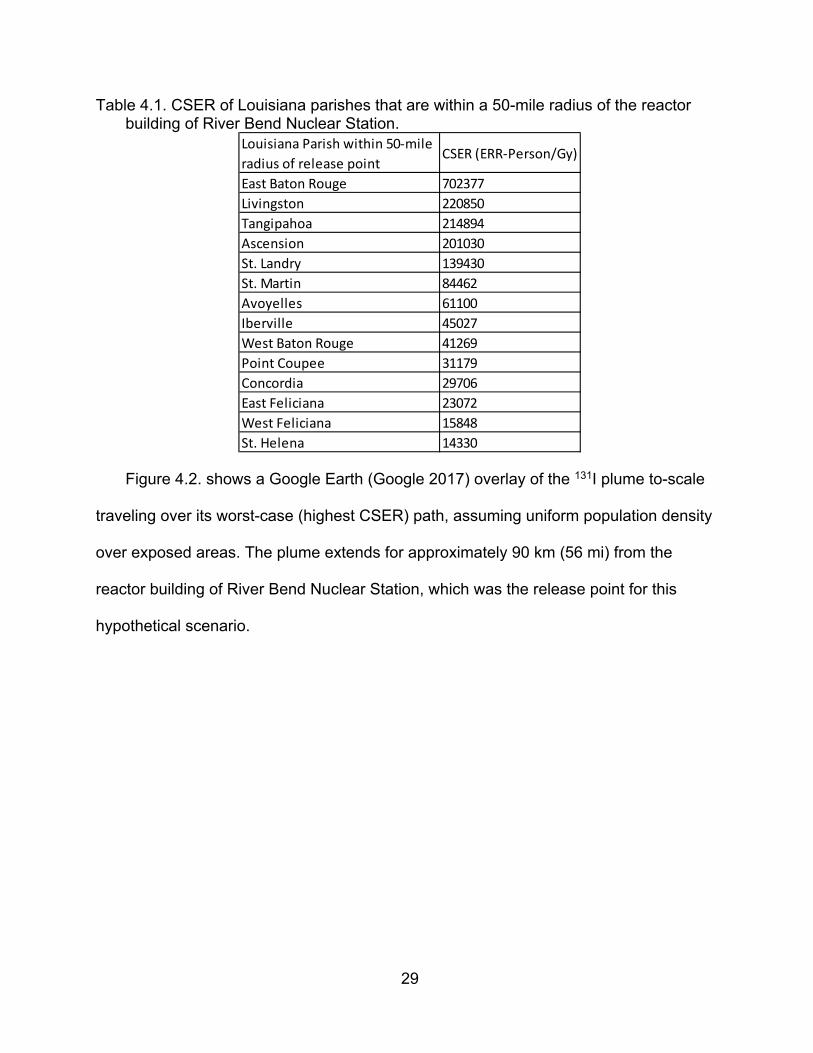
Figure 4.2. shows a Google Earth (Google 2017) overlay of the 131I plume to-scale
traveling over its worst-case (highest CSER) path, assuming uniform population density
over exposed areas. The plume extends for approximately 90 km (56 mi) from the
reactor building of River Bend Nuclear Station, which was the release point for this
hypothetical scenario.
Louisiana Parish within 50‐mile
radius of release pointCSER (ERR‐Person/Gy)
East Baton Rouge 702377
Livingston 220850
Tangipahoa 214894
Ascension 201030
St. Landry 139430
St. Martin 84462
Avoyelles 61100
Iberville 45027
West Baton Rouge 41269
Point Coupee 31179
Concordia 29706
East Feliciana 23072
West Feliciana 15848
St. Helena 14330
30
Figure 4.2. To-scale overlay of the modeled 131I concentration over its worst-case path
according to the CSER; this assumes uniform population density within each parish. The plume’s heading is 144.3 degrees from due north and extends for approximately 90 km (56 mi) from the release point. The source is located at latitude 30°45’26.67”N, longitude 91°19’54.89”W (Google 2017).
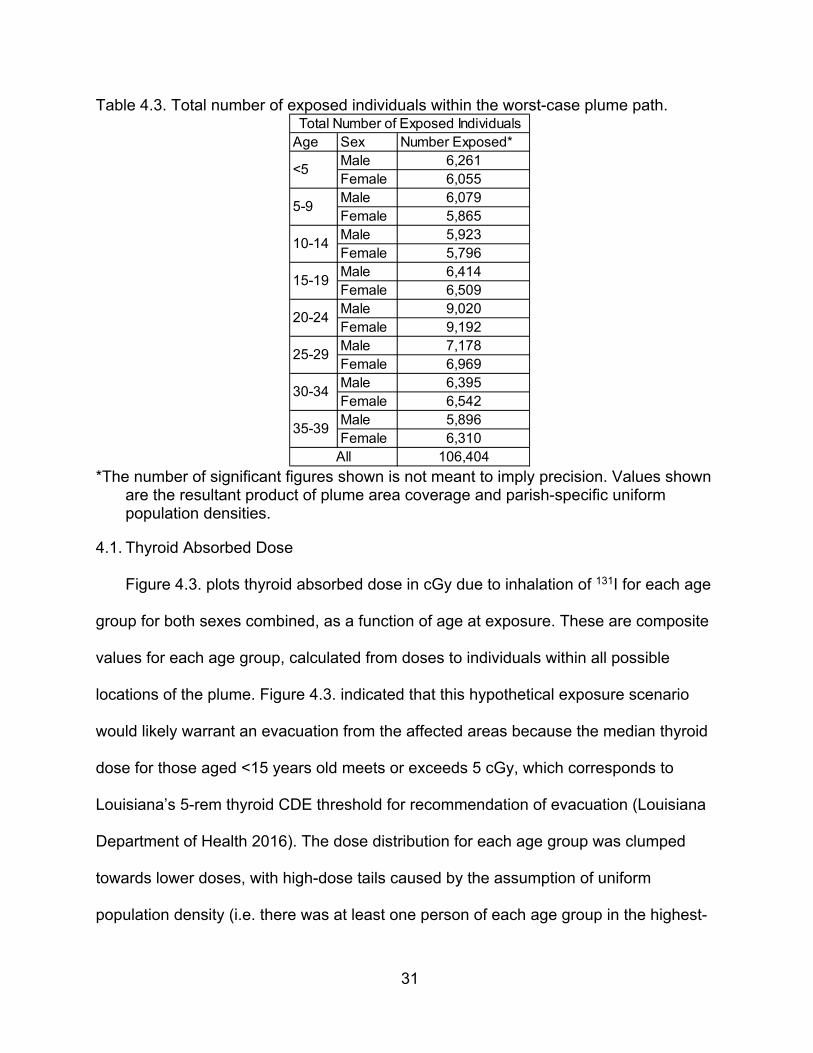
Table 4.3. summarizes the number of exposed people within the plume path. As
discussed in Section 3.4, the numbers of exposed people within each demographic were
used when excess cancers were calculated. Due to the Baton Rouge population, the
largest number of people exposed were those between 20 and 24 years of age.
31
Table 4.3. Total number of exposed individuals within the worst-case plume path.
*The number of significant figures shown is not meant to imply precision. Values shown
are the resultant product of plume area coverage and parish-specific uniform population densities.
4.1. Thyroid Absorbed Dose
Figure 4.3. plots thyroid absorbed dose in cGy due to inhalation of 131I for each age
group for both sexes combined, as a function of age at exposure. These are composite
values for each age group, calculated from doses to individuals within all possible
locations of the plume. Figure 4.3. indicated that this hypothetical exposure scenario
would likely warrant an evacuation from the affected areas because the median thyroid
dose for those aged <15 years old meets or exceeds 5 cGy, which corresponds to
Louisiana’s 5-rem thyroid CDE threshold for recommendation of evacuation (Louisiana
Department of Health 2016). The dose distribution for each age group was clumped
towards lower doses, with high-dose tails caused by the assumption of uniform
population density (i.e. there was at least one person of each age group in the highest-
Age Sex Number Exposed*Male 6,261Female 6,055Male 6,079Female 5,865Male 5,923Female 5,796Male 6,414Female 6,509Male 9,020Female 9,192Male 7,178Female 6,969Male 6,395Female 6,542Male 5,896Female 6,310
106,404
Total Number of Exposed Individuals
<5
5-9
10-14
15-19
20-24
25-29
30-34
35-39
All

32
concentration areas of the plume). Table A.1. provides the percentile values of dose that
comprise Figure 4.3.
Figure 4.3. Thyroid absorbed dose as a function of age at exposure due to inhalation of
131I. Horizontal lines of the boxes represent 25th, 50th, and 75th percentiles.
For comparison of these results to the Fukushima accident upon which the exposure
scenario is based, the majority of emergency workers (17,804 of 19,561; 91%) who
assisted during the Fukushima accident were estimated to have received thyroid
absorbed doses of less than 10 cGy (IAEA 2015). Concerning thyroid dose to the
general public from the Fukushima accident, an assessment from the World Health
Organization estimated a typical dose band to those in the Fukushima Prefecture of 1-10
cGy, with one particular location having an estimated 10-20 cGy dose to infants (IAEA
2015). The distribution of thyroid dose shown in Figure 4.3. generally tracked with the
distribution of thyroid dose from the Fukushima accident, which suggested that the
results were reasonable for the hypothetical exposure scenario.

33
4.2. Thyroid Cancer Risk
Figure 4.4. plots ERR for each age group for both sexes. As expected, females
showed a higher ERR than males because the thyroid cancer risk model used in this
assessment predicted a higher ERR per Gy for females than males (see Eq. 1), and
dose was calculated independent of sex. The majority of ERR was below a value of 1,
which meant that most of the exposed population had less than a 100% increase
(doubling) of their baseline thyroid cancer risk. The only demographic that exceeded an
ERR of 1 in their interquartile range was females <10 years of age. In contrast, people
exposed at >19 years of age had increases in baseline risk that were generally below
20%, indicating that risk reduction interventions (such as KI prophylaxis) should prioritize
young populations. Table A.2. provides the percentile values of ERR that comprise
Figure 4.4.
Figure 4.4. ERR as a function of sex and age at exposure due to inhalation of 131I.
Horizontal lines of the boxes represent 25th, 50th, and 75th percentiles.

34
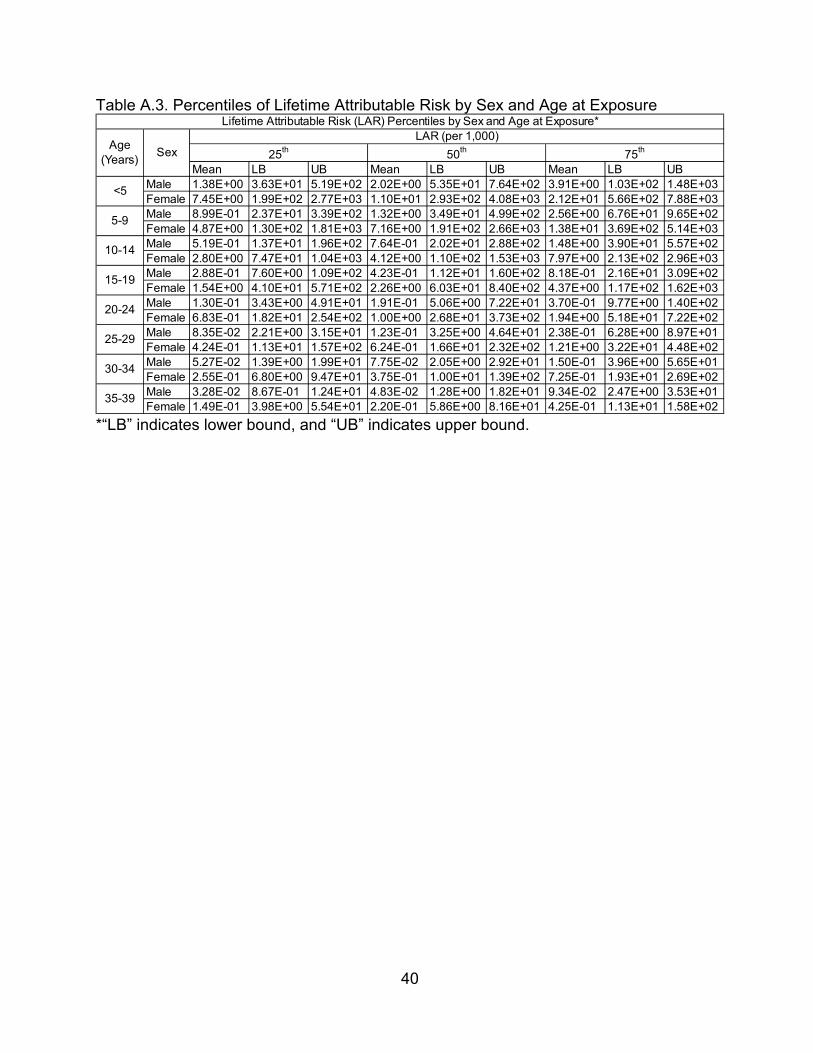
Figure 4.5. plots LAR per 1,000 people exposed for each age group for both sexes
(see Sections 2.2 and 3.4 for definition of LAR). Figure 4.5. indicated that females had a
LAR that was larger than males by a factor of about 5, meaning that excess lifetime
thyroid cancer incidence due to exposure was 5 times larger for females than males.
Table A.3. provides the percentile values of LAR that comprise Figure 4.5.
Figure 4.5. LAR (per 1,000) as a function of sex and age at exposure, assuming a 5-year
latent period for radiation-induced thyroid cancer. Horizontal lines of the boxes represent 25th, 50th, and 75th percentiles.
Females were expected to have a larger LAR than males for three reasons. The first
reason was that females generally have a higher baseline thyroid cancer risk than males
(NAACCR 2018), meaning that their excess absolute risk (EAR, see Section 2.2) for a
given value of ERR would be larger than for males. The second reason was that females
generally have a longer life expectancy than males (Arias 2018), so that when LAR was
calculated, the high incidence rates of old age were weighted more. The third reason

35
was that the thyroid cancer risk model used in this assessment predicts a higher ERR
per Gy for females than males (see Eq. 1).
4.3. Risk Reduction
For the ideal model approach, which assumes thyroid is blocked for the entirety of
exposure to 131I, thyroid dose was reduced by three orders of magnitude (Leggett 2017).
The ideal model does not represent a typical dose reduction, but it was helpful to
estimate the extent to which cross-irradiation from 131I accumulation in non-thyroidal
tissue would impact thyroid dose when the thyroid is blocked.
For the Poland model approach, a retrospective evaluation of populations in Poland
that received KI in response to the Chernobyl accident estimated that thyroid blockade
reduced thyroid doses by 40% (Nauman 1993). The authors of the evaluation further
stated that, had there been timely notification of the accident by Russian authorities, the
dose reduction could have been as high as 60% to 70% with early prophylaxis,
particularly with respect to inhaled 131I (Nauman 1993).
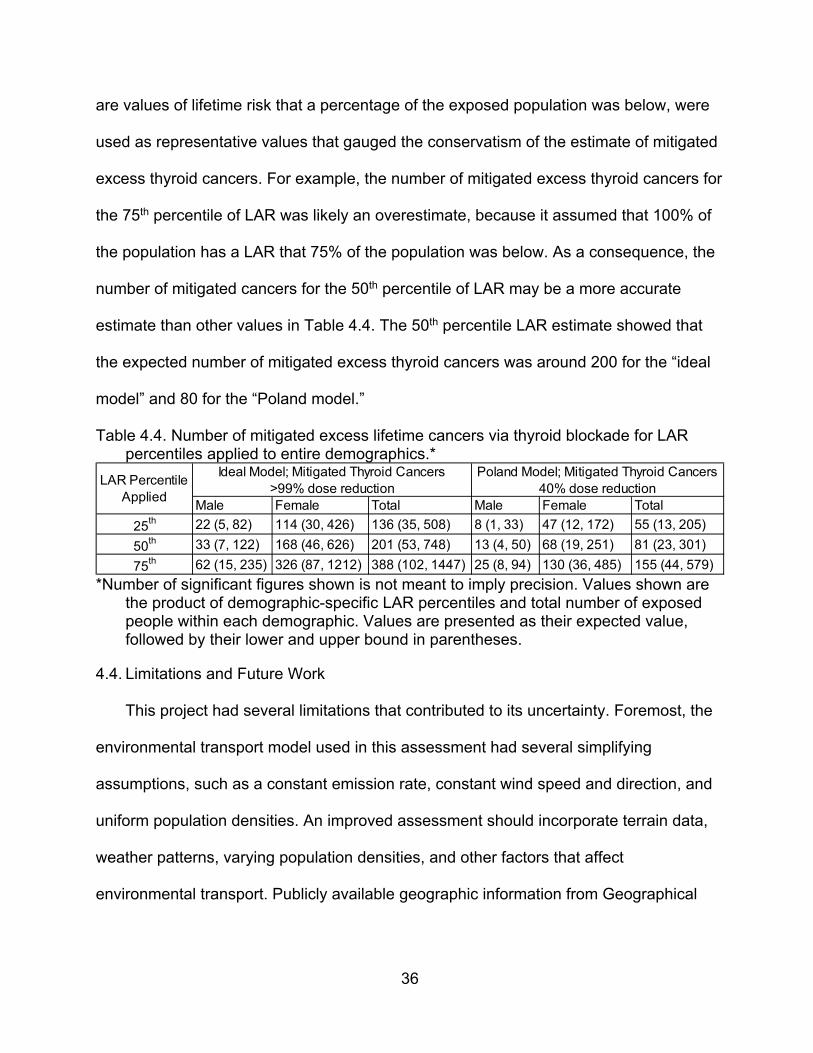
Table 4.4. shows the number of mitigated excess lifetime thyroid cancers from
thyroid blockade for this assessment’s hypothetical exposure scenario, as a function of
percentiles of LAR. Values in Table 4.4. were presented in the form of their expected
value followed by their lower and upper bound in parentheses. As expected, based upon
the results of LAR in Figure 4.5., the majority of excess lifetime thyroid cancers mitigated
by thyroid blockade were due to females.
The two approaches of dose reduction shown in Table 4.4. illustrated an ideal
reduction (“ideal model”), which is unlikely to be achievable in practice, and a plausible
reduction (“Poland model”) of excess lifetime thyroid cancers. Percentiles of LAR, which
36
are values of lifetime risk that a percentage of the exposed population was below, were
used as representative values that gauged the conservatism of the estimate of mitigated
excess thyroid cancers. For example, the number of mitigated excess thyroid cancers for
the 75th percentile of LAR was likely an overestimate, because it assumed that 100% of
the population has a LAR that 75% of the population was below. As a consequence, the
number of mitigated cancers for the 50th percentile of LAR may be a more accurate
estimate than other values in Table 4.4. The 50th percentile LAR estimate showed that
the expected number of mitigated excess thyroid cancers was around 200 for the “ideal
model” and 80 for the “Poland model.”
Table 4.4. Number of mitigated excess lifetime cancers via thyroid blockade for LAR percentiles applied to entire demographics.*
*Number of significant figures shown is not meant to imply precision. Values shown are
the product of demographic-specific LAR percentiles and total number of exposed people within each demographic. Values are presented as their expected value, followed by their lower and upper bound in parentheses.
4.4. Limitations and Future Work
This project had several limitations that contributed to its uncertainty. Foremost, the
environmental transport model used in this assessment had several simplifying
assumptions, such as a constant emission rate, constant wind speed and direction, and
uniform population densities. An improved assessment should incorporate terrain data,
weather patterns, varying population densities, and other factors that affect
environmental transport. Publicly available geographic information from Geographical
Male Female Total Male Female Total
25th 22 (5, 82) 114 (30, 426) 136 (35, 508) 8 (1, 33) 47 (12, 172) 55 (13, 205)
50th 33 (7, 122) 168 (46, 626) 201 (53, 748) 13 (4, 50) 68 (19, 251) 81 (23, 301)
75th 62 (15, 235) 326 (87, 1212) 388 (102, 1447) 25 (8, 94) 130 (36, 485) 155 (44, 579)
Ideal Model; Mitigated Thyroid Cancers>99% dose reduction
Poland Model; Mitigated Thyroid Cancers40% dose reduction
LAR Percentile Applied
37
Information Systems data could be incorporated into a transport model. Commercial
dispersion software packages, albeit expensive, include such features.
Regarding calculation of excess thyroid cancer risk, the risk model used in this
assessment was the preferred model reported in the BEIR VII report (National Research
Council 2006). The model was developed using a pooled analysis of data from seven
thyroid cancer incidence studies, which included atomic bomb survivors. Most of the data
involved external exposure from x-rays rather than internal exposure from 131I (National
Research Council 2006), which was the pathway of interest for this assessment. A
potentially important modifier of the model, though not well-quantified at this time, is
dietary iodine deficiency (Shakhtarin 2003, Cardis 2005). A Louisiana-specific study of
urinary iodine excretion could clarify iodine deficiency prevalence among populations
used for this assessment. This could be factored into the ERR per Gy for the affected
populations, so that the impact on the protective effect of KI prophylaxis could be
assessed.
A factor affecting the calculated LAR is the fact that thyroid cancer incidence in
Louisiana has been increasing over the past several years (NCI 2019). Because a
relative risk (RR) model was used for this assessment, an increase in baseline risk yields
a higher LAR for a fixed RR, which in turn would increase the potential number of excess
lifetime thyroid cancers induced by the hypothetical event described in this assessment.
Lastly, this assessment addressed only one factor pertaining to the risk
management question of whether Louisiana should provide KI pills to its general public.
Future work that addresses other factors of this question would be beneficial. The other
factors include financial cost; logistics of storage, distribution, and re-stocking of KI pills;

38
legal issues of widespread administration; and psychosocial ramifications of
implementing such a policy. Additionally, future work that models risk reduction from
anticipated evacuation and sheltering without thyroid blockade, and an associated
comparison to the risk reduction from thyroid blockade without evacuation and
sheltering, should aid decision-making for this issue.
4.5. Conclusion
This assessment provided a preliminary screening of the Louisiana-specific benefit
of thyroid cancer risk reduction due to thyroid blockade in a hypothetical exposure
scenario. Results indicated that thyroid blockade reduced a number of excess lifetime
thyroid cancers that was on the order of 80 across approximately 100,000 exposed
individuals, though the bounds on this estimate were large. The majority of mitigated
excess lifetime thyroid cancers were due to dose reduction in young females. Given
these results, more comprehensive assessments of KI distribution in Louisiana may be
warranted. By generating these results, people in positions of risk management for
Louisiana have access to Louisiana-specific information regarding the risk reduction
benefit of thyroid blockade for the general public.

39
Appendix A. Percentile Data of Dose, ERR, and LAR
Table A.1. Percentiles of Thyroid Absorbed Dose by Age at Exposure
Table A.2. Percentiles of Excess Relative Risk by Sex and Age at Exposure
*“LB” indicates lower bound, and “UB” indicates upper bound.
25th 50th 75th
<5 3.86E+00 5.68E+00 1.10E+015-9 3.82E+00 5.63E+00 1.09E+01
10-14 3.36E+00 4.95E+00 9.57E+0015-19 2.86E+00 4.21E+00 8.13E+0020-24 2.00E+00 2.94E+00 5.69E+0025-29 2.00E+00 2.94E+00 5.69E+0030-34 2.00E+00 2.94E+00 5.69E+0035-39 2.00E+00 2.94E+00 5.69E+00
Thyroid Absorbed Dose (cGy)Age (Years)
Percentiles of Thyroid Absorbed Dose by Age at Exposure
Mean LB UB Mean LB UB Mean LB UBMale 2.11E-01 5.56E-02 7.95E-01 3.10E-01 8.19E-02 1.17E+00 5.99E-01 1.58E-01 2.26E+00Female 4.17E-01 1.11E-01 1.55E+00 6.14E-01 1.64E-01 2.28E+00 1.19E+00 3.17E-01 4.41E+00Male 1.38E-01 3.64E-02 5.19E-01 2.03E-01 5.35E-02 7.65E-01 3.92E-01 1.03E-01 1.48E+00Female 2.73E-01 7.27E-02 1.01E+00 4.01E-01 1.07E-01 1.49E+00 7.76E-01 2.07E-01 2.88E+00Male 8.00E-02 2.11E-02 3.02E-01 1.18E-01 3.11E-02 4.44E-01 2.28E-01 6.01E-02 8.59E-01Female 1.58E-01 4.22E-02 5.88E-01 2.33E-01 6.22E-02 8.66E-01 4.51E-01 1.20E-01 1.67E+00Male 4.49E-02 1.19E-02 1.69E-01 6.60E-02 1.74E-02 2.49E-01 1.28E-01 3.37E-02 4.82E-01Female 8.89E-02 2.37E-02 3.30E-01 1.31E-01 3.49E-02 4.86E-01 2.53E-01 6.74E-02 9.39E-01Male 2.07E-02 5.47E-03 7.82E-02 3.05E-02 8.06E-03 1.15E-01 5.90E-02 1.56E-02 2.23E-01Female 4.11E-02 1.09E-02 1.53E-01 6.04E-02 1.61E-02 2.25E-01 1.17E-01 3.12E-02 4.34E-01Male 1.37E-02 3.62E-03 5.16E-02 2.01E-02 5.32E-03 7.60E-02 3.89E-02 1.03E-02 1.47E-01Female 2.71E-02 7.23E-03 1.01E-01 3.99E-02 1.06E-02 1.48E-01 7.72E-02 2.06E-02 2.87E-01Male 9.04E-03 2.39E-03 3.41E-02 1.33E-02 3.51E-03 5.02E-02 2.57E-02 6.79E-03 9.71E-02Female 1.79E-02 4.77E-03 6.65E-02 2.64E-02 7.03E-03 9.79E-02 5.10E-02 1.36E-02 1.89E-01Male 5.97E-03 1.58E-03 2.25E-02 8.78E-03 2.32E-03 3.32E-02 1.70E-02 4.49E-03 6.41E-02Female 1.18E-02 3.15E-03 4.39E-02 1.74E-02 4.64E-03 6.46E-02 3.36E-02 8.97E-03 1.25E-01
50th 75th
25-29
30-34
35-39
Excess Relative Risk (ERR) Percentiles by Sex and Age at Exposure*
<5
5-9
10-14
15-19
20-24
Age (Years)
SexERR (unitless)
25th
40
Table A.3. Percentiles of Lifetime Attributable Risk by Sex and Age at Exposure
*“LB” indicates lower bound, and “UB” indicates upper bound.
Mean LB UB Mean LB UB Mean LB UBMale 1.38E+00 3.63E+01 5.19E+02 2.02E+00 5.35E+01 7.64E+02 3.91E+00 1.03E+02 1.48E+03Female 7.45E+00 1.99E+02 2.77E+03 1.10E+01 2.93E+02 4.08E+03 2.12E+01 5.66E+02 7.88E+03Male 8.99E-01 2.37E+01 3.39E+02 1.32E+00 3.49E+01 4.99E+02 2.56E+00 6.76E+01 9.65E+02Female 4.87E+00 1.30E+02 1.81E+03 7.16E+00 1.91E+02 2.66E+03 1.38E+01 3.69E+02 5.14E+03Male 5.19E-01 1.37E+01 1.96E+02 7.64E-01 2.02E+01 2.88E+02 1.48E+00 3.90E+01 5.57E+02Female 2.80E+00 7.47E+01 1.04E+03 4.12E+00 1.10E+02 1.53E+03 7.97E+00 2.13E+02 2.96E+03Male 2.88E-01 7.60E+00 1.09E+02 4.23E-01 1.12E+01 1.60E+02 8.18E-01 2.16E+01 3.09E+02Female 1.54E+00 4.10E+01 5.71E+02 2.26E+00 6.03E+01 8.40E+02 4.37E+00 1.17E+02 1.62E+03Male 1.30E-01 3.43E+00 4.91E+01 1.91E-01 5.06E+00 7.22E+01 3.70E-01 9.77E+00 1.40E+02Female 6.83E-01 1.82E+01 2.54E+02 1.00E+00 2.68E+01 3.73E+02 1.94E+00 5.18E+01 7.22E+02Male 8.35E-02 2.21E+00 3.15E+01 1.23E-01 3.25E+00 4.64E+01 2.38E-01 6.28E+00 8.97E+01Female 4.24E-01 1.13E+01 1.57E+02 6.24E-01 1.66E+01 2.32E+02 1.21E+00 3.22E+01 4.48E+02Male 5.27E-02 1.39E+00 1.99E+01 7.75E-02 2.05E+00 2.92E+01 1.50E-01 3.96E+00 5.65E+01Female 2.55E-01 6.80E+00 9.47E+01 3.75E-01 1.00E+01 1.39E+02 7.25E-01 1.93E+01 2.69E+02Male 3.28E-02 8.67E-01 1.24E+01 4.83E-02 1.28E+00 1.82E+01 9.34E-02 2.47E+00 3.53E+01Female 1.49E-01 3.98E+00 5.54E+01 2.20E-01 5.86E+00 8.16E+01 4.25E-01 1.13E+01 1.58E+02
Age (Years)
Sex
<5
5-9
10-14
15-19
20-24
25-29
30-34
35-39
LAR (per 1,000)
25th 50th 75th
Lifetime Attributable Risk (LAR) Percentiles by Sex and Age at Exposure*

41
References
ACS 2018. U.S. Census Bureau, 2013-2017 American Community Survey 5-Year Estimates. Online: https://factfinder.census.gov/faces/nav/jsf/pages/community_facts.xhtml?src=bkmk. Accessed 9 June 2019.
Alexakhin 1994. R.M. Alexakhin, R.T. Karaban, B.S. Prister, et al., The effects of acute irradiation on a forest biogeocenosis; experimental data, model and practical applications for accidental cases, Science of The Total Environment 157, 357–369 (1994).
Arias 2018. E. Arias and J. Xu, United States Life Tables, 2015, National Vital Statistics Reports 67(7), 64 (2018).
Belgium 2018. Get iodine tablets from the pharmacy | Nuclear Risk; 2018. Online: https://www.nuclearrisk.be/get-iodine-tablets-pharmacy. Accessed 4 June 2019.
Blum 1967. M. Blum and M. Eisenbud, Reduction of Thyroid Irradiation From 131I by Potassium Iodide, JAMA 200(12), 1036–1040 (1967).
Cardis 2005. Cardis, A. Kesminiene, V. Ivanov, et al., Risk of thyroid cancer after exposure to 131I in childhood, J. Natl. Cancer Inst. 97(10), 724–732 (2005).
CFR 2002. Code of Federal Regulation, Title 40, Part 141, Section 141.16 (40 CFR 141.16); 2002. Online: https://www.govinfo.gov/app/details/CFR-2002-title40-vol19/CFR-2002-title40-vol19-sec141-16. Accessed 8 June 2019.
CFR 2019. Code of Federal Regulation, Title 10, Part 20 (10 CFR 20), 2019. Online: https://www.nrc.gov/reading-rm/doc-collections/cfr/part020/index.html. Accessed 8 June 2019.
Conard 1984. R.A. Conard, Late radiation effects in Marshall Islanders exposed to fallout 28 years ago, Radiation carcinogenesis: epidemiology and biological significance (1984).
Davis 2004. S. Davis, K.J. Kopecky, T.E. Hamilton, L. Onstad, and Hanford Thyroid Disease Study Team, Thyroid neoplasia, autoimmune thyroiditis, and hypothyroidism in persons exposed to iodine 131 from the hanford nuclear site, JAMA 292(21), 2600–2613 (2004).
EPA 1995. U.S. Environmental Protection Agency. User’s Guide for the Industrial Source Complex (ISC3) Dispersion Models, Volume II - Description of Model Algorithms. Online: https://www3.epa.gov/scram001/userg/regmod/isc3v2.pdf. Accessed 6 June 2019.
42
EPA 2017. U.S. Environmental Protection Agency. PAG Manual: Protective Action Guides and Planning Guidance for Radiological Incidents; EPA-400/R-17/001 (2017).
FDA 2001 U.S. Food and Drug Administration. Potassium Iodide as a Thyroid Blocking Agent in Radiation Emergencies. Online: https://www.fda.gov/regulatory-information/search-fda-guidance-documents/potassium-iodide-thyroid-blocking-agent-radiation-emergencies. Accessed 6 June 2019.
FDA 2005. U.S. Food and Drug Administration – CPG Sec. 560.750 Guidance Levels for Radionuclides in Domestic and Imported Foods (CPG 7119.14) Online: https://www.fda.gov/Food/FoodborneIllnessContaminants/ChemicalContaminants/ucm078331.htm. Accessed 6 June 2019.
Gauthier-Lafaye 1996. F. Gauthier-Lafaye, P. Holliger, and P.-L. Blanc, Natural fission reactors in the Franceville basin, Gabon: A review of the conditions and results of a “critical event” in a geologic system, Geochimica et Cosmochimica Acta 60(23), 4831–4852 (1996).
Gifford 1982. F.A. Gifford, Atmospheric Dispersion Models for Environmental Pollution Applications, in Lectures on Air Pollution and Environmental Impact Analyses, edited by D.A. Haugen (American Meteorological Society, Boston, MA, 1982), pp. 35–58.
Google 2017. Google Earth, Imagery Date November 13, 2017. Accessed February 17, 2019.
Higley 2006. K.A. Higley, Environmental consequences of the chernobyl accident and their remediation: twenty years of experience. Report of the chernobyl forum expert group ‘environment,’ Radiation Protection Dosimetry 121(4), 476–477 (2006).
Hosten 2012. 1 B. Hosten, N. Rizzo-Padoin, J.-M. Scherrmann, and V. Bloch, Stable iodine as a prophylaxis therapy following exposure to radioactive iodines: Pharmacological and pharmaceutical characteristics, Annales Pharmaceutiques Francaises 70(2), 75–81 (2012).
Hou 2003. X.L. Hou, C.L. Fogh, J. Kucera, K.G. Andersson, H. Dahlgaard, and S.P. Nielsen, Iodine-129 and Caesium-137 in Chernobyl contaminated soil and their chemical fractionation, Science of The Total Environment 308(1), 97–109 (2003).
IAEA 2015. International Atomic Energy Agency (ed.), The Fukushima Daiichi Accident (International Atomic Energy Agency, Vienna, 2015).
43
ICRP 1995. International Commission on Radiological Protection. Age-dependent Doses to Members of the Public from Intake of Radionuclides - Part 4 Inhalation Dose Coefficients. ICRP Publication 71. Ann. ICRP 25 (3-4) (1995).
ICRP 2007. International Commission on Radiological Protection. The 2007 Recommendations of the International Commission on Radiological Protection. ICRP Publication 103. Ann. ICRP 37 (2-4) (2007).
ICRP 2012. International Commission on Radiological Protection. Compendium of Dose Coefficients based on ICRP Publication 60. ICRP Publication 119. Ann. ICRP 41(Suppl.) (2012).
ICRP 2015. International Commission on Radiological Protection. Occupational Intakes of Radionuclides: Part 1. ICRP Publication 130. Ann. ICRP 44(2) (2015).
Kerber 1993. R.A. Kerber, J.E. Till, S.L. Simon, et al., A cohort study of thyroid disease in relation to fallout from nuclear weapons testing, JAMA 270(17), 2076–2082 (1993).
Kikuchi 2004. S. Kikuchi, N.D. Perrier, P. Ituarte, A.E. Siperstein, Q.-Y. Duh, and O.H. Clark, Latency Period of Thyroid Neoplasia After Radiation Exposure, Ann Surg 239(4), 536–543 (2004).
Kimura 1987. S. Kimura, T. Kotani, O.W. McBride, et al., Human thyroid peroxidase: complete cDNA and protein sequence, chromosome mapping, and identification of two alternately spliced mRNAs, PNAS 84(16), 5555–5559 (1987).
Knolls Atomic Power Lab 2010. Nuclides and Isotopes : Chart of the Nuclides 17th Edition (Knolls Atomic Power Lab, Schenectady, N.Y., 2010).
Korsakissok 2013. I. Korsakissok, A. Mathieu, and D. Didier, Atmospheric dispersion and ground deposition induced by the Fukushima Nuclear Power Plant accident: A local-scale simulation and sensitivity study, Atmospheric Environment 70, 267–279 (2013).
Lakes 2019. Lakes Environmental. ISCST3 Tech Guide, (n.d.). Online: https://www.weblakes.com/guides/iscst3/section6/6_1_6.html. Accessed 8 June 2019.
Lamarsh 2001. J.R. Lamarsh and A.J. Baratta, Introduction to Nuclear Engineering, 3rd ed (Prentice Hall, Upper Saddle River, N.J, 2001).
Leggett 2017. R. Leggett, An age-specific biokinetic model for iodine, J. Radiol. Prot. 37(4), 864 (2017).
44
Louisiana Department of Health 2016. Policy Statement. Use of potassium iodide (KI) in Louisiana for emergencies at fixed nuclear facilities; December 2016. (Louisiana DHH Office of Public Health, 325 Loyola Avenue, New Orleans, Louisiana 70160, 2016)
Luxembourg 2014. Preventive distribution of potassium iodide tablets to all residents (21/10/2014) - Home – Infocrise; 2014. Online: https://www.infocrise.lu/en/web/guest/home/-/asset_publisher/uJAlpeXURbmf/content/id/23146. Accessed 4 June 2019.
Mettler 1996. F.H. Mettler, D.V. Becker, B.W. Wachholz, and A.C. Bouville, Chernobyl: 10 years later, J. Nucl. Med. 37(12), 24N, 26N-27N (1996).
MIRD 1975. MIRD Pamphlet No. 11: S, Absorbed Dose per Unit Cumulated Activity for Selected Radionuclides and Organs (1975).
NAACCR 2018. North American Association of Central Cancer Registries, Fast Stats. Online: https://faststats.naaccr.org/selections.php?series=cancer. Accessed 9 June 2019.
National Research Council 2004. National Research Council (ed.), Distribution and administration of potassium iodide in the event of a nuclear incident (National Academies Press, Washington, DC, 2004).
National Research Council 2006. National Research Council (NRC), Health Risks from Exposure to Low Levels of Ionizing Radiation: BEIR VII Phase 2 (National Academies Press, Washington, D.C., 2006).
Nauman 1993. J. Nauman and J. Wolff, Iodide prophylaxis in Poland after the Chernobyl reactor accident: benefits and risks, Am. J. Med. 94(5), 524–532 (1993).
NCI 2019. National Cancer Institute, State Cancer Profiles: Historical Trends. Online: https://statecancerprofiles.cancer.gov/historicaltrend/index.php?0&4322&999&7599&009&080&00&0&0&0&1&0&1&1#results. Accessed 9 June 2019.
Netherlands 2017. Ministerie van Algemene Zaken, Jodiumtabletten - Straling - Rijksoverheid.nl; 2017. Online: https://www.rijksoverheid.nl/onderwerpen/straling/jodiumtabletten. Accessed 4 June 2019.
NOAA 2018. National Oceanic and Atmospheric Administration U.S. Wind Climatology, Societal Impacts | National Centers for Environmental Information. Online: https://www.ncdc.noaa.gov/societal-impacts/wind/w-mean/201805. Accessed 9 June 2019.

45
NRC 1987. U.S. Nuclear Regulatory Commission. Report on the Accident at the Chernobyl Nuclear Power Station, NUREG-1250 (1987). Online: https://www.nrc.gov/docs/ML0716/ML071690245.pdf. Accessed 9 June 2019.
NRC 2018: U.S. Nuclear Regulatory Commission: River Bend Station, Unit 1; 2018. Online: https://www.nrc.gov/info-finder/reactors/rbs1.html. Accessed 5 June 2019.
Pasquill 1961. F. Pasquill, The Estimation of the Dispersion of Windborne Material, Meteorol. Mag. 90, 33–49 (1961).
Pasquill 1984. F. Pasquill and F. B. Smith. Ellis Horwood, (John Wiley & Sons) Chichester, 1983; Quarterly Journal of the Royal Meteorological Society 110(464), 565–565 (1984).
Prăvălie 2014. R. Prăvălie, Nuclear Weapons Tests and Environmental Consequences: A Global Perspective, Ambio 43(6), 729–744 (2014).
Ruf 2006. J. Ruf and P. Carayon, Structural and functional aspects of thyroid peroxidase, Archives of Biochemistry and Biophysics 445(2), 269–277 (2006).
Shakhtarin 2003. V.V. Shakhtarin, A.F. Tsyb, V.F. Stepanenko, M.Y. Orlov, K.J. Kopecky, and S. Davis, Iodine deficiency, radiation dose, and the risk of thyroid cancer among children and adolescents in the Bryansk region of Russia following the Chernobyl power station accident, Int J Epidemiol 32(4), 584–591 (2003).
Swizterland 2014. Verteilung von Jodtabletten: eine vorsorgliche Schutzmassnahme; 2014. Online: http://www.jodtabletten.ch/. Accessed 4 June 2019.
Till 2008. J.E. Till and H.A. Grogan (eds.), Radiological risk assessment and environmental analysis (Oxford University Press, Oxford ; New York, 2008).
Williams 2003. E.D. Williams, Chernobyl, 15 years later, correlation of clinical, epidemiological and molecular outcomes, Ann. Endocrinol. (Paris) 64(1), 72 (2003).
Zanzonico 2000. P.B. Zanzonico and D.V. Becker, Effects of time of administration and dietary iodine levels on potassium iodide (KI) blockade of thyroid irradiation by 131I from radioactive fallout, Health Phys 78(6), 660–667 (2000).

46
Vita
Garrett Otis was born and raised in Covington, Louisiana. He enrolled at Louisiana
State University (LSU) in 2010 and began an undergraduate teaching role at the
university as a supplemental instructor in 2013, which he fulfilled until he received his
Bachelor of Science degree in Electrical Engineering in 2015. After working for 2 years
as an electrical and instrumentation engineer in the nuclear power industry, he returned
to LSU in 2017 to pursue a Master of Science degree from the Medical Physics and
Health Physics program. Upon completion of his degree requirements by the end of
Summer 2019, he plans to pursue a career in the field of health physics.
Top Related