


Languages
Pages
Legal

1 Economic Recovery Index
Economic Recovery Index An Amárach Research Briefing
March 2015
© Amárach Research

2 Economic Recovery Index
Picking Up
As we approach the end of Q1 2015 our
Economic Recovery Index shows a modest
recovery in momentum after reaching a
plateau in Q4 2014.
Nearly 1 in 5 adults now claims to see clear
signs of recovery – the highest level since we
began measuring perceptions back in April
2009 – we’ve come a long way since then.
It may be a springtime surge, or a statistical
blip, and we’ll know for sure in the next few
months, but the trend in retail sales suggests it
more than just a blip…

3 Economic Recovery Index
The Emotional Recovery
We have been reporting our monthly
Economic Recovery Index since April 2009.
We set out nearly six years ago to assess the
psychological impact of the recession and to
chart our ‘emotional progress’ towards
recovery alongside our ‘economic progress’.
This report summarises our Economic
Recovery Index results from April 2009 to
March 2015.
The most recent fieldwork was conducted
during 12th to 20th March 2015 inclusive.
See how bad it was five years ago: http://www.slideshare.net/amarach/aib-amarach-recovery-indicator-march-2010

Economic Recovery Index

5 Economic Recovery Index
Using the answers to the question on ‘stages of recovery’ we have created the Economic
Recovery Index, which ranges from 0 to 100 (0 = deep recession; 100 = back to peak).
Our Index has reached its highest level in six years, just shy of the 40 mark:
The Economic Recovery Index
Source: Amárach Research, March 2015
0
5
10
15
20
25
30
35
40
45
Ap
r '0
9
Jun
July
Au
g
Sep
t
Oct
No
v
Dec
Jan
'10
Feb
Mar
Ap
r
May
Jun
e
July
Au
g
Sep
t
Oct
No
v
Dec
Jan
'11
Feb
Mar
Ap
r
May
Jun
e
July
Au
g
Sep
t
Oct
No
v
Dec
Jan
'12
Feb
Mar
Ap
r
May
Jun
e
July
Au
g
Sep
t
Oct
No
v
Dec
Jan
'13
Feb
Mar
Ap
r
May
Jun
e
July
Au
g
Sep
t
Oct
No
v
Dec
Jan
'14
Feb
Mar
Ap
r
May
Jun
e
July
Au
g
Sep
t
Oct
No
v
Dec
Jan
'15
Feb
Mar
the ERI has regained momentum after a late 2014 plateau…

6 Economic Recovery Index
A Matter of Measurement
Feb ’15: 16% Mar ’15: 16%
Feb ’15: 33% Mar ’15: 30%
Feb ’15: 37% Mar ’15: 36%
Feb ’15: 13% Mar ’15: 17%
Feb ’15: 1% Mar ’15: 1%
Every month we survey a representative, online sample of 1,000 adults and ask them to tell us
which one statement ‘best describes the economic situation in Ireland right now’ (listed below)
A solid majority of Irish people still continues to say that the economy is improving:

7 Economic Recovery Index
ERI Summary Table
Which one statement ‘best describes the economic situation in Ireland right now’?
% choosing each statement:
%
The economic
situation in
Ireland is
getting worse
The economic
situation is bad
but has
stabilized
The economic
situation is bad
but showing a
few signs of
improvement
The economic
situation is
getting better
and showing
clear signs of
improvement
The economic
situation is
good and
almost fully
recovered
Economic
Recovery
Index
Mar-10 36 35 27 2 0 23.5
Mar-11 48 30 20 2 0 19.2
Mar-12 43 29 24 4 0 22.3
Mar-13 41 29 25 5 0 24.0
Mar-14 19 34 36 10 1 34.7
Feb-15 16 33 37 13 1 37.4
Mar-15 16 30 36 17 1 39.5
nearly 1 in 5 see clear signs of improvement…

8 Economic Recovery Index
Which one statement ‘best describes the economic situation in Ireland right now’?
(by sex, age, Dublin, class)
Source: Amárach Research, March 2015
March 2015 TOTAL Male Female 18-24 25-34 35-44 45-54 55+ Dublin ABC1
F50+
C2DE
F50-
1000 494 507 169 223 187 156 265 279 441 559
The economic situation
in Ireland is getting
worse 16% 15% 16% 10% 18% 13% 23% 14% 11% 11% 19%
The economic situation
is bad but has stabilized 30% 31% 26% 25% 31% 33% 31% 25% 30% 30% 28%
The economic situation
is bad but showing a
few signs of
improvement
36% 31% 37% 37% 27% 31% 35% 40% 32% 35% 34%
The economic situation
is getting better and
showing clear signs of
improvement
17% 18% 15% 17% 18% 15% 9% 21% 19% 21% 13%
The economic situation
is good and almost fully
recovered from the
recession
1% 1% 1% 2% 1% 1% 1% 1% 1% 1% 1%
ERI Score 39.5 39.8 39.2 41.1 37.3 37.7 34.4 44.6 41.1 41.1 42.7
Some Progress

Consumer Impact

10 Economic Recovery Index
Consumer Sentiment Summary Table I
% agree strongly/slightly with selected statements:
%
Ireland will be
through the
worst of the
recession in
12 months
time
I feel I am
financially
comfortable
enough to
make it
through the
recession
I am optimistic
in spite of the
current
economic
situation
Right now it
seems like the
recession is
affecting other
people more
than it is
affecting me
Mar-10 42 43 54 55
Mar-11 25 36 48 47
Mar-12 30 40 50 48
Mar-13 30 40 44 47
Mar-14 37 40 49 45
Feb-15 42 42 53 45
Mar-15 40 40 48 40
overall financial wellbeing indicators have plateaued or fallen slightly…
11 Economic Recovery Index
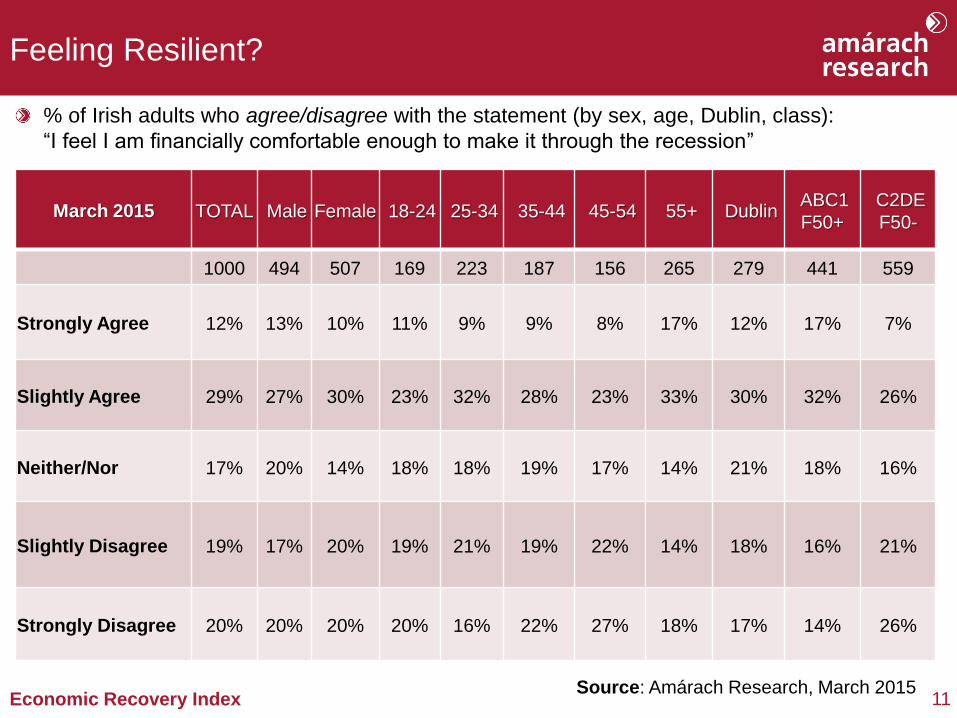
Feeling Resilient?
% of Irish adults who agree/disagree with the statement (by sex, age, Dublin, class):
“I feel I am financially comfortable enough to make it through the recession”
Source: Amárach Research, March 2015
March 2015 TOTAL Male Female 18-24 25-34 35-44 45-54 55+ Dublin ABC1
F50+
C2DE
F50-
1000 494 507 169 223 187 156 265 279 441 559
Strongly Agree 12% 13% 10% 11% 9% 9% 8% 17% 12% 17% 7%
Slightly Agree 29% 27% 30% 23% 32% 28% 23% 33% 30% 32% 26%
Neither/Nor 17% 20% 14% 18% 18% 19% 17% 14% 21% 18% 16%
Slightly Disagree 19% 17% 20% 19% 21% 19% 22% 14% 18% 16% 21%
Strongly Disagree 20% 20% 20% 20% 16% 22% 27% 18% 17% 14% 26%

12 Economic Recovery Index
Consumer Sentiment Summary Table II
% agree strongly/slightly with selected statements:
%
I am more
relaxed about
spending
money than I
was a few
months ago
I am saving a
lot more than
before
because of the
recession
My main
financial priority
is to pay off my
debts as quickly
as possible
I would be
happy to
borrow money
from a bank if I
need to
Mar-10 18 25 61 30
Mar-11 13 23 58 23
Mar-12 18 29 55 24
Mar-13 19 27 53 25
Mar-14 23 24 58 26
Feb-15 27 28 53 26
Mar-15 26 27 51 24
there has been some recovery in % willing to borrow and % saving more

13 Economic Recovery Index
St Patrick’s Effect
% of Irish adults who agree/disagree with the statement:
“I always buy Irish when I can”
Source: Amárach Research, March 2015
March 2015 TOTAL Male Female 18-24 25-34 35-44 45-54 55+ Dublin ABC1
F50+
C2DE
F50-
Weighted Sample 1000 494 507 169 223 187 156 265 279 441 559
Strongly Agree 20% 21% 20% 17% 20% 16% 16% 27% 19% 19% 21%
Slightly Agree 28% 28% 29% 24% 26% 32% 28% 31% 29% 31% 26%
Neither/Nor 26% 25% 27% 34% 23% 29% 26% 23% 27% 26% 27%
Slightly Disagree 11% 11% 11% 11% 14% 10% 12% 10% 12% 12% 11%
Strongly Disagree 9% 10% 8% 9% 11% 8% 14% 4% 9% 8% 10%

Mood of the Nation

15 Economic Recovery Index
The Mood of the Nation – I
Did you experience any of these feelings a lot of the day yesterday?
% saying Yes: April 2009 to March 2015
Source: Amárach Research, March 2015
0%
10%
20%
30%
40%
50%
60%
70%
Apr
'09
May
Ju
n
Ju
l
Aug
Sep
t
Oct
No
v
De
c
Ja
n'1
0
Feb
Mar
Apr
May
Ju
ne
Ju
ly
Aug
Sep
t
Oct
No
v
De
c
Ja
n'1
1
Feb
Mar
Apr
May
Ju
ne
Ju
ly
Aug
Sep
t
Oct
No
v
De
c
Ja
n'1
2
Feb
Mar
Apr
May
Ju
ne
Ju
ly
Aug
Sep
t
Oct
No
v
De
c
Ja
n'1
3
Feb
Mar
Apr
May
Ju
ne
Ju
ly
Aug
Sep
t
Oct
No
v
De
c
Ja
n'1
4
Feb
Mar
Apr
May
Ju
ne
Ju
ly
Aug
Sep
t
Oct
No
v
De
c
Ja
n'1
5
Feb
Mar
Enjoyment Happiness Stress Worry
16 Economic Recovery Index
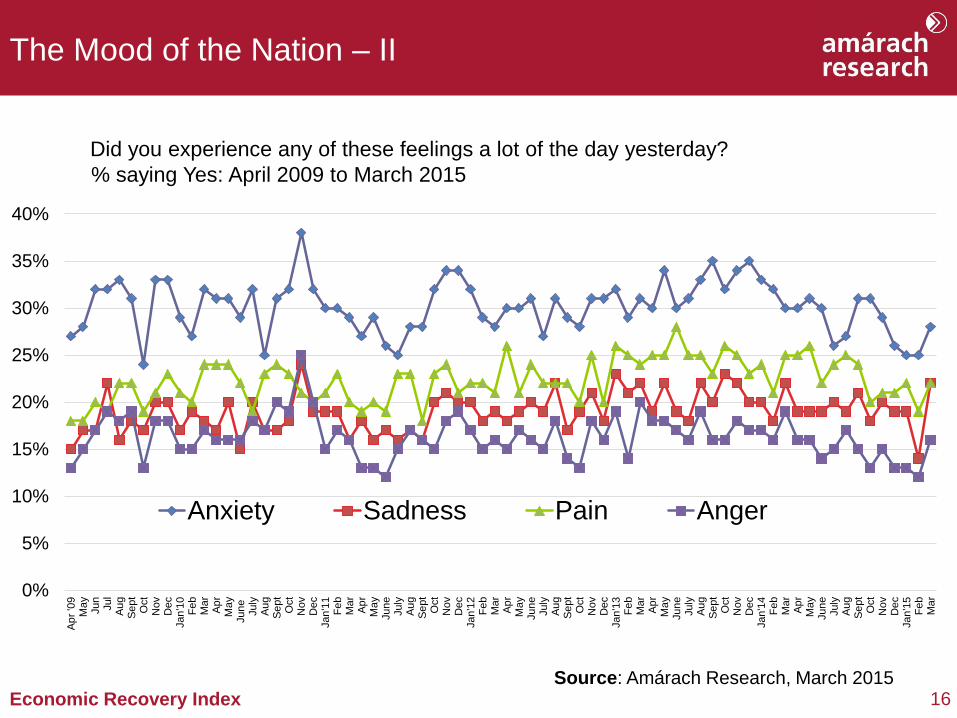
The Mood of the Nation – II
Did you experience any of these feelings a lot of the day yesterday?
% saying Yes: April 2009 to March 2015
Source: Amárach Research, March 2015
0%
5%
10%
15%
20%
25%
30%
35%
40%
Ap
r '0
9M
ay
Jun
Jul
Au
gS
ept
Oct
Nov
Dec
Jan
'10
Fe
bM
ar
Ap
rM
ay
Jun
eJuly
Au
gS
ept
Oct
Nov
Dec
Jan
'11
Fe
bM
ar
Ap
rM
ay
Jun
eJuly
Au
gS
ept
Oct
Nov
Dec
Jan
'12
Fe
bM
ar
Ap
rM
ay
Jun
eJuly
Au
gS
ept
Oct
Nov
Dec
Jan
'13
Fe
bM
ar
Ap
rM
ay
Jun
eJuly
Au
gS
ept
Oct
Nov
Dec
Jan
'14
Fe
bM
ar
Ap
rM
ay
Jun
eJuly
Au
gS
ept
Oct
Nov
Dec
Jan
'15
Fe
bM
ar
Anxiety Sadness Pain Anger

17 Economic Recovery Index
The Mood of the Nation – III
Source: Amárach Research, March 2015
March 2015 TOTAL Male Female 18-24 25-34 35-44 45-54 55+ Dublin ABC1
F50+
C2DE
F50-
1000 494 507 169 223 187 156 265 279 441 559
Enjoyment 52% 51% 52% 53% 47% 41% 51% 62% 52% 57% 48%
Happiness 50% 46% 54% 53% 50% 34% 49% 61% 48% 55% 46%
Stress 42% 40% 45% 52% 46% 46% 54% 24% 47% 40% 44%
Worry 35% 32% 38% 39% 34% 35% 49% 26% 37% 32% 38%
Anxiety 28% 27% 29% 37% 28% 27% 31% 20% 32% 30% 26%
Boredom 25% 23% 26% 47% 26% 24% 22% 12% 25% 23% 26%
Sadness 22% 19% 25% 34% 19% 23% 26% 15% 24% 22% 22%
Physical Pain 22% 21% 24% 24% 17% 19% 30% 24% 24% 18% 26%
Loneliness 17% 16% 17% 28% 14% 16% 19% 11% 16% 17% 16%
Anger 16% 16% 15% 22% 20% 15% 19% 7% 18% 15% 17%
Fear 11% 10% 12% 17% 10% 11% 12% 7% 12% 11% 10%
Did you experience any of these feelings a lot of the day yesterday? % saying Yes:

Amárach Outlook

19 Economic Recovery Index
Carry Forward
Our ERI survey shows the consumer
economy to be firing on a few engines, but by
no means all of them.
We can expect to see more momentum in the
coming months as falling unemployment
translates into higher spending power, but
even those already in jobs will be more
positively disposed to loosening the purse
and wallet strings.
We hope you find this edition of the
Economic Recovery Index helpful and
please do get in contact if you want to
discuss how it can be applied to your brand
planning requirements in 2015.
For more on the ERI see:
http://www.amarach.com/resources/economic-recovery-index.htm

we ask better questions
so you get better answers
Image: http://yourawakenedself.com/tag/jacob-nordby/

Trends Report
t. 01 410 5200
w. www.amarach.com
b. www.amarach.com/blog
t. twitter.com/AmarachResearch
s. slideshare.net/amarach/
Top Related