


Languages
Pages
Legal


AGRICULTURE INSIGHTS FROM FINSCOPE RWANDA 2016 SURVEY

The findings are based on the FinScope Survey Rwanda 2016
Abstract
This paper was prepared by FinMark Trust on behalf of Access to Finance Rwanda. It summarises the uptake of financial products and services (both formal and informal) of farmers in Rwanda.

AGRICULTURE AND FINANCIALINCLUSION IN RWANDA
FinScope 2016

ContentsList of tables 1
List of figures 1
Acronyms and abbreviations 2
Executive summary 3
1 Introduction 5
2 Subsistence farmers 8
2.1 Demographic profile and characteristics 8
2.2 Agriculture finance for subsistence farmers 9
2.3 Level of financial inclusion 10
2.3.1 Overall levels of financial inclusion 10
2.3.2 Banking and payments 12
2.3.3 Savings and investments 12
2.3.4 Credit and borrowing 14
2.3.5 Remittances 15
2.3.6 Insurance and risk mitigation 16
2.3.7 Mobile money 17
3 Commercial farmers 18
3.1 Demographic profile and characteristics 18
3.2 Agriculture finance for commercial farmers 20
3.3 Level of financial inclusion 21
3.3.1 Overall levels of financial inclusion 21
3.3.2 Banking and payments 23
3.3.3 Savings and investments 23
3.3.4 Credit and borrowing 25
3.3.5 Remittances 26
3.3.6 Insurance and risk mitigation 27
3.3.7 Mobile money 28
4 Farm workers 29
4.1 Demographic profile and characteristics 29
4.2 Level of financial inclusion 30
4.2.1 Overall levels of financial inclusion 30
4.2.2 Banking and payments 32
4.2.3 Savings and investments 33
4.2.4 Credit and borrowing 35
4.2.5 Remittances 36
4.2.6 Insurance and risk mitigation 384.2.7 Mobile money 39
5 Recommendations and implications for stakeholders 40
5.1 Recommendations 40
5.2 Implications for stakeholders 40
5.2.1 Recommendations for policy-makers and regulators 40
5.2.2 Recommendations for NGOs and other development agencies 41
5.2.3 Recommendations for financial service providers (FSPs) 41
6 References 43

List of tablesTable 1: Size of commercial farming businesses 19
List of figuresFigure 1: Segmentation of farmers 6
Figure 2: Analytical framework 7
Figure 3: Location of subsistence farmers 8
Figure 4: Gender of subsistence farmers 8
Figure 5: Age of subsistence farmers 8
Figure 6: Level of education of subsistence farmers 8
Figure 7: Farming categories of subsistence farmers 9
Figure 8: Sources of money for subsistence farming activities 9
Figure 9: Subsistence farmers - drivers for agricultural savings (of those who are saving for agriculture purposes) 10
Figure 10: Subsistence farmers - drivers for agricultural credit (of those who borrow for agricultural purposes) 10
Figure 11: Subsistence farmers overview of financial products/services uptake 11
Figure 12: Subsistence farmers overlaps in product uptake 11
Figure 13: Subsistence farmers Access Strand 11
Figure 14: Subsistence farmers overview of savings products/services uptake 13
Figure 15: Subsistence farmers Savings Strand 13
Figure 16: Subsistence farmers overview of credit products/services uptake 14
Figure 17: Subsistence farmers Credit Strand 15
Figure 18: Subsistence farmers overview of remittance products/services uptake 15
Figure 19: Subsistence farmers Remittances Strand 15
Figure 20: Subsistence farmers’ financial risks experienced during the past 6 months 16
Figure 21: Location of commercial farmers 18
Figure 22: Gender of commercial farmers 18
Figure 23: Age of commercial farmers 18
Figure 24: Level of education of commercial farmers 18
Figure 25: Challenges facing commercial farming businesses (of those who face challenges) 19
Figure 26: Farming categories of commercial farmers 20
Figure 27: Sources of money for commercial farming activities 20
Figure 28: Commercial farmers - drivers for agricultural savings (of those who are saving for agriculture purposes) 21
Figure 29: Commercial farmers - drivers for agricultural credit (of those who borrow for agricultural purposes) 21
Figure 30: Commercial farmers overview of financial products/services uptake 22
Figure 31: Commercial farmers overlaps in product uptake 22
Figure 32: Commercial farmers Access Strand 22
Figure 33: Commercial farmers overview of savings products/services uptake 24
Figure 34: Commercial farmers Savings Strand 24
Figure 35: Commercial farmers overview of credit products/services uptake 25
Figure 36: Commercial farmers Credit Strand 26
Figure 37: Sources of credit 26
Figure 38: Commercial farmers overview of remittances products/services uptake 26
Figure 39: Commercial farmers Remittances Strand 27
Figure 40: Commercial farmers’ financial risks experienced during the past 6 months 27
Figure 41: Location of farm workers 29
Figure 42: Gender of farm workers 29
Figure 43: Age of farm workers 30
Figure 44: Level of education of commercial farmers 30
Figure 45: Farm workers overview of financial products/services uptake 31
1

2
AFR Access to Finance Rwanda
ATM Automated Teller Machine
CESS Centre for Economic and Social Studies
BNR National Bank of Rwanda
DFID Department for International Development
EICV Integrated Household Living Conditions Survey
FMT FinMark Trust
FSDP II Second Financial Sector Development Program II
FSP Financial Services Providers
MFIs Microfinance Institutions
MSME Micro, Small and Medium Enterprises
MNO Mobile Network Operator
NGO Non-Governmental Organisation
NISR National Institute of Statistics Rwanda
PPS Probability Proportional to Size
POS Point of Sale
SACCOs Savings and Credit Cooperative Organisation
Telcos Telecommunications company
VSLAs Village Savings and Lending Associations
Acronyms and abbreviations
Figure 46: Farm workers overlaps in product uptake 31
Figure 47: Farm workers Access Strand 32
Figure 48: Farm workers overview of savings products/services uptake 34
Figure 49: Farm workers Savings Strand 35
Figure 50: Farm workers overview of credit products/services uptake 36
Figure 51: Farm workers Credit Strand 36
Figure 52: Farm workers overview of remittance products/services uptake 37
Figure 53: Farm workers Remittances Strand 37
Figure 54: Farm workers’ financial risks experienced during the past 6 months 38

Executive summaryRwandan agriculture has made great progress over the past years in terms of productivity. FinScope 2016 results show that 86% of adultsin Rwanda are from households that are involved in farming activities. As such, the sector contributes to poverty reduction by enablingincome generation and ensuring food security for a large part of the population. These changes are supported by the deliberate efforts bythe Government of Rwanda as guided by Vision 2020 and in line with the EDPRS II targets1. However, farmers are still facing a number ofchallenges linked to the lack of access to agricultural finance, low and irregular income, high vulnerability related to seasonality, drought,and climate change, as well as location and associated remoteness, which affects their levels of financial inclusion especially in terms oflow access to finance and credit, crop and livestock insurance, as well as other risk management strategies in the agricultural sector.
In total, about 86% of adults in Rwanda are from households that are involved in agricultural activities (= about 5.2 million). They dependeither directly or indirectly on agriculture as their main source of income, employment, and/or main source of food security. In turn, only14% of Rwanda’s adult population is not involved in agricultural activities at all.
For the purposes of this report, farmers have been segmented into three groups, namely:
n Subsistence farmers (30% = about 1.8 million): those who are head of households and are involved in self-sufficiency agriculturalactivities (i.e. farming, fishing);
n Commercial farmers (9% = about 536 000): those who perceive their agricultural activities (i.e. farming, fishing) as a commercialfarming business; and
n Farm workers (30% = about 1.8 million): those who receive an income from agricultural activities, including farming, fishing, and/orrural wage labour, i.e. salary/wage from a farmer. Further segmentation includes (a) those who receive their main income throughrural wage labour (14% of adults in Rwanda – farm workers only), and (b) those who also receive an income from other sources,including off-farm work (16% - farm workers and off-farm).
n Note: The remaining 17% of adults who also come from households involved in farming activities are not considered here as theyare neither head of households nor do they receive an income from rural wage labour, i.e. salary/wage from a farmer. As such itis difficult to determine their actual involvement in agricultural activities based on the survey conducted. Nevertheless, it is animportant group which could be examined further by conducting a specially designed agricultural study.
Profile of farmers in Rwanda: Large majority of farmers are rural-based. The majority of the subsistence and commercial farmers aremale, while farmer workers in Rwanda are mainly female. Subsistence farmers are usually older compared to the other groups, whichrelates to the fact that most of them are head of the households. In total, however, farmers in Rwanda are relatively young, especially farmworkers, followed by commercial farmers. Education levels are relatively low, especially among subsistence farmers, followed by commercialfarmers, and farm workers.
Financial inclusion among farmers in Rwanda: In general, financial inclusion among farmers in Rwanda is relatively high and variesbetween 86% and 91%. Farm workers with additional sources of income show the highest level of financial inclusion, followed by commercialand subsistence farmers. Farm workers who only rely on rural wage labour seem to be most vulnerable; they are less likely to be financiallyincluded, borrow money, have an insurance product, and/or a mobile money account. Given the high vulnerability of farmers, it is of greatconcern that risk coverage is very low. The large majority of farmers are not covered by an insurance product, such as livestock or cropinsurance. In case of emergencies (e.g. harvest and/or livestock loss) most farmers rely on cutting down expenses and borrowing money- mainly from informal sources given also the limited access to agricultural credit - which increases their vulnerability. Only 14% ofsubsistence farmers and 17% of commercial farmers have access to formal credit, and as such mainly rely on informal groups as well asfriends and family. Therefore, farmers are required to plan carefully to cater for seasonal changes as well as possible emergencies toreduce their detrimental effects. Their inability to afford additional agricultural and yield-enhancing inputs and limited access to creditmight affect their ability to extend their agricultural activities and as such agricultural productivity.
3
1 Economic Development and Poverty Reduction Strategy 2013 – 2018, available online at URL:http://www.minecofin.gov.rw/fileadmin/templates/documents/NDPR/EDPRS_2.pdf

4
Conclusions and recommendations: As shown in this report, financial inclusion among farmers in Rwanda is relatively high and variesbetween 86% and 91%. However, there is opportunity to further growth, especially in terms of deepening financial inclusion beyond accessand moving towards a greater level of formal inclusion of those relying exclusively on informal mechanism and improving usage of formalfinancial products/services, which require:
n A holistic approach of poverty alleviation and development (given the link between financial inclusion and income);
n Continued innovation (to tailor financial products/services to the specific challenges and needs of farmers, i.e. seasonality andhigh risk factors characteristic for the sector, as well as low/irregular incomes associated with it);
n Financial education (given that a lack of consumer awareness and knowledge is often a key barrier to uptake); and
n Persistent monitoring of progress (i.e. measuring of financial inclusion levels in rural areas).

1 Introduction Amongst other areas, rural development in Rwanda focuses on the linkages of rural growth, agriculture and rural finance (see EDPR II). Assuch, increasing financial inclusion amongst farmers is a consideration of significant importance in the Rwandan development agenda asit yields a number of development benefits, including accumulation of economic assets at household and enterprise level, increasedhousehold well-being through productive investments and responsible borrowing, as well as protection against major risks, and as such,decreased vulnerability.
This paper was prepared by FinMark Trust (FMT)2 on behalf of Access to Finance Rwanda (AFR)3. It summarises farmers’ uptake/usageof financial products and services (both formal and informal) and as such documents Rwanda’s development towards greater financialinclusion and rural development4. Findings are based on the FinScope Survey5 Rwanda 2016 which was initiated by the Government ofRwanda and AFR with the intention to continue measuring progress in financial inclusion. Implemented by the Centre for Economic andSocial Studies (CESS) the survey was conducted under the supervision of the steering committee members (e.g. including the Ministry ofFinance, Central Bank, NISR, AFR, CESS) and with technical support from FMT.
The main objectives of the FinScope Survey Rwanda 2016 were to describe the levels of financial inclusion (i.e. levels of access to financialproducts and services – both formal and informal) and the landscape of access (i.e. the type of products and services used by financiallyincluded individuals). As such, it aimed to identify the drivers of, and barriers to financial access, and therefore, to stimulate evidence-based dialogue that will ultimately lead to effective public and private sector interventions aimed to increase and deepen financial inclusion.
The survey is based on a nationally representative sample of the adult population in Rwanda aged 16 years and older. A total of 12 480face-to-face interviews were conducted from November 2015 to January 2016 using Computer Assisted Personal Interviews (CAPI). Thedata was weighted and benchmarked to the 2013/14 Integrated Household Living Conditions Survey (EICV4) and the FinScope Rwanda2016 survey findings were validated and approved by the NISR. Data analysis was conducted by FinMark Trust with the involvement ofAFR and the steering committee.
FinScope Rwanda 2016 estimated the total adult population (16 years and older) to be almost 6 million6 of which 86% are from householdsthat are involved in agricultural activities (= about 5.2 million). They depend either directly or indirectly on agriculture as their main sourceof income, employment, and/or main source of food security. In turn, only 14% of Rwanda’s adult population is not involved in agriculturalactivities at all.
5
2 FinMark Trust was established in March 2002 with initial funding from the UK’s Department for International Development (DFID). More recently some other funders(UNCDF, Bill & Melinda Gates Foundation and MasterCard Foundation) have come on board to support the work of FinMark Trust. FinMark Trust is an independent trustwhose purpose is ‘Making financial markets work for the poor, by promoting financial inclusion and regional financial integration’. In pursuit of its goal of improving thelivelihoods of the poor through the usage of financial products and services, FinMark Trust recognises the complementary role of governments (as policymakers andregulators) and the private sector (as service providers) and believes that the availability of credible financial sector information enables effective, evidence-baseddialogue amongst financial sector role players, and that this will facilitate the development of effective interventions that are essential for sustainable financial marketdevelopment. In order to fulfil its objectives, FinMark Trust developed the FinScope Consumer Survey.
3 AFR was launched in March 2010 at the request the Government of Rwanda and with support from DFID and the World Bank. The core objective of AFR is to removesystemic barriers to financial services by putting the poor at the center of its interventions.
4 For a better understanding of the country context, the financial landscape, and overall levels of financial inclusion, this paper shall be read in conjunction with the fullFinScope Rwanda 2016 report which is available upon request from FinMark Trust or AFR.
5 FinScope Consumer Survey: FinScope is a comprehensive and nationally representative survey on financial inclusion, looking at how individuals source their incomeand manage their financial lives. It provides insight into attitudes and perceptions regarding financial products and services. The key objective of the FinScope ConsumerSurvey is to measure and profile levels of access to and use of financial services by all eligible adults (16/18 years and older), across income ranges and otherdemographics, and to make this information available for use by key stakeholders such as policy-makers, regulators, and financial services providers. To date, FinScopeSurveys in Rwanda have been conducted in 2008, 2012 and 2016.
6 For a profile of the total adult population please refer to the FinScope Rwanda 2016 Report.

6
For the purpose of this report, farmers are segmented into the following groups:
1. Subsistence farmers (30% = about 1.8 million): those who are head of households and are involved in self-sufficiency agricultural activities (i.e. farming, fishing) in which the farmers focus on growing enough food to feedthemselves and their families. The output is used for household purposes with little or no surplus for sale. They might alsohave other sources of income (e.g. as rural wage labourers/farm workers and/or off-farm work).
2. Commercial farmers (9% = about 536 000): those who perceive their agricultural activities (i.e. farming, fishing) as acommercial farming business, i.e. farming for profit, where food is produced for sale in the market. They either ownan agricultural business or they farm mostly for the purpose of selling their produce. They might also receive an incomefrom other sources, including off-farm work.
3. Farm workers (30% = about 1.8 million): those who receive an income from agricultural activities, including farming,fishing, and/or rural wage labour, i.e. salary/wage from a farmer. They might come from households that are involvedin subsistence farming but they are not the head of the household/are not involved in decision making regarding agriculturalinputs. Farm workers can be segmented further into (a) those who receive their main income through rural wage labour(14% of adults in Rwanda – farm workers only), and (b) those who also receive an income from other sources, includingoff-farm work (16% - farm workers and off-farm).
Excluded in this segmentation are:
– Those who are involved in agricultural activities but are not head of households and do not receive an income from ruralwage labour, i.e. salary/wage from a farmer (17%)
– Those who are not involved in agricultural activities at all (14%)
7 The concept of ‘financial inclusion’ is core to the FinScope methodology and is based on the extent to which individuals (i.e. percentage of the adult population) currentlyhave/use financial products/services both formal and/or informal (including banking, savings and investments, borrowing and credit, insurance and risk management,remittance).
Figure 1: Segmentation of farmers
%
Subsistence agriculture farmers and farm workers only
Subsistence agriculture farmers and farm and non-farmworkers
Subsistence agriculture farmers only
Commercial farmers
Farm workers as main source of income only
Farm workers and non-farm workers
Households involved in farming but not respondents
Households not involved in farming
10
11
9
9
14
16
17
14
Subsistence farmers30%
Commercial farmers 9%
Farm workers30%
}
The following chapters will:
1) Introduce the profile of farmers (e.g. location, gender, age, education) according to this segmentation.
2) Summarise overall levels of financial inclusion amongst these farmers following the analytical framework illustrated below and furtherexplore the uptake of banking, savings, credit, insurance, and remittance products/services7.

7
Banked= have/use financial products/services provided by a bank,regulated by the Central Bank
Served by other formal financial institutions = have/use financial products/services provided by other
regulated (non-bank) financial institutions, e.g. mobile money, SACCO’s.
Financially excluded = do nothave/use any financial productsand/or services – neither formal
nor informal
Informally served = have/use financial products and/orservices which are not regulated and operate without legal governance that
would be recognised.
Financially included = have/use financial products and/orservices – formal and/or informal
Total adult population = 16 years and older in Rwanda
Formally served = have/use financial products and/or services providedby a formal financial institution (bank and/or non-bank).
A formal financial institution is governed by a legalprecedent of any kind and bound by legally recognised
rules
Figure 2: Analytical framework
8
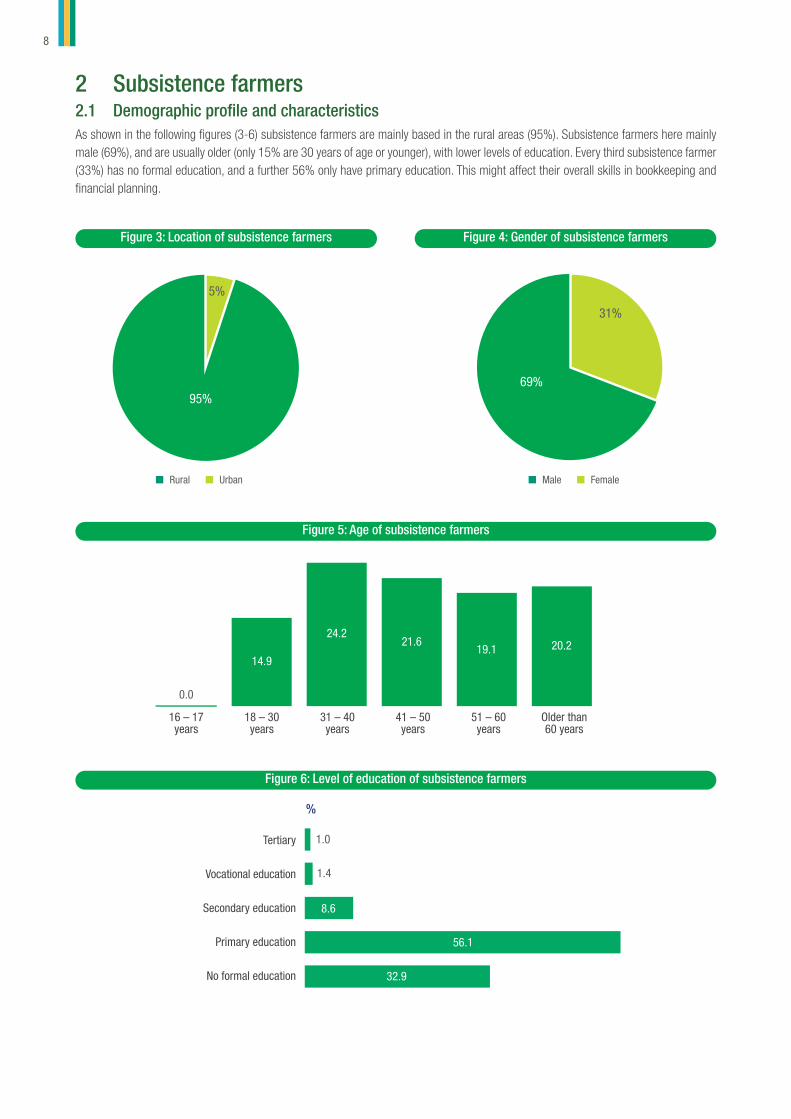
2 Subsistence farmers2.1 Demographic profile and characteristicsAs shown in the following figures (3-6) subsistence farmers are mainly based in the rural areas (95%). Subsistence farmers here mainlymale (69%), and are usually older (only 15% are 30 years of age or younger), with lower levels of education. Every third subsistence farmer(33%) has no formal education, and a further 56% only have primary education. This might affect their overall skills in bookkeeping andfinancial planning.
14.9
0.0
24.221.6
19.1 20.2
16 – 17 years
18 – 30 years
31 – 40 years
41 – 50 years
51 – 60 years
Older than 60 years
Figure 3: Location of subsistence farmers Figure 4: Gender of subsistence farmers
95%
5%
69%
31%
n Rural n Urban n Male n Female
Figure 5: Age of subsistence farmers
Figure 6: Level of education of subsistence farmers
%
Tertiary
Vocational education
Secondary education
Primary education
No formal education
1.0
1.4
8.6
56.1
32.9

9
Farming categories: Subsistence farmers mainly depend on pulses (96% e.g. beans, peas), roots (85% e.g. sweet potato), and otherstaples (75% e.g. grains) as shown in Figure 7. Almost every second subsistence farmer also has livestock, mainly goats, sheep, and/orpigs (49%), followed by cattle (41%).
0
%
Pulses (beans, peas)
Roots (sweet potato)
Staples (grains)
Green bananas
Fruits
Vegetables
Cash crops (tea, coffee)
Other
Goats, sheep, pigs
Cattle
Other livestock
95.5
85.4
74.9
39.7
25.3
24.3
9.1
0.2
49.4
41.0
21.4
Figure 7: Farming categories of subsistence farmers
2.2 Agriculture finance for subsistence farmersMany subsistence farmers seem to plan for the next season: 40% do not have to buy agricultural inputs because they manage with whatthey have already, e.g. seeds from the previous harvest, and 20% said they sell crops, livestock, and/or other produce the get the moneyfor their agricultural activities. However, that probably also means that farming remains on a small scale as large inputs would not beaffordable. While 19% use their own savings, only 10% rely on credit.
Saving and borrowing for farming activities leads to the overall savings and borrowing behaviour (see sections 2.3.3 and 2.3.4).
Figure 8: Sources of money for subsistence farming activities
0
%
Do not have to buy, manage with what already have
Sell crops/livestock/other products to get money
Savings
Use money from other sources of income
Credit
Do not buy imputs – get inputs in exchange for goods or labour
Other
39.5
20.3
19.4
11.5
10.2
2.5
1.3

10
2.3 Level of financial inclusion2.3.1 Overall levels of financial inclusion
The following section summarises the overall levels of financial inclusion among subsistence farmers, i.e. the uptake of financial productsand/or services, including all forms of banking, savings, credit, remittances, insurance, mobile money, and informal mechanisms.
The financially included subsistence farmers include those who are:
n Formally served: 65% of subsistence farmers have or use products or services from financial institutions that are regulatedthrough an Act of law (formal financial institutions), which is driven by other formal (non-bank) financial products/services (nationalaverage of 68%)
n Informally served: 77% have or use products or services from financial institutions that are not regulated (informal financialinstitutions and mechanisms) and/or use community based organisations/mechanisms to save or borrow money (national averageof 71%).
The formally served subsistence farmers further includes those who are:
n Banked: 20% of subsistence farmers have or use products or services from licensed commercial banks that are regulated by thecentral bank (national average of 26%).
n Served by other formal financial institutions (non-bank): 63% have or use products or services from financial institutions that areregulated through Acts of law but which are not commercial banks (national average of 65%). That is mainly driven by the uptakeof mobile money, as well as the continued increase of Umurenge SACCOs. About 41% of subsistence farmers in Rwanda aremembers of Umurenge SACCOs (national average 51%).
Drivers for saving and borrowing money for farming activities: Subsistence farmers’ agricultural savings are driven by livestock asillustrated in the figure below, as the majority of them keep seeds etc. from their own harvest for agriculture input. Agricultural credit onthe contrary is driven by agricultural inputs, as well as livestock. The figure below shows that agricultural credit is also key for farmingequipment.
Figure 9: Subsistence farmers - drivers for agricultural savings (of those who are saving for agriculture purposes)
%
Livestock
Agriculture input
Equipment
79.9
16.3
1.9
Figure 10: Subsistence farmers - drivers for agricultural credit (of those who borrow for agricultural purposes)
%
Agriculture input
Livestock
Equipment
59.2
42.1
33.8

11
Figure 11: Subsistence farmers overview of financial products/services uptake
%
Financially included
Formally served
Banked
Other formal
Informal
Excluded
89.4
65.4
19.9
63.0
77.3
10.6
The Access Strand removes the overlaps using a hierarchical approach to depict the uptake of financial products/services. As illustratedbelow, 11% of subsistence farmers in Rwanda are financially excluded. Around 24% of subsistence farmers only rely on informalmechanisms to manage their financial lives. They do not use/have any formal financial products/services. 46% of subsistence farmershave/use other formal non-bank financial products/services. They do not use financial products/services offered by a commercial bank.They might, however, also use informal mechanisms to manage their financial lives. About 20% of subsistence farmers are banked. Theymight also have/use financial products/services offered by other formal non-bank institutions and/or informal financial mechanisms.
As illustrated in the figure below, there are a number of overlaps in the uptake of financial products and services, especially with regardto the uptake of other formal and informal mechanisms.
Banked (20%) Other formal (63%)
Informal (77%)Excluded (11%)
0.8% 3.4%8.0%
37.6%
14.1%
1.7%
24%
Figure 12: Subsistence farmers overlaps in product uptake
Figure 13: Subsistence farmers Access Strand
19.9 45.5 10.624.0
% n Banked n Other formal n Informal only n Excluded
The following sections look at the uptake of specific product categories and financial behavior in more detail, namely banking, savings andinvestments, credit and borrowing, insurance and risk mitigation, as well as remittances and mobile money.

12
2.3.2 Banking and payments
Although overall levels of financial inclusion are relatively high in Rwanda, the FinScope survey found that subsistence farmers in Rwandaare largely unbanked. 80% of subsistence farmers do not have a bank account in their names or joint accounts and/or are using bankingchannels or services8 to manage their finances. The main barriers to banking relate to insufficient or irregular income (insufficient moneycoming in 85%). In turn, 20% of subsistence farmers are banked, which is mainly driven by savings (37%), keeping money safe (26%) andto process salary (25%).
8 Other banking services refer to banking services over the counter (OTC), e.g. paying school fees, receiving income and remitting through a bank without having anaccount in their name.
20% of subsistence farmers are banked
Drivers
Subsistence farmers in Rwanda have a bank account/usebanking services mainly to:
n Save money (37%)n Keep money safe (26%)n To process income (25%)
80% of subsistence farmers are not banked(neither direct nor indirect)
Barriers
Subsistence farmers do not have a bank account mainlydue to monetary reasons (affordability):
n Insufficient money coming in (85%)n Charges to high (8%)n Banks are too far away (4%)
2.3.3 Savings and investments
Savings are the leading product type and one of the main drivers of financial inclusion for subsistence farmers in Rwanda. In total, 88% ofsubsistence farmers save mainly for agricultural activities (37%), but also to pay for living expenses when times are hard (32%), as wellas other developmental purposes (18%), and emergencies (8%). Only 12% of subsistence farmers do not save, mainly because of monetaryreasons. They do not have the money to save (75%) and/or do not have a job (18%) and as such no regular income. 9% never thought ofsaving, which might be an opportunity for financial inclusion.
88% of subsistence farmers save
Drivers
Subsistence farmers in Rwanda mainly save:
n Farming activities (37%)n To pay for pay for living expenses when times are hard
(32%)n Other developmental purposes (18%)
12% of subsistence farmers do not save
Barriers
Subsistence farmers do not save mainly due to monetaryreasons (affordability):
n Do not have money (75%)n Do not have job(18%)n Never thought of it (9%)

13
Savings Strand: In constructing this strand, the overlaps in savings product/services usage are removed, showing that:
n 12% of subsistence farmers do not save at alln 9% of subsistence farmers keep all their savings at home, i.e. they do not have/use formal or informal savings products or
mechanisms n 30% of subsistence farmers rely on informal mechanisms such as savings groups (they might also save at home, but they do not
have/use any formal savings products) n 39% of subsistence farmers have/use other formal non-bank savings products (they might also have/use informal savings
mechanisms and/or save at home, but they do not have/use savings products from a commercial bank) n 10% of subsistence farmers have/use savings products from a commercial bank (they might also have/use other formal and/or
informal mechanisms, and/or save at home)
The figure below illustrated the uptake of savings products/mechanisms. As shown, saving through informal savings groups and SACCOs(other formal) is particularly popular. They are not only a viable alternative for the vast number of subsistence farmers unlikely to be servedby commercial banks, they are also the catalyst for enhanced social capital, skills exchange, as well as community social and economicdevelopment.
Figure 14: Subsistence farmers overview of savings products/services uptake
%
Saving
Formally served
Banked
Other formal
Informal
At home
Not saving
87.7
49.4
10.2
46.0
64.7
34.9
12.3
Figure 15: Subsistence farmers Savings Strand
10.2 39.2 12.38.529.8
% n Banked n Other formal n Informal only n At home only n Not saving

14
The figure below summarises the uptake of credit products/services. The percentage of subsistence farmers taking a loan from a commercialbank is only 3%. Subsistence farmers also lag behind in taking up credit from other formal (non-bank) institutions (12%). As shown below,the majority of subsistence farmers rely on borrowing from informal groups (66%) as well as family/friends (34%). The importance ofinformal groups to enhance financial inclusion among subsistence farmers cannot be stressed enough especially in remote areas.
74% of subsistence farmers borrow(mainly from informal sources)
Drivers
Subsistence farmers in Rwanda mainly borrow:
n Farming activities (37%)n To pay for pay for living expenses when times are hard
(32%)n Other developmental purposes (18%)n Medical expenses (13%)n Emergencies (8%)
26% of subsistence farmers do not borrow
Barriers
Subsistence farmers in Rwanda do not borrow mainlybecause they:
n Are worried that they would not be able to pay back themoney (54%)
n Did not need to borrow the money (23%)n Do not have security (13%)
2.3.4 Credit and borrowing
Subsistence farmers are less likely to borrow than to save. In total, 74% of subsistence farmers borrow, mainly to pay for agriculturalactivities (37%), but also to pay for living expenses when times are hard (32%), for other developmental purposes (18%), as well as medicalexpenses (13%), and emergencies (8%). However, 26% of subsistence farmers do not borrow, mainly because they are worried that theywould not be able to pay it back (54%). 23% said that they did not need to borrow money, and 13% did not borrow because of the lack ofsecurity/collateral.
Figure 16: Subsistence farmers overview of credit products/services uptake
%
Borrowing
Formally served
Banked
Other formal
Informal
Family/friends
Not borrowing
74.2
13.8
3.0
12.1
65.9
33.8
25.8
Credit Strand: In constructing this strand, the overlaps in credit product/services usage are removed, showing that:
n 26% of subsistence farmers do not borrow at all n 4% of subsistence farmers only rely on friends and/or family, i.e. they do not have/use formal or informal credit products or
mechanismsn 56% of subsistence farmers rely on informal mechanisms such as savings groups and money lenders (they might also borrow
from family/friends, but they do not have/use any formal credit products) n 11% of subsistence farmers have/use other formal non-bank credit products (they might borrow from informal sources and/or
borrow from friends, but they do not have/use credit products from a commercial bank) n 3% of subsistence farmers have/use credit products from a commercial bank (they might also have/use other formal and/or
informal mechanisms, and/or borrow from friends/family)

15
Remittances Strand: The Remittances Strand shows that there are hardly any overlaps in the uptake of remittance channels.
Figure 17: Subsistence farmers Credit Strand
3.0 10.8 25.84.456.0
% n Banked n Other formal n Informal only n Family/friends only n Not borrowing
2.3.5 Remittances
About 37% of subsistence farmers in Rwanda either sent and/or received money from people living in a different place (within the countryand/or outside Rwanda). The most common mechanism used to transfer money is through formal channels. Around 7% of subsistencefarmers still send or receive money in cash through a relative/friend or deliver it in person. The figure below summarises the uptake byremittances channels. Only 1% of subsistence farmers either sent and/or received money using commercial banks.
Figure 18: Subsistence farmers overview of remittances products/services uptake
%
Remitting
Formally served
Banked
Other formal
Informal
Relative/friend/personal
Not remitting
37.4
33.3
1.1
33.1
0.3
6.5
62.6
Figure 19: Subsistence farmers Remittances Strand
1.10.2
32.2 62.63.9
% n Banked n Other formal n Informal only n Relative/friend/personal only n Not remitting

16
2.3.6 Insurance and risk mitigation
To pay for livings expenses when times are hard is an important driver for both savings and borrowing. As such it is not surprising thatrunning out of money to meet household expenses in the past 6 months prior to the survey is reported as the main financial risk experiencedby 86% of subsistence farmers, which is also related to low/irregular income of subsistence farmers. Many subsistence farmers dealt withit by cutting down expenses (34%) and/or borrowed money (33%), which increases their vulnerability. Coping strategies for harvest andlivestock losses (experienced by 56% of subsistence farmers) mainly include cutting down expenses (31%), followed by borrowing money(8%) and the use of savings (8%). Only 0.1% claimed an insurance policy.
Figure 20: Subsistence farmers’ financial risks experienced during the past 6 months
%
Running out of money to meet household expenses
Harvest/livestock loss
Pay for unforeseen expenses
Unexpected rise in prices of goods, fuel
Increase household size
Household not getting cash anymore
Loss of assets/dwelling/land
86.1
56.2
44.9
20.5
14.7
10.9
8.2
About 77% of subsistence farmers have Mutuelle de Sante. However, other risk cover is low in Rwanda. In total, only 6% of subsistencefarmers are covered by an insurance product which is mainly driven by medical insurance (67%) and Rwanda’s Social Security Board(50%). Only 3% are covered by agricultural insurance. Given the high vulnerability of subsistence farmers, especially with regard toharvest/livestock loss, affordable and accessible crop and livestock insurance poses a real opportunity to financial inclusion. In turn, 94%of subsistence farmers do not have an insurance/pension product, mainly because they cannot afford it (63%), followed by a lack ofconsumer awareness/knowledge. 17% have never heard about it and 15% do not know how it works.
6% of subsistence farmers have insurance
Drivers
Product uptake is driven by:
n Medical insurance (67%)n Rwanda’s Social Security Board (50%)n Agriculture (3%)
94% of subsistence farmers do not have insurance
Barriers
Main barriers to the uptake of insurance relate to:
n Cannot afford (63%)n Has never heard about it (17%)n Does not know how insurance works (15%)

17
2.3.7 Mobile money
Cellphone access and ownership continue to increase in Rwanda with 82% of subsistence farmers owning/having access to a cellphone.As such, the uptake of mobile money has also increased over the past years with 31% of subsistence farmers having/using a mobilemoney account. The uptake of mobile money is mainly driven by remittances (60%), followed by savings (13%). 19% said they have amobile money account because they saw other people using it/advertisement. In turn, 69% of subsistence farmers do not use mobilemoney, mainly because of product knowledge (59%). 26% said they do not know how to use it.
31% of subsistence farmers use mobile money
Drivers
Product uptake is driven by:
n Remittances (60%)n Saw other people using it/advertisement (19%)n Savings or to store money (13%)
69% of subsistence farmers do notuse mobile money
Barriers
Main barriers to the uptake of mobile money relate to lackof consumer awareness and knowledge, e.g.
n Lack of product knowledge (59%)n Do not know how to use it (26%)n Do not need it (9%)

18
3 Commercial farmers3.1 Demographic profile and characteristicsAbout 9% (= 536 000) of Rwanda’s adult population can be classified as commercial farmers. They perceive their agricultural activities(i.e. farming, fishing) as a commercial farming business, i.e. farming for profit, where food is produced for sale in the market. They eitherown an agricultural business or they farm mostly for the purpose of selling their produce. They might also receive an income from othersources, including off-farm work.
As shown in the Figures 21 - 24 commercial farmers are mainly based in the rural areas (95%). Commercial farmers are mainly female(56%), and are relatively young (32% are 30 years of age or younger), with lower levels of education. Every third commercial farmer (23%)has no formal education, and a further 61% have only primary education, which might affect their overall skills in bookkeeping and financialplanning.
27.5
4.1
26.0
18.015.0
9.4
16 – 17 years
18 – 30 years
31 – 40 years
41 – 50 years
51 – 60 years
Older than 60 years
Figure 21: Location of commercial farmers Figure 22: Gender of commercial farmers
95%
5%
44%
56%
n Rural n Urban n Male n Female
Figure 23: Age of commercial farmers
Figure 24: Level of education of commercial farmers
0
%
Tertiary
Vocational education
Secondary education
Primary education
No formal education
0.6
1.1
13.9
61.1
23.4

19
Size and scope of farming businesses: Sizing the farming businesses by number of employees shows that most commercial farmersare in fact individual entrepreneurs or only employ a few people, demonstrating the importance of entrepreneurship and micro businessesin Rwanda. As illustrated below, 69% of commercial farmers do not have any employees, while the remaining 31% of commercial farmersactually generate employment (for a total of about 527 100 people). The large majority, however, are micro business (22%), employingonly 1 to 3 people, while small businesses (employing 4 to 30 employees) account for 6%. Only 3% of agricultural businesses are medium-size (employing more than 30 people)9.
Destination Number of commercial farmers Southern Province
Number of employees 374 866 69.1
Micro (1-3 employees) 117 633 21.7
Small (4-30 employees) 33 088 6.1
Medium (more than 30 employees) 15 896 2.9
Table 1: Size of commercial farming businesses
9 Note: It is recommended to conduct a FinScope MSME survey in Rwanda to assess these agricultural businesses in more detail.
Challenges facing the business: Commercial farmers face a range of challenges in their agricultural businesses as illustrated in thefigure below with finance being the most common as mentioned by 73% of commercial farmers (who said their business faces challenges).Finance includes a number of constraints, including sourcing money, opening a bank account, cash flow challenges, as well as being owedmoney/debtors, and financial records. Despite the relatively low levels of education among farmers, lacking skills is not perceived as amajor problem.
Figure 25: Challenges facing commercial farming businesses (of those who face challenges)
%
Finance
Resources
Sales and marketing
Legal
Skills and staff
Other
72.7
51.7
23.1
10.5
8.4
2.3

3.2 Agriculture finance for commercial farmersThis section discusses the different aspects about the agriculture finance for subsistence farmers. This section looks into the need forinvesting in agriculture as essential is increasing due to a rising population, regional politics and changing dietary preferences of thegrowing middle class in emerging markets toward higher value foods (e.g. dairy, meats, fish, fruits, vegetables, etc.). According to GIEWRwanda brief, food security is deteriorating in some eastern districts as stocks have been depleted earlier than usual following the belowaverage 2016A production, and households rely more on markets to meet their food needs10.
The figure below shows that many commercial farmers in Rwanda seem to plan for the next season: 34% do not have to buy agriculturalinputs because they manage with what they have already, e.g. seeds from the previous harvest, and 20% said they sell crops, livestock,and/or other produce for which they get the money for their agricultural activities. While 24% use their own savings, and only 13% rely oncredit. Lack of agriculture, specifically access to credit for agricultural activities among commercial farmers constrains commercial farminggrowth.
20
%
Pulses (beans, peas)
Roots (sweet potato)
Staples (grains)
Green bananas
Fruits
Vegetables
Cash crops (tea, coffee)
Other
Goats, sheep, pigs
Cattle
Other livestock
87.8
77.6
70.6
32.3
21.1
20.8
5.8
0.2
51.7
38.6
24
Figure 26: Farming categories of commercial farmers
Farming categories: Commercial farmers mainly depend on pulses (88%, e.g. beans, peas), roots (78%, e.g. sweet potato), and otherstaples (71%, e.g. grains) as shown in the figure below. Cultivated crops such as beans and peas, as well as grains offer huge opportunitiesfor commercial farmers along the value chain, e.g. through processing and canning. However, opportunities in the processing and canningindustry require sector knowledge, key financials, and capital requirements associated with this opportunity. Every second commercialfarmer also has livestock, mainly goats, sheep, and/or pigs (52%), followed by cattle (39%).
10 http://www.fao.org/giews/countrybrief/country.jsp?code=RWA
Figure 27: Sources of money for commercial farming activities
%
Do not have to buy, manage with what already have
Savings
Sell crops/livestock/other products to get money
Credit
Use money from other sources of income
Other
Do not buy imputs – get inputs in exchange for goods or labour
34.2
24
19.9
13.1
7.6
2.6
2.1

21
Drivers for saving and borrowing money for farming activities: Commercial farmers mainly save to buy livestock (70%). In turn, 31%borrowed money to pay for livestock. As for equipment, it seems to be the other way around. More commercial farmers borrow money topay for equipment (18%) rather than save for it (5%) as illustrated below.
Figure 28: Commercial farmers - drivers for agricultural savings (of those who are saving for agriculture purposes)
%
Livestock
Agriculture input
Equipment
69.2
26.4
4.5
Figure 29: Commercial farmers - drivers for agricultural credit (of those who borrow for agricultural purposes)
%
Agriculture input
Livestock
Equipment
51.4
30.6
18
3.3 Level of financial inclusion3.3.1 Overall levels of financial inclusion
The following section summarises the overall levels of financial inclusion among commercial farmers, i.e. the uptake of financial productsand/or services, including all forms of banking, savings, credit, remittances, insurance, mobile money, and informal mechanisms.
The financially included subsistence farmers include those who are:
n Formally served: 66% of commercial farmers have or use products or services from financial institutions that are regulatedthrough an Act of law (formal financial institutions), which is driven by other formal (non-bank) financial products/services (nationalaverage of 68%).
n Informally served: 81% have or use products or services from financial institutions that are not regulated (informal financialinstitutions and mechanisms) and/or use community based organisations/mechanisms to save or borrow money (national averageof 71%).
The formally served subsistence farmers further includes those who are:
n Banked: 21% of commercial farmers have or use products or services from licensed commercial banks that are regulated by thecentral bank (national average of 26%).
n Served by other formal financial institutions (non-bank): 62% have or use products or services from financial institutions that areregulated through Acts of law but which are not commercial banks (national average of 65%). That is mainly driven by the uptakeof mobile money, as well as the continued increase of Umurenge SACCOs. About 37% of commercial farmers in Rwanda aremembers of Umurenge SACCOs (national average of 51%).

22
Figure 30: Commercial farmers overview of financial products/services uptake
%
Financially included
Formally served
Banked
Other formal
Informal
Excluded
89.8
65.5
20.6
62.2
80.8
10.2
The Access Strand removes the overlaps using a hierarchical approach to depict the uptake of financial products/services. As illustratedbelow, 10% of commercial farmers in Rwanda are financially excluded. Around 24% of commercial farmers only rely on informal mechanismsto manage their financial lives. They do not use/have any formal financial products/services. 46% of commercial farmers have/use otherformal non-bank financial products/services. They do not use financial products/services offered by a commercial bank. They might,however, also use informal mechanisms to manage their financial lives. About 21% of commercial farmers are banked. They might alsohave/use financial products/services offered by other formal non-bank institutions and/or informal financial mechanisms. tions and/orinformal financial mechanisms.
As illustrated in the figure below, there are a number of overlaps in the uptake of financial products and services, especially with regardto the uptake of other formal and informal mechanisms.
Banked (21%) Other formal (62%)
Informal (81%)Excluded (10%)
1.0% 2.0%6.0%
39.0%
15.2%
2.3%
24.3%
Figure 31: Commercial farmers overlaps in product uptake
Figure 32: Commercial farmers Access Strand
20.6 45.5 10.224.3
% n Banked n Other formal n Informal only n Excluded
The following sections look at the uptake of specific product categories and financial behavior in more detail, namely banking, savings andinvestments, credit and borrowing, insurance and risk mitigation, as well as remittances and mobile money.

23
3.3.2 Banking and payments
Although overall levels of financial inclusion are relatively high in Rwanda, the FinScope survey found that commercial farmers in Rwandaare largely unbanked. About 79% of commercial farmers do not have a bank account in their name or joint accounts and/or are usingbanking channels or services11 to manage their finances. The main barriers to banking relate to insufficient or irregular income (81%). Inturn, 21% of commercial farmers are banked, which is mainly driven by the desire to save money (29%), to keep money safe (36%), and/orto get a bank loan (17%). It is interesting to note that although 17% commercial farmers that opened a bank account were hoping to getcredit, only 3% actually received a loan from the bank.
21% of commercial farmers are banked
Drivers
Commercial farmers in Rwanda have a bank account/usebanking services mainly to:
n Save money (29%)n Keep money safe (36%)n To get credit/loan (17%)
79% of commercial farmers are not banked(neither direct nor indirect)
Barriers
Commercial farmers do not have a bank account mainlydue to monetary reasons (affordability):
n Insufficient money coming in (81%)n Charges to high (6%)n Banks are too far away (6%)
3.3.3 Savings and investments
Savings are the leading product type and one of the main drivers of financial inclusion for commercial farmers in Rwanda. In total, 85% ofcommercial farmers save mainly to pay for living expenses when times are hard (75%). 31% save for farming activities, and only 8% savefor emergencies. In turn, only 15% of commercial farmers do not save, mainly because of monetary reasons; 68% said that they do nothave money to save.
85% of commercial farmers save
Drivers
Commercial farmers in Rwanda mainly save:
n To pay for pay for living expenses when times are hard(75%)
n Farming activities (30.8%)n Other emergencies (8.3%)
15% of commercial farmers do not save
Barriers
Commercial farmers do not save mainly due to monetaryreasons (affordability):
n Do not have money (68%)n Do not have job(13%)n It is too expensive (11%)
11 Other banking services refer to banking services over the counter (OTC), e.g. paying school fees, receiving income and remitting through a bank without having anaccount in their name.

24
Savings Strand: In constructing this strand, the overlaps in savings product/services usage are removed, showing that:
n 15% of commercial farmers do not save at alln 9% of commercial farmers keep all their savings at home, i.e. they do not have/use formal or informal savings products or
mechanisms n 33% of commercial farmers rely on informal mechanisms such as savings groups (they might also save at home, but they do not
have/use any formal savings products) n 34% of commercial farmers have/use other formal non-bank savings products (they might also have/use informal savings
mechanisms and/or save at home, but they do not have/use savings products from a commercial bank) n 10% of commercial farmers have/use savings products from a commercial bank (they might also have/use other formal and/or
informal mechanisms, and/or save at home)
The figure below illustrated the uptake of savings products/mechanisms. As shown, saving through informal savings groups (68%) andSACCOs (other formal 41%) is particularly popular. They are not only a viable alternative for the vast number of commercial farmers unlikelyto be served by commercial banks, they are also the catalyst for enhanced social capital, skills exchange, as well as community social andeconomic development. 40% of commercial farmers also save at home.
Figure 33: Commercial farmers overview of savings products/services uptake
%
Saving
Formally served
Banked
Other formal
Informal
At home
Not saving
85.4
44.2
10.2
41.4
68.2
39.9
14.6
Figure 34: Commercial farmers Savings Strand
10.2 34 14.68.532.7
% n Banked n Other formal n Informal only n At home only n Not saving

25
The figure below summarises the uptake of credit products/services. The percentage of commercial farmers taking a loan from a commercialbank is only 3%. Commercial farmers also lag behind in taking up credit from other formal (non-bank) institutions (15%). As shown below,the majority of commercial farmers rely on borrowing from informal groups (71%). The importance of informal groups to enhance financialinclusion among commercial farmers cannot be stressed enough especially in remote areas. 27% rely on family/friends.
78% of commercial farmers borrow(mainly from informal sources)
Drivers
Commercial farmers in Rwanda mainly borrow:
n Farming activities (34%)n To pay for pay for living expenses when times are hard
(28%)n For business (13%)n Other developmental purposes (18%)
22% of commercial farmers do not borrow
Barriers
Commercial farmers in Rwanda do not borrow mainly
because they:
n Are worried that they would not be able to pay back the
money (54%)n Did not need to borrow the money (29%)
n Do not believe in borrowing money (6%)
3.3.4 Credit and borrowingCommercial farmers are less likely to borrow than to save. In total, 78% of commercial farmers borrow, mainly for farming activities (34%)as illustrated in the figure below. Further 27% of commercial farmers borrowed money for other developmental reasons (e.g. business at13%, as well as land, building and education at 14%). In turn, 22% of commercial farmers do not borrow, mainly because they are worriesthey would not be able to pay it back (54%).
About 5000 commercial farmers were refused a loan by a bank or SACCO or MFI in the last 6 months prior to the FinScope survey mainlybecause they did not have down payment or did not have security or collateral. Another third that was refused a loan by these formalfinancial institutions were not told the reasons for refusal.
Figure 35: Commercial farmers overview of credit products/services uptake
%
Borrowing
Formally served
Banked
Other formal
Informal
Family/friends
Not borrowing
77.6
16.9
3.3
14.6
70.9
26.6
22.4
Credit Strand: In constructing this strand, the overlaps in credit product/services usage are removed, showing that:
n 22% of commercial farmers do not borrow at all n 3% of commercial farmers only rely on friends and/or family, i.e. they do not have/use formal or informal credit products or
mechanismsn 58% of commercial farmers rely on informal mechanisms such as savings groups and money lenders (they might also borrow
from family/friends, but they do not have/use any formal credit products) n 14% of commercial farmers have/use other formal non-bank credit products (they might borrow from informal sources and/or
borrow from friends, but they do not have/use credit products from a commercial bank) n 3% of commercial farmers have/use credit products from a commercial bank (they might also have/use other formal and/or informal
mechanisms, and/or borrow from friends/family)

26
Figure 36: Commercial farmers Credit Strand
3.3 13.6 22.4357.7
% n Banked n Other formal n Informal only n Family/friends only n Not borrowing
3.3.5 Remittances
Around 39% of commercial farmers in Rwanda either sent and/or received money from people living in a different place (within the countryand/or outside Rwanda). The most common mechanism used to transfer money is through formal channels (i.e. mobile money). Around6% of commercial farmers still send or receive money in cash through a relative/friend or deliver it in person. The figure below summarisesthe uptake by remittance channels.
Figure 38: Commercial farmers overview of remittances products/services uptake
%
Remitting
Formally served
Banked
Other formal
Informal
Relative/friend/personal
Not remitting
39.1
37.4
1.1
37.4
0.3
5.6
60.9
Credit and borrowing sources: As illustrated above, commercial farmers are more likely to obtain credit from informal mechanisms(51% savings groups and 20% from family and friends) than from formal financial services institutions (Umurenge SACCO 6% and banks3%).
Figure 37: Sources of credit
%
Savings group such as a co-op, VLSA, tontine ikibina
Family/friends
Received goods in advance and pay back later
Umurenge SACCO
Bank
Ubudehe credit scheme/VUP loan
MFI
Mobile money
51
20
10
6
3
2
2
1

27
Remittances Strand: The Remittances Strand shows that there are hardly any overlaps in the uptake of remittance channels.
Figure 39: Commercial farmers Remittances Strand
1.10.1
36.3 60.91.2
% n Banked n Other formal n Informal only n Relative/friend/personal only n Not remitting
3.3.6 Insurance and risk mitigation
To pay for livings expenses when times are hard is an important driver for both savings and borrowing. As such it is not surprising thatrunning out of money to meet household expenses is reported as the main financial risk experienced by 82% of commercial farmers inthe past 6 months prior to the survey, which is also relates seasonal fluctuations. Many commercial farmers rely on credit to deal with it(37% borrow money when they could not pay for household expenses) and/or the cut down expenses (31%), which increases theirvulnerability. Coping strategies for harvest and livestock losses (experienced by 61% of commercial farmers) mainly include cutting downexpenses (39%), followed by the use of savings (22%), and credit (19%). Only 0.2% claimed an insurance policy.
Figure 40: Commercial farmers’ financial risks experienced during the past 6 months
%
Running out of money to meet household expenses
Harvest/livestock loss
Pay for unforeseen expenses
Unexpected rise in prices of goods, fuel
Increase household size
Household not getting cash anymore
Loss of assets/dwelling/land
82.1
60.8
46.4
25.3
18.0
13.5
7.9
Four in five commercial farmers (80%) are covered by Mutuelle de Sante. Other risk cover, however, risk cover is low in Rwanda. In total,only 9% of commercial farmers are covered by an insurance product which is mainly driven by medical insurance (38%) and Rwanda’sSocial Security Board (21%). In turn, 91% of commercial farmers do not have an insurance/pension product, mainly because of a lack ofconsumer awareness/knowledge. 34% said that they never heard of it, and 28% said that they do not know how it works.
9% of commercial farmers have insurance
Drivers
Product uptake is driven by:
n Medical insurance (38%)n Rwanda’s Social Security Board (21%)n Life insurance (19%)n Third party (13%)n Agriculture (9%)
91% of commercial farmers do not have insurance
Barriers
Main barriers to the uptake of insurance relate to:
n Has never heard about it (34%)n Does not know how insurance works (28%)n Cannot afford (13%)n Does not know where to get it (10%)

28
3.3.7 Mobile money
Cellphone access and ownership continue to increase in Rwanda with 80% of commercial farmers owning/having access to a cellphone.As such, the uptake of mobile money has also increased over the past years with 36% of commercial farmers having/using a mobilemoney account. Product uptake is mainly driven by remittance (68%). In turn, 64% of commercial farmers do not have a mobile moneyaccount which poses a real opportunity for financial inclusion especially in remote areas. Main barriers to product uptake refer to a lack ofconsumer awareness/knowledge. 54% do not know about it, and 23% said they do not know how to use it.
36% of commercial farmers use mobile money
Drivers
Product uptake is driven by:
n Remittances (68%)n Saw other people using it/advertisement (15%)n Savings or to store money (12%)
64% of commercial farmers do notuse mobile money
Barriers
Main barriers to the uptake of mobile money relate to lackof consumer awareness and knowledge, e.g.
n Lack of product knowledge (54%)n Do not know how to use it (23%)n Do not need it (10%)

29
4 Farm workers4.1 Demographic profile and characteristicsAbout 30% (= 536 000) of Rwanda’s adult population can be classified as farm workers. They receive an income from agricultural activities,including farming, fishing, and/or rural wage labour, i.e. salary/wage from a farmer. They might come from households that are involved insubsistence farming but they are not the head of the household/are not involved in decision making regarding agricultural inputs. Farmworkers can be segmented further into (1) those who receive their main income through rural wage labour (14% of adults in Rwanda –farm workers only), and (2) those who also receive an income from other sources, including off-farm work (16% - farm workers and off-farm).
As shown in the following figures farm workers are mainly based in the rural areas: 96% of farm workers who only receive an income fromrural wage labour reside in rural areas compared to 92% of farm workers with additional sources of income. They are mainly female (76%and 75% respectively), and are rather young (46% are 30 years of age or younger, and 48% respectively), with relatively lower levels ofeducation. 18% of farm workers who only receive an income from rural wage labour have no formal education compared to 17% of farmworkers with additional sources of income, and a further 46% and 48% respectively have only primary education, which might affect theiroverall skills in bookkeeping and financial planning.
96%
4%
92%
8%
n Rural n Urban n Rural n Urban
Figure 41: Location of farm workers
Farm workers only Farm workers and off-farm
76%
24%
75%
25%
n Male n Female n Male n Female
Figure 42: Gender of farm workers
Farm workers only Farm workers and off-farm

30
7.7 5.2
38.4 42.9
19.326.5
14.8 14.9 11.0 8.0 8.7 2.5
16 – 17 years
18 – 30 years
31 – 40 years
41 – 50 years
51 – 60 years
Older than 60 years
Figure 43: Age of farm workers
n Farm workers only n Farm workers and off-farm
Figure 44: Level of education of commercial farmers
%
Tertiary
Vocational education
Secondary education
Primary education
No formal education
0.4
1.5
0.8
1.3
23.6
19.9
57.0
60.5
18.2
16.8
n Farm workers only n Farm workers and off-farm
4.2 Level of financial inclusion4.2.1 Overall levels of financial inclusion
The following section summarises the overall levels of financial inclusion among farm workers, i.e. the uptake of financial products and/orservices, including all forms of banking, savings, credit, remittances, insurance, mobile money, and informal mechanisms.
As shown in the figures below, farm workers who also have other sources of income including off-farm work are more likely to be financiallyincluded (both served formally and informally). 91% of those with additional sources of income are financially included, compared to 86%of farm workers who only rely on rural wage labour.
The financially included farm workers include those who are:
n Formally served: 65% of farm workers who only receive an income from rural wage labour have or use products or servicesfrom financial institutions that are regulated through an Act of law (formal financial institutions), which is driven by other formal(non-bank) financial products/services, compared to 66% of farm workers with additional sources of income, and the nationalaverage of 68%.
n Informally served: 71% of farm workers who only receive an income from rural wage labour have or use products or servicesfrom financial institutions that are not regulated (informal financial institutions and mechanisms) and/or use community basedorganisations/mechanisms to save or borrow money, compared to 79% of farm workers with additional sources of income, andthe national average of 71%.

31
The formally served farm workers further includes those who are:
n Banked: 20% of farm workers who only receive an income from rural wage labour have or use products or services from licensedcommercial banks that are regulated by the central bank, compared to 22% of farm workers with additional sources of income,and the national average of 26%.
n Served by other formal financial institutions (non-bank): 61% of farm workers who only receive an income from rural wage labourhave or use products or services from financial institutions that are regulated through Acts of law but which are not commercialbanks, compared to 64% of farm workers with additional sources of income, and the national average of 65%. That is mainlydriven by the uptake of mobile money, as well as the continued increase of Umurenge SACCOs. About 34% of farm workers whoonly receive an income from rural wage labour are members of Umurenge SACCOs, compared to 37% of farm workers withadditional sources of income, and the national average of 51%.
Figure 45: Farm workers overview of financial products/services uptake
Financially included
Formally served
Banked
Other formal
Informal
Excluded
90.8
66.3
21.9
63.7
79.4
9.2
As illustrated in the figure below, there are a number of overlaps in the uptake of financial products and services, especially with regardto the uptake of other formal and informal mechanisms.
Banked (20%) Other formal (61%)
Informal (71%)Excluded (14%)
1.1% 3.6%10.7%
33.8%
13.4%
2.3%
21.2%
Figure 46: Farm workers overlaps in product uptake
85.8
64.7
20.4
61.3
70.7
14.2
% %Farm workers only
Farm workers only
Farm workers and off-farm
Farm workers and off-farm
Banked (22%) Other formal (64%)
Informal (79%)Excluded (9%)
0.6% 3.3%7.5%
36.9%
16.1%
2.0%
24.5%

32
The Access Strand removes the overlaps using a hierarchical approach to depict the uptake of financial products/services, showing that:
n 14% of farm workers who only receive an income from rural wage labour are financially excluded, compared to 9% of farm workerswith additional sources of income
n 21% of farm workers who only receive an income from rural wage labour only rely on informal mechanisms to manage theirfinancial lives, compared to 25% of farm workers with additional sources of income. They do not use/have any formal financialproducts/services
n 44% of both farm workers’ segments have/use other formal non-bank financial products/services. They do not use financialproducts/services offered by a commercial bank. They might, however, also use informal mechanisms to manage their financiallives
n 20% of farm workers who only receive an income from rural wage labour are banked, compared to 22%. They might also have/usefinancial products/services offered by other formal non-bank institutions and/or informal financial mechanisms.
Figure 47: Farm workers Access Strand
21.9 44.4
44.4
9.224.5
20.2 14.221.2
% n Banked n Other formal n Informal only n Excluded
The following sections look at the uptake of specific product categories and financial behavior in more detail, namely banking, savings andinvestments, credit and borrowing, insurance and risk mitigation, as well as remittances and mobile money.
4.2.2 Banking and payments
Although overall levels of financial inclusion are relatively high in Rwanda, the FinScope survey found that farm workers in Rwanda arelargely unbanked. About 80% of farm workers who only receive an income from rural wage labour do not have a bank account in theirnames or joint accounts and/or are using banking channels or services12 to manage their finances, compared to 78% of farm workers withadditional sources of income. The main barriers to banking relate to insufficient or irregular income (83% and 86% respectively). In turn,20% and 22% respectively are banked, which is mainly driven by savings (37% and 46% respectively), and the desire to keep money safe(31% and 21%). Further, 27% of farm workers with additional sources of income said they have a bank account to process incomepayments.
20% of farm workers who only receive anincome from rural wage labour are banked
Drivers
Farm workers in Rwanda have a bank account/use bankingservices mainly to:
n Save money (37%)n Keep money safe (31%)n To process income (8%)
80% of farm workers who only receive anincome from rural wage labour are not banked
(neither direct nor indirect)Barriers
Farm workers do not have a bank account mainly due tomonetary reasons (affordability):
n Insufficient money coming in (83%)n Charges too high (4%)n Banks are too far away (5%)
12 Other banking services refer to banking services over the counter (OTC), e.g. paying school fees, receiving income and remitting through a bank without having anaccount in their name.

33
4.2.3 Savings and investments
Savings are the leading product type and one of the main drivers of financial inclusion for farm workers in Rwanda. In total, 86% of farmworkers who only receive an income from rural wage labour save, compared to 90% of farm workers with additional sources of income.Farm workers mainly save to pay for living expenses when times are hard (68% and 66% respectively), indicating their high vulnerabilityand dependency on seasonal work which often results in low/irregular income. In turn, only 14% of farm workers who only receive anincome from rural wage labour do not save, compared to 10% of farm workers with additional sources of income. Farm workers do notsave mainly because of monetary reasons. 60% and 64% respectively said that they do not have the money to save, and/or do not havea job (17% and 20% respectively).
86% of farm workers who only receive anincome from rural wage labour save
Drivers
Farm workers in Rwanda mainly save:
n To pay for pay for living expenses when times are hard(68%)
n Developmental purposes (15%)n Medical and non-medical emergencies (11%)
14% of farm workers who only receive anincome from rural wage labour do not save
Barriers
Farm workers do not save mainly due to monetary reasons(affordability):
n Do not have money (60%)n Do not have job (17%)
22% of farm workers with additional sources of income are banked
Drivers
Farm workers in Rwanda have a bank account/use bankingservices mainly to:
n Save money (46%)n Keep money safe (21%)n To process income (27%)
78% of farm workers with additional sources of income are not banked
(neither direct nor indirect)Barriers
Farm workers do not have a bank account mainly due tomonetary reasons (affordability):
n Insufficient money coming in (86%)n Charges too high (4%)n Banks are too far away (4%)
90% of farm workers with additionalsources of income save
Drivers
Farm workers in Rwanda mainly save:
n To pay for pay for living expenses when times are hard(66%)
n Developmental purposes (14%)n Medical and non-medical emergencies (11%)
10% of farm workers with additionalsources of income do not save
Barriers
Farm workers do not save mainly due to monetary reasons(affordability):
n Do not have money (64%)n Do not have job (20%)

34
The figure below illustrated the uptake of savings products/mechanisms. As shown, saving through informal savings groups (60% and65% respectively) and SACCOs (other formal 40% and 45% respectively) is particularly popular. They are not only a viable alternative forthe vast number of farm workers unlikely to be served by commercial banks, they are also the catalyst for enhanced social capital, as wellas community social and economic development. 41% of farm workers who only receive an income from rural wage labour save at home,compared to 36% of farm workers with additional sources of income.
Figure 48: Farm workers overview of savings products/services uptake
Saving
Formally served
Banked
Other formal
Informal
At home
Not saving
90.4
48.3
10.4
45.3
65.0
35.6
85.7
42.9
7.1
40.0
60.0
40.5
14.3
% %Farm workers only
Farm workers
only
Farm workers and off-farm
Farmworkers and
off-farm
9.6
Savings Strand: In constructing this strand, the overlaps in savings product/services usage are removed, showing that:
n 14% of farm workers who only receive an income from rural wage labour do not save at all, compared to 10% of farm workerswith additional sources of income
n 12% of farm workers (both segments) keep all their savings at home, i.e. they do not have/use formal or informal savings productsor mechanisms
n 31% of farm workers who only receive an income from rural wage labour rely on informal mechanisms such as savings groups(they might also save at home, but they do not have/use any formal savings products), compared to 30% of farm workers withadditional sources of income
n 36% of farm workers who only receive an income from rural wage labour have/use other formal non-bank savings products (theymight also have/use informal savings mechanisms and/or save at home, but they do not have/use savings products from acommercial bank), compared to 38% of farm workers with additional sources of income
n 7% of farm workers who only receive an income from rural wage labour have/use savings products from a commercial bank (theymight also have/use other formal and/or informal mechanisms, and/or save at home), compared to 10% of farm workers withadditional sources
Figure 49: Farm workers Savings Strand
10.4 37.9
35.8
11.7 9.630.3
7.1 12.2 14.330.5
% n Banked n Other formal n Informal only n At home only n Not saving

35
The figure below summarises the uptake of credit products/services. The percentage of farm workers taking a loan from a commercialbank is only 1% for farm workers who only receive an income from rural wage labour, and 3% for those farm workers with additionalsources of income. Farm workers also lag behind in taking up credit from other formal (non-bank) institutions (10% and 12% respectively).As shown below, the majority of farm workers rely on borrowing from informal groups (58% and 66% respectively). The importance ofinformal groups to enhance financial inclusion among farm workers cannot be stressed enough especially in remote areas. 28% of farmworkers who only receive an income from rural wage labour rely on family/friends, compared to 34% of farm workers with additionalsources of income.
4.2.4 Credit and borrowing
Farm workers are less likely to borrow than to save. Interestingly, farm workers with additional sources of income are more likely to borrowthan those who only receive an income from rural wage labour. In total, 65% of farm workers who only receive an income from rural wagelabour borrow, compared to 76% of farm workers with additional sources of income. Farm workers mainly borrow money for developmentalpurposes (e.g. education, business, and farming). Of concern, however, is that 29% and 34% of farm workers borrow money to pay forlivings expenses when times are hard which further increases their vulnerability. In turn, 35% of farm workers who only receive an incomefrom rural wage labour do not borrow, compared to 24% of farm workers with additional sources of income. Farm workers do not borrowmainly because they are worries they would not be able to pay it back (44% and 56% respectively). Interestingly, 40% and 23% of farmworkers respectively said they did not need to borrow money – mainly because they cut down expenses when they ran out of money (seerisk mitigation section 4.2.6).
65% of farm workers who only receive anincome from rural wage labour borrow
(mainly from informal sources)Drivers
Farm workers in Rwanda mainly borrow:
n Developmental activities - education, business andfarming (48%)
n To pay for pay for living expenses when times are hard(29%)
n Medical and non-medical emergencies (20%)
35% of farm workers who only receive anincome from rural wage labour do not borrow
Barriers
Farm workers do not borrow mainly because they:
n Are worried that they would not able to pay back themoney (44%)
n Did not need to borrow the money (40%)n Do not have security (11%)
76% of farm workers with additional sources of income borrow(mainly from informal sources)
Drivers
Farm workers in Rwanda mainly borrow:
n Developmental activities - education, business andfarming (37%)
n To pay for pay for living expenses when times are hard(34%)
n Medical and non-medical emergencies (19%)
24% of farm workers with additional sources of income do not borrow
Barriers
Farm workers do not borrow mainly because they:
n Are worried that they would not able to pay back themoney (56%)
n Did not need to borrow the money (23%)n Do not have security (14%)

36
Figure 50: Farm workers overview of credit products/services uptake
Borrowing
Formally served
Banked
Other formal
Informal
Family/friends
Not borrowing
76.4
14.2
3.2
12.4
66.1
34.0
65.4
10.7
1.2
9.9
57.9
28.1
34.6
% %Farm workers only Farm workers and off-farm
23.6
Credit Strand: In constructing this strand, the overlaps in credit product/services usage are removed, showing that:
n 35% of farm workers who only receive an income from rural wage labour do not borrow at all, compared to 24% of farm workerswith additional sources of income
n 5% of farm workers who only receive an income from rural wage labour only rely on friends and/or family, i.e. they do not have/useformal or informal credit products or mechanisms, compared to 6% of farm workers with additional sources of income
n 50% of farm workers who only receive an income from rural wage labour rely on informal mechanisms such as savings groupsand money lenders (they might also borrow from family/friends, but they do not have/use any formal credit products), comparedto 57% of farm workers with additional sources of income
n 10% of farm workers who only receive an income from rural wage labour have/use other formal non-bank credit products (theymight borrow from informal sources and/or borrow from friends, but they do not have/use credit products from a commercialbank), compared to 11% of farm workers with additional sources of income
n Only 1% of farm workers who only receive an income from rural wage labour have/use credit products from a commercial bank(they might also have/use other formal and/or informal mechanisms, and/or borrow from friends/family), compared to 3% of farmworkers with additional sources of income.
Farm workers
only
Farmworkers and
off-farm
Figure 51: Farm workers Credit Strand
3.2 11.0
9.5
5.5 23.656.6
4.9 34.649.8
% n Banked n Other formal n Informal only n Family/friends only n Not borrowing
1.2

37
Remittances Strand: The Remittances Strand shows that there are hardly any overlaps in the uptake of remittance channels.
4.2.5 Remittances
Around 39% of farm workers in Rwanda either sent and/or received money from people living in a different place (within the country and/oroutside Rwanda). The most common mechanism used to transfer money is through formal channels (i.e. mobile money). Around 6% offarm workers still send or receive money in cash through a relative/friend or deliver it in person. The figure below summarises the uptakeby remittance channels.
Figure 52: Farm workers overview of remittances products/services uptake
Borrowing
Formally served
Banked
Other formal
Informal
Relative/friend/personal
Not remitting
38.5
35.9
1.5
35.5
0.3
5.9
39.3
35.7
0.9
35.3
0.2
5.8
60.7
% %Farm workers only Farm workers and off-farm
61.5
Farm workers
only
Farmworkers and
off-farm
Figure 53: Farm workers Remittances Strand
34.4
34.8
2.6 61.5
3.7 60.7
% n Banked n Other formal n Informal only n Relative/friend/personal only n Not remitting
0.9
1.5

38
4.2.6 Insurance and risk mitigation
To pay for livings expenses when times are hard is a main driver for both savings and borrowing. As such it is not surprising that runningout of money to meet household expenses is reported as the main financial risk experienced by 82% of farm workers who only receive anincome from rural wage labour in the past 6 months prior to the survey. This figure is even higher for farm workers with additional sourcesof income with 85%. Most farm workers dealt with it by cutting down expenses (32% and 34% respectively) and/or borrowed money (31%and 34% respectively), which increases their vulnerability. Coping strategies for harvest and livestock losses (experienced by 57% and56% respectively) include cutting down expenses, use savings, and borrow money. Less than 1% claimed an insurance policy.
Figure 54: Farm workers’ financial risks experienced during the past 6 months
0
%
Running out of money to meet householdexpenses
Harvest/livestock loss
Pay for unforeseen expenses
Unexpected rise in prices of goods, fuel
Increase household size
Household not getting cash anymore
Loss of assets/dwelling/land
84.7
82.2
55.7
56.6
43.1
45.9
18.5
18.2
15.8
17.2
11.5
13.1
7.2
7.8
n Farm workers and off-farm n Farm workers only
About 82% of farm workers who only receive an income from rural wage labour are covered by Mutuelle de Sante, compared to 78% offarm workers with additional sources of income. However, other risk cover is low in Rwanda. In total, only 3% of farm workers who onlyreceive an income from rural wage labour are covered by an insurance product, compared to 7% of farm workers with additional sourcesof income. Insurance cover is mainly driven by medical insurance (60% and 76% respectively), as well as Rwanda’s Social Security Board(23% and 40% respectively). In turn, 97% of farm workers who only receive an income from rural wage labour do not have aninsurance/pension product, compared to 93% of farm workers with additional sources of income. Main barriers to the uptake of insurancerelate to monetary reasons (cannot afford it 57% and 61% respectively), as well as lack of consumer awareness/knowledge (do not knowhow it works, where to get it, never heard about it).
3% of farm workers who only receive an income from rural wage labour
have insuranceDrivers
Product uptake is driven by:
n Medical insurance (60%)n Rwanda’s Social Security Board (23%)
97% of farm workers who only receive anincome from rural wage labour do not
have insuranceBarriers
Main barriers to the uptake of insurance relate to:
n Cannot afford (57%)n Does not know how it works and where to get it (22%)n Has never heard about it (18%)

39
7% of farm workers with additional sourcesof income have insurance
Drivers
Product uptake is driven by:
n Medical insurance (76%)n Rwanda’s Social Security Board (40%)
97% of farm workers who only receive anincome from rural wage labour do not
have insuranceBarriers
Main barriers to the uptake of insurance relate to:
n Cannot afford (61%)n Does not know how it works and where to get it (22%)n Has never heard about it (15%)
4.2.7 Mobile money
Cellphone access and ownership continue to increase in Rwanda with 85% of farm workers who only receive an income from rural wagelabour owning/having access to a cellphone, compared to 87% of farm workers with additional sources of income. As such, the uptake ofmobile money has also increased over the past years with 31% of farm workers who only receive an income from rural wage labourhaving/using a mobile money account, compared to 35% of farm workers with additional sources of income. Farm workers mainly usetheir mobile money account to remit money (59% and 58% respectively), but also to save money (14% and 15% respectively) which posesa real opportunity for financial inclusion. In turn, 69% of farm workers who only receive an income from rural wage labour do not usemobile money, compared to 65% of farm workers with additional sources of income, mainly because of a lack of consumer awareness(lack of product knowledge, do not know how to use it).
31% of farm workers who only receive anincome from rural wage labour use
mobile moneyDrivers
Product uptake is driven by:
n Remittances (59%)n Saw other people using it/advertisement (22%)n Savings or to store money (14%)
69% of farm workers who only receive anincome from rural wage labour do not use
mobile moneyBarriers
Main barriers to the uptake of mobile money relate to lackof consumer awareness and knowledge, e.g.
n Lack of product knowledge (53%)n Do not know how to use it (26%) n Do not need it (12%)
35% of farm workers with additional sources of income use mobile money
Drivers
Product uptake is driven by:
n Remittances (58%)n Saw other people using it/advertisement (25%)n Savings or to store money (15%)
65% of farm workers with additional sources of income do not use mobile money
Barriers
Main barriers to the uptake of mobile money relate to lackof consumer awareness and knowledge, e.g.
n Lack of product knowledge (57%)n Do not know how to use it (21%) n Do not need it (9%)
40
5 Recommendations and implications for stakeholders5.1 RecommendationsAs shown in this report, financial inclusion among farmers in Rwanda is relatively high and varies between 86% and 91%. Nevertheless,there is opportunity to further growth, especially in terms of deepening financial inclusion beyond access and moving towards a greaterlevel of formal inclusion (particularly with regard to the uptake of banking products/services) which require a holistic approach to povertyalleviation and rural development, constant innovation, capacity building and financial education, as well as persistent monitoring of progress(e.g. using FinScope surveys and additional research).
Holistic approach to rural development and poverty alleviation - The study shows that various constraints might prevent farmers fromengaging with (formal) financial products/services. They refer to both specific ones related to the financial sector and overarching structuralissues such as low levels of education and low/irregular incomes. Hence, rural development and financial inclusion require a holisticapproach and the buy-in from all its stakeholders, including government, the financial sector, and the private sector, for example throughpartnerships, contracts and triparty arrangements.
Capacity building and financial education - Low levels of education among farmers is a major challenge in the sector. Often, farmerslack business skills like record-keeping, understanding market needs, preparing funding proposals, and the standards required of theirproduce. Further, there is a need to transform the sector from subsistence agriculture to a more market-oriented approach, which wouldalso to improve the credibility of farmers when borrowing from financial institutions. Financial capability and confidence especially withregard to formal financial services has also been shown to be a key barrier (i.e. for the uptake of mobile money and insurance), particularlyfor farmers that have little or no experience with financial services. As such, access to information and consumer education becomesimportant, which calls for further strategic intervention from both the private and public sector. An improved understanding of benefits,costs and risks of financial services increases the likelihood of the beneficial use of appropriate financial services. Given that formal inclusionis driven by the uptake of other formal financial products/services (i.e. mobile money), promoting these products /services to farmers posesa real opportunity for financial inclusion.
Innovation - Although distance to the bank hasn’t been reported as a major barrier, (geographical) convenience might still be a driver ofthe uptake of financial products/services given the preference for informal mechanisms, savings at home, and borrowing from family/friends.Moving towards increased uptake of Umurenge SACCOs and mobile money might be key channels to facilitate easy access and to reducethe vulnerability particularly of farmers residing in remote areas. Information on savings and borrowing behavior of farmers might alsopresent an opportunity for FSPs to provide insights into farmers’ financial needs and performance as responsible borrowers.
5.2 Implications for stakeholdersFinancial inclusion is seen as a major driver of economic development in Rwanda. However, access to formal financial services by farmersis still limited across the country. Location plays a particularly important role, as adults residing in rural areas are much more under-served(i.e. relying on informal mechanisms only) than those living in urban areas. The analysis in this report offer many opportunities for improvingfarmers’ financial inclusion in Rwanda.
5.2.1 Recommendations for policy-makers and regulators
Create awareness to policy-makers and other stakeholders with regard to the financial needs of farmers in different marketsegments, bringing farmers associations into policy dialogue – Policy-makers can encourage the adoption of effective policy measures.It is recommended that stakeholders identify and endorse policy champions for fostering farmers’ financial inclusion. The central bank, asthe custodian of financial inclusion programme/agenda in Rwanda, can reinforce the implementation of a self-check tool (sector check-list) for the commercial banks, MFIs and SACCOs in the country. This set-up could encourage the financial services providers to checkwhether their financial products and services address farmers’ needs.
Dedicated training/financial education programmes targeted at farmers - This report showed that farmers often have lower levelsof education and that they are more likely to be lacking awareness of innovative financial products. Policy-makers can promote and drivethe public-private partnership that leads to greater financial inclusion for farmers through a coordinated national financial education strategy.Continued modification and adjusting of legal, regulatory and supervisory frameworks – this relates to continuous monitoring, removingimpediments and allowing space for innovation to allow greater financial inclusion for Rwandan farmers.
Information dissemination - Policy-makers to recommend and share financial sector policy and strategies and make them available toother stakeholders involved in the policy-making and advocacy process (networks, associations and other civil society organisations aswell as donor agencies). These financial and agricultural sector recommendations can be useful to set financial inclusion targets, to support

the assessment of financial needs, and to design appropriate services for farmers according to their context (e.g. seasonality, weatherpatterns, and level of poverty).
As such, the Government of Rwanda supports research projects and has developed numerous agricultural and financial strategies guidedby Vision 2020 and the Financial Sector Development Program (FSDP), which are available online on the Ministry of Finance and EconomicPlanning website13, such as the following:
n Building an Inclusive Financial Sector in Rwanda (BIFSIR) project, funded by UNDP/UNCDF to scale up entrepreneurial capacitybuilding, financial education and financial linkages to target groups of youth and women.
n Crop and Livestock Insurance Feasibility Study to explore the potential of developing crop and livestock insurance in Rwanda.
n National Financial Education Strategy (NFES) aimed at deepening and broadening the financial literacy of Rwandans.
n National Microfinance Policy Implementation Strategy 2013-2017 to offer guidance to microfinance players and develop the sectorover the next few years.
n Rural and Agricultural Financial Services Strategy to enable to shift from subsistence agriculture towards market-oriented agriculturewith particular focus on financing agricultural value chains.
n Saving Mobilisation Strategy to strengthen financial infrastructure, mobilise savings and help culture of saving.
n FinScope surveys which are supported by the Government of Rwanda and have been conducted in 2008, 2012 and 2016.
5.2.2 Recommendations for NGOs and other development agencies
Strengthening informal FSPs to expand outreach of financial services to rural areas - Accessibility of informal financial serviceproviders and their ability to design products that suits the needs of individuals (specifically farmers) makes them ideal providers at districtlevels. However, informal operators may not have the technical know-how of managing financial services and may also lack resources tosatisfy the needs of all their clients. Building the financial and managerial capacity of informal financiers may allow majority of farmers toobtain quality financial services at a lower cost.
Demand-driven research and data, research institutes, donors – It is recommended that development agencies continue to supportthe sector through identifying measures for key dimensions of financial inclusion among farmers (e.g. % of farmers within 1-hour travel ofa branch/agent or dashboard on m-money services awareness/usage) that can be regularly updated, and establish systems for regularreporting/collection of information needed to measure the defined indicators.
Specialised agricultural finance tools and guides - Specialised tools such as Information Management Systems developed bydevelopment agencies and research institutes, tools like the Agricultural Lending Analysis System (ALAS), credit scoring tools and agriculturalmapping (see above), as well as studying the agricultural value chain can assist FSPs and other stakeholders with information for designingnew products and services, mitigating risks, lowering their costs, and making appropriate decisions that foster the financial inclusion offarmers14.
5.2.3 Recommendations for financial service providers (FSPs)
FSP and telcos to promote financial education - Financial education programs targeted at farmers will enable them to develop areasonable understanding about the language used by FSP (such as banks, MFI) on the benefits of owning a formal financial account andhow to apply for it, as well as varieties of bank products/services. Farmers also need to develop financial literacy in order to present fundingproposals that are attractive to FSPs. This includes organising farmers and linking them to FSPs.
Recognising the role of cooperatives and SACCOs – As shown in this report, cooperatives and SACCOs are very important in improvingaccess to finance in agriculture. They have closer proximity to adults residing in remote rural areas and as such can reach more farmersat a lower cost. Further, they usually lend small amounts that farmers need and but cannot be provided by FSPs. As such, it is recommendedthat FSPs develop stronger partnerships with cooperatives and SACCOs in order to achieve the desired results.
41
13 The URL links are provided under the section References.14 Some interesting agricultural lending tools developed by AgriFin (World Bank) with financial institutions in Africa and Asia are available online at
https://www.agrifinfacility.org/agricultural-lending-tools-corner. They include agricultural lending guidelines, credit assessment tools, product sheets, training materials,and value chain assessments. are available online at https://www.agrifinfacility.org/agricultural-lending-tools-corner

42
Understanding the market for a specific service – As shown in this report, farmers have different financial services’ needs. It is importantthat FSPs understand these needs and circumstances under which they operate (e.g. seasonality, remoteness) to be able to design suitableproducts and services. Hence, it is recommended to employ specialised agricultural officers who understand the sector. These officerscould help to design products, handle agricultural loan facilities, as well as offer financial and business advice to the farmers.
Innovation along the agricultural value chain – Given the specific needs of farmers, it is recommended that FSPs use innovative productdevelopment along the agricultural value chain15, such as business development funds (BDFs), weather-based crop insurance, andwarehouse receipt schemes.
n Savings: Micro-group financing could provide a risk sharing facility targeting farmers’ savings groups. Deepening rural, branchlessand mobile banking/vans could be an example of financial services designed to meet the requirements of farmers who are facedby remoteness.
n Credit: FSPs should consider the seasonality of the sector when designing their products. As such, the timing of the loandisbursement, for example, should be in accordance with the agricultural seasons. Small loan amounts can be disbursed fordifferent activities at different stages of the season, such as credit for seeds during the pre-sowing phase, pest management andfertilizers during sowing and vegetative phase, as well as loan disbursements during and post-harvesting. It is important, however,not to overfund or underfund agricultural activities. Otherwise the risk of non-repayment increases. In addition, flexibility with regardto the type of collateral required makes it possible for more farmers to borrow.
n Insurance: As mentioned above, it is imperative to understand the sector; not only to design new products and services that meetfarmer’s needs but also to develop appropriate risk mitigation strategies. A multi-stakeholder approach is recommended here. Forexample, agricultural, financial, and meteorological experts can assist a consortium of insurance companies to underwrite specificmicro-insurance products, taking existing and emerging risks (e.g. climate change) into account.
n Further, it is recommended to combine financial products / package them together such as savings and credit, as well as insuranceto reduce costs, and therefore making them more affordable to farmers, as well as to mitigate the risks of non-repayment. Forexample, one of the major reasons for defaults on loan payments is crop failure as a result of drought. Combining loan disbursementwith a weather-based crop insurance scheme seems sensible.
Leveraging the mobile phone access and ownership – Rwanda has good penetration of cellphones, providing a huge opportunity togrow the number of mobile money uptake and usage. A number of farmers who are served only through informal mechanisms are notaware of mobile money services. A further segment that is aware of mobile money services does not understand how it could benefit themor to operate mobile money services. Effective marketing from the FSP is therefore necessary for mobile money services to reach scaleamong farmers in Rwanda.
Supporting the digital financial services - Electronic money transfers are key to lowering the cost of remittances for poor economiesthat heavily depend on such transfers and technology. It is currently evolving at a fast pace and therefore costs will be significantly lowerin the near future, favoring local development and financial inclusion16.
15 For a practical guide on agricultural value chain finance please refer to Cuevas, C. and Pagura, M. 2016.16 For a practical guide on how to use digital financial services in agriculture please refer to Martin, C. et. al. 2016.

6 ReferencesAFR 2015. Agricultural finance conference report. 7-8 October 2015. Available online at URL: http://www.fsdafrica.org/wp-content/uploads/2015/11/AFR-AFC-Report-04.11.15.pdf
AFR 2015. Supporting agricultural finance. Available online at URL: http://www.afr.rw/wp-content/uploads/2015/11/Supporting-agriculture-finance-in-Rwanda-Brief.pdf
Bizimana, C. et.al. 2012. Trends in Key Agricultural and Rural Development Indicators in Rwanda. Available online at URL:http://www.minagri.gov.rw/fileadmin/user_upload/documents/RWANDA_SAKSS/Annual_Trends_and_Outlook_Report_2012.pdf
Cuevas, C. and Pagura, M. 2016. The Agricultural Value Chain Finance - A Guide for Bankers. Available online at URL: http://www.fgda.org/dati/ContentManager/files/Documenti_microfinanza/AVCF-Guide.pdf
GPFI 2015. New trends in agricultural finance. Available online at URL: http://www.gpfi.org/sites/default/files/documents/02-New%20Trend%20Agricultural%20Finance%20Report-Final-LowRes.pdf
Martin, C. et. al. 2016. Guide to the Use of Digital Financial Services in Agriculture. Available online at URL: https://www.usaid.gov/sites/default/files/documents/15396/Guide%20to%20DFS%20in%20Ag_Web_Final.pdf
Umuhinzi 2015. Bank loans for agricultural sector must recover. Available online at URL: http://www.umuhinzi.com/english/9675/whos-to-blame-for-no-bank-loans-to-agricultural-sector/
Other resources shared by the Government of Rwanda, e.g.: Building an Inclusive Financial Sector in Rwanda (BIFSIR). Available online at URL:http://www.minecofin.gov.rw/fileadmin/templates/documents/Building_an_Inclusive_Financial_Sector_in_Rwanda.pdf
Crop and Livestock Insurance Feasibility Study. Available online at URL: http://www.minecofin.gov.rw/fileadmin/templates/documents/AFR_Agri_Feasiblity_Study_FINAL_Agric_insurance.pdf
National Financial Education Strategy (NFES). Available online at URL:http://www.minecofin.gov.rw/fileadmin/templates/documents/National_Financial_Education_Strategy.pdf
National Microfinance Policy Implementation Strategy 2013-2017. Available online at URL: http://www.minecofin.gov.rw/fileadmin/templates/documents/National_Microfinance_Policy_Implementation_Strategy.pdf
Rural and Agricultural Financial Services Strategy. Available online at URL:http://www.minecofin.gov.rw/fileadmin/templates/documents/Rural_and_Agricultural_Financial_Services_Strategy.pdf
Saving Mobilisation Strategy. Available online at URL:http://www.minecofin.gov.rw/fileadmin/templates/documents/National_Savings_mobilization_strategy.pdf
Economic Development and Poverty Reduction Strategy II 2013 – 2018. Available online at URL:http://www.minecofin.gov.rw/fileadmin/templates/documents/NDPR/EDPRS_2.pdf
43

Janine AmpulireMonitoring, Evaluation and Learning Manager
ACCESS TO FINANCE RWANDA (AFR)PO Box 1599 Kigali Rwanda
Phone: +250782507751Email: [email protected]
orEmail: [email protected]
Top Related