FinScope MSME Survey - World...
60
FinScope MSME Survey Zimbabwe 2012 Public Disclosure Authorized Public Disclosure Authorized Public Disclosure Authorized Public Disclosure Authorized Public Disclosure Authorized Public Disclosure Authorized Public Disclosure Authorized Public Disclosure Authorized
-
Upload
truongxuyen -
Category
Documents
-
view
218 -
download
2
Transcript of FinScope MSME Survey - World...

FinScope MSME Survey Zimbabwe 2012
Pub
lic D
iscl
osur
e A
utho
rized
Pub
lic D
iscl
osur
e A
utho
rized
Pub
lic D
iscl
osur
e A
utho
rized
Pub
lic D
iscl
osur
e A
utho
rized
Pub
lic D
iscl
osur
e A
utho
rized
Pub
lic D
iscl
osur
e A
utho
rized
Pub
lic D
iscl
osur
e A
utho
rized
Pub
lic D
iscl
osur
e A
utho
rized
WB406484
Typewritten Text
94505


Table of contents
Acknowledgements 1
List of figures 2
List of tables 3
Acronyms and abbreviations 4
Definitions 5
Executive summary 8
1 Introduction and background 101.1 Background to the FinScope MSME study 101.2 Methodology of the study 11
2 Country context: MSMEs and the financial sector in Zimbabwe 132.1 Economic context 132.2 MSME support institutions in Zimbabwe 142.3 Banking industry and financial services 15
3 Overview of size and scope of the MSME sector in Zimbabwe 183.1 MSME owners 183.2 Employees 233.3 Nature of businesses 23
4 Financial inclusion 294.1 Overview 294.2 Banking 334.3 Borrowing and credits/loans 344.4 Savings and investments 364.5 Insurance and risk management 37
5 Key challenges 395.1 Starting the business 395.2 Operation and management 415.3 Growing the business 425.4 Business support 43
6 Conclusions and recommendations 446.1 General recommendations 446.2 Financial inclusion specific recommendations 46
Appendix A: Survey methodology and approach 49
Appendix B: Analytical framework for financial inclusion 55
1
Acknowledgements
This report was written jointly by Research Continental-Fonkom (RCF) and FinMark Trust (FMT).
FinScope MSME Zimbabwe was designed to involve a range of stakeholders engaging in a comprehensive
consultation process, thereby enriching the survey and ensuring appropriateness and buy-in. We would like to
thank all individuals who participated in this project in their personal and institutional capacity, without which the
project would not have been successful.
The survey was carried out under the auspices of the Ministry of Small and Medium Enterprises and Cooperative
Development and funded by the Multi Donor Trust Fund headed by the World Bank.
A Steering Committee chaired by the Ministry of Small and Medium Enterprises and Cooperative Development
was set up, which comprised representatives from FinMark Trust, ZIMSTAT, Ministry of Industry and Commerce,
Ministry of Finance, Ministry of Youth Development, Indigenisation and Empowerment, Ministry of Gender, Women
Affairs and Community Development, Ministry of Tourism, Bankers Association of Zimbabwe, Insurance Council
of Zimbabwe, Insurance and Pensions Commission, Reserve Bank of Zimbabwe, Zimbabwe Association of
Microfinance Institutions, Confederation of Zimbabwe Industries, Zimbabwe National Chamber of Commerce,
and Zimbabwe Council for Tourism. These stakeholders played an integral role in the design of the survey
questionnaire and provided valuable insight into the MSME sector.
Further, we would like to thank ZIMSTAT for their vital contributions in providing statistical oversight of the survey,
including sampling and weighting of the data. In addition, ZIMSTAT played an important role in the training of the
enumerators and the quality control process during fieldwork.
Africa Corporate Advisors (Private) Limited coordinated the entire project locally which ensured the smooth
running of all survey stages.
Last but not least we would like to acknowledge Research Continental-Fonkom which implemented the survey,
and thank their staff including their supervisors and coordinators, provincial supervisors, team leaders and
enumerators, as well as office staff who worked tirelessly on this survey.
Republic of Zimbabwe
2
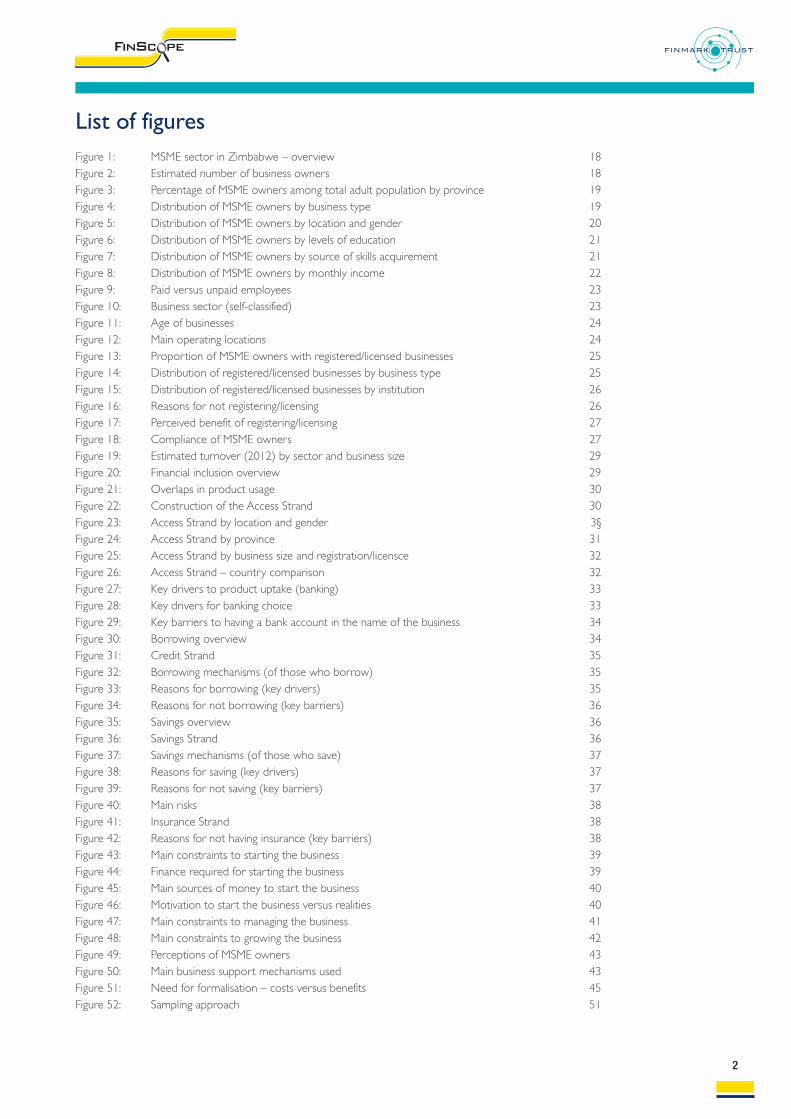
List of figuresFigure 1: MSME sector in Zimbabwe – overview 18Figure 2: Estimated number of business owners 18Figure 3: Percentage of MSME owners among total adult population by province 19Figure 4: Distribution of MSME owners by business type 19Figure 5: Distribution of MSME owners by location and gender 20Figure 6: Distribution of MSME owners by levels of education 21Figure 7: Distribution of MSME owners by source of skills acquirement 21Figure 8: Distribution of MSME owners by monthly income 22Figure 9: Paid versus unpaid employees 23Figure 10: Business sector (self-classified) 23Figure 11: Age of businesses 24Figure 12: Main operating locations 24Figure 13: Proportion of MSME owners with registered/licensed businesses 25Figure 14: Distribution of registered/licensed businesses by business type 25Figure 15: Distribution of registered/licensed businesses by institution 26Figure 16: Reasons for not registering/licensing 26Figure 17: Perceived benefit of registering/licensing 27Figure 18: Compliance of MSME owners 27Figure 19: Estimated turnover (2012) by sector and business size 29Figure 20: Financial inclusion overview 29Figure 21: Overlaps in product usage 30Figure 22: Construction of the Access Strand 30Figure 23: Access Strand by location and gender 3§Figure 24: Access Strand by province 31Figure 25: Access Strand by business size and registration/licensce 32Figure 26: Access Strand – country comparison 32Figure 27: Key drivers to product uptake (banking) 33Figure 28: Key drivers for banking choice 33Figure 29: Key barriers to having a bank account in the name of the business 34Figure 30: Borrowing overview 34Figure 31: Credit Strand 35Figure 32: Borrowing mechanisms (of those who borrow) 35Figure 33: Reasons for borrowing (key drivers) 35Figure 34: Reasons for not borrowing (key barriers) 36Figure 35: Savings overview 36Figure 36: Savings Strand 36Figure 37: Savings mechanisms (of those who save) 37Figure 38: Reasons for saving (key drivers) 37Figure 39: Reasons for not saving (key barriers) 37Figure 40: Main risks 38Figure 41: Insurance Strand 38Figure 42: Reasons for not having insurance (key barriers) 38Figure 43: Main constraints to starting the business 39Figure 44: Finance required for starting the business 39Figure 45: Main sources of money to start the business 40Figure 46: Motivation to start the business versus realities 40Figure 47: Main constraints to managing the business 41Figure 48: Main constraints to growing the business 42Figure 49: Perceptions of MSME owners 43Figure 50: Main business support mechanisms used 43Figure 51: Need for formalisation – costs versus benefits 45Figure 52: Sampling approach 51
3
List of tablesTable 1: Methodological overview 12Table 2: Key statistics (World Bank) 13Table 3: Examples of MSME support institutions in Zimbabwe 14Table 4: Architecture of the banking sector in Zimbabwe 15Table 5: Distribution of MSME owners by business type and province 20Table 6: Overview of demographics – individual entrepreneurs versus business
owners with employees 22Table 7: Estimated turnover (2012) by sector and business size 28Table 8: Size and scope of the MSME sector – country comparison of key statistics 28Table 9: Examples of classification of MSMEs 49table 10: Questionnaire structure 50Table 11: Sample allocation of EAs 52Table 12: Sample allocation rural/urban by province 52

4
Acronyms and abbreviations
AU The African Union
BOP Balance of Payments
COMESA Common Market for Eastern and Southern Africa
DiMAF Distressed Industries and Marginalised Areas Fund
EA Enumeration Area
ESAP Economic Structural Adjustment Programme
Est. Estimate
GDP Gross Domestic Product
HH Household
IDP Industrial Development Policy
IG Inclusive Government
LSE Large Scale Enterprise
MFI Micro-Finance Institution
MSME Micro, Small and Medium Enterprises
MSMECD Ministry of Small and Medium Enterprises and Cooperative Development
MTP Medium Term Plan
NSSA National Social Security Authority
PAYE Pay as you earn
RBZ Reserve Bank of Zimbabwe
SADC Southern African Development Community
SPSS Statistical Package for Social Sciences
SEDCO Small Enterprises Development Corporation
SEDCO Act Small Enterprises Development Corporation Act (2012)
SME Small and Medium Enterprise
SNV Netherlands Development Organisation
STERP Short Term Economic Recovery Programme
VAT Value-added tax
ZAMFI Zimbabwe Association of Micro-Finance Institutions
ZIDB Zimbabwe Infrastructure Development Bank
ZIMPREST Zimbabwe Programme for Economic and Social Transformation
ZIMRA Zimbabwe Revenue Authority

5
Definitions
TERM DEFINITION
Access Strand A measurement of financial inclusion across the formal-informal institutionalprovider continuum
Adults Those people aged 18 years or older
BankedIndividuals using one or more traditional financial products supplied by commercialbanks
Credit Obtaining funds from a third party with the promise of repayments of principaland, in most cases, with interest and arrangement charges in exchange for themoney
Demand-side barriers
Demand-side barriers to access financial services relate to characteristics inherentto individuals that prevent them from using financial services such as perceivedinsufficient income, low levels of financial literacy and lack of trust in financialinstitutions
Enumeration Area (EA)
Enumeration area (EA) is a well identified territorial unit containing the prescribedpopulation size (usually about 80 to 120 households) in which enumeration is tobe carried out by a single enumerator within a specified period of enumeration.Each EA has a unique 10 digit geo-code that reflects the province, district, wardand land use sector in which it is located
Formal productsProducts provided by government regulated financial institutions such ascommercial banks, insurance companies and microfinance institutions
Formal otherFinancial products/services supplied by formal financial institutions which are notbanks
Formally includedMSME owners using formal financial products supplied by institutions governed bya legal precedent of any type. This is not exclusive usage, as these individuals mayalso be using informal products
Financial accesslandscape
A measurement of usage of both formal and informal products across the fourmain product groups: transactions, savings, credit and insurance
Financially servedMSME owners using one or more formal and/or informal financialproducts/services
Financially excludedMSME owners who are not using any formal or informal financialproducts/services
Financial inclusionThe extent to which the adult population in the country engages with financialproducts and services, such as savings, transaction banking, credit and insurance,whether formal or informal
Informal productsFinancial services provided by individuals and/or associations which are notregulated by government such as savings clubs and private moneylenders
Informally only servedMSME owners who are not using any formal financial products but who are usingone or more financial products/services supplied from an informal source, such asa savings club or informal moneylender
Informally servedMSME owners who make use of informal financial products (regardless of whetheror not they use formal financial services and products)

Note: Some graphs add up to more than 100% due to multiple mentions, i.e. the respondent could give more
than one answer. As such, the graph includes overlaps in responses and cannot be added to 100%.
6
TERM DEFINITION
MSME
Micro, small and medium enterprises (MSMEs) are defined by the number ofemployees (according to the Small Enterprises Development CorporationAmendment of 2011) including individual entrepreneurs (0 employees), microbusinesses (1 to 5 employees), as well as small businesses (6 to 30/40 employees –depending on the sector) and medium size businesses (31/41 to 75 employee.MSMEs also include agricultural activities if 50% or more of the produced goodsare sold
InsurancePayment of a premium for risk of an event happening, where payout is made if orwhen the event occurs
Savings Safeguarding and accumulating wealth for future use
Supply-side barriersSupply-side barriers to access to financial services relate to factors inherent tofinancial service providers that prevent individuals from using their services such aslocation of access points and the cost of using their services
TransactionalFinancial services that use cash or other means (such as cheques, credit cards, debitcards or other electronic means) to send or receive payments

7

8
Executive summaryThis report provides a synthesis of the findings from the FinScope MSME Survey, which was carried out inZimbabwe in 2012. This study was initiated by the Zimbabwe Ministry of Small and Medium Enterprises andCooperative Development and FinMark Trust, with funding provided by the Multi Donor Trust Fund, led by theWorld Bank. The primary aim of the research was to describe the micro-, small-, and medium- business sector inZimbabwe as well as the key challenges MSME owners face (with particular focus on their financial service’s needs)– and as such close the information gap, which exists especially for unregistered businesses (mainly individual andmicro entrepreneurs). This information helps to identify and design appropriate support programmes for thewhole sector, determining policy direction and relevant financial products and services to address the needs of theMSME owners in Zimbabwe.
The survey involved a comprehensive listing exercise and interviewing a nationally representative sample of 3 222MSME owners (18 years and older, including those who employ 75 people or less, as well as individualentrepreneurs without any employees).
This research report provides an overview of the whole project, its topline findings and the issues arising from thestudy. In particular it contributes to the understanding of critical factors impacting small-scale entrepreneurialactivity in Zimbabwe.
Key findingsPEOPLE: An estimated 5.7 million people work in the MSME sector in Zimbabwe, including 2.8 million MSMEowners (18 years and older) and about 2.9 million employees (any age). Only 22% of employees work full-time.Although paid employees are mainly male, unpaid workers are mainly female (many of them are spouses workingin the business). The MSME owners are usually middle aged (73% are over the age of 30). Basic demographicssuch as gender and location broadly reflect the distribution of the total adult population. As such, 53% of MSMEowners are female (mainly individual entrepreneurs engaged in agricultural activities), and 66% of MSME ownersare located in rural areas. MSME owners generally have good levels of education (71% some secondary educationor more), and are usually heads of households (65%). Often, income from entrepreneurial activity is supplementedby other sources of income such as another business or salaried job. The main motivation to start the business isdriven by need, meaning the businesses are survivalist rather than opportunity based. Although business ownershave largely positive attitudes towards the business, many are worried about sustainability. MSME owners usuallywork long hours but have low levels of income.
BUSINESSES: The 2.8 million MSME owners own an estimated 3.5 million businesses (meaning, some businessowners have more than one business). They are mainly individual entrepreneurs without any employees (about71%) and micro-businesses with 1 to 5 employees (24%). The sector is driven by agricultural activities (43%),wholesale and retail (33%). Most of the businesses are located in the rural areas (66%), and operate mainly fromresidential premises (39%) and farms (22%). They are largely informal (85% are not registered or licensed) andrelatively young (40% are in the start-up and 31% are in the growth phase; in total 71% have been in operationfor 5 years or less).
FINANCIAL INCLUSION: About 57% of MSME owners are financially included. That means they use/havefinancial products/services to manage their business finances, i.e. using formal and/or informal product/services,including savings, borrowing, and/or insurance, excluding those who save at home and those who borrow fromfamily and friends. This means that 43% of MSME owners are financially excluded, i.e. they do not use any financialproducts/services, neither formal nor informal, to manage their business finances; however, they might borrow fromfamily and friends, and/or save at home. Only 18% are served by formal institutions, including products/servicesfrom commercial banks and other formal non-bank institutions. Informal financial mechanisms (e.g. savings groups)push out the boundaries of financial inclusion as every second MSME owner uses informal mechanisms to managetheir business finances. 72% of MSME owners save, mainly at home. Only 15% borrow money, mainly from familyand friends. Main drivers for savings and borrowing relate to growing/expanding the business. Main barriers, inturn, relate to monetary reasons (low/irregular income). Although MSME owners face a number of risks, most arenot insured (80%). Financial inclusion is higher among small and medium size businesses, women (mainly throughthe use of informal mechanisms, i.e. their involvement in savings groups etc.), registered/licensed businesses, and inurban areas and main urban centres (Bulawayo and Harare).

9
CHALLENGES: Main challenges reported by MSME owners relate to access to finance/sourcing money, lackof raw material and operational space/working facilities. The following challenges affect financial inclusion: affordability(income from MSME is too low/irregular, bank charges are too high, insurance is too expensive), appropriateness(many MSMEs lack required formality and documentation such as address and financial records to open a bankaccount), and accessibility/proximity in rural areas (banks are too far away). Other challenges include informality(not being registered/licensed), limited use of sophisticated marketing strategies, and the fact that many businessesare necessity driven (rather than opportunistic) which affects growth and sustainability of the businesses.

10
1 Introduction and background1.1 Background to the FinScope MSME study
It is widely acknowledged that micro, small and medium enterprises (MSMEs) are significant contributorsto job creation, development and poverty alleviation. Given the crucial role of MSMEs in the nationaleconomy, it is in the common interest to harness and optimise this potential by putting into place strategiesto mobilise and enable MSME growth and development. To do so, it is imperative that these interventionsare targeted and evidence-based. However, the lack of accurate and reliable information about the sectorand the challenges it faces, have been identified as the key constraints in achieving this objective.
It is in pursuit of this objective that the Zimbabwe Ministry of Small and Medium Enterprises andCooperative Development with support from the Multi Donor Trust Fund led by the World Bank, andFinMark Trust (FMT) initiated the FinScope MSME Survey Zimbabwe 2012.
The FinScope MSME Survey is a nationally representative survey developed by FinMark Trust focusing onMSME owners and their financial services needs. The aim of this survey is to build a comprehensive bodyof evidence. The objectives of the Zimbabwe FinScope MSME Survey include the following:
n To assess the size and scope of micro, small, and medium enterprises (MSME) in Zimbabwe;n To describe the levels and landscape of access to financial products and services (both formal and
informal);n To identify the most binding constraints to MSMEs development and growth with a focus on access
to financial markets;n To identify and describe different market segments with specific development needs in order to
stimulate segment-related innovation; andn To propose recommendations regarding financial assistance to MSMEs and financial policies.
FinScope MSME Zimbabwe was designed to engage a broad range of stakeholders in a comprehensive andintensive consultative process. This process has enriched the survey and the shared results have contributedmeaningfully to members who have a common interest in MSME development and financial inclusion, aswell as to the overall growth and development of the country. The study was funded by the Multi DonorTrust Fund led by the World Bank, and implemented by the Research Continental-Fonkom (RCF) with thesupport of ZIMSTAT and FinMark Trust. A Steering Committee chaired by the Ministry of Small andMedium Enterprises and Cooperative Development was set up which comprised of representatives fromFinMark Trust, ZIMSTAT, RCF, Africa Corporate Advisors, Ministry of Industry and Commerce, Ministry ofFinance, Ministry of Youth Development, Indigenisation and Empowerment, Ministry of Gender, WomenAffairs and Community Development, Bankers Association of Zimbabwe, Insurance Council of Zimbabwe,Insurance and Pensions Commission, Reserve Bank of Zimbabwe, Zimbabwe Association of MicrofinanceInstitutions, Confederation of Zimbabwe Industries, Zimbabwe National Chamber of Commerce, andZimbabwe Council for Tourism. These stakeholders played an integral role in the design of the surveyquestionnaire and provided valuable insight into the MSME sector.
This report summarises the findings of the FinScope MSME Survey Zimbabwe 2012. It has been writtenwith the following objectives in mind:
1. To provide background information on FinScope MSME as a tool and to describe how it can be usedto build inclusive financial markets;
2. To provide insight on the methodology used in the FinScope MSME Survey Zimbabwe 2012 so thatusers of the survey can understand the implementation arrangements and the rigorous approach tosampling that produced the data set;
3. To present high level findings of FinScope MSME Zimbabwe 2012 to enhance stakeholdersunderstanding of the current state of financial access, and to use this understanding as a baseline toinform and guide future developments; and
4. To make recommendations to stakeholders (financial sector and policymakers) as to how to improvefinancial access.
11
1 Note: The definition for small-and medium-size businesses depends on the sector and has been taken into consideration here (small: 6 to30/40 employees, medium: 31/41 to 75 employees). The term ‘employees’ here includes all people working in business – both paid and unpaid(excluding the business owners).
Findings are reported in a manner comparable to FinScope reports in other countries. However, there isa wealth of data contained in this survey that has not been covered in this report. It is thereforerecommended that stakeholders review the data available to see how it can help them to address financialand development questions that are significant to them.
This report is complemented by a brochure and a launch presentation. The main findings of this surveywere presented to the public on the 19th June 2013 at the Rainbow Towers Conference Centre in Harare,Zimbabwe.
About FinMark TrustFinMark Trust, an independent trust based in Johannesburg, South Africa, was established in March 2002and is funded primarily by UKaid from the Department for International Development (DFID) through itsSouthern Africa office. FinMark Trust is a not-for-profit independent trust whose purpose is ‘Making financialmarkets work for the poor, by promoting financial inclusion and regional financial integration’. In pursuitof its purpose, FinMark Trust supports institutional and organisational development which increases accessto financial services in Africa, by conducting research to identify the systemic constraints that preventfinancial markets from reaching out to poor consumers and MSME owners, and by advocating for changeon the basis of research findings.
About FinScope MSME SurveyThe FinScope MSME Survey is a research tool developed by FinMark Trust focusing on small businessesand their financial services needs. It was first piloted in South Africa in 2006 and since then the surveymethodology has been applied in Zambia (2008), South Africa (2010), Tanzania (2010), and Malawi (2012).The Mozambique survey results have not been launched at yet.
1.2 Methodology of the studyThe survey population refers to MSME owners in Zimbabwe. MSMEs are defined by the number of
employees (according to the Small Enterprises Development Corporation Amendment of 2011). This
includes individual entrepreneurs (without any employees), micro-businesses (with 1 to 5 employees), as
well as small- and medium- size businesses (6 to 75 employees)1. A nationally representative sample of
MSME owners was drawn from the Zimbabwe adult population, including those who:
n Are 18 years or older ;n Perceive themselves to be business owners/generating an income through business activities; andn Employing 75 people or less as well as entrepreneurs without any employees.
FinScope MSME Survey Zimbabwe 2012 is based on a nationally representative sample of 3 222 individuals.All provinces in Zimbabwe were covered. The sample frame was provided by ZIMSTAT based on the 2002Master Sample and recent population estimates. Weighting of the data was also conducted by ZIMSTAT.The Zimbabwe 2002 Master Sample was used to boost the weights to the population estimates. Thepopulation for 2011 was then compared with the population projections. These figures were validated bythe ZIMSTAT sampling unit.
Sampling strategy: A multi-stage sampling approach was used, including an initial listing phase.
Sampling units: Enumeration areas (EAs) are the primary sampling units, qualifier households (those withbusiness owners) are secondary sampling units, and individuals selected by the KISH GRID from a list ofeligible respondents (business owners) at every selected qualifier household are tertiary and ultimatesampling units.
A total of 500 Enumeration Areas (EAs) were sampled using probability proportional to household size(PPS) based on the Master sample developed by ZIMSTAT after the 2002 census. These EAs included 194

12
Logistics Details
Methodology Face-to-face, pen and paper interviews were conducted among MSME owners inZimbabwe
Definition of MSMEowners
Survey of MSME owners, defined as individuals who are:
n 18 years or older ;
n Perceiving themselves to be business owners/generating an income through somebusiness activities; and
n Employing 75 people or less, as well as individual entrepreneurs without anyemployees
Sample sizen=3222, representative on national, urban/rural, and provincial level Sample drawn by ZIMSTAT based on 2002 Master Sample
Sampling frame Listing exercise, population stratified by location (urban/rural)
Sample areaselection
500 Enumerator Areas (EAs) were selected using probability proportional to size(PPS), interviews were conducted in 194 urban and 306 rural EAs
Householdqualification
6 – 7 households were selected from each EA using systematic random sampling
Respondentselection
Final respondent to interview was selected using a Kish Grid
Questionnairelength
± 75 minutes
Fieldwork September 2012
Data management
Weighting was done by ZIMSTAT using the 2002 Master Sample and populationestimates for 2011. Data validation was done using the Finscope Consumer SurveyZimbabwe results and the 2012 population census data. A sample of 10% backchecks was selected during field work to ensure collection of good quality data. Dataanalysis was done in Statistical Package for Social Sciences (SPSS)
ImplementationThe study was funded by the Multi Donor Trust Fund led by the World Bank andimplemented by Research Continental-Fonkom with support from ZIMSTAT andFinMark Trust
Table 1: Methodological overview
The table below provides a summary of the methodology applied.
urban and 306 rural areas. All households in the selected EAs were then listed constituting over 57 000households. Within the households, all MSME owners were identified (18 years and older, employing 75people or less, as well as individual entrepreneurs). Within each selected EA, six to seven qualifierhouseholds (with MSME owners) were systematically selected from the listed MSMEs. Within the selectedhouseholds, where there was more than one business owner, a Kish Grid was used to randomly select thequalifying household member with whom to complete the interview (this individual was the ultimatesampling unit). A total of 3 222 interviews with MSME owners were conducted by Research Continental-Fonkom during September 2012. More detailed information about the survey methodology is providedin Appendix A.
13
2 Country context: MSMEs and the financial sector inZimbabweThis section is based on a literature review conducted by Africa Corporate Advisors (Private) Limitedcontextualising the financial sector in Zimbabwe. An understanding of the structure of the financial servicessystem in Zimbabwe is critical to the understanding of the state of financial inclusion in Zimbabwe. Thefollowing section contains an overview of a range of financial services and mechanisms available to MSMEsin Zimbabwe, including both formal and informal mechanisms. In addition, the World Bank Doing Business
Report2 and Enterprise Survey 2011 Zimbabwe3 provides useful information regarding the formal privatesector in Zimbabwe, including SMEs (excluding businesses that are not registered/licensed, agriculturalactivities, and individual entrepreneurs). While the Doing Business Report measures the regulations applyingto SMEs through their life cycle, the Enterprise Survey assesses the constraints to private sector growththrough interviews with manufacturing and services firms with 5 or more employees operating in theformal non-agricultural private sector. The Enterprise Surveys cover a broad range of business environmenttopics including access to finance, corruption, infrastructure, crime, competition, and performance measures.As such, the Doing Business report and the Enterprise Surveys data create statistically significant businessenvironment indicators that are comparable across countries. Findings are available on the World Bankwebsite.
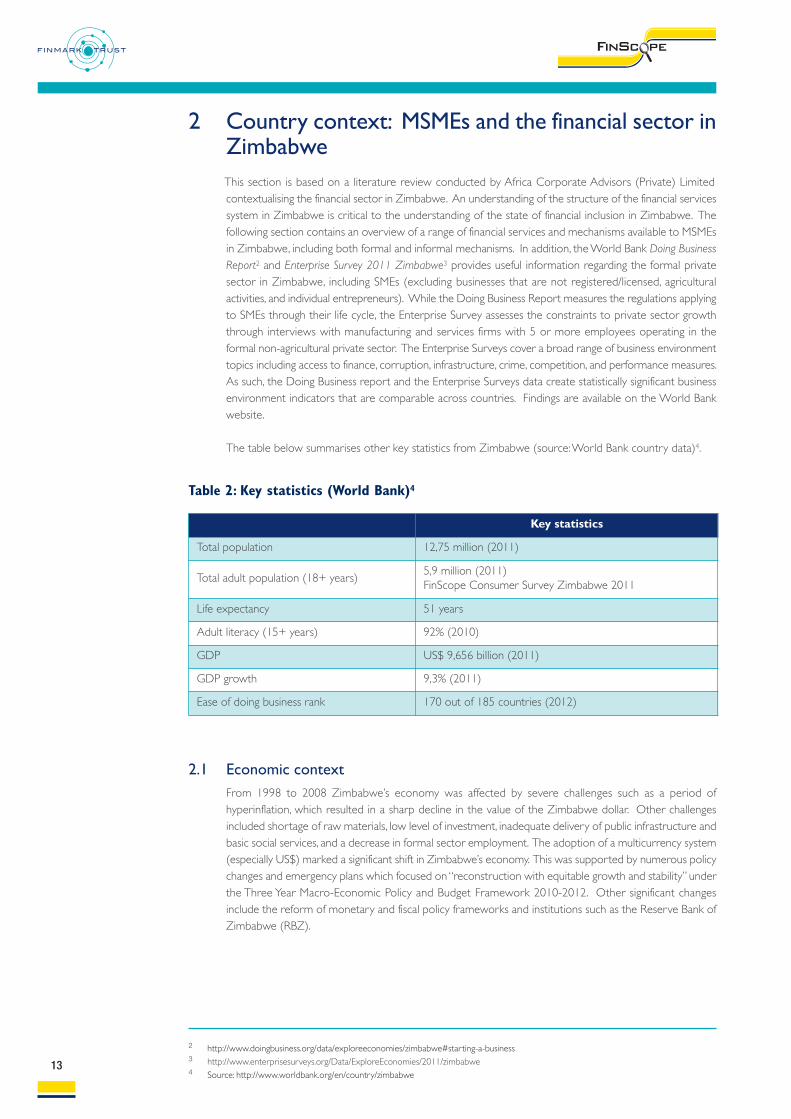
The table below summarises other key statistics from Zimbabwe (source: World Bank country data)4.
2 http://www.doingbusiness.org/data/exploreeconomies/zimbabwe#starting-a-business 3 http://www.enterprisesurveys.org/Data/ExploreEconomies/2011/zimbabwe 4 Source: http://www.worldbank.org/en/country/zimbabwe
Key statistics
Total population 12,75 million (2011)
Total adult population (18+ years)5,9 million (2011)FinScope Consumer Survey Zimbabwe 2011
Life expectancy 51 years
Adult literacy (15+ years) 92% (2010)
GDP US$ 9,656 billion (2011)
GDP growth 9,3% (2011)
Ease of doing business rank 170 out of 185 countries (2012)
Table 2: Key statistics (World Bank)4
2.1 Economic contextFrom 1998 to 2008 Zimbabwe’s economy was affected by severe challenges such as a period ofhyperinflation, which resulted in a sharp decline in the value of the Zimbabwe dollar. Other challengesincluded shortage of raw materials, low level of investment, inadequate delivery of public infrastructure andbasic social services, and a decrease in formal sector employment. The adoption of a multicurrency system(especially US$) marked a significant shift in Zimbabwe’s economy. This was supported by numerous policychanges and emergency plans which focused on “reconstruction with equitable growth and stability” underthe Three Year Macro-Economic Policy and Budget Framework 2010-2012. Other significant changesinclude the reform of monetary and fiscal policy frameworks and institutions such as the Reserve Bank ofZimbabwe (RBZ).

14
2.2 MSME support institutions in ZimbabweIt is clear that MSMEs have become an important and indispensable component of the Zimbabweaneconomy through their contribution to employment creation, poverty alleviation and sustainabledevelopment. A variety of challenges, however, continue to hamper a majority of MSMEs from realisingtheir potential and significantly contributing to national development. Among these challenges are limitedaccess to affordable finance, the lack of adequate skills and market information, and poor managementskills, which have emerged as the greatest impediments. A number of institutions are active in trying tobridge these identified gaps in the MSME sector. The table below shows some of these MSME supportinstitutions.
Name Service providedNature ofinstitution
Ministry of Small and MediumEnterprises and CooperativeDevelopment (MSMECD)
Policy formulation Facilitating linkages betweenSMEs and LSEs Skills and management training
Public
Small Enterprise DevelopmentCorporation (SEDCO)
Skills and management trainingCreditMarket information
Public
Confederation of ZimbabweIndustry (CZI)
Financial support Market information Advocacy
Association
ZimTrade Trade promotion and developmentTraining
Public
Indigenous Business Women’sOrganisation
Financial support Information
NGO
Zimbabwe National Chamber ofCommerce (ZNCC)
Market informationTraining
Association
Zimbabwe Youth Council (ZYC)Skills and management training Information
NGO
EMPRETEC Training Private
Zimbabwe Economic Policy andResearch Analysis Unit (ZEPARU)
Research NGO
National Chamber of SME Representing SMEs Public
SME Association of ZimbabweMarket access informationTraining Representing SMEs
Association
Netherlands DevelopmentOrganisation (SNV)
Research NGO
Zimbabwe Association of Micro-Finance Institutions
AdvocacyResearch
Association
Table 3: Examples of MSME support institutions in Zimbabwe
Source: Interviews conducted by African Corporate Advisors with RBZ, commercial banks, ZAMFI, MSMECD, and SME Association of Zimbabwe.

15
2.3 Banking industry and financial servicesAccess to low cost financing is widely regarded as a critical ingredient for the growth of all MSMEs. Globally,the commercial banking sector is regarded as the main tool of extending viable and sustainable credit tothe MSME sector. Though the banking sector has been slow to embrace the MSME sector as evidence fromFinScope Consumer Survey 2011 would suggest, a significant number of banks are arguably increasing theirexposure to MSMEs.
As of 2012 Zimbabwe had 26 operational banking institutions, 16 asset management companies and 157micro-finance institutions. The table below summarises the architecture of Zimbabwe banking sector.
The institutions listed above are available in Zimbabwe to provide financial services to MSMEs in Zimbabwewith the exception of a few that once existed but have since closed down. The purpose of these differenttypes of the institutions is discussed below.
Registered banking institutionsCommercial banks: Commercial banks in Zimbabwe carry out business through a network of branches,agencies and mobile facilities. Authorised and regulated along with merchant banks, finance houses anddiscount houses under the Banking Act Chapter 24:01, commercial banks offer a wide range of services,including current and savings deposit accounts, loans and overdraft facilities, foreign exchange trading andfacilities, financial advice and the provision of facilities for the purchase and sale of investments, as well asfunds transfer and payment services. After having to start from a near zero-base (following thehyperinflationary period and the introduction of the multi-currency system), the banking sector haswitnessed significant growth in deposits and loans (and presumably client base) since dollarisation (and theadoption of a multicurrency system). Possibly as a reflection of the growing confidence in the bankingsector and improvements in the economic sector, 2012 witnessed an annual bank deposits growth rate of19.4%6. Liquidity remains a challenge in the banking sector with 60% of bank deposits being demanddeposits forcing the majority of banks to increasingly turn to foreign sources of capital. According to theMinistry of Finance (2012, page 57)7 from January-October 2012 banks distributed 19% of their loans toagriculture, 18% to individuals while manufacturing and mining sector got 17% and 9% of the loansrespectively.
Merchant banks: : Merchant banks offer wholesale banking services to complement those offered bycommercial banks. They are specialists in money and capital markets as well as fee-based services such ascorporate finance, underwriting of securities and portfolio management. They also provide trade financingthrough acceptance credit, offshore financing facilities and foreign exchange facilities. Merchant banks onlyhold reserve accounts with the Reserve Bank of Zimbabwe but are not part of the clearinghouse. Dueto increased integration of banking services and as financial markets become more sophisticated andplayers seek to provide all services under one roof, merchant banks in Zimbabwe have tended to ‘graduate’into commercial banks but retaining their wholesale banking business through corporate banking divisions.
Type of institution Number
Commercial banks5 17
Merchant banks 4
Building societies 4
Savings bank 1
Finance houses 0
Discount houses 0
Total banking institutions 26
Asset management companies 16
Microfinance institutions 157
Table 4: Architecture of the banking sector in Zimbabwe
5 Excludes Barbican Bank which was re-licensed but is not yet operational.6 Ministry of Finance (2012). The 2013 National Budget Statement, Ministry of Finance, Harare p.547 Ministry of Finance 2012. The 2013 National Budget Statement, Ministry of Finance, Harare.
Source: Reserve Bank of Zimbabwe http://www.rbz.co.zw/publications/banksurveillance.asp

16
Building societies: Building societies are involved in savings and fixed deposits, share deposits andmortgage lending. They are authorised and regulated by the central bank through the Building SocietiesAct, Chapter 24:02. Traditionally, they lend for residential and commercial mortgages, purchase treasurybills, place funds in the money market and finance low-income housing projects. However, like in othercountries in Africa with a shortage of long-term finance, and exacerbated by the economic decline, themortgage market has shrunk dramatically.
Finance houses: Finance houses specialise in offering asset based financial instruments in the form ofhire purchase and lease hire advances to individuals and corporates. While finance houses in Zimbabweare deposit taking institutions, many of them have over the years been acquired and subsequently mergedinto and operate as divisions of commercial banks. Also because of the lower minimum capital requiredfor licensing, finance houses (along with discount houses) have become a route to establishing merchantor commercial banks. The asset-backed finance business is slowly picking up but the commercial banks arenow active players in this market as well.
Discount houses: Discount houses’ main business is to discount and hold bills with funds borrowed atcall from banks. The bills are then re-discounted with the banks at the Reserve Bank of Zimbabwe.Discount houses are not members of the clearinghouse. As banking business has been redefined over theyears and the treasury activities of the banking institutions have developed into de facto discount houses,the remaining discount houses have upgraded their licenses to become merchant banks and commercialbanks. As a result, the number of discount houses in Zimbabwe has decreased from six in 2005 to currentlynone.
Other financial service providers to MSMEsDevelopment finance institutions: Two development finance institutions have been created by theGovernment of Zimbabwe to serve the needs of micro, small and medium sized enterprises. Twoinstitutions namely the Small Enterprise Development Corporation (SEDCO) and the InfrastructureDevelopment Bank of Zimbabwe (IDBZ) deserve further attention.
n SEDCO, a state enterprise established in terms of the Small Enterprise Development Act of 1984 ismandated to spearhead the development of viable small and medium enterprises (SMEs) through theprovision of financial assistance, business management training and business infrastructure to enableSMEs to make a significant contribution to national development. The body receives funds from theReserve Bank of Zimbabwe and the SME Revolving Productive Fund. Its prominent financial productfor SMEs is the microfinance product, the ‘loan book’ that small businesses can benefit from. Theorganisation has however been facing major capital injection constraints and is therefore offering micro-loans ranging from US$500 to a maximum of US$ 5000.
n The Infrastructure Development Bank of Zimbabwe (IDBZ) was constituted in terms of theInfrastructure Development Act in 2005 to assist and promote the development of Zimbabwe. Thisis achieved through the provision of bonds and guarantees, long term loans and project finance, workingcapital, lease and trade finances. Even though the Zimbabwe Development Bank (ZDB), thepredecessor of the IDBZ, initially focused on the construction and transport industry, IDBZ now alsoclaims to support lower income market segments.
Money lenders: All moneylenders are governed by the Money Lending and Rates of Interest Act(Chapter 14:14) and are licensed and regulated by the Reserve Bank. They offer small personal loans athigh interest rates, usually higher rates than the market rate charged on credit cards or on bank overdrafts.Moneylenders are an important source of credit to a category of borrowers who would normally berefused credit by most financial institutions because their income may be at or below the poverty thresholdor whose credit score indicates that the borrower might be unable to repay the loan. Examples of theseare NISSI, Zambuko Trust, SHD Savings and Credit Company and SHDF, Organisation for Rural Associationsfor Progress (ORAP), Women Development Credit Scheme (Harare), and Pundutso.

Microfinance institutions: Microfinance institutions (MFIs) are organisations that provide microfinance
services to low-income clients or solidarity lending groups including consumers and the self-employed,
who traditionally lack access to banking and related services. MFIs range from small non-profit organisations
to departments of large commercial banks. The microfinance sector in Zimbabwe has generally been
affected by the unfavourable macroeconomic environment. The licensing process for microfinance
institutions has been revamped in order to reduce the turnaround time for licensing to a period less than
one week provided all the required documentation is available. With regard to bank charges and deposit
rates, the RBZ continues to promote market determined charges and interest rates for bank products
and services, albeit cognisant of the need to balance viability of the banking sector and accessibility to
affordable banking services by the public and corporates.
Insurance providers: Zimbabwe’s economic crisis also affected the insurance industry as clients’ policies
were rendered virtually worthless by the hyper-inflationary environment. Since the adoption of the
multicurrency regime, however, the sector has been on a steady recovery path. It has been observed,
justifiably by ZAMFI and SNV (2009:32)8 that the insurance industry is dominated by a small number of
big organisations notably First Mutual, ZIMNAT, Old Mutual and NICOZ Diamond. Notwithstanding this,
micro-insurance has emerged as a new subsector of the insurance industry. Some of the service providers
in this subsector and their products are as follows: Evolution Group (providers of Mbijana Mbichana funeral
assurance), Cell Insurance (Honeygold Agrisure – small holder agriculture insurance), CBZ Life Assurance
(CBZ Funeral cash plan), ZB Life Assurance – (funeral cash plan), Credsure (micro-insurance for motor
vehicles), New Eagle Insurance (Hospital cash plan), Altfin Insurance (Medlife – medical insurance), Nyaradzo
Funeral Assurance (Scorepack funeral assurance), Moonlight Funeral Assurance, and Zimre Holdings. These
service providers have been able to reach out to low income groups and the rural population who
constitute a significant proportion of the MSME owners. This has enabled MSME owners to manage risks
around events that may occur such as loss of crops or animals, business failure, theft and damages as well
as risks that will occur as a result of death and illness.
Money Transfer Agencies (MTAs): MTAs offer various ways through which MSMEs can pay their
suppliers, workers, as well as receive payments from their customers (both local and international). In the
case of transferring money internationally, available platforms such as the Western Union have enabled
MSMEs and a greater proportion of the unbanked population to receive and send money across and
within the country’s borders. Locally, banks such as CABS, Barclays and Tetrad have also availed platforms
for transferring money which is linked to their banks that MSMEs are yet to fully exploit. These bank linked
money transfer channels include CABS’ Texta Cash, Barclays’ Cash Send and Tetrad’s E-Mali amongst others.
The rapid improvements in accessibility to communication technology have also enabled cellphone network
service providers to tap into the largely unbanked MSME sector and rural population through the provision
of mobile money transfer services. Apart from Econet’s EcoCash (which has an estimated 2,3 million
registered users since its launch in September 2011 and transferring around US$200 million every month),
network service providers such as Telecel and NetOne have also launched mobile money transfer platforms
largely targeting MSMEs and the unbanked.
Savings and Credit Co-operatives Societies (SACCOS): These are member-owned organisations
that mobilise savings from and lend to their members. Registered and governed by the Cooperative
Societies Act (Chapter 24:05), SACCOS are regulated by the Ministry of Youth Development,
Indigenisation and Employment (MYDIE). SACCOS are generally well established institutions that are
relatively stable, i.e. 70% of the SACCOS are aged between 7 to 10 years, and 30% are more than 10 years
in business. They have a significant outreach in the country, covering urban, peri-urban and rural areas. In
fact, they have experienced recent growth especially in the rural areas (agro- and enterprise based). The
interest rates are usually low compared to other financial services providers, and they lend both for business
and consumption.
178 ZAMFI and SNV (2009). Microfinance Recovery Study. Available online at URL:
http://www.snvworld.org/sites/www.snvworld.org/files/publications/microfinance_sector_recover_study_-_zimbabwe.pdf

3 Overview of size and scope of the MSME sector in ZimbabweThe size of the MSME sector in Zimbabwe is portrayed by a number of indicators, such as the number of MSME owners, thenumber of businesses they own, the number of people they employ in their main businesses, and the total estimated turnover,etc. The following figure gives a broad overview of the sector:
There are 2.8 million MSME owners in Zimbabwe (18 years and older), owning 3.5 million businesses, employinga total of 2.9 million people (all ages, excluding the business owners themselves). As such, the sector contributessignificantly to employment with a total of 5.7 million people working in the sector. Considering an estimatedadult population of about 5.9 million, almost all adults in Zimbabwe engage in small business activities (either asindividual entrepreneurs, MSME owners, or employees). Furthermore, it contributes to poverty alleviation assurvivalist businesses play a vital role, especially as a buffer against slipping into deeper poverty and as such reducingindividual and household vulnerability. The estimated turnover of the MSME sector in 2012 is estimated to be atleast US$ 7.4 billion9.
3.1 MSME ownersAs illustrated in Figure 2, Harare has the highest number of MSME owners (= about 411 466). However,only 38% of the adult population in Harare engage in business activities, compared to 56% in MashonalandEast as illustrated in the Figure 3.
189 Note: This only includes the 65% of MSME owners who reported their turnover10 Using population figures per province from the FinScope Consumer Survey Zimbabwe 2011
2,8 millionMSME owners
Owning3,5 million
MSMEs
Employing2,9 million
people(excluding MSME owners)
Estimatedturnover (2012)US$ 7,4 billion(65% of MSME ownersreported on turnover)
Figure 1: MSME sector in Zimbabwe – overview
Figure 2: Estimated number of business owners
Harare Manicaland Masvingo Midlands MashonalandWest
MashonalandEast
MashonalandCentral
MatabelelandNorth
Bulawayo MatabelelandSouth
411 466 383 714 348 981 245 841299 119 279 033 264 590
141 931 139 067 135 148
Source: FinScope MSME Survey Zimbabwe 2012
Note: The following chapters, figures and tables are based on findings of the FinScope MSME Survey Zimbabwe 2012.

The majority of MSME owners (71%) are individual entrepreneurs, meaning they do not have any
employees in their business (= about 2 million) while 29% of MSME owners employ people in their
business (= about 800 000). Using the MSME definition by number of employees as explained above,
24% of MSME owners run micro-businesses (employing 1 to 5 people), while 4% can be classified as
small-businesses (employing 6 to 30/40 people, depending on the sector), and only 1% are medium- size
businesses (employing up to 75 people).
19
Total
Mashonaland East
Mashonaland Central
Masvingo
Manicaland
Matabeleland South
Midlands
Matabeleland North
Mashonaland West
Bulawayo
Harare
46
%
56
51
50
48
46
46
44
43
42
38
Figure 3: Percentage of MSME owners among total adult population by province
Figure 4: Distribution of MSME owners by business type
Percentage of MSME owners Micro businesses
23.8%
71.6% 71%
n 0.7% Medium (30/40 – 75 employees) n 03.9% Small (6 – 30/40 employees) n 23.8% Micro (1 – 5 employees) n 71.6% Individual entrepreneurs (no employees)
1 employee
2 employees
3 employees
4 employees
5 employees
10
%
6
4
2
2
0.7%
3.9%
As summarised in table 5, Manicaland has the highest proportion of individual entrepreneurs. 84.8% of
businesses in Manicaland do not have any employees compared to 71.6% in total.
Masvingo has the highest proportion of micro businesses. 37.8% of businesses in Masvingo can be
classified as micro-businesses compared to 23.8% in total.
Mashonaland West has the highest proportion of small businesses. 6.2% of businesses in Mashonaland
West can be classified as small businesses, compared to 3.9% in total.
Bulawayo has the highest proportion of medium-size businesses. 3.8% of businesses in Bulawayo can be
classified as medium-size businesses compared to 0.7% in total.

The distribution of MSME owners broadly reflects the distribution of the total adult population in
Zimbabwe. 53% of MSME owners are female (compared to 47% who are male) and the majority reside
in rural areas (66% of MSME owners reside in rural areas compared to 34% in urban areas).
20
Figure 5: Distribution of MSME owners by location and gender
Urban/rural
34%
66%
n 34% Urbann 66% Rural
n 47% Malen 53% Female
Gender
53%
47%
Table 5: Distribution of MSME owners by business type and province
ProvinceEstimated number/percentage of MSMEowners
MSME definition by size
TotalNoemployees
Micro Small Medium
BulawayoEstimated number 103 106 26 127 4 508 5 326 139 067
% within province 74.1% 18.8% 3.2% 3.8% 100.0%
ManicalandEstimated number 325 256 49 095 9 363 0 383 714
% within province 84.8% 12.8% 2.4% 0.0% 100.0%
MashonalandCentral
Estimated number 203 183 53 799 6 655 953 264 590
% within province 76.8% 20.3% 2.5% 0.4% 100.0%
Mashonaland EastEstimated number 185 928 79 742 10 849 2 514 279 033
% within province 66.6% 28.6% 3.9% 0.9% 100.0%
MashonalandWest
Estimated number 216 232 63 976 18 534 377 299 119
% within province 72.3% 21.4% 6.2% 0.1% 100.0%
MatebelelandNorth
Estimated number 108 499 31 100 2 332 0 141 931
% within province 76.4% 21.9% 1.6% 0.0% 100.0%
MatebelelandSouth
Estimated number 98 974 31 968 4 206 0 135 148
% within province 73.2% 23.7% 3.1% 0.0% 100.0%
MidlandsEstimated number 231 019 88 809 20 672 5 341 345 841
% within province 66.8% 25.7% 6.0% 1.5% 100.0%
MasvingoEstimated number 199 132 131 164 15 116 3 569 348 981
% within province 57.1% 37.6% 4.3% 1.0% 100.0%
HarareEstimated number 295 773 98 444 16 051 1 198 411 466
% within province 71.9% 23.9% 3.9% 0.3% 100.0%
Grand TotalEstimated number 1 967 102 654 224 108 286 19 278 2 748 890
% within province 71.6% 23.8% 3.9% 0.7% 100.0%

21
No schooling
Some primary education
Grade 7 complete
Some secondary incomplete
Secondary complete
A level
College
University degree
4
11
14
22
39
2
7
1
%
Figure 6: Distribution of MSME owners by levels of education
Family
Training programmes/courses
Previous job
Whilst managing the business
Mentor/advisor
School
University/college
Spouse/partner
Friends neighbours
Business skills acquisition
38
15
11
9
9
8
4
2
3
1
%
Figure 7: Distribution of MSME owners by source of skills acquirement
Consistent with the high literacy levels in the country, the majority of MSME owners have fairly good
levels of education (71% have some secondary education and better), but acquired their business skills
mainly informally (73%) through internal networks (family, friends, other business owners) or whilst
managing the business, which indicates that a great need for specific business training exists (over and
above their school education).
The survey shows that 73% of MSME owners are over 30 years of age, which might indicate that they
are more experienced and economically settled. At the same time, these business owners are often
heads of households (66%). Thus, many started their business to provide for their families, wanting to
generate more income, escape unemployment and poverty. This needs-driven motivation (63%),
however, does not fulfil its promise as many MSME owners in fact have low levels of monthly income
(40% earn less than US$ 200 a month, 11% do not have a monthly income) even though many work
full-time, i.e. 8 hours or more (50%), six to seven days a week (69%). Nevertheless, survivalist businesses
play a vital role acting as a buffer against slipping into deeper poverty and as such reducing individual and
household vulnerability. For 49%, these businesses are their only source of income.
22
Less than USD$100
USD$100 – USD$199
USD$200 – USD$299
USD$300 – USD$699
USD$700+
No income
Refused/Don’t know
23
17
12
17
7
11
13
%
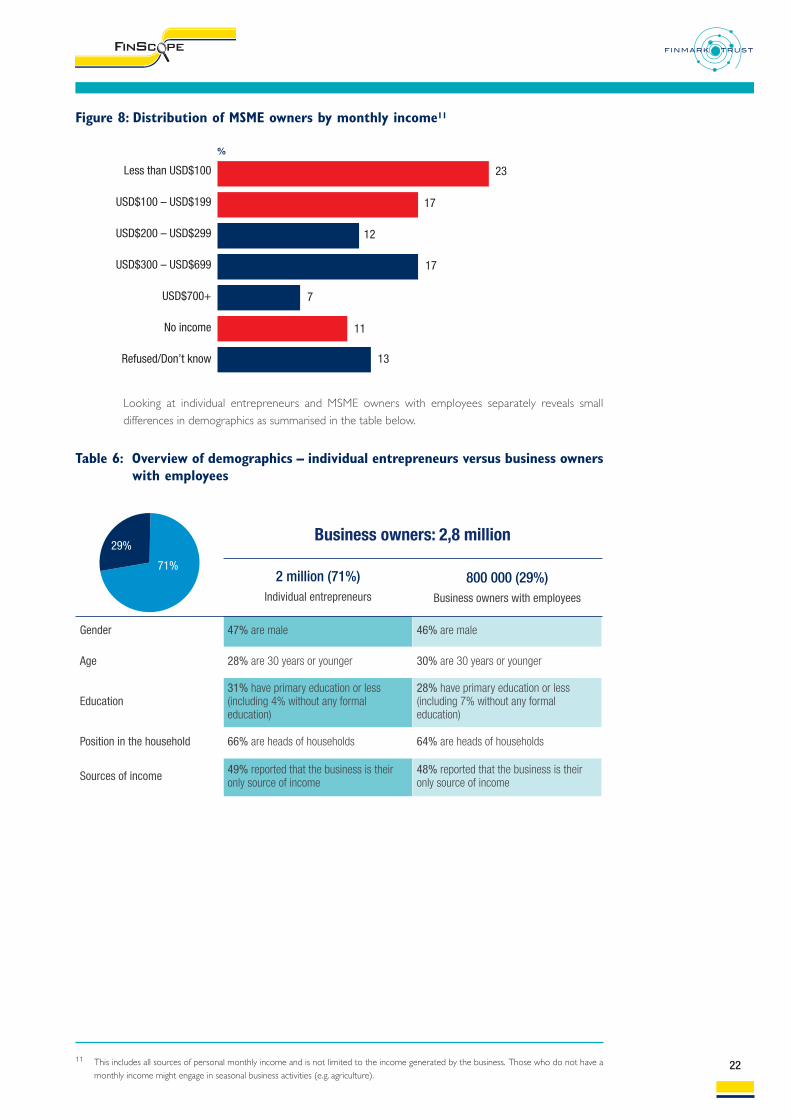
Figure 8: Distribution of MSME owners by monthly income11
Looking at individual entrepreneurs and MSME owners with employees separately reveals small
differences in demographics as summarised in the table below.
11 This includes all sources of personal monthly income and is not limited to the income generated by the business. Those who do not have amonthly income might engage in seasonal business activities (e.g. agriculture).
Table 6: Overview of demographics – individual entrepreneurs versus business ownerswith employees
Business owners: 2,8 million
2 million (71%)Individual entrepreneurs
800 000 (29%)Business owners with employees
Gender 47% are male 46% are male
Age 28% are 30 years or younger 30% are 30 years or younger
Education31% have primary education or less(including 4% without any formaleducation)
28% have primary education or less(including 7% without any formaleducation)
Position in the household 66% are heads of households 64% are heads of households
Sources of income 49% reported that the business is theironly source of income
48% reported that the business is theironly source of income
29%
71%

3.2 Employees12
The majority of MSME owners do not have any employees (71%). The remaining 29% of MSME owners(about 800 000) employ a total of 2.9 million people. The majority of their employees are male (59%).About 24% of MSME owners employ 1 to 5 employees (= micro-businesses). The remaining 4% employmore than 5 people (=small-and medium-businesses). It is interesting to note that 22% of employees inthe MSME sector are unpaid. The majority of those unpaid workers are female, many of which are probablythe spouses of MSME owners. About 1 in 4 (26%) people are temporary staff, seasonal, or on contract.The survey also found that only 22% of employees in the sector are full-time paid employees. The majorityof those employees are male. The figure below summarises the information on employees.
23
Figure 9: Paid versus unpaid employees
Unpaid
Paid in kind
Paid in kind and money
Temporary/seasonal/contract paid
Part-time paid
Full-time paid
Other
%
9
3
26
14
4
22Mainlyfemale
Mainlymale 22
3.3 Nature of businessesBusiness sector: The MSME sector in Zimbabwe is largely driven by agriculture, wholesale and retail.About 43% of MSME owners work in agriculture13, while 33% of MSME owners reported to work inwholesale and retail. Another 9% of MSME owners work in the manufacturing sector.
12 Note: This includes all people working in the business (paid and un-paid workers).13 Note: Business sector classification is self-reported. Agricultural activity was taken into consideration here if 50% or more of the produced
goods are sold.
Figure 10: Business sector (self-classified)
Agriculture
Wholesale and retail
Manufacturing
Other services
Energy and construction
Art, entertainment, culture, education and sport
Accommodation and food activities
Transport
Mining and quarrying
43
33
9
7
3
2
2
1
1
% n Driven by growing
produce and gardening
n Driven by vending andselling clothes
n Driven by cutting anddesign, carpentry, andcrafting

Age of the business: MSMEs in Zimbabwe are relatively young. As shown in the figure below, the majorityof MSME owners (71%) reported that their business is 5 years or younger, including 40% that are in thestart-up phase (0 to 2 years in operation), as well as 31% that are in the growth phase (3 to 5 years inoperation). About 21% of MSMEs have been in operation for 6 to 10 years and a further 8% have beenin operation for more than 10 years.
24
Figure 11: Age of businesses
Start-up0 to 2 years
Growth phase3 to 5 years
Established6 to 10 years
MatureMore than 10 years
4031
21
8
Business location: Many MSME owners operate their business from residential premises (39%), indicatingthat there might be a lack of available and/or affordable operational space/working facilities. It might alsobe out of choice considering the nature of the business (e.g. small, informal). A further 22% operate fromfarms (small holdings/plots), which relates to the high percentage of MSME owners that engage inagricultural activities. While 11% go directly to their customers (operate door-to-door), 9% operate asstreet vendors, and 6% work in a traditional market setting.
39%operate from residential premises (home, homestead, garage)
22%operate from a farm (small holding/plot)
11%operate door to door/go directly to customers
9%operate from the street/pavement
6%Operate from a traditional market
Figure 12: Main operating locations

25
Figure 13: Proportion of MSME owners with registered/licensed businesses
Total
Rural
Urban
Individual entrepreneurs
Micro businesses
Small businesses
Medium size businesses
%
15 85
14 86
18 82
10 90
25 75
37 63
36 64
n Registered/licensed n Not registered/licensed
Registration/licensing: In total, only 15% of MSME owners reported that their business isregistered/licensed, mainly with the local council/authority. This number is driven by the high percentageof individual entrepreneurs – the large majority of which are not registered (90%). A quarter of microbusinesses are registered/licensed, while more than every third small and medium size business is registered/licensed as illustrated in the figure below. The proportion of MSME owners with registered/licensedbusinesses is slightly higher in urban areas, probably due to better accessibility of registration/licensingfacilities, possibly better enforcement, as well as the higher proportion of small and medium size businessesin those areas.
As mentioned above, in total 15% of MSMEs are registered/licensed, which is an estimated 412 000licensed/registered businesses in Zimbabwe. Of those 412 000 businesses, almost 50% are individualentrepreneurs as illustrated below (=about 204 300). While 39% of registered/licensed businesses can beclassified as micro-businesses (=about 160 400), 10% are small-businesses (= 40 300) and only 2% aremedium-size businesses (= about 7000).
Figure 14: Distribution of registered/licensed businesses by business type
Total number of register/licensedbusineses: about 412 000
49%
39%
10%2%
n 49% Individual entrepreneurs = 204 300n 39% Micro = 160 400n 10% Small = 40 300n 2% Medium = 7 000

26
The majority of those businesses are licensed with the local council/authority. Only 17% are in factregistered with the Registrar of Companies, while 6% are registered with the Registrar of Cooperatives,and about 7% are registered/licensed with other institutions.
Figure 15: Distribution of registered/licensed businesses by institution
Local council/authority
Registrar of Companies
Registrar of Cooperatives
Other
71
%
17
6
7
According to the ‘Doing Business in Zimbabwe’ study conducted by the World Bank the registration processis rather cumbersome and expensive with an average duration of 90 days and a minimum cost of US$ 68514
(excluding travel expenses and other additional costs the MSME owner might incur). Taking into accountthat about 40% of MSME owners have a personal monthly income of less than US$ 200 – this might notbe affordable.
This reflects the challenges raised by MSME owners who have not registered/licensed their business. Themain barriers to registration/license as reported by MSME themselves relate to monetary reasons (‘Businessis too small’ as reported by 53% and ‘No money to register’ 35%) and a lack of knowledge/complexity ofthe registration process (26% do not know how to register and 10% reported that it is too complicated).
14 Source: http://www.doingbusiness.org/data/exploreeconomies/zimbabwe#starting-a-business
Business too small
No money to register
Don't know how to register
Too complicated
No benefit
Unsuccessful
No time
53
35
26
10
8
3
3
%
Figure 16: Reasons for not registering/licensing

27
Avoiding harassment from authorities
Law compliance
Access to government assistance
Access to finance
Access to new clients
Raw material access
None
Don't know
25
24
11
7
5
3
5
%
Figure 17: Perceived benefit of registering/licensing
Figure 18: Compliance of MSME owners
16
Environmental management act
Health regulations
VAT
Labour relations act
Minimum wage
Income tax
NSSA
PAYE
Basic conditions of employment act
11
9
2
2
2
1
1
1
1
%
On the other hand, the perceived benefits do not seem to outweigh these challenges. Only 11% reportedthat registering/licensing their business would help to access government assistance. Access to finance(7%), new clients (5%), and raw materials (3%) can be used as proxy for ‘real’/tangible benefits, whereasavoiding harassment from authorities and law compliance might not seem as attractive, yet was reportedby almost a quarter of MSME owners as shown in the figure below.
The majority of MSME owners do not comply with many regulations. For example, only 9% comply withhealth regulations, and a mere 1% follow the basic conditions of the Employment Act. Only 2% reportedthat they are registered with ZIMRA and pay VAT – which indicates a huge opportunity for the Governmentof Zimbabwe.

28
Sector Turnover (US$)
Agriculture 1.9 billion
Retail 3.3 billion
Other sectors 811 million
Manufacturing 564 million
Services 539 million
Mining 234 million
Business size Turnover (US$)
Individual entrepreneurs 3.1 billion
Micro 3.1 billion
Small 1.2 billion
Medium 30.6 million
TOTAL 7.4 billion
Table 7: Estimated turnover (2012) by sector and business size
The estimated turnover of the MSME sector in 2012 amounts to a minimum of US$ 7.4 billion. This figureonly includes 65% of MSME owners who actually reported their turnover. Thus, it is expected that the totalannual turnover of the sector is probably higher. It also needs to be considered that only 51% of MSMEowners keep financial records.
The turnover of MSME owners who use formal financial products/services amounts to a minimum of US$3.9 billion. That means that almost half of the sector’s turnover (minimum of US$ 3.5 billion) is circulatedoutside the formal financial system.
Comparing Zimbabwe with other countries in the region shows that the proportion of MSME ownerscompared to the total adult population is much higher in Zimbabwe. On average 46% of adults (18 yearsand older) are MSME owners in Zimbabwe, compared to 17% in South Africa (16 years and older), andonly about 13% in Malawi. Levels of registration/licence in Zimbabwe can be compared with those of SouthAfrica. However, Zimbabwe has a much higher proportion of individual entrepreneurs.
South Africa (2010) Malawi (2012) Zimbabwe (2012)
Business owners16 years and older 200 employees or less
18 years and older 100 employees or less
18 years and older 75 employees or less
Estimated adult population 33,5 million 6,1 million 5,9 million
Estimated % of adult population that ownsMSMEs
17% 13% 46%
Number of MSME owners 5,6 million 760 000 2,8 million
Number of MSMEs they own 6 million 1 million 3,5 million
% of MSME owners with registered/licensedbusinesses
17% (only CIPC)
3% 15%
Number of employees 6 million 1 million 2,9 million
% of individual entrepreneurs% of businesses with employees
67%33%
59%41%
71%29%
Table 8: Size and scope of the MSME sector – country comparison of key statistics

29
Figure 21: Overlaps in product usage
Figure 20: Financial inclusion overview
Banked14% (382 000)Driven by cash
transactions andsavings
Served by other formal financial institutions 7% (186 000)
Driven by insurance
Financially excluded 43% (1,2 million)
Informally served 50% (1,4 million)
Driven by informal savings
Formally served
Banked
Other formal
Informal
Excluded
18
%
14
7
50
43
BankedOther formal
Informal
Excluded
3.8 1.4 1.1
2.3
2.0
6.7
39.4
43.3
Formally served 18% (475 000)
Total business owner (BO) population100% (2,8 million)
Financially included57% (1,6 million)
4 Financial inclusion15
4.1 OverviewIn total, 43% of MSME owners (about 1.2 million) are financially excluded, i.e. they do not use any financialproducts or services (neither formal nor informal) to manage their business finances. If they borrow, theyborrow from friends and family; if they save, they save at home. On the other hand, 57% of MSME ownersare financially included (about 1.6 million), i.e. they use financial products or services (formal and/or informal)to manage their business finances. Every second MSME owner (50%) have/use informal mechanisms tomanage their business finances, while 18% are formally served, including both banked and other formal non-bank products/services (14% of business owners are banked and 7% of business owners have/use otherformal non-bank products/services). The overlaps in product usage need to be considered here. Thus, thefigure below adds up to more than 100%. The overlaps are depicted using circles, whereas the dark bluedepict banked, yellow describes the usage of other formal non-bank products/services, and green theuptake of informal products/services such as savings groups. Product uptake for those who use bankproducts/services is driven by cash related transactions (cash withdrawals and deposits) as well as savings.While other formal non-bank products/services are driven by formal insurance, informal mechanisms arealso largely driven by savings (e.g. savings groups), particularly among female MSME owners.
15 The analytical framework used here is explained in Appendix A.
30
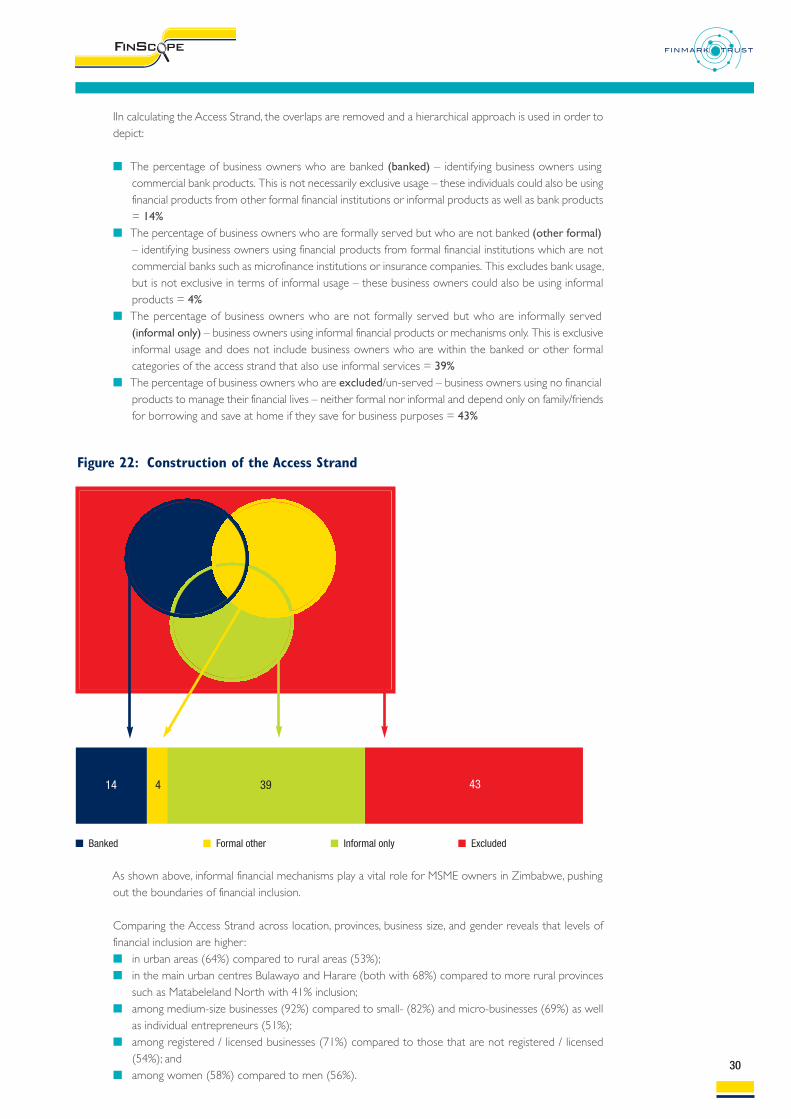
Figure 22: Construction of the Access Strand
14 434 39
n Banked n Formal other n Informal only n Excluded
IIn calculating the Access Strand, the overlaps are removed and a hierarchical approach is used in order todepict:
n The percentage of business owners who are banked (banked) – identifying business owners usingcommercial bank products. This is not necessarily exclusive usage – these individuals could also be usingfinancial products from other formal financial institutions or informal products as well as bank products= 14%
n The percentage of business owners who are formally served but who are not banked (other formal)– identifying business owners using financial products from formal financial institutions which are notcommercial banks such as microfinance institutions or insurance companies. This excludes bank usage,but is not exclusive in terms of informal usage – these business owners could also be using informalproducts = 4%
n The percentage of business owners who are not formally served but who are informally served(informal only) – business owners using informal financial products or mechanisms only. This is exclusiveinformal usage and does not include business owners who are within the banked or other formalcategories of the access strand that also use informal services = 39%
n The percentage of business owners who are excluded/un-served – business owners using no financialproducts to manage their financial lives – neither formal nor informal and depend only on family/friendsfor borrowing and save at home if they save for business purposes = 43%
As shown above, informal financial mechanisms play a vital role for MSME owners in Zimbabwe, pushingout the boundaries of financial inclusion.
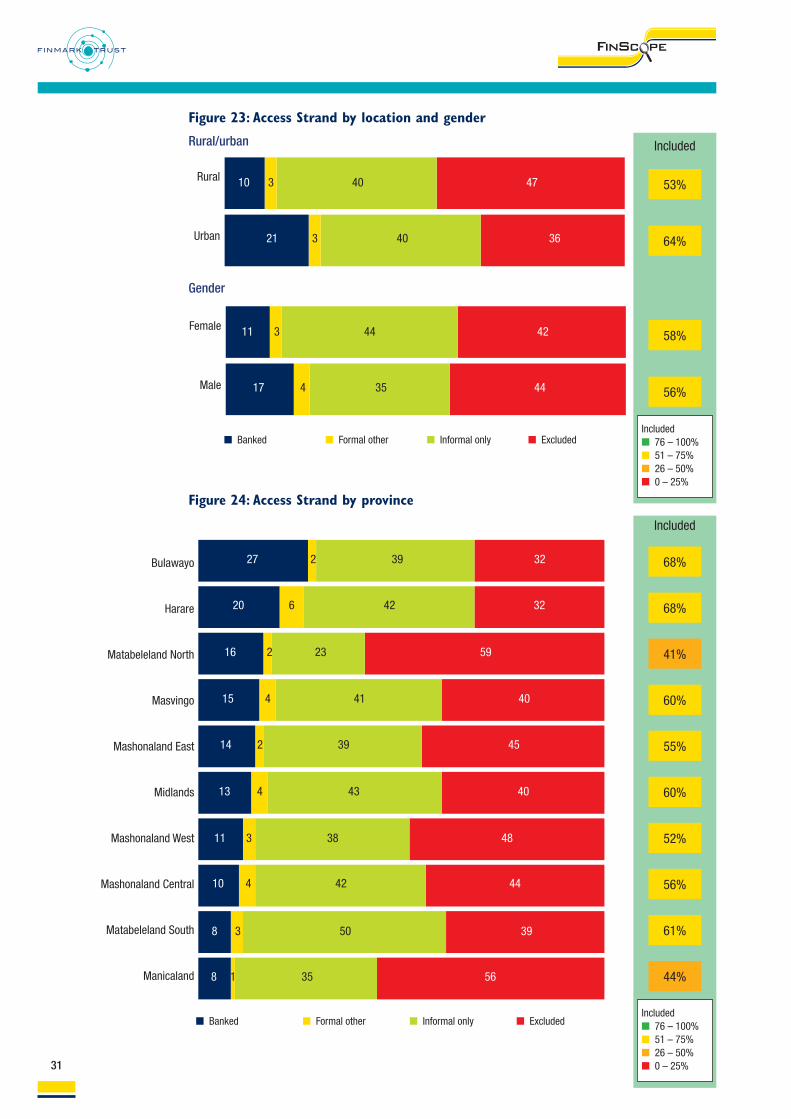
Comparing the Access Strand across location, provinces, business size, and gender reveals that levels offinancial inclusion are higher:n in urban areas (64%) compared to rural areas (53%); n in the main urban centres Bulawayo and Harare (both with 68%) compared to more rural provinces
such as Matabeleland North with 41% inclusion; n among medium-size businesses (92%) compared to small- (82%) and micro-businesses (69%) as well
as individual entrepreneurs (51%); n among registered / licensed businesses (71%) compared to those that are not registered / licensed
(54%); andn among women (58%) compared to men (56%).
31
Rural
Urban 21 36403
10 473 40
n Banked n Formal other n Informal only n Excluded
Female
Male 17 44354
11 423 44
Included
53%
58%
56%
64%
Includedn 76 – 100%n 51 – 75%n 26 – 50%n 0 – 25%
Included
68%
68%
41%
60%
55%
60%
52%
56%
61%
44%
Includedn 76 – 100%n 51 – 75%n 26 – 50%n 0 – 25%
Figure 23: Access Strand by location and gender
Rural/urban
Gender
Bulawayo
Harare
Matabeleland North
Masvingo
Mashonaland East
Midlands
Mashonaland West
Mashonaland Central
Matabeleland South
Manicaland
n Banked n Formal other n Informal only n Excluded
27 32392
20 32426
16 59232
15 40414
14 45392
13 40434
11 48383
10 44424
8 39503
8 56351
Figure 24: Access Strand by province

32
n Banked n Formal other n Informal only n Excluded
Included
92%
69%
51%
54%
71%
82%
Includedn 76 – 100%n 51 – 75%n 26 – 50%n 0 – 25%
Figure 25: Access Strand by business size and registration/license
Business size
37 183510
26 31394
8 49403
45 47 8Medium
Small
Micro
Individualentrepreneurs
Registration/license
Not registered/
licensed
Registered/licensed 30 29365
11 463 40
Country comparison: Comparing the Access Strand of MSME owners in South Africa and Zimbabweshow very similar levels of financial inclusion (57% in Zimbabwe compared to 58% in South Africa).However, in Zimbabwe informal mechanisms play an important role, with 39% of Zimbabwean MSMEowners who only use informal mechanisms to manage their business finances compared to only 7% inSouth Africa. The uptake of formal financial products/services (both banked and other formal non-bank)is higher in South Africa (51% in South Africa compared to 18% in Zimbabwe). Given the historical eventsthat affected the formal financial sector in Zimbabwe, this is not surprising.
n Banked n Formal other n Informal only n Excluded
Included
57%
58%
41%
Includedn 76 – 100%n 51 – 75%n 26 – 50%n 0 – 25%
14 43394
22 59109
47 4274
Zimbabwe (2012)
Malawi (2012)
South Africa (2010)
Figure 26: Access Strand – country comparison

33
Figure 27: Key drivers to product uptake (banking)
70Cash withdrawal
Cash deposit for the business
Balance enquiry
Request bank statement
Paying business account
Buy cellphone airtime for the business
Pay utility bills
Money transfers between account
%
63
28
20
18
14
10
9
Figure 28: Key drivers for banking choice
34Have personal bank accounts there
Convenience
Recommended by friend/family
Products/services
Interest rates/best rates on credit/loans/borrowing
Interest rates/best rates on savings
%
25
20
16
6
6
4.2 Banking The majority of MSME owners do not use any products or services from a commercial bank (86%). 14%of MSME owners use products/services offered by a commercial bank, and only 3% use an account in thename of the business. Banking is largely driven by cash transactions (withdrawals and deposits) as illustratedbelow. About 70% of MSME owners who are banked use cash withdrawals and 64% cash deposit for theirbusiness. As shown in the FinScope Consumer Survey 2011, Zimbabwe is a largely cash based economy.Enquiries of bank balances and statements are also fairly common.
Drivers: The main reasons given for opening a bank account in the name of the business at a particularbank relate to the existence of a personal account at the same bank as reported by over a third of MSMEowners together with convenience (bank is available – a quarter of MSME owners) andreferrals/recommendations (from friends and family). Only 16% chose to open a bank account in thename of the business at a particular bank because of its product offering.

34
Figure 29: Key barriers to having a bank account in the name of the business
69Business/income is too small
Not enough money from business
Irregular income
Do not need one
Have not registered my business
Banks too far from where I stay
Do not know anything about it
%
34
21
9
6
6
6
Barriers: On the other hand, the main barriers to having a bank account in the name of the businessrelate to monetary reasons, i.e. because the income is too low/irregular as shown in the figure below –which is not surprising given the low levels of monthly income. Only 6% of MSME owners reported thatthey are not banked because banks are too far away (accessibility – proximity) while 5% reported that theydo not know anything about it which indicates a lack of financial literacy / knowledge about banks and theirproducts. In addition, MSME owners require numerous documents to open their account, such asidentification document, proof of address, business registration/licence, other business documents (e.g.Articles of Association, etc.), as well as a certain income to cover bank charges, minimum balance required,etc.
4.3 Borrowing and credits/loans In total, only 15% of MSME owners borrowed money/have taken goods on credit in the past 12 monthsfor business purposes (that excludes money used to start or take over the business), or are currentlyrepaying or owing money/goods for their business. Only 2% of MSME owners borrow from a bank and2% borrow from other formal non-bank institutions. On the other hand, 4% borrow from informal groups,and 8% borrow from family and friends as illustrated in the figure below.
Figure 30: Borrowing overview
Banked
Other formal
Informal
Family/friends
Excluded
2
%
2
4
8
85
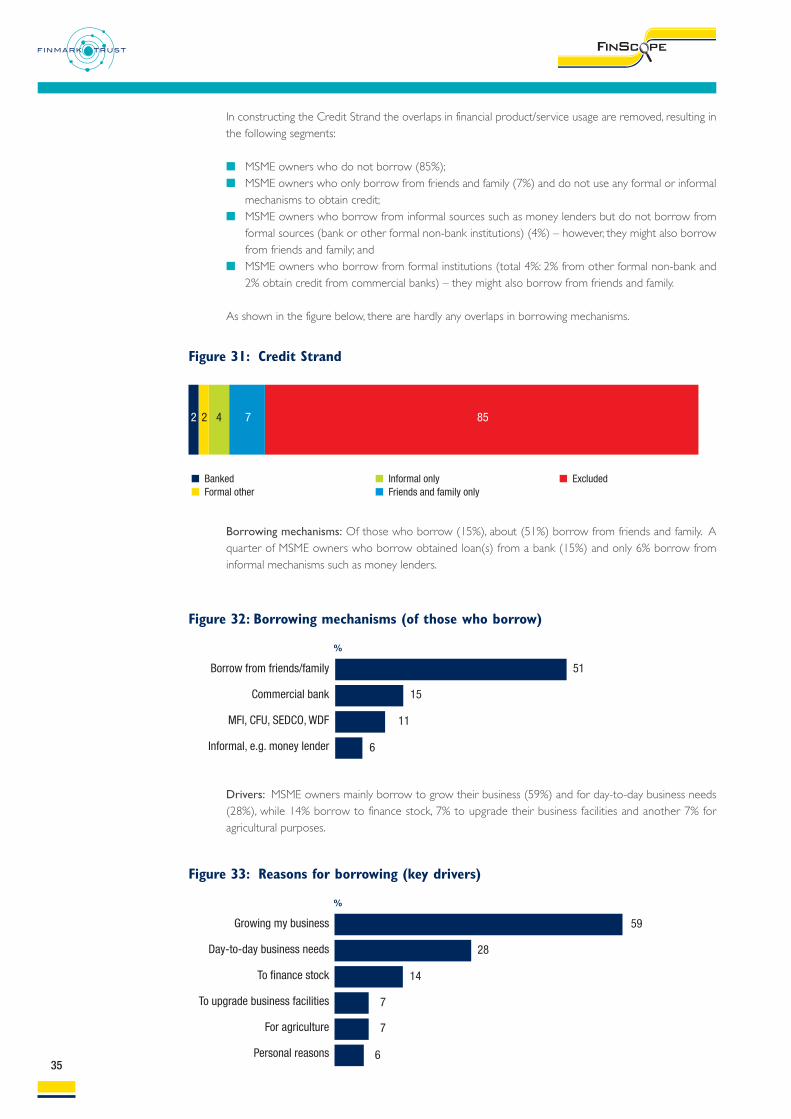
35
n Bankedn Formal other
n Informal only n Friends and family only
n Excluded
Figure 31: Credit Strand
Figure 32: Borrowing mechanisms (of those who borrow)
2 852 4 7
Borrow from friends/family
Commercial bank
MFI, CFU, SEDCO, WDF
Informal, e.g. money lender
51
15
11
6
%
Figure 33: Reasons for borrowing (key drivers)
Growing my business
Day-to-day business needs
To finance stock
To upgrade business facilities
For agriculture
Personal reasons
59
28
14
7
7
6
%
In constructing the Credit Strand the overlaps in financial product/service usage are removed, resulting inthe following segments:
n MSME owners who do not borrow (85%);n MSME owners who only borrow from friends and family (7%) and do not use any formal or informal
mechanisms to obtain credit;n MSME owners who borrow from informal sources such as money lenders but do not borrow from
formal sources (bank or other formal non-bank institutions) (4%) – however, they might also borrowfrom friends and family; and
n MSME owners who borrow from formal institutions (total 4%: 2% from other formal non-bank and2% obtain credit from commercial banks) – they might also borrow from friends and family.
As shown in the figure below, there are hardly any overlaps in borrowing mechanisms.
Borrowing mechanisms: Of those who borrow (15%), about (51%) borrow from friends and family. Aquarter of MSME owners who borrow obtained loan(s) from a bank (15%) and only 6% borrow frominformal mechanisms such as money lenders.
Drivers: MSME owners mainly borrow to grow their business (59%) and for day-to-day business needs(28%), while 14% borrow to finance stock, 7% to upgrade their business facilities and another 7% foragricultural purposes.

36
Banked
Other formal
Informal
At home
Excluded
13
%
1
42
53
28
Figure 34: Reasons for not borrowing (key barriers)
Fear of debts
Did not have the need to borrow
Worried I won’t be able to pay back
Had no one to borrow from
Do not know where to borrow money
Don’t know
31
28
27
20
13
10
%
Figure 35: Savings overview
Barriers: The majority of MSME owners do not borrow (85%), mainly because they fear that they won’tbe able to pay it back. 31% fear debts, while 27% are worried they won’t be able to pay it back. 20%reported that they do not have anyone to borrow money from, and 13% do not know where to borrowmoney. 28% do not borrow because they do not have the need. Many of those who reported that theydo not have the need to borrow cover expense with savings rather than borrowing.
4.4 Savings and investmentsThe majority of MSME owners in Zimbabwe save (72%). 13% save with a bank and 1% save with anotherformal non-bank institution. About 42% save using informal mechanisms such as savings groups/clubs, while53% save at home.
In constructing the Savings Strand the overlaps in financial product/service usage are removed, resulting inthe following segments as shown in the figure below:
n MSME owners who do not save (28%);n MSME owners who only save at home (24%) and do not use any formal or informal mechanisms;n MSME owners who save through informal sources such as savings clubs but do not save using formal
products/services – however, they might also save at home;n MSME owners who save through formal institutions (14%) – they might also be part of savings clubs,
and/or save at home.
Comparing this with the figure above shows that there are several overlaps, especially looking at the usageof informal mechanisms (e.g. savings groups) and savings at home.
n Bankedn Other formal non-bank
n Informal n Home only
n Excluded
Figure 36: Savings Strand
13 281 35 24

37
To have money when I need it
To expand the business
For the future
Money for day-to-day running of business
49
40
32
25
%
Figure 38: Reasons for saving (key drivers)
The business is not making enough to save
All money is put back in the business
Do not believe in saving
74
23
3
%
Figure 39: Reasons for not saving (key barriers)
Home
Saving in a club
Buy something and sell later with profit
Commercial bank
Someone in the community
Saving by lending to others
Other formal
65
31
23
17
%
6
4
2
Figure 37: Savings mechanisms (of those who save)
Savings mechanisms: 72% of people save – the majority (65%) save at home/secret place, with 31% savingin a club, and 23% saving through buying something and selling it later. 17% save through a commercial bank,and 6% save with someone in the community.
Drivers and barriers: MSME owners mainly save to have money when they need it (49%) and to expandthe business (40%). The results also show that 28% of MSME owners do not save, mainly because ofmonetary reasons. Of those who do not save, 74% reported that the business is not making enoughmoney to save, while 23% claimed that all the money is put back in the business and hence there is nosurplus to save.
4.5 Insurance and risk managementMSME owners face a number of risks, such as natural disasters (drought, rain/floods, and fire) as reportedby 46% of MSME owners, as well as low selling prices (22%). Given the high percentage of business ownerswho work in the agricultural sector and the high (perceived) risk for natural disasters, there might be a greatneed for affordable agricultural insurance. Other risks include not being paid (19%), lack of raw materials(16%), illness or death of the business owner (15%), theft of business stock (15%), and/or loss of income(10%).

38
Figure 40: Main risks
Natural disasters (drought, rain/floods, fire)
Low selling prices
Not being paid
Lack of raw materials
Illness/death of business owner
Theft of business stock
Loss of income
%
22
19
16
15
15
10
n Formal n Informal n Excluded
Figure 41: Insurance Strand
805 15
46
Figure 42: Reasons for not having insurance (key barriers)
Cannot afford it
Has never thought about it
Does not know how it work
Have not heard about it
Does not need it
Does not know how to get it
It is not good value for money
%
23
17
13
11
6
5
40
Despite these risks, the majority of MSME owners (80%) are not insured as illustrated in the InsuranceStrand below. 15% only use informal mechanisms, i.e. burial societies, while only 5% are formally insuredagainst defined risks. Of those who have insurance, 38% have a funeral plan and 34% are a member of aburial society.
Barriers: Key barriers to insurance uptake relate to affordability and lack of knowledge about insurance.40% reported that they are not insured because they cannot afford it, 23% have never thought about it,while 17% do not know how it works, and 13% have never even heard about it. On the other hand, 6%do not know how to get it – which indicates the need for knowledge about insurance.
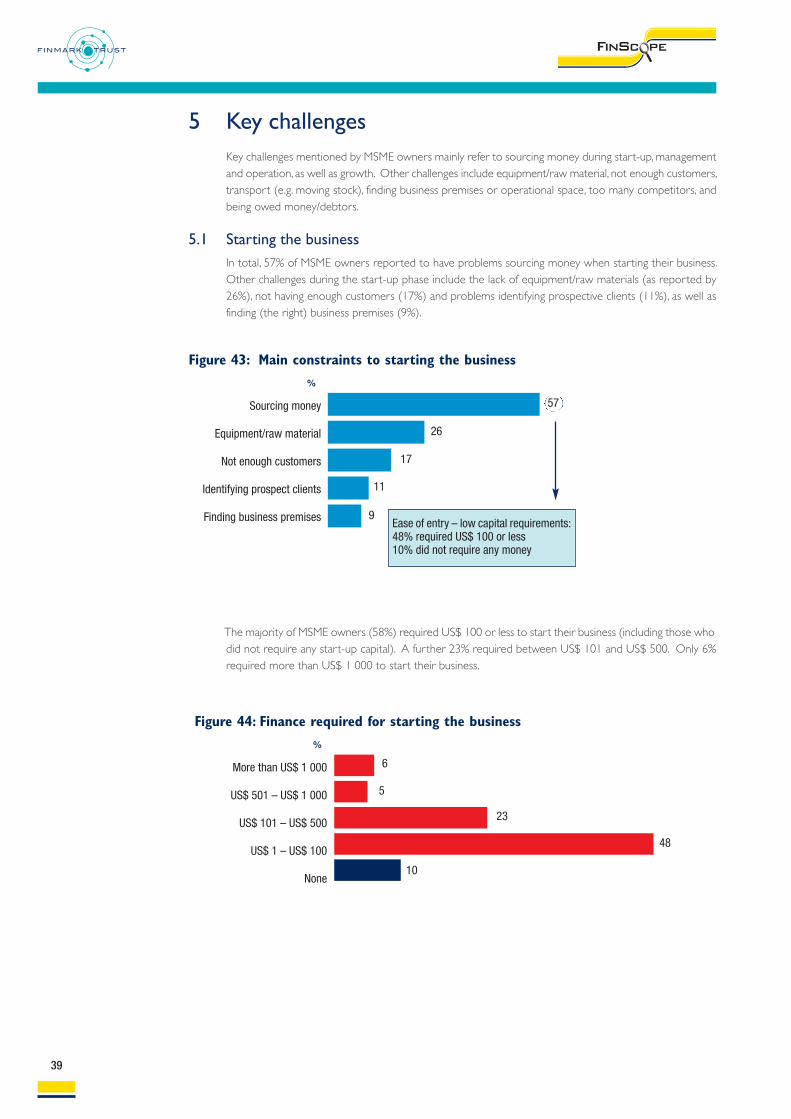
39
Figure 43: Main constraints to starting the business
Sourcing money
Equipment/raw material
Not enough customers
Identifying prospect clients
Finding business premises
57
%
26
17
11
9Ease of entry – low capital requirements:48% required US$ 100 or less10% did not require any money
Figure 44: Finance required for starting the business
More than US$ 1 000
US$ 501 – US$ 1 000
US$ 101 – US$ 500
US$ 1 – US$ 100
None
6
%
5
23
48
10
5 Key challengesKey challenges mentioned by MSME owners mainly refer to sourcing money during start-up, managementand operation, as well as growth. Other challenges include equipment/raw material, not enough customers,transport (e.g. moving stock), finding business premises or operational space, too many competitors, andbeing owed money/debtors.
5.1 Starting the businessIn total, 57% of MSME owners reported to have problems sourcing money when starting their business.Other challenges during the start-up phase include the lack of equipment/raw materials (as reported by26%), not having enough customers (17%) and problems identifying prospective clients (11%), as well asfinding (the right) business premises (9%).
The majority of MSME owners (58%) required US$ 100 or less to start their business (including those whodid not require any start-up capital). A further 23% required between US$ 101 and US$ 500. Only 6%required more than US$ 1 000 to start their business.

The motivation to start a business is mainly driven by the need to secure livelihoods, rather than seeingan opportunity. 63% of business owners reported that their main motivation to start their business wasdriven by economic need (e.g. to provide for their families, to escape poverty and unemployment, tosubstitute income), while 34% actually saw an opportunity. However, MSME owners have low levels ofincome but high levels of dependency with 40% having a personal monthly income of less than US$ 200.49% reported that their business is the only source of income. 66% are heads of households and oftenthe main income earner. This needs to be taken into consideration when looking at business growth andsustainability.
40
Those who did require start-up capital, mainly generated it themselves (59%), including own savings (19%),money from other businesses (17%), salaries/wages (16%), or sold assets (7%), while 14% were given thebusiness for free from friends/family to run. Given the high percentage of family-run businesses, that is notsurprising. A further 9% receive the money for the business start-up from their partner/spouse, and 7%borrowed money from friends or family.
Figure 45: Main sources of money to start the business
Savings
Money from another business
Salary/wages
Given free from family/friends
Spouse/partner
Loan from family and friends
Sold assets
Other
%
17
16
14
9
7
7
19
11
Necessity driven• 63% driven by
economic need• 34% actually saw
an opportunity
Low levels ofincome• 40% have a
personal montlyincome of less thanUS$ 200
High dependency• 49% business =
only source ofincome
• 66% are heads ofhouseholds
Sustainability• 23% would close
their business ifthey were offeredpaid employment
Figure 46: Motivation to start the business versus realities

41
Figure 47: Main constraints to managing the business
Sourcing money
Equipment/raw material
Not enough customers
Too many competitors
Being owed money
52
%
21
15
11
9
5.2 Operation and managementSourcing of money is perceived to be the biggest challenge for business owners. About every secondbusiness owner (52%) reported to have problems sourcing money and 21% reported to have challengeswith equipment/raw material. Further, MSME owners claimed not to have enough customers (15%) andtoo many competitors (11%) which might be related to the limited use of sophisticated marketingtechniques.
In addition, the existing business acumen of MSME owners needs to be taken into consideration. Businessacumen here is defined as ‘the keenness and quickness in understanding and dealing with a business situationin a manner that is likely to lead to a good outcome’ (Reilly and Reilly 2009:1)16. As business acumencannot be measured directly, various proxies are used here to estimate levels of business acumen, such aslevels of education and skills training, business experience (here: age of MSME owners), their understandingof financials, access to formal financial services, their level of (in)formality, their use of marketing techniquesin promoting their business, as well as various attitudes and perceptions.
Education and skills training: As previously mentioned, levels of education are relatively good in Zimbabwecompared to other countries in the region. As such, only 31% have primary education or less (including5% who have no schooling). However, the majority (73%) acquired the necessary business skills informally(through informal networks such as family and friends, previous job, or while managing the business), whileonly 27% acquired the skills formally (through a training programme, school, university/college) – whichindicates the need for tailored business skills and management programmes.
Business experience: The majority of businesses are young (5 years or younger) – but many MSMEowners are older than 30 years which might indicate a higher level of experience. Only 28% are 30 yearsor younger.
Understanding of financials: Almost every second MSME owner (49%) does not keep financial records,and only 8% reported to have up-to-date financial/accounting records. 29% did not know their turnover,and only 6% have a written business plan. That might be related to the nature of the business (small-scale,survivalist businesses) and/or the lack of financial literacy/capability. The insufficient understanding offinancials affects operation and management of the business on a daily basis. In addition, it affects futureplanning and hence sustainability and growth of the business which indicated a great need for support inthis area.
Access to formal financial services: The majority of MSME owners do not have a bank account forbusiness purposes, which prevents them from saving through and/or borrowing from commercial banks.Only 3% have a separate business bank account in the name of the business. Often, business and personalfinances are mixed up, which affects financial management of the business.
16 Reilly, Dr. Raymond R and Reilly, Dr. Gregory P. 2009. Building Business Acumen. In: HR West, December 2009. Available [online] at URL:http://www.acumenlearning.com/public/images/uploaded/reilly-building_business_acumen-hrwest1209.pdf

42
Figure 48: Main constraints to growing the business
Sourcing money
Operational space
Too many competitors
Bad weather/natural disaster
Electricity and water supply
Equipment/raw material
Being owed money
Transport
43
%
11
6
6
5
5
5
4
“Growing the business” = mainreasons for savings andborrowing
Informality: 85% are informal, i.e. they are not registered / licensed, which does not mean that they areless business savvy. However, formalisation of the business requires a relatively large sum of money and anumber of documents which the majority of MSME owners do not have.
Limited use of sophisticated marketing strategies: The majority (82%) rely on word-of-mouth to advertisetheir business, and 14% do not market or advertise their business at all – which indicates a great need forsupport in this area.
Attitudes: Despite the challenges mentioned above, the majority of MSME owners have positive attitudestowards their business. 83% are decisive (agreed with the statement: if you make up your mind to dosomething you do not let anything stop you; and you are happy to take charge of and see things through),68% are flexible if further change is warranted in the future (agree with the statement: you would easilyconsider venturing into a new business), and 75% regularly assess their competitors.
5.3 Growing the businessGrowing the business was reported to be the main reason for saving and borrowing. As access to financeis challenging (reported by 43%), many business owners rely on savings and other forms of income. Otherconstraints to growing the business mainly refer to space to operate (11%), and bad weather/naturaldisasters (6%) which is not surprising considering the large number of MSME owners that engage inagricultural activities.
In addition, MSME owners reported the following challenges:
n Too many competitors (6%); n Problems with electricity and water supply (5%); n Lack of equipment and raw materials (5%); n Being owed money (5%); andn Inadequate transport (4%).
Sustainability versus risk diversification: Survivalist entrepreneurs might prefer to in invest in newbusiness(es) instead of growing the existing one which affects the sustainability of businesses. It is interestingto note that 23% would close their business if offered paid employment, and 68% would easily venture intoa new business.

43
Figure 49: Perceptions of MSME owners
Given opportunity
would leave
Zimbabwe for good
Worried that their
business would
shut down
Would close the
business if offered
paid job
Would easily consider
venturing into a new
business
n Agree n Disagree n Don’t know
8314 3
7027 3
7423 3
2968 3
Cottco
Banking institutions
Care International
SEDCO
Oxfam
Ministry of SMED
Agri-Bank
Other councils
Zambuko Trust
Micro King
20
13
6
6
5
5
4
3
3
2
%
Figure 50: Main business support mechanisms used by those who used any support
5.4 Business supportDespite these numerous challenges MSME owners face, only 9% have ever used business support (besidesthe support received from internal networks such as family and friends). Of those who received businesssupport, 72% positively reported that the help they received was useful.
Of those who used business support 20% used support provided by Cottco, while 13% used bankinstitutions. NGOs, such as Care International and Oxfam also play an important role with 6% and 5%respectively. 5% received support from the Ministry of Small and Medium Enterprise and CooperativeDevelopment.
6 Conclusions and recommendationsThis study found that the sector is driven by individual entrepreneurs and micro-enterprises. The majorityof MSME owners are located in rural areas, mainly engaging in agriculture, retail and wholesale relatedactivities, which are largely driven by female entrepreneurs. Uptake of formal financial products and servicesis low (especially in rural areas), and financial inclusion is driven by informal mechanisms (e.g. savings groups,burial societies, etc.).
The MSME sector plays an important role in addressing unemployment in Zimbabwe with a total of 5.7million people working in the sector (including the MSME owners). Further, the sector contributessignificantly to poverty alleviation. Although effects on wealth creation are limited given the low levels ofincome among the majority of MSME owners – survivalist businesses play a vital role as a buffer againstslipping into deeper poverty and reducing individual and household vulnerability.
Given this crucial role of MSMEs, and especially of survivalist businesses, it is imperative to create an enablingenvironment by putting into place strategies to support upward mobility and growth of these businessesto mature into more sophisticated formalised enterprises. To do so, it is important that these interventionsare targeted. MSME support programmes can only be meaningful if they target specific segments withinthis broad sector that range from informal survivalist businesses to formal, more sophisticated small- andmedium-size businesses. As found in this survey, the majority of business activities in Zimbabwe can becharacterised as survivalist businesses and hence focus should be given to those. Furthermore, it isimportant that interventions are evidence-based. However, the lack of accurate and reliable informationabout these businesses and the challenges they face, have been identified as the key constraints in achievingthis objective. There is an information gap especially for businesses that are not registered and as such havenot been captured in the system (90% of individual entrepreneurs and 75% of micro-businesses are notregistered/licensed)17. This could be a stumbling block in terms of identifying and designing appropriatesupport programmes for the whole sector, determining policy direction and relevant financial productsand services to address the needs of the MSME owners in Zimbabwe.
This survey builds a comprehensive body of evidence focusing on MSME owners (especially individualentrepreneurs and micro-businesses) and their financial needs, and has identified the following challengesand recommendations thereafter.
6.1 General recommendationsNeed for interventions that focus on growth and sustainability: The age of the business can be used asa proxy for sustainability/maturity of the business given the lack of other baseline data18. As found in thissurvey, the majority of businesses are young (in operation for 5 years or less). This might also be relatedto the introduction of the multicurrency system in 2009. Limited upward mobility and sustainability ofbusinesses has been associated with many factors, including the effects of policy and regulations directedat the MSME sector, the macroeconomic environment (e.g. the availability of paid wage employment versusthe need to take up self-employment/entrepreneurial activities), and industry specific factors (e.g.vulnerabilities of the agricultural sector versus professional services sector). In addition, individualcharacteristics of the MSME owner play a vital role. As such, business success is based on clear and positivelymotivated business intentions. As found in this survey, however, the motivation to start a business is oftendriven by need (to provide for their family, unemployment, poverty, etc.) rather than seeing an opportunity.It is apparent that a large number of adults in Zimbabwe are compelled to enterinformal/survivalist/necessity driven self-employment. Many MSME owners would therefore take up paidemployment (if offered) or venture into a new business. As such, most profits are absorbed by thehousehold to smooth consumption (the majority of MSME owners are heads of households; often thebusiness is the only source of income), or invested into other business activities rather than into the corebusiness to diversify risk. By design many of these entrepreneurial activities are not motivated by growthbut by survival. Interventions focusing on business growth and sustainability need to take these issues intoconsideration as part of the strategy exploring factors that are required to transform entrepreneurialsurvivalist activities into sustainable businesses.
44
17 The World Bank Enterprise Survey explores formal small- and medium-size businesses in Zimbabwe.18 Data generated from this survey can be used as a baseline. Following a repeat survey it can then be compared, assessing the maturity of those
businesses (higher percentage of businesses in the growth and mature phase).

45
Need for education and training: Entrepreneurial action is linked to business acumen and sound businessmanagement skills. Although the majority of MSME owners in Zimbabwe have good levels of education,many of them rely on their own networks (friend, family, and other MSME owners) to acquire the necessarybusiness skills. While every second MSME owner claimed to keep financial records, only 8% have up-to-date financial and accounting records and many did not know their turnover. Often business and personalfinances are mixed up. As such, there is a great need for tailored training programmes focusing on financialcapability. It needs to be considered, however, that financial capability requires behaviour change. Hence,appropriate and relevant interventions need to be designed timeously, at different phases of the businesslife cycle taking into consideration different audiences. Three broad categories are start-ups, survivalistbusinesses (which are the majority of MSME owners), and established businesses. Basic concepts thatshould be included here focus on entrepreneurial and basic MSME management competencies, modernaccounting and financial management systems, looking at business versus personal finances (only 3% havea separate bank account in the name of the business), and different financial services options (many MSMEowners reported that they have not thought about insurance, for example, and do not know where andhow to get it). In addition, MSME owners require a basic understanding of financial regulations, legal andtax issues (only 2% are registered with ZIMRA), and understand related resources they can resort to in asituation of financial stress.
Need for formality: For the purposes of this survey, the term ‘informal businesses’ refers to enterprisesthat are not registered and/or licensed with any government institution within Zimbabwe. Uncertainties,the scale of business activities, as well as the costs and complexities of registration affect the motivation toformalise the business. In Zimbabwe, incomes from formal employment tend to be low and hencesecondary incomes are essential. Incomes from entrepreneurial activities provide an important opportunityto ‘top-up’ incomes, and they are often based on activities that can be fitted around a main job. A quarterof MSME owners reported to generate additional income from another job / business. As such, ownersof ‘top-up’ businesses might not see the need to register their entrepreneurial activities. Another reasonfor resisting formalisation is that the processes and requirements of registration can be complex andexpensive. This is a particular issue where educational levels are low and entrepreneurs have to engagehelp in completing the paperwork required (29% of MSME owners have primary education or less).Owners of survivalist businesses might not see the need for registering their business activities as theassociated cost registration and compliance might exceed the limited income. About 35% of MSMEowners reported that they do not have the money to register their business activities, 26% don’t know howto register, and 10% reported that it is too complicated. Further, there are low levels of awareness as towhat the benefits of registration are. To reduce complexities and travel costs, it might be useful to introducea ‘one-stop-shop’ model where MSME owners can register/license their activities in one go. In addition,incentives such as support with writing a business plan, access to finance, operational space, and newcustomers (i.e. marketing) could be offered. There is need to ensure that MSME owners understand theimportance and benefits of registering their businesses, that the process is transparent and easy, and thatthe cost is affordable. There is an opportunity to come up with incentives and a formalisation model whichwould suit the needs of the sector while contributing towards their financial inclusion, the use of micro-franchising, loan booths, the advent of ninety nine year leases and the formation of SACCOs.
Cost and complexity ofregistration process• About 90 days• At least US$ 685• Multiple steps
Perceived benefits of registration• Avoid harassment from authorities• Law compliance• Access finance/government assistance
3 Reduce registration costs3 Communicate registration process3 Reduce complexities
Incentives:3 Help to access finance and operational space3 Education and training (e.g. help to compile a
business plan3 “One-top-shop”
Figure 51: Need for formalisation – costs versus benefits

46
Need for revised labour laws: Although MSME owners do not perceive labour laws as a main constraint,policies affecting the hiring and firing of employees might contribute to the willingness/ability to employ full-time paid staff. As found in this survey, the majority of MSME owners do not have any employees (72%)and only 4% of MSME owners employ more than 5 people. Often businesses are embedded in networksof family and kin and rely on people who work in the business without pay. In fact, only 22% are full-timepaid employees. There is a need to create an enabling environment for MSME owners which encouragesquality employment across the sector. Labour policies that are positively perceived on macro-level, mightaffect MSME owners, in particular informal micro-businesses. These effects are worth exploring further.
Need for operational space: The majority of MSME owners operate from residential premises, not onlydue to the nature of businesses but also due to the lack of operations space. The lack of operations spacewas reported as a key challenge when growing the business. Although operational space is a challenge itself,there is also another challenge with the actual cost that is often associated with acquiring the space. Hence,there is need for intervention from different stakeholders on how to tackle the operational space issue withregard to availability and affordability.
Need for marketing and market linkages: Many MSME owners identified too many competitors. However,having enough customers / identifying prospective clients is a key challenge for business start-up, operation,management and business growth. The majority of entrepreneurs (82%) do not use sophisticatedmarketing practices, but rely on word-of-mouth to advertise their business. An additional 14% do notmarket their business at all. This indicates the great need to support MSME owners in their venture tomarket their products and services. Common marketing techniques for small businesses includenetworking, customer referrals, local business directories, local radio, road-side billboards, and print (e.g. localnewspapers). Although internet marketing might seem to be a cost effective option (e.g. website, emailmarketing, as well as social media), only 3% have access to internet. SMS marketing could be utilised formarketing purposes as the majority of MSME owners have access to cellphones (80% in total, and 90% inmajor urban centres such as Harare and Bulawayo). However, that might not be feasible / affordable to allMSME owners.
6.2 Financial inclusion specific recommendationsNeed for credit/loans: Only 2% of MSME owners in Zimbabwe borrow from a commercial bank. In apredominantly cash-based economy20 such as Zimbabwe, where access to formal financial services isproblematic (as income is too small / irregular, or banks are too far away), managing enterprise liquiditypresents a number of challenges. Sourcing money was reported as a key challenge when starting, managingand growing the business. Lenders have a range of requirements – of which the majority of MSME ownersdo not fulfil, such as formal registration (15% of MSME owners are registered/licensed), a bank account(14%), a business plan (6%), and financial records (51%). Although the majority of MSME owners save (andthese savings could be used as cash collateral), information about the amount of savings is not available.From a supply-side perspective, these requirements and other information are needed to establishcredibility of the business and to be able to calculate the risk accordingly. As already known, the lack ofreliable information is linked to the high administrative costs of small-scale lending. Credit markets aresegmented by the relative costs of engagement for the provider – as these costs rise, the provision ofcredit declines. Using existing business models, where the information normally used to assess risk isabsent, risk evaluation becomes less robust and the risk assessment process becomes based on uncertainty,thus raising the cost of the engagement. The uncertainty introduced by irregularity and low levels ofincome as well as insufficient credit and other information (e.g. business address, owners ID, up-to-datefinancial records) results in murky risk-profiles. Often the accounts of enterprises are inseparable fromthose of the household as the household may use funds borrowed for business purposes. As a result theexpected loss and revenue no longer lend themselves to estimation, and the risk to lenders in thesecircumstances is very high. As such, many credit providers cannot operate with traditional models of riskin this segment of the market. Efforts that assist in furthering the access to information required by creditproviders will contribute to reducing the barrier of access to credit for MSMEs.
20 The majority of MSME owners are paid in cash. They pay their employees in cash. And banking is driven by cash related transactions such ascash withdrawals and cash deposits.

47
Examples include small-business credit bureaux, using any historical data on client financial behaviour orcredit-related variables that can be used to calculate the risk of extending credit, or even alternative modelsfor credit scoring, like psychometric scoring. A focus on policies and technologies that contribute toimproving the information available to lenders may reduce the lending constraints. Credit bureaux improvethe information available in making credit decisions and supply credit information to lenders. Similarly,credit technolo¬gies that better use currently available information (such as scoring) can improve theinformation position of the lender. Partial credit guarantees (PCGs) can be another mechanism of risktransfer and risk diversification. PCGs allow enterprises with insufficient collateral to access the lendingmarket. Additionally, by being able to access loans these enterprises are able to establish a repaymentrecord, providing the borrower with a credit history, which in itself can lessen the need for collateral. Finally,by extending more loans to smaller businesses, lending institutions gain experience in managing these typesof loans, encouraging further development in this market segment. However, access to credit bringsadditional risk to a market due to the risks associated with unaffordable credit. There is a need to balanceaccess to credit with responsible credit provision. Responsible credit provision can be encouraged by anappropriate regulatory framework that restricts certain practices and behaviours, while at the same timeempowering and protecting consumers. A well-functioning credit market needs a simple and transparentregulatory framework that is relatively easy to comply with. A well-defined legislative framework will enablean effective credit market where reputable credit providers serve responsible credit seekers, so that overtime, access to finance is improved. Excessively onerous and costly compliance requirements, which increasethe cost and risk for credit providers, is likely to lead to higher cost of credit for consumers and lowerreturns for providers, and reduced access over time.
Need for long-term savings and investments: MSME owners save for a number of reasons. Most ofthem, however, are related to day-to-day- needs and household consumption rather than long-terminvestments such as productive assets for the business, which is understandable considering theuncertainties many businesses face and the daily hardship (low levels of income, high number ofdependents). Rebuilding confidence in the financial services sector is vital as most people are currentlykeeping their savings at home or save with informal groups.
Need for low-cost banking products: The cost of services (including bank charges and minimum balance)appears to be a problem among MSME owners in Zimbabwe. Low-cost or free accounts for the lowestincome market segment would be a way to boost the financial inclusion of the very poor. This type ofservice could also be vital for enabling people to save through formal mechanisms and build an asset base.Restoring confidence in the financial institutions and the ability to freely access one’s own funds are criticalfor product uptake.
Need for mobile financial services: The low levels of formal financial inclusions and the high uptake ofcellphones (as used by 80% of MSME owners in Zimbabwe) indicates an opportunity for mobile financialservices. A shift towards greater intentional and appropriate use of technology (e.g. cellphones) enablingelectronic transactions brings material benefits to governments, private sector, individuals andcommunities—in terms of reduced costs, improved transparency, enhanced security, and access to financialservices. Advances in technology and recognition of the benefits of innovation in electronic paymentprovide the opportunity to look beyond the traditional brick-and-mortar bank branch models of servicingcustomers. From a policy and regulatory perspective, attention is necessary to ensure that there is anenabling environment for these ‘beyond branch’ models to develop, which requires understanding of themoney management habits and economic networks of MSME owners. Consideration is required on howfar the regulation should go in determining the branchless banking framework, which models of branchlessbanking are economical and should take into account how far they will go in reaching the unbanked orunder-banked population.
Need for agricultural finance and insurance: As shown in this survey, the sector is largely driven byagricultural activities (43%). The FinScope Consumer Survey Zimbabwe 2011 also indicated that farmingand fishing is a main source of income for 29% of adult Zimbabweans. Given the seasonal nature of thiswork and the high vulnerability due to various risks such as natural disasters and low selling prices, mostMSME owners face uncertainties (and as such are often not able to employ full-time staff). Although morepeople residing in rural areas rely on farming and fishing, access to agricultural finance and insurance islimited. There is a need for affordable and flexible solutions, including loan and savings products to coverseasonal input (e.g. fertiliser, seeds, labour, etc.) and fixed assets (e.g. tractors, implements, land

improvements). In addition, there seems to be a demand for tailored affordable agricultural insurancecould help to address some of the risks and uncertainties MSME owners face.
Need to leverage informal financial services: Every second MSME owner in Zimbabwe uses informalmechanisms to manage their business’ finances (mainly for saving purposes), compared to 18% who areserved formally. As such, informal services such as savings clubs play a vital role in the financial servicescontinuum, often as precursors for those who cannot be reached formally. Informal services are often usedthroughout and beyond the transition from informal to formal. But ultimately, informal services becomemarginal or supplemental. For MSME owners in Zimbabwe, the move to formal brings a number ofadvantages that informal cannot provide. Principle among these is the element of credibility. This elementextends from funders (access to credit), to potential investors or business partners, to customerengagement. A formally registered business, for example, that implements some prudentially acceptedlevel of account management and reports to a regulatory body give certainty to stakeholders engaging withthe business. In addition, consumers generally should have access to some level of consumer protectionwhere a business is formally registered, providing consumers with added comfort in engaging with thebusiness.
48

Appendix A: Survey methodology and approachDefining MSMEs In this survey, MSMEs are defined by the number of employees according to the Small Enterprises DevelopmentCorporation (SEDCO) Amendment of 201121. This definition includes individual entrepreneurs (without anyemployees), micro-businesses (with 1 to 5 employees), as well as small-businesses (6 to 30/40 employees –depending on the sector) and medium-size businesses (31/41 to 75 employees)22. This study also includesagricultural activities if 50% or more of the produced goods are sold.
49
Micro Small Medium
Agriculture 1 – 5 6 – 30 31 – 75
Manufacturing 1 – 5 6 – 40 41 – 75
Retail 1 – 5 6 – 30 31 – 75
Table 9: Examples of classification of MSMEs
Note: The SEDCO classification also takes other indicators into consideration to classify MSMEs, such as maximumtotal turnover in US$ and maximum gross value of assets in US$. A formula is used to combine all indicators andclassify MSMEs accordingly (as described in the Fifth Schedule). As these figures are rather unreliable, the FinScopesurvey only uses the number of employees to define the business as agreed upon by the Steering Committee.Further, it includes all employees, not only full-time employees, to estimate the total number of people working inthe sector.
QuestionnaireThe FinScope MSME Survey methodology was first piloted in South Africa in 2006. It has since been implementedin Zambia (2008), Tanzania (2010), South Africa (2010), and Mozambique (2012). The South African questionnairewas used as a benchmark for the Zimbabwe MSME questionnaire. The questionnaire was then adapted to theZimbabwean context. By design the questionnaire is intended to involve a range of stakeholders, thereby enrichingthe survey tools through a process of cross-cutting learning and sharing of information. The design of thequestionnaire was guided by the Steering Committee. The design process entailed several revisions whilemaintaining continuity on the content for the indicators on trend and monitoring analysis of changes in the financialsystems over time. The final questionnaire was signed off by all relevant parties involved. It was then translatedfrom English into Shona and Ndebele. The questionnaire was used in the training of enumerators and iscomplemented by a detailed training manual. The questionnaire was then piloted internally and in the field. Insightsand feedback from supervisors during the pilot were taken into account for further revision before thequestionnaire was finalised. The final version was adopted and accepted and ready to be used in the field.
21 Government of Zimbabwe 2011. Small Enterprises Development Corporation Amendment of 2011, Fourth Schedule, Section 2. The 2010Amendment (which contains the same classification as the 2011 amendment, Chapter 24:12, Forth Schedule, Section 2, page 16) is availableonline at URL: http://www.sedco.co.zw/index.php?option=com_docman&task=cat_view&gid=12&Itemid=8
22 Note: The definition for small-and medium-size businesses depends on the sector and has been taken into consideration here. The term‘employees’ here includes all people working in business – both paid and unpaid (excluding the business owners).

The questionnaire includes the following broad sections:
50
Topic
Introduction and screening
ANature of the business
Economic activity, ownership, location, etc.
BGetting involved in your own business
Reasons for opening the business, main constraints, etc.
CEmployees in the business
Number of employees, nature of employment, labour relations, etc.
DCustomers
Client base, marketing practices, etc.
E Registration/compliance of business
FFormal product penetration
Usage of formal financial products
GBanking penetration
Usage of banking products, main constraints
HCredit and loans
Usage of credits and loans, reasons for borrowing, main constraints
ISavings and investments
Saving mechanism, reasons for saving and investments, main constraints
JRisks and insurance
Main risks (perceived and experienced) and coping mechanisms, usage of insurance products
KMoney management within the business
Transactions, terms and conditions, etc.
LRecord keeping
Methods of payment, financial record keeping processes, business turnover, etc.
M Import and exports
NBusiness support
Awareness of and access to small business support mechanisms
O Skills of the business owner/company resources
PPsychographics and business performancePerceptions and attitudes regarding business performance, and main constraints
QDemographics
Age, gender, education, income, etc.
Table 10: Questionnaire structure

51
Household
BusinessOwner
BusinessOwner
BusinessOwner
BusinessOwner
BusinessOwner
All EAs will be stratified according toprovince and urban/rural
Selected on probabilityproportional size (PPS)
Listing of all households in theselected EA
Listing of all business owners (aged 18years and older) within the households
Selection of one business owner per qualifierhousehold using the Kish Grid
(Random selection of 6 – 7 qualifier households
All EAs per region
Urban EAsRural EAs
Household Household
EA 1 EA 2 EA 3 EA 4 EA 5 EA 6
Household
Figure 52: Sampling approach
SamplingThis survey is national representative. The sample frame was provided by ZIMSTAT. The survey included acomprehensive listing exercise, listing over 57 000 households in 500 Enumeration areas (EAs), identifying almost16 000 MSME owners, of which 3 222 were interviewed. Business owners with more than 75 employees werenot interviewed.
Sampling population: The survey population refers to MSME owners in Zimbabwe, who are:
n 18 years or older ;n Perceive themselves to be business owners/generating an income through small business activities; andn Employ 75 people or less as well as individual entrepreneurs without any employee.
Sampling units: Enumeration areas (EAs) are the primary sampling units, qualifier households (those with MSMEowners) are secondary sampling units, and individuals selected by the KISH GRID from a list of eligible respondents(business owners) at every selected qualifier household are tertiary and ultimate sampling units.
Primary sampling units (PSU): At the first stage the sampling frame was made up of Enumeration areas (EAs). EAsare the smallest geographical units that consist of about 80 to 120 households. Each EA has a unique 10 digit geo-code that reflects the province, district, ward and land use sector in which it is located. For the purpose of thissurvey the sampling frame excludes non-household population, people residing on state land (national parks, safariareas, etc.) and in institutions, and these account for less than one percent of the population.
Secondary sampling units (SSU): Prior to every survey, a list of households in the selected EAs is established. Inaddition, a comprehensive listing exercise was conducted, listing all the households in the selected EAs, identifyingqualifying households, i.e. those with MSME owners. This is used as the frame for the second stage systematicselection of households.
Tertiary Sampling Units (TSUs): One MSME owner per selected household is eligible to participate in the surveyand Kish Grid was be used to select one eligible respondent from a list of all eligible household members (if therewas more than one MSME owner in the household).
Sampling strategy: A multi-stage sampling approach is used as illustrated in the figure below, including an initial listingphase.

52
Province Urban Rural Rural
Bulawayo 31 0 31
Manicaland 13 55 68
Mashonaland Central 5 36 41
Mashonaland East 6 44 50
Mashonaland West 16 36 52
Matabeleland North 5 22 27
Matabeleland South 4 22 25
Midlands 17 42 58
Masvingo 7 47 54
Harare 92 1 93
TOTAL 194 306 500
Table 11: Sample allocation of EAs
A list of all census enumerator areas (EAs) was obtained, stratified by region and urban/rural. A total of 500 EAswere sampled using probability proportional to household size (PPS) based on the master sample developed byZIMSTAT after the 2002 census, including 194 urban and 306 rural areas. Then all households in the selected EAswere listed. Within the households, all MSME owners who are 18 years or older (employing 75 people or less, aswell as individual entrepreneurs without any employees) were identified and this was used as the main samplingframe. Within each selected EA, six to seven qualifier households (with MSME owners) were systematically selectedfrom the listed MSMEs. Within the selected households, where there was more than one business owner, the KishGrid was used to randomly select the qualifying household member with whom to complete the interview (thisindividual was the ultimate sampling unit). The MSME owner was asked about the number of businesses they own.If they own more than one business, the MSME owner was requested to identify the main business, i.e. the businessthe MSME owner spent the most time working in or on.
Sample size: A total of 3222 face-to-face interviews were conducted in 500 EAs. The detailed sample distributionis provided in the table below.
Province Urban Rural Rural
Bulawayo 185 0 185
Manicaland 73 377 450
Mashonaland Central 53 221 274
Mashonaland East 54 279 333
Mashonaland West 129 217 346
Matabeleland North 27 153 180
Matabeleland South 25 139 164
Midlands 112 278 390
Masvingo 47 310 357
Harare 542 1 543
TOTAL 1 247 1 975 3 222
Table 12: Sample allocation rural/urban by province
Note: The original sample included 3000 MSME owners. RCF conducted an additional 222 interviews.

Training and pilotThe team of enumerators was recruited from all provinces in Zimbabwe. A total of 100 enumerators wereshortlisted. Academically all had at least advanced level education and market research experience with variousresearch houses most notably with ZIMSTAT. The shortlisted personnel attended a 10 day training workshop atthe Research Continental-Fonkom offices from the 17th to the 26th of September 2012. The briefing sessioncovered background, objectives, methodology, sample, survey instruments and a day to pilot the study. At theconclusion of the training, the final selection of enumerators was done. Enumerators were selected based onperformance on written tests, participation in training, prior experience and level of education. The trainingworkshop was attended by representatives from FinMark Trust, the Ministry of Small and Medium Enterprises andCooperative Development, ZIMSTAT, and the Steering Committee. The actual training was conducted by Mr. Ushe,the Research Director for Research Continental-Fonkom. Honourable Minister of Small and Medium Enterprisesand Corporate Development Mrs. S.G. Nyoni officially closed the training session and announced thecommencement of fieldwork on the 26th of September 2012 at the Jameson Hotel.
Data collection and managementA total of 16 teams composed of a supervisor, four enumerators and a driver embarked on the data collectionprocess from the 28th September 2012. The data collection started in Harare with twelve teams followed byBulawayo with four teams. This was done to closely monitor the field challenges, capacity of the teams and thequality of work produced before the teams could be dispatched to other provinces. Each province had two teamsto cover it. Each team had a quota of one EA a day.
Generally each field day involved the following process:
n Identifying the EA, establishing the boundariesn Deploying enumerators from the north western cornern Enumerators listing all existing household (stickers were placed on listed HH)n Establishing HH status whether a business exist or notn Supervisor verifying completeness of listingn Compile total HHs, total HH with MSME owners, total MSME owners in EAn Systematic Selection of 6 HHs with SMEs to be interviewedn Interviews with selected/qualifying HHs and respondent
Quality controlQuality assurance was carried out by RCF quality controllers. In addition, independent quality checks wereconducted by representatives from ZIMSTAT, the Ministry, as well as FinMark Trust. These field visits had thefollowing objectives:
n Verify the status of field workn Assess the quality control procedures implemented in fieldn Observe implementation of field proceduresn Back checking of listing proceduresn Observe interviews by accompanying enumeratorsn Identify challenges in field and suggest solutions
Further, all questionnaires were back checked in office, and 10% of call backs were conducted. Very few omissionswere detected and these were rectified by calling back respondents. This was due to on-spot-checks done bysupervisors during field work. Thus all questionnaires received by the quality controller officer were clean.
53

WeightingWeighting was conducted by ZIMSTAT. The Zimbabwe 2002 Master Sample was used to boost the weights tothe population estimates. The population for 2011 was then compared with the population projections. Thesefigures were validated by the ZIMSTAT sampling unit. Details regarding the sample and weights can be requestedfrom ZIMSTAT.
Data analysis and reportingThe analysis followed a standard analysis plan based on the questionnaire and the objectives of this survey. Thefinancial inclusion section, however, uses the FinScope analytical framework, which is applied to all FinScope MSMEsurveys for the purpose of comparative study (see Appendix B).
54

55
Total business owner (BO) population = Minimum age defined by the age at which individuals can enter
into a legal financial transaction in their own capacity
Banked= BOs who
have/use financialproducts and/or
services providedby a commercial
bank regulated bythe central bank
Served by other formal financial institutions = BOs who have/use financial products and/or
services provided by regulated non-bank formal financial institutions, e.g. insurance companies
Financially included = BOs whohave/use financial products and/or
services for business purposes – formal and/or informal
Financially excluded = BOs who donot have/use any financial productsand/or services – if borrowing, they
rely only on friend/family; and if saving, they save at home
Formally served = BOs who
have/use financialproducts and/or services
provided by a formalfinancial institution (bank
and/or non-bank)
Informally served = BOs who have/use financial products and/or services which
are not regulated, e.g. farmer associations, savings clubs/groups,
private money-lenders
Appendix B: Analytical framework for financial inclusion


Tel +27 11 315 9197 Fax +27 86 518 3579www.finmark.org.za www.finscope.co.za