


Languages
Pages
Legal


5.5.5.5.5. Case Study Of The Textile Industry In TirupurCase Study Of The Textile Industry In TirupurCase Study Of The Textile Industry In TirupurCase Study Of The Textile Industry In TirupurCase Study Of The Textile Industry In Tirupur
5.15.15.15.15.1 BackgroundBackgroundBackgroundBackgroundBackground
AAS OUR CAR bounced along the narrow pot-holed road to Tirupur, a signWelcome to Banian City greeted us. Banian is the local name for the white vests used mostly by men in India. This sign described what was
in store for us in Tirupur. There does not seem to be any activity in the town thatis not directly or indirectly connected with the manufacture and sale of baniansand T-shirts.
The whole world appeared to have discovered Tirupur in the early nineties. Thesuccess story of Tirupur, the new boom town, had spread all over. Suddenly manyinternational agencies began to take notice of this little town in the state of TamilNadu in the south of India.
We had decided to conduct an Industrial Ecology study in Tirupur. The purpose ofthe study was to see how to apply the concepts of Industrial Ecology in a developingcountry, where the pattern of industrialization was vastly different from that of adeveloped country.
As we first drove into the town, we wondered what made this place such a successstory. The narrow streets were crowded and hardly well laid. There were opendrains running along the sides of the roads, carrying filthy, colored water. Anassortment of vehicles, trucks, hand carts and bullock carts with their assortedloads of cargo, clogged the streets. Smoldering garbage was dumped on both sidesof the road and the stench was hardly bearable. Through one such narrow streetwe approached our first point of call, which was the Tirupur Exporters’ Association(TEA). The moment we entered the building of TEA, we started to notice theefficiency which makes Tirupur successful. Professional, well-trained staff mansthe plush office. The building itself has all the facilities that an exporter wouldrequire, including a well-equipped conference room.

CASE STUDY OF THE TEXTILE INDUSTRY IN TIRUPUR 45
���������������� ����������������������������������
������������������������������ ������������ ��
�� ������������������� ����������������������������
���� ����������������� ������������������ �
When we met the secretary, he told us straight awaythat dozens of such studies had been conducted byvarious agencies and he did not see any point in
further studies being carried out. Many national and international agencies hadbeen conducting studies on waste minimization technologies. Other than this,Tirupur had been the subject of many technical and socio-economic studies inthe past. However, since we were very keen on going ahead with the study, heoffered all assistance. Through TEA, we were introduced to many of the leadingindustrialists in Tirupur, who had been witness to the phenomenal growth of thetown.
5.25.25.25.25.2 The Study in TirupurThe Study in TirupurThe Study in TirupurThe Study in TirupurThe Study in TirupurThe study was carried out in the year 1996. All the data and estimates pertain tothe year 1995. Tirupur, chosen as a sample town, represented a typical industrypattern in developing countries with many small and micro enterprises involvedin an industrial activity.
A lot of attention has been given to the industrial symbiosis model in Kalundborg(Denmark), where a few disparate large units have worked out an effective systemto optimize the use of their material and energy resources (as described inChapter 1). The industrial pattern in Tirupur is very unlike Kalundborg. Tirupurhas a large number of small and medium units engaged in similar activities, apattern much more representative of a developing country.
������� ������� ����������!�������������������������������� ��� ��������������
�"������������������� �������������������������� ���������������������������
������������ ������������������������ ����������"������������������������ �����
����������������� ��� ������� ����#����������"���������
A typical street in Tirupur
Roads in India
Small-scale sector policy

46 CASE STUDY OF THE TEXTILE INDUSTRY IN TIRUPUR
5.2.15.2.15.2.15.2.15.2.1 Preparing a FrameworkPreparing a FrameworkPreparing a FrameworkPreparing a FrameworkPreparing a FrameworkWhen Tirupur was chosen, no specific format was available for carrying out
the study. The object was to explore how to apply the concepts of Industrial Ecologyin a developing country. Our idea was that we needed to start looking at possibilitiesfor building linkages between different industries as was done in Kalundborg or aswas being experimented in some parts of North America. When the study began,we realized that this was much more difficult than we had imagined. Unlike thehalf-a-dozen industries in Kalundborg, Tirupur had nearly 4000! Even to startlooking for partners who would be interested in forming linkages to share theirwastes was a major task. Secondly, the scales of operation of most of the unitswere extremely small. Hence for any individual unit to make major investmentsin any recycling systems would not prove economical. Thirdly, the industriestend to be extremely secretive about their operations, as they do not wish that anyinformation about their business should reach enforcement authorities of theGovernment. We faced a great deal of difficulty collecting any information otherthan from published sources. The only details available pertained to value of salesand were available with the Export Promotion Council. As a next step, we tried tomeet the major industrial units and the heads of the different industries’associations in the town, to understand what they perceived as their problems.
������"��������������������������� �"��$������������������"��������������������
���������"��������������������������������������%����� �&"�������������������" �
���������� ����"����������������������������� ������������� ��� ������� �� �����
��������������������������"������������������������������ �������������������
������"�������������������������� �� ����������������������� ����������������
��������������"�����������"����� �������%��� �������������������������� ���
�������������� ���������������� � ��������������� ���������� ��������
������������� ��������������������������������������������� �� ���� '�����������
�������������������"��
Other than listing out hundreds of problems with the bureaucracy and makingout a case for greater support from the Government, there did not appear to beany perceived problem. Oh, yes, there is also a lot of harassment from the Pollution
The tax system in India

CASE STUDY OF THE TEXTILE INDUSTRY IN TIRUPUR 47
Control Board, which is needlessly making us spend millions, was the constantrefrain. In any case this problem also appeared to have been solved, by theindustries becoming members of the Common Effluent Treatment Plant Scheme.
At the end of the first month of the study, we were still struggling to collect usefuldata. The figures of water consumption and production, which were collected byus from different sources, also appeared to vary greatly.
We then decided that we should get a good idea of the activities of the town andwe chose to make a rough assessment of the materials flowing through it, at leastto understand what was happening in the area. As a first step, a fact file on thetown was prepared.
5.35.35.35.35.3 Tirupur Fact FileTirupur Fact FileTirupur Fact FileTirupur Fact FileTirupur Fact File5.3.15.3.15.3.15.3.15.3.1 History of TirupurHistory of TirupurHistory of TirupurHistory of TirupurHistory of Tirupur
The textile boom in Tirupur is recent. Tirupur used to be a center for cottontrading a few decades ago. Over the years a few small units were established tomanufacture banians. It was said that the water in Tirupur was of such goodquality that the banians made here were the whitest of them all. The fact that thetown was located so close to Coimbatore, which was an established textilemanufacturing and trading center, ensured that adequate skills were available.This business grew steadily. It was only in the early 1980s that some enterprisingbusinessman got the idea that the same facilities could be used to manufacturecolored T-shirts, which had become a rage all over the world.
5.3.25.3.25.3.25.3.25.3.2 Tirupur and its IndustryTirupur and its IndustryTirupur and its IndustryTirupur and its IndustryTirupur and its IndustryTirupur is a relatively small town in the Coimbatore district of Tamil Nadu. It
has a resident population of around 300,000. An additional 200,000 people comein from nearby towns to work in Tirupur’s booming textile industry. The rainfallin the area is low and erratic. The groundwater in most parts of the town is nowpolluted through years of effluent discharge by the textile industry.
The entire town’s economic activity is centered on the manufacture of cottonknitwear: for use as banians (mostly sold in the Indian market), and for use as T-shirts (mostly exported).
48 CASE STUDY OF THE TEXTILE INDUSTRY IN TIRUPUR
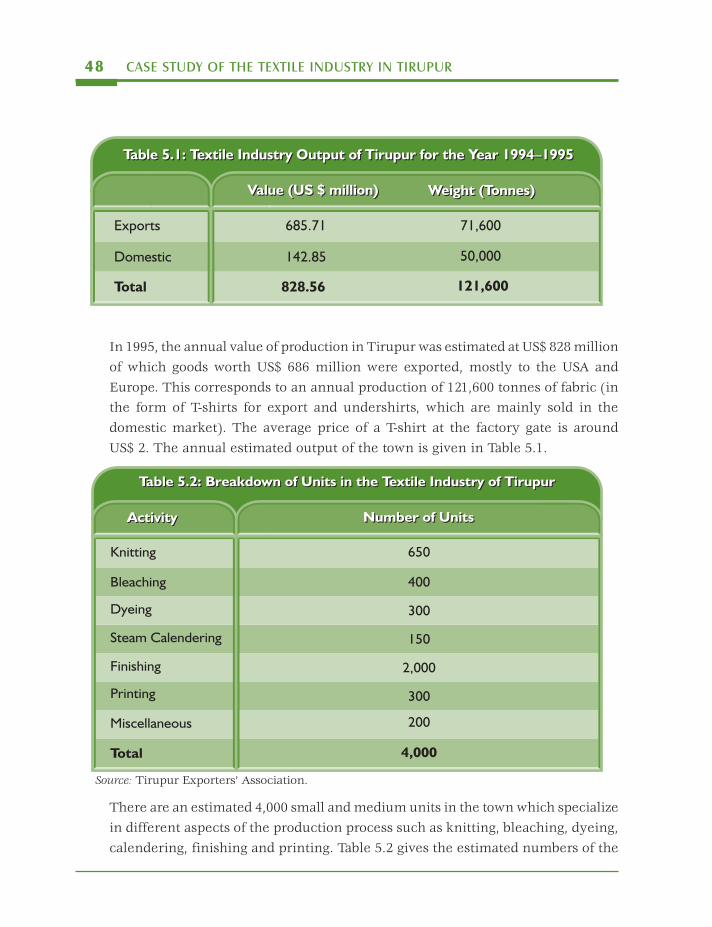
In 1995, the annual value of production in Tirupur was estimated at US$ 828 millionof which goods worth US$ 686 million were exported, mostly to the USA andEurope. This corresponds to an annual production of 121,600 tonnes of fabric (inthe form of T-shirts for export and undershirts, which are mainly sold in thedomestic market). The average price of a T-shirt at the factory gate is aroundUS$ 2. The annual estimated output of the town is given in Table 5.1.
Table 5.2: Breakdown of Units in the Textile Industry of TirupurTable 5.2: Breakdown of Units in the Textile Industry of Tirupur
Knitting
Bleaching
Dyeing
Finishing
Printing
Miscellaneous
Steam Calendering
Total
ActivityActivity Number of UnitsNumber of Units
650
400
300
150
2,000
300
200
4,000
Source: Tirupur Exporters’ Association.
There are an estimated 4,000 small and medium units in the town which specializein different aspects of the production process such as knitting, bleaching, dyeing,calendering, finishing and printing. Table 5.2 gives the estimated numbers of the
Table 5.1: Textile Industry Output of Tirupur for the Year 1994 1995–Table 5.1: Textile Industry Output of Tirupur for the Year 1994 1995–
Exports
Domestic
Total
Value (US $ million)Value (US $ million) Weight (Tonnes)Weight (Tonnes)
685.71 71,600
50,000
121,600
142.85
828.56

CASE STUDY OF THE TEXTILE INDUSTRY IN TIRUPUR 49
units involved in these activities. Accurate figures are not available as many ofthese units are very small or in the cottage sector and are not registered with anystatutory authorities. There are very few integrated manufacturing units in Tirupur,with all the activities under one roof. The absence of many large integrated unitsis partly due to the current government policy and the regulatory framework,which encourages the small-scale sector.
Tirupur is a job working center and not a brand exporter. This means that most ofthe exporters take up job work for brand marketers in developed countries and donot sell their own brands. This also means that the buyer in Europe or the USAcan easily change his source of supply. Hence, the contact that the exporter haswith the buyer is the most important business asset. This makes the exporter,who may have no manufacturing facility, the key player in the industry. Often,
F I G U R E 5.1
Knitting
Calen-
dering
Finishing
Bleaching
Dyeing
EXPORTER
Transaction Pattern in Tirupur

50 CASE STUDY OF THE TEXTILE INDUSTRY IN TIRUPUR
the exporter will buy the yarn and have the material processed by any of thejobbers in the town. The exporter may also have processing facilities. The patternof transactions can be represented as in Figure 5.1.
5.3.35.3.35.3.35.3.35.3.3 InfrastructureInfrastructureInfrastructureInfrastructureInfrastructureA view of the town does not give any indication of its prosperity. The power
supply is erratic and the town is prone to frequent blackouts. A majority of theindustrial units have diesel generators to provide stand-by power. The piped watersupply is hardly adequate and the limited water is insufficient even for householdrequirements. There is no underground sewerage system. The industrial effluentsare carried through open drains into a dry river called Noyel, which cuts throughthe town. The wastewater is carried to a reservoir built for irrigation purposes,about 15 km away. During its journey to the reservoir, a part of the wastewaterpermeates through the soil and contaminates the groundwater. Like in most partsof India, the piped water supply is very inexpensive, at around five US cents percubic meter.
In an attempt to overcome the scarcity of water in the town, the New TirupurArea Development Corporation Ltd (an organization set up in the mid-1990s toimprove the infrastructure in Tirupur), is working on an ambitious plan to laypipelines to bring water from the Cauvery river (nearly 70 km away). This wouldprovide a cheap and plentiful supply of water to Tirupur for its domestic andindustrial needs.
(����������������������������������������
������ ��� ��� (���� ��� ���� ���� ����� ��� ��
�� ���� ������ ����� ������ ��� �����������
����������������������������������������� �
���������� �������������������������������
���������������������������������������
������������������������������������� �
���� ����������������� ������)� ���� �����
����������������������������������������������������Women in Tirupur waiting
for water
Water issues
CASE STUDY OF THE TEXTILE INDUSTRY IN TIRUPUR 51
5.3.45.3.45.3.45.3.45.3.4 Government Policy and the Regulatory FrameworkGovernment Policy and the Regulatory FrameworkGovernment Policy and the Regulatory FrameworkGovernment Policy and the Regulatory FrameworkGovernment Policy and the Regulatory FrameworkTill a few years ago, the large industry in India was governed by an elaborate
licensing procedure. The government has always encouraged the small-scale sector,which has never needed more than a formal registration. Incentives like low interestloans and concessions in production and sales taxes are available to the smallindustry. The criterion for qualifying as a small-scale industry traditionally hasbeen the total investment in plant and machinery and not the totalproduction value.
India has a complex bureaucratic system and the industry is answerable to anumber of Government agencies. This includes having to file periodic statementswith different agencies. The small units fall outside the ambit of many governmentagencies. For instance, if a unit employs less than a specified number of persons,it falls outside the purview of the Factories Inspectorate, which specifies elaboratesafety standards.
It is probably because of these considerations, that the small (but very prosperous)units stay small. Growth of a unit takes the form of a new firm being established.For example, if a garment manufacturer wants to increase production, he wouldestablish a new firm and hire people accordingly. The value of equipment boughtin the new firm would be small enough for qualification as a small-scale industry.
In the recent years, the Government of India has laid down elaborate standardsfor industrial effluents. In India, the responsibility for management of theenvironment is divided between the central and the state governments. The CentralPollution Control Board and the Ministry of Environment of the central governmentmake policy, set standards and monitor their implementation at a national level.
The State Pollution Control Boards, which operate administratively under the stategovernments, are entrusted with the job of implementing the standards laid down.These boards carry out the regular monitoring of industries in India. These stateagencies have wide powers to penalize offenders, including ordering the closureof manufacturing units.
The regulatory authorities have been active in implementing the standards, andin the recent past the law courts have been very active in giving priority toenvironment-related cases. Some of the High Courts in the states have a specialGreen Bench to deal exclusively with these matters.
52 CASE STUDY OF THE TEXTILE INDUSTRY IN TIRUPUR
������������������������������� ������������������� �������������*+,-����
���������������������.������������������������������ �����������������������
������ ����������������������������� ������ �� �����������������������������
�� ���������� ��� ����������� ����������������� �����������������������/������
���������������������� �� ���������������������� ����*+0-�����������������
�������� ���� ������� �
�� ������� ������������� ������������������������������������������� ��������
����������1!$��������������������� ��#���������������������������� ��������
����� ���������������������������������������������� ����
5.3.55.3.55.3.55.3.55.3.5 Industry and Production ProcessesIndustry and Production ProcessesIndustry and Production ProcessesIndustry and Production ProcessesIndustry and Production ProcessesThere are six production processes involved in the manufacture of knitted
garments:
Knitting: Knitting is the first step, in which, the fabric is made from yarn. Theoutput is in the form of a hose.
Scouring: The knitted fabrics are scoured in a bleaching or dyeing unit by boilingwith caustic soda in open tanks. The fabric is then washed in freshwater.
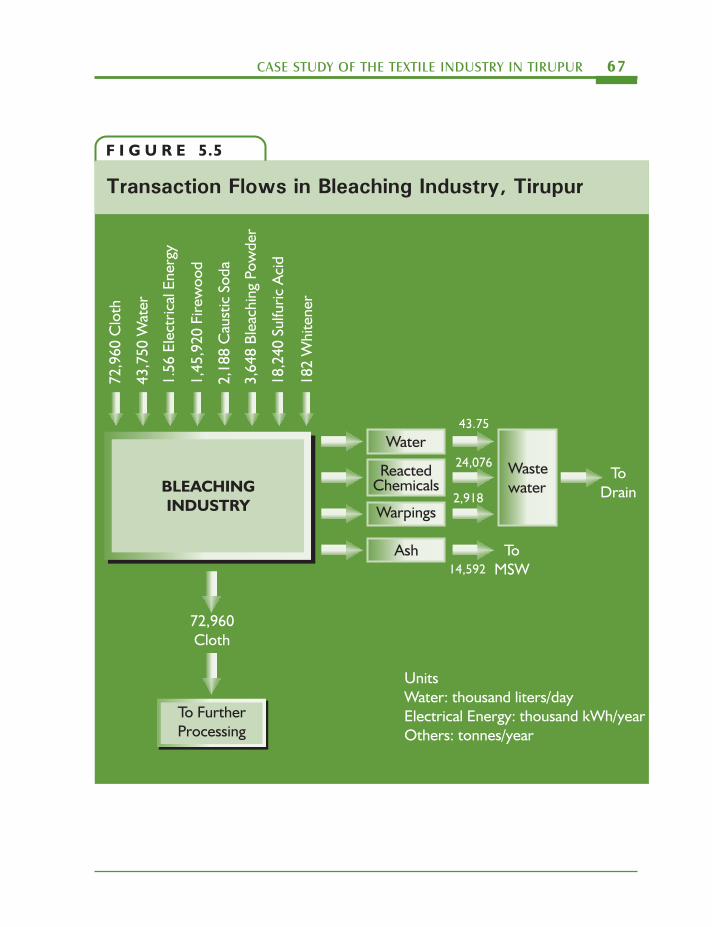
Bleaching: Figure 5.2 gives the process chart of the bleaching operation. Bleachingis done manually, or mechanically in a winch.
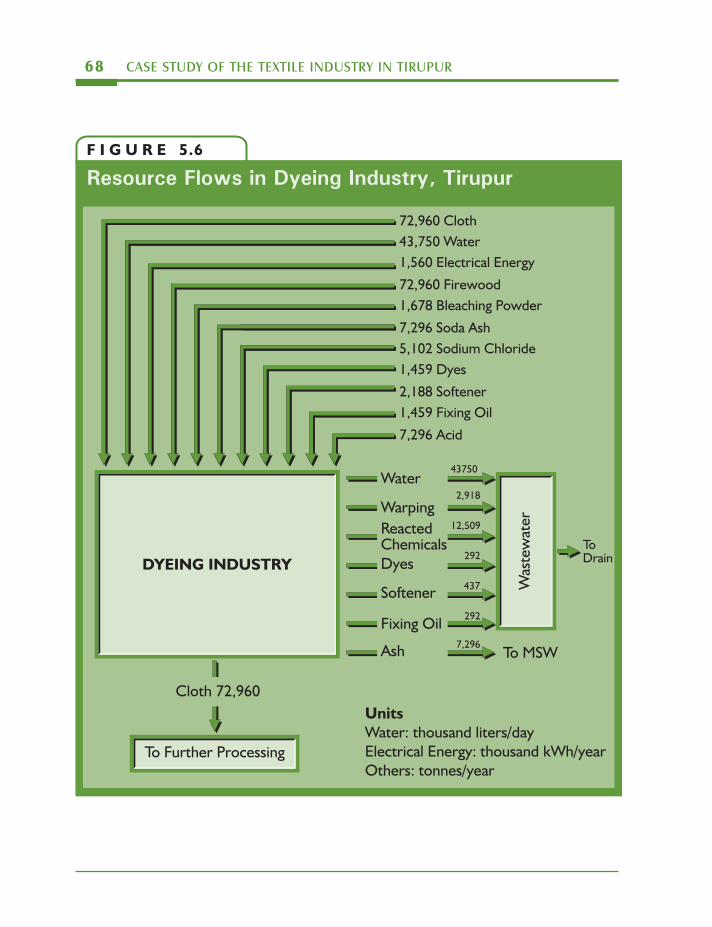
Dyeing: Figure 5.2 gives the details of the dyeing process.
Calendering: After bleaching/dyeing, the fabric is passed through steam heatedrollers in the steam calendering machines.
Finishing: After calendering, the fabric is ready to be made into garments in thefinishing units. These units use electrically operated stitching machines and electricirons. Some of the processes like embroidery require sophisticated computercontrolled machines.

CASE STUDY OF THE TEXTILE INDUSTRY IN TIRUPUR 53
F I G U R E 5.2
KerningPeroxideBleaching
WashingHot Washing
BleachingWashing
WashingAcid Washing
Acid WashingWashing
Grey
Hosiery
Grey
Hosiery
Bleaching
Powder
Hydrogen
Peroxide
The Bleaching and Dyeing Processes
Soap Washing
Rinsing
Dyeing
Steaming
Washing
Washing
Acid Washing
Grey
Hosiery
Washing
Hand
Bleached
Hosiery
PeroxideBleachedHosiery
Washing
Fixing &Softening
Dyed
Hosiery
54 CASE STUDY OF THE TEXTILE INDUSTRY IN TIRUPUR
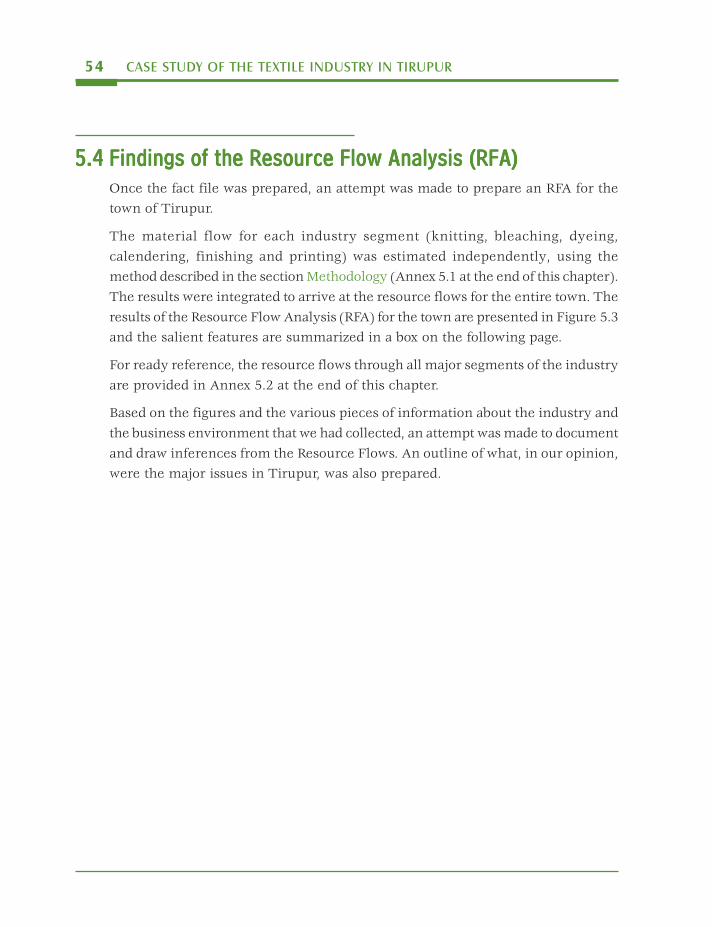
5.45.45.45.45.4 Findings of the Resource Flow Analysis (RFA)Findings of the Resource Flow Analysis (RFA)Findings of the Resource Flow Analysis (RFA)Findings of the Resource Flow Analysis (RFA)Findings of the Resource Flow Analysis (RFA)Once the fact file was prepared, an attempt was made to prepare an RFA for thetown of Tirupur.
The material flow for each industry segment (knitting, bleaching, dyeing,calendering, finishing and printing) was estimated independently, using themethod described in the section Methodology (Annex 5.1 at the end of this chapter).The results were integrated to arrive at the resource flows for the entire town. Theresults of the Resource Flow Analysis (RFA) for the town are presented in Figure 5.3and the salient features are summarized in a box on the following page.
For ready reference, the resource flows through all major segments of the industryare provided in Annex 5.2 at the end of this chapter.
Based on the figures and the various pieces of information about the industry andthe business environment that we had collected, an attempt was made to documentand draw inferences from the Resource Flows. An outline of what, in our opinion,were the major issues in Tirupur, was also prepared.

CASE STUDY OF THE TEXTILE INDUSTRY IN TIRUPUR 55
F I G U R E 5.3
Resource Flows for Tirupur Town
KNITTING
DYEING
FINISHING
BLEACHING
CALENDERING
PRINTING
Finished Product
160,265 Yarn
90,120 Water
62,530 Electrical Energy
437,760 Firewood
49,862 Chemicals
1,470 Dyes/Inks
160,265 Yarn2,432 Thread
20,250 Packing Material, Paper
3,545 Packing Material, Plastic
Solid Waste
to MSW
Plastic
Cloth
Metal
Waterto Drain
54,492
2,430
25,532
20
87,500
Unused
Resource
Unused
Resource
UnitsElectrical Energy: thousand kWh/year
Water: thousand liters/day
Others: tonnes/year
To
Re-use
121,600 Tonnes of Fabric
608 Million Pieces/Year
56 CASE STUDY OF THE TEXTILE INDUSTRY IN TIRUPUR
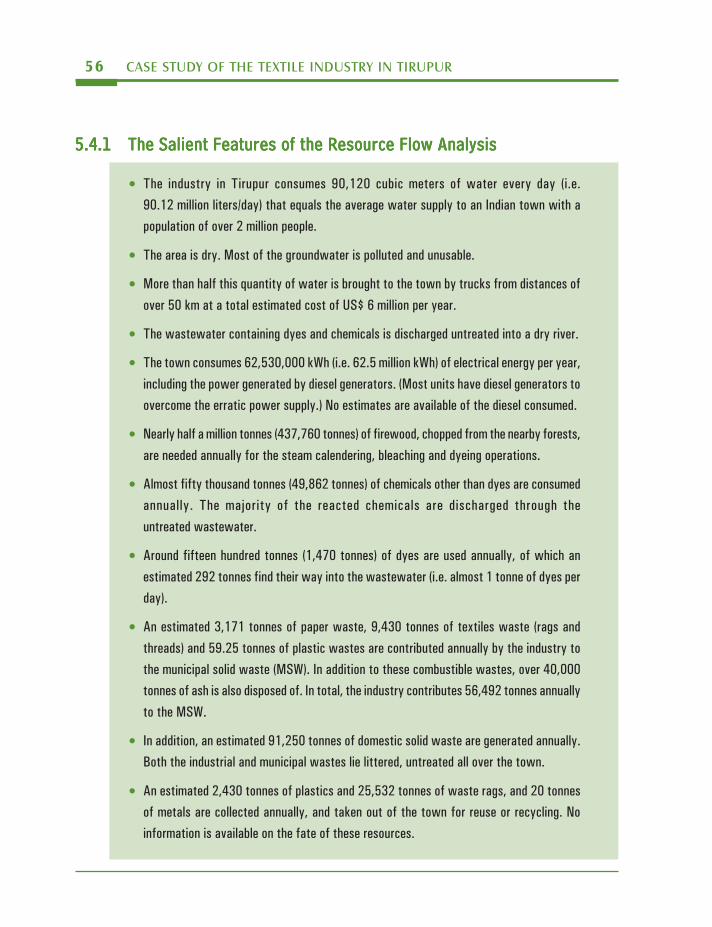
5.4.15.4.15.4.15.4.15.4.1 The Salient Features of the Resource Flow AnalysisThe Salient Features of the Resource Flow AnalysisThe Salient Features of the Resource Flow AnalysisThe Salient Features of the Resource Flow AnalysisThe Salient Features of the Resource Flow Analysis
• ���� ������� �� ������� ������� +-�*2-� ����� ������ ��� ������ ������ ���� ����
+-�*2�� ��� ���3��� ���������� ���������������������� ������������������������
���� �������������2�� ������� ��
• ���������������(������������������������� �������������� ��
• (����������� ������������������������������������������������������������������
�����4-������������� ����������������567�8�� ������������
• ������������������������������������� ������������������������������������
• ����������������82�49-�---��.�������82�4�� ����.� ����� ������ �����������������
�� ������������������������������� �������������(��������������� �������������
����������������������������� �� �1���������������� �� ������������ ���������
• 1��� ���� ����� ����������:9,�,8-������ �������������������������������������������
���������������� ����������������� ���������� ��������������������������
• � ������������������������:+�082������ ���������� ���������������������������
����� ��� ���� ��#����� ��� ���� �������� ������ � ���� ��������� �������� ���
���������;����������
• �����������������������������*�:,-������ ��������������������� �������������
��������2+2�������������������������������������������� ����*�����������������
��� �
• �����������9�*,*����������������������+�:9-������������"� ���������������
������ �����4+�24����������� ����������������������������� ������������������
���������� �� ��������(6. ��������������������������� �������������:-�---
�������������� ������������������� �����������������������48�:+2������������ �
�������(6.�
• ����������������������+*�24-������������������ �������������������������� ��
<�������������� ����������� ������ �� ������������������� ���������������
• �����������2�:9-����������� ��������24�492������������������������2-������
������� ������� ����������� ���������������������������������������������� ����1�
�������������� �� ������������������������������

CASE STUDY OF THE TEXTILE INDUSTRY IN TIRUPUR 57
5.55.55.55.55.5 Major issues in TirupurMajor issues in TirupurMajor issues in TirupurMajor issues in TirupurMajor issues in Tirupur5.5.15.5.15.5.15.5.15.5.1 WaterWaterWaterWaterWater
As is apparent from Figure 5.3, water is a major requirement of the industry.As the area is dry and much of the groundwater is polluted, over half the waterrequired by the industry is brought in by trucks from groundwater sources atdistances of over 50 km. The industry pays around US$ 6 million annually tobring the water by trucks (which amounts to almost US$ 1 per cubic meter againsta much lower price of just US$ 0.05 in many parts of India). In addition, the lureof quick money tempts small farmers who still have access to uncontaminatedgroundwater sources to sell water to the industry instead of using it for farming.
The other half of the water requirement is met from the few bore-wells wherewater is still of good quality. However, the groundwater table is going down rapidlyand even these sources will soon not be available. The industrial effluents aredrained out untreated into a dry river. The effluents accumulate at a reservoir,built originally for irrigation, around 15 km away. A substantial part of the effluentleaches into the ground through its passage to the reservoir. The water is saline,highly colored and contains toxic dyes. The entire agricultural operations in theneighborhood have been badly affected by the groundwater contamination.
Under pressure from the regulatory authorities, it is planned to set up ninetraditional common effluent treatment plants (CETP) at an estimated cost of US$30 million including the cost of piping the effluents. The recurring costs of overUS$ 7.5 million per annum for operation and maintenance would be extra. Thedesign of the CETPs is primarily aimed at reducing the biological and chemicaloxygen demand (BOD and COD) of the effluents. But the effluents after treatmentmay continue to contain toxic chemicals and will also be very saline. Due to this,the post-treatment effluents will not be usable for agriculture or for industry, andobviously not for domestic use also.
5.5.25.5.25.5.25.5.25.5.2 FirewoodFirewoodFirewoodFirewoodFirewoodThe consumption of firewood by the industry is over 437,760 tonnes per year.
The firewood is brought in by the felling of trees from the nearby Nilgiri Hills(part of the Western Ghats mountain range, about 100 km from Tirupur). Thewood cover in the Nilgiri Hills is rapidly depleting. The steam calendering industry

58 CASE STUDY OF THE TEXTILE INDUSTRY IN TIRUPUR
uses over half of this quantity, for steam generation. The bleaching and dyeingindustry uses the rest. The firewood is used in inefficient boilers at 850 differentproduction centers. It would be possible to substantially reduce the consumptionby improving the design of the boilers. A central steam generating system couldalso be considered. Alternatively, a system of substitution of the fuel could beworked out—such as pre-heating with solar energy, substitution with treatedmunicipal waste, etc.
5.5.35.5.35.5.35.5.35.5.3 Solid wasteSolid wasteSolid wasteSolid wasteSolid wasteNearly 40 tonnes of combustible solid waste is generated every day by the
textile industry. This comprises paper and textile scrap (rags and threads). Thishas a high fuel value. In addition, an estimated 250 tonnes per day of municipalwaste is generated by the households.
The possibility of utilizing the fuel value of this waste could also be considered.These industrial and municipal wastes presently lie littered over the town,untreated and unused. Using the heat value of the waste would also help in reducingthe consumption of firewood.
5.65.65.65.65.6 Direct Outcome of the StudyDirect Outcome of the StudyDirect Outcome of the StudyDirect Outcome of the StudyDirect Outcome of the StudyWhen the results were presented to the various industry associations, it came asquite a surprise to them. Till the numbers were aggregated, the magnitude ofresources flowing through the system was not obvious to them. The total pricepaid for the different materials by the industry, as a whole, was also not obvious.Each small industrialist was paying a small amount for buying water every dayand the costs had been internalized into the costing. Hence, the fact that suchlarge quantities of water were being used in the town and given that such largeamounts of money were being spent on water by the industry came as aneye-opener.
Based on the presentation of the results, it was obvious that water recycling couldbe both an economically viable option and a solution to the environmentalproblems, as a first step.
A private entrepreneur came forward to explore the business opportunity thatthis water recycling presented. Initially, the idea was to set up a water factory,

CASE STUDY OF THE TEXTILE INDUSTRY IN TIRUPUR 59
which would take in the effluent from the industry and sell back the recycledpurified water to the manufacturing units. After considerable work, this was notfound to be economically feasible, because the cost of recycling the highly salinewater would be high, as the process would be energy intensive.
As an alternative, the entrepreneur explored the possibility of using the wasteheat from the boilers in the dyeing units to serve as the energy source, to recyclethe wastewater. Development work was immediately started on this and a prototypewas ready in six months. A commercial plant was readied for marketing and itsuse is now proliferating. By the last quarter of the year 2000, over 40 plants hadbeen installed.
Entrepreneurs are also looking at the possibility of setting up central steam unitswith solar preheating as a commercial proposition. This facility may also use thehigh heat value of the municipal solid waste in the town.
Local entrepreneurs are looking at the possibility of using the municipal solidwaste as a source of fuel to replace firewood as the waste has a high calorificvalue.
For the time being, pollution prevention and cleaner production approaches, suchas cultivating colored cotton, natural dyes, and water minimisation, have not beenconsidered as immediate solutions. Although promising, these approaches arevery unlikely to be adopted on a large scale by the industry in the near future. Indeveloping countries like India, where both agriculture and industry tend to becarried out by fragmented small players, there is a great reluctance to try newmethods which often require substantial capital investment and may be risky,even more so in the context of increasing competition from neighboring countries.
5.6.15.6.15.6.15.6.15.6.1 Perspectives for Business and PlanningPerspectives for Business and PlanningPerspectives for Business and PlanningPerspectives for Business and PlanningPerspectives for Business and PlanningAs it is today, the Tirupur industrial system is obviously not sustainable. It is
characterized by heavy pollution, misuse and depletion of critical resources likeland/soil, firewood and water. High flows of materials passing rapidly through thesystem and absence of materials loops makes this industrial cluster a good exampleof a typical unsustainable ecosystem. Unfortunately, as mentioned above, theproposed end-of-pipe (CETP) approach is not likely to improve the situation in
60 CASE STUDY OF THE TEXTILE INDUSTRY IN TIRUPUR
the near future. On the other hand, the RFA study of Tirupur quickly pointed tonew, simple and effective solutions.
In the perspective of Industrial Ecology, planners could play a crucial role inpreventing potential disasters. RFA studies of different activity groups, aggregatedto provide an overall picture of material flows in a region, would allow planners toconsider promotion of industries in specific sectors that would optimize the use ofcritical resources, and guide the development of a region towards sustainability.

CASE STUDY OF THE TEXTILE INDUSTRY IN TIRUPUR 61
Annex 5.1Annex 5.1Annex 5.1Annex 5.1Annex 5.1
Methodology Adopted for the Assessment of Methodology Adopted for the Assessment of Methodology Adopted for the Assessment of Methodology Adopted for the Assessment of Methodology Adopted for the Assessment of ResourceResourceResourceResourceResource Flow Flow Flow Flow FlowsssssThe study team collected the data between January and June 1996.
The exercise of data collection was quite a challenge as reliable data was not easily available.
Potential Sources of DataPotential Sources of DataPotential Sources of DataPotential Sources of DataPotential Sources of DataThe IndustryThe industry in the town is made up of 4000 small and medium companies, most of which areowner managed. Although the owners have a high degree of specialized professional skill, theyare mostly traditional, resisting new ideas. Competition is intense and secrecy is of paramountimportance. The owners are often not keen on discussing details of their processes, materialconsumption, waste volumes or their sales and production figures. The recent crackdown bythe Pollution Control authorities and the resultant spate of litigation, have made the industrymore suspicious of any data collection being carried out.
Industry AssociationsThe industry is organized into twelve different industry associations, which represent specificactivity segments. For example, there is a Bleachers’ Association where all the bleaching unitsare members. There is substantial cross membership as many manufacturers are involved inmore than one activity. The main role of the associations seems to be to represent the viewpointof the members to different Government departments. Data availability with the associations isminimal.
Government AgenciesConsolidated data on the materials and energy consumption by the industries was not availablewith any of the various Government agencies, which monitor the industries. Some of the agencieslike the Apparel Export Promotion Council and the Sales Tax Administration had data of totalmoney value of sales but not the quantities.
The AssessmentNone of these sources would be able to give the team the data that were required. A newapproach was essential to collect the quantitative data so necessary to prepare an RFA. Veryaccurate data were not essential at this stage to get a broad understanding of resource flows, andreasonable estimations were adequate at least for the team to assess the order of magnitude ofthe different resources. Based on their relative importance, a more accurate assessment couldbe made for a few selected resources, if necessary.

62 CASE STUDY OF THE TEXTILE INDUSTRY IN TIRUPUR
The basis of the method chosen was to break down the entire industrial activity into six industrysegments: knitting, bleaching, dyeing, calendering, finishing and printing. Within each segment,it was noted that the processes used by the different units were similar. Hence since eachsegment was homogeneous, it would be possible to select a few sample units in each segment,make assessments and extrapolate the results over the entire segment.
Each of the segments was taken up for specific analysis, so that an assessment of the materialflows could be made for each individual segment.
At the first level, it was required to make an assessment of the total production quantities. Thiswas achieved by taking the aggregate sales value and dividing it by the average price of a made-up garment sold. This gave the number of pieces sold. This estimation was done separately forexports and domestic sales, as there is a wide price variation. The number of pieces sold wasmultiplied by the average weight of a garment to arrive at the total tonnage produced. Thefigures were tallied with the total sales of yarn in the town. The figures concerning yarn, wereassessed by taking a mean of trade reports and the sales value, as given by the tax administration.The assumptions on price and weight per garment were calculated on the basis of interviewswith a number of industry experts. Details of the total production of the Tirupur Textile Industryare given in Table 5.3.
Table 5.3: Total Production of the Tirupur Textile Industry (1995)Table 5.3: Total Production of the Tirupur Textile Industry (1995)
Total garments exported 358 million pieces (71,600 tonnes)
Domestic sales 250 million pieces (50,000 tonnes)
Total yarn/fabric processed 160,265 tonnes
Process losses 24.12%
Total tonnage of fabric manufactured 121,600 tonnes
ProductionProduction Number of UnitsNumber of Units
Once the total tonnage was estimated, it was necessary to establish the process flow. That is,the processes the material has to go through from the stage of the yarn to the finished garment.The typical sequence is knitting, bleaching/dyeing, steam calendering, finishing, and printing.A finished garment must go through the complete sequence. That is, if the total quantity producedin Tirupur is known, it may be assumed that the entire quantity has passed through the entiresequence of operations except the dyeing/bleaching operations. It was assumed that only 50%of all the garments produced is dyed. The balance is sold as white and is just bleached.
The next stage was to make an assessment of the consumption and flow of materials and energyin each operation. The basis of the method was to establish material consumption norms for
CASE STUDY OF THE TEXTILE INDUSTRY IN TIRUPUR 63
each operation, which could be extrapolated over the entire industry segment. For example, ifthe consumption of sodium chloride per kilogram of fabric dyed is known and the total fabricdyed in Tirupur is estimated, the total consumption of sodium chloride in Tirupur could beeasily calculated. As mentioned earlier, this method was suitable for Tirupur, because, withineach industry segment, the technology and methods adopted are largely uniform.
To arrive at the norms for extrapolation, the following steps were followed:
• 6��� ������������ ����������������������������������������������� ����� �� �
�����������������
• ������������������������������������������������������� ������������ ������
������������������������� ������������������ ��� ��������������
• $�������������������������������������� �������� ������
• =������ ������ ������������� ���������������������� �'������� ������ ���������
����������������������� ����
• �������������������������������������"���������������������������������������
��������
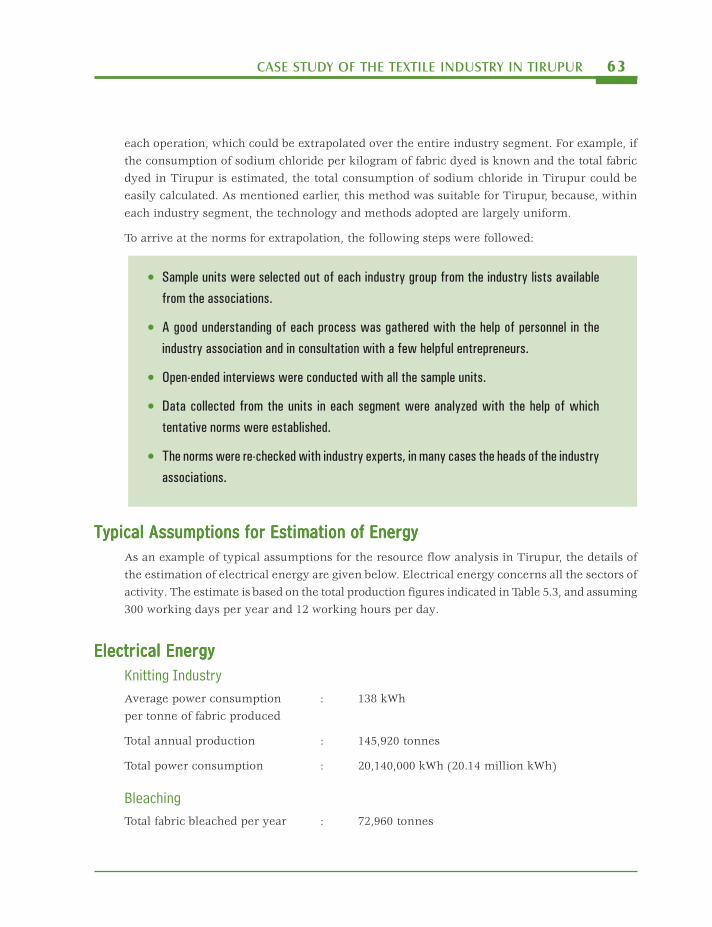
Typical Assumptions for Estimation of EnergyTypical Assumptions for Estimation of EnergyTypical Assumptions for Estimation of EnergyTypical Assumptions for Estimation of EnergyTypical Assumptions for Estimation of EnergyAs an example of typical assumptions for the resource flow analysis in Tirupur, the details ofthe estimation of electrical energy are given below. Electrical energy concerns all the sectors ofactivity. The estimate is based on the total production figures indicated in Table 5.3, and assuming300 working days per year and 12 working hours per day.
Electrical EnergyElectrical EnergyElectrical EnergyElectrical EnergyElectrical EnergyKnitting IndustryAverage power consumption : 138 kWhper tonne of fabric produced
Total annual production : 145,920 tonnes
Total power consumption : 20,140,000 kWh (20.14 million kWh)
BleachingTotal fabric bleached per year : 72,960 tonnes

64 CASE STUDY OF THE TEXTILE INDUSTRY IN TIRUPUR
Fabric bleached by machine : 58,368 tonnes (assuming 80% of total fabric bleachedby machine, and 20% hand bleached which does notneed any power)
Power consumption per tonne : 26.78 kWhof fabric bleached
Consumption per year : 1,560,000 kWh (1.56 million kWh)
Dyeing : Exactly the same consumption as the bleachingindustry
Note: The original estimates were done for all the wet processes together as is usually estimated by thePollution Control Board in Tirupur and the quantities divided between the bleaching and the dyeing sectors.Splitting this between bleaching and dyeing is difficult in Tirupur as many of the small units have facilitiesfor dyeing and bleaching and change their activities depending on the needs of business. It is very difficultand time consuming to follow a more elaborate methodology for estimating the split between the dyeing and
the bleaching unit. However, the overall aggregated industry figures have been cross-checked.
CalenderingAverage consumption per tonne : 35.8 kWh
Total fabric calendered : 145,920 tonnes
Total annual consumption : 5,230,000 (5.23 million kWh)
Finishing : Cutting, Stitching + Ironing
Cutting & StitchingTotal production : 608 million pieces
Average consumption : 12.78 kWhper 1,000 pieces
Total annual consumption : 7,780,000 kWh (7.78 million kWh)
Pressing/IroningTotal production : 608 million pieces
Consumption per 1,000 pieces : 43.19 kWh
Total annual consumption : 26,260,000 kWh (26.26 million kWh)
Total Finishing (stitching + : 34,040,000 kWh (34.04 million kWh)ironing)
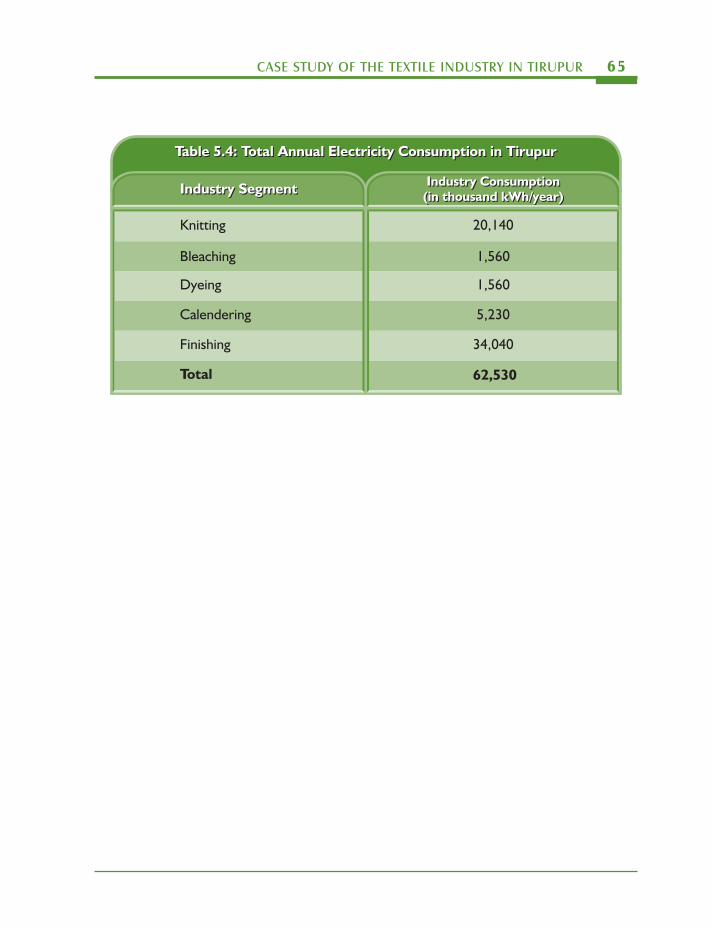
The summary of the total electrical energy consumption estimates is given in Table 5.4.
CASE STUDY OF THE TEXTILE INDUSTRY IN TIRUPUR 65
Table 5.4: Total Annual Electricity Consumption in TirupurTable 5.4: Total Annual Electricity Consumption in Tirupur
Knitting 20,140
Bleaching 1,560
Dyeing 1,560
Finishing
Total
34,040
62,530
Calendering 5,230
Industry SegmentIndustry Segment Industry Consumption(in thousand kWh/year)Industry Consumption
(in thousand kWh/year)

66 CASE STUDY OF THE TEXTILE INDUSTRY IN TIRUPUR
Annex 5.2Annex 5.2Annex 5.2Annex 5.2Annex 5.2
RFA for each Segment of the IndustryRFA for each Segment of the IndustryRFA for each Segment of the IndustryRFA for each Segment of the IndustryRFA for each Segment of the IndustryThe RFA for each segment of the industry in Tirupur are presented in Figures 5.4 to 5.8. Theunits for all the Figures are: electrical energy as million kWh per year, water as thousand litresper day, others as tonnes per year (MSW = Municipal Solid Waste).
No material flow details are provided for the printing industry as the total quantity of printingmaterials used in Tirupur is insignificant, as hardly any printing is done on the T-shirts. Althoughan estimate was prepared, a material flow diagram has not been provided.
F I G U R E 5.4
145,920 of Cloth
End Product
Yarn
160,265
Electrical Energy
20,140
YarnSweepings To MSW
730
2,430
2,430
20
8755
To MSW (paper)
To Re-melt
To Re-use (plastic)
To MSW
Units
Electrical Energy: thousand kWh/year
Others: tonnes/year
Cones
Needles
Jute bags
KNITTINGINDUSTRY
To FurtherProcessing
Resource Flows in Knitting Industry, Tirupur
CASE STUDY OF THE TEXTILE INDUSTRY IN TIRUPUR 67
F I G U R E 5.5
72,960
Cloth
To
Drain
To
MSW
43.75
24,076
2,918
14,592
ReactedChemicals
Water
Waste
water
Warpings
Ash
BLEACHINGINDUSTRY
To Further
Processing
72
,96
0C
loth
43
,75
0W
ater
1.5
6E
lect
rica
lE
nerg
y
1,4
5,9
20
Fir
ew
oo
d
2,1
88
Cau
stic
Sod
a
3,6
48
Ble
achin
gP
ow
der
18
,24
0Su
lfuri
cA
cid
18
2W
hit
ener
Units
Water: thousand liters/day
Electrical Energy: thousand kWh/year
Others: tonnes/year
Transaction Flows in Bleaching Industry, Tirupur
68 CASE STUDY OF THE TEXTILE INDUSTRY IN TIRUPUR
F I G U R E 5.6
Resource Flows in Dyeing Industry, Tirupur
DYEING INDUSTRY
To Further Processing
72,960 Cloth
43,750 Water
1,560 Electrical Energy
72,960 Firewood
1,678 Bleaching Powder
7,296 Soda Ash
2,188 Softener
1,459 Fixing Oil
7,296 Acid
1,459 Dyes
5,102 Sodium Chloride
UnitsWater: thousand liters/day
Electrical Energy: thousand kWh/year
Others: tonnes/year
43750
2,918
12,509
292
437
292
7,296
Was
tew
ater
ToDrain
To MSW
Cloth 72,960
Water
Warping
Water
Dyes
Softener
Fixing Oil
Ash
ReactedChemicals

CASE STUDY OF THE TEXTILE INDUSTRY IN TIRUPUR 69
F I G U R E 5.7
145,920
Cloth
2,630
Water5,230
Electrical Energy
To
MSW
218,880
Firewood
STEAMCALENDERING
INDUSTRY
Units
Water: thousand liters/day
Electrical Energy: thousand kWh/year
Others: tonnes/year
145,920
of Cloth
21,888
To Further
Processing
Ash
Resource Flows in Calendering Industry, Tirupur

70 CASE STUDY OF THE TEXTILE INDUSTRY IN TIRUPUR
F I G U R E 5.8
FINISHING INDUSTRY
Finished Product
Thre
adP
ackin
gP
ackin
gW
aste
145,920 Cloth
34,030 Electrical Energy
2,027 Plastic Bags
20,250 Carton (Cardboard)
709 Rafia Tape
810 Gum Tape
2,432 Thread
Cloth
Cuttings
Resource Flows in Finishing Industry, Tirupur
ToM
SW
Pulping 14,590
10,942
Small Garments
Cotton Waste
To Re-use
UnitsWater: thousand liters/day
Electrical Energy: thousand kWh/year
Others: tonnes/year
Cones
Plastic Covers
Cardboard Box
Plastic Bags
195
7
243
30
Rafia Tape
Gum Tape
11
12
304Carton
Top Related