


Languages
Pages
Legal

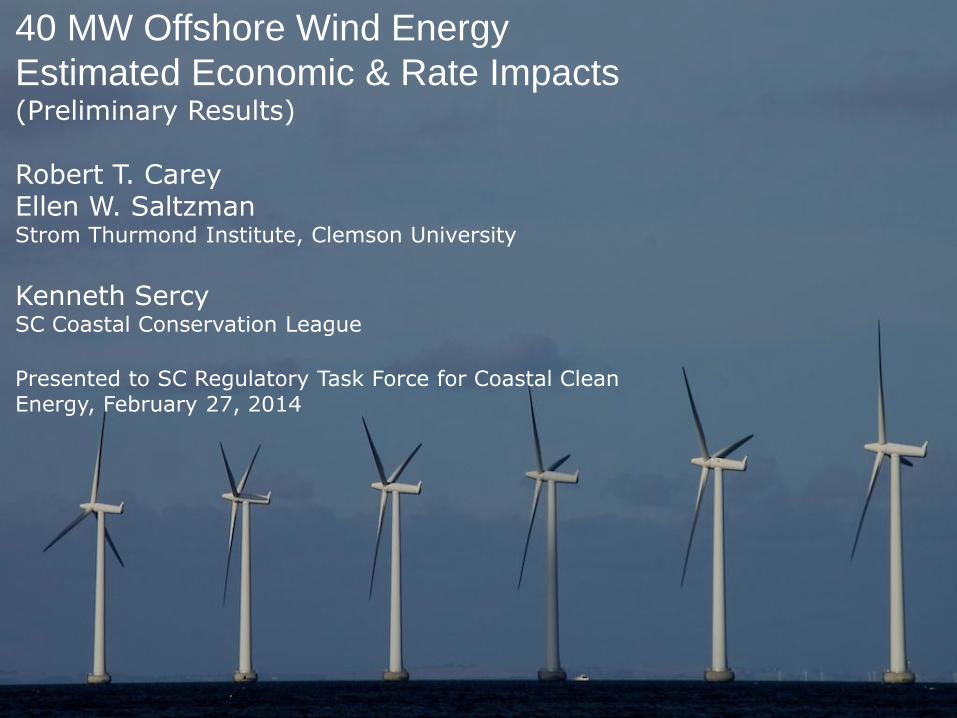
40 MW Offshore Wind Energy
Estimated Economic & Rate Impacts (Preliminary Results) Robert T. Carey Ellen W. Saltzman Strom Thurmond Institute, Clemson University
Kenneth Sercy SC Coastal Conservation League
Presented to SC Regulatory Task Force for Coastal Clean Energy, February 27, 2014

Background
• 2008 - present
– Regulatory Task Force for Coastal Clean Energy (US DOE grant, 2008-)
– Wind Energy Production Farms Feasibility Study Committee established (SC Act 318 of 2008)
• 2010 report to SC General Assembly
– Palmetto Wind Project (SCEO, Santee-Cooper, CURI, Coastal Carolina)
– CURI and USDOE wind turbine drive train testing facility (2009- )
– Offshore Renewable Energy State-Federal Task Force (with US BOEMRE, 2012-)
2/27/2014 2
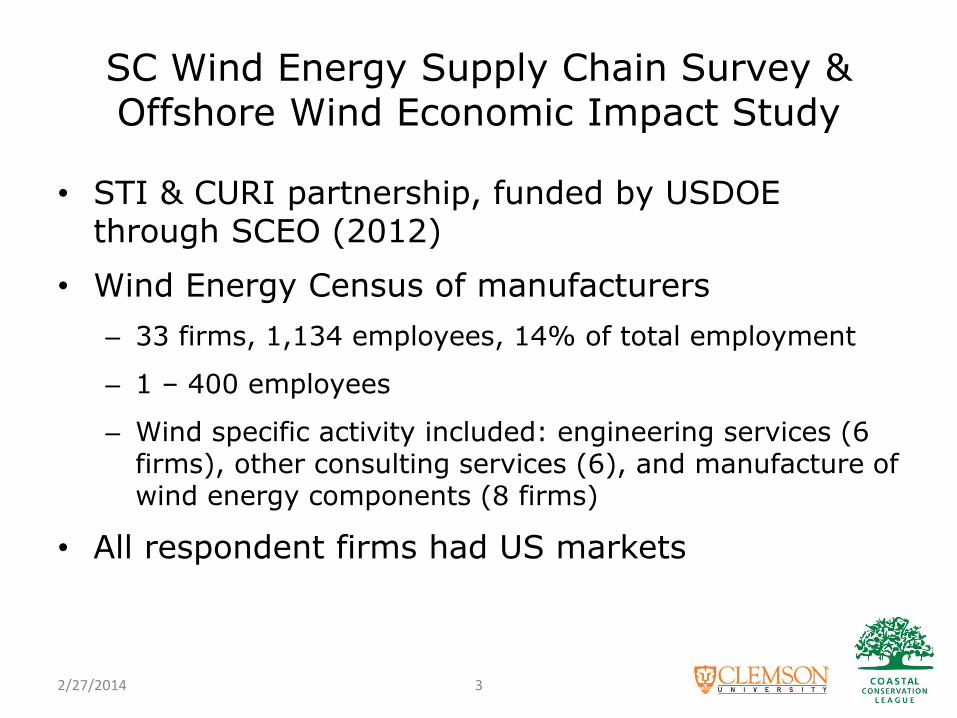
SC Wind Energy Supply Chain Survey & Offshore Wind Economic Impact Study
• STI & CURI partnership, funded by USDOE through SCEO (2012)
• Wind Energy Census of manufacturers
– 33 firms, 1,134 employees, 14% of total employment
– 1 – 400 employees
– Wind specific activity included: engineering services (6 firms), other consulting services (6), and manufacture of wind energy components (8 firms)
• All respondent firms had US markets
2/27/2014 3
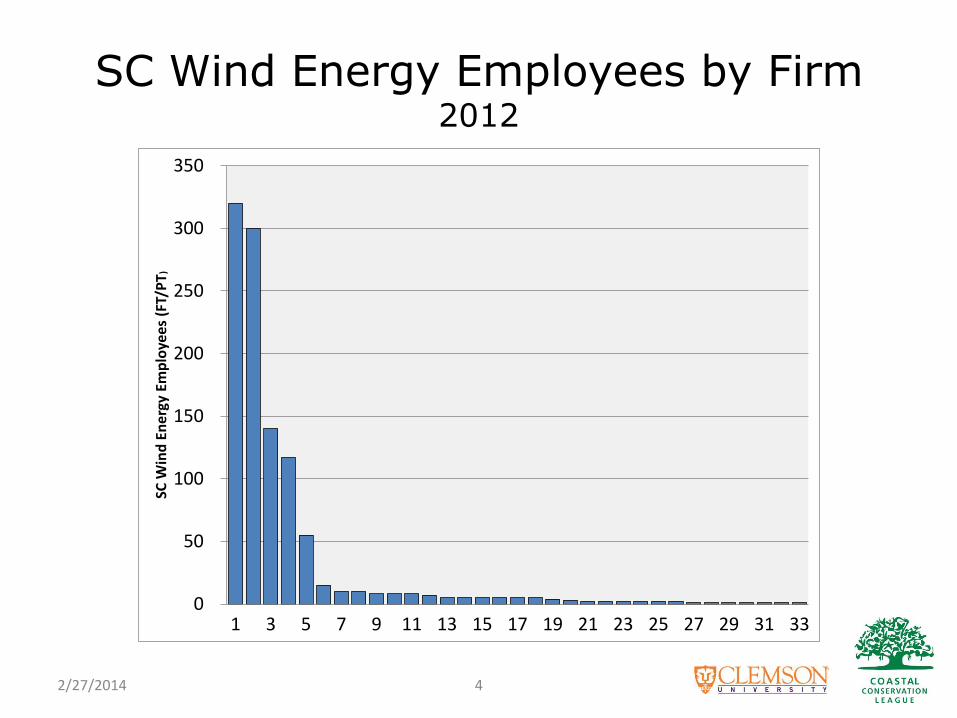
SC Wind Energy Employees by Firm 2012
2/27/2014 4
0
50
100
150
200
250
300
350
1 3 5 7 9 11 13 15 17 19 21 23 25 27 29 31 33
SC W
ind
En
erg
y Em
plo
yee
s (F
T/P
T)

Primary Firm Functions (not limited to wind related)
2/27/2014 5
10
1
4
13
2
19
0 2 4 6 8 10 12 14 16 18 20
Component or Material Supplier
Wind Turbine OEM
Developer
Eng'g Procurement & Construction
Operations & Management
Other
Number of Respondents
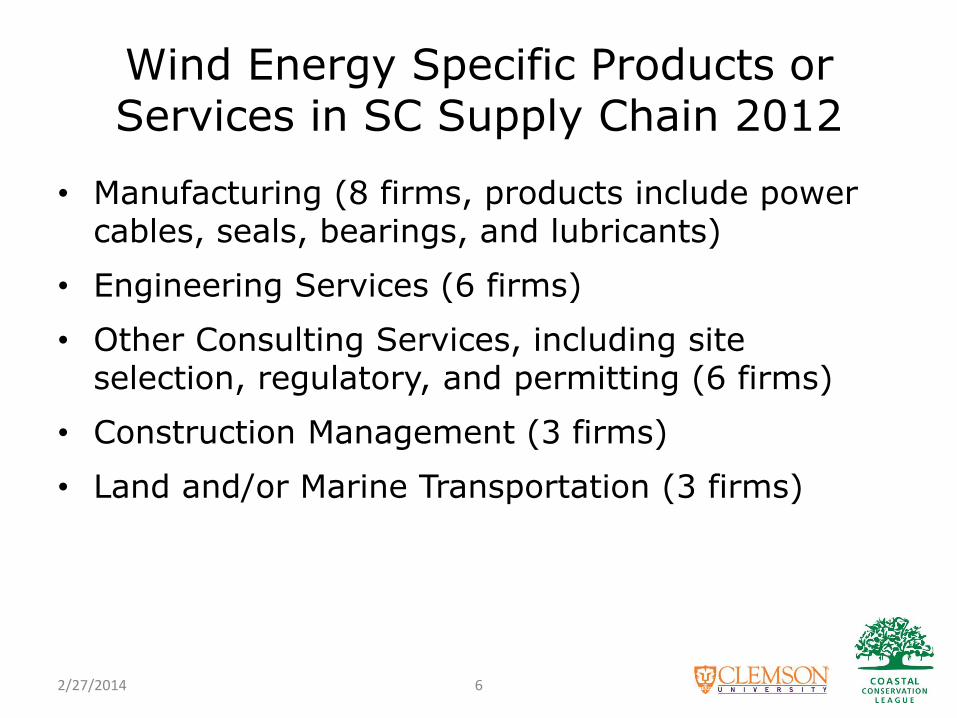
Wind Energy Specific Products or Services in SC Supply Chain 2012
• Manufacturing (8 firms, products include power cables, seals, bearings, and lubricants)
• Engineering Services (6 firms)
• Other Consulting Services, including site selection, regulatory, and permitting (6 firms)
• Construction Management (3 firms)
• Land and/or Marine Transportation (3 firms)
2/27/2014 6

Economic Impact of SC’s Wind Energy Supply Chain (2012)
• 1,134 jobs in wind energy related production or service activities
• 1,797 additional jobs generated through indirect and induced effects for total impact of 2,931 jobs
• $530 million in output in 2012
• $29 million in revenue to state government
• $21 million in revenue to local governments
2/27/2014 7
Phase 2 Purpose & Funding
8
To assess the estimated economic impact of a 40 MW demonstration offshore wind farm on South Carolina, including electric rate impacts.
Funded by the State Energy Office, a division of the South Carolina Budget & Control Board, with a U.S. Department of Energy grant.
2/27/2014

Phase 2 Tasks
1. Estimate economic and fiscal impact of 40 MW to 60 MW offshore wind farm construction and O&M
2. Estimate impact of utility capital recoupment on electricity rates
3. Estimate savings and rate impact from wind offset of electric generation from coal & natural gas
9 2/27/2014

Economic Impact Model
• Estimated impact of demonstration-scale 40 MW wind farm using REMI PI+ model
– I/O & CGE modeling uses inter-industry linkages and interregional trade patterns (New Economic Geography) to estimate economic and fiscal impacts based on user inputs
• Estimated impacts include:
– Direct Effects
– Indirect Effects
– Induced Effects
2/27/2014 10

40 MW Demonstration Offshore Wind Farm
• Construction and O&M cost estimates from
– NREL
– REPP
– Industry sources
• One year for construction (2016)
• 20 years of O&M (2017-2036)
2/27/2014 11
20162017
20182019
20202021
20222023
20242025
20262027
20282029
20302031
20322033
20342035
2036
Installation
O&M
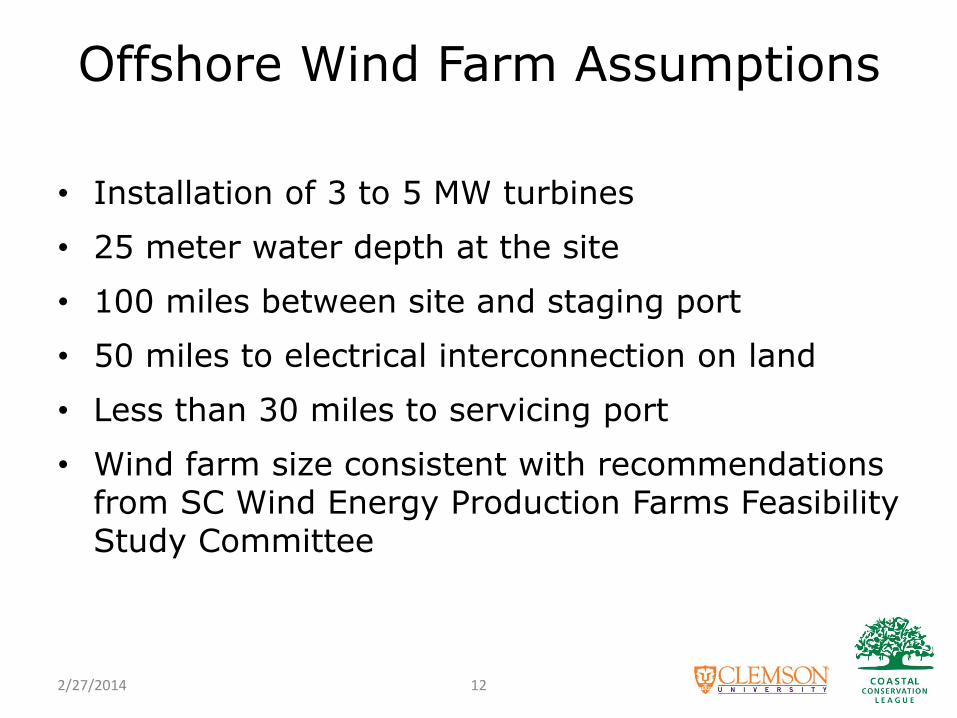
Offshore Wind Farm Assumptions
• Installation of 3 to 5 MW turbines
• 25 meter water depth at the site
• 100 miles between site and staging port
• 50 miles to electrical interconnection on land
• Less than 30 miles to servicing port
• Wind farm size consistent with recommendations from SC Wind Energy Production Farms Feasibility Study Committee
2/27/2014 12
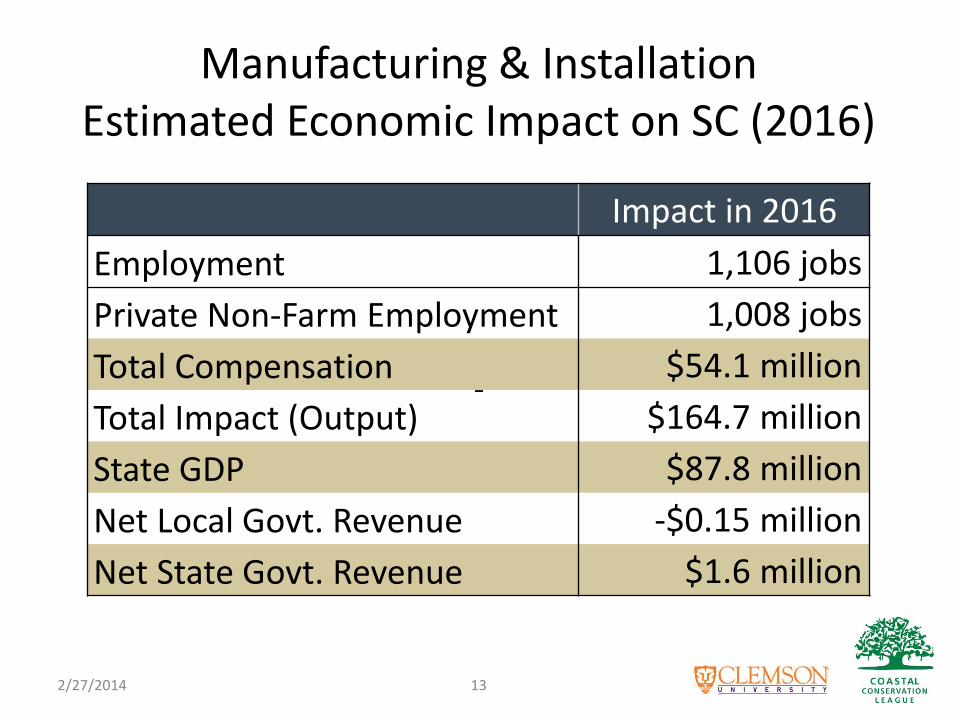
Impact in 2016
Employment 1,106 jobs
Private Non-Farm Employment 1,008 jobs
Total Compensation $54.1 million
Total Impact (Output) $164.7 million
State GDP $87.8 million
Net Local Govt. Revenue -$0.15 million
Net State Govt. Revenue $1.6 million
Manufacturing & Installation Estimated Economic Impact on SC (2016)
2/27/2014 13

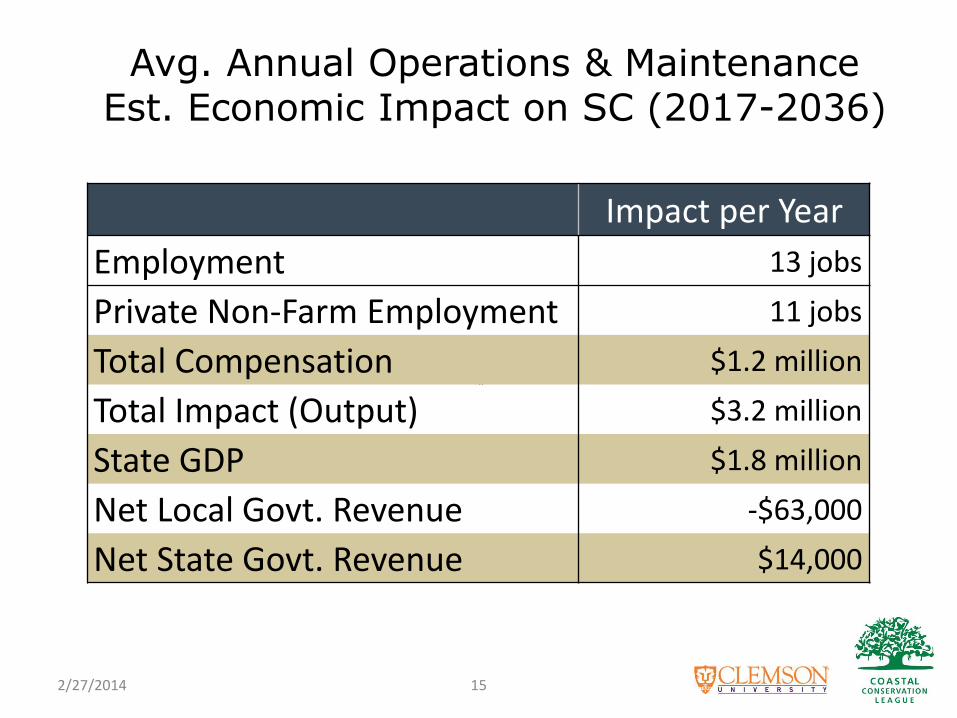
Impact per Year
Employment 13 jobs
Private Non-Farm Employment 11 jobs
Total Compensation $1.2 million
Total Impact (Output) $3.2 million
State GDP $1.8 million
Net Local Govt. Revenue -$63,000
Net State Govt. Revenue $14,000
Avg. Annual Operations & Maintenance Est. Economic Impact on SC (2017-2036)
14 2/27/2014
Impact per Year
Employment 13 jobs
Private Non-Farm Employment 11 jobs
Total Compensation $1.2 million
Total Impact (Output) $3.2 million
State GDP $1.8 million
Net Local Govt. Revenue -$63,000
Net State Govt. Revenue $14,000
Avg. Annual Operations & Maintenance Est. Economic Impact on SC (2017-2036)
2/27/2014 15

-200
0
200
400
600
800
1,000
1,200
20
15
20
16
20
17
20
18
20
19
20
20
20
21
20
22
20
23
20
24
20
25
20
26
20
27
20
28
20
29
20
30
20
31
20
32
20
33
20
34
20
35
20
36
Job
sEstimated Impact on Employment
2/27/2014 16

$0
$20
$40
$60
$80
$100
$120
$140
$160
$180
20
15
20
16
20
17
20
18
20
19
20
20
20
21
20
22
20
23
20
24
20
25
20
26
20
27
20
28
20
29
20
30
20
31
20
32
20
33
20
34
20
35
20
36
Mill
ion
s o
f 2
01
2 D
olla
rsEstimated Economic Impact
Total Compensation State GDP Output
2/27/2014 17
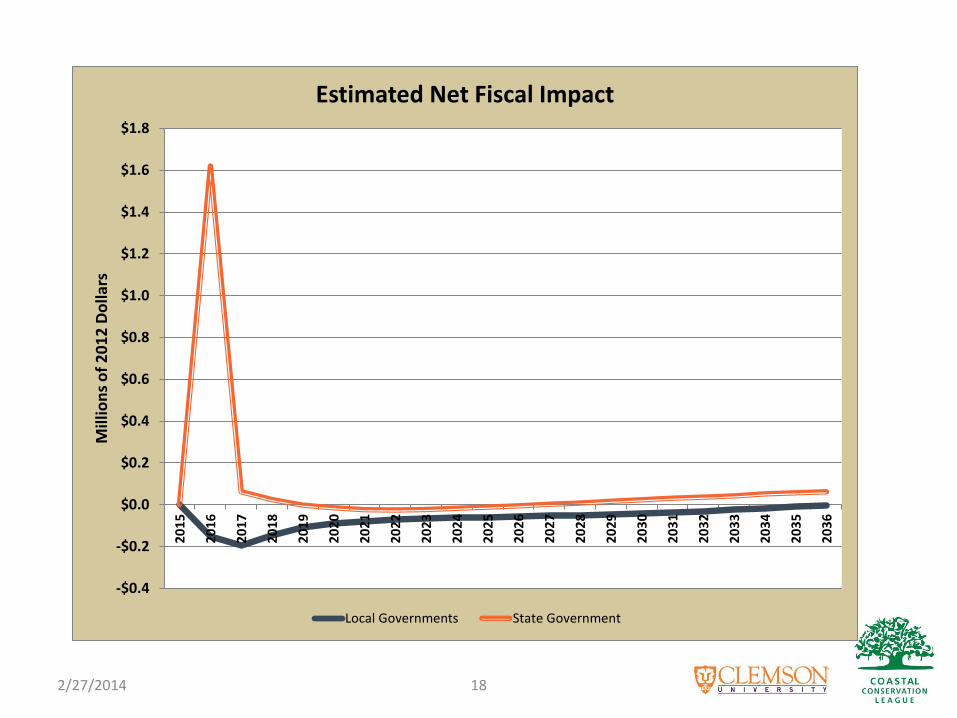
-$0.4
-$0.2
$0.0
$0.2
$0.4
$0.6
$0.8
$1.0
$1.2
$1.4
$1.6
$1.8
20
15
20
16
20
17
20
18
20
19
20
20
20
21
20
22
20
23
20
24
20
25
20
26
20
27
20
28
20
29
20
30
20
31
20
32
20
33
20
34
20
35
20
36
Mill
ion
s o
f 2
01
2 D
olla
rsEstimated Net Fiscal Impact
Local Governments State Government
2/27/2014 18
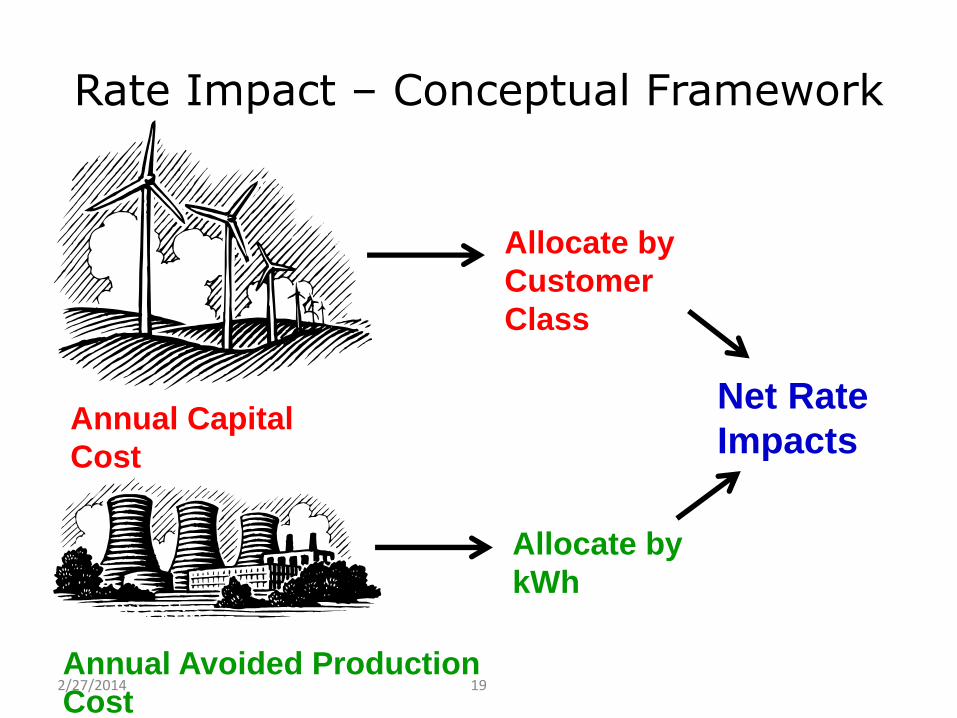
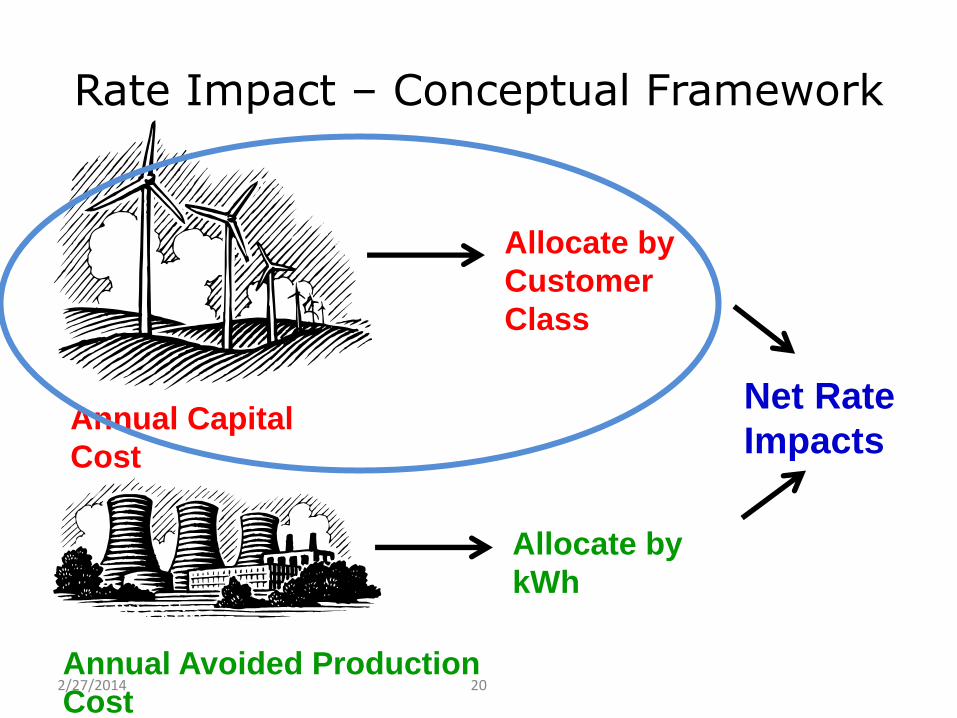
Rate Impact – Conceptual Framework
Annual Capital
Cost
Annual Avoided Production
Cost
Allocate by
Customer
Class
Allocate by
kWh
Net Rate
Impacts
2/27/2014 19
Rate Impact – Conceptual Framework
Annual Capital
Cost
Annual Avoided Production
Cost
Allocate by
Customer
Class
Allocate by
kWh
Net Rate
Impacts
2/27/2014 20

Annual Capital Cost Cost of Renewable Energy Spreadsheet Tool
(CREST; US NREL) Input Value Units
Generator nameplate capacity
40 MW
Project useful life 20 Years
Total installed cost 6,459 $/kW
Fixed O&M cost 66.16 $/kW-yr
Variable O&M cost 0.73 cents/kWh
Annual O&M cost inflation 2 % per year
Blended after-tax WACC 6.11 % per year
Federal incentives None --
State incentives None --
Depreciation Straight-line --
2/27/2014 21

Annual Capital Cost Example (CREST Model)
2/27/2014 22

0%
10%
20%
30%
40%
50%
60%
70%
80%
90%
100%
1 2 3 4 5 6 7 8 9 10 11 12 13 14 15 16 17 18 19 20
Year of Project Capital Recovery and Operation
40 MW OSW Capital and O&M Costs ($33.3 million/yr)
Capital Recovery O&M Costs
O&M share increases over time

Rate Impact – Conceptual Framework
Annual Capital
Cost
Annual Avoided Production
Cost
Allocate by
Customer
Class
Allocate by
kWh
Net Rate
Impacts
2/27/2014 24

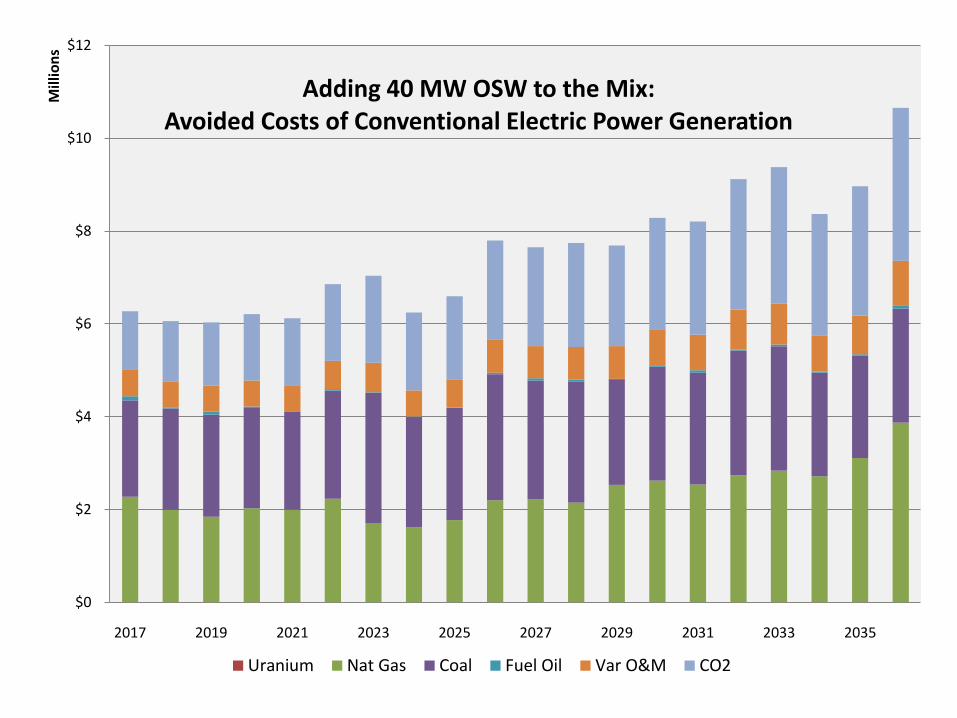
Wind Power Benefits: Conventional Production Costs Avoided
• Fuel purchases
• Other variable O&M
• CO2 emissions allowance costs
2/27/2014 25

How the PC model works: Annual Avoided Production Cost
2/27/2014 26

Annual Avoided Production Cost
• Custom hourly production cost model built by CCL with input from STI
• ‘Representative’ South Carolina utility system based on existing and planned Carolinas generation
• Historical SC load data and SC load growth projections
• Wind output from publicly available AWS Truepower data
• Fuel price projections from US Energy Information Administration
• CO2 allowance price projections based on EIA and SC utility planning documents
2/27/2014 27
$0
$2
$4
$6
$8
$10
$12
2017 2019 2021 2023 2025 2027 2029 2031 2033 2035
Mill
ion
s
Adding 40 MW OSW to the Mix: Avoided Costs of Conventional Electric Power Generation
Uranium Nat Gas Coal Fuel Oil Var O&M CO2
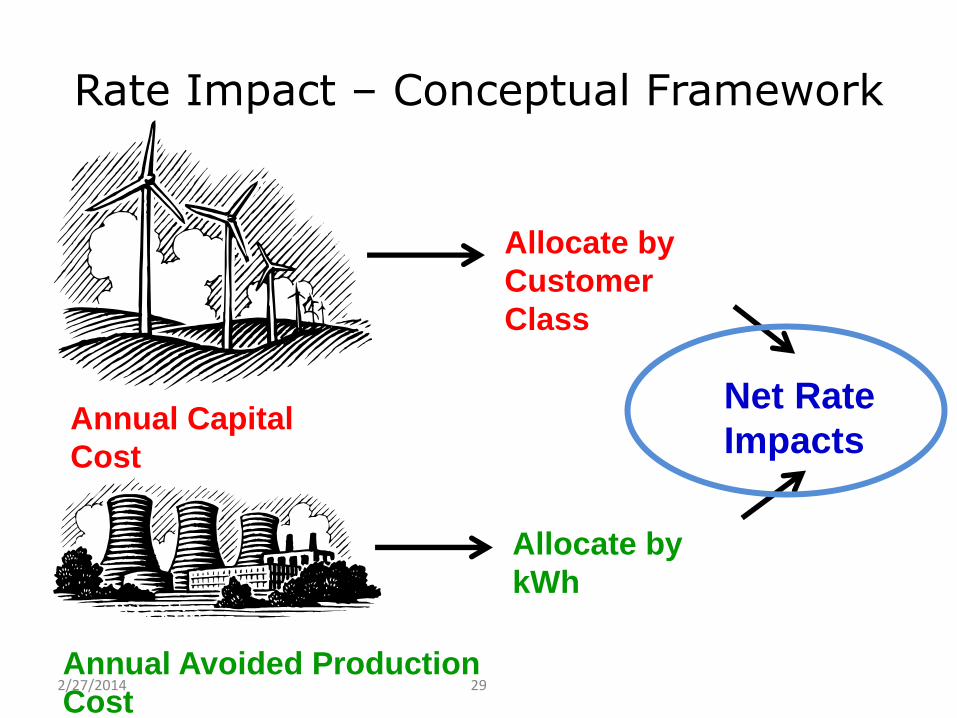
Rate Impact – Conceptual Framework
Annual Capital
Cost
Annual Avoided Production
Cost
Allocate by
Customer
Class
Allocate by
kWh
Net Rate
Impacts
2/27/2014 29
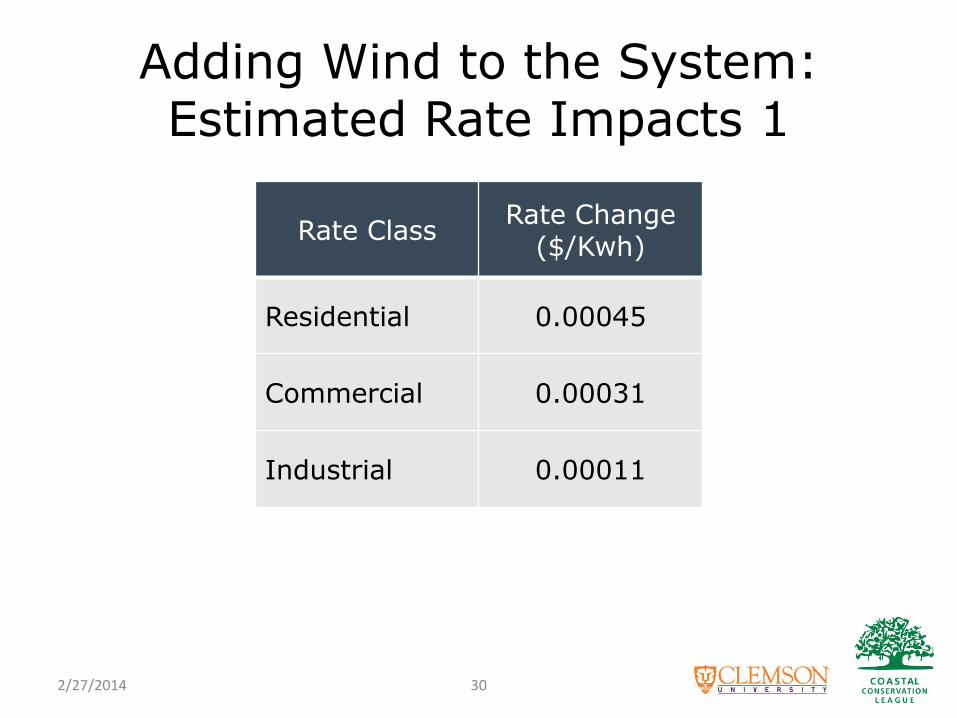
Adding Wind to the System: Estimated Rate Impacts 1
Rate Class Rate Change
($/Kwh)
Residential 0.00045
Commercial 0.00031
Industrial 0.00011
2/27/2014 30

Adding Wind to the System: Estimated Rate Impacts 2
Rate Class
Average Rate/kWh
2011
Average kWh/mo
2012
Avg Monthly
Bill
Monthly Increase
($)
Avg Bill Increase
(%)
Resid. 0.1105 1,119 $123.66 $0.50 0.41%
Comm. 0.0930 5,167 $480.34 $1.60 0.33%
Industrial 0.0594 534,380 $31,742.88 $57.74 0.18%
2/27/2014 31

Offshore Wind Energy in SC?
• SC’s already in the wind energy supply chain.
• The offshore environment is favorable.
• The statewide economic impact is positive.
• The electric rate impact is modest.
2/27/2014 32

The mission of the Coastal Conservation League is to protect the natural environment of the South Carolina coastal plain and to enhance the quality of life of our communities by working with individuals, businesses and governments to ensure balanced solutions. coastalconservationleague.org
The mission of the Strom Thurmond Institute is to provide objective research and outreach in economic and regional development and natural resources; serving business, government and community constituents; and supporting interdisciplinary graduate education. sti.clemson.edu
2/27/2014 33

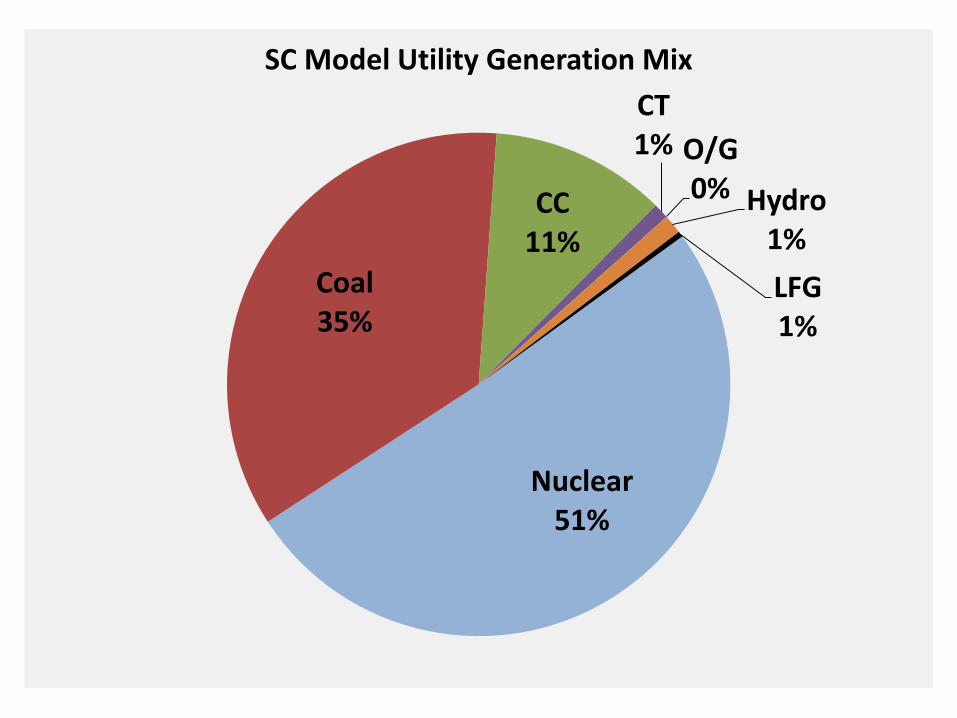
Nuclear51%
Coal35%
CC11%
CT1% O/G
0% Hydro1%
LFG1%
SC Model Utility Generation Mix
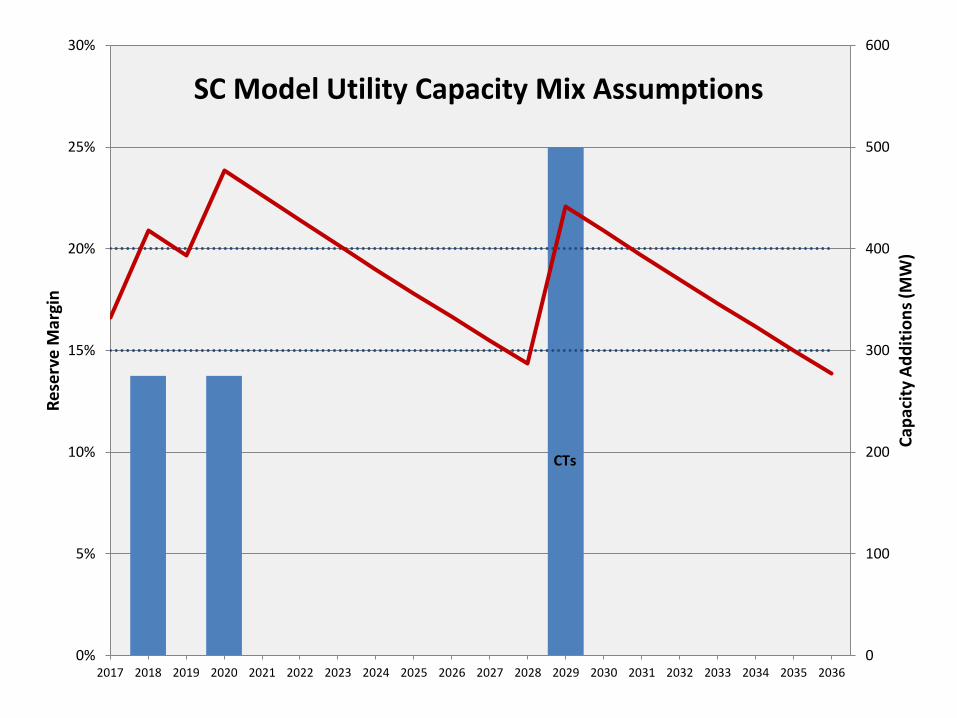
0
100
200
300
400
500
600
0%
5%
10%
15%
20%
25%
30%
2017 2018 2019 2020 2021 2022 2023 2024 2025 2026 2027 2028 2029 2030 2031 2032 2033 2034 2035 2036
Cap
acit
y A
dd
itio
ns
(MW
)
Re
serv
e M
argi
n
SC Model Utility Capacity Mix Assumptions
CTs
Top Related