ZETA-TECH P.O. Box 8407 Cherry Hill, New Jersey 08002
27
ZETA-TECH Associates, Inc. 900 Kings Highway North P.O. Box 8407 Cherry Hill, New Jersey 08002 August 17, 2006 Mr. Jim Gauntt The Railway Tie Association 115 Commerce Drive Suite C Fayetteville, GA 30214 FAX: (770) 460-5573 Dear Jim: Enclosed please find our report “Development of Comparative Cross-Tie Unit Costs and Values”. If you have any questions or comments please give me a call. Respectfully yours, Allan M. Zarembski, Ph.D., P.E. President
Transcript of ZETA-TECH P.O. Box 8407 Cherry Hill, New Jersey 08002
ZETA-TECH Associates, Inc.
900 Kings Highway North P.O. Box 8407
Cherry Hill, New Jersey 08002
August 17, 2006 Mr. Jim Gauntt The Railway Tie Association 115 Commerce Drive Suite C Fayetteville, GA 30214 FAX: (770) 460-5573 Dear Jim:
Enclosed please find our report “Development of Comparative Cross-Tie Unit Costs and Values”.
If you have any questions or comments please give me a call. Respectfully yours, Allan M. Zarembski, Ph.D., P.E. President
Development of Comparative Cross-Tie Unit Costs and Values
August 2006
Prepared for:
Railway Tie Association
by:
ZETA-TECH Associates, Inc. 900 Kings Highway North, Suite 208
Cherry Hill, New Jersey 08034 (856) 779-7795
Fax: (856) 779-7436
www.zetatech.com
Development of Comparative Cross-Tie Unit Costs and Values Introduction
This report presents the results of an analysis of Comparative cross-tie unit costs and values as a function of traffic and service. Specifically, this activity calculated the “value” of wood ties on a cost per ton mile basis as compared to competing tie types to include:
• Concrete • Steel • Plastic
These values were obtained for tangent and curved tracks, separately, as well as for an overall average track determined using an aggregated mix of tangent and curved track, with a distribution reflective of the US national average.
In addition, separate values were obtained for high, medium and low density trackage.
The results presented here-in also reflect the upgrade of the RTA SelecTie model using recently obtained costs and performance based on input from selected US Class 1 railroads. The updated SelecTie model has been submitted under separate cover.
Three distinct approaches were used in this analysis is as follows:
1. Simplified Analysis of Unit Costs
In this analysis, tie material and replacement (labor and equipment) costs were used to calculate a cost per mile of track, based on a full, one time replacement of all of the cross-ties.
2. Tie Replacement Life Cycle Costs
In this analysis, tie material and replacement (labor and equipment) costs were used to calculate a cost per mile of track, based on a 100 year life cycle cost analysis. In this analysis, wood, steel and plastic ties were replaced using conventional tie gangs, based on 25% replacement of ties per cycle. Note, this analysis is not appropriate for concrete ties because of the significant difference in cycles, due to the fact that concrete ties are replaced out of face (100% replacement).
3. Full SelecTie Life Cycle Cost Analysis
Concrete vs. Wood tie analysis was performed using the RTA SelecTie model, where all of the major maintenance activities addressed by the SelecTie model (to include tie replacement, rail replacement, surfacing, grinding, etc.) costs were used to calculate a cost per mile of track, based on a life cycle cost analysis. Maintenance cycles were activity specific
3
based on internal SelecTie life models. Most recent updated costs were used in SelecTie. Note, this analysis was limited to the wood vs. Concrete tie analysis.
It should be noted that because of the difference in time horizons, the actual costs per unit of traffic ($/mile/MGT) differ significantly between the three methods. However the relative ranking and ratio can be used for comparison of wood against the other tie materials.
Tie Lives and Costs
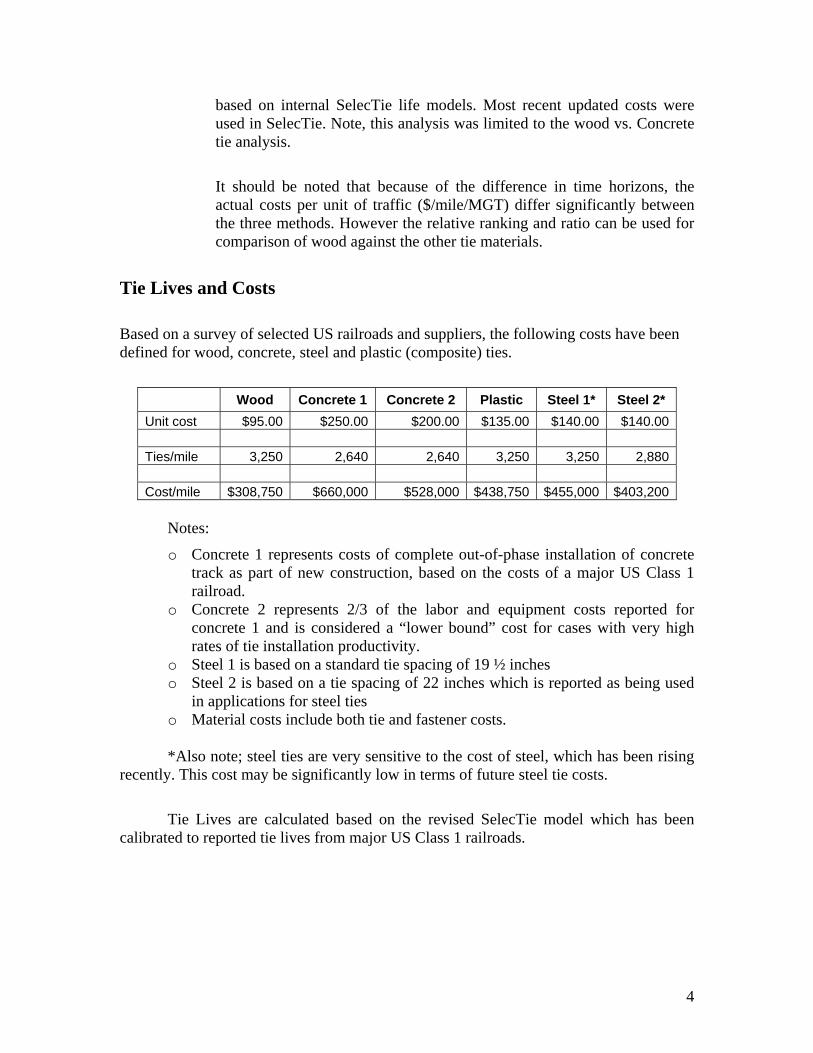
Based on a survey of selected US railroads and suppliers, the following costs have been defined for wood, concrete, steel and plastic (composite) ties.
Wood Concrete 1 Concrete 2 Plastic Steel 1* Steel 2*
Unit cost $95.00 $250.00 $200.00 $135.00 $140.00 $140.00 Ties/mile 3,250 2,640 2,640 3,250 3,250 2,880 Cost/mile $308,750 $660,000 $528,000 $438,750 $455,000 $403,200
Notes:
o Concrete 1 represents costs of complete out-of-phase installation of concrete track as part of new construction, based on the costs of a major US Class 1 railroad.
o Concrete 2 represents 2/3 of the labor and equipment costs reported for concrete 1 and is considered a “lower bound” cost for cases with very high rates of tie installation productivity.
o Steel 1 is based on a standard tie spacing of 19 ½ inches o Steel 2 is based on a tie spacing of 22 inches which is reported as being used
in applications for steel ties o Material costs include both tie and fastener costs. *Also note; steel ties are very sensitive to the cost of steel, which has been rising
recently. This cost may be significantly low in terms of future steel tie costs.
Tie Lives are calculated based on the revised SelecTie model which has been
calibrated to reported tie lives from major US Class 1 railroads.
4
Note: Tie lives are defined for three classes of annual tonnage:
• Low: 10 MGT per year
• Moderate: 25 MGT per year
• High: 50 MGT per year
Tie lives are defined for the following curvature classes:
• Tangent
• Moderate: defined here as 4 degree
A composite curvature value is also calculated based on track that is 80% tangent and 20% curved (to reflect a distribution identified on selected US railway routes)
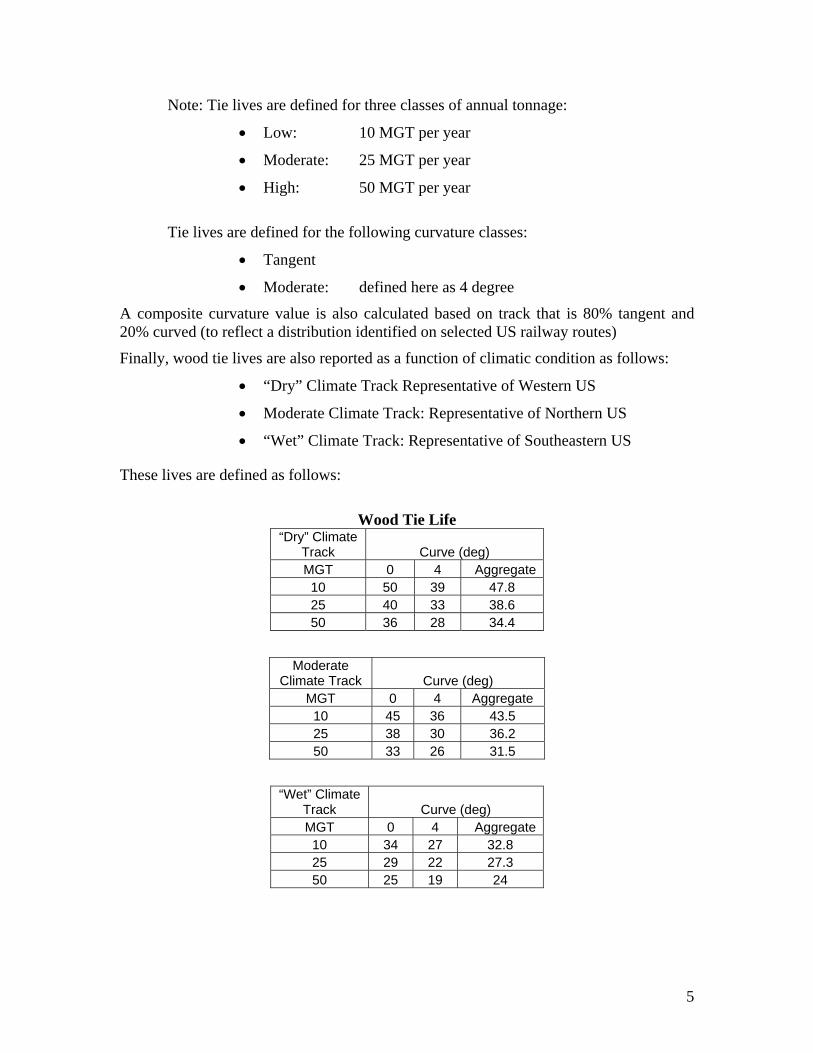
Finally, wood tie lives are also reported as a function of climatic condition as follows:
• “Dry” Climate Track Representative of Western US
• Moderate Climate Track: Representative of Northern US
• “Wet” Climate Track: Representative of Southeastern US
These lives are defined as follows:
Wood Tie Life
“Dry” Climate Track Curve (deg) MGT 0 4 Aggregate10 50 39 47.8 25 40 33 38.6 50 36 28 34.4
Moderate
Climate Track Curve (deg) MGT 0 4 Aggregate
10 45 36 43.5 25 38 30 36.2 50 33 26 31.5
“Wet” Climate
Track Curve (deg) MGT 0 4 Aggregate10 34 27 32.8 25 29 22 27.3 50 25 19 24
5
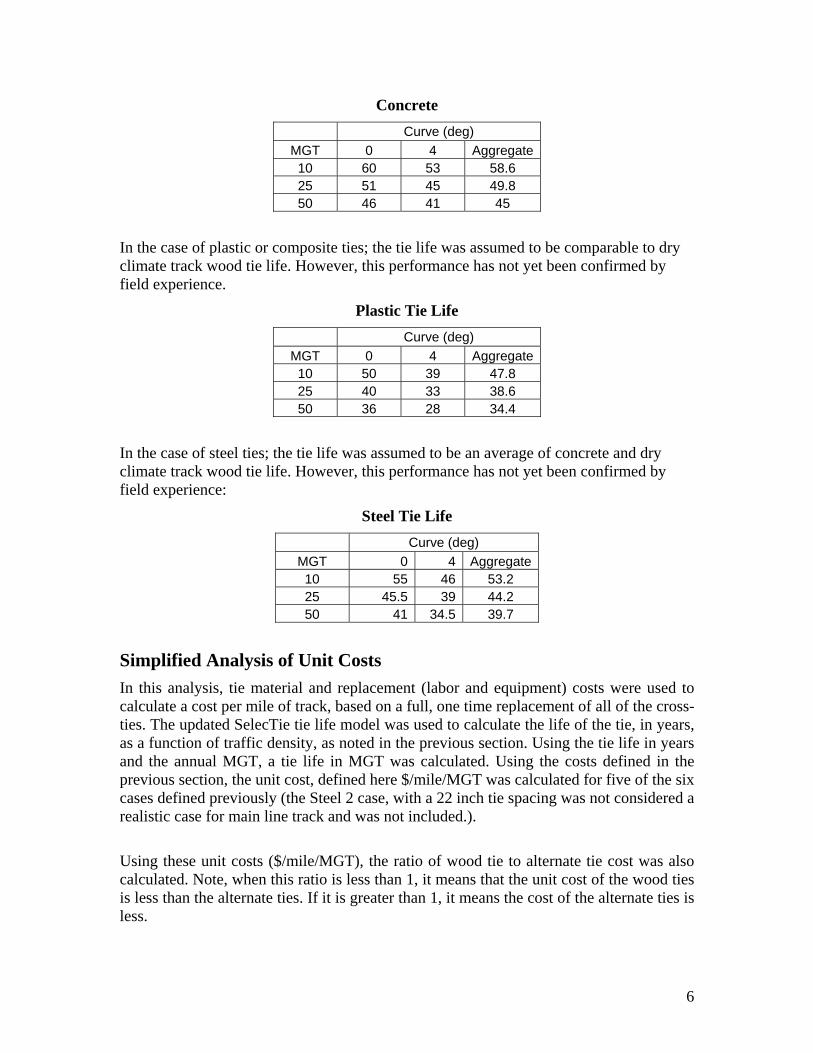
Concrete Curve (deg)
MGT 0 4 Aggregate10 60 53 58.6 25 51 45 49.8 50 46 41 45
In the case of plastic or composite ties; the tie life was assumed to be comparable to dry climate track wood tie life. However, this performance has not yet been confirmed by field experience.
Plastic Tie Life Curve (deg)
MGT 0 4 Aggregate10 50 39 47.8 25 40 33 38.6 50 36 28 34.4
In the case of steel ties; the tie life was assumed to be an average of concrete and dry climate track wood tie life. However, this performance has not yet been confirmed by field experience:
Steel Tie Life Curve (deg)
MGT 0 4 Aggregate10 55 46 53.2 25 45.5 39 44.2 50 41 34.5 39.7
Simplified Analysis of Unit Costs In this analysis, tie material and replacement (labor and equipment) costs were used to calculate a cost per mile of track, based on a full, one time replacement of all of the cross-ties. The updated SelecTie tie life model was used to calculate the life of the tie, in years, as a function of traffic density, as noted in the previous section. Using the tie life in years and the annual MGT, a tie life in MGT was calculated. Using the costs defined in the previous section, the unit cost, defined here $/mile/MGT was calculated for five of the six cases defined previously (the Steel 2 case, with a 22 inch tie spacing was not considered a realistic case for main line track and was not included.).
Using these unit costs ($/mile/MGT), the ratio of wood tie to alternate tie cost was also calculated. Note, when this ratio is less than 1, it means that the unit cost of the wood ties is less than the alternate ties. If it is greater than 1, it means the cost of the alternate ties is less.
6
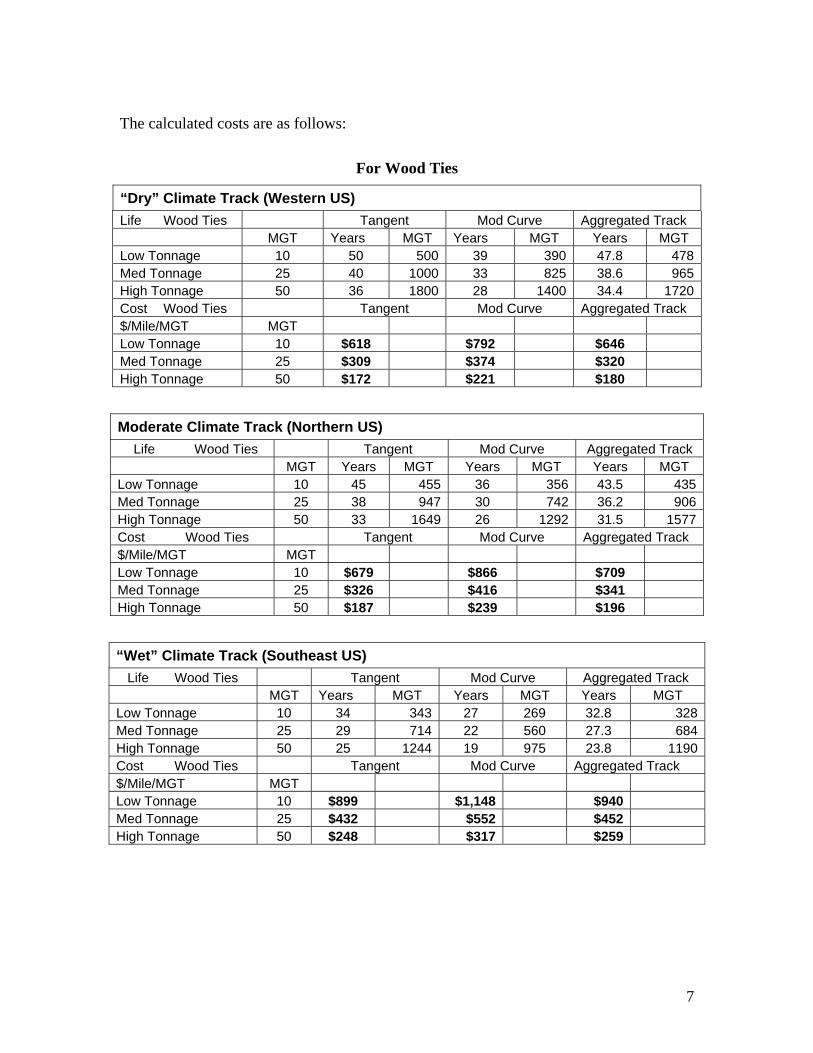
The calculated costs are as follows:
For Wood Ties
“Dry” Climate Track (Western US) Life Wood Ties Tangent Mod Curve Aggregated Track MGT Years MGT Years MGT Years MGT Low Tonnage 10 50 500 39 390 47.8 478Med Tonnage 25 40 1000 33 825 38.6 965High Tonnage 50 36 1800 28 1400 34.4 1720Cost Wood Ties Tangent Mod Curve Aggregated Track $/Mile/MGT MGT Low Tonnage 10 $618 $792 $646 Med Tonnage 25 $309 $374 $320 High Tonnage 50 $172 $221 $180
Moderate Climate Track (Northern US) Life Wood Ties Tangent Mod Curve Aggregated Track
MGT Years MGT Years MGT Years MGT Low Tonnage 10 45 455 36 356 43.5 435Med Tonnage 25 38 947 30 742 36.2 906High Tonnage 50 33 1649 26 1292 31.5 1577Cost Wood Ties Tangent Mod Curve Aggregated Track $/Mile/MGT MGT Low Tonnage 10 $679 $866 $709 Med Tonnage 25 $326 $416 $341 High Tonnage 50 $187 $239 $196
“Wet” Climate Track (Southeast US) Life Wood Ties Tangent Mod Curve Aggregated Track
MGT Years MGT Years MGT Years MGT Low Tonnage 10 34 343 27 269 32.8 328Med Tonnage 25 29 714 22 560 27.3 684High Tonnage 50 25 1244 19 975 23.8 1190Cost Wood Ties Tangent Mod Curve Aggregated Track $/Mile/MGT MGT Low Tonnage 10 $899 $1,148 $940 Med Tonnage 25 $432 $552 $452 High Tonnage 50 $248 $317 $259
7
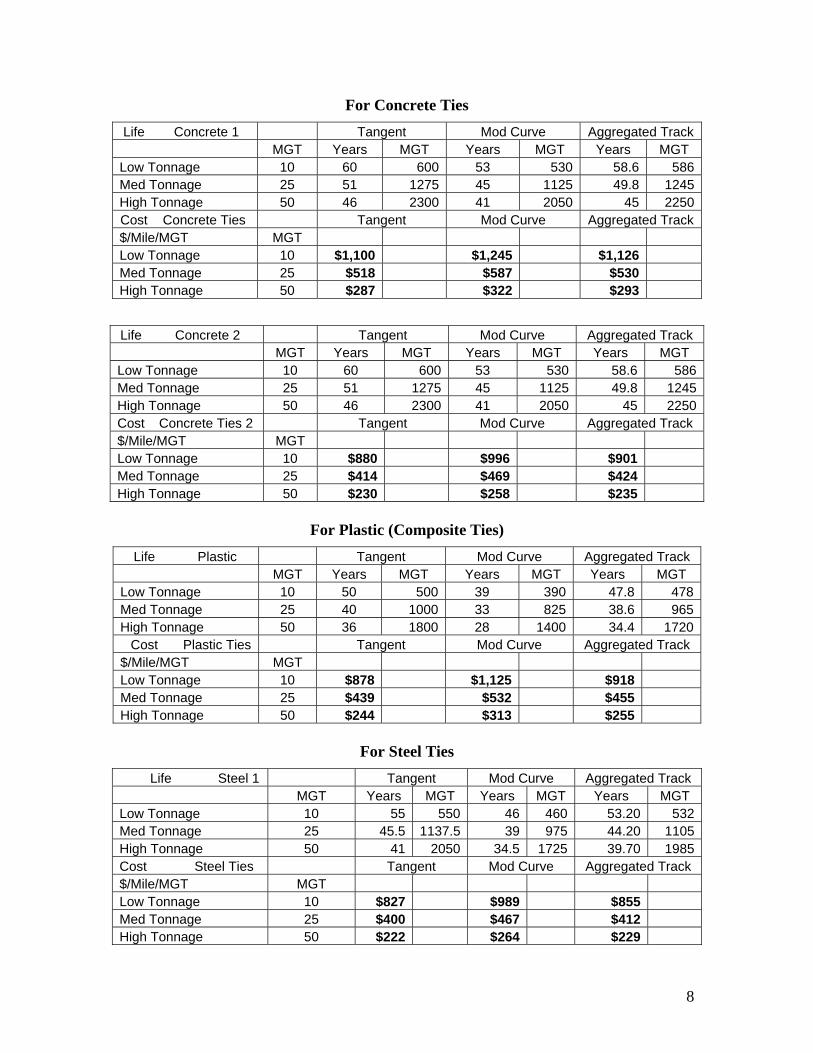
For Concrete Ties Life Concrete 1 Tangent Mod Curve Aggregated Track
MGT Years MGT Years MGT Years MGT Low Tonnage 10 60 600 53 530 58.6 586Med Tonnage 25 51 1275 45 1125 49.8 1245High Tonnage 50 46 2300 41 2050 45 2250Cost Concrete Ties Tangent Mod Curve Aggregated Track $/Mile/MGT MGT Low Tonnage 10 $1,100 $1,245 $1,126 Med Tonnage 25 $518 $587 $530 High Tonnage 50 $287 $322 $293
Life Concrete 2 Tangent Mod Curve Aggregated Track MGT Years MGT Years MGT Years MGT
Low Tonnage 10 60 600 53 530 58.6 586Med Tonnage 25 51 1275 45 1125 49.8 1245High Tonnage 50 46 2300 41 2050 45 2250Cost Concrete Ties 2 Tangent Mod Curve Aggregated Track $/Mile/MGT MGT Low Tonnage 10 $880 $996 $901 Med Tonnage 25 $414 $469 $424 High Tonnage 50 $230 $258 $235
For Plastic (Composite Ties)
Life Plastic Tangent Mod Curve Aggregated Track MGT Years MGT Years MGT Years MGT
Low Tonnage 10 50 500 39 390 47.8 478Med Tonnage 25 40 1000 33 825 38.6 965High Tonnage 50 36 1800 28 1400 34.4 1720
Cost Plastic Ties Tangent Mod Curve Aggregated Track $/Mile/MGT MGT Low Tonnage 10 $878 $1,125 $918 Med Tonnage 25 $439 $532 $455 High Tonnage 50 $244 $313 $255
For Steel Ties
Life Steel 1 Tangent Mod Curve Aggregated Track MGT Years MGT Years MGT Years MGT
Low Tonnage 10 55 550 46 460 53.20 532Med Tonnage 25 45.5 1137.5 39 975 44.20 1105High Tonnage 50 41 2050 34.5 1725 39.70 1985Cost Steel Ties Tangent Mod Curve Aggregated Track $/Mile/MGT MGT Low Tonnage 10 $827 $989 $855 Med Tonnage 25 $400 $467 $412 High Tonnage 50 $222 $264 $229
8
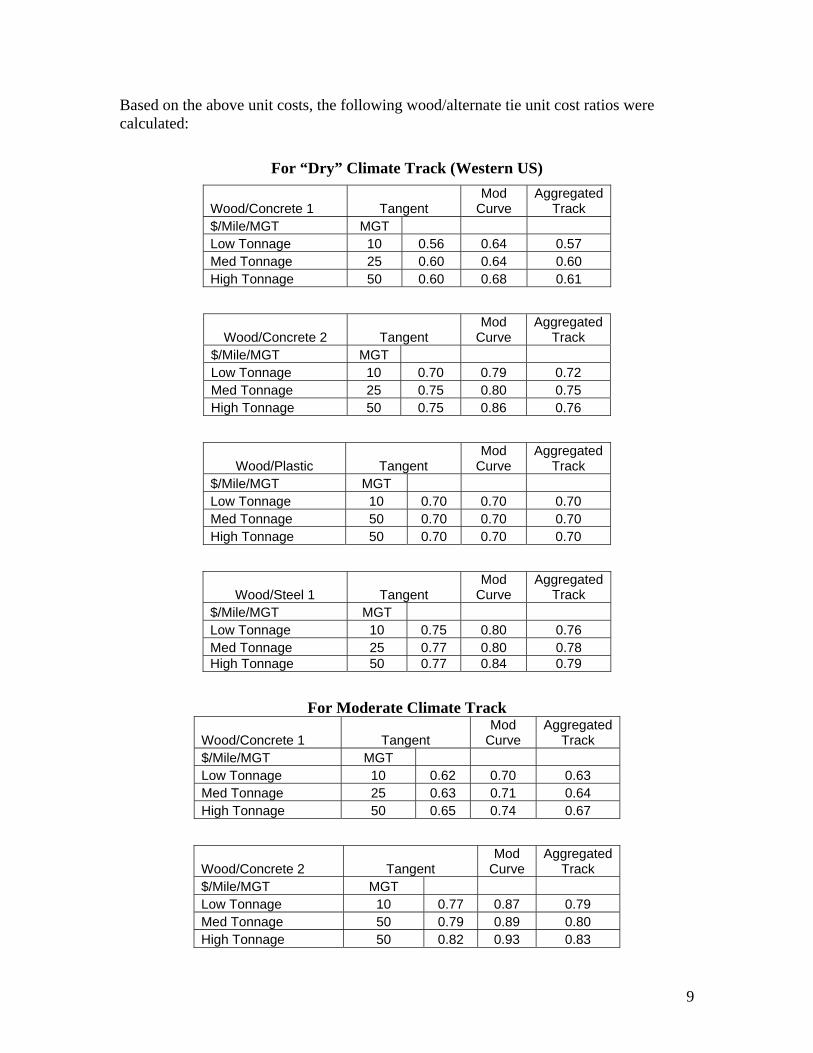
Based on the above unit costs, the following wood/alternate tie unit cost ratios were calculated:
For “Dry” Climate Track (Western US)
Wood/Concrete 1 Tangent Mod
Curve Aggregated
Track $/Mile/MGT MGT Low Tonnage 10 0.56 0.64 0.57 Med Tonnage 25 0.60 0.64 0.60 High Tonnage 50 0.60 0.68 0.61
Wood/Concrete 2 Tangent Mod
Curve Aggregated
Track $/Mile/MGT MGT Low Tonnage 10 0.70 0.79 0.72 Med Tonnage 25 0.75 0.80 0.75 High Tonnage 50 0.75 0.86 0.76
Wood/Plastic Tangent Mod
Curve Aggregated
Track $/Mile/MGT MGT Low Tonnage 10 0.70 0.70 0.70 Med Tonnage 50 0.70 0.70 0.70 High Tonnage 50 0.70 0.70 0.70
Wood/Steel 1 Tangent Mod
Curve Aggregated
Track $/Mile/MGT MGT Low Tonnage 10 0.75 0.80 0.76 Med Tonnage 25 0.77 0.80 0.78 High Tonnage 50 0.77 0.84 0.79
For Moderate Climate Track
Wood/Concrete 1 Tangent Mod
Curve Aggregated
Track $/Mile/MGT MGT Low Tonnage 10 0.62 0.70 0.63 Med Tonnage 25 0.63 0.71 0.64 High Tonnage 50 0.65 0.74 0.67
Wood/Concrete 2 Tangent Mod
Curve Aggregated
Track $/Mile/MGT MGT Low Tonnage 10 0.77 0.87 0.79 Med Tonnage 50 0.79 0.89 0.80 High Tonnage 50 0.82 0.93 0.83
9
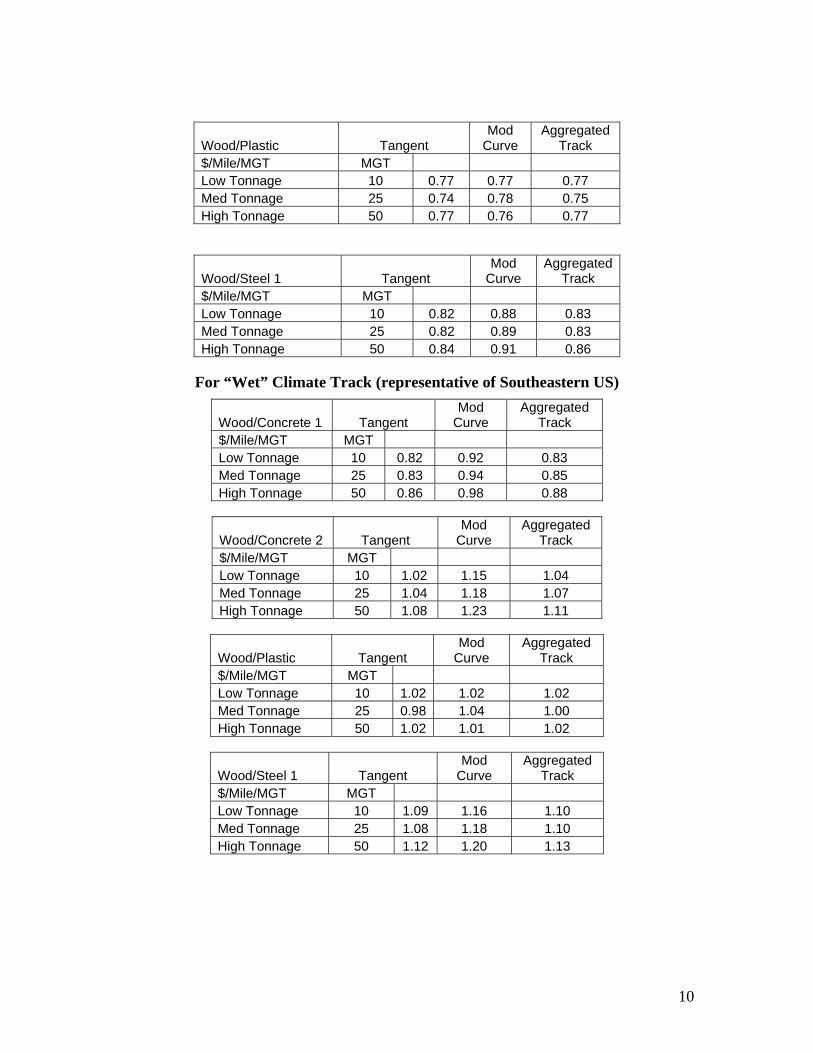
Wood/Plastic Tangent Mod
Curve Aggregated
Track $/Mile/MGT MGT Low Tonnage 10 0.77 0.77 0.77 Med Tonnage 25 0.74 0.78 0.75 High Tonnage 50 0.77 0.76 0.77
Wood/Steel 1 Tangent Mod
Curve Aggregated
Track $/Mile/MGT MGT Low Tonnage 10 0.82 0.88 0.83 Med Tonnage 25 0.82 0.89 0.83 High Tonnage 50 0.84 0.91 0.86
For “Wet” Climate Track (representative of Southeastern US)
Wood/Concrete 1 Tangent Mod
Curve Aggregated
Track $/Mile/MGT MGT Low Tonnage 10 0.82 0.92 0.83 Med Tonnage 25 0.83 0.94 0.85 High Tonnage 50 0.86 0.98 0.88
Wood/Concrete 2 Tangent Mod
Curve Aggregated
Track $/Mile/MGT MGT Low Tonnage 10 1.02 1.15 1.04 Med Tonnage 25 1.04 1.18 1.07 High Tonnage 50 1.08 1.23 1.11
Wood/Plastic Tangent Mod
Curve Aggregated
Track $/Mile/MGT MGT Low Tonnage 10 1.02 1.02 1.02 Med Tonnage 25 0.98 1.04 1.00 High Tonnage 50 1.02 1.01 1.02
Wood/Steel 1 Tangent Mod
Curve Aggregated
Track $/Mile/MGT MGT Low Tonnage 10 1.09 1.16 1.10 Med Tonnage 25 1.08 1.18 1.10 High Tonnage 50 1.12 1.20 1.13
10
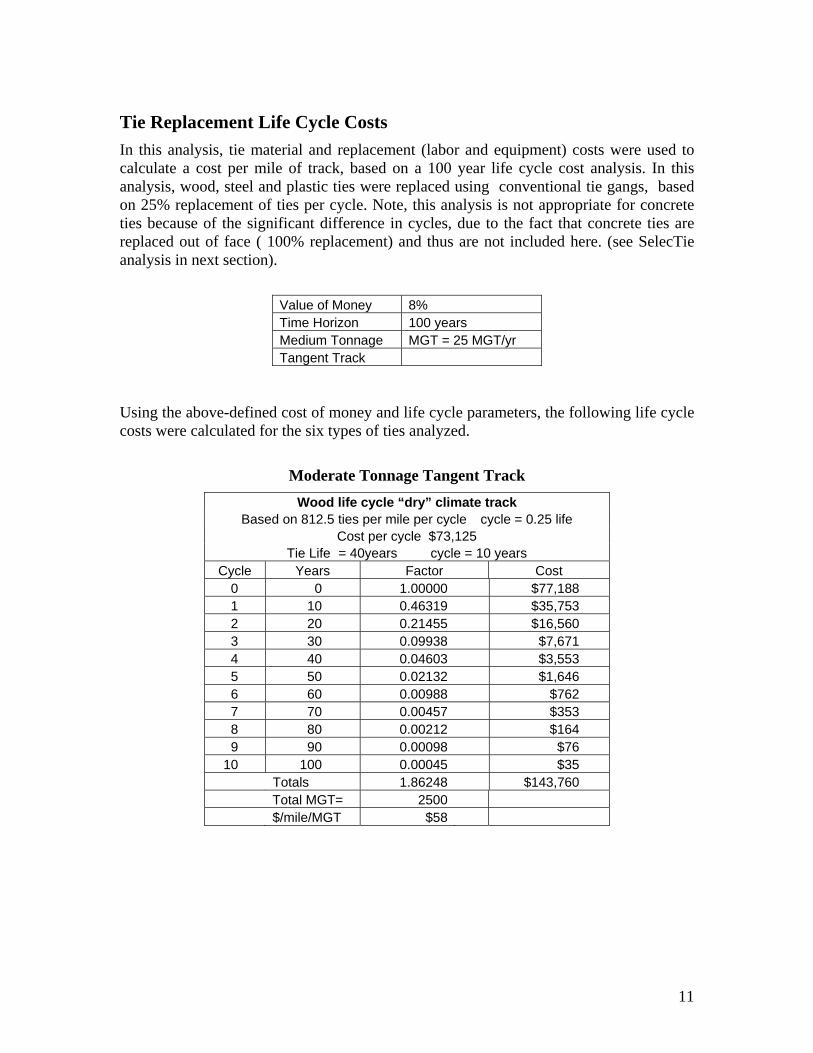
Tie Replacement Life Cycle Costs In this analysis, tie material and replacement (labor and equipment) costs were used to calculate a cost per mile of track, based on a 100 year life cycle cost analysis. In this analysis, wood, steel and plastic ties were replaced using conventional tie gangs, based on 25% replacement of ties per cycle. Note, this analysis is not appropriate for concrete ties because of the significant difference in cycles, due to the fact that concrete ties are replaced out of face ( 100% replacement) and thus are not included here. (see SelecTie analysis in next section).
Value of Money 8% Time Horizon 100 years Medium Tonnage MGT = 25 MGT/yr Tangent Track
Using the above-defined cost of money and life cycle parameters, the following life cycle costs were calculated for the six types of ties analyzed.
Moderate Tonnage Tangent Track
Wood life cycle “dry” climate track Based on 812.5 ties per mile per cycle cycle = 0.25 life
Cost per cycle $73,125 Tie Life = 40years cycle = 10 years
Cycle Years Factor Cost 0 0 1.00000 $77,188 1 10 0.46319 $35,753 2 20 0.21455 $16,560 3 30 0.09938 $7,671 4 40 0.04603 $3,553 5 50 0.02132 $1,646 6 60 0.00988 $762 7 70 0.00457 $353 8 80 0.00212 $164 9 90 0.00098 $76
10 100 0.00045 $35 Totals 1.86248 $143,760 Total MGT= 2500 $/mile/MGT $58
11
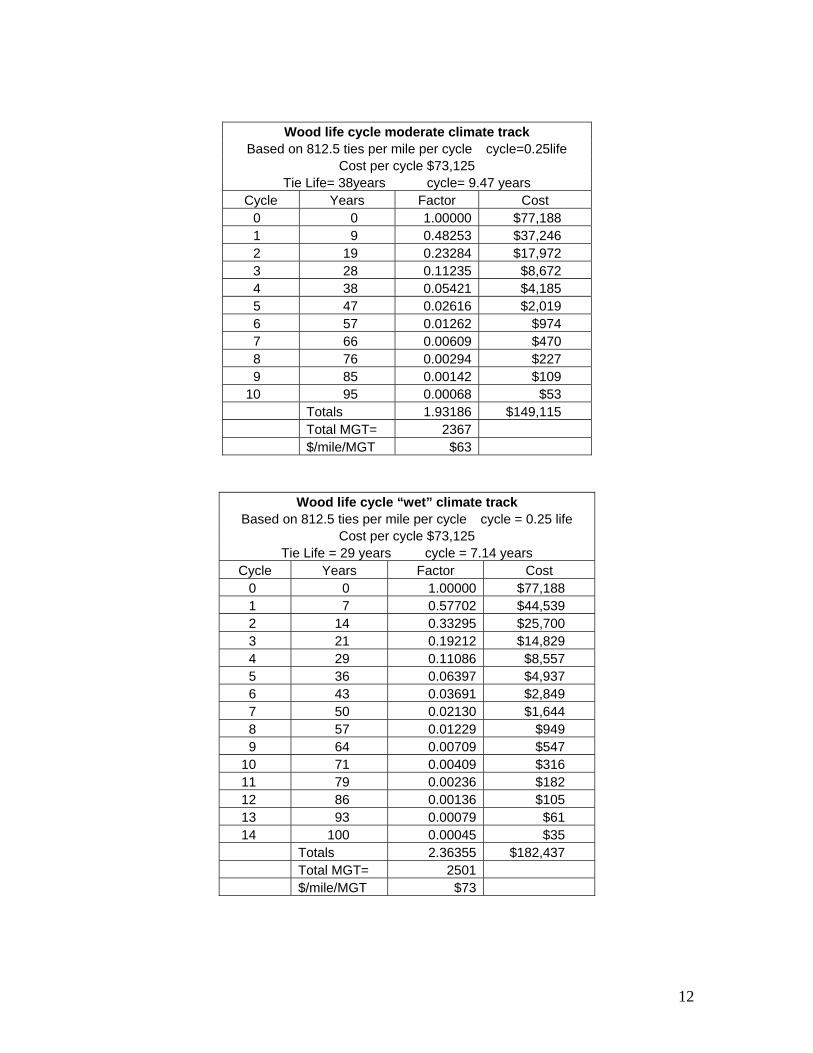
Wood life cycle moderate climate track Based on 812.5 ties per mile per cycle cycle=0.25life
Cost per cycle $73,125 Tie Life= 38years cycle= 9.47 years
Cycle Years Factor Cost 0 0 1.00000 $77,188 1 9 0.48253 $37,246 2 19 0.23284 $17,972 3 28 0.11235 $8,672 4 38 0.05421 $4,185 5 47 0.02616 $2,019 6 57 0.01262 $974 7 66 0.00609 $470 8 76 0.00294 $227 9 85 0.00142 $109
10 95 0.00068 $53 Totals 1.93186 $149,115 Total MGT= 2367 $/mile/MGT $63
Wood life cycle “wet” climate track Based on 812.5 ties per mile per cycle cycle = 0.25 life
Cost per cycle $73,125 Tie Life = 29 years cycle = 7.14 years
Cycle Years Factor Cost 0 0 1.00000 $77,188 1 7 0.57702 $44,539 2 14 0.33295 $25,700 3 21 0.19212 $14,829 4 29 0.11086 $8,557 5 36 0.06397 $4,937 6 43 0.03691 $2,849 7 50 0.02130 $1,644 8 57 0.01229 $949 9 64 0.00709 $547
10 71 0.00409 $316 11 79 0.00236 $182 12 86 0.00136 $105 13 93 0.00079 $61 14 100 0.00045 $35
Totals 2.36355 $182,437 Total MGT= 2501 $/mile/MGT $73
12
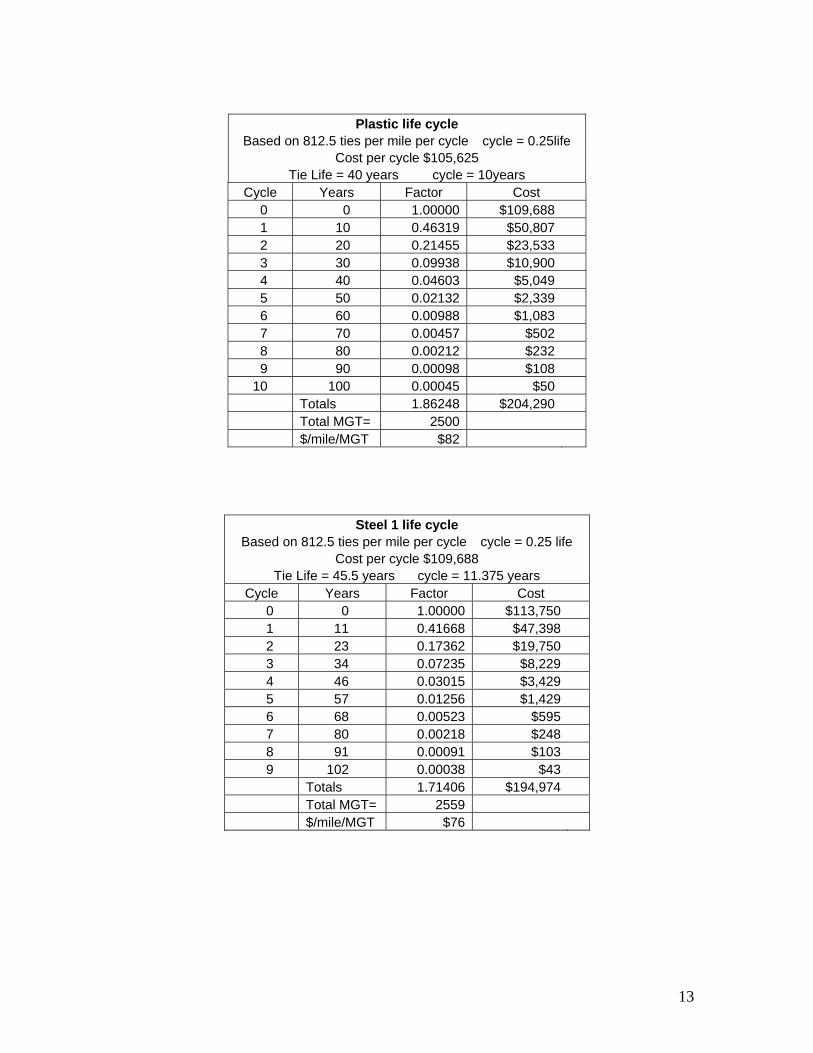
Plastic life cycle
Based on 812.5 ties per mile per cycle cycle = 0.25life Cost per cycle $105,625
Tie Life = 40 years cycle = 10years Cycle Years Factor Cost
0 0 1.00000 $109,688 1 10 0.46319 $50,807 2 20 0.21455 $23,533 3 30 0.09938 $10,900 4 40 0.04603 $5,049 5 50 0.02132 $2,339 6 60 0.00988 $1,083 7 70 0.00457 $502 8 80 0.00212 $232 9 90 0.00098 $108
10 100 0.00045 $50 Totals 1.86248 $204,290 Total MGT= 2500 $/mile/MGT $82
Steel 1 life cycle
Based on 812.5 ties per mile per cycle cycle = 0.25 life Cost per cycle $109,688
Tie Life = 45.5 years cycle = 11.375 years Cycle Years Factor Cost
0 0 1.00000 $113,750 1 11 0.41668 $47,398 2 23 0.17362 $19,750 3 34 0.07235 $8,229 4 46 0.03015 $3,429 5 57 0.01256 $1,429 6 68 0.00523 $595 7 80 0.00218 $248 8 91 0.00091 $103 9 102 0.00038 $43
Totals 1.71406 $194,974 Total MGT= 2559 $/mile/MGT $76
13
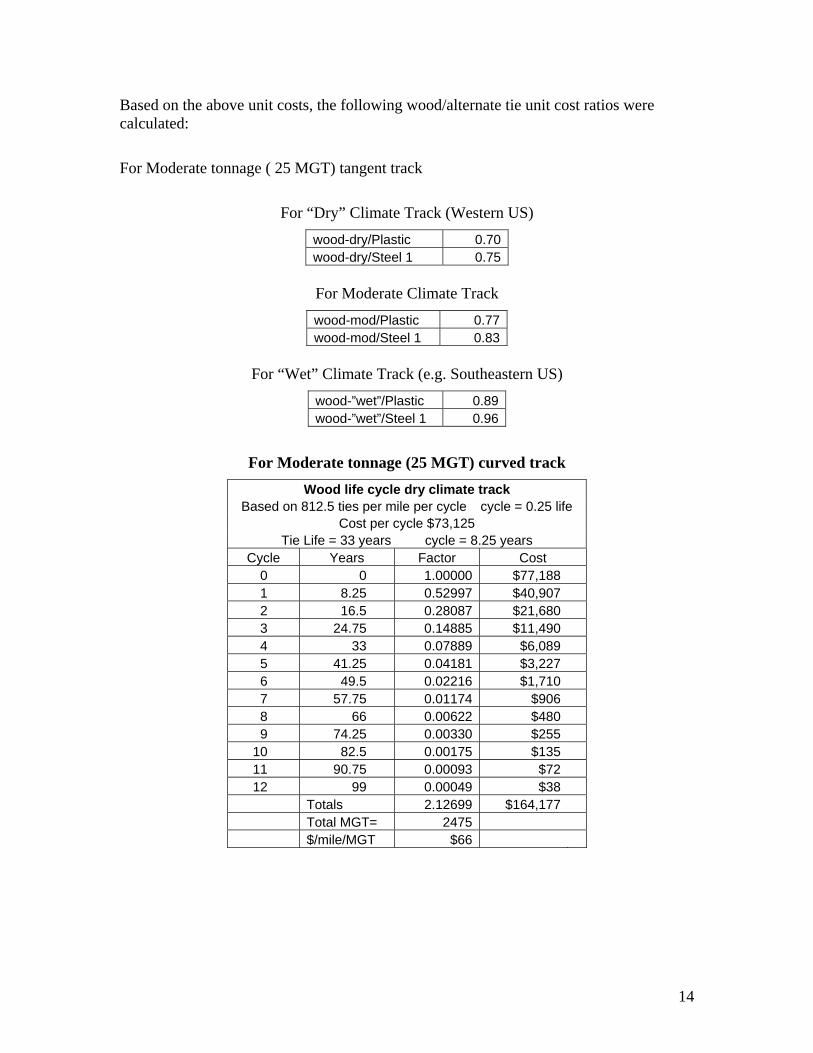
Based on the above unit costs, the following wood/alternate tie unit cost ratios were calculated:
For Moderate tonnage ( 25 MGT) tangent track
For “Dry” Climate Track (Western US)
wood-dry/Plastic 0.70wood-dry/Steel 1 0.75
For Moderate Climate Track
wood-mod/Plastic 0.77wood-mod/Steel 1 0.83
For “Wet” Climate Track (e.g. Southeastern US)
wood-”wet”/Plastic 0.89wood-”wet”/Steel 1 0.96
For Moderate tonnage (25 MGT) curved track Wood life cycle dry climate track
Based on 812.5 ties per mile per cycle cycle = 0.25 life Cost per cycle $73,125
Tie Life = 33 years cycle = 8.25 years Cycle Years Factor Cost
0 0 1.00000 $77,188 1 8.25 0.52997 $40,907 2 16.5 0.28087 $21,680 3 24.75 0.14885 $11,490 4 33 0.07889 $6,089 5 41.25 0.04181 $3,227 6 49.5 0.02216 $1,710 7 57.75 0.01174 $906 8 66 0.00622 $480 9 74.25 0.00330 $255
10 82.5 0.00175 $135 11 90.75 0.00093 $72 12 99 0.00049 $38
Totals 2.12699 $164,177 Total MGT= 2475 $/mile/MGT $66
14
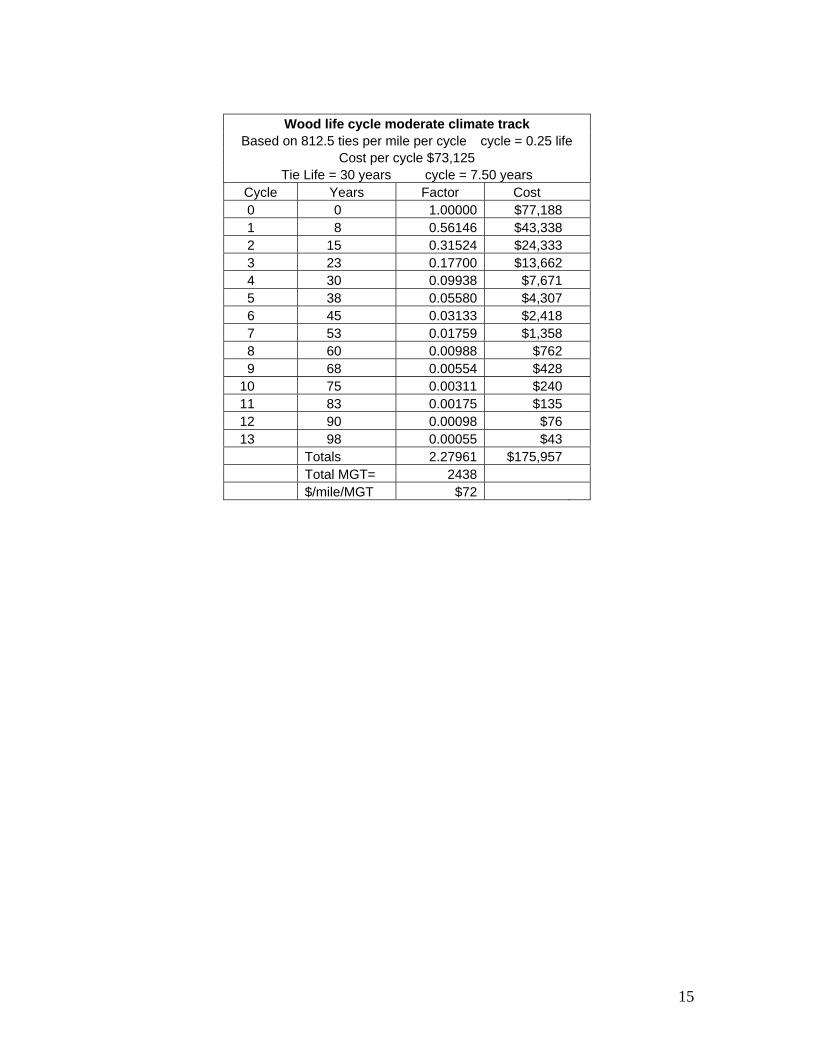
Wood life cycle moderate climate track
Based on 812.5 ties per mile per cycle cycle = 0.25 life Cost per cycle $73,125
Tie Life = 30 years cycle = 7.50 years Cycle Years Factor Cost 0 0 1.00000 $77,188 1 8 0.56146 $43,338 2 15 0.31524 $24,333 3 23 0.17700 $13,662 4 30 0.09938 $7,671 5 38 0.05580 $4,307 6 45 0.03133 $2,418 7 53 0.01759 $1,358 8 60 0.00988 $762 9 68 0.00554 $428
10 75 0.00311 $240 11 83 0.00175 $135 12 90 0.00098 $76 13 98 0.00055 $43
Totals 2.27961 $175,957 Total MGT= 2438 $/mile/MGT $72
15
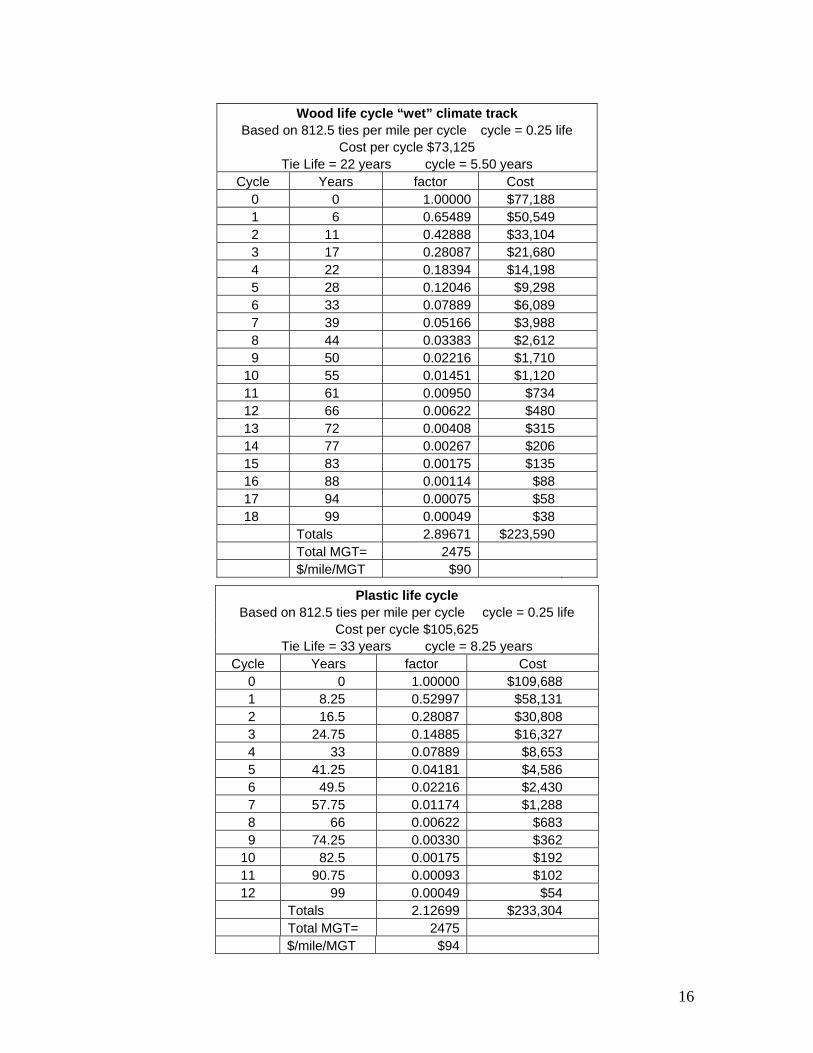
Wood life cycle “wet” climate track Based on 812.5 ties per mile per cycle cycle = 0.25 life
Cost per cycle $73,125 Tie Life = 22 years cycle = 5.50 years
Cycle Years factor Cost 0 0 1.00000 $77,188 1 6 0.65489 $50,549 2 11 0.42888 $33,104 3 17 0.28087 $21,680 4 22 0.18394 $14,198 5 28 0.12046 $9,298 6 33 0.07889 $6,089 7 39 0.05166 $3,988 8 44 0.03383 $2,612 9 50 0.02216 $1,710
10 55 0.01451 $1,120 11 61 0.00950 $734 12 66 0.00622 $480 13 72 0.00408 $315 14 77 0.00267 $206 15 83 0.00175 $135 16 88 0.00114 $88 17 94 0.00075 $58 18 99 0.00049 $38
Totals 2.89671 $223,590 Total MGT= 2475 $/mile/MGT $90
Plastic life cycle Based on 812.5 ties per mile per cycle cycle = 0.25 life
Cost per cycle $105,625 Tie Life = 33 years cycle = 8.25 years
Cycle Years factor Cost 0 0 1.00000 $109,688 1 8.25 0.52997 $58,131 2 16.5 0.28087 $30,808 3 24.75 0.14885 $16,327 4 33 0.07889 $8,653 5 41.25 0.04181 $4,586 6 49.5 0.02216 $2,430 7 57.75 0.01174 $1,288 8 66 0.00622 $683 9 74.25 0.00330 $362
10 82.5 0.00175 $192 11 90.75 0.00093 $102 12 99 0.00049 $54
Totals 2.12699 $233,304 Total MGT= 2475 $/mile/MGT $94
16
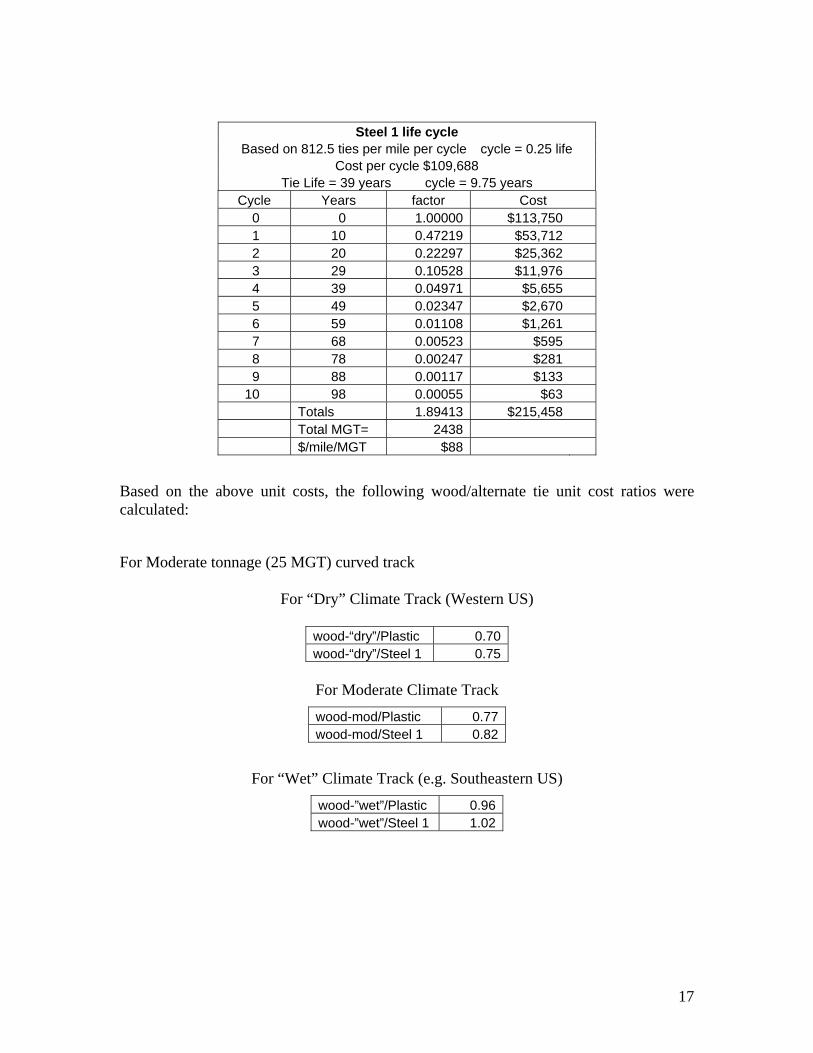
Steel 1 life cycle Based on 812.5 ties per mile per cycle cycle = 0.25 life
Cost per cycle $109,688 Tie Life = 39 years cycle = 9.75 years
Cycle Years factor Cost 0 0 1.00000 $113,750 1 10 0.47219 $53,712 2 20 0.22297 $25,362 3 29 0.10528 $11,976 4 39 0.04971 $5,655 5 49 0.02347 $2,670 6 59 0.01108 $1,261 7 68 0.00523 $595 8 78 0.00247 $281 9 88 0.00117 $133
10 98 0.00055 $63 Totals 1.89413 $215,458 Total MGT= 2438 $/mile/MGT $88
Based on the above unit costs, the following wood/alternate tie unit cost ratios were calculated:
For Moderate tonnage (25 MGT) curved track
For “Dry” Climate Track (Western US)
wood-“dry”/Plastic 0.70wood-“dry”/Steel 1 0.75
For Moderate Climate Track
wood-mod/Plastic 0.77wood-mod/Steel 1 0.82
For “Wet” Climate Track (e.g. Southeastern US)
wood-”wet”/Plastic 0.96wood-”wet”/Steel 1 1.02
17
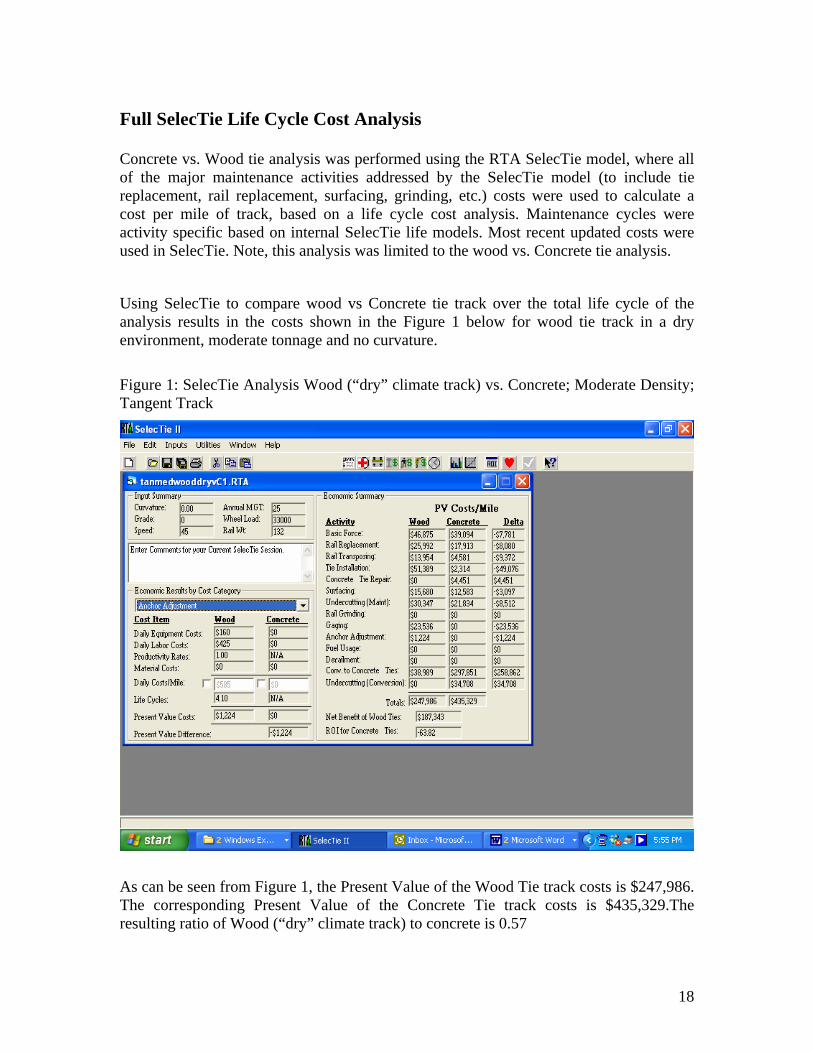
Full SelecTie Life Cycle Cost Analysis
Concrete vs. Wood tie analysis was performed using the RTA SelecTie model, where all of the major maintenance activities addressed by the SelecTie model (to include tie replacement, rail replacement, surfacing, grinding, etc.) costs were used to calculate a cost per mile of track, based on a life cycle cost analysis. Maintenance cycles were activity specific based on internal SelecTie life models. Most recent updated costs were used in SelecTie. Note, this analysis was limited to the wood vs. Concrete tie analysis.
Using SelecTie to compare wood vs Concrete tie track over the total life cycle of the analysis results in the costs shown in the Figure 1 below for wood tie track in a dry environment, moderate tonnage and no curvature.
Figure 1: SelecTie Analysis Wood (“dry” climate track) vs. Concrete; Moderate Density; Tangent Track
As can be seen from Figure 1, the Present Value of the Wood Tie track costs is $247,986. The corresponding Present Value of the Concrete Tie track costs is $435,329.The resulting ratio of Wood (“dry” climate track) to concrete is 0.57
18
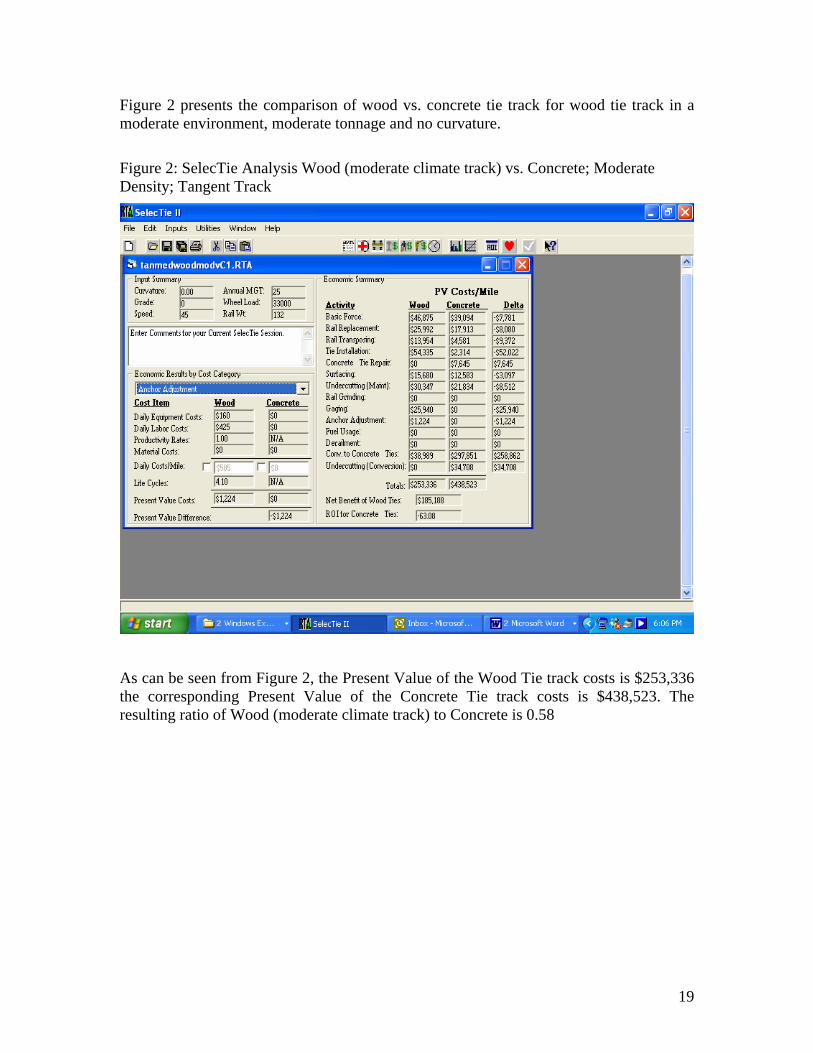
Figure 2 presents the comparison of wood vs. concrete tie track for wood tie track in a moderate environment, moderate tonnage and no curvature.
Figure 2: SelecTie Analysis Wood (moderate climate track) vs. Concrete; Moderate Density; Tangent Track
As can be seen from Figure 2, the Present Value of the Wood Tie track costs is $253,336 the corresponding Present Value of the Concrete Tie track costs is $438,523. The resulting ratio of Wood (moderate climate track) to Concrete is 0.58
19
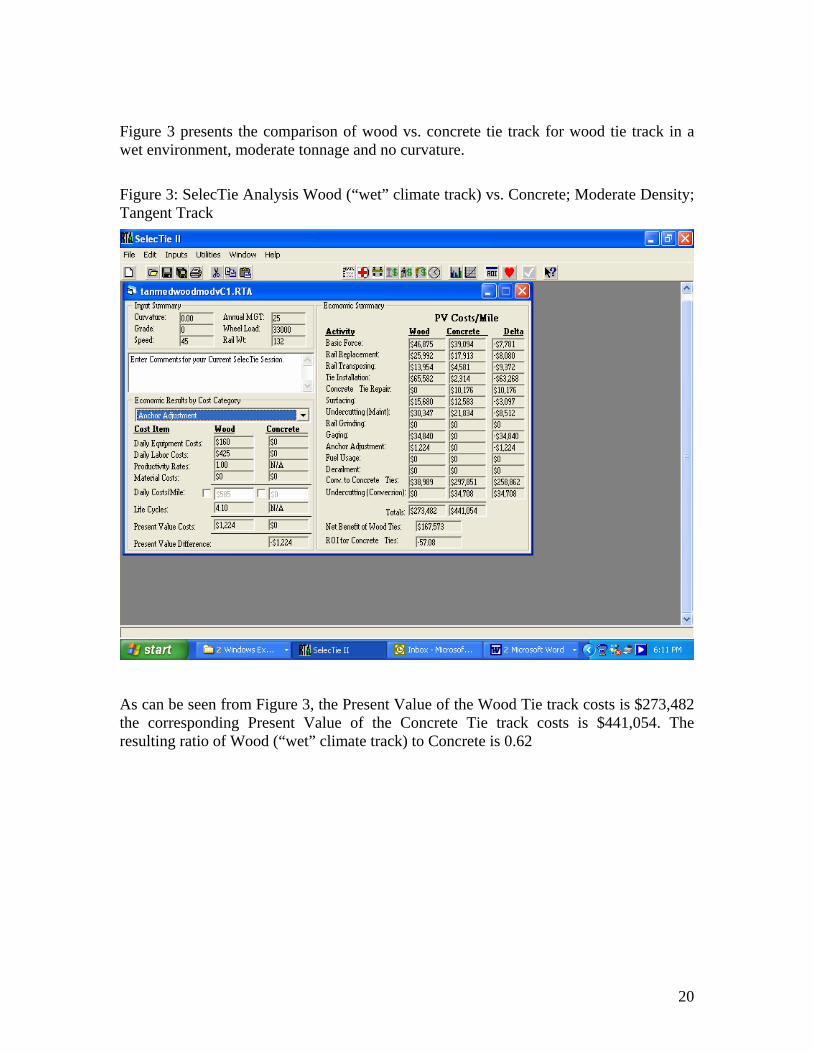
Figure 3 presents the comparison of wood vs. concrete tie track for wood tie track in a wet environment, moderate tonnage and no curvature.
Figure 3: SelecTie Analysis Wood (“wet” climate track) vs. Concrete; Moderate Density; Tangent Track
As can be seen from Figure 3, the Present Value of the Wood Tie track costs is $273,482 the corresponding Present Value of the Concrete Tie track costs is $441,054. The resulting ratio of Wood (“wet” climate track) to Concrete is 0.62
20
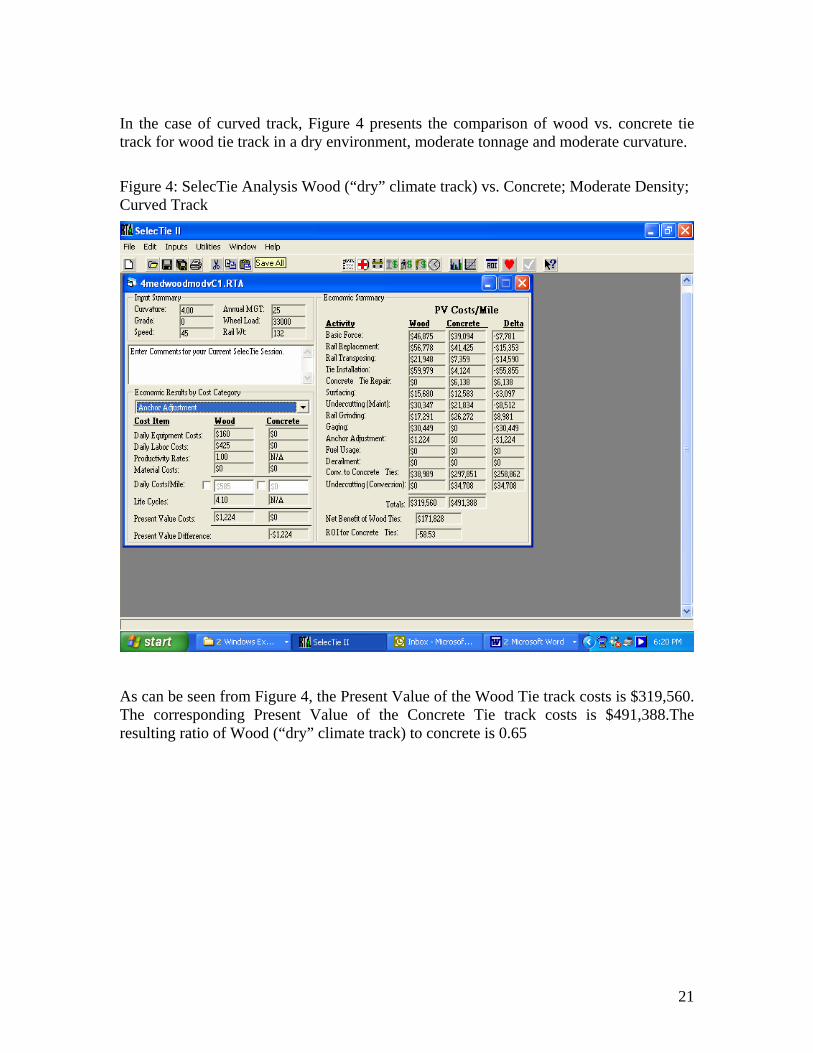
In the case of curved track, Figure 4 presents the comparison of wood vs. concrete tie track for wood tie track in a dry environment, moderate tonnage and moderate curvature.
Figure 4: SelecTie Analysis Wood (“dry” climate track) vs. Concrete; Moderate Density; Curved Track
As can be seen from Figure 4, the Present Value of the Wood Tie track costs is $319,560. The corresponding Present Value of the Concrete Tie track costs is $491,388.The resulting ratio of Wood (“dry” climate track) to concrete is 0.65
21
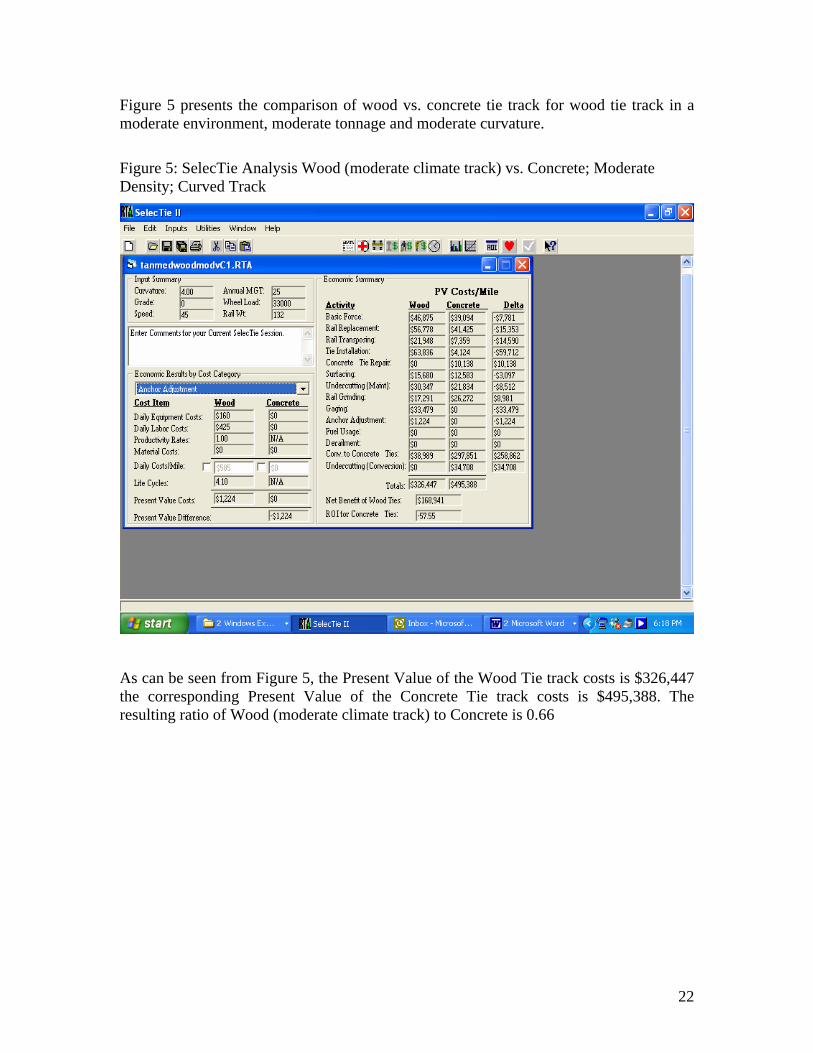
Figure 5 presents the comparison of wood vs. concrete tie track for wood tie track in a moderate environment, moderate tonnage and moderate curvature.
Figure 5: SelecTie Analysis Wood (moderate climate track) vs. Concrete; Moderate Density; Curved Track
As can be seen from Figure 5, the Present Value of the Wood Tie track costs is $326,447 the corresponding Present Value of the Concrete Tie track costs is $495,388. The resulting ratio of Wood (moderate climate track) to Concrete is 0.66
22

Figure 6 presents the comparison of wood vs. concrete tie track for wood tie track in a “wet” environment, moderate tonnage and moderate curvature..
Figure 6: SelecTie Analysis Wood (“wet” climate track) vs. Concrete; Moderate Density; Curved Track
As can be seen from Figure 6, the Present Value of the Wood Tie track costs is $352,306. The corresponding Present Value of the Concrete Tie track costs is $498,525. The resulting ratio of Wood (“wet” climate track) to Concrete is 0.71.
23
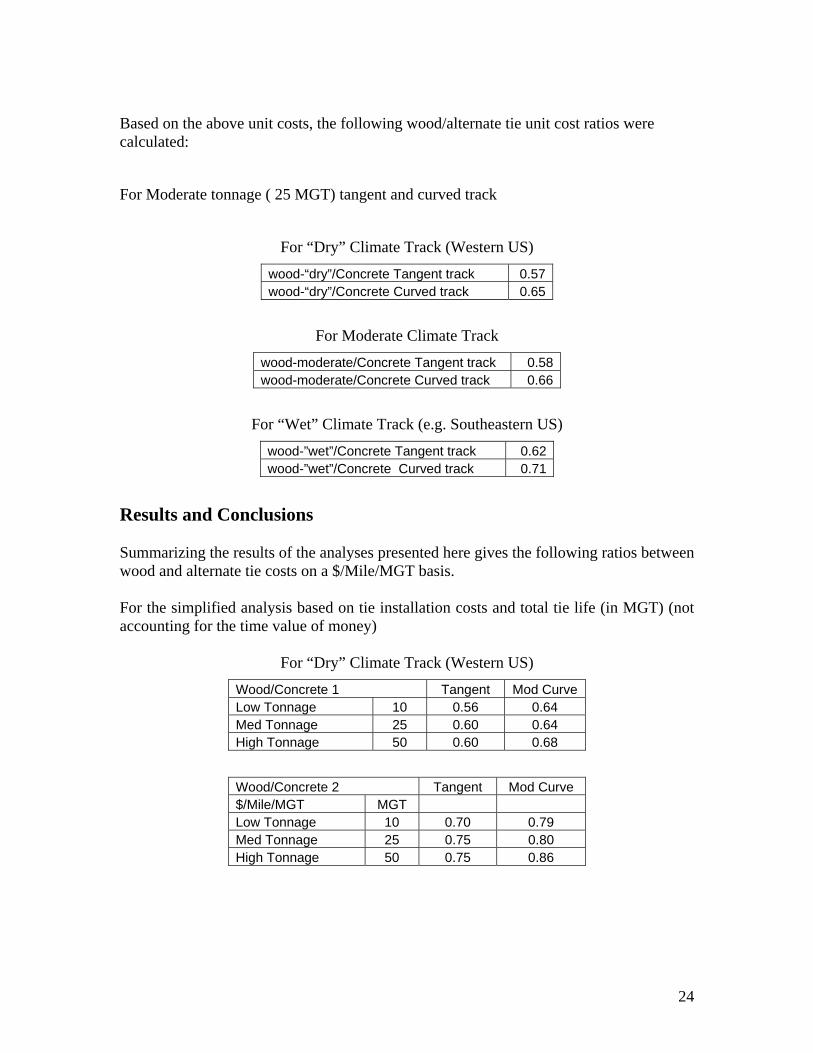
Based on the above unit costs, the following wood/alternate tie unit cost ratios were calculated:
For Moderate tonnage ( 25 MGT) tangent and curved track
For “Dry” Climate Track (Western US)
wood-“dry”/Concrete Tangent track 0.57wood-“dry”/Concrete Curved track 0.65
For Moderate Climate Track
wood-moderate/Concrete Tangent track 0.58wood-moderate/Concrete Curved track 0.66
For “Wet” Climate Track (e.g. Southeastern US)
wood-”wet”/Concrete Tangent track 0.62wood-”wet”/Concrete Curved track 0.71
Results and Conclusions Summarizing the results of the analyses presented here gives the following ratios between wood and alternate tie costs on a $/Mile/MGT basis. For the simplified analysis based on tie installation costs and total tie life (in MGT) (not accounting for the time value of money)
For “Dry” Climate Track (Western US)
Wood/Concrete 1 Tangent Mod Curve Low Tonnage 10 0.56 0.64 Med Tonnage 25 0.60 0.64 High Tonnage 50 0.60 0.68
Wood/Concrete 2 Tangent Mod Curve $/Mile/MGT MGT Low Tonnage 10 0.70 0.79 Med Tonnage 25 0.75 0.80 High Tonnage 50 0.75 0.86
24
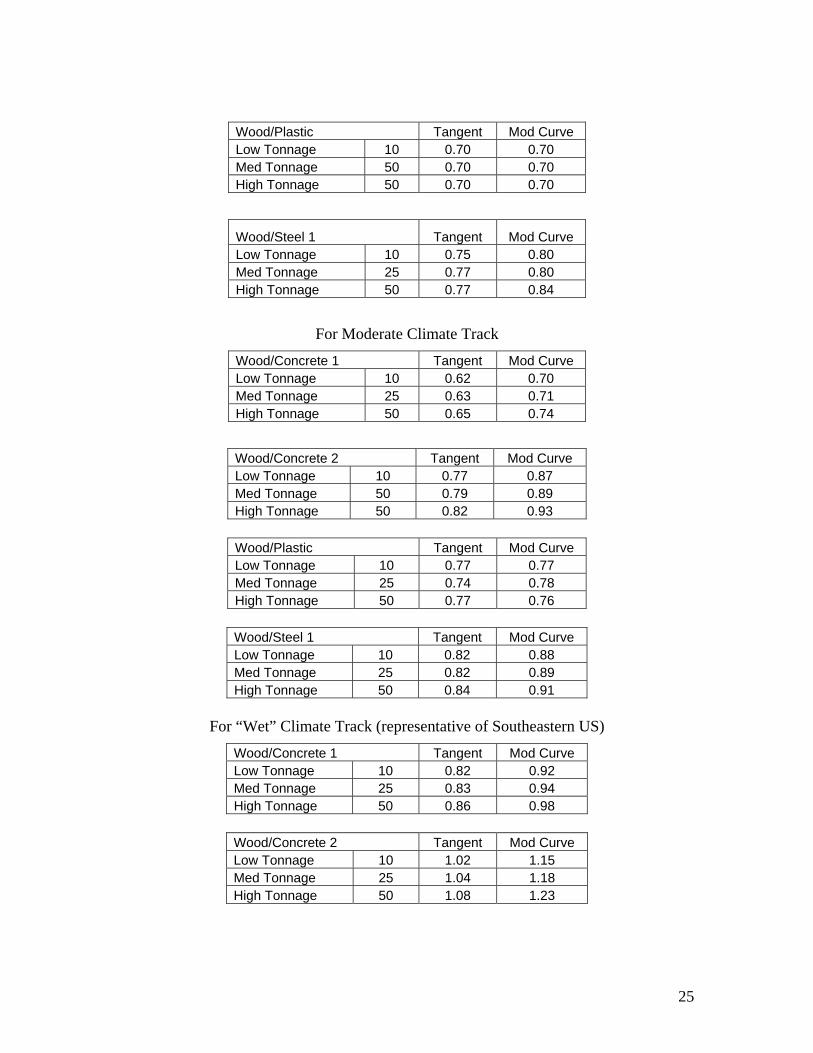
Wood/Plastic Tangent Mod Curve Low Tonnage 10 0.70 0.70 Med Tonnage 50 0.70 0.70 High Tonnage 50 0.70 0.70
Wood/Steel 1 Tangent Mod Curve Low Tonnage 10 0.75 0.80 Med Tonnage 25 0.77 0.80 High Tonnage 50 0.77 0.84
For Moderate Climate Track
Wood/Concrete 1 Tangent Mod Curve Low Tonnage 10 0.62 0.70 Med Tonnage 25 0.63 0.71 High Tonnage 50 0.65 0.74
Wood/Concrete 2 Tangent Mod Curve Low Tonnage 10 0.77 0.87 Med Tonnage 50 0.79 0.89 High Tonnage 50 0.82 0.93
Wood/Plastic Tangent Mod Curve Low Tonnage 10 0.77 0.77 Med Tonnage 25 0.74 0.78 High Tonnage 50 0.77 0.76
Wood/Steel 1 Tangent Mod Curve Low Tonnage 10 0.82 0.88 Med Tonnage 25 0.82 0.89 High Tonnage 50 0.84 0.91
For “Wet” Climate Track (representative of Southeastern US)
Wood/Concrete 1 Tangent Mod Curve Low Tonnage 10 0.82 0.92 Med Tonnage 25 0.83 0.94 High Tonnage 50 0.86 0.98
Wood/Concrete 2 Tangent Mod Curve Low Tonnage 10 1.02 1.15 Med Tonnage 25 1.04 1.18 High Tonnage 50 1.08 1.23
25
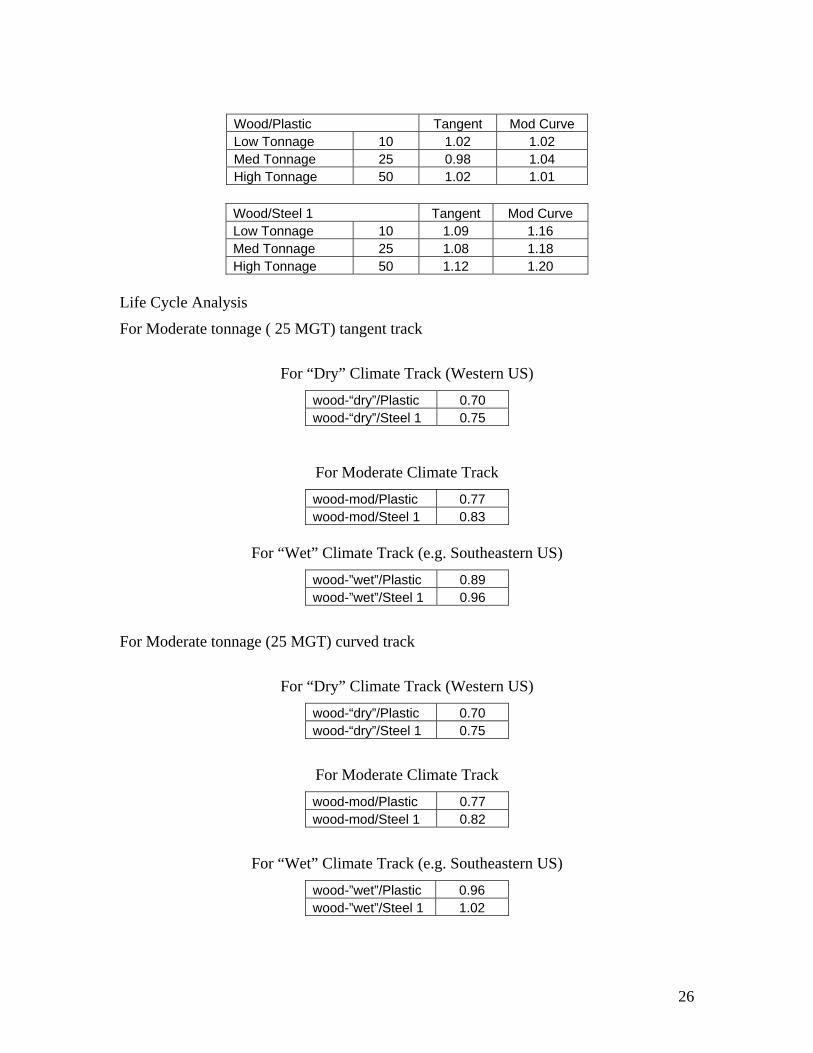
Wood/Plastic Tangent Mod Curve Low Tonnage 10 1.02 1.02 Med Tonnage 25 0.98 1.04 High Tonnage 50 1.02 1.01
Wood/Steel 1 Tangent Mod Curve Low Tonnage 10 1.09 1.16 Med Tonnage 25 1.08 1.18 High Tonnage 50 1.12 1.20
Life Cycle Analysis
For Moderate tonnage ( 25 MGT) tangent track
For “Dry” Climate Track (Western US)
wood-“dry”/Plastic 0.70 wood-“dry”/Steel 1 0.75
For Moderate Climate Track
wood-mod/Plastic 0.77 wood-mod/Steel 1 0.83
For “Wet” Climate Track (e.g. Southeastern US)
wood-”wet”/Plastic 0.89 wood-”wet”/Steel 1 0.96
For Moderate tonnage (25 MGT) curved track
For “Dry” Climate Track (Western US)
wood-“dry”/Plastic 0.70 wood-“dry”/Steel 1 0.75
For Moderate Climate Track
wood-mod/Plastic 0.77 wood-mod/Steel 1 0.82
For “Wet” Climate Track (e.g. Southeastern US)
wood-”wet”/Plastic 0.96 wood-”wet”/Steel 1 1.02
26
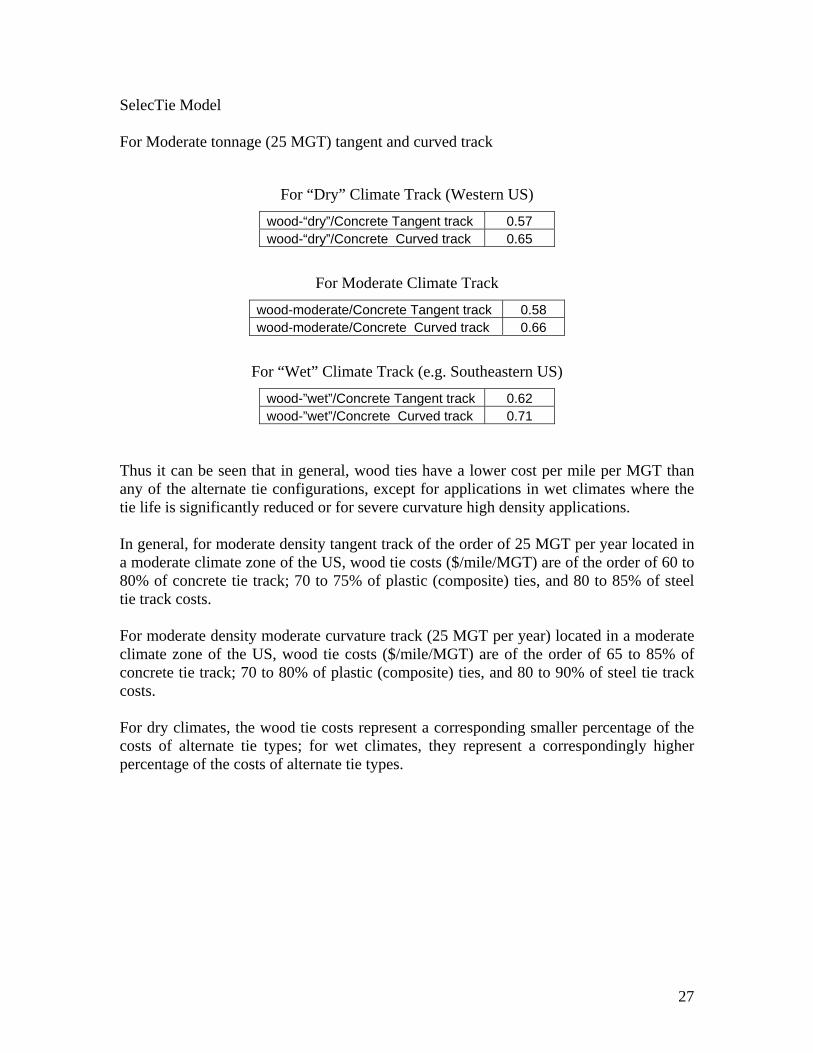
SelecTie Model For Moderate tonnage (25 MGT) tangent and curved track
For “Dry” Climate Track (Western US)
wood-“dry”/Concrete Tangent track 0.57 wood-“dry”/Concrete Curved track 0.65
For Moderate Climate Track
wood-moderate/Concrete Tangent track 0.58 wood-moderate/Concrete Curved track 0.66
For “Wet” Climate Track (e.g. Southeastern US)
wood-”wet”/Concrete Tangent track 0.62 wood-”wet”/Concrete Curved track 0.71
Thus it can be seen that in general, wood ties have a lower cost per mile per MGT than any of the alternate tie configurations, except for applications in wet climates where the tie life is significantly reduced or for severe curvature high density applications. In general, for moderate density tangent track of the order of 25 MGT per year located in a moderate climate zone of the US, wood tie costs ($/mile/MGT) are of the order of 60 to 80% of concrete tie track; 70 to 75% of plastic (composite) ties, and 80 to 85% of steel tie track costs. For moderate density moderate curvature track (25 MGT per year) located in a moderate climate zone of the US, wood tie costs ($/mile/MGT) are of the order of 65 to 85% of concrete tie track; 70 to 80% of plastic (composite) ties, and 80 to 90% of steel tie track costs. For dry climates, the wood tie costs represent a corresponding smaller percentage of the costs of alternate tie types; for wet climates, they represent a correspondingly higher percentage of the costs of alternate tie types.
27