ZCCM Investments Holdings Plc - Novi Insight … · ZCCM Investments Holdings Plc 5 ZCCM...
98
Transcript of ZCCM Investments Holdings Plc - Novi Insight … · ZCCM Investments Holdings Plc 5 ZCCM...

ZCCM Investments Holdings PlcAnnual report and financial statements
for the year ended 31 March 2013
ZCCM Investments Holdings Plc
Annual report and financial statements for the year ended 31 March 2013
ZCCM Investments Holdings PlcZCCM Investments Holdings PlcAnnual Reportfor the year ended 31 March 2013
Contents Page
Directorate and administration 1
Management committee 2-3
Chairman’s statement 4 - 6
Report of the directors 7 - 10
Operations report
Subsidiary companies’ performance 11 - 12
Associate companies and other investments’ performance 13 - 21
Corporate social responsibility and environmental review 22
Directors’ responsibilities in respect of the preparation of financial statements 23
Report of the independent auditors 24 - 25
Consolidated and company statements of comprehensive income 26 - 27
Consolidated and company statements of financial position 28 - 29
Consolidated and company statements of changes in equity 30 - 31
Consolidated and company statements of cash flows 32 - 33
Notes to the financial statements 34 - 93
Corporate information 94 - 95
12 - 21
2 - 3
ZCCM Investments Holdings Plc
1
ZCCM Investments Holdings Plc Annual Report (continued) for the year ended 31 March 2013 DIRECTORATE AND ADMINISTRATION DIRECTORS The Directors who held office during the period to 31 March 2013 were: Mr. W D Mung’omba Executive Chairman of the Board Mr. J M D Patterson Non Executive Director Mr.C Mwananshiku Non Executive Director Ms. S Mutemba Non Executive Director Dr. V Mutambo Non Executive Director Dr. B K E Ng’andu Non Executive Director Appointed 02 April 2012 Mrs. P C Kabamba Non Executive Director Appointed 15 January 2013 Dr. A Mwenda Non Executive Director Retired 30 June 2012 The Directors who held office as at the date of approval of this report (08 November 2013) were: Mr. W D Mung’omba (Executive Chairman) Mr. J M D Patterson (Non-executive Director) Mr. C Mwananshiku (Non-executive Director) Ms. S Mutemba (Non-executive Director) Dr. V Mutambo (Non-executive Director) Dr. B K E Ng’andu (Non-executive Director) Mrs. P C Kabamba (Non-executive Director)
ZCCM Investments Holdings Plc
2
ZCCM Investments Holdings Plc Annual Report (continued) for the year ended 31 March 2013 MANAGEMENT COMMITTEE Management officials who held office during the year to 31 March 2013 were: Mr. W D Mung’omba Executive Chairman of the Board Mr. M Muyunda Chief Executive Officer Mr. C Chabala Company Secretary Ms. M Chanda Chief Operating Officer (Appointed 01 February 2013) Mr. M T Chipata Chief Financial Officer ( Appointed 1 July 2012) Ms. Y Mkandawire Acting Legal Manager (Appointed 21 November 2012) Mr. Moses Chilambe Acting Technical Manager (Appointed 21 August 2012) Mr C Mjumphi Corporate Officer (Appointed 07 January 2013) Mr. B F Shamalavu Head, Human Resources Ms. W Mangambwa Head, Risk and Internal Audit Mr. J Makumba Environmental Manager (separated 28 February 2013) Mr. M Mbewe Investments Manager (separated 02 November 2012) Mr. J K Kaite Legal Manager (separated 31 October 2012) Mr. M Khunga Corporate Officer (separated 24 September 2012) Mr. W K Katoto Technical Manager (separated 30 June 2012)
ZCCM Investments Holdings Plc
3
ZCCM Investments Holdings Plc Annual Report (continued) for the year ended 31 March 2013 MANAGEMENT COMMITTEE (continued) Management officials who held office as at the date of approval of this report (08 November 2013) were: Mr. W D Mung’omba Executive Chairman of the Board
Mr. M Muyunda Chief Executive Officer
Mr. C Chabala Chief Corporate Services Officer /Company Secretary
Ms. M Chanda Chief Operating Officer
Mr. M T Chipata Chief Financial Officer
Ms. Y Mkandawire Deputy General Counsel
Ms. W Mangambwa Head, Risk and Internal Audit
Mr C Mjumphi Corporate Officer
ZCCM Investments Holdings Plc
4
ZCCM Investments Holdings Plc Annual Report (continued) for the year ended 31 March 2013 CHAIRMAN’S STATEMENT During the period under review the global economy continued to record sluggish growth and continuing volatility. Uncertainty across the major economic regions ranging from the post election fiscal cliff in the United States of America, the Chinese leadership transition, to reforms in the Eurozone area continued to impact the global economy. Global copper demand marginally increased by 3.1% (2012:3.2%), while copper production increased by 4.5% (2012: Nil). Copper prices declined 9.4%, from US$8,318 per tonne at the beginning of the year to US$7,540 per tonne at the close of the financial year. Despite the scenario above, the Zambian economy recorded growth of 7.2% in 2013 (2012:6.6%), 0.5% lower than forecast due to lower than budgeted performance in the mining sector and the weaker global economy. Financial performance For the Group, investment in productive capacity, efforts to reposition and enhance efficiencies continued. Investment in Ndola Lime Company Limited continued and this was expected to improve the production capacity of lime and the Group’s business. Other investee companies continued with their growth strategies premised on the prospect of recovery in global demand and improved investments in power projects intended to remove bottlenecks in electricity supply. Growth in output is expected in 2014-15 as investments continue in Lubambe Copper Mine Plc, Konkola Copper Mines Plc as well as First Quantum Minerals Limited’s new Trident Mine. The Group recorded turnover of K520 million (2012: K257 million) and operating profit of K417 million (2012: K367 million). Improved dividend payments from investee companies impacted positively on Group performance. The Group reported a profit before tax of K654 million (2012: K1, 053 million). The Group recorded a profit after tax of K762 million (2012: K1, 238 million). The Group’s share of profit of equity accounted investees reduced to K222 million (2012: K640 million). The Group’s retained earnings as at 31 March 2013 were positive at K4, 018 million (2012: K3, 256 million).The Company’s retained earnings became positive for the first time to K511 million (2012: negative K57 million). Strategic and new investments Ndola Lime Company Limited continued with the rehabilitation of the plant as part of the recapitalisation project of the company. The electrostatic precipitator on the rotary kiln was re-commissioned and a new dust abatement unit on the vertical kiln was installed. ZCCM-IH provided an additional loan of K133 million (2012: K137 million) for the recapitalisation project expected to be commissioned in December 2013.
ZCCM Investments Holdings Plc
5
ZCCM Investments Holdings Plc Annual Report (continued) for the year ended 31 March 2013 CHAIRMAN’S STATEMENT (continued) In September 2012, the Government of the Republic of Zambia (GRZ) gave approval for the conversion of all or part of the GRZ debt owed by ZCCM-IH amounting to K 1.9 billion (approximately US$352 million) into equity through a rights issue. As at 31st March 2013, implementation modalities involving the appointment of the Lead Financial Advisors to undertake the rights issue had progressed. As part of this exercise, a valuation of ZCCM-IH and its investments was conducted to ascertain the appropriate value of ZCCM-IH shares. The valuation has been incorporated in these financial statements. The whole balance sheet restructuring exercise is expected to be completed in 2014. During the period under review, ZCCM-IH and Konkola Copper Mines Plc (KCM) entered into a Settlement Agreement pursuant to which certain outstanding payments owed by KCM to ZCCM-IH and certain contingent amounts payable, under the then existing Price Participation Arrangements (PPAs) which dated back to March 2000 were settled. The PPAs were concurrently terminated. Under the settlement agreement, US$46.3 million was required to be paid by KCM (in instalments) to ZCCM-IH on or before 31 August 2013, and a further US$73.4 million (in instalments) on or before 30 September 2016.
During the financial year under review, GRZ announced the cancellation of the Small Scale Mining Licenses issued to Collum Coal Mining Industries Limited (Collum) situated in Sinazongwe District in the Southern Province of Zambia. Following the cancellation of the licenses, ZCCM-IH applied for and was issued with licences for the coal mine. ZCCM-IH has incorporated Nkandabwe Coal Mine Limited, a 100% subsidiary to operate the coal mine. ZCCM-IH intends to look for strategic partners to work with and develop the mine. Albidon Zambia Ltd was placed under care and maintenance during the financial year under review so as to maintain the investment at Munali. On 28 March 2013, the Board of Albidon Limited announced, that Jin Tuo Investment Limited (a wholly owned subsidiary of Jinchuan Group Resources Holdings Limited, which is itself a majority shareholder of Albidon Limited) had proposed to acquire 100 per cent of the Albidon Limited at a cash price per share of US$0.0025. Subsequent to the financial year under review, the proposal was made to all shareholders other than the Jinchuan Group via a Statutory Merger pursuant to the British Virgin Islands Business Companies Act 2004 (as amended). During the year, the Board of ZCCM-IH resolved to restructure and reorganise the Legal Department. The objective of the restructuring was to separate all legacy matters from current and future business so that the internal legal counsel would focus on current and future business while legacy matters could be handled by external legal counsel. The other objective was to downsize and enhance efficiencies. In this regard, all legacy (historical) related conveyancing and litigation matters were outsourced to an external law firm. As a result of the restructuring the number of staff in the legal department reduced from 26 to 3. Further restructuring decisions were made to the Environment Department. The restructuring of the Environment Department resulted in the formation of a subsidiary company called Misenge Environmental and Technical Services Limited (METS), The objective of the restructuring was to allow ZCCM-IH to be more focused on investment activities while METS would provide environmental management services to ZCCM-IH including taking over all outstanding and future environmental obligations for ZCCM-IH. METS would also provide environment management services to other clients. METS officially commenced operations on 1 February 2013.
ZCCM Investments Holdings Plc
6
ZCCM Investments Holdings Plc Annual Report (continued) for the year ended 31 March 2013 CHAIRMAN’S STATEMENT (continued) Capital market The ZCCM-IH share price on the Lusaka Stock Exchange closed the year at K12.5 (2011; K12.5). The market capitalisation as at 31 March 2013 was K1, 116 million (2012; K1, 116 million). To strengthen corporate governance in investee companies, ZCCM-IH adopted a new policy for the appointment of Representative Directors intended to tap best talent to represent ZCCM-IH on the Boards of Directors of its investee companies. This was done by advertising in the national media for applicants who would be interested in taking up directorships in ZCCM-IH’s investee companies. The applicants were subjected to interviews before selection. To this effect, new ZCCM-IH’s Representative Directors were appointed on the Boards of investee companies in September 2012. Outlook ZCCM-IH remains confident about the fundamentals of the mining industry in general and those of copper in particular. While continued volatility is expected in the short term, the long-term fundamentals for copper are expected to remain strong on the back of continued urbanization in China, India, South East Asia and Africa. The Zambian economy is expected to continue to grow at higher rates than most of the economies in Sub-Saharan Africa premised on increased execution of development projects, investment in transport infrastructure, private investment in existing and new mining operations, and power projects. ZCCM-IH is well positioned to maximise returns from its existing investments currently concentrated in copper mining, as well as pursuing value adding opportunities in other minerals and mining related opportunities. Directorate During the year, there were changes to the Directorate as follows: Dr B K E Ng’andu Appointed 02 April 2012 Non Executive Director Mrs P C Kabamba Appointed 15 January 2013 Non Executive Director Dr A Mwenda Retired 30 June 2012 Non Executive Director Appreciation I extend my gratitude to my fellow Board members, the Management and Staff of ZCCM-IH for their commitment and hard work during the past financial year. I further extend my gratitude to the investee companies for their efforts and contributions in the year. Wila D Mung’omba Executive Chairman of the Board
ZCCM Investments Holdings Plc
7
ZCCM Investments Holdings Plc Annual Report (continued) for the year ended 31 March 2013 REPORT OF THE DIRECTORS The Directors submit their report together with the audited financial statements for the year ended 31 March 2013, which disclose the state of affairs of ZCCM Investments Holdings Plc (‘the Company’) and its subsidiaries (together “the Group”). Shareholding The Group has the following interests in the undernoted companies:
1 Ndola Lime Company Limited 2 Misenge Environmental and Technical Services Ltd 3 Kariba Minerals Limited
100.00% 100.00% 50.00%
4 Maamba Collieries Limited 35.00% 5 Konkola Copper Mines Plc 20.60% 6 Kansanshi Mining Plc 20.00% 7 Copperbelt Energy Corporation Plc 20.00% 8 Lubambe Copper Mine Plc 20.00% 9 Luanshya Copper Mines Plc 20.00% 10 NFC Africa Mining Plc 15.00% 11 Chibuluma Mines Plc 15.00% 12 Investrust Bank Plc 10.60% 13 Chambishi Metals Plc 10.00% 14 Mopani Copper Mines Plc 10.00% 15 Albidon Limited 0.98%
Share capital
The authorised share capital of the Company remained unchanged at K 900 000 divided as follows:
54,000,000 “A” Ordinary Shares of K 0.01 each; and 36,000,000 “B” Ordinary Shares of K 0.01 each.
There were no changes in the issued share capital of 89,296,428 shares with a nominal value of K892,964 during the year which remained as detailed below:
Number of shares
Amount K
At beginning and end of year 89,296,428 892,964
ZCCM Investments Holdings Plc
8
ZCCM Investments Holdings Plc Annual Report (continued) for the year ended 31 March 2013 REPORT OF THE DIRECTORS (continued) The shares are held as follows Number of
shares Amount
K “A” shares - Ministry of Finance and National Planning on behalf of the Government of the Republic of Zambia (GRZ)
53,825,808
538,258
“B” shares - Ministry of Finance and National Planning on behalf of the Government of the Republic of Zambia (GRZ)
24,329,828
243,298
“B” Shares - Others 11,140,792 111,408
89,296,428 892,964 The 11,140,792 “B” Ordinary Shares are thinly spread and as at 31 March 2013 were held by 2,317 non-controlling shareholders. Currency rebasing
With effect from 1 January 2013, the Zambian Kwacha was rebased by dividing the currency by a thousand. As part of the process the currency code was changed from ZMK to ZMW although the currency symbol “K” remained unchanged. Consequently, the financial statements are presented in the rebased currency.
ZCCM Investments Holdings Plc
9
ZCCM Investments Holdings Plc Annual Report (continued) for the year ended 31 March 2013 REPORT OF THE DIRECTORS (continued)
PRINCIPAL ACTIVITIES
ZCCM–IH (“ the Company’’) is an investments holdings company which has a primary listing on the Lusaka Stock Exchange and secondary listings on London and Euronext Stock Exchanges. The Company has the majority of its investments held in the copper mining sector of Zambia. Its principal activities include managing the Zambian Government’s stake in the mining sector. Other activities include: Undertaking investment analysis and aligning company operations towards maximising
returns to shareholders; Pursuing investee companies to consistently declare reasonable dividends and company
growth; Ensuring effective representation on the boards of the investee companies; Establishing and securing joint venture partnerships for projects assessed to be viable; and Promoting Zambian ownership and management in mining assets.
Functions and performance of the Group
In its transformed state as an investments holding company, the main functions of the Company are as follows:
to monitor the performance of the investee companies with respect to production and metal prices in order to ensure that commitments agreed upon relating to disbursements are fulfilled on a timely basis;
to continue monitoring production and cost levels in the associate companies. In addition, to ensure collection of price participation payments due;
to anticipate the receipt of deferred sale considerations and ensure that these are received on a timely basis and in the correct amounts;
to ensure that ZCCM-IH environmental obligations under the transaction documents are complied with;
to ensure that environmental obligations continued to be attended to through different levels of participation. The Company undertook remedial environmental measures through its Environmental Department up to 31 January 2013 when provision of environmental services was outsourced to METS; and
to liaise with prospective greenfield investors in the mining and minerals industry who will enter into agreements with the Government. The Group has continued to liaise with greenfield investors.
CORPORATE GOVERNANCE
The Group continued to operate by enforcing good corporate governance practices and observing the separation of powers between the Directors and Management on one hand and the Chairman of the Board and the Chief Executive Officer on the other. All Directors on the Board except for the Chairman were non-executive during the financial year.
Activities were further streamlined by the full utilisation of the existing Audit, Remuneration and Investments Committees of the Board whose membership as at the date of this report (08 November 2013) is indicated below:

ZCCM Investments Holdings Plc
10
ZCCM Investments Holdings Plc Annual Report (continued) for the year ended 31 March 2013 REPORT OF THE DIRECTORS (continued)
CORPORATE GOVERNANCE (continued)
Audit Committee
Remuneration Committee
Mr. C Mwananshiku (Chairperson) Mr. J M D Patterson Ms. S Mutemba Mrs. P C Kabamba
Dr.B K E Ng’andu (Chairperson) Ms. S Mutemba Mr.C Mwananshiku Dr.V Mutambo
Investments Committee
Mr. J M D Patterson Mrs P C Kabamba Dr.V Mutambo Dr. B K E Ng’andu Mr.M Muyunda Mr. M T Chipata Ms. M Chanda Mr.C Mpundu Mr.B Nundwe Mr.A Chimpwende
Chairperson Chief Executive Officer Chief Financial Officer Chief Operating Officer Co-opted Investments Expert Co-opted Investments Expert Co-opted Investments Expert
Average number and remuneration of employees
The total remuneration of employees during the year amounted to K90.6 million (2012: K53.9 million) for the Group and K28 million (2012: K23.2 million) for the Company. The average number of employees was as follows:
Month Subsidiaries Company Group Month Subsidiaries Company Group
April 2012 455 85 540 October 2012 457 87 544 May 2012 455 87 542 November 2012 448 64 512 June 2012 453 86 539 December 2012 443 64 507 July 2012 454 85 539 January 2013 444 65 509 August 2012 438 86 524 February 2013 468 58 526 September 2012 436 86 522 March 2013 465 60 525
Staff expenses 2013 2012
Subsidiary Companies 62,577 30,711 ZCCM-IH 27,981 23,157 90,558 53,868
Signed on their behalf by: ........................................ ......................................... Director Director
ZCCM Investments Holdings Plc
11
ZCCM Investments Holdings Plc Annual Report (continued) for the year ended 31 March 2013 OPERATIONS REPORT
(A) Subsidiary Companies’ Performance
The performance of the subsidiary companies for the year ended 31 March 2013 is summarised below: 1 Ndola Lime Company Limited
Total revenue for the financial year ended 31 March 2013 was K214.6 million (2012:K177.6 million). The company reported a loss before tax of K 30.5 million (2012:profit K 5.4 million). The loss after tax was K 22.9 million (2012:loss K 6.2 million).
The company also exported goods amounting to K 23.4 million (2012: K 40.6million).
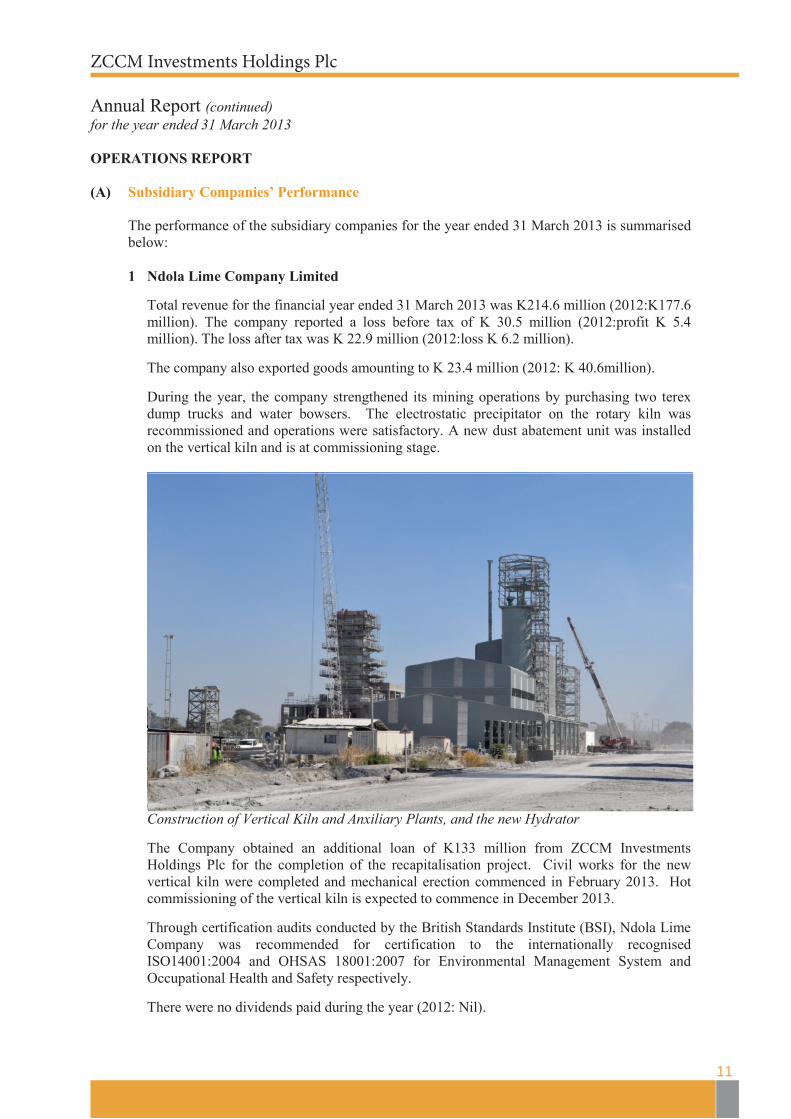
During the year, the company strengthened its mining operations by purchasing two terex dump trucks and water bowsers. The electrostatic precipitator on the rotary kiln was recommissioned and operations were satisfactory. A new dust abatement unit was installed on the vertical kiln and is at commissioning stage.
Construction of Vertical Kiln and Anxiliary Plants, and the new Hydrator
The Company obtained an additional loan of K133 million from ZCCM Investments Holdings Plc for the completion of the recapitalisation project. Civil works for the new vertical kiln were completed and mechanical erection commenced in February 2013. Hot commissioning of the vertical kiln is expected to commence in December 2013.
Through certification audits conducted by the British Standards Institute (BSI), Ndola Lime Company was recommended for certification to the internationally recognised ISO14001:2004 and OHSAS 18001:2007 for Environmental Management System and Occupational Health and Safety respectively.
There were no dividends paid during the year (2012: Nil).
ZCCM Investments Holdings Plc
12
ZCCM Investments Holdings Plc Annual Report (continued) for the year ended 31 March 2013 OPERATIONS REPORT (continued) (A) Subsidiary Companies’ Performance (continued)
2 Misenge Environmental and Technical Services Limited
Misenge Environmental and Technical Services Limited (METS) officially commenced operations on 1 February 2013. METS realised total revenue of K203, 903 during the two months of operation in February and March 2013.
The company has started preparing a strategic plan for the period 2013 to 2016 for the provision of environmental and technical services to ZCCM-IH and other clients. The main focus during the strategic period will be to grow the revenue to K 51.5 million which translates into a growth of 8% annually.
There were no dividends paid during the year (2012: Nil).
(B) Associate Companies’ Performance
The performance of investee companies for the year ended 31 March 2013 is summarised below:
1 Kariba Minerals Limited (KML)
For the financial period ended 31 March 2013, Kariba Minerals Limited (KML) had a turnover of K2.6 million (2012: K7.8 million) with a loss after tax for the year of K 6.7 million. ZCCM-IH and Gemfields advanced a total of US$2.5 million (K13.5 million) loan to the company to finance acquisition of mining equipment and working capital requirements. The equipment has been commissioned. ZCCM-IH advanced a loan balance of US$1.25 million (K6.6 million) from the above amount as at end of year.
With the arrival of new mining equipment and washing plant, the operations are expected to be more mechanised and cost efficient requiring less manpower and therefore in line with the company’s business plan, the workforce has been reduced from 224 to 164 as at 31 March 2013 and all benefits for the separated employees have since been paid.
There were no dividends paid during the year (2012: Nil).
2 Maamba Collieries Limited (MCL)
During the year to 31 March 2013, Maamba Collieries Limited (MCL) reported a total revenue of K15.1 million (2012: K1.5 million) and a net loss of K55.5 million (2012: K8.8 million). The strategic thrust remains in power generation using thermal grade coal to add value to the mining function as a path to viability. MCL has retained ABSA Capital Consortium (ABSA) as the mandated lead arranger to arrange up to US$ 508 million through International Commercial Banks and Development Financial Institutions (DFIs) to partially finance the integrated coal mine revamping and thermal power plant projects. ABSA circulated the Project Information Memorandum (PIM) to all shortlisted prospective lenders.

ZCCM Investments Holdings Plc
13
ZCCM Investments Holdings Plc
Annual Report (continued) for the year ended 31 March 2013
OPERATIONS REPORT (continued) (B) Associate Companies’ Performance (continued)
2 Maamba Collieries Limited (MCL) (continued)
Ongoing construction at Maamba Power Plant
Some of the issues for project finance from likely financiers include the credit enhancement mechanism for receivables and the lack of progress on grid up-gradation work by Zambia Electricity Supply Corporation Limited (ZESCO). MCL is also exploring options other than those loans backed by Sinosure support (ECA) and by DFIs. These options include loans from commercial banks backed by Political Risk Insurance (PRI) cover. MCL expects financial closure to occur by February 2014, assuming that the external concerns on the Escrow arrangement and the grid up-gradation works of ZESCO are resolved to the lenders’ satisfaction. MCL has received the detailed indicative term sheet from the lenders advisor, which would undergo some changes based on the terms approved by the credit committee of each of the banks.
There were no dividends paid during the year (2012: Nil).
3 Konkola Copper Mines Plc (KCM)
KCM’s medium-long term outlook remains dependent on the Konkola Ore Body Expansion (KOBE) Project. The objective of the project is to ensure continuity of mining at Konkola Mine, expand production from the current 2 million metric tonnes of ore per annum to final ramp up level of 7.5 million metric tonnes per annum and extend the life of the mine by up to 30 years. Finished copper production will increase from the current level of approximately 50,000 tonnes per annum to approximately 210,000 tonnes per annum.
On 11 February 2013, ZCCM-IH Plc and Konkola Copper Mines Plc (KCM) entered into a settlement agreement, pursuant to which certain outstanding payments owed by KCM to ZCCM-IH and certain contingent amounts payable under the then existing Price Participation Arrangements (PPAs) which dated back to March 2000 were settled. The PPAs were concurrently terminated. Under the settlement agreement, US$46.3 million was required to be paid by KCM (in instalments) to ZCCM-IH on or before 31 August 2013, and a further US$73.4 million (in instalments) on or before 30 September 2016.
KCM declared a total of K400.37 million (US$75 million) as dividend on 20 October 2012 in respect of the financial year ended 31 March 2013 (2012: Nil). The amount payable to ZCCM-IH was K82.6 million (2012: K8.5 million).
ZCCM Investments Holdings Plc
14
ZCCM Investments Holdings Plc Annual Report (continued) for the year ended 31 March 2013 OPERATIONS REPORT (continued)
(B) Associate Companies’ Performance (continued)
4 Kansanshi Mining Plc
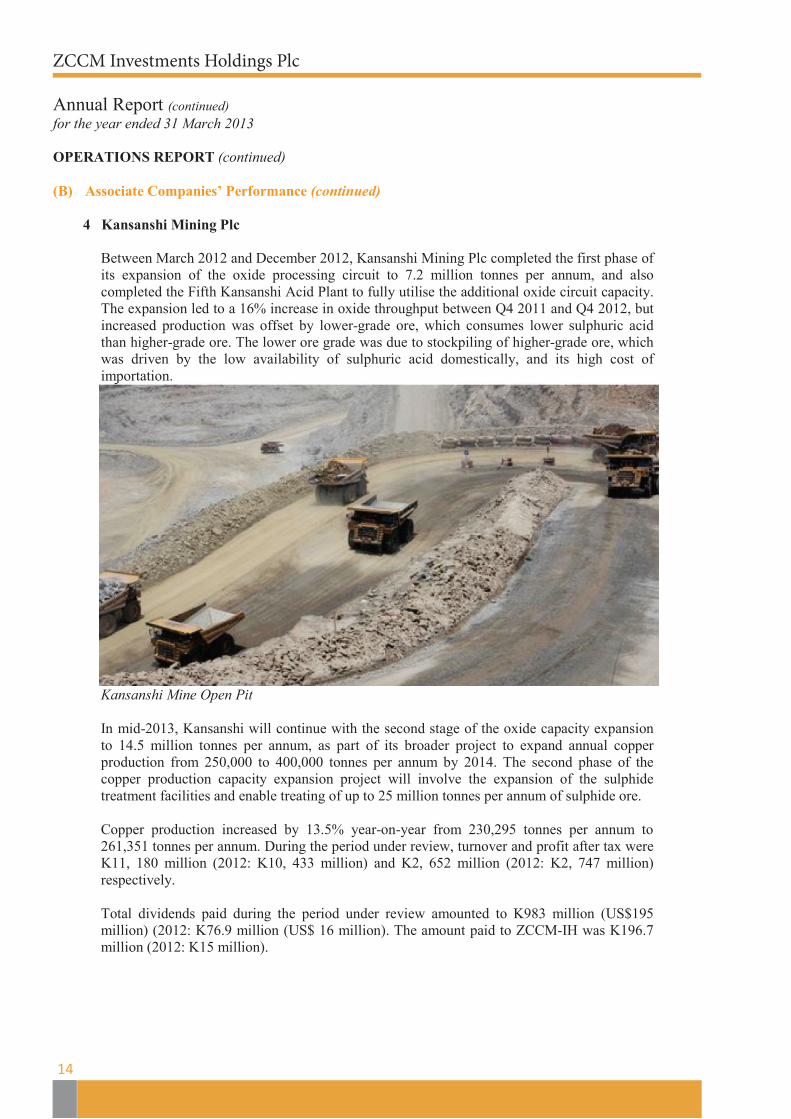
Between March 2012 and December 2012, Kansanshi Mining Plc completed the first phase of its expansion of the oxide processing circuit to 7.2 million tonnes per annum, and also completed the Fifth Kansanshi Acid Plant to fully utilise the additional oxide circuit capacity. The expansion led to a 16% increase in oxide throughput between Q4 2011 and Q4 2012, but increased production was offset by lower-grade ore, which consumes lower sulphuric acid than higher-grade ore. The lower ore grade was due to stockpiling of higher-grade ore, which was driven by the low availability of sulphuric acid domestically, and its high cost of importation.
Kansanshi Mine Open Pit In mid-2013, Kansanshi will continue with the second stage of the oxide capacity expansion to 14.5 million tonnes per annum, as part of its broader project to expand annual copper production from 250,000 to 400,000 tonnes per annum by 2014. The second phase of the copper production capacity expansion project will involve the expansion of the sulphide treatment facilities and enable treating of up to 25 million tonnes per annum of sulphide ore.
Copper production increased by 13.5% year-on-year from 230,295 tonnes per annum to 261,351 tonnes per annum. During the period under review, turnover and profit after tax were K11, 180 million (2012: K10, 433 million) and K2, 652 million (2012: K2, 747 million) respectively. Total dividends paid during the period under review amounted to K983 million (US$195 million) (2012: K76.9 million (US$ 16 million). The amount paid to ZCCM-IH was K196.7 million (2012: K15 million).
ZCCM Investments Holdings Plc
15
ZCCM Investments Holdings Plc
Annual Report (continued) for the year ended 31 March 2013 OPERATIONS REPORT (continued) (B) Associate Companies’ Performance (continued)
5 Copperbelt Energy Corporation Plc (CEC)
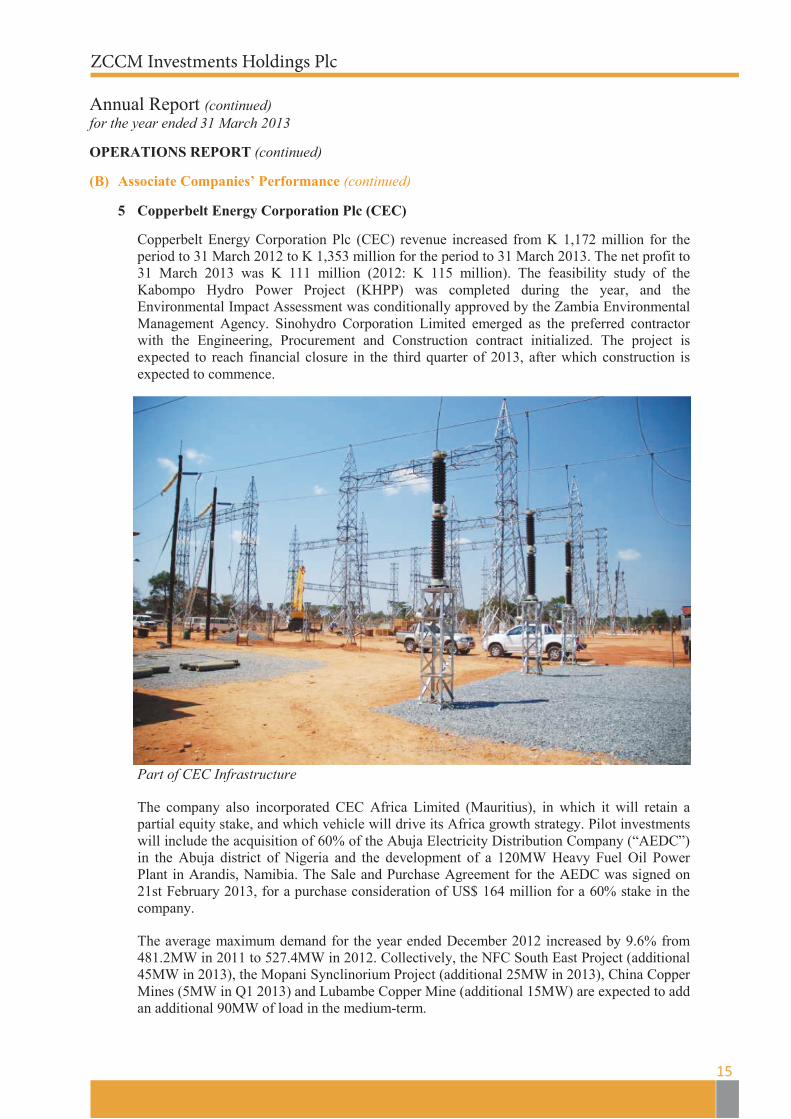
Copperbelt Energy Corporation Plc (CEC) revenue increased from K 1,172 million for the period to 31 March 2012 to K 1,353 million for the period to 31 March 2013. The net profit to 31 March 2013 was K 111 million (2012: K 115 million). The feasibility study of the Kabompo Hydro Power Project (KHPP) was completed during the year, and the Environmental Impact Assessment was conditionally approved by the Zambia Environmental Management Agency. Sinohydro Corporation Limited emerged as the preferred contractor with the Engineering, Procurement and Construction contract initialized. The project is expected to reach financial closure in the third quarter of 2013, after which construction is expected to commence.
Part of CEC Infrastructure The company also incorporated CEC Africa Limited (Mauritius), in which it will retain a partial equity stake, and which vehicle will drive its Africa growth strategy. Pilot investments will include the acquisition of 60% of the Abuja Electricity Distribution Company (“AEDC”) in the Abuja district of Nigeria and the development of a 120MW Heavy Fuel Oil Power Plant in Arandis, Namibia. The Sale and Purchase Agreement for the AEDC was signed on 21st February 2013, for a purchase consideration of US$ 164 million for a 60% stake in the company. The average maximum demand for the year ended December 2012 increased by 9.6% from 481.2MW in 2011 to 527.4MW in 2012. Collectively, the NFC South East Project (additional 45MW in 2013), the Mopani Synclinorium Project (additional 25MW in 2013), China Copper Mines (5MW in Q1 2013) and Lubambe Copper Mine (additional 15MW) are expected to add an additional 90MW of load in the medium-term.
ZCCM Investments Holdings Plc
16
ZCCM Investments Holdings Plc
Annual Report (continued) for the year ended 31 March 2013
OPERATIONS REPORT (continued)
(B) Associate Companies’ Performance (continued) 5 Copperbelt Energy Corporation Plc (CEC) (continued)
The CEC Plc’s share price on the LuSE increased from K 0.65 as at end of April 2012 to K0.83 at end of March 2013, representing a 27.9% capital gain year-on-year. CEC Plc paid dividends of K 55 million during the period under review. The amount paid to ZCCM-IH was K11 million (2012: K12 million).
6 Lubambe Copper Mine Ltd
In July 2012 the Konkola North Project Copper Mines (Konnoco) was renamed Lubambe Copper Mine Plc (LCM). The mine is a modern facility, with fully mechanised underground operations, that was completed two months ahead of schedule and delivered the first copper concentrate in October 2012. The mine is expected to produce 45,000 tonnes of contained copper by 2015 at a steady pace and employ 1,500 people. The total cost of the project is US$456 million. Construction of the concentrator plant was completed in September 2012 which was also completed two months ahead of schedule. Copper concentrate produced by Lubambe will be sold for smelting and refining within Zambia. All the copper concentrate sale agreements have been agreed and signed and the first concentrate was sold in October 2012.
The extension of the LCM includes the expansion of operations into an area six kilometres south of the current mine and within the allocated Large-scale Mining License area. A feasibility study into the viability of the extension is forecast to be completed by the first half of 2014. There were no dividends paid during the year (2012: Nil).
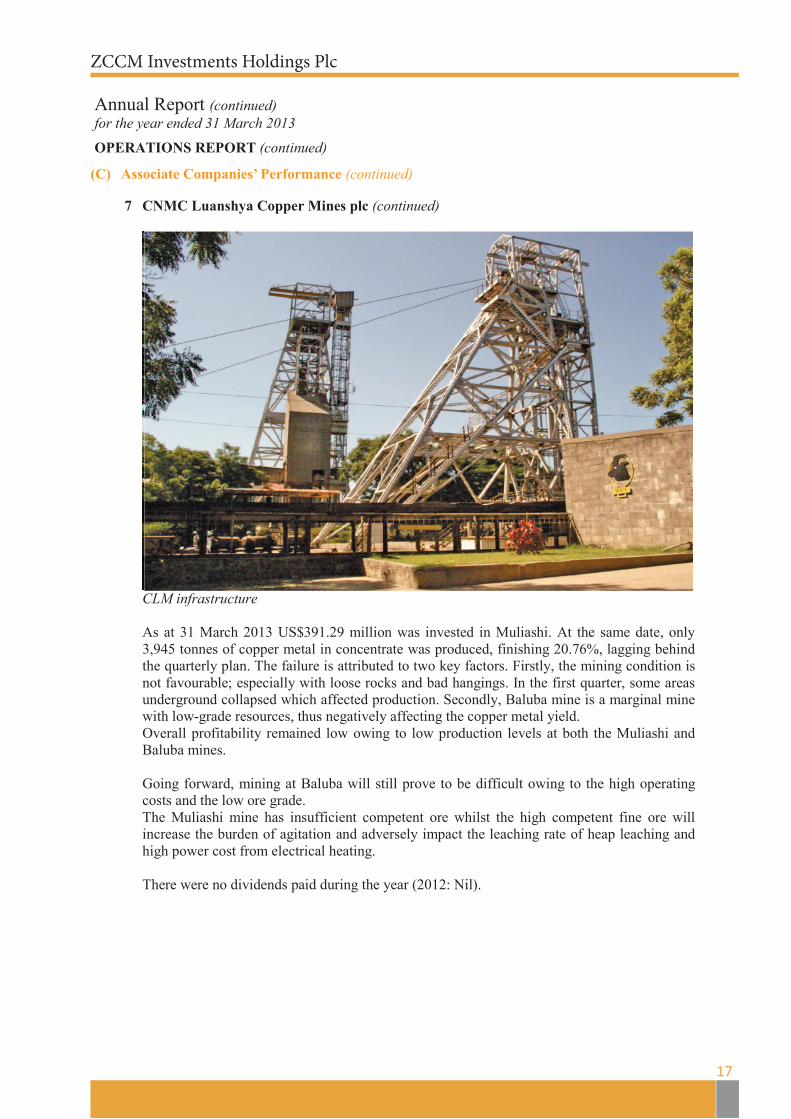
7 CNMC Luanshya Copper Mines plc
Turnover for the period to 31 March 2013 was K1, 093 million and the loss after tax was K7.9 million. The Muliashi Project was commissioned in March 2012. However, low oxide ore grades and below-capacity production led to sub-optimal production performance. The Ore grades were low at 1%, whilst production levels were at 20% capacity. The capacity constraint occurred owing to the natural overlay of friable ore over competent ore, which warrants that friable ore is mined first in order to obtain competent ore. In addition, the delay in the completion of a Heap Leach System to process competent ore further impeded production.
ZCCM Investments Holdings Plc
17
ZCCM Investments Holdings Plc
Annual Report (continued) for the year ended 31 March 2013
OPERATIONS REPORT (continued)
(C) Associate Companies’ Performance (continued)
7 CNMC Luanshya Copper Mines plc (continued)
CLM infrastructure As at 31 March 2013 US$391.29 million was invested in Muliashi. At the same date, only 3,945 tonnes of copper metal in concentrate was produced, finishing 20.76%, lagging behind the quarterly plan. The failure is attributed to two key factors. Firstly, the mining condition is not favourable; especially with loose rocks and bad hangings. In the first quarter, some areas underground collapsed which affected production. Secondly, Baluba mine is a marginal mine with low-grade resources, thus negatively affecting the copper metal yield. Overall profitability remained low owing to low production levels at both the Muliashi and Baluba mines. Going forward, mining at Baluba will still prove to be difficult owing to the high operating costs and the low ore grade. The Muliashi mine has insufficient competent ore whilst the high competent fine ore will increase the burden of agitation and adversely impact the leaching rate of heap leaching and high power cost from electrical heating. There were no dividends paid during the year (2012: Nil).
(C) Associate Companies’ Performance (continued)

ZCCM Investments Holdings Plc
18
ZCCM Investments Holdings Plc
Annual Report (continued) for the year ended 31 March 2013
OPERATIONS REPORT (continued) (C) Other Investments
1 NFC Africa Mining Plc (NFCA)
At NFC Africa, capital expenditure in the financial year ended December 2012 amounted to US$ 26.91 million on the South East Ore body project. It is expected that the total investment will reach approximately US$830 million, with construction over a period of 5 years, and with a labour-force of 5,000.
NFCA Infrastructure Loan financing of US$ 548 million will be acquired from the Export-Import Bank of China to part-finance the South East Ore body project.
There were no dividends paid during the year (2012: Nil).
2 Chibuluma Mines Plc
Chibuluma Mines Plc (CMP) current mining reserves will be exhausted by 2017. Currently, exploration works are progressing at: • Chifupu, where deposit mineral resources have been doubled by additional drilling at
depth in 2011 and 2012. Early indications point to an increase of 800,000 tons, with drilling completion planned for May 2013;
• Chibuluma West Mine, no ore intersections have been recorded in the first two holes drilled in the Kalulushi Anticline region, to the south-west of the West Chibuluma mine;
• Deepening of the South Mine, where drilling was completed in Q3 and confirmed that the Chibuluma South ore-body has pinched out at 600 meters, with no further work planned; and
ZCCM Investments Holdings Plc
19
ZCCM Investments Holdings Plc
Annual Report (continued) for the year ended 31 March 2013
OPERATIONS REPORT (continued)
(C) Other Investments (continued)
3 Chibuluma (continued)
• Chibuluma has been awarded an exploration licence in the area between the
Chibuluma South and West mining licences areas.
For the financial year ended 31 December 2012, CMP had revenue of US$142.6 million, a 2.7% drop from the US$$146.6 million achieved the previous year. The profit for the year was US$30.3 million (2011: US$22.1 million). Chibuluma paid a total of K101 million (K186.8 million in 2012) in dividends for the period to 31 March 2013. The amount paid to ZCCM-IH was K15.2 million (2012: K20 million).
4 Investrust Bank Plc
During the year, the Bank embarked on an ambitious branch expansion programme. It completed and opened the Levy Business Park Branch in April 2012 and initiated works on construction of Kabwe Branch (completed in January 2013), Lusaka Mumbwa Road Agency, branches in Ndola, Choma and Mongu. The Bank also rolled out its branding program and installed state-of-the-art signage at head office and a number of existing and new branch locations. The Bank also re-organised and improved on its credit function by introducing a Credit Risk Management unit alongside the Credit Control unit and strengthened its credit underwriting, review and control processes. The Corporate and Investment Banking unit was also augmented by the appointment of the Head Corporate and Investment Banking and the appointment of additional Relationship Managers. The Bank introduced more products onto its portfolio and launched InvestMobile and extended the use of InvestNet to payment of selected utility bills. The Bank aggressively marketed and popularised the use of its VISA Green Card and recorded massive improvement in its utilisation rate. In 2013 and beyond the Bank will continue its systematic expansion programme and consolidation of its existing operations in all new business units to prop up levels of efficiencies and effectiveness to boost overall bank profitability. The Bank did not declare any dividends in the period under review. The Bank’s share price on the LuSE closed the period under review at K 14.90 (2012: K18.00). There were no dividends paid during the year (2012: Nil).
ZCCM Investments Holdings Plc
20
ZCCM Investments Holdings Plc
Annual Report (continued) for the year ended 31 March 2013
OPERATIONS REPORT (continued)
(C) Other Investments (continued)
5 Chambishi Metals Plc
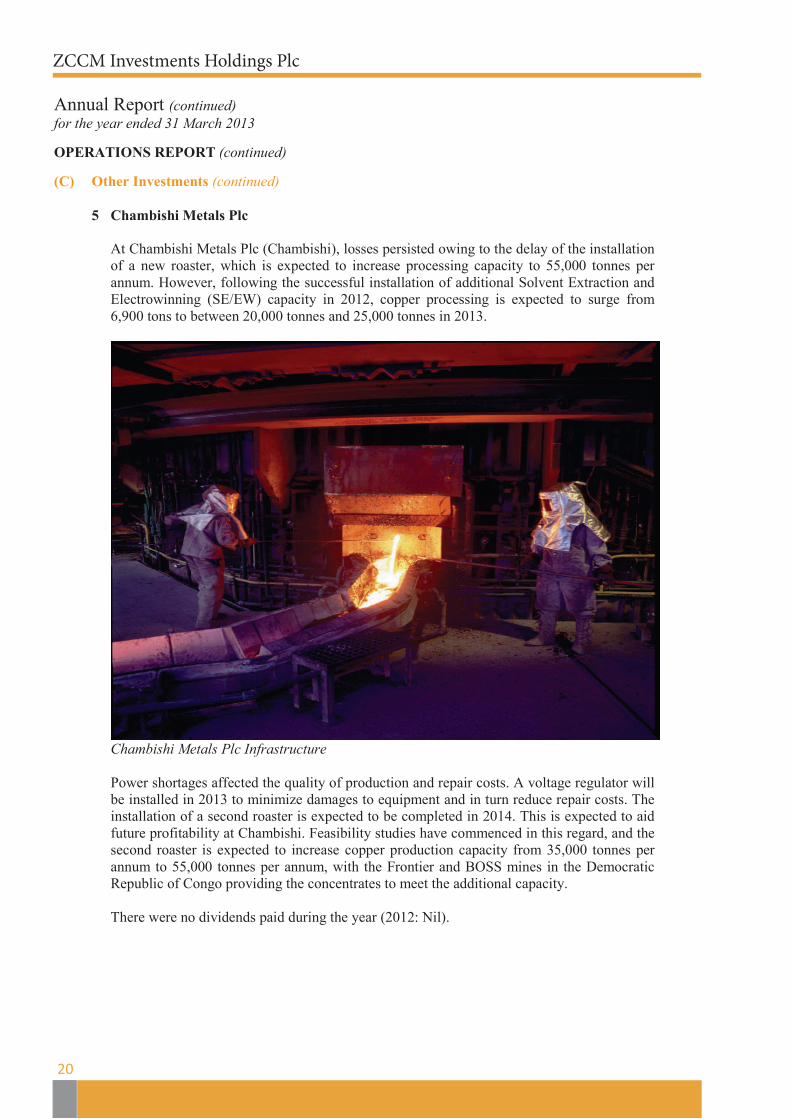
At Chambishi Metals Plc (Chambishi), losses persisted owing to the delay of the installation of a new roaster, which is expected to increase processing capacity to 55,000 tonnes per annum. However, following the successful installation of additional Solvent Extraction and Electrowinning (SE/EW) capacity in 2012, copper processing is expected to surge from 6,900 tons to between 20,000 tonnes and 25,000 tonnes in 2013.
Chambishi Metals Plc Infrastructure Power shortages affected the quality of production and repair costs. A voltage regulator will be installed in 2013 to minimize damages to equipment and in turn reduce repair costs. The installation of a second roaster is expected to be completed in 2014. This is expected to aid future profitability at Chambishi. Feasibility studies have commenced in this regard, and the second roaster is expected to increase copper production capacity from 35,000 tonnes per annum to 55,000 tonnes per annum, with the Frontier and BOSS mines in the Democratic Republic of Congo providing the concentrates to meet the additional capacity.
There were no dividends paid during the year (2012: Nil).
ZCCM Investments Holdings Plc
21
ZCCM Investments Holdings Plc
Annual Report (continued) for the year ended 31 March 2013
OPERATIONS REPORT (continued)
(C) Other Investments (continued)
6 Mopani Copper Mines Plc
During the year ended December 2012, US$ 53 million was spent on the new Synclinorium shaft with major milestones completed this year including starting the construction of the permanent Winder House and the start of the vent shaft pre-sink. The project continues to remain on target to be completed at a total cost of approximately US$ 323 million by the end of 2015 and will significantly extend the economic life of Mopani's operations. In 2012, Mopani announced that the smelter upgrade project (including improving SO2 emission capture to above 97%) is expected to be completed by December 2013, 18 months ahead of schedule. Mopani recorded a decline in revenue from US$ 1,152 million for the year ended December 2011 to US$1,053 million in 2012. Profit after tax in 2012 was US$31million (2011:US$111.7 million). Over the same period, Mopani processed 187,100 tonnes of copper representing a 2% decline year-on-year, and it produced 99,000 tonnes of copper representing an 8% decline year-on-year. The remaining 88,100 tonnes of copper processed was sourced from third parties. The decline in production resulted from the temporary suspension of the heap leach process earlier in the year There were no dividends paid during the year (2012: Nil).
7 Albidon Limited (Munali Nickel project)
Albidon Zambia Ltd was placed under care and maintenance in the period under review so as to maintain the investment at Munali. All staff at the Company were given notices of their redundancies in line with the Zambian law. On the US$12 million tax liability, a delegation from Albidon was advised by the Zambia Revenue Authority (ZRA) that whilst an arrangement could be entered into with the ZRA with respect to a deferred payment plan for the tax, the only way that the liability could be extinguished would be by way of a ‘Statutory Instrument’ (SI) issued by the GRZ.
As there remained ongoing uncertainty as to the Company’s financial future, the Company’s securities remained in voluntary suspension on the Australian Securities Exchange.
ZCCM Investments Holdings Plc
22
ZCCM Investments Holdings Plc Annual Report (continued) for the year ended 31 March 2013
Corporate social responsibility and environmental review (A) Corporate Social Responsibility
The Company’s focus on meeting its social obligations continued during the year, and was to be undertaken through completion of implementation of environmental programmes by the Company’s Environmental Department up to 31 January 2013 and thereafter through METS.
(B) Environmental Review
The two subprojects on the Copperbelt which had not been completed before closure of the Copperbelt Environment Project (CEP) on 31 March 2011 were still not completed in the financial year ended 31 March 2013. The following are the major highlights of environmental activities undertaken during the year:
i) ZCCM-IH successfully disposed, in an environmentally sound manner, the stock of
redundant chemicals which were collected from privatised mines in 2000 and kept in interim storage.
ii) During the year, implementation of the Integrated Case Management (ICM) of children with elevated blood lead levels continued with household interviews, standardized physical examination and treatment at health centers. In addition, an outreach programme involving all parts of the community, providing guidance and education on minimizing exposure to lead continued in identified areas in Kabwe.
iii) A Knowledge, Attitude, Beliefs and Practise (KABP) survey phase 2 was conducted during the year to assess behavioural changes in the lead impacted communities of Kabwe.
iv) Monitoring of the physical integrity of Tailings Dams (TD) and overburden dumps
continued during the year and where necessary, minor maintenance works were done. Feasibility studies by SINO Metals Plc to establish potential for reprocessing of two TDS in Mufulira (TD10 and TD8) continued during the year.
v) ZCCM-IH transferred the responsibility of managing open pits numbers 1, 2 and a
combination of pits 5 and 6 at Kabwe Mine site to Enviro Props Limited after the mine licences area was transferred to the new owners.
Mukela Muyunda Lusaka Chief Executive Officer November 2013

ZCCM Investments Holdings Plc
23
ZCCM Investments Holdings Plc Directors' responsibilities in respect of the preparation of financial statements The directors are responsible for the preparation and fair presentation of the consolidated and separate annual financial statements of ZCCM Investments Holdings Plc, comprising the statements of financial position at 31 March 2013, the statements of comprehensive income, changes in equity and cash flows for the year then ended, and the notes to the financial statements, which include a summary of significant accounting policies and other explanatory notes, in accordance with International Financial Reporting Standards and the requirements of the Companies Act of Zambia. In addition, the directors are responsible for preparing the chairman and directors’ report. The directors are also responsible for such internal controls as they determine is necessary to enable the preparation of financial statements that are free from material misstatement, whether due to fraud or error and for maintaining adequate accounting records and an effective system of risk management. The directors have made an assessment of the company and its subsidiaries to continue as going concerns and have no reason to believe the business will not be going concerns in the year ahead. The auditor is responsible for reporting on whether the consolidated and separate financial statements are fairly presented in accordance with the applicable financial reporting framework. Approval of the financial statements The consolidated and separate annual financial statements of ZCCM Investments Holdings Plc, as identified in the first paragraph, were approved by the board of directors on 25 November 2013 and signed on its behalf by: .............................................. ............................................. Director Director

ZCCM Investments Holdings PlcZCCM Investments Holding Plc
24 KPMG Chartered Accountants, a Zambian Partnership, is a
member firm of the KPMG network of independent member firms affiliated with KPMG International cooperative (“KPMG International”), .a Swiss entity. All rights reserved.
Partners: A list of the partners is available at the above mentioned address
Independent auditor’s report to the shareholders of ZCCM Investments Holdings Plc Report on the financial statements
We have audited the consolidated and separate financial statements of ZCCM Investments Holdings Plc, which comprise the statements of financial position as at 31 March 2013, and the statements of comprehensive income, changes in equity and cash flows for the year then ended, and the notes to the financial statements which include a summary of significant accounting policies and other explanatory notes as set out on pages 26 to 93.
Directors’ responsibility for the financial statements
The Company’s Directors are responsible for the preparation and fair presentation of these financial statements in accordance with International Financial Reporting Standards and the requirements of the Companies Act of Zambia, and for such internal control as the directors determine is necessary to enable the preparation of financial statements that are free from material misstatement, whether due to fraud or error.
Auditor’s responsibility
Our responsibility is to express an opinion on these financial statements based on our audit. We conducted our audit in accordance with International Standards on Auditing. Those standards require that we comply with ethical requirements and plan and perform the audit to obtain reasonable assurance about whether the financial statements are free from material misstatement.
An audit involves performing procedures to obtain audit evidence about the amounts and disclosures in the financial statements. The procedures selected depend on the auditor’s judgement, including the assessment of the risk of material misstatement of the financial statements, whether due to fraud or error. In making those risk assessments, we consider internal control relevant to the entity’s preparation and fair presentation of the financial statements in order to design audit procedures that are appropriate in the circumstances, but not for the purpose of expressing an opinion on the effectiveness of the entity’s internal control. An audit also includes evaluating the appropriateness of accounting policies used and the reasonableness of accounting estimates made by management, as well as evaluating the overall presentation of the financial statements.
We believe that the audit evidence we have obtained is sufficient and appropriate to provide a basis for our audit opinion.
KPMG Chartered Accountants First Floor, Elunda Two Addis Ababa Roundabout Rhodes Park, P.O Box 31282 Lusaka Zambia
Telephone +260 2 11372900
Website www.kpmg.com/zm
ZCCM Investments Holdings Plc
25
Opinion
In our opinion, these financial statements present fairly, in all material respects, the consolidated and separate financial position of ZCCM Investments Holdings Plc as at 31 March 2013, and its consolidated and separate financial performance and consolidated and separate cash flows for the year then ended in accordance with International Financial Reporting Standards and the requirements of the Companies Act of Zambia.
Report on other legal and regulatory requirements
In accordance with Section 173 (3) of the Companies Act of Zambia, we report that, in our opinion, the required accounting records, other records and registers have been properly kept in accordance with the Act. KPMG Chartered Accountants 2013 Lusaka, Zambia
Jason Kazilimani, Jr Partner
ZCCM Investments Holdings Plc
26
ZCCM Investments Holdings Plc
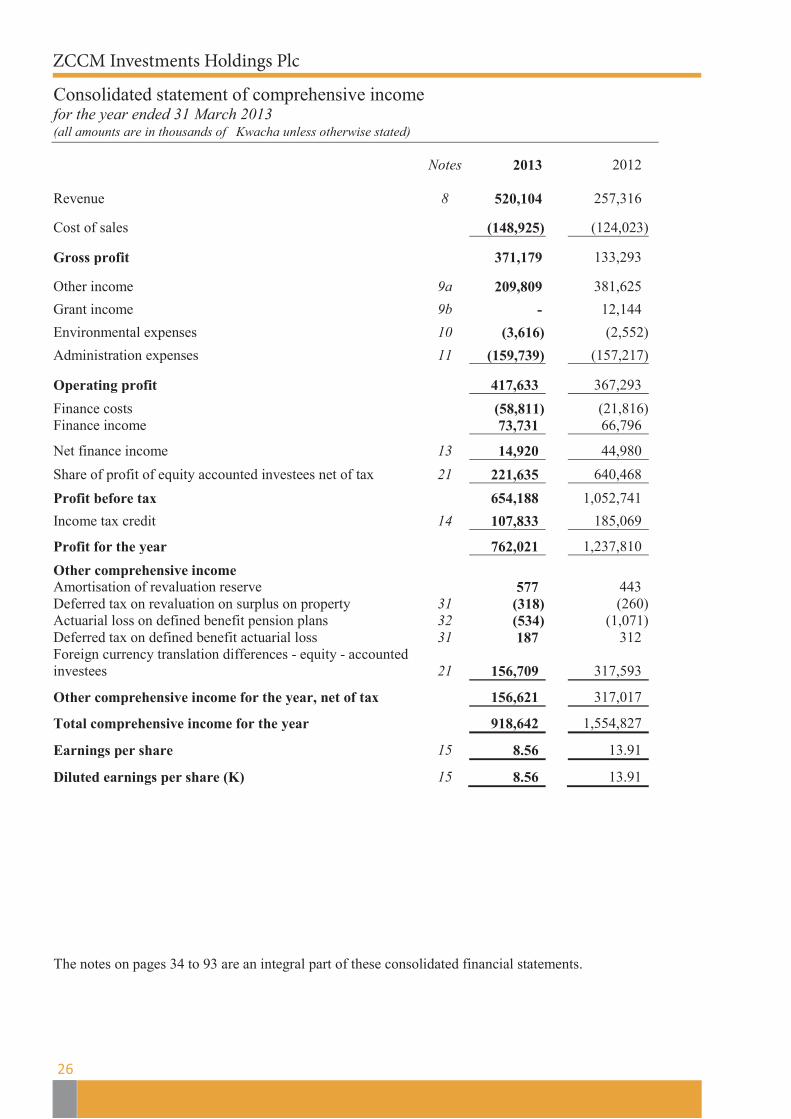
Consolidated statement of comprehensive income for the year ended 31 March 2013 (all amounts are in thousands of Kwacha unless otherwise stated)
Notes 2013
2012
Revenue 8 520,104 257,316 Cost of sales (148,925) (124,023) Gross profit 371,179 133,293 Other income 9a 209,809 381,625
Grant income 9b - 12,144
Environmental expenses 10 (3,616) (2,552)
Administration expenses 11 (159,739) (157,217) Operating profit 417,633 367,293
Finance costs (58,811) (21,816) Finance income 73,731 66,796
Net finance income 13 14,920 44,980
Share of profit of equity accounted investees net of tax 21 221,635 640,468
Profit before tax 654,188 1,052,741
Income tax credit 14 107,833 185,069
Profit for the year 762,021 1,237,810
Other comprehensive income Amortisation of revaluation reserve 577 443 Deferred tax on revaluation on surplus on property 31 (318) (260) Actuarial loss on defined benefit pension plans 32 (534) (1,071) Deferred tax on defined benefit actuarial loss 31 187 312 Foreign currency translation differences - equity - accounted investees 21 156,709 317,593
Other comprehensive income for the year, net of tax 156,621 317,017
Total comprehensive income for the year 918,642 1,554,827
Earnings per share 15 8.56 13.91
Diluted earnings per share (K) 15 8.56 13.91 The notes on pages 34 to 93 are an integral part of these consolidated financial statements.
ZCCM Investments Holdings Plc
27
ZCC M Investments Holdings Plc
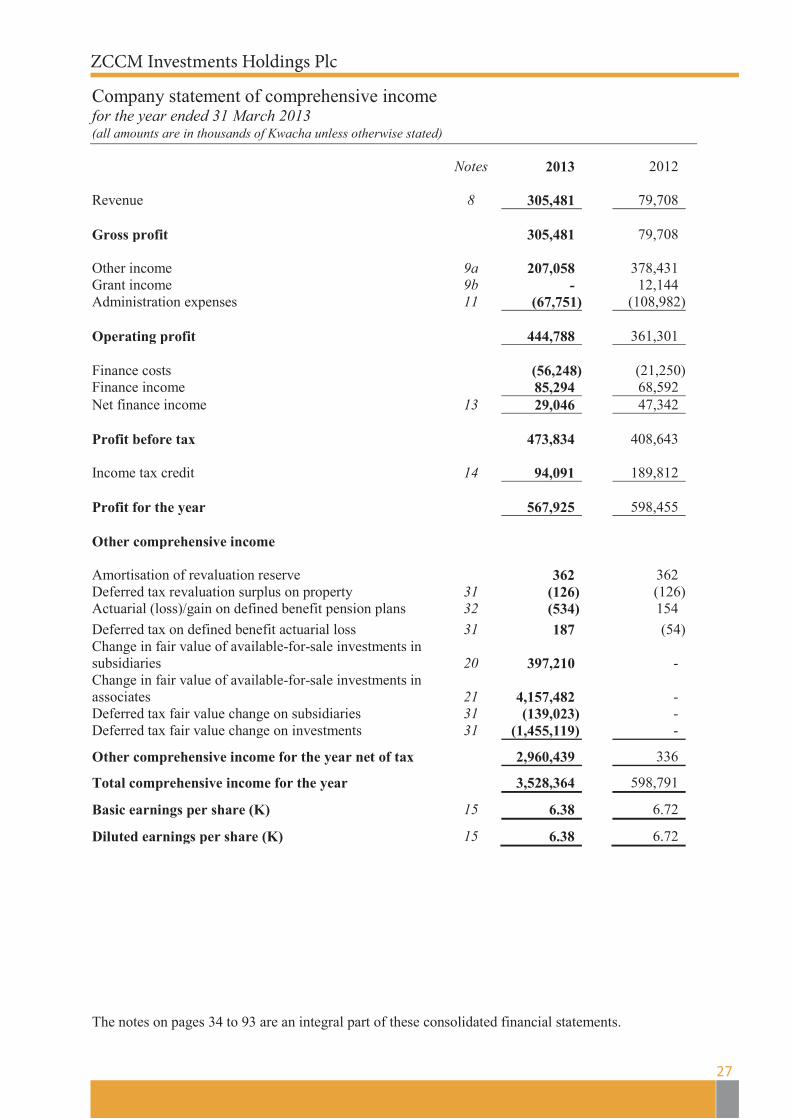
Company statement of comprehensive income for the year ended 31 March 2013 (all amounts are in thousands of Kwacha unless otherwise stated) Notes 2013
2012
Revenue 8 305,481 79,708 Gross profit 305,481 79,708 Other income 9a 207,058 378,431 Grant income 9b - 12,144 Administration expenses 11 (67,751) (108,982) Operating profit 444,788 361,301 Finance costs (56,248) (21,250) Finance income 85,294 68,592 Net finance income 13 29,046 47,342 Profit before tax 473,834 408,643 Income tax credit 14 94,091 189,812 Profit for the year 567,925 598,455 Other comprehensive income Amortisation of revaluation reserve 362 362 Deferred tax revaluation surplus on property 31 (126) (126) Actuarial (loss)/gain on defined benefit pension plans 32 (534) 154 Deferred tax on defined benefit actuarial loss 31 187 (54) Change in fair value of available-for-sale investments in subsidiaries 20 397,210 - Change in fair value of available-for-sale investments in associates 21 4,157,482 - Deferred tax fair value change on subsidiaries 31 (139,023) - Deferred tax fair value change on investments 31 (1,455,119) -
Other comprehensive income for the year net of tax 2,960,439 336
Total comprehensive income for the year 3,528,364 598,791
Basic earnings per share (K) 15 6.38 6.72
Diluted earnings per share (K) 15 6.38 6.72 The notes on pages 34 to 93 are an integral part of these consolidated financial statements.
ZCCM Investments Holdings Plc
28
ZCC M Investments Holdings Plc
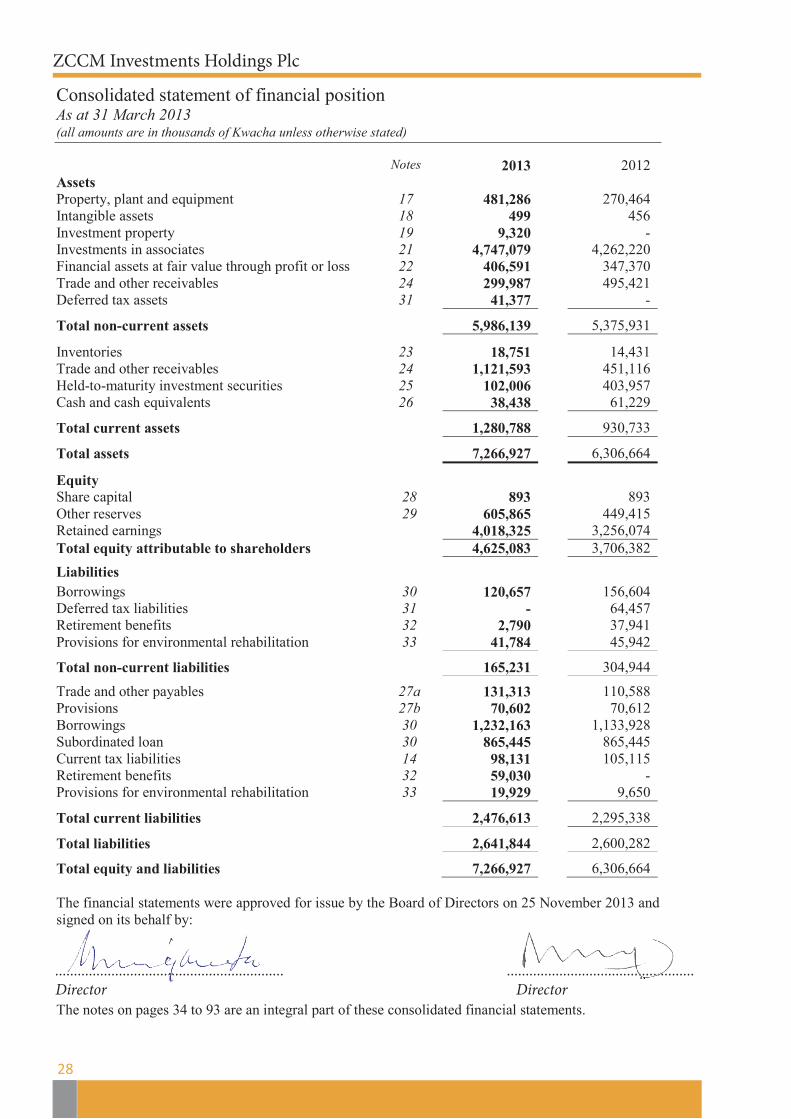
Consolidated statement of financial position As at 31 March 2013 (all amounts are in thousands of Kwacha unless otherwise stated) Notes 2013 2012 Assets Property, plant and equipment 17 481,286 270,464 Intangible assets 18 499 456 Investment property 19 9,320 - Investments in associates 21 4,747,079 4,262,220 Financial assets at fair value through profit or loss 22 406,591 347,370 Trade and other receivables 24 299,987 495,421 Deferred tax assets 31 41,377 -
Total non-current assets 5,986,139 5,375,931
Inventories 23 18,751 14,431 Trade and other receivables 24 1,121,593 451,116 Held-to-maturity investment securities 25 102,006 403,957 Cash and cash equivalents 26 38,438 61,229
Total current assets 1,280,788 930,733
Total assets 7,266,927 6,306,664
Equity Share capital 28 893 893 Other reserves 29 605,865 449,415 Retained earnings 4,018,325 3,256,074 Total equity attributable to shareholders 4,625,083 3,706,382
Liabilities Borrowings 30 120,657 156,604 Deferred tax liabilities 31 - 64,457 Retirement benefits 32 2,790 37,941 Provisions for environmental rehabilitation 33 41,784 45,942
Total non-current liabilities 165,231 304,944
Trade and other payables 27a 131,313 110,588 Provisions 27b 70,602 70,612 Borrowings 30 1,232,163 1,133,928 Subordinated loan 30 865,445 865,445 Current tax liabilities 14 98,131 105,115 Retirement benefits 32 59,030 - Provisions for environmental rehabilitation 33 19,929 9,650
Total current liabilities 2,476,613 2,295,338
Total liabilities 2,641,844 2,600,282
Total equity and liabilities 7,266,927 6,306,664 The financial statements were approved for issue by the Board of Directors on 25 November 2013 and signed on its behalf by:
……………………………. ……………………………. Director Director The notes on pages 34 to 93 are an integral part of these consolidated financial statements.
............................................................. ..................................................Director Director
ZCCM Investments Holdings Plc
29
ZCC M Investments Holdings Plc
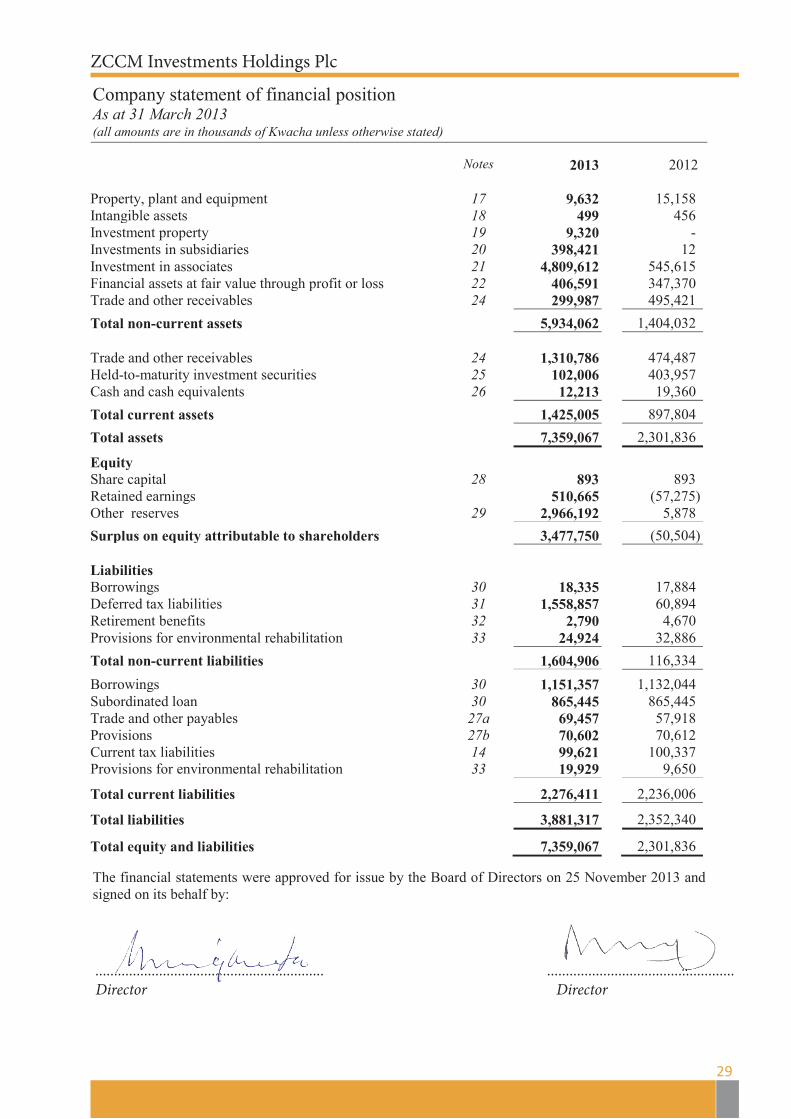
Company statement of financial position As at 31 March 2013 (all amounts are in thousands of Kwacha unless otherwise stated) Notes 2013
2012
Property, plant and equipment 17 9,632 15,158 Intangible assets 18 499 456 Investment property 19 9,320 - Investments in subsidiaries 20 398,421 12 Investment in associates 21 4,809,612 545,615 Financial assets at fair value through profit or loss 22 406,591 347,370 Trade and other receivables 24 299,987 495,421 Total non-current assets 5,934,062 1,404,032 Trade and other receivables 24 1,310,786 474,487 Held-to-maturity investment securities 25 102,006 403,957 Cash and cash equivalents 26 12,213 19,360 Total current assets 1,425,005 897,804 Total assets 7,359,067 2,301,836
Equity Share capital 28 893 893 Retained earnings 510,665 (57,275) Other reserves 29 2,966,192 5,878 Surplus on equity attributable to shareholders 3,477,750 (50,504) Liabilities Borrowings 30 18,335 17,884 Deferred tax liabilities 31 1,558,857 60,894 Retirement benefits 32 2,790 4,670 Provisions for environmental rehabilitation 33 24,924 32,886 Total non-current liabilities 1,604,906 116,334
Borrowings 30 1,151,357 1,132,044 Subordinated loan 30 865,445 865,445 Trade and other payables 27a 69,457 57,918 Provisions 27b 70,602 70,612 Current tax liabilities 14 99,621 100,337 Provisions for environmental rehabilitation 33 19,929 9,650
Total current liabilities 2,276,411 2,236,006
Total liabilities 3,881,317 2,352,340
Total equity and liabilities 7,359,067 2,301,836 The financial statements were approved for issue by the Board of Directors on 25 November 2013 and signed on its behalf by: …………………………… ……………………………….. Director Director The notes on pages 34 to 93 are an integral part of these consolidated financial statements.
............................................................. ..................................................Director Director
ZCC
M In
vest
men
ts H
oldi
ng P
lc
30
ZCC
M In
vest
men
ts H
oldi
ngs P
lc
Con
solid
ated
stat
emen
t of c
hang
es in
equ
ity
for t
he y
ear e
nded
31
Mar
ch 2
013
(all
amou
nts a
re in
thou
sand
s of K
wac
ha u
nles
s oth
erw
ise st
ated
) 20
12
N
otes
Sh
are
capi
tal
R
eval
uatio
n re
serv
e
T
rans
latio
n re
serv
e
R
etai
ned
earn
ings
T
otal
B
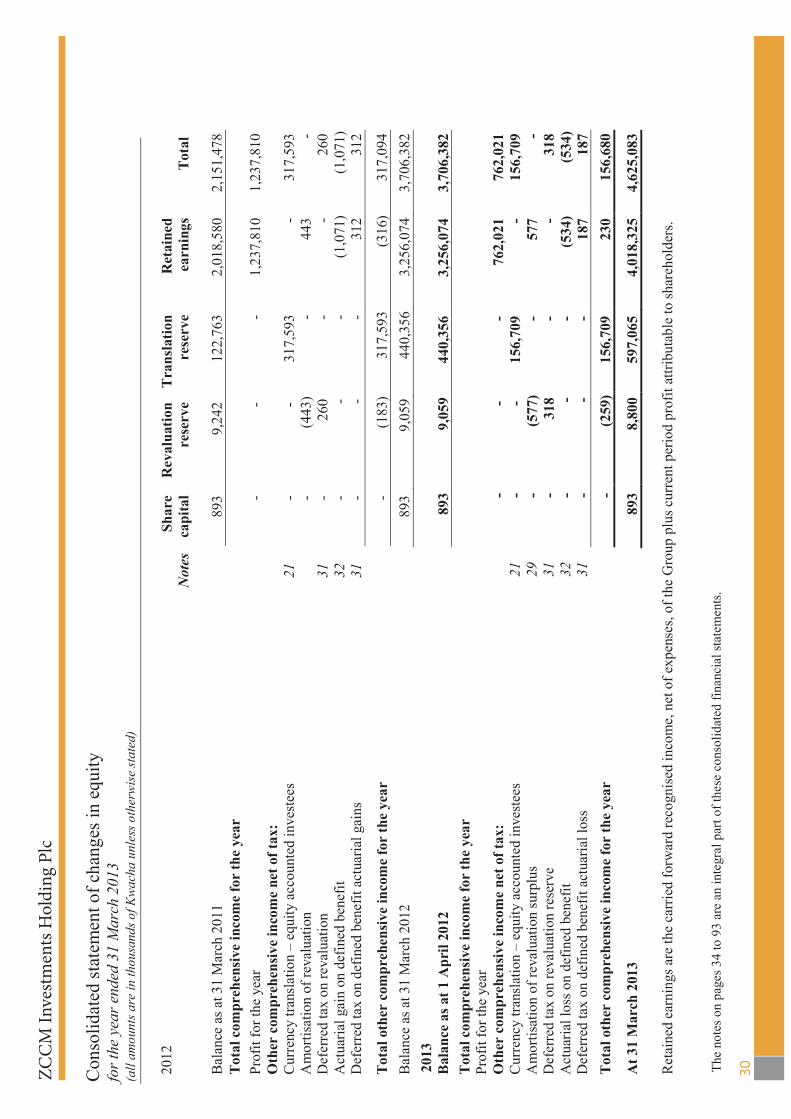
alan
ce a
s at 3
1 M
arch
201
1
893
9,24
2 12
2,76
3 2,
018,
580
2,15
1,47
8 T
otal
com
preh
ensi
ve in
com
e fo
r th
e ye
ar
Prof
it fo
r the
yea
r
- -
- 1,
237,
810
1,23
7,81
0 O
ther
com
preh
ensi
ve in
com
e ne
t of t
ax:
Cur
renc
y tra
nsla
tion
– eq
uity
acc
ount
ed in
vest
ees
21
- -
317,
593
- 31
7,59
3 A
mor
tisat
ion
of re
valu
atio
n
-
(443
) -
443
- D
efer
red
tax
on re
valu
atio
n
31
- 26
0 -
- 26
0 A
ctua
rial g
ain
on d
efin
ed b
enef
it
32
- -
- (1
,071
) (1
,071
) D
efer
red
tax
on d
efin
ed b
enef
it ac
tuar
ial g
ains
31
-
- -
312
312
Tot
al o
ther
com
preh
ensi
ve in
com
e fo
r th
e ye
ar
-
(183
) 31
7,59
3 (3
16)
317,
094
Bal
ance
as a
t 31
Mar
ch 2
012
893
9,05
9 44
0,35
6 3,
256,
074
3,70
6,38
2 20
13
Bal
ance
as a
t 1 A
pril
2012
893
9,05
9 44
0,35
6 3,
256,
074
3,70
6,38
2 T
otal
com
preh
ensi
ve in
com
e fo
r th
e ye
ar
Prof
it fo
r the
yea
r
O
ther
com
preh
ensi
ve in
com
e ne
t of t
ax:
-
- -
762,
021
762,
021
Cur
renc
y tra
nsla
tion
– eq
uity
acc
ount
ed in
vest
ees
21
- -
156,
709
- 15
6,70
9 A
mor
tisat
ion
of re
valu
atio
n su
rplu
s 29
-
(577
) -
577
- D
efer
red
tax
on re
valu
atio
n re
serv
e 31
-
318
- -
318
Act
uaria
l los
s on
defin
ed b
enef
it 32
-
- -
(534
) (5
34)
Def
erre
d ta
x on
def
ined
ben
efit
actu
aria
l los
s 31
-
- -
187
187
Tot
al o
ther
com
preh
ensi
ve in
com
e fo
r th
e ye
ar
-
(259
) 15
6,70
9 23
0 15
6,68
0
At 3
1 M
arch
201
3
893
8,80
0 59
7,06
5 4,
018,
325
4,62
5,08
3 R
etai
ned
earn
ings
are
the
carr
ied
forw
ard
reco
gnis
ed in
com
e, n
et o
f exp
ense
s, of
the
Gro
up p
lus c
urre
nt p
erio
d pr
ofit
attri
buta
ble
to sh
areh
olde
rs.
The
note
s on
page
s 34
to 9
3 ar
e an
inte
gral
par
t of t
hese
con
solid
ated
fina
ncia
l sta
tem
ents
.

ZCC
M In
vest
men
ts H
oldi
ng P
lc
31
ZCC
M In
vest
men
ts H
oldi
ngs P
lc
Com
pany
stat
emen
t of c
hang
es in
equ
ity
for t
he y
ear e
nded
31
Mar
ch 2
013
(all
amou
nts a
re in
thou
sand
s of K
wac
ha u
nles
s oth
erw
ise st
ated
)
2012
N
otes
Sh
are
capi
tal
Rev
alua
tion
rese
rve
Fair
val
ue
rese
rve
Ret
aine
d ea
rnin
g
Tot
al
Bal
ance
as a
t 1 A
pril
2011
893
6,11
4 -
(656
,192
) (6
49,1
85)
Prof
it fo
r the
yea
r
- -
59
8,45
5 59
8,45
5 O
ther
com
preh
ensi
ve in
com
e ne
t of t
ax
Am
ortis
atio
n of
reva
luat
ion
surp
lus
29
- (3
62)
36
2 -
Def
erre
d ta
x on
reva
luat
ion
surp
lus
31
- 12
6
- 12
6 A
ctua
rial g
ain
on d
efin
ed b
enef
it
32
- -
15
4 15
4 D
efer
red
tax
on d
efin
ed b
enef
it ac
tuar
ial g
ain
31
- -
(5
4)
(54)
O
ther
com
preh
ensi
ve in
com
e ne
t of t
ax
-
(236
) -
462
226
Tota
l com
preh
ensi
ve in
com
e fo
r the
yea
r
- (2
36)
59
8,91
7 59
8,68
1
Bal
ance
at 3
1 M
arch
201
2 as
rest
ated
893
5
,878
-
(57,
275)
(5
0,50
4)
2013
B
alan
ce a
s at 1
Apr
il 20
12
89
3 5,
878
- (5
7,27
5)
(50,
504)
T
otal
com
preh
ensi
ve in
com
e fo
r th
e ye
ar
Prof
it fo
r the
yea
r
- -
- 56
7,92
5 56
7,92
5 O
ther
com
preh
ensi
ve in
com
e ne
t of t
ax
Am
ortis
atio
n of
reva
luat
ion
surp
lus
-
(362
) -
362
- D
efer
red
tax
on re
valu
atio
n re
serv
e 31
-
126
-
-
12
6 A
ctua
rial g
ain
on d
efin
ed b
enef
it
32
- -
- (5
34)
(534
) D
efer
red
tax
on d
efin
ed b
enef
it ac
tuar
ial g
ain
31
- -
- 18
7 18
7 C
hang
e in
fair
valu
e of
ava
ilabl
e-fo
r-sal
e in
vest
men
ts in
subs
idia
ries
20
- -
397,
210
- 39
7,21
0 D
efer
red
tax
fair
valu
e ch
ange
on
subs
idia
ries
31
- -
(139
,023
) -
(139
,023
) C
hang
e in
fair
valu
e of
ava
ilabl
e-fo
r-sal
e in
vest
men
ts in
ass
ocia
tes
21
- -
4,15
7,48
2 -
4,15
7,48
2 D
efer
red
tax
fair
valu
e ch
ange
on
inve
stm
ents
31
-
- (1
,455
,119
) -
(1,4
55,1
19)
Tot
al o
ther
com
preh
ensi
ve in
com
e fo
r th
e ye
ar
-
(236
)
2,9
60,5
50
15
2,96
0,32
9
Tot
al c
ompr
ehen
sive
inco
me
for
the
year
- (2
36)
2
,960
,550
567,
940
3,
528,
254
At 3
1 M
arch
201
3
893
5,
642
2,9
60,5
50
51
0,66
5
3,47
7,75
0
Ret
aine
d ea
rnin
gs a
re th
e ca
rrie
d fo
rwar
d re
cogn
ised
inco
me,
net
of e
xpen
ses,
of th
e C
ompa
ny p
lus c
urre
nt p
erio
d pr
ofit
attri
buta
ble
to sh
areh
olde
rs.
The
note
s on
page
s 34
to 9
3 ar
e an
inte
gral
par
t of t
hese
con
solid
ated
fina
ncia
l sta
tem
ents
.
ZCCM Investments Holdings PlcZCCM Investments Holdings Plc
Consolidated statement of cash flows for the year ended 31 March 2013 (all amounts are in thousands of Kwacha unless otherwise stated)
32
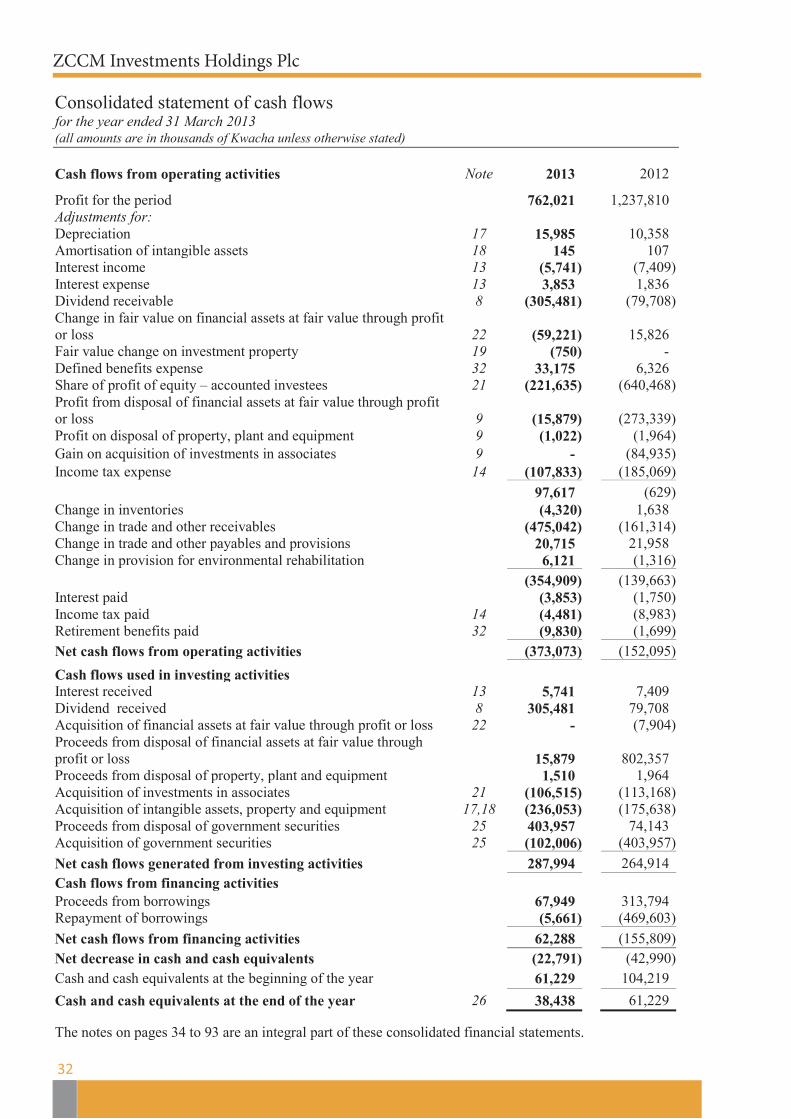
Cash flows from operating activities Note 2013 2012
Profit for the period 762,021 1,237,810 Adjustments for: Depreciation 17 15,985 10,358 Amortisation of intangible assets 18 145 107 Interest income 13 (5,741) (7,409) Interest expense 13 3,853 1,836 Dividend receivable 8 (305,481) (79,708) Change in fair value on financial assets at fair value through profit or loss
22
(59,221)
15,826 Fair value change on investment property 19 (750) - Defined benefits expense 32 33,175 6,326 Share of profit of equity – accounted investees 21 (221,635) (640,468) Profit from disposal of financial assets at fair value through profit or loss
9
(15,879)
(273,339) Profit on disposal of property, plant and equipment 9 (1,022) (1,964) Gain on acquisition of investments in associates 9 - (84,935) Income tax expense 14 (107,833) (185,069) 97,617 (629) Change in inventories (4,320) 1,638 Change in trade and other receivables (475,042) (161,314) Change in trade and other payables and provisions 20,715 21,958 Change in provision for environmental rehabilitation 6,121 (1,316) (354,909) (139,663) Interest paid (3,853) (1,750) Income tax paid 14 (4,481) (8,983) Retirement benefits paid 32 (9,830) (1,699) Net cash flows from operating activities (373,073) (152,095)
Cash flows used in investing activities Interest received 13 5,741 7,409 Dividend received 8 305,481 79,708 Acquisition of financial assets at fair value through profit or loss 22 - (7,904) Proceeds from disposal of financial assets at fair value through profit or loss
15,879 802,357
Proceeds from disposal of property, plant and equipment 1,510 1,964 Acquisition of investments in associates 21 (106,515) (113,168) Acquisition of intangible assets, property and equipment 17,18 (236,053) (175,638) Proceeds from disposal of government securities 25 403,957 74,143 Acquisition of government securities 25 (102,006) (403,957) Net cash flows generated from investing activities 287,994 264,914 Cash flows from financing activities Proceeds from borrowings 67,949 313,794 Repayment of borrowings (5,661) (469,603) Net cash flows from financing activities 62,288 (155,809) Net decrease in cash and cash equivalents (22,791) (42,990) Cash and cash equivalents at the beginning of the year 61,229 104,219 Cash and cash equivalents at the end of the year 26 38,438 61,229
The notes on pages 34 to 93 are an integral part of these consolidated financial statements.
ZCCM Investments Holdings PlcZCCM Investments Holdings Plc
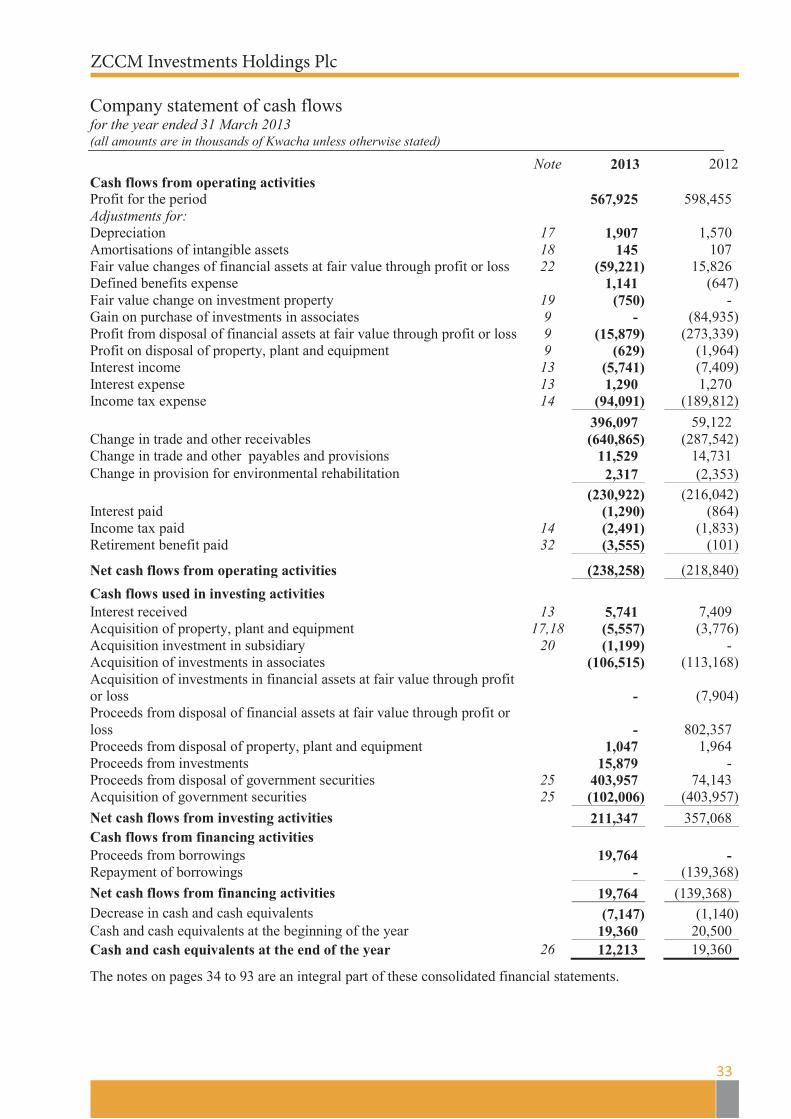
Company statement of cash flows for the year ended 31 March 2013 (all amounts are in thousands of Kwacha unless otherwise stated)
33
Note 2013 2012 Cash flows from operating activities Profit for the period 567,925 598,455 Adjustments for: Depreciation 17 1,907 1,570 Amortisations of intangible assets 18 145 107 Fair value changes of financial assets at fair value through profit or loss 22 (59,221) 15,826 Defined benefits expense 1,141 (647) Fair value change on investment property 19 (750) - Gain on purchase of investments in associates 9 - (84,935) Profit from disposal of financial assets at fair value through profit or loss 9 (15,879) (273,339) Profit on disposal of property, plant and equipment 9 (629) (1,964) Interest income 13 (5,741) (7,409) Interest expense 13 1,290 1,270 Income tax expense 14 (94,091) (189,812) 396,097 59,122 Change in trade and other receivables (640,865) (287,542) Change in trade and other payables and provisions 11,529 14,731 Change in provision for environmental rehabilitation 2,317 (2,353) (230,922) (216,042) Interest paid (1,290) (864) Income tax paid 14 (2,491) (1,833) Retirement benefit paid 32 (3,555) (101)
Net cash flows from operating activities (238,258) (218,840)
Cash flows used in investing activities Interest received 13 5,741 7,409 Acquisition of property, plant and equipment 17,18 (5,557) (3,776) Acquisition investment in subsidiary 20 (1,199) - Acquisition of investments in associates (106,515) (113,168) Acquisition of investments in financial assets at fair value through profit or loss -
(7,904)
Proceeds from disposal of financial assets at fair value through profit or loss -
802,357
Proceeds from disposal of property, plant and equipment 1,047 1,964 Proceeds from investments 15,879 - Proceeds from disposal of government securities 25 403,957 74,143 Acquisition of government securities 25 (102,006) (403,957) Net cash flows from investing activities 211,347 357,068 Cash flows from financing activities Proceeds from borrowings 19,764 - Repayment of borrowings - (139,368) Net cash flows from financing activities 19,764 (139,368) Decrease in cash and cash equivalents (7,147) (1,140) Cash and cash equivalents at the beginning of the year 19,360 20,500 Cash and cash equivalents at the end of the year 26 12,213 19,360
The notes on pages 34 to 93 are an integral part of these consolidated financial statements.
ZCCM Investments Holdings PlcZCCM Investments Holdings Plc
Notes to the financial statements for the year ended 31 March 2013
(all amounts are in thousands of Kwacha unless otherwise stated)
34
1 Reporting entity ZCCM Investments Holdings Plc (the “Company” or “ZCCM – IH”) is domiciled in Zambia. The
address of the Company is Mukuba Pension House, 5309 Dedan Kimathi Road. P.O Box 30048, Lusaka. The consolidated financial statements of the Company as of and for the year ended 31 March 2013 comprise the Company and its subsidiaries (together referred to as “the Group”) and the Group’s interest in associates. The principal activity of the Company is to manage the Zambian Government’s stake in the mining sector.
The Company’s shares are listed on the Lusaka Stock Exchange (LuSE), the London Stock Exchange and Euronext.
Where reference is made in the basis of preparation to Group it should be interpreted as being applied to the consolidated and separate financial statements as the context requires.
2 Basis of preparation
(a) Statement of compliance
The financial statements have been prepared in accordance with International Financial Reporting Standards (IFRSs) as issued by the International Accounting Standard Board (IASB) and in the manner required by the Companies Act of Zambia.
(b)
Basis of measurement
The financial statements have been prepared on the historical cost basis except for the following material items in the statement of financial position:
• Non – derivative financial instruments at fair value through profit or loss are measured at fair value.
• Investment property is measured at fair value. • The liability for the defined benefit obligation is recognised as the present value of the defined
obligation and is limited as explained in Note 3.10 (ii). • Available-for-sale investments are measured at fair value. • An investment in associates is measured at fair value in the company.
(c) Functional and presentation currency
These financial statements are presented in Zambian Kwacha, which is the Company’s functional currency. Except as otherwise indicated, financial information presented in Kwacha has been rounded to the nearest thousand. Rebasing of the Zambian Kwacha The Zambian currency (The Kwacha) was rebased effective 1 January 2013, by dividing the nominal value of the existing currency by a multiple of one thousand so that one thousand Kwacha yielded a face value of one Kwacha. All reporting entities with financial year ends after 31 December 2012 are required to prepare financial statements in the new (rebased) currency. Accordingly, the comparatives have been rebased by dividing them by 1,000.
(a) Statement of compliance
The financial statements have been prepared in accordance with International Financial Reporting Standards (IFRSs) as issued by the International Accounting Standard Board (IASB) and in the manner required by the Companies Act of Zambia.
ZCCM Investments Holdings Plc
Notes to the financial statements (continued) for the year ended 31 March 2013 (all amounts are in thousands of Kwacha unless otherwise stated)
35
2 Basis of preparation (continued)
(b) Basis of measurement
The financial statements have been prepared on the historical cost basis except for the following material items in the statement of financial position:
• Non – derivative financial instruments at fair value through profit or loss are measured at fair value.
• Investment property is measured at fair value. • The liability for the defined benefit obligation is recognised as the present value of the defined
obligation and is limited as explained in Note 3.10 (ii). • Available-for-sale investments are measured at fair value. • An investment in associates is measured at fair value in the company.
(c) Functional and presentation currency
These financial statements are presented in Zambian Kwacha, which is the Company’s functional currency. Except as otherwise indicated, financial information presented in Kwacha has been rounded to the nearest thousand.
Rebasing of the Zambian Kwacha
The Zambian currency (The Kwacha) was rebased effective 1 January 2013, by dividing the nominal value of the existing currency by a multiple of one thousand so that one thousand Kwacha yielded a face value of one Kwacha. All reporting entities with financial year ends after 31 December 2012 are required to prepare financial statements in the new (rebased) currency. Accordingly, the comparatives have been rebased by dividing them by 1,000.
(d)
Use of estimates and judgements
The preparation of financial statements in conformity with IFRSs requires management to make judgements, estimates and assumptions that affect the application of accounting policies and the reported amounts of assets, liabilities, income and expenses. Actual results may differ from these estimates.
Estimates and underlying assumptions are reviewed on an ongoing basis. Revisions to accounting estimates are recognised in the period in which the estimates are revised and in any future periods affected.
Information about assumptions and estimations of uncertainties that have a significant risk of resulting in material adjustment within the next financial period, and critical judgements in applying accounting policies that have the most significant effect on the amounts recognised in the financial statements is described in note 6.
(e) Change in accounting policy
In 2013, ZCCM-IH Plc decided to change its accounting policy for measuring its investments in subsidiaries and associates in the separate financial statements from cost to fair value. As a result of the change, the Group now measures its investment in subsidiaries and associates using various valuation models:
• Investments in subsidiaries are measured at fair value using a discounted cash flow valuation model.
• Investments in associates are measured at fair value using capitalisation of maintainable earnings method based on a price-earnings ratio, price book ratio and EV/EBITDA ratio.
The valuation of ZCCM-IH’s investments in subsidiaries and associates at 31 March 2013 resulted in a change in accounting policy, which would ordinarily require retrospective restatements of its financial statements. However the following limitations have made it impracticable for the entity to do so;
ZCCM Investments Holdings PlcZCCM Investments Holdings Plc
Notes to the financial statements (continued) for the year ended 31 March 2013 (all amounts are in thousands of Kwacha unless otherwise stated)
35
2 Basis of preparation (continued)
(b) Basis of measurement
The financial statements have been prepared on the historical cost basis except for the following material items in the statement of financial position:
• Non – derivative financial instruments at fair value through profit or loss are measured at fair value.
• Investment property is measured at fair value. • The liability for the defined benefit obligation is recognised as the present value of the defined
obligation and is limited as explained in Note 3.10 (ii). • Available-for-sale investments are measured at fair value. • An investment in associates is measured at fair value in the company.
(c) Functional and presentation currency
These financial statements are presented in Zambian Kwacha, which is the Company’s functional currency. Except as otherwise indicated, financial information presented in Kwacha has been rounded to the nearest thousand.
Rebasing of the Zambian Kwacha
The Zambian currency (The Kwacha) was rebased effective 1 January 2013, by dividing the nominal value of the existing currency by a multiple of one thousand so that one thousand Kwacha yielded a face value of one Kwacha. All reporting entities with financial year ends after 31 December 2012 are required to prepare financial statements in the new (rebased) currency. Accordingly, the comparatives have been rebased by dividing them by 1,000.
(d)
Use of estimates and judgements
The preparation of financial statements in conformity with IFRSs requires management to make judgements, estimates and assumptions that affect the application of accounting policies and the reported amounts of assets, liabilities, income and expenses. Actual results may differ from these estimates.
Estimates and underlying assumptions are reviewed on an ongoing basis. Revisions to accounting estimates are recognised in the period in which the estimates are revised and in any future periods affected.
Information about assumptions and estimations of uncertainties that have a significant risk of resulting in material adjustment within the next financial period, and critical judgements in applying accounting policies that have the most significant effect on the amounts recognised in the financial statements is described in note 6.
(e) Change in accounting policy
In 2013, ZCCM-IH Plc decided to change its accounting policy for measuring its investments in subsidiaries and associates in the separate financial statements from cost to fair value. As a result of the change, the Group now measures its investment in subsidiaries and associates using various valuation models:
• Investments in subsidiaries are measured at fair value using a discounted cash flow valuation model.
• Investments in associates are measured at fair value using capitalisation of maintainable earnings method based on a price-earnings ratio, price book ratio and EV/EBITDA ratio.
The valuation of ZCCM-IH’s investments in subsidiaries and associates at 31 March 2013 resulted in a change in accounting policy, which would ordinarily require retrospective restatements of its financial statements. However the following limitations have made it impracticable for the entity to do so;
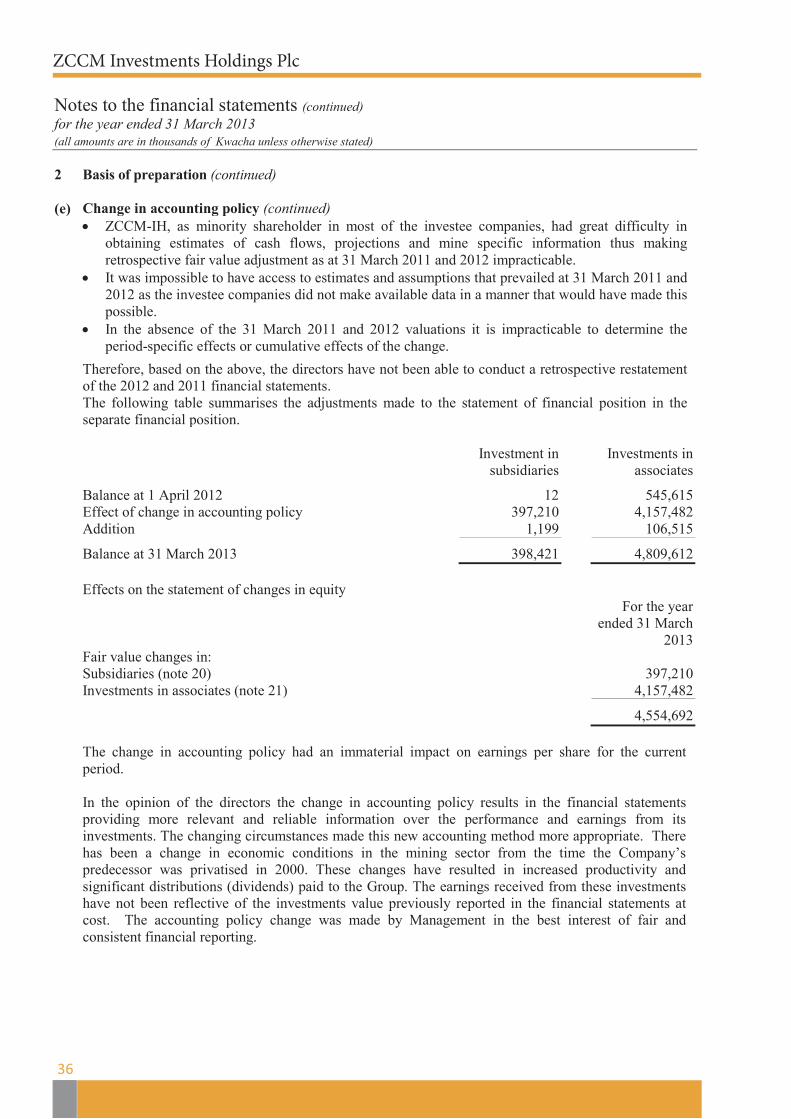
ZCCM Investments Holdings PlcZCCM Investments Holdings Plc
Notes to the financial statements (continued) for the year ended 31 March 2013 (all amounts are in thousands of Kwacha unless otherwise stated)
36
2 Basis of preparation (continued)
(e) Change in accounting policy (continued) • ZCCM-IH, as minority shareholder in most of the investee companies, had great difficulty in
obtaining estimates of cash flows, projections and mine specific information thus making retrospective fair value adjustment as at 31 March 2011 and 2012 impracticable.
• It was impossible to have access to estimates and assumptions that prevailed at 31 March 2011 and 2012 as the investee companies did not make available data in a manner that would have made this possible.
• In the absence of the 31 March 2011 and 2012 valuations it is impracticable to determine the period-specific effects or cumulative effects of the change.
Therefore, based on the above, the directors have not been able to conduct a retrospective restatement of the 2012 and 2011 financial statements. The following table summarises the adjustments made to the statement of financial position in the separate financial position.
Investment in subsidiaries
Investments in associates
Balance at 1 April 2012 12 545,615 Effect of change in accounting policy 397,210 4,157,482 Addition 1,199 106,515
Balance at 31 March 2013 398,421 4,809,612
Effects on the statement of changes in equity For the year
ended 31 March 2013
Fair value changes in: Subsidiaries (note 20) 397,210 Investments in associates (note 21) 4,157,482
4,554,692
The change in accounting policy had an immaterial impact on earnings per share for the current period. In the opinion of the directors the change in accounting policy results in the financial statements providing more relevant and reliable information over the performance and earnings from its investments. The changing circumstances made this new accounting method more appropriate. There has been a change in economic conditions in the mining sector from the time the Company’s predecessor was privatised in 2000. These changes have resulted in increased productivity and significant distributions (dividends) paid to the Group. The earnings received from these investments have not been reflective of the investments value previously reported in the financial statements at cost. The accounting policy change was made by Management in the best interest of fair and consistent financial reporting.
ZCCM Investments Holdings PlcZCCM Investments Holdings Plc
Notes to the financial statements (continued) for the year ended 31 March 2013 (all amounts are in thousands of Kwacha unless otherwise stated)
37
3
Significant accounting policies
The accounting policies set out below have been applied consistently to all periods presented in these consolidated financial statements, and have been applied consistently by Group entities except for the change in accounting policy as explained in note 2(e).
3.1 Basis of consolidation
(i)
(ii)
(iii)
Business combinations Business combinations are accounted for using the acquisition method as at the acquisition date, which is the date on which control is transferred to the Group. Control is the power to govern the financial and operating policies of an entity so as to obtain benefits from its activities. In assessing control, the Group takes into consideration potential voting rights that currently are exercisable.
The Group measures goodwill at the acquisition date as:
The fair value of the consideration transferred; plus; The recognised amount of any non-controlling interest in the acquiree; plus; If the business combination is achieved in stages, the fair value of the pre- existing equity interest
in the acquire; less The net recognised amount (generally fair value) of the identifiable assets acquired and liabilities
assumed.
When the excess is negative, a bargain purchase gain is recognised immediately in the statement of comprehensive income. The consideration transferred does not include amounts related to the settlement of pre-existing relationships. Such amounts generally are recognised in profit or loss.
Transaction costs, other than those associated with the issue of debt or equity securities, that the Group incurs in connection with the business combination are expensed as incurred. Any contingent consideration payable is measured at fair value at the acquisition date. If the contingent consideration is classified as equity, then it is not remeasured and settlement is accounted for within equity. Otherwise, subsequent changes in the fair value of the contingent consideration are recognised in profit or loss. Subsidiaries Subsidiaries are entities controlled by the Group. The financial statements of subsidiaries are included in the consolidated financial statements from the date that control commences until the date that control ceases.
Investments in subsidiaries in the Company financial statements are measured at fair value (refer to 2(e)).
Loss of control Upon the loss of control, the Group derecognises the assets and liabilities of the subsidiary, any non controlling interests and the other components of equity related to the subsidiary. Any surplus or deficit arising on the loss of control is recognised in profit or loss. If the Group retains any interest in the previous subsidiary, then such interest is measured at fair value at the date that control is lost. Subsequently it is accounted for as an equity-accounted investee or as an available-for-sale financial asset depending on the level of influence retained.

ZCCM Investments Holdings PlcZCCM Investments Holdings Plc
Notes to the financial statements (continued) for the year ended 31 March 2013 (all amounts are in thousands of Kwacha unless otherwise stated)
38
3
Significant accounting policies (continued)
3.1
Basis of consolidation (continued)
(iv) Investments in associates (equity-accounted investees)
Associates are those entities in which the Group has significant influence, but not control or joint control, over the financial and operating policies. Significant influence is presumed to exist when the Group holds between 20 and 50 percent of the voting power of another entity.
Investments in associates are initially recognised at cost and subsequently accounted for using the equity method (equity-accounted investees). In the company’s financial statements, investments in associates are initially recognised at cost and subsequently measured at fair value .The cost of the investments includes transaction costs.
The consolidated financial statements include the Group’s share of the profit or loss and other comprehensive income, after adjustments to align the accounting policies with those of the Group, from the date that significant influence commences until the date that significant influence ceases.
When the Group’s share of losses exceeds its interest in an equity-accounted investee, the carrying amount of the investment, including any long-term interests that form part there of is reduced to zero, and the recognition of further losses is discontinued except to the extent that the Group has an obligation or has made payments on behalf of the investee.
(v) Transactions eliminated on consolidation
(i)
Intra-group balances and transactions, fair value changes recognised in respect of its investment in subsidiaries and associates, and any unrealised income and expenses arising from intra group transactions, are eliminated in preparing the consolidated financial statements. Unrealised gains arising from transactions with equity accounted investees are eliminated against the investment to the extent of the Group’s interest in the investee. Unrealised losses are eliminated in the same way as unrealised gains, but only to the extent that there is no evidence of impairment. Foreign currency transactions Transactions in foreign currencies are translated to the respective functional currencies of Group entities at exchange rates at the dates of the transactions. Monetary assets and liabilities denominated in foreign currencies at the reporting date are retranslated to the functional currency at the exchange rate at that date. The foreign currency gain or loss on monetary items is the difference between amortised cost in the functional currency at the beginning of the year, adjusted for effective interest and payments during the year, and the amortised cost in foreign currency translated at the exchange rate at the end of the year Non-monetary assets and liabilities denominated in foreign currencies that are measured at fair value are retranslated to the functional currency at the exchange rate at the date that the fair value was determined. Non-monetary items in a foreign currency that are measured in terms of historical cost are translated using the exchange rate at the date of the transaction. Foreign currency differences arising on retranslation are recognised in profit or loss. Foreign differences arising on the retranslation of the following items are recognised in other comprehensive income: - Available for sale equity investments except on impairment in which case foreign currency
differences that have been recognised in other comprehensive income are reclassified to profit or loss.
ZCCM Investments Holdings PlcZCCM Investments Holdings Plc
Notes to the financial statements (continued) for the year ended 31 March 2013 (all amounts are in thousands of Kwacha unless otherwise stated)
39
3 3.2
Significant accounting policies (continued) Foreign currency (continued)
(ii) Foreign operations
The assets and liabilities of foreign operations, including goodwill and fair value adjustments arising on acquisition, are translated to Zambian Kwacha at exchange rates at the reporting date. The income and expenses of foreign operations are translated to Kwacha at the exchange rate at the date of the transactions. Foreign currency differences are recognised in other comprehensive income, and presented in the foreign currency translation reserve (translation reserve) in equity. However, if the operation is a non-wholly-owned subsidiary, then the relevant proportionate share of the translation difference is allocated to the non-controlling interests. When a foreign operation is disposed of such that control, significant influence or joint control is lost, the cumulative amount in the translation reserve related to that foreign operation is reclassified to profit or loss as part of the gain or loss on disposal. When the Group disposes of only part of its interest in a subsidiary that includes a foreign operation while retaining control, the relevant proportion of the cumulative amount is reattributed to non-controlling interests. When the Group disposes of only part of its investment in an associate that includes a foreign operation while retaining significant influence or joint control, the relevant proportion of the cumulative amount is reclassified to profit or loss. When the settlement of a monetary item receivable from or payable to a foreign operation is neither planned nor likely in the foreseeable future, foreign exchange gains and losses arising from such a monetary item are considered to form part of a net investment in a foreign operation and are recognised in other comprehensive income, and presented in the translation reserve in equity.
The Group initially recognises loans and receivables on the date that they are originated. All other financial assets (including assets designated at fair values through profit or loss) are recognised initially on the trade date, which is the date that the Group becomes a party to the contractual provisions of the instrument.
The Group derecognises a financial asset when the contractual rights to the cash flows from the asset expire, or when it transfers the rights to receive the contractual cash flows in a transaction in which substantially all the risks and rewards of ownership of the financial asset are transferred. Any interest in such transferred financial asset that is created or retained by the Group is recognised as a separate asset.
Financial assets and financial liabilities are offset and the net amount presented in the statement of financial position when, and only when, the Group has a legal right to offset the amounts and intends either to settle on a net basis or to realise the asset and settle the liability simultaneously.
The Group classifies non-derivative financial assets into the following categories: held-to-maturity financial assets, available for sale financial assets, loans and receivables and financial assets at fair value through profit or loss.
ZCCM Investments Holdings PlcZCCM Investments Holdings Plc
Notes to the financial statements (continued) for the year ended 31 March 2013 (all amounts are in thousands of Kwacha unless otherwise stated)
40
3 Significant accounting policies (continued)
3.3 Financial instruments
(i) Non-derivative financial assets
Held-to-maturity financial investment securities
If the Group has the positive intent and ability to hold debt securities to maturity, then such financial assets are classified as held-to-maturity. Held-to-maturity financial assets are recognised initially at fair value plus an/directly attributable transaction costs. Subsequent to initial recognition, held-to-maturity financial assets are measured at amortised cost using the effective interest method, less any impairment losses (see note 3.9(i)).
Held-to-maturity financial assets comprise debt securities.
Financial assets at fair value through profit or loss
A financial asset is classified at fair value through profit or loss if it is classified as held for trading or is designated as such on initial recognition. Financial assets are designated as at fair value through profit or loss if the Group manages such investments and makes purchase and sale decisions based on their fair value in accordance with the Group’s documented risk management or investment strategy. Attributable transactions costs are recognised in profit or loss as incurred. Financial assets at fair value through profit or loss are measured at fair value and changes therein, which takes into account any dividend income, are recognised in profit or loss.
Financial assets designated at fair value through profit or loss comprise equity securities that otherwise would have been classified as available -for -sale. Available-for-sale financial assets Available-for-sale financial assets are non-derivative financial assets that are designated as available-for-sale or are not classified in any of the above categories of financial assets. Available-for-sale financial assets are recognised initially at fair value plus any directly attributable transaction costs. Subsequent to initial recognition, they are measured at fair value and changes therein, other than impairment losses (see Note 3.9 (i)) and foreign currency differences on available-for-sale debt instruments, are recognised in other comprehensive income and presented in the fair value reserve in equity. When an investment is derecognised, the gain or loss accumulated in equity is reclassified to profit or loss.
Loans and receivables
Loans and receivables are financial assets with fixed or determinable payments that are not quoted in an active market. Such assets are recognised initially at fair value plus any directly attributable transaction costs. Subsequent to initial recognition, loans and receivables are measured at amortised costs using the effective interest method, less any impairment losses (see Note 3.9).
Loans and receivables comprise cash and cash equivalents, and trade and other receivables. Cash and cash equivalents
Cash and cash equivalents comprise cash balances and call deposits with maturities of three months or less from the acquisition date that are subject to an insignificant risk of changes in their fair value, and are used by the Group in the management of its short-term commitments.
ZCCM Investments Holdings PlcZCCM Investments Holdings Plc
Notes to the financial statements (continued) for the year ended 31 March 2013 (all amounts are in thousands of Kwacha unless otherwise stated)
41
3 Significant accounting policies (continued) 3.3
Financial instruments
(ii) Non-derivative financial liabilities
The Group initially recognises debt securities issued and subordinated liabilities on the date that they are originated. All other financial liabilities (including financial liabilities designated at fair value through profit or loss) are recognised initially on the trade date, which is the date that the Group becomes a party to the contractual provisions of the instrument.
The Group derecognises a financial liability when its contractual obligations are discharged, cancelled or expire.
The Group classifies non-derivative financial liabilities into the other financial liabilities category. Such financial liabilities are recognised initially at fair value plus any directly attributable transaction costs. Subsequent to initial recognition, these financial liabilities are measured at amortised cost using the effective interest method.
Other financial liabilities comprise loans and borrowings, bank overdrafts, and trade and other payables. Bank overdrafts that are repayable on demand and form an integral part of the Group’s cash management are included as a component of cash and cash equivalents for the purpose of the statement of cash flows.
3.4 Share capital
Ordinary shares Ordinary shares are classified as equity. Incremental costs directly attributable to the issue of ordinary shares are recognised as a deduction from equity, net of any tax effects.
3.5 Property, plant and equipment
(i) Recognition and measurement
Items of property, plant and equipment are initially recognised at cost. Items of plant and equipment are subsequently measured at cost less accumulated depreciation and accumulated impairment losses.
Cost includes expenditure that is directly attributable to the acquisition of the asset. The cost of self constructed assets includes the cost of materials and direct labour, any other costs directly attributable to bringing the assets to a working condition for their intended use, the costs of dismantling and removing the items and restoring the site on which they are located and capitalised borrowing costs.
When parts of an item of property, plant and equipment have different useful lives, they are accounted for as separate items (major components) of property, plant and equipment.
Capital work in progress relates to items of property, plant and equipment that are under construction and are yet to be commissioned for use. Work in progress is measured at the costs incurred in relation to the construction up to the reporting date.
The Company’s policy is to revalue property every three to five years. The revaluation differences are credited to other comprehensive income and accumulated in equity under the heading "revaluation surplus" unless it represents the reversal of a revaluation decrease previously recognised as an expense, in which case it is recognised as income. A decrease arising as a result of a revaluation is recognised as an expense to the extent that it exceeds any amount previously credited to the revaluation surplus relating to the same asset.
The gain or loss on disposal of an item of property, plant and equipment is determined by comparing the proceeds from disposal with the carrying amount of the property, plant and equipment, and is recognised net within other income/other expenses in profit or loss. When revalued assets are sold, any related amount included in the revaluation reserve is transferred to retained earnings.
ZCCM Investments Holdings PlcZCCM Investments Holdings Plc
Notes to the financial statements (continued) for the year ended 31 March 2013 (all amounts are in thousands of Kwacha unless otherwise stated)
42
3 3.5
Significant accounting policies (continued)
Property, plant and equipment (continued)
(ii)
Reclassification of investment property When the use of a property changes from owner occupied to investment property; the property is measured at fair value and reclassified as investment property. Any gain arising in the remeasurement is recognised in profit or loss to the extent that it reverses impairment loss on the specific property, with any remaining gain recognised in other comprehensive income and presented in the revaluation reserve as equity. Any loss is recognised immediately in profit or loss.
(iii)
Subsequent costs The cost of replacing a component of an item of property, plant and equipment is recognised in the carrying amount of the item if it is probable that the future economic benefits embodied within the component will flow to the Group, and its cost can be measured reliably. The carrying amount of the replaced component is derecognised. The costs of the day-to-day servicing of property, plant and equipment are recognised in profit or loss as incurred.
(iv) Depreciation Items of property, plant and equipment are depreciated from the date they are available for use or, in
respect of self-constructed assets, from the date that the asset is completed and ready for use.
Depreciation is based on the cost of an asset less its residual value. Significant components of individual assets are assessed and if a component has a useful life that is different from the remainder of that asset, that component is depreciated separately.
Capital work in progress is not depreciated.
Depreciation is recognised in profit or loss on a straight-line basis over the estimated useful lives of each component of an item of property, plant and equipment. Leased assets are depreciated over the shorter of the lease term and their useful lives unless it is reasonably certain that the Group will obtain ownership by the end of the lease term. Land is not depreciated.
The estimated useful lives for the current and comparative years are as follows:
• Property 40 years • Vehicles 4 years • Plant, equipment and furniture 5 years
Depreciation methods, useful lives and residual values are reviewed at each reporting date and adjusted if appropriate.
3.6 Investment property Investment property is property held to earn rental income or capital appreciation or for both, but not for sale in the ordinary course of business, use for the production or supply of goods or services or for administrative purposes. Investment property is initially measured at cost and subsequently at fair value with any change therein recognised in the profit or loss. Costs include expenditure that is directly attributable to the acquisition of the investment property. The cost of a self constructed investment property includes the cost of materials and direct labour, any other costs directly attributable to bringing the investment property to a working condition for their intended use and capitalised borrowing costs. Any gain or loss on the disposal of investment property (calculated as the difference between the net proceeds and the carrying amount of the item) is recognised in profit or loss. When investment property that was previously classified as property, plant and equipment is sold, any related amount that is included in the revaluation reserve is transferred to retained earnings.
When the use of the property changes such that it is reclassified as property, plant and equipment, its fair value at the date of the reclassification becomes its cost for subsequent accounting.
ZCCM Investments Holdings PlcZCCM Investments Holdings Plc
Notes to the financial statements (continued) for the year ended 31 March 2013 (all amounts are in thousands of Kwacha unless otherwise stated)
43
3.0 Significant accounting policies (continued)
3.7 Intangible assets
Software Acquired computer software licences are capitalised on the basis of the costs incurred to acquire and
bring to use the specific software. These costs are amortised over their estimated useful lives (three to five years). Amortisation methods, useful lives and residual values are reviewed at each reporting date and adjusted if appropriate.
Costs associated with maintaining computer software programmes are recognised as an expense as incurred. Costs that are directly associated with the production of identifiable and unique software products controlled by the Group, and that will probably generate economic benefits exceeding costs beyond one year, are recognised as intangible assets. Direct costs include the software development employee costs and an appropriate portion of relevant overheads.
3.8 Inventories
Inventories are measured at the lower of cost and net realisable value. The cost of inventories is based on the first-in first-out principle, and includes expenditure incurred in acquiring the inventories, production or conversion costs and other costs incurred in bringing them to their existing location and condition. In the case of manufactured inventories and work in progress, cost includes an appropriate share of production overheads based on normal operating capacity.
Net realisable value is the estimated selling price in the ordinary course of business, less the estimated costs of completion and selling expenses.
3.9 Impairment
(i) Non-derivative financial assets
Financial assets A financial asset not classified at fair value through profit or loss including an interest in an equity
accounted investee, is assessed at each reporting date to determine whether there is objective evidence that it is impaired. A financial asset is impaired if there is objective evidence of impairment as a result of one or more events that occurred after the initial recognition of the asset, and that the loss event(s) had an impact on the estimated future cash flows of that asset that can be estimated reliably.
Objective evidence that financial assets (including equity securities) are impaired can include default or delinquency by a debtor, restructuring of an amount due to the Group on terms that the Group would not consider otherwise, indications that a debtor or issuer will enter bankruptcy, adverse changes in the payment status of borrowers or issuers in the Group, economic conditions that correlate with defaults or the disappearance of an active market for a security. In addition, for an investment in an equity security, a significant or prolonged decline in its fair value below its cost is objective evidence of impairment.
Financial assets measured at amortised cost The Group considers evidence of impairment for financial assets measured at amortised cost (loans and receivables and held-to-maturity financial assets) on a specific asset level. All individually significant assets are assessed for specific impairment. Assets that are not individually significant are collectively assessed for impairment by grouping together assets with similar characteristics.
An impairment loss in respect of a financial asset measured at amortised cost is calculated as the difference between its carrying amount and the present value of the estimated future cash flows discounted at the asset’s original effective interest rate.
Impairment losses are recognised in profit or loss and reflected in an allowance account against loans and receivables or held-to-maturity investment securities. Interest on the impaired asset continues to be recognised. When a subsequent event (e.g. repayment by a debtor) causes the amount of impairment loss to decrease, the decrease in impairment loss is reversed through profit or loss.
ZCCM Investments Holdings PlcZCCM Investments Holdings Plc
Notes to the financial statements (continued) for the year ended 31 March 2013 (all amounts are in thousands of Kwacha unless otherwise stated)
44
3 Significant accounting policies (continued) 3.9 Impairment (continued)
(i)
(ii)
Non-derivative financial assets (continued)
Available-for-sale assets Impairment losses on available-for-sale financial assets are recognised by reclassifying the losses accumulated in the fair value reserve in equity to profit or loss. The cumulative loss that is reclassified from equity to profit or loss is the difference between the acquisition cost, net of any principal repayment and amortisation, and the current fair value, less any impairment loss recognised previously in profit or loss. Changes in cumulative impairment losses attributable to application of the effective interest method are reflected as a component of interest income. If, in a subsequent period, the fair value of an impaired available-for-sale debt security increased and the increase can be related objectively to an event occurring after the impairment loss was recognised, then the impairment loss is reversed, with the amount of the reversal recognised in profit or loss. However, any subsequent recovery, in the fair value of an impaired available-for-sale equity security is recognised in other comprehensive income.
An impairment loss in respect of an equity-accounted investee is measured by comparing the recoverable amount of the investment with its carrying amount. An impairment loss is recognised in profit or loss. An impairment loss is reversed if there has been a favourable change in the estimates used to determine the recoverable amount.
Non-financial assets
The carrying amounts of the Group’s non-financial assets, other than, inventories and deferred tax assets are reviewed at each reporting date to determine whether there is any indication of impairment. If any such indication exists, then the asset’s recoverable amount is estimated. For intangible assets that have indefinite useful lives or that are not yet available for use, the recoverable amount is estimated each year at the same time. An impairment loss is recognised if the carrying amount of an asset or its related cash-generating unit (CGU) exceeds its estimated recoverable amount.
The recoverable amount of an asset or CGU is the greater of its value in use and its fair value less costs to sell. In assessing value in use, the estimated future cash flows are discounted to their present value using a pre-tax discount rate that reflects current market assessments of the time value of money and the risks specific to the asset or CGU. For the purpose of impairment testing, assets that cannot be tested individually are grouped together into the smallest group of assets that generates cash inflows from continuing use that are largely independent of the cash inflows of other assets or CGU. Subject to an operating segment ceiling test, for the purposes of goodwill impairment testing, CGUs to which goodwill has been allocated are aggregated so that the level at which impairment testing is performed reflects the lowest level at which goodwill is monitored for internal reporting purposes. Goodwill acquired in a business combination is allocated to groups of CGUs that are expected to benefit from the synergies of the combination. The Group’s corporate assets do not generate separate cash inflows and are utilised by more than one CGU. Corporate assets are allocated to CGUs on a reasonable and consistent basis and tested for impairment as part of the testing of the CGU to which the corporate asset is allocated.
Impairment losses are recognised in profit or loss. Impairment losses recognised in respect of CGUs are allocated first to reduce the carrying amount of any goodwill allocated to the CGU (group of CGUs), and then to reduce the carrying amounts of the other assets in the CGU (group of CGUs) on a pro rata basis. An impairment loss in respect of goodwill is not reversed. In respect of other assets, impairment losses recognised in prior periods are assessed at each reporting date for any indications that the loss has decreased or no longer exists. An impairment loss is reversed if there has been a change in the estimates used to determine the recoverable amount. An impairment loss is reversed only to the extent that the asset’s carrying amount does not exceed the carrying amount that would have been determined, net of depreciation or amortisation, if no impairment loss had been recognised.

ZCCM Investments Holdings PlcZCCM Investments Holdings Plc
Notes to the financial statements (continued) for the year ended 31 March 2013 (all amounts are in thousands of Kwacha unless otherwise stated)
45
3 Significant accounting policies (continued)
3.10 Employee benefits
(i) Defined contribution plans
(ii)
(iii)
(iv)
A defined contribution plan is a post employment benefit plan which an entity pays fixed contributions into a separate entity and has no legal or constructive obligation to pay further amounts. Obligations for contribution to defined contribution plans are recognised as an employee benefit expense in the Profit or loss in a period during which related services are received by the employees. Prepaid contributions are recognised as an asset to the extent that a cash refund or reduction in future payments is available. The Group and all its employees also contribute to the National Pension Scheme Authority, which is a defined contribution scheme.
Defined benefit plans
A defined benefit plan is a post-employment benefit plan other than a defined contribution plan. The Group operates a retirement benefit scheme which is of the nature of a defined benefit scheme. Under the defined benefit scheme, the employees are entitled to retirement payment based on the number of years worked and their terminal salaries at retirement. The liability recognised in the statement of financial position in respect of the defined benefit plan is the present value of the defined benefit obligation at the reporting date, together with adjustments for unrecognised actuarial gains or losses and past service costs. The defined benefit obligation is calculated annually by independent actuaries using the projected unit credit method. The present value of the defined benefit obligation is determined by estimating the expected future cash flows using interest rates of Government bonds which are denominated in the currency in which the benefit will be paid, and have terms to maturity approximating to the terms of the related pension liability. The Group recognises all actuarial gains and losses arising from defined benefit plans in other comprehensive income and all related expenses related to personnel expenses in profit or loss.
Other entitlements
Some employees are on fixed term contracts or are entitled to gratuity. These are recognised when they accrue to employees. An estimate is made for the liability for such entitlements as a result of services rendered by employees up to the reporting date.
The estimated monetary liability for employees’ accrued annual leave entitlement at the reporting date is recognised as an expense accrual.
Short -term employee benefits Short term-employee benefit obligations are measured on an undiscounted basis and are recognised in profit or loss as the related service is provided. A liability is recognised for the amount expected to be paid under short-term cash bonus or profit-sharing plans if the Group has a present legal or construction obligation to pay this amount as a result of past service provided by the employee, and the obligation can be estimated reliably.
ZCCM Investments Holdings PlcZCCM Investments Holdings Plc
Notes to the financial statements (continued) for the year ended 31 March 2013 (all amounts are in thousands of Kwacha unless otherwise stated)
46
3 3.10
Significant accounting policies (continued) Employee benefits (continued)
3.11 Provisions
A provision is recognised if, as a result of a past event, the Company has a present legal or constructive obligation, for which it is probable that an outflow of economic benefits will occur and where a reliable estimate can be made of the amount of the obligation. The amount recognised as a provision is the best estimate of the consideration required to settle the obligation at the reporting date, taking into account the risks and uncertainties surrounding the obligation. Where the effect of time value of money is material, provisions are determined by discounting the expected future cash flows to their present value at a pre-tax rate that reflects current market assessment of the time value of money. The unwinding of the discount is recognised as finance cost.
3.12 Revenue
Revenue from the sale of goods in the course of ordinary activities is measured at the fair value of the consideration received or receivable, net of returns, trade discounts and volume rebates. Revenue is recognised when persuasive evidence exists, usually in the form of an executed sales agreement, that the significant risks and rewards of ownership have been transferred to the customer, recovery of the consideration is probable, the associated costs and possible return of goods can be estimated reliably, there is no continuing management involvement in the goods, and the amount of revenue can be measured reliably. Revenue is recognised as follows: Dividends are recognised as income in the period in which the right to receive payment is
established, which in the case of quoted securities is usually the ex-dividend date. Dividends are reflected as a component of other operating income based on the underlying classification of the equity investment.
Copper and cobalt participation income relates to payments made by various mining
companies to the Company as a result of the agreements that were signed at the time of privatisation of the mining assets. This income is recognised as and when it is due.
Lime sales are recognised in the period in which the Group has delivered products to the
customer, the customer has full discretion over the channel and price to sell the products, and there is no unfulfilled obligations that could affect the customers’ acceptance of the products. Delivery does not occur until the products have been accepted by the customers.
3.13 Government grants
The government grants relate to environmental cleanup works on behalf of the Government. Government grants are recognised initially as deferred income at fair value when there is reasonable assurance that they will be received and the Group will comply with the conditions associated with them. The government grants are then recognised in profit or loss as grant income on a systematic basis over the periods in which the Group recognises as expenses the costs for which the grant are intended to compensate. Grants that compensate the Group for expenses incurred are recognised in profit or loss as grant income on a systematic basis in the same periods in which the expenses are recognised.

ZCCM Investments Holdings PlcZCCM Investments Holdings Plc
Notes to the financial statements (continued) for the year ended 31 March 2013 (all amounts are in thousands of Kwacha unless otherwise stated)
47
3 Significant accounting policies (continued)
3.14 Finance income and finance costs Finance income comprises interest income on funds invested, exchange gains, fair value adjustment financial asset at fair value through profit or loss and bank interest received. Interest income is recognised as it accrues in profit or loss, using the effective interest method.
Finance costs comprise interest expense on borrowings, exchange losses and impairment losses recognised on financial assets at fair value through profit or loss.
Borrowing costs that are not directly attributable to the acquisition, construction or production of qualifying assets are recognised in profit or loss using the effective interest method.
Foreign currency gains and losses are reported on a net basis as either finance income or finance cost depending on whether foreign currency movements are in a net gain or net loss position.
3.15 Income tax expenses
Income tax expense is the aggregate of current and deferred tax.
3.16
Current income tax is the amount of tax payable or receivable on the taxable profit or loss for the year determined in accordance with the relevant tax legislation, and any adjustment to tax payable in respect of previous years.
Deferred tax is provided on all temporary differences arising between the tax bases of assets and liabilities and their carrying values for financial reporting purposes. However, if the deferred tax arises from the initial recognition of an asset or liability in a transaction other than a business combination that at the time of the transaction affects either accounting or taxable profit or loss, it is not accounted for. Deferred tax is determined using tax rates enacted or substantively enacted at the reporting date and are expected to apply when the related deferred tax liability is settled or deferred tax asset is realised.
Deferred tax assets are recognised only to the extent that it is probable that future taxable profits will be available against which the temporary differences can be utilised. Deferred tax assets are reviewed at each reporting date and are reduced to the extent that it is no longer probable that future taxable profits will be available against which they can be utilised.
Deferred tax is provided on temporary differences arising on investments in subsidiaries and associates, except where the timing of the reversal of the temporary difference is controlled by the Group and it is probable that the temporary difference will not reverse in the foreseeable future.
Deferred tax assets and liabilities are offset if there is a legally enforceable right to offset current tax liabilities and assets and they relate to income taxes levied by the same tax authority on the same taxable entity, or on different tax entities, but they intend to settle current tax liabilities and assets on a net basis or they will be realised simultaneously. Earnings per share The Group presents basic and diluted earnings per share data for its ordinary shares. Basic earnings per share is calculated by dividing the profit or loss attributable to ordinary shareholders of the Company by the weighted average number of ordinary shares outstanding during the year, adjusted for own shares held. Diluted earnings per share is determined by adjusting the profit or loss attributable to ordinary shareholders and the weighted average number of ordinary shares outstanding, adjusted for own shares held, for the effects of all dilutive potential ordinary shares, which comprise convertible notes and share options.

ZCCM Investments Holdings PlcZCCM Investments Holdings Plc
Notes to the financial statements (continued) for the year ended 31 March 2013 (all amounts are in thousands of Kwacha unless otherwise stated)
48
3 Significant accounting policies (continued)
3.17
3.18
3.19
Segment reporting An operating segment is a component of the Group that engages in business activities from which it may earn revenues and incur expenses, including revenues and expenses that relate to transactions with any of the Group’s other components. All operating segments’ operating results are reviewed regularly by the Group’s Chief Executive Officer to make decisions about resources to be allocated to the segment and to assess its performance, and for which discrete financial information is available.
Leases
Leases in terms of which the Group assumes substantially all the risks and rewards of ownership are classified as finance leases, all other leases are classified as operating leases. Upon initial recognition the leased asset is measured at an amount equal to the lower of its fair value and the present value of the minimum lease payments. Subsequent to initial recognition, the asset is accounted for in accordance with the accounting policy applicable to that asset.
(i) Minimum lease payments made under finance leases are apportioned between the finance expenses and the reduction of the outstanding liability. The finance expense is allocated to each period during the lease term so as to produce a constant periodic rate of interest on the remaining balance of the liability.
(ii) Determining whether an arrangement contains a lease
At inception of an arrangement, the Group determines whether such an arrangement is or contains a lease. This will be the case if the following two criteria are met:
• The fulfilment of the arrangement is dependent on the use of a specific asset or assets; and
• the arrangement contains a right to use the asset(s.)
At inception or on reassessment of the arrangement, the Group separates payments and other consideration required by such an arrangement into those for the lease and those for other elements on the basis of their relative fair values. If the Group concludes for a finance lease that it is impracticable to separate the payments reliably, then an asset and a liability are recognised at an amount equal to the fair value of the underlying asset. Subsequently the liability is reduced as payments are made and an imputed finance cost on the liability is recognised using the Group’s incremental borrowing rate.
Environmental rehabilitation and restoration provision
Provisions for environmental rehabilitation and restoration are recognised when the Group has a present legal or constructive obligation as a result of the past events; it is probable that an outflow of resources will be required to settle the obligation; and the amount has been reliably estimated.
Provisions are measured at present value of the expenditures expected to be required to settle the obligation using a pre-tax rate that reflects current market assessments of the time value of money and the risks specific to the obligation. The increase in the provision due to passage of time is recognised in profit or loss.
ZCCM Investments Holdings PlcZCCM Investments Holdings Plc
Notes to the financial statements (continued) for the year ended 31 March 2013 (all amounts are in thousands of Kwacha unless otherwise stated)
49
3 Significant accounting policies (continued) 3.20
New standards and interpretations not adopted
A number of new standards, amendments to standards and interpretation are effective for periods beginning after 1 January 2013, and have not been applied at the date of authorisation of these financial statements of the Group for the year ended 31 March 2013. The standards and interpretations relevant to the Group are set out below. The Group does not plan to adopt these standards early.
IFRS 9 Financial Instruments deals with classification and measurement of financial assets and is effective 1 January 2015. The standard will be applied retrospectively, subject to transitional provisions. IFRS 9 (2010) addresses the measurement and classification of financial assets and will replace the relevant sections of IAS 39. The standard contains two primary measurement categories for financial assets: amortised cost and fair value through profit or loss. A financial asset would be measured at amortised cost if it is held within a business model whose objective is to hold assets in order to collect contractual cash flows, and the assets’ contractual terms give rise on specified dates to cash flows that are solely payments of principal and interest on the principal outstanding. All other financial assets would be measured at fair value through profit or loss, with some exceptions. The standard eliminates the existing IAS 39 categories of held to maturity available-for-sale and loans and receivables. The Company is yet to determine the impact the adoption of the standard will have on the financial statements. The standard is effective for annual periods beginning on or after 1 January 2015 with earlier application permitted.
The impact on the financial statements for the Group has not yet been quantified.
IFRS 9 (2010) Financial Instruments, effective 1 January 2015. The standard will be applied
retrospectively, subject to transitional provisions. IFRS 9 (2010) addresses the measurement and classification of financial liabilities and will replace the relevant sections of IAS 39. Under IFRS 9 (2010) the classification and measurement requirements of financial liabilities are the same as per IAS 39, except for the following two aspects: fair value changes for financial liabilities (other than financial guarantees and loan commitments) designated at fair value through profit or loss, that are attributable to the changes in the credit risk of the liability will be presented in other comprehensive income (OCI). The remaining amount of the fair value change is recognised in profit or loss. However, if this requirement creates or enlarges an accounting mismatch in profit or loss, then the whole fair value change is presented in profit or loss. The determination as to whether such presentation would create or enlarge an accounting mismatch is made on initial recognition and is not subsequently reassessed. Under IFRS 9 (2010) derivative liabilities that are linked to and must be settled by delivery of an unquoted equity instrument whose fair value cannot be reliably measured are measured at fair value. IFRS 9 (2010) incorporates, the guidance in IAS 39 dealing with fair value measurement and accounting for derivatives embedded in a host contract that is not a financial asset, as well as the requirements of IFRIC 9 Reassessment of Embedded Derivatives. The Company is yet to determine the impact on the financial statements. The impact on the financial statements for the Group has not yet been quantified.
ZCCM Investments Holdings PlcZCCM Investments Holdings Plc
Notes to the financial statements (continued) for the year ended 31 March 2013 (all amounts are in thousands of Kwacha unless otherwise stated)
50
3
3.20 Significant accounting policies (continued)
New standards and interpretations not adopted (continued)
Investment entities (Amendments to IFRS 10, IFRS 12 and IAS 27) The amendments define an investment entity and require a parent that is an investment entity to measure its investments in particular subsidiaries at fair value through profit or loss, rather than consolidating them in its consolidated financial statements. Measurement at fair value through profit or loss must also be applied to an investment entity’s separate financial statements. The amendments also introduce disclosure requirements for investment entities into IFRS 12 Disclosure of Interests in Other Entities and amend IAS 27 Separate Financial Statements. An investment entity is an entity that meets all of the following criteria (the definition): − It obtains funds from one or more investors for the purpose of providing those investor(s) with
investment management services − It commits to its investor(s) that its business purpose is to invest funds solely for returns from
capital appreciation, investment income, or both − It measures and evaluates the performance of substantially all of its investments on a fair value
basis. In assessing whether it meets the definition an entity is required to consider whether it has the following typical characteristics of an investment entity:
− It has more than one investment − It has more than one investor − It has investors who are not related parties of the entity − It has ownership interests in the form of equity or similar interests.
Not meeting one or more of the typical characteristics does not preclude an entity from being an
investment entity. However, it does indicate that additional judgement is required in determining whether the entity meets the definition of an investment entity. Accordingly, an investment entity that does not meet one or more of the typical characteristics is required to disclose the reasons for concluding that it is nevertheless an investment entity (see disclosures below). An entity will not be disqualified from qualifying as an investment entity simply because: − It provides investment-related services (e.g. investment advisory services, investment
management, investment support and administrative services), either directly or through a subsidiary, to third parties as well as to its investors, even if those activities are substantial to the entity.
− If it provides management services, strategic advice and financial support to an investee, directly or through a subsidiary, but only if these activities are undertaken to maximise the investment return (capital appreciation or investment income) from its investees and do not represent a separate substantial business activity or a separate substantial source of income to the investment entity.
Mandatory adoption for periods beginning on or after 1 January 2014. The impact on the financial statements for the Group has not yet been quantified.
ZCCM Investments Holdings PlcZCCM Investments Holdings Plc
Notes to the financial statements (continued) for the year ended 31 March 2013 (all amounts are in thousands of Kwacha unless otherwise stated)
51
3
3.20 Significant accounting policies (continued)
New standards and interpretations not adopted (continued)
Amendments to IAS 32 Financial Instruments: Presentation: Offsetting Financial Assets and Financial Liabilities
The amendments clarify when an entity can offset financial assets and financial liabilities. This amendment will result in the Group no longer offsetting two of its master netting arrangements. This amendment is effective for annual periods beginning on or after 1 January 2014 with early adoption permitted. The impact on the financial statements for the Group has not yet been quantified.
4 Determination of fair values
A number of the Group’s accounting policies and disclosures require the determination of fair value, for both financial and non-financial assets and liabilities. Fair values have been determined for measurement and disclosure purposes based on the following methods.
Plant and equipment The fair value of plant and equipment recognised as a result of a business combination is the estimated amount for which the item could be exchanged on the date of acquisition between a willing buyer and willing seller in an arm’s length transaction after proper marketing wherein the parties had each acted knowledgeably. The fair value of items of plant and equipment, fixtures and fittings is based on the market approach and cost approaches using the quoted market prices for similar items when available and depreciated replacement cost when appropriate. Depreciated replacement cost reflects adjustments for physical deterioration as well as functional and economic obsolescence.
Investment property
An external, independent valuation expert, having appropriate recognised professional qualifications and recent experience in the location and category of property being valued, values the Group’s investment property portfolio every year. The fair values are based on market values, being the estimated amount for which a property could be exchanged on the date of the valuation between a willing buyer and a willing seller in an arm’s length transaction after proper marketing wherein the parties had each acted knowledgeably.
• capital income projections based upon Group’s estimate of net market rental income which is assumed to be a level annuity in perpetuity, and a capitalisation rate derived from the analysis of market evidence. Reversions associated with short term leasing risk/costs, incentive and capital expenditure maybe deducted from the capitalised net income figure.
• Valuations also reflect, when appropriate, the type of tenants actually in occupation or responsible for meeting lease commitments or likely to be in occupation after letting vacant accommodation, the allocation of maintenance and insurance responsibilities between the Group and the lessee, and the remaining economic life of the property. When rent reviews or lease renewals are pending with anticipated reversionary increases, it is assumed that all notices, and when appropriate counter-notices, have been served validly and within the appropriate time.
ZCCM Investments Holdings PlcZCCM Investments Holdings Plc
Notes to the financial statements (continued) for the year ended 31 March 2013 (all amounts are in thousands of Kwacha unless otherwise stated)
52
4
Determination of fair values (continued) In the absence of current prices in an active market, the valuations are prepared by considering the aggregate of the estimated cash flows expected to be received from renting out the property. A market yield is applied to the estimated rental value, adjustments are made to reflect actual rentals.
• current prices in an active market for properties of different nature, condition or location (or subject to different lease or other contracts), adjusted to reflect those differences;
• recent prices of similar properties in less active markets, with adjustments to reflect any changes in economic conditions since the date of the transactions that occurred at those prices;
• discounted cash flow projections based on reliable estimates of future cash flows, derived from the terms of any existing lease and other contracts and (where possible) from external evidence such as current market rents for similar properties in the same location and condition, and using discount rates that reflect current market assessments of the uncertainty in the amount and timing of the cash flows; and
Equity and debt securities The fair value of equity and debt securities is determined by reference to their quoted closing bid price at the reporting date, or if unquoted, determined using a valuation technique. Valuation techniques applied include market multiples and discounted cash flow analysis using expected future cash flows and a market-related discount rate. The fair value of held-to maturity investments is determined for disclosure purposes only. Trade and other receivables The fair value of trade and other receivables is estimated at the present value of future cash flows, discounted at the market rate of interest at the reporting date. This fair value is determined for disclosure purposes or when acquired in a business combination. Non-derivative financial liabilities Fair value, which is determined for disclosure purposes, is calculated based on the present value of future principal and interest cash flows, discounted at the market rate of interest at the reporting date. For finance leases the market rate of interest is determined by reference to similar lease agreements.
Provisions for liabilities and charges The Group receives legal claims against it in the normal course of business. Management has made judgements as to the likelihood of any claim succeeding in making provisions. The time of concluding legal claims is uncertain, as is the amount of possible outflow of economic benefits. Timing and cost ultimately depends on the due legal process.
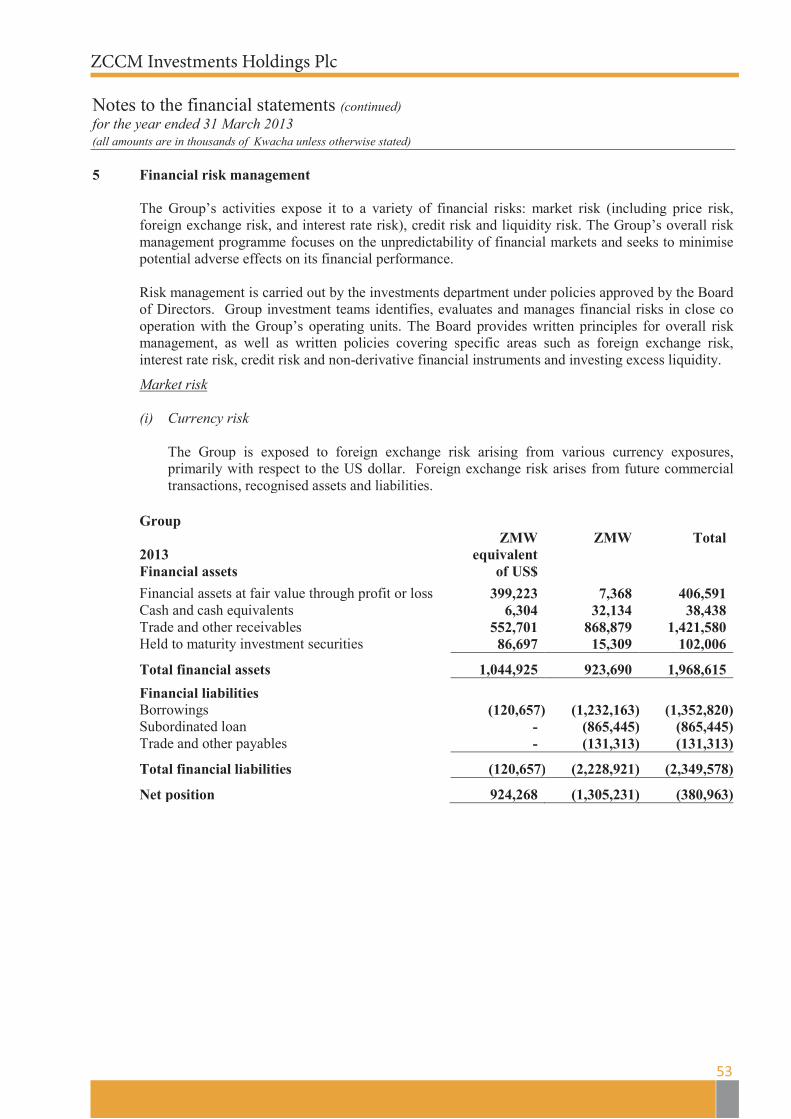
ZCCM Investments Holdings PlcZCCM Investments Holdings Plc
Notes to the financial statements (continued) for the year ended 31 March 2013 (all amounts are in thousands of Kwacha unless otherwise stated)
53
5 Financial risk management
The Group’s activities expose it to a variety of financial risks: market risk (including price risk, foreign exchange risk, and interest rate risk), credit risk and liquidity risk. The Group’s overall risk management programme focuses on the unpredictability of financial markets and seeks to minimise potential adverse effects on its financial performance. Risk management is carried out by the investments department under policies approved by the Board of Directors. Group investment teams identifies, evaluates and manages financial risks in close co operation with the Group’s operating units. The Board provides written principles for overall risk management, as well as written policies covering specific areas such as foreign exchange risk, interest rate risk, credit risk and non-derivative financial instruments and investing excess liquidity.
Market risk
(i) Currency risk
The Group is exposed to foreign exchange risk arising from various currency exposures, primarily with respect to the US dollar. Foreign exchange risk arises from future commercial transactions, recognised assets and liabilities.
Group
2013 Financial assets
ZMW equivalent
of US$
ZMW
Total
Financial assets at fair value through profit or loss 399,223 7,368 406,591 Cash and cash equivalents 6,304 32,134 38,438 Trade and other receivables 552,701 868,879 1,421,580 Held to maturity investment securities 86,697 15,309 102,006
Total financial assets 1,044,925 923,690 1,968,615
Financial liabilities Borrowings (120,657) (1,232,163) (1,352,820) Subordinated loan - (865,445) (865,445) Trade and other payables - (131,313) (131,313)
Total financial liabilities (120,657) (2,228,921) (2,349,578)
Net position 924,268 (1,305,231) (380,963)

ZCCM Investments Holdings PlcZCCM Investments Holdings Plc
Notes to the financial statements (continued) for the year ended 31 March 2013 (all amounts are in thousands of Kwacha unless otherwise stated)
54
5 Financial risk management (continued)
Group (continued) Currency risk (continued)
2012 Financial assets
ZMW equivalent
of US$
ZMW
Total
Financial instruments at fair value through profit or loss 338,478 8,892 347,370 Cash and cash equivalents 56,337 4,892 61,229 Trade and other receivables 781,780 164,757 946,537 Held to maturity investment securities 384,707 19,250 403,957
Total financial assets 1,561,302 197,791 1,759,093 Financial liabilities Borrowings (1,133,928) (156,604) (1,290,532) Subordinated loan - (865,445) (865,445) Trade and other payables - (110,588) (110,588) Total financial liabilities (1,133,928) (1,132,637) (2,266,565)
Net position 427,374 (934,846) (507,472)
Company
ZMW equivalent
of US$
ZMW
Total
2013 Financial assets Financial assets at fair value through profit or loss 399,223 7,368 406,591 Cash and cash equivalents 6,304 5,909 12,213 Available for sale investment in associate 4,809,612 - 4,809,612 Available for sale investment in subsidiaries 398,421 - 398,421 Trade and other receivables 552,701 1,058,072 1,610,773 Held to maturity investment securities 86,697 15,309 102,006
Total financial assets 6,252,958 1,086,658 7,339,616 Financial liabilities Borrowings (18,335) (1,151,357) (1,169,692) Subordinated loan - (865,445) (865,445) Trade and other payables - (69,458) (69,458)
Total financial liabilities (18,335) (2,086,260) (2,104,595)
Net Position 6,234,623 (999,602) 5,235,021
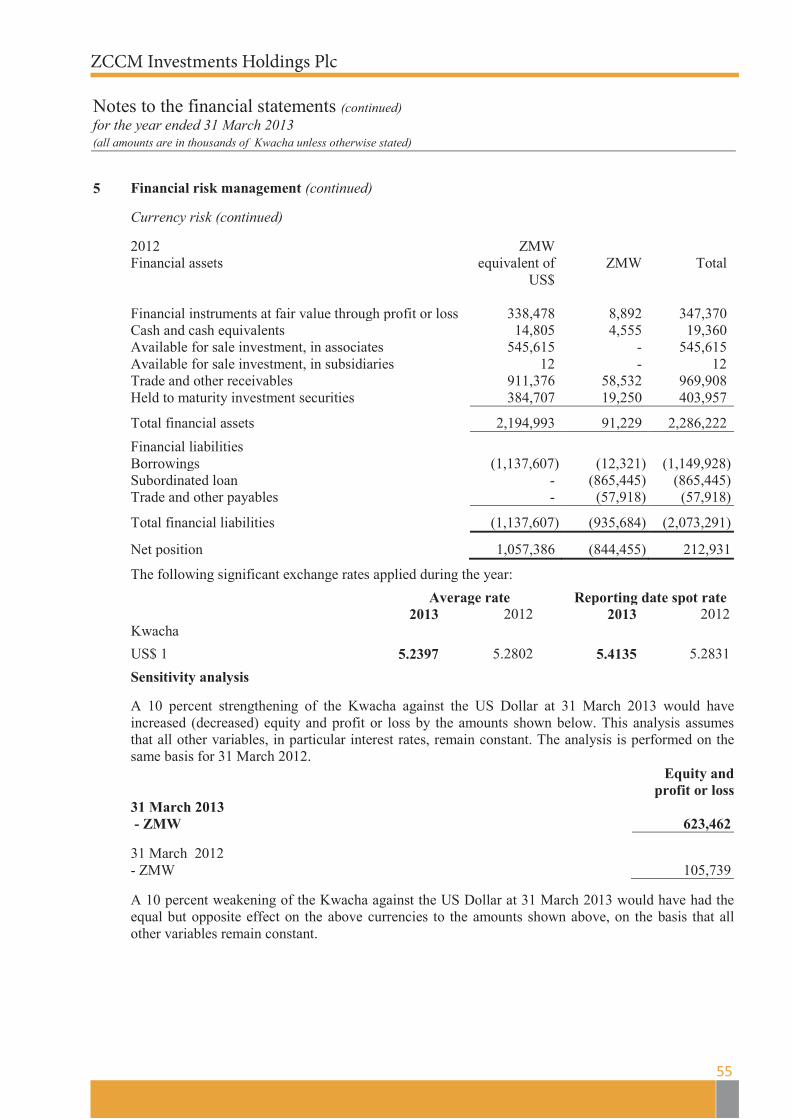
ZCCM Investments Holdings PlcZCCM Investments Holdings Plc
Notes to the financial statements (continued) for the year ended 31 March 2013 (all amounts are in thousands of Kwacha unless otherwise stated)
55
5 Financial risk management (continued)
Currency risk (continued)
2012 Financial assets
ZMW equivalent of
US$
ZMW
Total
Financial instruments at fair value through profit or loss 338,478 8,892 347,370 Cash and cash equivalents 14,805 4,555 19,360 Available for sale investment, in associates 545,615 - 545,615 Available for sale investment, in subsidiaries 12 - 12 Trade and other receivables 911,376 58,532 969,908 Held to maturity investment securities 384,707 19,250 403,957
Total financial assets 2,194,993 91,229 2,286,222
Financial liabilities Borrowings (1,137,607) (12,321) (1,149,928) Subordinated loan - (865,445) (865,445) Trade and other payables - (57,918) (57,918)
Total financial liabilities (1,137,607) (935,684) (2,073,291)
Net position 1,057,386 (844,455) 212,931
The following significant exchange rates applied during the year:
Average rate Reporting date spot rate 2013 2012 2013 2012 Kwacha
US$ 1 5.2397 5.2802 5.4135 5.2831
Sensitivity analysis
A 10 percent strengthening of the Kwacha against the US Dollar at 31 March 2013 would have increased (decreased) equity and profit or loss by the amounts shown below. This analysis assumes that all other variables, in particular interest rates, remain constant. The analysis is performed on the same basis for 31 March 2012.
Equity and
profit or loss 31 March 2013 - ZMW 623,462 31 March 2012 - ZMW 105,739
A 10 percent weakening of the Kwacha against the US Dollar at 31 March 2013 would have had the equal but opposite effect on the above currencies to the amounts shown above, on the basis that all other variables remain constant.
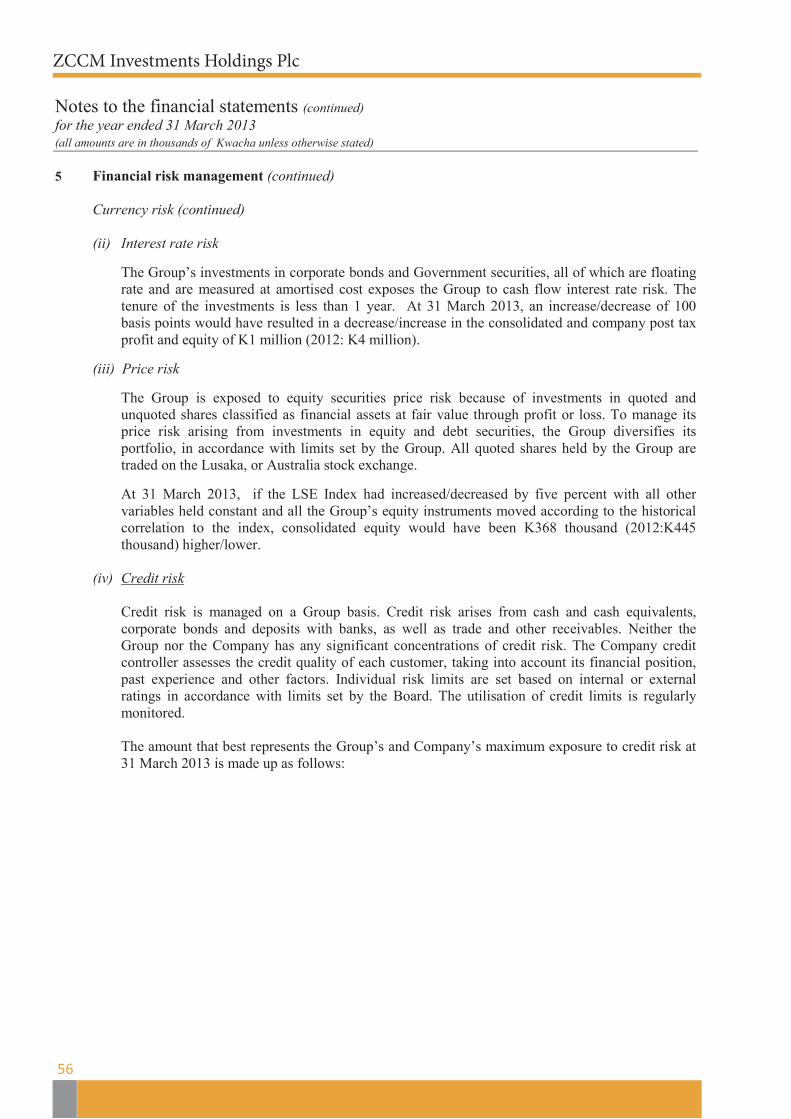
ZCCM Investments Holdings PlcZCCM Investments Holdings Plc
Notes to the financial statements (continued) for the year ended 31 March 2013 (all amounts are in thousands of Kwacha unless otherwise stated)
56
5 Financial risk management (continued)
Currency risk (continued) (ii) Interest rate risk
The Group’s investments in corporate bonds and Government securities, all of which are floating rate and are measured at amortised cost exposes the Group to cash flow interest rate risk. The tenure of the investments is less than 1 year. At 31 March 2013, an increase/decrease of 100 basis points would have resulted in a decrease/increase in the consolidated and company post tax profit and equity of K1 million (2012: K4 million).
(iii) Price risk
The Group is exposed to equity securities price risk because of investments in quoted and unquoted shares classified as financial assets at fair value through profit or loss. To manage its price risk arising from investments in equity and debt securities, the Group diversifies its portfolio, in accordance with limits set by the Group. All quoted shares held by the Group are traded on the Lusaka, or Australia stock exchange. At 31 March 2013, if the LSE Index had increased/decreased by five percent with all other variables held constant and all the Group’s equity instruments moved according to the historical correlation to the index, consolidated equity would have been K368 thousand (2012:K445 thousand) higher/lower.
(iv) Credit risk
Credit risk is managed on a Group basis. Credit risk arises from cash and cash equivalents, corporate bonds and deposits with banks, as well as trade and other receivables. Neither the Group nor the Company has any significant concentrations of credit risk. The Company credit controller assesses the credit quality of each customer, taking into account its financial position, past experience and other factors. Individual risk limits are set based on internal or external ratings in accordance with limits set by the Board. The utilisation of credit limits is regularly monitored.
The amount that best represents the Group’s and Company’s maximum exposure to credit risk at 31 March 2013 is made up as follows:

ZCCM Investments Holdings PlcZCCM Investments Holdings Plc
Notes to the financial statements (continued) for the year ended 31 March 2013 (all amounts are in thousands of Kwacha unless otherwise stated)
57
5 Financial risk management (continued)
(iv) Credit risk (continued)
The amount that best represents the Group’s and Company’s maximum exposure to credit risk at 31 March 2013 is made up as follows:
Group Company 2013 2012 2013 2012 Financial assets at fair value through profit or loss
406,591
347,370
406,591
347,370
Cash and cash equivalents 38,438 61,229 12,213 19,360 Available for sale investment in associate
-
-
4,809,612
545,615
Available for sale investment in subsidiaries
-
-
398,421
12
Trade and other receivables 1,421,580 946,537 1,610,773 969,908 Held to maturity investment securities 102,006 403,957 102,006 403,957 1,968,615 1,759,093 7,339,616 2,286,222
No collateral is held for any of the above assets. All receivables that are neither past due nor impaired are within their approved credit limits, and no receivables have had their terms renegotiated.
Ageing of trade and other receivables at the reporting date.
Group
2013 Gross Impairment Net
Neither due or impaired 6,719 - 6,719 Past due 30 - 60 days 555,565 - 555,565 Past due 61 – 90 days 59,664 - 59,664 Past due 91 - 120 days 377,784 - 377,784 Over 121 days 648,943 227,095 421,848 1,648,675 227,095 1,421,580
2012 Gross Impairment Net
Neither due or impaired 262,458 61,690 200,768 Past due 30 - 60 days 54,139 2,358 51,781 Past due 61 – 90 days 18,852 8,612 10,240 Past due 91 - 120 days 960,670 276,922 683,748 1,296,119 349,582 946,537
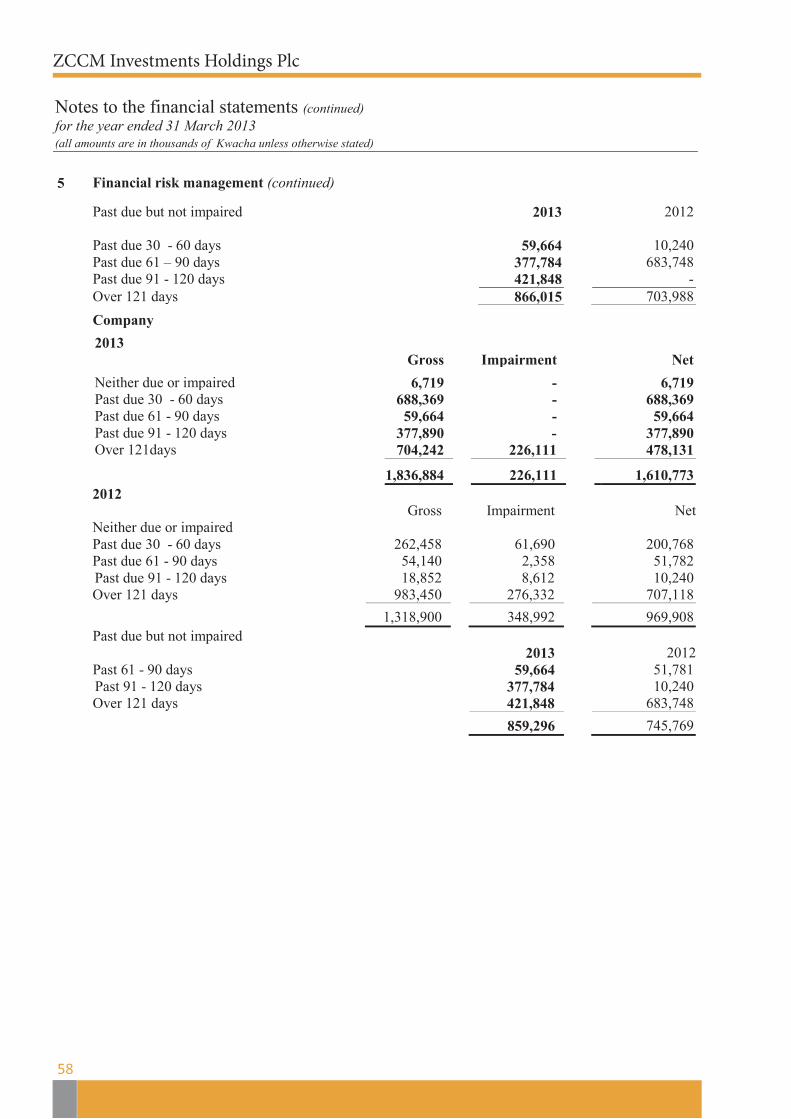
ZCCM Investments Holdings PlcZCCM Investments Holdings Plc
Notes to the financial statements (continued) for the year ended 31 March 2013 (all amounts are in thousands of Kwacha unless otherwise stated)
58
5 Financial risk management (continued)
Past due but not impaired 2013 2012 Past due 30 - 60 days 59,664 10,240 Past due 61 – 90 days 377,784 683,748 Past due 91 - 120 days 421,848 - Over 121 days 866,015 703,988
Company
2013 Gross Impairment Net
Neither due or impaired 6,719 - 6,719 Past due 30 - 60 days 688,369 - 688,369 Past due 61 - 90 days 59,664 - 59,664 Past due 91 - 120 days 377,890 - 377,890 Over 121days 704,242 226,111 478,131 1,836,884 226,111 1,610,773 2012 Gross Impairment Net Neither due or impaired Past due 30 - 60 days 262,458 61,690 200,768 Past due 61 - 90 days 54,140 2,358 51,782 Past due 91 - 120 days 18,852 8,612 10,240 Over 121 days 983,450 276,332 707,118 1,318,900 348,992 969,908
Past due but not impaired 2013 2012 Past 61 - 90 days 59,664 51,781 Past 91 - 120 days 377,784 10,240 Over 121 days 421,848 683,748 859,296 745,769
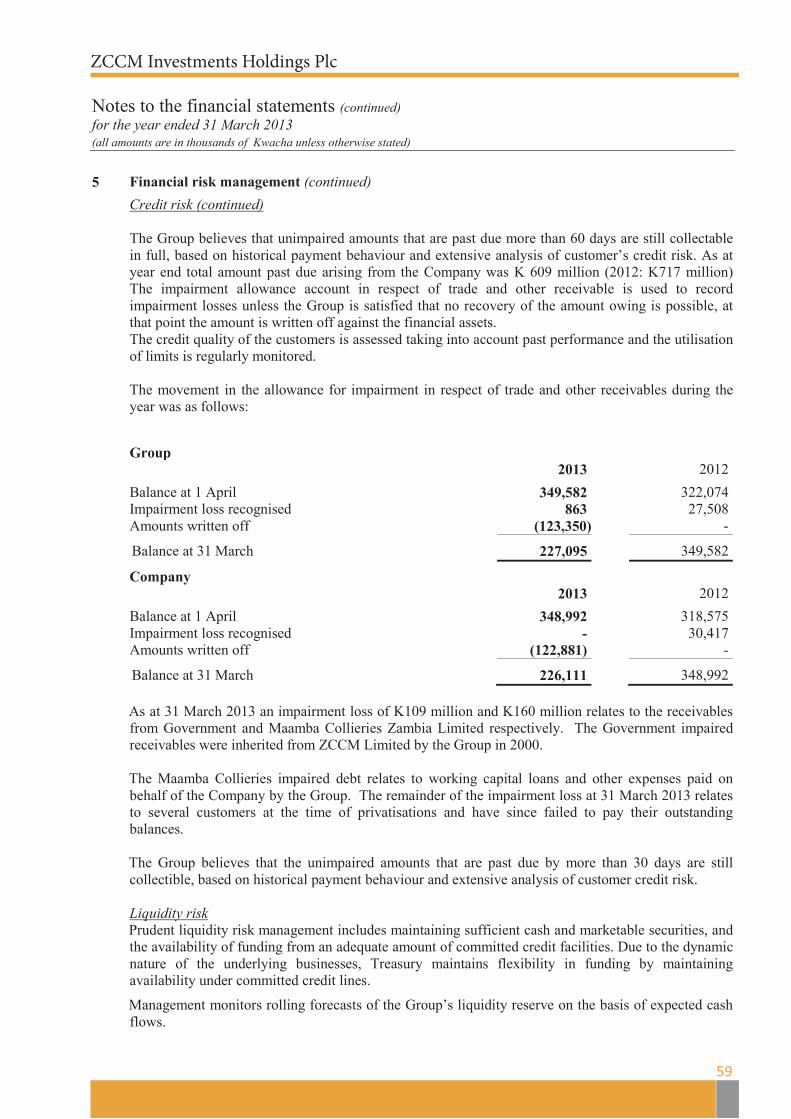
ZCCM Investments Holdings PlcZCCM Investments Holdings Plc
Notes to the financial statements (continued) for the year ended 31 March 2013 (all amounts are in thousands of Kwacha unless otherwise stated)
59
5 Financial risk management (continued)
Credit risk (continued)
The Group believes that unimpaired amounts that are past due more than 60 days are still collectable in full, based on historical payment behaviour and extensive analysis of customer’s credit risk. As at year end total amount past due arising from the Company was K 609 million (2012: K717 million) The impairment allowance account in respect of trade and other receivable is used to record impairment losses unless the Group is satisfied that no recovery of the amount owing is possible, at that point the amount is written off against the financial assets.
The credit quality of the customers is assessed taking into account past performance and the utilisation of limits is regularly monitored.
The movement in the allowance for impairment in respect of trade and other receivables during the year was as follows:
Group 2013 2012
Balance at 1 April 349,582 322,074 Impairment loss recognised 863 27,508 Amounts written off (123,350) -
Balance at 31 March 227,095 349,582
Company 2013 2012
Balance at 1 April 348,992 318,575 Impairment loss recognised - 30,417 Amounts written off (122,881) -
Balance at 31 March 226,111 348,992 As at 31 March 2013 an impairment loss of K109 million and K160 million relates to the receivables from Government and Maamba Collieries Zambia Limited respectively. The Government impaired receivables were inherited from ZCCM Limited by the Group in 2000. The Maamba Collieries impaired debt relates to working capital loans and other expenses paid on behalf of the Company by the Group. The remainder of the impairment loss at 31 March 2013 relates to several customers at the time of privatisations and have since failed to pay their outstanding balances. The Group believes that the unimpaired amounts that are past due by more than 30 days are still collectible, based on historical payment behaviour and extensive analysis of customer credit risk. Liquidity risk Prudent liquidity risk management includes maintaining sufficient cash and marketable securities, and the availability of funding from an adequate amount of committed credit facilities. Due to the dynamic nature of the underlying businesses, Treasury maintains flexibility in funding by maintaining availability under committed credit lines.
Management monitors rolling forecasts of the Group’s liquidity reserve on the basis of expected cash flows.
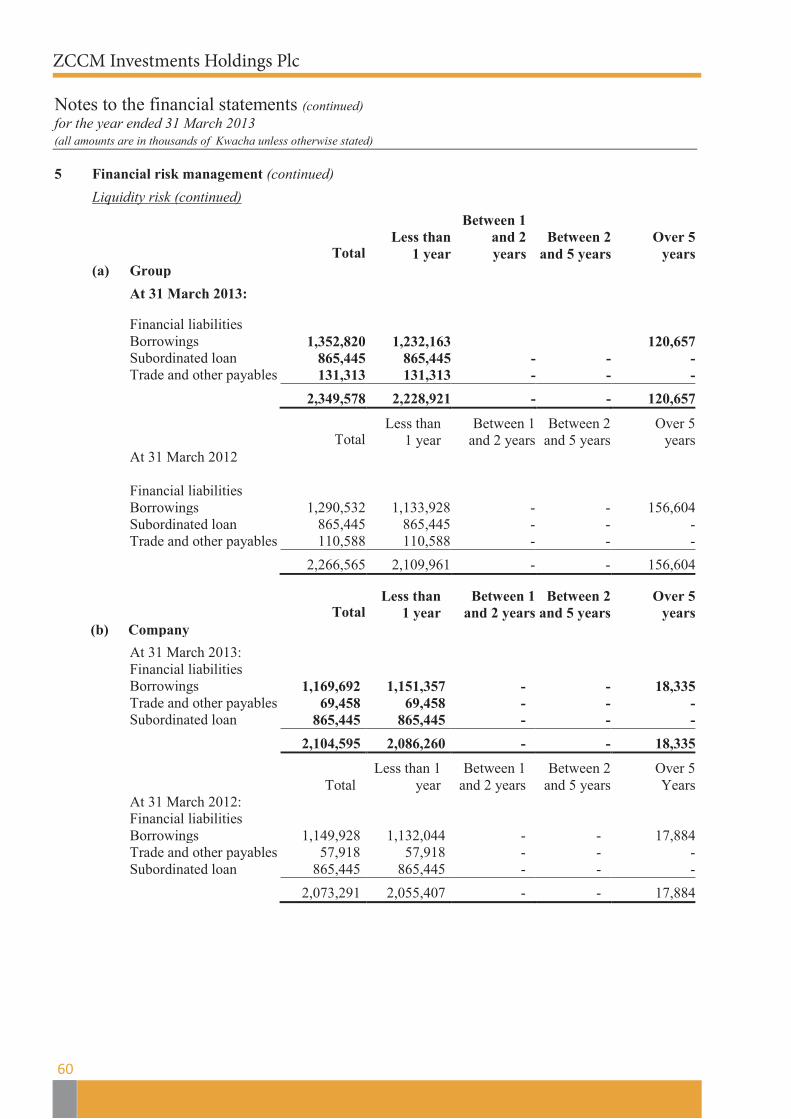
ZCCM Investments Holdings PlcZCCM Investments Holdings Plc
Notes to the financial statements (continued) for the year ended 31 March 2013 (all amounts are in thousands of Kwacha unless otherwise stated)
60
5 Financial risk management (continued)
Liquidity risk (continued)
Total
Less than
1 year
Between 1 and 2 years
Between 2
and 5 years
Over 5
years (a) Group
At 31 March 2013:
Financial liabilities
Borrowings 1,352,820 1,232,163 120,657 Subordinated loan 865,445 865,445 - - - Trade and other payables 131,313 131,313 - - -
2,349,578 2,228,921 - - 120,657
Total
Less than 1 year
Between 1 and 2 years
Between 2 and 5 years
Over 5 years
At 31 March 2012 Financial liabilities
Borrowings 1,290,532 1,133,928 - - 156,604 Subordinated loan 865,445 865,445 - - - Trade and other payables 110,588 110,588 - - -
2,266,565 2,109,961 - - 156,604
Total
Less than 1 year
Between 1 and 2 years
Between 2 and 5 years
Over 5 years
(b) Company
At 31 March 2013: Financial liabilities Borrowings 1,169,692 1,151,357 - - 18,335 Trade and other payables 69,458 69,458 - - - Subordinated loan 865,445 865,445 - - -
2,104,595 2,086,260 - - 18,335
Total
Less than 1 year
Between 1 and 2 years
Between 2 and 5 years
Over 5 Years
At 31 March 2012: Financial liabilities Borrowings 1,149,928 1,132,044 - - 17,884 Trade and other payables 57,918 57,918 - - - Subordinated loan 865,445 865,445 - - -
2,073,291 2,055,407 - - 17,884

ZCCM Investments Holdings PlcZCCM Investments Holdings Plc
Notes to the financial statements (continued) for the year ended 31 March 2013 (all amounts are in thousands of Kwacha unless otherwise stated)
61
5 Financial risk management (continued)
Capital management
The Group’s and Company objectives when managing capital are to safeguard their ability to continue as a going concern in order to provide returns for shareholders and to maintain an optimal capital structure to reduce the cost of capital. In order to maintain or adjust the capital structure, the Company may adjust the amount of dividends paid to shareholders, issue new capital or sell assets to reduce debt.
The Group monitors capital on the basis of the gearing ratio. This ratio is calculated as net debt divided by total capital. Net debt is calculated as total borrowings less cash and cash equivalents. Total capital is calculated as equity plus net debt. The gearing ratios at 31 March 2013 and 2012 were as follows: Group Company 2013 2012 2013 2012
Borrowings 1,352,820 1,290,532 1,169,692 1,149,928 Subordinated loan 865,455 865,455 865,455 865,445 Less: cash and cash equivalents (38,438) (61,229) (12,213) (19,360)
Net debt 2,179,837 2,094,758 2,022,934 1,996,013
Total equity 4,624,765 3,706,630 3,477,750 (50,504)
Total capital 6,804,602 5,801,388 5,500,684 1,945,509
Gearing ratio 32.03% 36.11% 36.78% 102.60%
The interest rates used to discount estimated cash flows when applicable are based on the government yield curve at the reporting date plus an appropriate credit spread, and are as follows:
2013 2012 Loans and borrowings 9.5% 8.9%
Fair value estimation
The Bank measures fair value using the fair value hierarchy that reflects the significance of the inputs used in making the measurements.
Level 1: Quoted market price (unadjusted) in an active market for an identical instrument.
Level 2: Valuation techniques based on observable inputs either directly (i.e. as prices) or indirectly (i.e. derived from prices). This category includes instruments valued using: quoted market prices in active markets for similar instruments; quoted prices for identical or similar instruments in markets that are considered less than active; or other valuation techniques where all significant inputs are directly or indirectly observable from market data.
Level 3: Valuation techniques using significant unobservable inputs. This category includes all instruments where the valuation technique includes inputs not based on observable data and the unobservable inputs have a significant effect on the instrument’s valuation. This category includes instruments that are valued based on quoted prices for similar instruments where significant unobservable adjustments or assumptions are required to reflect differences between the instruments.
The table below analyses financial instruments measured at fair value at the end of the reporting period, by the level in the fair value hierarchy into which the fair value measurement is categorised:

ZCCM Investments Holdings PlcZCCM Investments Holdings Plc
Notes to the financial statements (continued) for the year ended 31 March 2013 (all amounts are in thousands of Kwacha unless otherwise stated)
62
5 Financial risk management (continued)
The interest rates used to discount estimated cash flows when applicable are based on the government yield curve at the reporting date plus an appropriate credit spread, and are as follows:
2013 2012
Loans and borrowings 9.5% 8.9%
Fair value estimation
The Bank measures fair value using the fair value hierarchy that reflects the significance of the inputs used in making the measurements.
Level 1: Quoted market price (unadjusted) in an active market for an identical instrument.
Level 2: Valuation techniques based on observable inputs either directly (i.e. as prices) or indirectly (i.e. derived from prices). This category includes instruments valued using: quoted market prices in active markets for similar instruments; quoted prices for identical or similar instruments in markets that are considered less than active; or other valuation techniques where all significant inputs are directly or indirectly observable from market data.
Level 3: Valuation techniques using significant unobservable inputs. This category includes all instruments where the valuation technique includes inputs not based on observable data and the unobservable inputs have a significant effect on the instrument’s valuation. This category includes instruments that are valued based on quoted prices for similar instruments where significant unobservable adjustments or assumptions are required to reflect differences between the instruments.
The table below analyses financial instruments measured at fair value at the end of the reporting period, by the level in the fair value hierarchy into which the fair value measurement is categorised:
2013 Level 1 Level 2 Level 3 Total Assets – Financial investments at fair value through profit
or loss
7,368 -
399,233
406,591 – Available for sale investments on associates - - 4,809,612 4,809,612 – Available for sale investments on subsidiaries - - 406,591 406,591 7,368 - 5,615,436 5,622,804 2012 Assets – Financial investments at fair value through profit
or loss
8,892
-
338,478
347,370 – Available for sale investments in associates - 545,615 545,615 – Available for sale investments in subsidiaries - - 12 12 8,892 - 884,105 892,997
The following table shows a reconciliation from the beginning balances to the ending balances for fair value measurement in Level 3 of the fair value hierarchy: 2013 2012
At 1 April 347,370 355,292 Addition - 7,904 Fair value change 59,221 (15,826)
At 31 March 406,591 347,370
Total gains or losses included in comprehensive income for the year in the above table are presented in the statement of comprehensive income.

ZCCM Investments Holdings PlcZCCM Investments Holdings Plc
Notes to the financial statements (continued) for the year ended 31 March 2013 (all amounts are in thousands of Kwacha unless otherwise stated)
63
5 Financial risk management (continued)
Fair values versus carrying amounts
Group
The fair values of financial assets and liabilities, together with the carrying amounts shown in the statement of financial position, are as follows:
2013 2012 Carrying
amount Fair
value Carrying
amount Fair
value Financial assets Financial assets at fair value through profit or loss
406,591
406,591
347,370
347,370
Cash and cash equivalents 38,438 38,438 61,229 61,229 Trade and other receivables 1,421,580 1,421,580 946,537 946,537 Held to maturity investment securities 102,006 102,006 403,957 403,957 1,968,615 1,968,615 1,759,093 1,759,093
Financial liabilities Borrowings (1,352,820) (1,352,820) (1,290,532) (1,290,532) Subordinated loan (865,445) (865,445) (865,445) (865,445) Trade and other payables (131,313) (131,313) (110,588) (110,588)
(2,349,578) (2,349,578) (2,266,565) (2,266,565)
Net position (380,963) (380,963) (507,472) (507,472)
Company 2013 2012 Carrying
amount Fair
value Carrying
amount Fair
value Financial assets Financial investments at fair value through profit or loss
406,591
406,591
347,370
347,370
Cash and cash equivalents 12,213 12,213 19,360 19,360 Available for sale investments in associates
4,809,612
4,809,612
545,615
545,615
Available for sale investments in subsidiaries
406,591
406,591
12
12
Trade and other receivables 1,610,773 1,610,773 969,908 969,908 Held to maturity investment securities 102,006 102,006 403,957 403,957
7,347,786 7,347,786 2,286,222 2,286,222 Financial liabilities Borrowings (1,169,692) (1,169,692) (1,149,928) (1,149,928) Subordinated loan (865,445) (865,445) (865,445) (865,445) Trade and other payables (69,458) (69,458) (57,918) (57,918)
Total (2,104,595) (2,104,595) (2,073,291) (2,073,291)
Net position 5,243,191 5,243,191 212,931 212,931
The fair value of the financial assets and liabilities carried at amortised cost including cash and cash equivalents, trade and other receivable, held to maturity investment securities, borrowings and trade and other payables are considered to approximate their respective carrying values due to their short term nature and negligible credit losses. The subordinate loan is repayable in demand and has a fixed repayment term.

ZCCM Investments Holdings PlcZCCM Investments Holdings Plc
Notes to the financial statements (continued) for the year ended 31 March 2013 (all amounts are in thousands of Kwacha unless otherwise stated)
64
5 Financial risk management (continued)
The basis for determining fair values is disclosed in the respective accounting policy notes for each financial instrument.
The fair value of financial instruments traded in active markets is based on quoted market prices at the
reporting date. A market is regarded as active if quoted prices are readily and regularly available from an exchange, dealer, broker, industry group, pricing service, or regulatory agency, and those prices represent actual and regularly occurring market transactions on an arm’s length basis. The quoted market price used for financial assets held by the Group is the current bid price. These instruments are included in level 1.
6 Critical accounting estimates and judgements Estimates and judgements are continually evaluated and are based on historical experience and other
factors, including experience of future events that are believed to be reasonable under the circumstances.
Investments in associates and subsidiaries
Unlisted equity investments in associates and subsidiaries are categorised as available-for-sale financial investments and have no quoted prices. An external independent valuation company, having appropriate recognised professional qualification performed the Group’s valuation of the investments as at 31 March 2013. Their fair values were determined using the discounted cash flow valuation (DCF) and Relative Valuation or Market Approach (“RV”) methodologies. Discounted cash flow method DCF is an income approach valuation and methodology, which computes the value of a business by calculating the present value of anticipated future cash flow generated by the business. The key features of the DCF valuation methodology are presented below:
• Future cash flow generated by the business also known as the free cash flow is calculated by subtracting projected capital expenditure from the cash generated from operating activities, which in turn is calculated by subtracting the movement in working capital and depreciation charge from income generated from operations;
• The discount rate is the Weighted Average Cost of Capital (WACC), which is calculated by weighting the cost of equity and debt based on a debt to equity ratio. The Capital Asset Pricing Model (CAPM) is used to calculate the cost of equity. CAPM calculates the cost of equity as a function of the market return adjusted by the risk free rate and the company beta; and
• DCF methodology is typically highly sensitive to target debt to equity ratio, the consequent WACC, as well as the projected terminal growth rate. Slight changes in the WACC and terminal growth rate results in significant movement in the terminal value and consequently the Expected value (EV).
Relative valuation method
The RV Valuation Methodology is based upon how similar companies are currently priced by the market. RV valuation methods establish the value of a business in comparison to pricing multiples from transactions involving similar businesses or valuation multiples from comparable businesses that are listed on stock exchanges. The key features of the RV valuation methodology are presented below:
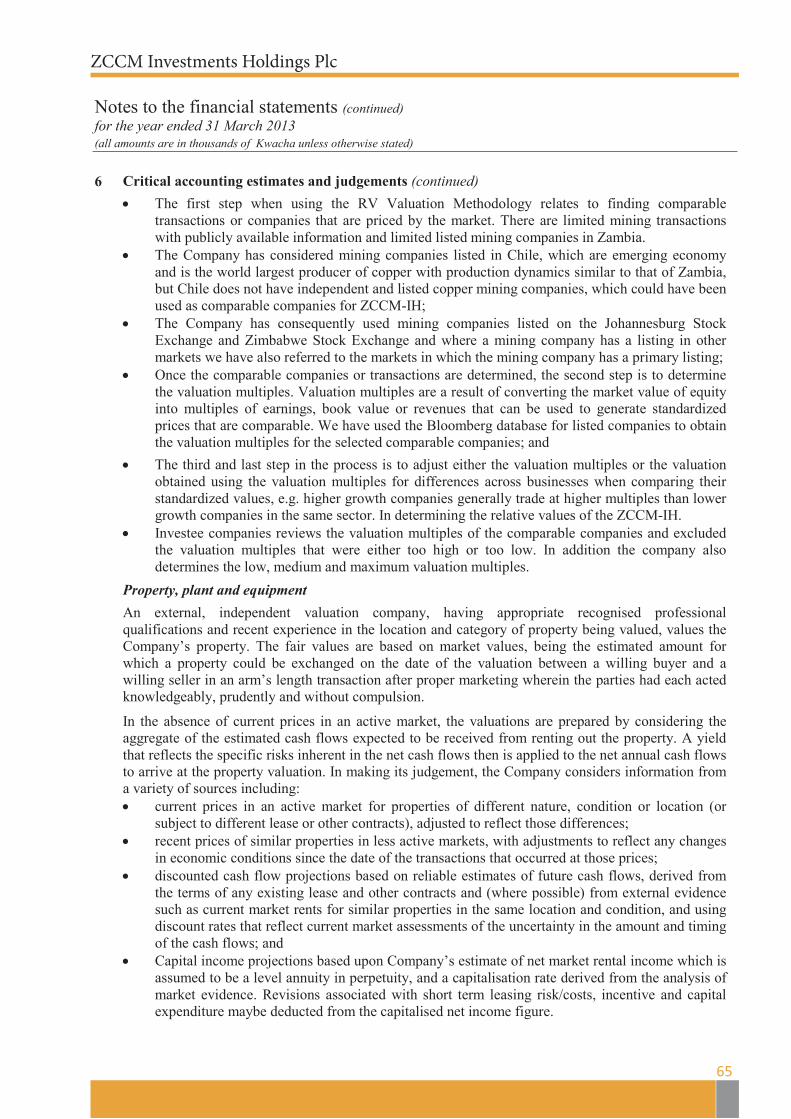
ZCCM Investments Holdings PlcZCCM Investments Holdings Plc
Notes to the financial statements (continued) for the year ended 31 March 2013 (all amounts are in thousands of Kwacha unless otherwise stated)
65
6
Critical accounting estimates and judgements (continued)
• The first step when using the RV Valuation Methodology relates to finding comparable transactions or companies that are priced by the market. There are limited mining transactions with publicly available information and limited listed mining companies in Zambia.
• The Company has considered mining companies listed in Chile, which are emerging economy and is the world largest producer of copper with production dynamics similar to that of Zambia, but Chile does not have independent and listed copper mining companies, which could have been used as comparable companies for ZCCM-IH;
• The Company has consequently used mining companies listed on the Johannesburg Stock Exchange and Zimbabwe Stock Exchange and where a mining company has a listing in other markets we have also referred to the markets in which the mining company has a primary listing;
• Once the comparable companies or transactions are determined, the second step is to determine the valuation multiples. Valuation multiples are a result of converting the market value of equity into multiples of earnings, book value or revenues that can be used to generate standardized prices that are comparable. We have used the Bloomberg database for listed companies to obtain the valuation multiples for the selected comparable companies; and
• The third and last step in the process is to adjust either the valuation multiples or the valuation obtained using the valuation multiples for differences across businesses when comparing their standardized values, e.g. higher growth companies generally trade at higher multiples than lower growth companies in the same sector. In determining the relative values of the ZCCM-IH.
• Investee companies reviews the valuation multiples of the comparable companies and excluded the valuation multiples that were either too high or too low. In addition the company also determines the low, medium and maximum valuation multiples.
Property, plant and equipment
An external, independent valuation company, having appropriate recognised professional qualifications and recent experience in the location and category of property being valued, values the Company’s property. The fair values are based on market values, being the estimated amount for which a property could be exchanged on the date of the valuation between a willing buyer and a willing seller in an arm’s length transaction after proper marketing wherein the parties had each acted knowledgeably, prudently and without compulsion.
In the absence of current prices in an active market, the valuations are prepared by considering the aggregate of the estimated cash flows expected to be received from renting out the property. A yield that reflects the specific risks inherent in the net cash flows then is applied to the net annual cash flows to arrive at the property valuation. In making its judgement, the Company considers information from a variety of sources including: • current prices in an active market for properties of different nature, condition or location (or
subject to different lease or other contracts), adjusted to reflect those differences; • recent prices of similar properties in less active markets, with adjustments to reflect any changes
in economic conditions since the date of the transactions that occurred at those prices; • discounted cash flow projections based on reliable estimates of future cash flows, derived from
the terms of any existing lease and other contracts and (where possible) from external evidence such as current market rents for similar properties in the same location and condition, and using discount rates that reflect current market assessments of the uncertainty in the amount and timing of the cash flows; and
• Capital income projections based upon Company’s estimate of net market rental income which is assumed to be a level annuity in perpetuity, and a capitalisation rate derived from the analysis of market evidence. Revisions associated with short term leasing risk/costs, incentive and capital expenditure maybe deducted from the capitalised net income figure.
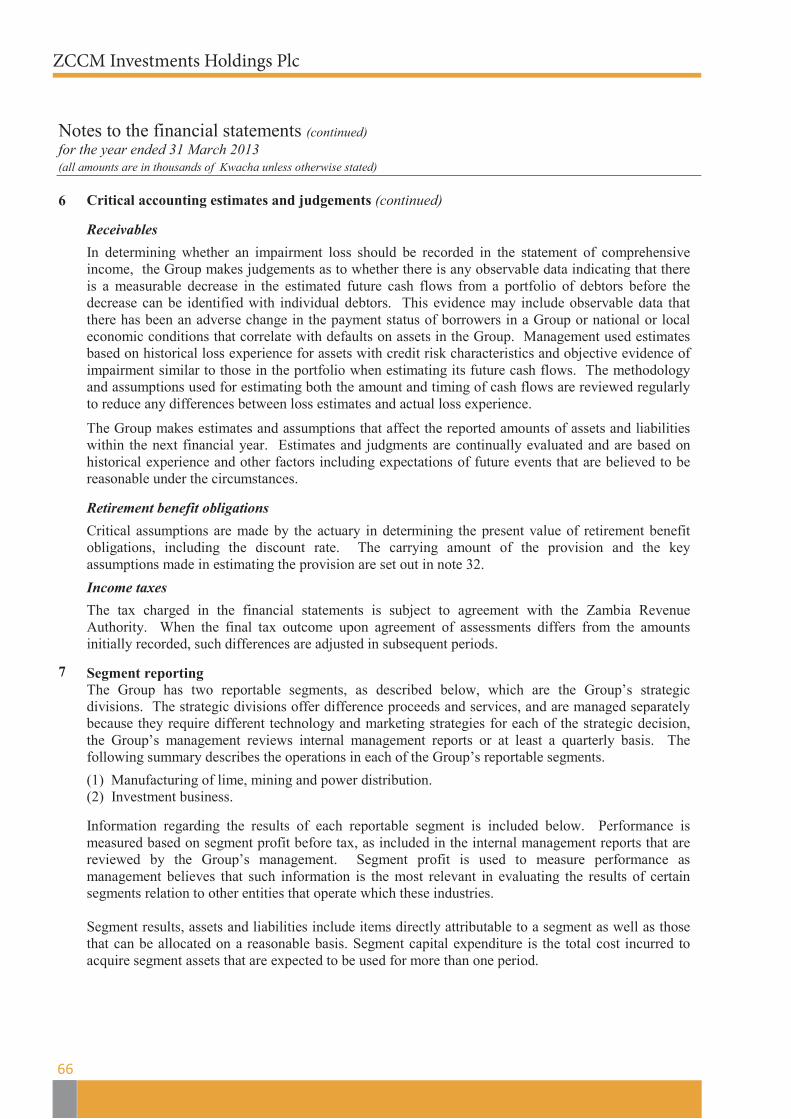
ZCCM Investments Holdings Plc
ZCCM Investments Holdings Plc
Notes to the financial statements (continued) for the year ended 31 March 2013 (all amounts are in thousands of Kwacha unless otherwise stated)
66
6
7
Critical accounting estimates and judgements (continued)
Receivables
In determining whether an impairment loss should be recorded in the statement of comprehensive income, the Group makes judgements as to whether there is any observable data indicating that there is a measurable decrease in the estimated future cash flows from a portfolio of debtors before the decrease can be identified with individual debtors. This evidence may include observable data that there has been an adverse change in the payment status of borrowers in a Group or national or local economic conditions that correlate with defaults on assets in the Group. Management used estimates based on historical loss experience for assets with credit risk characteristics and objective evidence of impairment similar to those in the portfolio when estimating its future cash flows. The methodology and assumptions used for estimating both the amount and timing of cash flows are reviewed regularly to reduce any differences between loss estimates and actual loss experience.
The Group makes estimates and assumptions that affect the reported amounts of assets and liabilities within the next financial year. Estimates and judgments are continually evaluated and are based on historical experience and other factors including expectations of future events that are believed to be reasonable under the circumstances.
Retirement benefit obligations
Critical assumptions are made by the actuary in determining the present value of retirement benefit obligations, including the discount rate. The carrying amount of the provision and the key assumptions made in estimating the provision are set out in note 32.
Income taxes
The tax charged in the financial statements is subject to agreement with the Zambia Revenue Authority. When the final tax outcome upon agreement of assessments differs from the amounts initially recorded, such differences are adjusted in subsequent periods.
Segment reporting The Group has two reportable segments, as described below, which are the Group’s strategic divisions. The strategic divisions offer difference proceeds and services, and are managed separately because they require different technology and marketing strategies for each of the strategic decision, the Group’s management reviews internal management reports or at least a quarterly basis. The following summary describes the operations in each of the Group’s reportable segments.
(1) Manufacturing of lime, mining and power distribution. (2) Investment business.
Information regarding the results of each reportable segment is included below. Performance is measured based on segment profit before tax, as included in the internal management reports that are reviewed by the Group’s management. Segment profit is used to measure performance as management believes that such information is the most relevant in evaluating the results of certain segments relation to other entities that operate which these industries.
Segment results, assets and liabilities include items directly attributable to a segment as well as those that can be allocated on a reasonable basis. Segment capital expenditure is the total cost incurred to acquire segment assets that are expected to be used for more than one period.

ZCC
M In
vest
men
ts H
oldi
ngs P
lc
67
ZCC
M In
vest
men
ts H
oldi
ngs P
lc
Not
es to
the
finan
cial
stat
emen
ts (c
ontin
ued)
fo
r the
yea
r end
ed 3
1 M
arch
201
3 (a
ll am
ount
s are
in th
ousa
nds o
f Kw
acha
unl
ess o
ther
wise
stat
ed)
7 Se
gmen
t rep
ortin
g (c
ontin
ued)
The
segm
ent r
esul
ts fo
r the
Gro
up w
ere
as fo
llow
s:
ZC
CM
-IH
Ndo
la L
ime
M
isen
ge
Elim
inat
ed/
adju
stm
ent
C
onso
lidat
ed
20
13
2012
2013
20
12
20
13
2012
2013
20
12
20
13
2012
R
even
ue fr
om e
xter
nal
cust
omer
s:
Sa
les
- -
21
4,62
3
177,
607
- -
-
-
214,
623
17
7,60
7
Serv
ices
-
-
- -
-
-
- -
-
- D
ivid
ends
30
5,48
1
79,7
08
-
-
- -
-
-
305,
481
79
,708
O
ther
-
-
- -
-
-
- -
-
- To
tal r
even
ue fr
om
exte
rnal
cus
tom
ers
30
5,48
1
79
,708
21
4,62
3
17
7,60
7
-
-
- -
52
0,10
4
257,
316
In
ter-
segm
ent r
even
ue
- -
-
-
204
-
(2
04)
- -
Shar
e of
pro
fit o
f equ
ity
acco
unte
d in
vest
ees
- -
-
-
204
-
(3
,548
) 5,
050
22
1,63
5 64
0,46
8 To
tal r
even
ue
305,
481
79
,708
214,
623
17
7,60
7
20
4
-
(204
) -
52
0,10
4
257,
316
Pr
ofit/
(loss
) for
the
year
56
7,92
5
598
,455
(22,
926)
(6
,163
)
(657
) -
3,
956
5,05
0
762,
021
1,
237,
810
Rev
enue
2
013
2
012
To
tal r
even
ue fr
om re
porta
ble
segm
ents
52
0,30
8 25
7,31
6 El
imin
atio
n of
inte
r seg
men
t re
venu
e
(2
04)
- C
onso
lidat
ed r
even
ue
520,
104
257,
316
Prof
it or
loss
To
tal p
rofit
or l
oss f
or re
porte
d se
gmen
ts
432,
553
4
12,2
73
Shar
e of
pro
fit o
f equ
ity a
ccou
nted
in
vest
ees
22
1,63
5
640,
468
C
onso
lidat
ed p
rofit
bef
ore
tax
654,
188
1
,052
,741
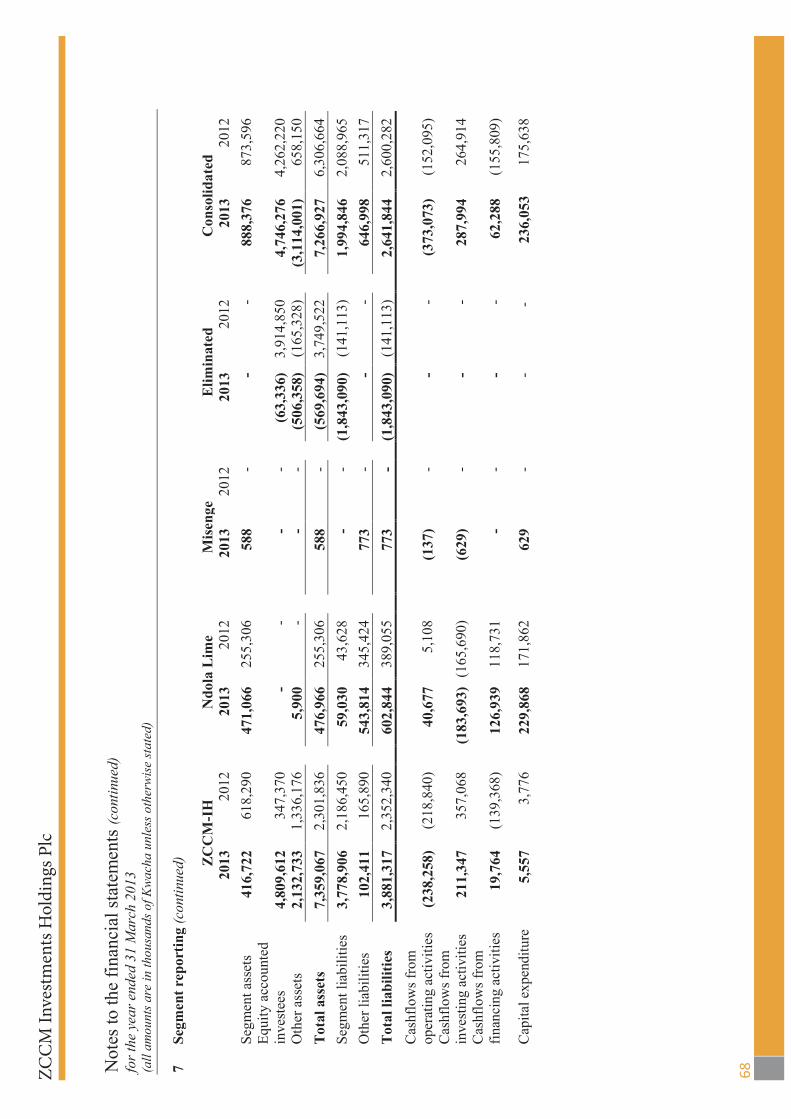
ZCC
M In
vest
men
ts H
oldi
ngs P
lc
68
ZCC
M In
vest
men
ts H
oldi
ngs P
lc
Not
es to
the
finan
cial
stat
emen
ts (c
ontin
ued)
fo
r the
yea
r end
ed 3
1 M
arch
201
3 (a
ll am
ount
s are
in th
ousa
nds o
f Kw
acha
unl
ess o
ther
wise
stat
ed)
7
Segm
ent r
epor
ting
(con
tinue
d)
ZC
CM
-IH
Ndo
la L
ime
M
isen
ge
E
limin
ated
Con
solid
ated
20
13
2012
2013
20
12
20
13
2012
2013
20
12
20
13
2012
Segm
ent a
sset
s 41
6,72
2 61
8,29
0
471,
066
255
,306
588
-
-
-
888,
376
87
3,59
6
Equi
ty a
ccou
nted
in
vest
ees
4,80
9,61
2 34
7,37
0
- -
-
-
(63,
336)
3,
914,
850
4,74
6,27
6
4,26
2,22
0
Oth
er a
sset
s 2,
132,
733
1,33
6,17
6
5,90
0 -
-
-
(506
,358
) (1
65,3
28)
(3
,114
,001
) 65
8,15
0
Tot
al a
sset
s 7,
359,
067
2,30
1,83
6
476,
966
255,
306
58
8 -
(5
69,6
94)
3,74
9,52
2
7,26
6,92
7
6,30
6,66
4
Segm
ent l
iabi
litie
s 3,
778,
906
2,18
6,45
0
59,0
30
43,6
28
-
- (1
,843
,090
) (1
41,1
13)
1,
994,
846
2
,088
,965
O
ther
liab
ilitie
s 10
2,41
1 16
5,89
0
543,
814
345,
424
77
3 -
-
-
646,
998
51
1,31
7
Tot
al li
abili
ties
3,88
1,31
7 2,
352,
340
60
2,84
4 38
9,05
5
773
-
(1,8
43,0
90)
(141
,113
)
2,64
1,84
4
2,60
0,28
2
C
ashf
low
s fro
m
oper
atin
g ac
tiviti
es
(238
,258
) (2
18,8
40)
4
0,67
7 5
,108
(137
) -
-
-
(373
,073
) (1
52,0
95)
Cas
hflo
ws f
rom
in
vest
ing
activ
ities
2
11,3
47
357
,068
(183
,693
) (1
65,6
90)
(6
29)
-
- -
2
87,9
94
264
,914
C
ashf
low
s fro
m
finan
cing
act
iviti
es
19,
764
(139
,368
)
126
,939
1
18,7
31
-
-
- -
6
2,28
8 (1
55,8
09)
C
apita
l exp
endi
ture
5
,557
3
,776
229,
868
171,
862
62
9 -
-
-
236
,053
1
75,6
38

ZCCM Investments Holdings PlcZCCM Investments Holdings Plc
Notes to the financial statements (continued) for the year ended 31 March 2013 (all amounts are in thousands of Kwacha unless otherwise stated)
69
7 Segment reporting (continued)
Revenue from one associate entity (Kansanshi Mining Plc) of the Group’s investment business represents approximately K197 million (2012: K39 million) of the Group’s total revenue.
Group reconciliation of reported assets and liabilities (i) Other assets consist of inventories, trade and other receivables, held to maturity investment
securities, cash and cash equivalents, and assets classified as held for sale.
(ii) Other liability includes bank overdraft, tax liabilities, retirement benefits and liabilities classified as held for sale.
8 Revenue Group Company 2013 2012 2013 2012 Dividends receivable (note 34(ii)) 305,481 79,708 305,481 79,708 Lime sales 214,623 177,608 - -
520,104 257,316 305,481 79,708 9(a) Other income
Group Company 2013 2012 2013 2012 Gain on disposal of Equinox - 273,339 - 273,339 Gain on disposal of Alberg 15,879 - 15,879 - Gain on 5% free carried interest: Lubambe Copper Mines Limited -
84,935
-
84,935
Reversal of environmental provision (note 32) - 1,316 - 1,316 Income from price participation 144,391 - 144,391 - Interest income from related parties 36,257 15,178 36,040 11,984 Management fee income 9,012 4,893 9,012 4,893 Fair value adjustment – investment property 750 - 750 - Rental income 116 - 116 - Profit on disposal of property, plant and equipment 1,022 1,964 629 1,964 Miscellaneous income 2,382 - 241 -
209,809 381,625 207,058 378,431 Gain on disposal of Equinox On April 26, 2011, Barrick Canada Inc. (offeror), a wholly owned subsidiary of Barrick Gold Corporation, made an offer (as extended pursuant to the notice of extension dated June 2, 2012) to purchase all of the issued and outstanding common shares of Equinox Minerals Limited (Equinox), including those common shares that are represented by CHESS Depositary Interests (CDIs) but other than the common shares directly or indirectly owned by the offeror or its affiliates (collectively, “the Equinox Shares”).
The offer was accepted by ZCCM -IH together with other Equinox shareholders who held, in aggregate, more than 96% of the outstanding Equinox shares. The profits realised from this transaction were K273 billion.
Gain on disposed or Alberg The gain of K15.9 million arises from the sale of Alberg Mining licenses and intellectual materials.
Gain on 5% free carried interest: Lubambe Copper Mines Limited
The gain on Lubambe Copper Mines Limited relates to the 5% free carried interest resulting from the acquisition of the 20% shareholding in Lubambe Copper Mines Limited.
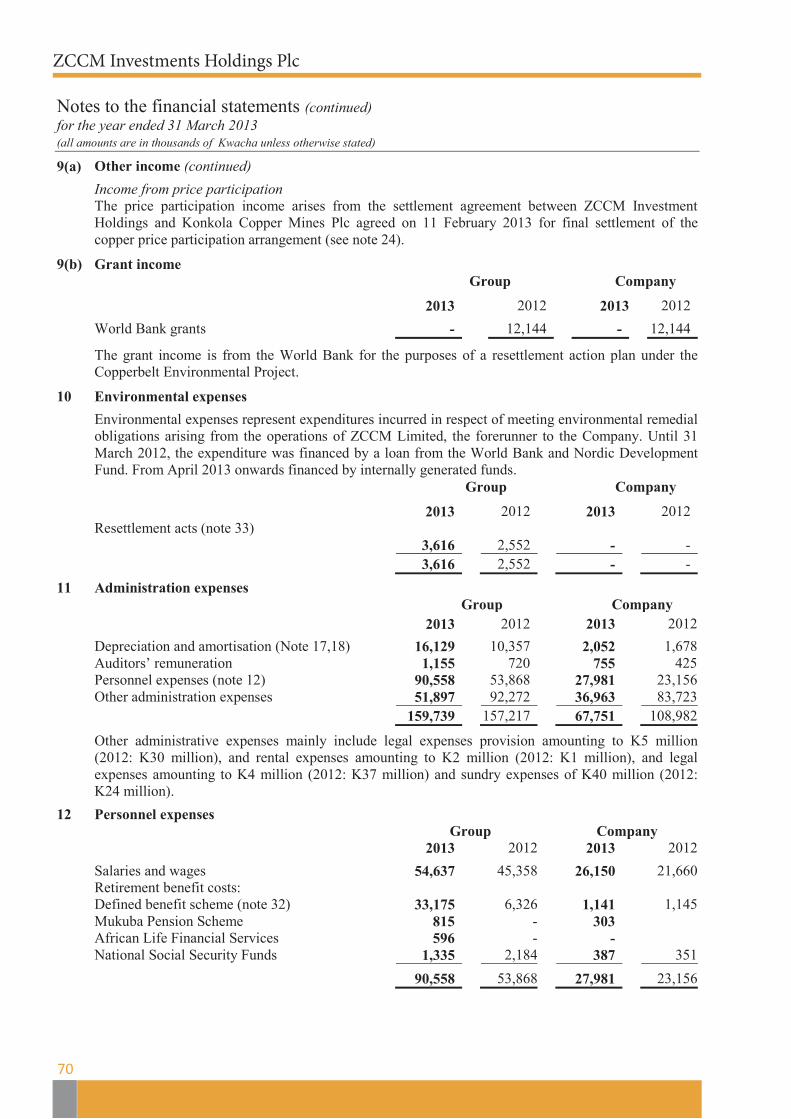
ZCCM Investments Holdings PlcZCCM Investments Holdings Plc
Notes to the financial statements (continued) for the year ended 31 March 2013 (all amounts are in thousands of Kwacha unless otherwise stated)
70
9(a) Other income (continued)
Income from price participation The price participation income arises from the settlement agreement between ZCCM Investment Holdings and Konkola Copper Mines Plc agreed on 11 February 2013 for final settlement of the copper price participation arrangement (see note 24).
9(b) Grant income Group Company
2013 2012 2013 2012
World Bank grants - 12,144 - 12,144
The grant income is from the World Bank for the purposes of a resettlement action plan under the Copperbelt Environmental Project.
10 Environmental expenses
Environmental expenses represent expenditures incurred in respect of meeting environmental remedial obligations arising from the operations of ZCCM Limited, the forerunner to the Company. Until 31 March 2012, the expenditure was financed by a loan from the World Bank and Nordic Development Fund. From April 2013 onwards financed by internally generated funds.
Group Company
2013 2012 2013 2012 Resettlement acts (note 33)
3,616 2,552 - -
3,616 2,552 - -
11 Administration expenses Group Company 2013 2012 2013 2012
Depreciation and amortisation (Note 17,18) 16,129 10,357 2,052 1,678 Auditors’ remuneration 1,155 720 755 425 Personnel expenses (note 12) 90,558 53,868 27,981 23,156 Other administration expenses 51,897 92,272 36,963 83,723
159,739 157,217 67,751 108,982
Other administrative expenses mainly include legal expenses provision amounting to K5 million (2012: K30 million), and rental expenses amounting to K2 million (2012: K1 million), and legal expenses amounting to K4 million (2012: K37 million) and sundry expenses of K40 million (2012: K24 million).
12 Personnel expenses Group Company 2013 2012 2013 2012
Salaries and wages 54,637 45,358 26,150 21,660 Retirement benefit costs: Defined benefit scheme (note 32) 33,175 6,326 1,141 1,145 Mukuba Pension Scheme 815 - 303 African Life Financial Services 596 - - National Social Security Funds 1,335 2,184 387 351
90,558 53,868 27,981 23,156
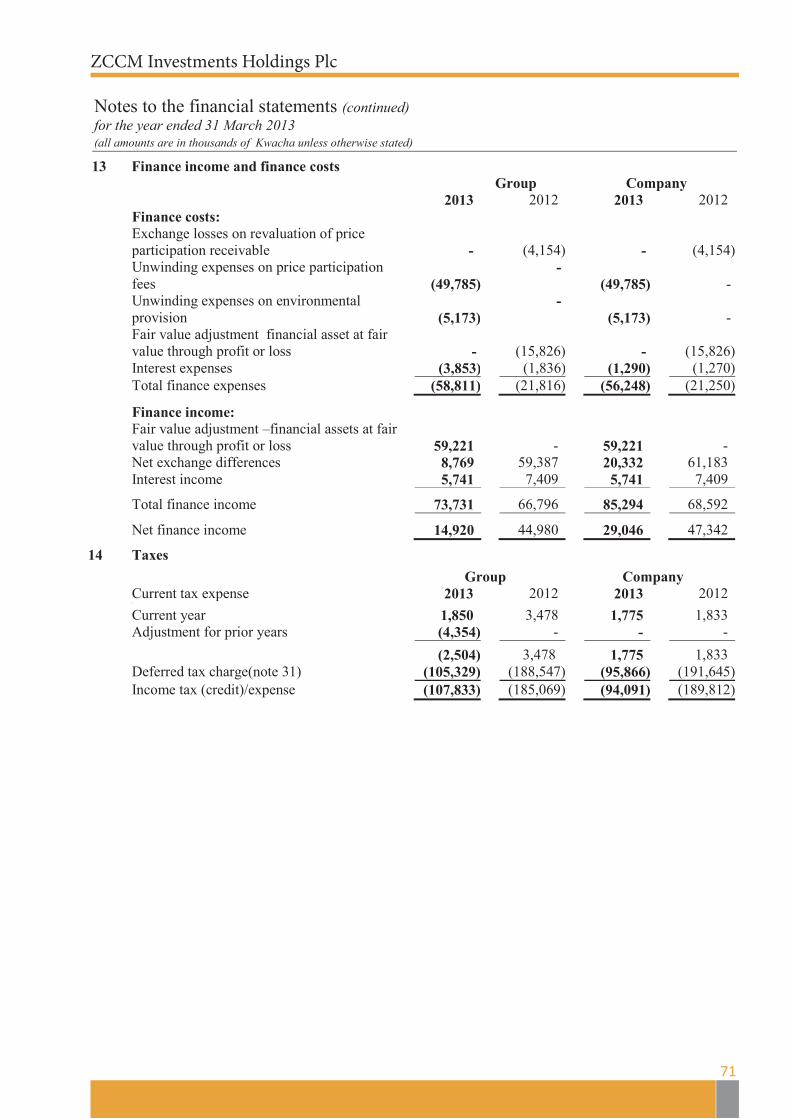
ZCCM Investments Holdings PlcZCCM Investments Holdings Plc
Notes to the financial statements (continued) for the year ended 31 March 2013 (all amounts are in thousands of Kwacha unless otherwise stated)
71
13 Finance income and finance costs Group Company 2013 2012 2013 2012 Finance costs: Exchange losses on revaluation of price participation receivable
-
(4,154)
-
(4,154)
Unwinding expenses on price participation fees (49,785)
- (49,785)
-
Unwinding expenses on environmental provision (5,173)
- (5,173)
-
Fair value adjustment financial asset at fair value through profit or loss
-
(15,826)
-
(15,826)
Interest expenses (3,853) (1,836) (1,290) (1,270) Total finance expenses (58,811) (21,816) (56,248) (21,250)
Finance income: Fair value adjustment –financial assets at fair
value through profit or loss 59,221 - 59,221 - Net exchange differences 8,769 59,387 20,332 61,183 Interest income 5,741 7,409 5,741 7,409
Total finance income 73,731 66,796 85,294 68,592
Net finance income 14,920 44,980 29,046 47,342
14 Taxes
Group Company Current tax expense 2013 2012 2013 2012 \
Current year 1,850 3,478 1,775 1,833 Adjustment for prior years (4,354) - - -
(2,504) 3,478 1,775 1,833 Deferred tax charge(note 31) (105,329) (188,547) (95,866) (191,645) Income tax (credit)/expense (107,833) (185,069) (94,091) (189,812)
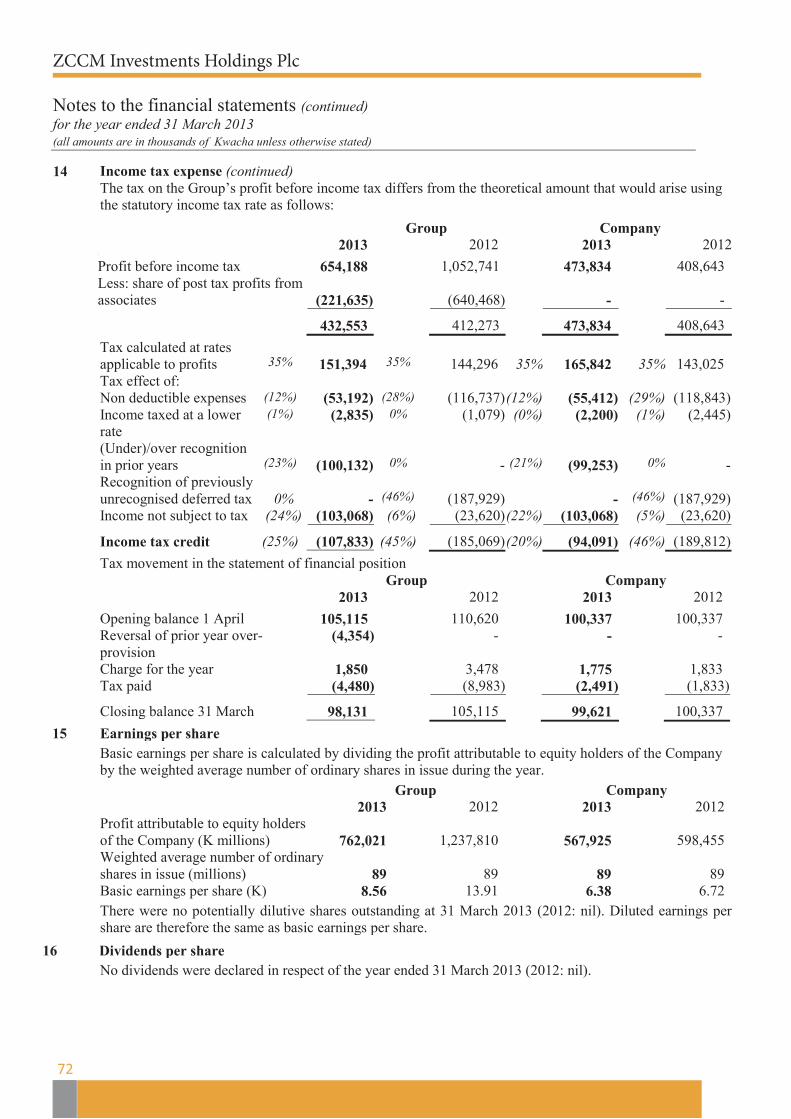
ZCCM Investments Holdings PlcZCCM Investments Holdings Plc
Notes to the financial statements (continued) for the year ended 31 March 2013 (all amounts are in thousands of Kwacha unless otherwise stated)
72
14 Income tax expense (continued) The tax on the Group’s profit before income tax differs from the theoretical amount that would arise using
the statutory income tax rate as follows:
Group Company 2013 2012 2013 2012 \
Profit before income tax 654,188 1,052,741 473,834 408,643 Less: share of post tax profits from associates
(221,635)
(640,468)
-
-
432,553 412,273 473,834 408,643
Tax calculated at rates applicable to profits
35%
151,394
35%
144,296
35%
165,842
35%
143,025
Tax effect of: Non deductible expenses (12%) (53,192) (28%) (116,737) (12%) (55,412) (29%) (118,843) Income taxed at a lower rate
(1%) (2,835) 0% (1,079) (0%) (2,200) (1%) (2,445)
(Under)/over recognition in prior years
(23%)
(100,132)
0%
-
(21%)
(99,253)
0%
-
Recognition of previously unrecognised deferred tax
0%
-
(46%)
(187,929)
-
(46%)
(187,929)
Income not subject to tax (24%) (103,068) (6%) (23,620) (22%) (103,068) (5%) (23,620)
Income tax credit (25%) (107,833) (45%) (185,069) (20%) (94,091) (46%) (189,812)
Tax movement in the statement of financial position Group Company 2013 2012 2013 2012
Opening balance 1 April 105,115 110,620 100,337 100,337 Reversal of prior year over-provision
(4,354)
- - -
Charge for the year 1,850 3,478 1,775 1,833 Tax paid (4,480) (8,983) (2,491) (1,833)
Closing balance 31 March 98,131 105,115 99,621 100,337
15 Earnings per share
Basic earnings per share is calculated by dividing the profit attributable to equity holders of the Company by the weighted average number of ordinary shares in issue during the year.
Group Company 2013 2012 2013 2012 Profit attributable to equity holders of the Company (K millions)
762,021
1,237,810
567,925
598,455
Weighted average number of ordinary shares in issue (millions)
89
89
89
89
Basic earnings per share (K) 8.56 13.91 6.38 6.72
There were no potentially dilutive shares outstanding at 31 March 2013 (2012: nil). Diluted earnings per share are therefore the same as basic earnings per share.
16 Dividends per share
No dividends were declared in respect of the year ended 31 March 2013 (2012: nil).
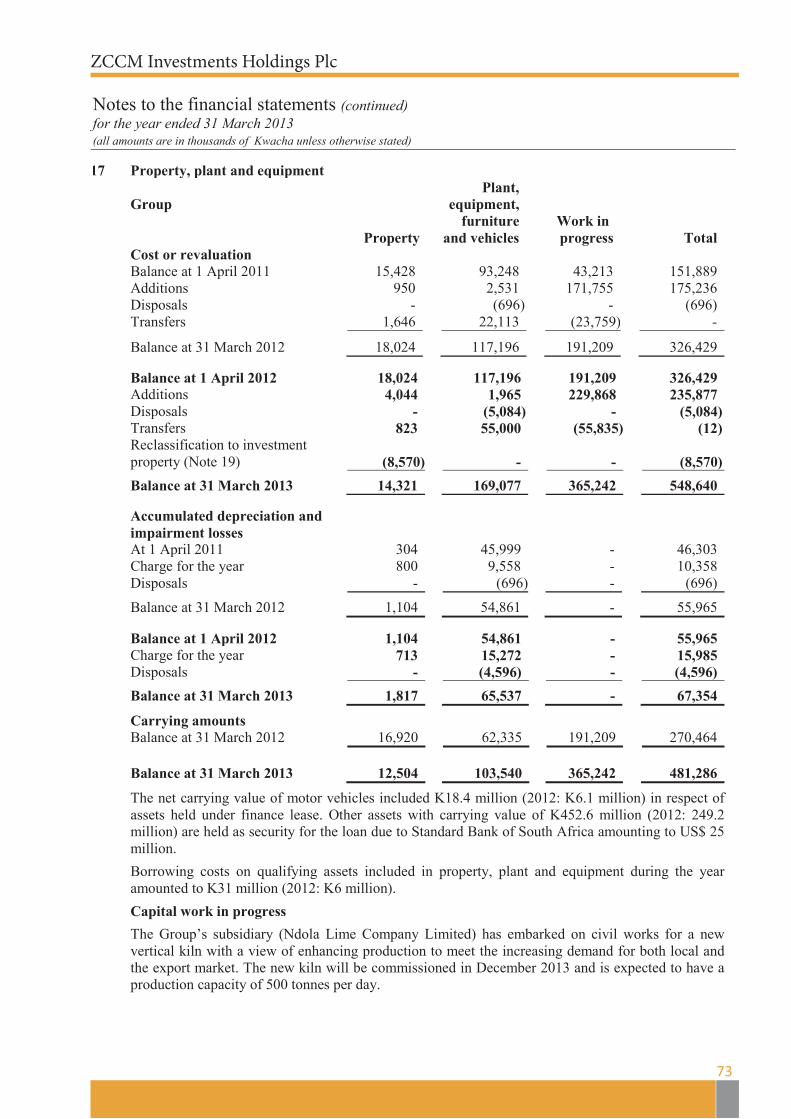
ZCCM Investments Holdings PlcZCCM Investments Holdings Plc
Notes to the financial statements (continued) for the year ended 31 March 2013 (all amounts are in thousands of Kwacha unless otherwise stated)
73
17 Property, plant and equipment
Group
Property
Plant, equipment,
furniture and vehicles
Work in progress
Total Cost or revaluation Balance at 1 April 2011 15,428 93,248 43,213 151,889 Additions 950 2,531 171,755 175,236 Disposals - (696) - (696) Transfers 1,646 22,113 (23,759) -
Balance at 31 March 2012 18,024 117,196 191,209 326,429
Balance at 1 April 2012 18,024 117,196 191,209 326,429 Additions 4,044 1,965 229,868 235,877 Disposals - (5,084) - (5,084) Transfers 823 55,000 (55,835) (12) Reclassification to investment property (Note 19)
(8,570)
-
-
(8,570)
Balance at 31 March 2013 14,321 169,077 365,242 548,640
Accumulated depreciation and impairment losses
At 1 April 2011 304 45,999 - 46,303 Charge for the year 800 9,558 - 10,358 Disposals - (696) - (696)
Balance at 31 March 2012 1,104 54,861 - 55,965
Balance at 1 April 2012 1,104 54,861 - 55,965 Charge for the year 713 15,272 - 15,985 Disposals - (4,596) - (4,596)
Balance at 31 March 2013 1,817 65,537 - 67,354
Carrying amounts Balance at 31 March 2012 16,920 62,335 191,209 270,464 Balance at 31 March 2013 12,504 103,540 365,242 481,286
The net carrying value of motor vehicles included K18.4 million (2012: K6.1 million) in respect of assets held under finance lease. Other assets with carrying value of K452.6 million (2012: 249.2 million) are held as security for the loan due to Standard Bank of South Africa amounting to US$ 25 million.
Borrowing costs on qualifying assets included in property, plant and equipment during the year amounted to K31 million (2012: K6 million).
Capital work in progress
The Group’s subsidiary (Ndola Lime Company Limited) has embarked on civil works for a new vertical kiln with a view of enhancing production to meet the increasing demand for both local and the export market. The new kiln will be commissioned in December 2013 and is expected to have a production capacity of 500 tonnes per day.

ZCCM Investments Holdings PlcZCCM Investments Holdings Plc
Notes to the financial statements (continued) for the year ended 31 March 2013 (all amounts are in thousands of Kwacha unless otherwise stated)
74
17 Property, plant and equipment (continued)
Company
Property
Plant, equipment, furniture and
vehicles
Work in progress
Total Cost or revaluation At 1 April 2012 10,099 10,836 528 21,463 Additions - 2,316 1,058 3,374 Disposal - (696) - (696) Transfers - 528 (528) -
At 31 March 2012 10,099 12,984 1,058 24,141 At 1 April 2012 10,099 12,984 1,058 24,141
Additions 4,044 1,337 - 5,381 Disposal - (2,629) - (2,629) Reclassification to investment property
(8,570)
-
-
(8,570)
Transfers 552 494 (1,058) (12)
At 31 March 2013 6,125 12,186 - 18,311
Accumulated depreciation and impairment losses
At 1 April 2012 - 8,109 - 8,109 Charge for the year 482 1,088 - 1,570 Disposals - (696) - (696)
At 31 March 2012 482 8,501 - 8,983
At 1 April 2012 482 8,501 - 8,983 Charge for the year 324 1,583 - 1,907 Disposals - (2,211) - (2,211)
At 31 March 2013 806 7,873 - 8,679
Carrying amount At 31 March 2012 9,617 4,483 1,058 15,158
At 31 March 2013 5,319 4,313 - 9,632
Buildings were last revalued on 31 March 2011, by the Government Valuation Department. Valuations were made on the basis of the Open Market Value. The carrying values of the properties were adjusted to their revalued amounts and the resultant surplus net of deferred income tax was credited to the revaluation surplus in shareholders’ equity.
The register showing the details of property, as required by section 193 of the Zambia Companies Act, is available for inspection during business hours at the registered office of the Company.
Capital work in progress was commissioned in February 2013.
The carrying amount of property would have been K1.6 million (2012: K1.7 million) had it been measured using the cost model.

ZCCM Investments Holdings PlcZCCM Investments Holdings Plc
Notes to the financial statements (continued) for the year ended 31 March 2013 (all amounts are in thousands of Kwacha unless otherwise stated)
75
18 Intangible assets Group and company 2013 2012
Computer software licences
Computer software licences
Opening balance 1 April
Cost 881 479 Accumulated amortisation and impairment losses (425) (318)
Closing balance 31 March 456 161
At start of year 1 April 456 161 Additions 176 402 Transfers 12 - Amortisation (145) (107)
At end of year 499 456
At 31 March Cost 1,069 881 Accumulated amortisation and impairment losses (570) (425)
Carrying amounts 499 456
19 Investment property
Group and Company 2013 2012
Opening balance - - Reclassification from property, plant and
equipment 8,570 -
Fair value movement (Note 9 (a)) 750 -
Closing balance 9,320 -
Investment property comprises a number of commercial properties that are leased to third parties. Each of the leases contains an initial non-cancellable period of 1 year, with annual rents indexed to consumer prices. Subsequent renewals are negotiated with the lessee and on average renewal period is 1 year. No contingent rents are charged. The above properties have been transferred from property, plant and equipment (see note 17) to investment property, since the buildings were no longer used by the Group and as such it was decided that the buildings would be leased to third parties.
The investment properties were revalued by the Government Valuation Department. The valuations were made on the basis of Open Market Value as at 31 March 2013.
The use of a property changed from owner occupied to investment property on 1 November 2012 and the properties were reclassified as investment property and measured at fair value.
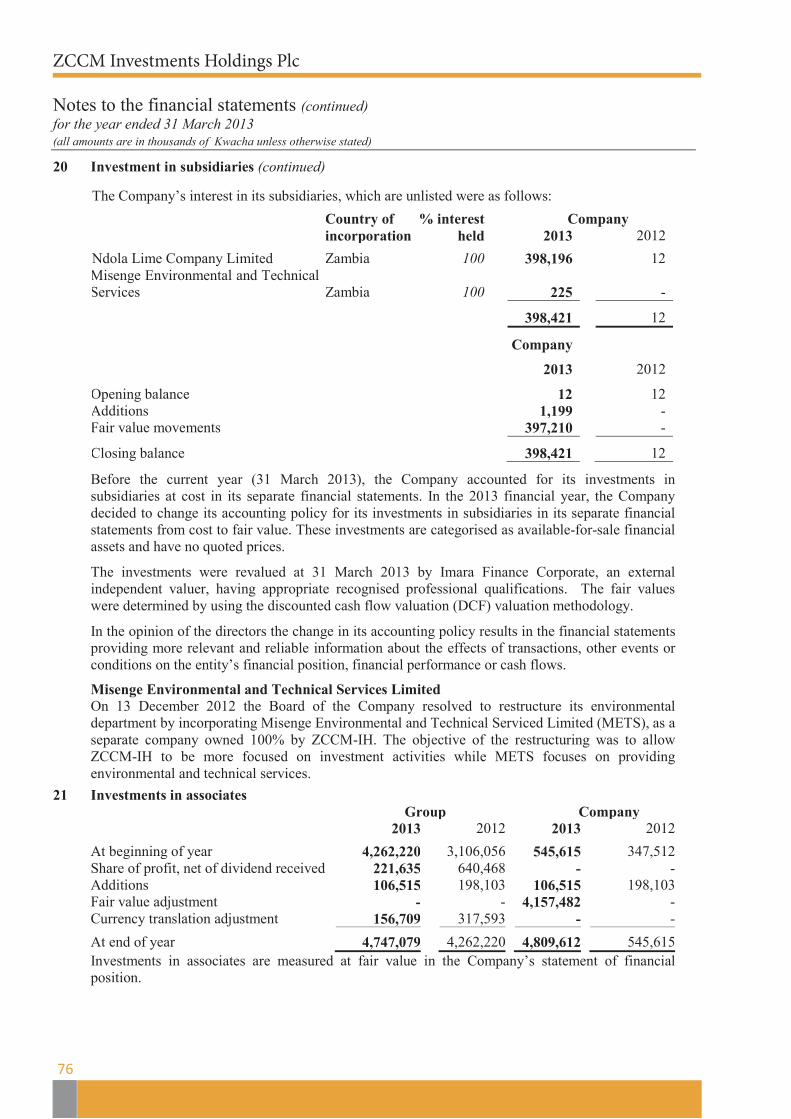
ZCCM Investments Holdings PlcZCCM Investments Holdings Plc
Notes to the financial statements (continued) for the year ended 31 March 2013 (all amounts are in thousands of Kwacha unless otherwise stated)
76
20 Investment in subsidiaries (continued)
The Company’s interest in its subsidiaries, which are unlisted were as follows:
Country of % interest Company incorporation held 2013 2012
Ndola Lime Company Limited Zambia 100 398,196 12 Misenge Environmental and Technical
Services Zambia
100
225
-
398,421 12
Company
2013
2012
Opening balance 12 12 Additions 1,199 - Fair value movements 397,210 -
Closing balance 398,421 12
Before the current year (31 March 2013), the Company accounted for its investments in subsidiaries at cost in its separate financial statements. In the 2013 financial year, the Company decided to change its accounting policy for its investments in subsidiaries in its separate financial statements from cost to fair value. These investments are categorised as available-for-sale financial assets and have no quoted prices.
The investments were revalued at 31 March 2013 by Imara Finance Corporate, an external independent valuer, having appropriate recognised professional qualifications. The fair values were determined by using the discounted cash flow valuation (DCF) valuation methodology.
In the opinion of the directors the change in its accounting policy results in the financial statements providing more relevant and reliable information about the effects of transactions, other events or conditions on the entity’s financial position, financial performance or cash flows.
Misenge Environmental and Technical Services Limited On 13 December 2012 the Board of the Company resolved to restructure its environmental department by incorporating Misenge Environmental and Technical Serviced Limited (METS), as a separate company owned 100% by ZCCM-IH. The objective of the restructuring was to allow ZCCM-IH to be more focused on investment activities while METS focuses on providing environmental and technical services.
21 Investments in associates Group Company 2013 2012 2013 2012
At beginning of year 4,262,220 3,106,056 545,615 347,512 Share of profit, net of dividend received 221,635 640,468 - - Additions 106,515 198,103 106,515 198,103 Fair value adjustment - - 4,157,482 - Currency translation adjustment 156,709 317,593 - -
At end of year 4,747,079 4,262,220 4,809,612 545,615 Investments in associates are measured at fair value in the Company’s statement of financial position.

ZCC
M In
vest
men
ts H
oldi
ngs P
lcZC
CM
Inve
stm
ents
Hol
ding
s Plc
N
otes
to th
e fin
anci
al st
atem
ents
(con
tinue
d)
for t
he y
ear e
nded
31
Mar
ch 2
013
(all
amou
nts a
re in
thou
sand
s of
Kw
acha
unl
ess o
ther
wis
e st
ated
)
77
21
Inve
stm
ents
in a
ssoc
iate
s (co
ntin
ued)
Sum
mar
y fin
anci
al in
form
atio
n fo
r equ
ity a
ccou
nted
inve
stee
s, no
t adj
uste
d fo
r the
per
cent
age
owne
rshi
p he
ld b
y th
e C
ompa
ny.
A
ccou
ntin
g ye
ar e
nd
C
ount
ry o
f in
corp
orat
ion
%
In
tere
st
A
sset
s
L
iabi
litie
s
R
even
ues
Pr
ofit/
(lo
ss)
Shar
e of
pr
ofit/
(lo
ss)
D
ivid
end
rece
ived
Shar
e of
as
soci
ate
pr
ofit/
(los
s)
2013
K
onko
la C
oppe
r Min
es
31 M
arch
Za
mbi
a 20
.6
13,8
56,3
95
8,34
0,03
8 9,
434,
648
(34,
105)
(7
,026
) 82
,594
(8
9,62
0)
Kan
sans
hi M
inin
g Pl
c 31
Mar
ch
Zam
bia
20
21,9
61,7
85
6,38
2,81
4 11
,180
,472
2,
652,
494
530,
499
196,
689
333,
810
Cop
perb
elt E
nerg
y C
orpo
ratio
n Pl
c 31
Dec
embe
r Za
mbi
a 20
1,
821,
094
874,
322
1,35
3,09
3 11
1,36
8 22
,274
11
,000
11
,274
C
NM
C L
uans
hya
31 D
ecem
ber
Zam
bia
20
3,42
5,18
6 3,
431,
342
1,09
3,37
2 (7
,939
) -
- -
Kar
iba
Min
eral
s 30
June
Za
mbi
a 50
19
,909
38
,392
2,
589
(6,6
56)
- -
- M
aam
ba C
ollie
ries L
imte
d 31
Mar
ch
Zam
bia
35
842,
070
492,
024
15,1
19
(55,
500)
(1
9,42
5)
- (1
9,42
5)
Luba
mbe
Cop
per M
ines
(Kon
noco
) 30
June
Za
mbi
a 20
3,
177,
373
2,26
2,15
0 27
3,98
3 (7
2,02
1)
(14,
404)
-
(14,
404)
51
1,91
8 29
0,28
3 22
1,63
5 20
12
Kon
kola
Cop
per M
ines
31
Mar
ch
Zam
bia
20.6
13
,925
,090
8,
105,
799
9,03
2,97
6 62
8,68
4 12
9,50
9 8,
489
121,
020
Kan
sans
hi M
inin
g Pl
c 31
Mar
ch
Zam
bia
20
19,5
60,9
95
5,90
0,56
0 10
,432
,522
2,
747,
101
549,
420
39,0
01
510,
419
Cop
perb
elt E
nerg
y C
orpo
ratio
n Pl
c 31
Dec
embe
r Za
mbi
a 20
1,
642,
704
742,
529
1,17
1,89
9 11
4,95
9 22
,992
12
,224
10
,768
M
aam
ba C
ollie
ries L
imte
d 31
Mar
ch
Zam
bia
35
338,
120
538,
389
1,47
5 (8
,794
) -
- -
Luba
mbe
Cop
per M
ines
(Kon
noco
) 30
June
Za
mbi
a 20
1,
895,
996
1,13
9,37
6 -
(8,6
94)
(1,7
39)
- (1
,739
)
70
0,18
2 59
,714
64
0,46
8 Sh
are
of p
rofit
s are
net
of d
ivid
ends
rece
ived
. 22
Fi
nanc
ial a
sset
s at f
air
valu
e th
roug
h pr
ofit
or lo
ss
G
roup
and
Com
pany
20
13
2012
At b
egin
ning
of y
ear
34
7,37
0
355,
292
Add
ition
- 7,
904
Fair
valu
e ch
ange
s (no
te 1
3)
59
,221
(1
5,82
6)
At e
nd o
f yea
r
406,
591
34
7,37
0
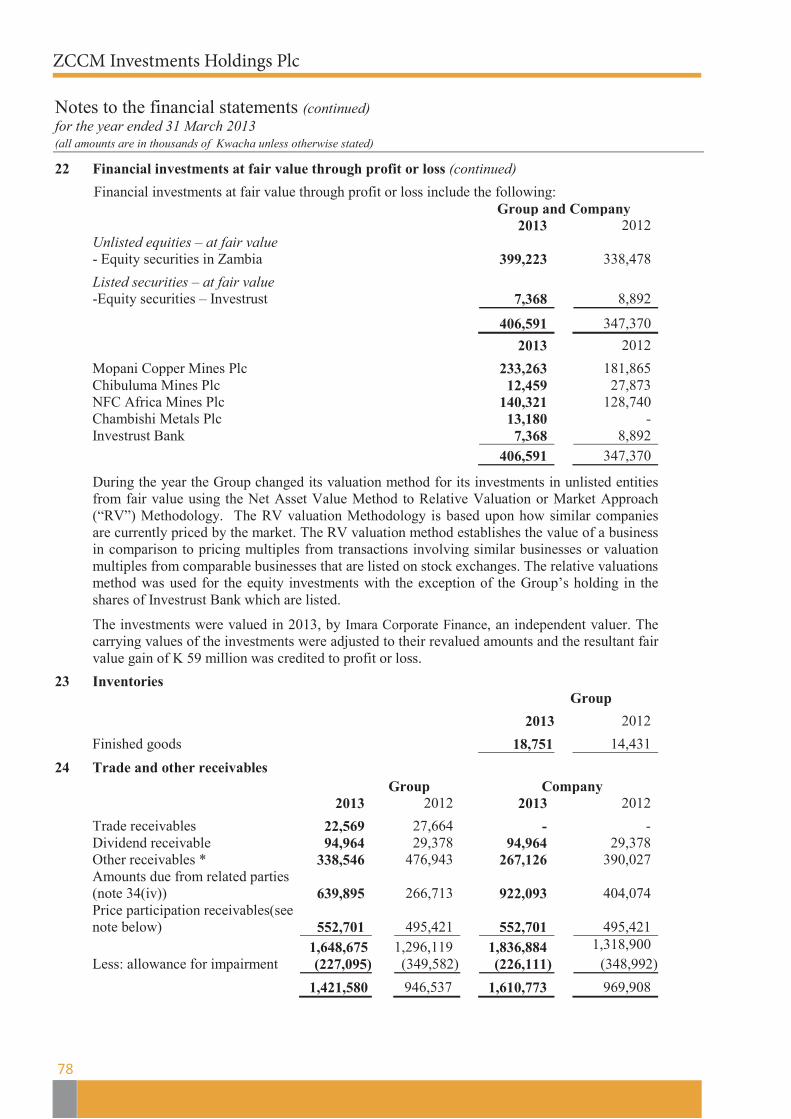
ZCCM Investments Holdings PlcZCCM Investments Holdings Plc
Notes to the financial statements (continued) for the year ended 31 March 2013 (all amounts are in thousands of Kwacha unless otherwise stated)
78
22 Financial investments at fair value through profit or loss (continued)
.Financial investments at fair value through profit or loss include the following: Group and Company 2013 2012 Unlisted equities – at fair value - Equity securities in Zambia 399,223 338,478
Listed securities – at fair value -Equity securities – Investrust 7,368 8,892
406,591 347,370
2013 2012
Mopani Copper Mines Plc 233,263 181,865 Chibuluma Mines Plc 12,459 27,873 NFC Africa Mines Plc 140,321 128,740 Chambishi Metals Plc 13,180 - Investrust Bank 7,368 8,892 406,591 347,370
During the year the Group changed its valuation method for its investments in unlisted entities from fair value using the Net Asset Value Method to Relative Valuation or Market Approach (“RV”) Methodology. The RV valuation Methodology is based upon how similar companies are currently priced by the market. The RV valuation method establishes the value of a business in comparison to pricing multiples from transactions involving similar businesses or valuation multiples from comparable businesses that are listed on stock exchanges. The relative valuations method was used for the equity investments with the exception of the Group’s holding in the shares of Investrust Bank which are listed.
The investments were valued in 2013, by Imara Corporate Finance, an independent valuer. The carrying values of the investments were adjusted to their revalued amounts and the resultant fair value gain of K 59 million was credited to profit or loss.
23 Inventories Group
2013 2012
Finished goods 18,751 14,431
24 Trade and other receivables Group Company
2013 2012 2013 2012
Trade receivables 22,569 27,664 - - Dividend receivable 94,964 29,378 94,964 29,378 Other receivables * 338,546 476,943 267,126 390,027 Amounts due from related parties
(note 34(iv))
639,895
266,713
922,093
404,074 Price participation receivables(see
note below)
552,701
495,421
552,701
495,421 1,648,675 1,296,119 1,836,884 1,318,900 Less: allowance for impairment (227,095) (349,582) (226,111) (348,992) 1,421,580 946,537 1,610,773 969,908
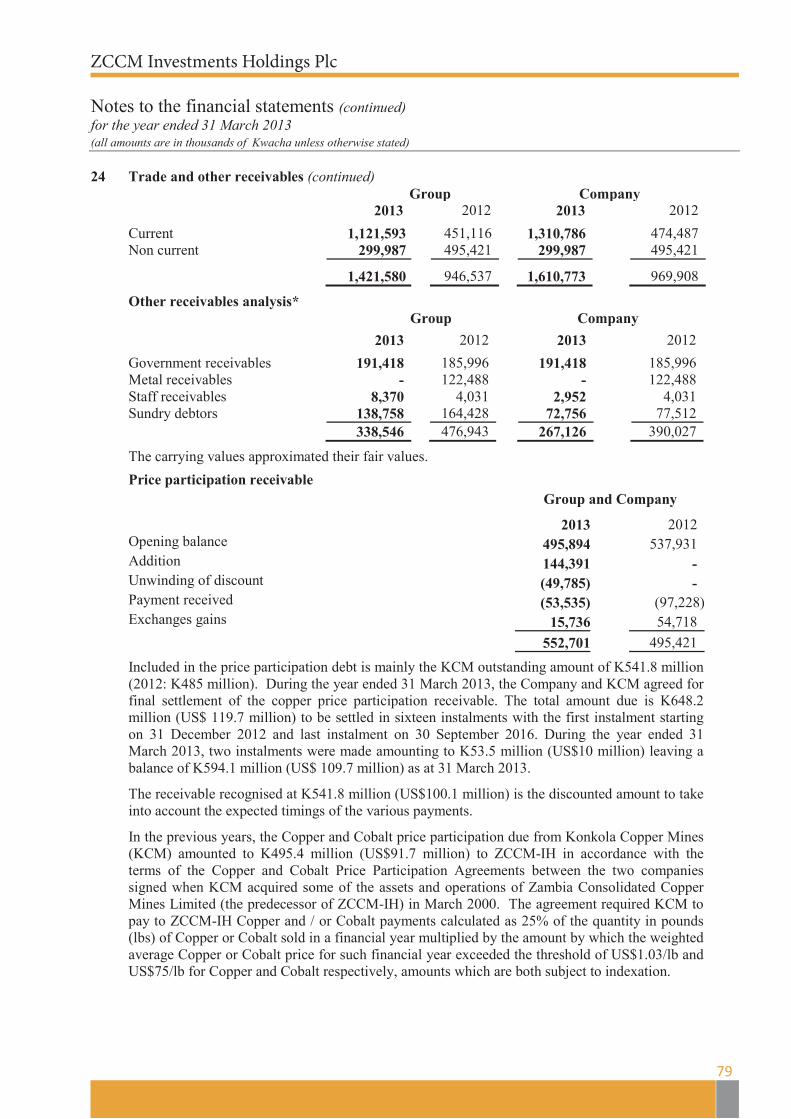
ZCCM Investments Holdings PlcZCCM Investments Holdings Plc
Notes to the financial statements (continued) for the year ended 31 March 2013 (all amounts are in thousands of Kwacha unless otherwise stated)
79
24 Trade and other receivables (continued)
Group Company 2013 2012 2013 2012
Current 1,121,593 451,116 1,310,786 474,487 Non current 299,987 495,421 299,987 495,421
1,421,580 946,537 1,610,773 969,908
Other receivables analysis* Group Company
2013 2012 2013 2012
Government receivables 191,418 185,996 191,418 185,996 Metal receivables - 122,488 - 122,488 Staff receivables 8,370 4,031 2,952 4,031 Sundry debtors 138,758 164,428 72,756 77,512 338,546 476,943 267,126 390,027
The carrying values approximated their fair values.
Price participation receivable Group and Company
2013 2012 Opening balance 495,894 537,931 \ Addition 144,391 - Unwinding of discount (49,785) - Payment received (53,535) (97,228) Exchanges gains 15,736 54,718 552,701 495,421
Included in the price participation debt is mainly the KCM outstanding amount of K541.8 million (2012: K485 million). During the year ended 31 March 2013, the Company and KCM agreed for final settlement of the copper price participation receivable. The total amount due is K648.2 million (US$ 119.7 million) to be settled in sixteen instalments with the first instalment starting on 31 December 2012 and last instalment on 30 September 2016. During the year ended 31 March 2013, two instalments were made amounting to K53.5 million (US$10 million) leaving a balance of K594.1 million (US$ 109.7 million) as at 31 March 2013.
The receivable recognised at K541.8 million (US$100.1 million) is the discounted amount to take into account the expected timings of the various payments.
In the previous years, the Copper and Cobalt price participation due from Konkola Copper Mines (KCM) amounted to K495.4 million (US$91.7 million) to ZCCM-IH in accordance with the terms of the Copper and Cobalt Price Participation Agreements between the two companies signed when KCM acquired some of the assets and operations of Zambia Consolidated Copper Mines Limited (the predecessor of ZCCM-IH) in March 2000. The agreement required KCM to pay to ZCCM-IH Copper and / or Cobalt payments calculated as 25% of the quantity in pounds (lbs) of Copper or Cobalt sold in a financial year multiplied by the amount by which the weighted average Copper or Cobalt price for such financial year exceeded the threshold of US$1.03/lb and US$75/lb for Copper and Cobalt respectively, amounts which are both subject to indexation.
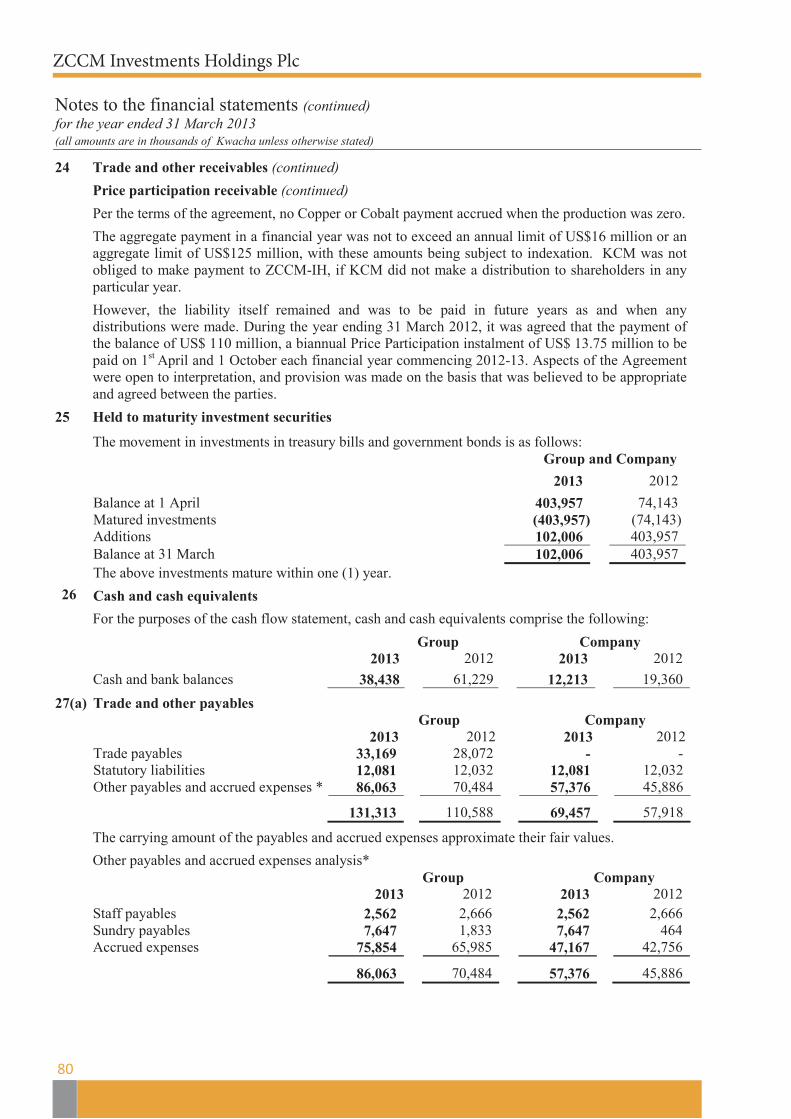
ZCCM Investments Holdings PlcZCCM Investments Holdings Plc
Notes to the financial statements (continued) for the year ended 31 March 2013 (all amounts are in thousands of Kwacha unless otherwise stated)
80
24 Trade and other receivables (continued)
Price participation receivable (continued)
Per the terms of the agreement, no Copper or Cobalt payment accrued when the production was zero.
The aggregate payment in a financial year was not to exceed an annual limit of US$16 million or an aggregate limit of US$125 million, with these amounts being subject to indexation. KCM was not obliged to make payment to ZCCM-IH, if KCM did not make a distribution to shareholders in any particular year.
However, the liability itself remained and was to be paid in future years as and when any distributions were made. During the year ending 31 March 2012, it was agreed that the payment of the balance of US$ 110 million, a biannual Price Participation instalment of US$ 13.75 million to be paid on 1st April and 1 October each financial year commencing 2012-13. Aspects of the Agreement were open to interpretation, and provision was made on the basis that was believed to be appropriate and agreed between the parties.
25 Held to maturity investment securities
The movement in investments in treasury bills and government bonds is as follows: Group and Company
2013 2012
Balance at 1 April 403,957 74,143 Matured investments (403,957) (74,143) Additions 102,006 403,957 Balance at 31 March 102,006 403,957
26 The above investments mature within one (1) year.
Cash and cash equivalents
For the purposes of the cash flow statement, cash and cash equivalents comprise the following:
Group Company 2013 2012 2013 2012 Cash and bank balances 38,438 61,229 12,213 19,360
27(a) Trade and other payables
Group
Company
2013 2012 2013 2012 Trade payables 33,169 28,072 - - Statutory liabilities 12,081 12,032 12,081 12,032 Other payables and accrued expenses * 86,063 70,484 57,376 45,886
131,313 110,588 69,457 57,918
The carrying amount of the payables and accrued expenses approximate their fair values.
Other payables and accrued expenses analysis* Group Company 2013 2012 2013 2012 Staff payables 2,562 2,666 2,562 2,666 Sundry payables 7,647 1,833 7,647 464 Accrued expenses 75,854 65,985 47,167 42,756
86,063 70,484 57,376 45,886
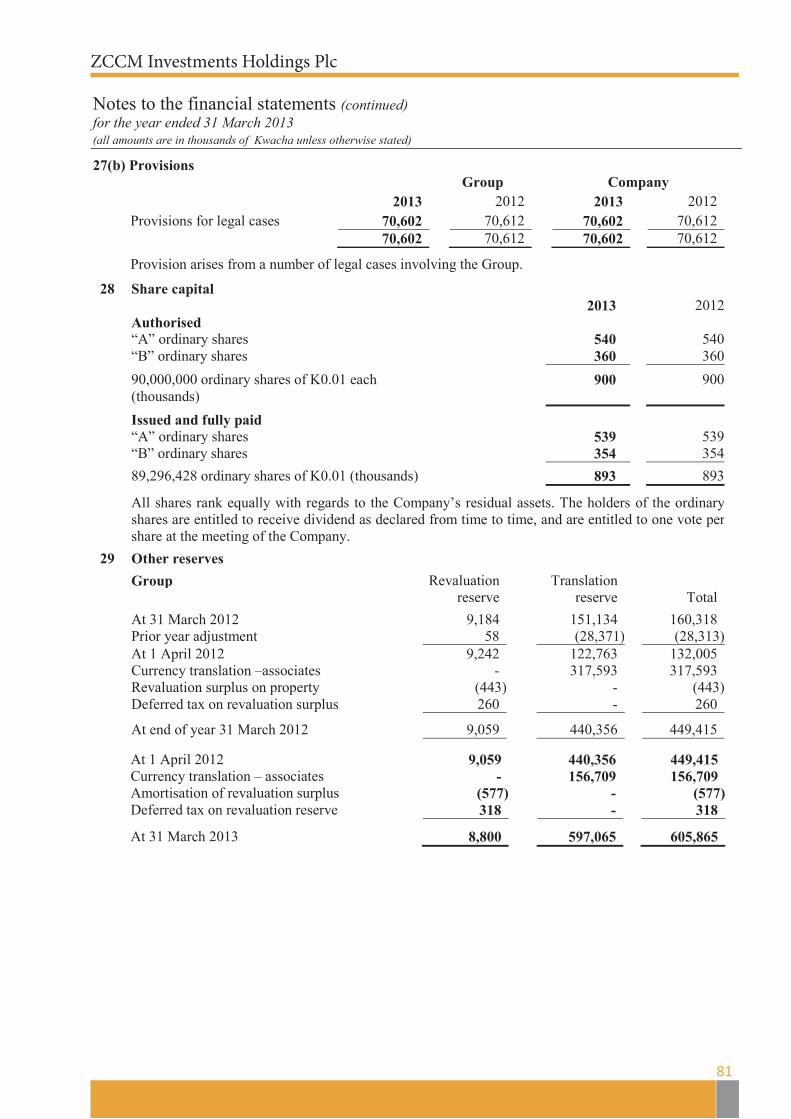
ZCCM Investments Holdings PlcZCCM Investments Holdings Plc
Notes to the financial statements (continued) for the year ended 31 March 2013 (all amounts are in thousands of Kwacha unless otherwise stated)
81
27(b) Provisions
Group Company 2013 2012 2013 2012 Provisions for legal cases 70,602 70,612 70,602 70,612 70,602 70,612 70,602 70,612
Provision arises from a number of legal cases involving the Group.
28 Share capital 2013 2012 Authorised “A” ordinary shares 540 540 “B” ordinary shares 360 360
90,000,000 ordinary shares of K0.01 each (thousands)
900 900
Issued and fully paid “A” ordinary shares 539 539 “B” ordinary shares 354 354
89,296,428 ordinary shares of K0.01 (thousands) 893 893
All shares rank equally with regards to the Company’s residual assets. The holders of the ordinary shares are entitled to receive dividend as declared from time to time, and are entitled to one vote per share at the meeting of the Company.
29 Other reserves Group Revaluation
Translation
reserve reserve Total
At 31 March 2012 9,184 151,134 160,318 Prior year adjustment 58 (28,371) (28,313) At 1 April 2012 9,242 122,763 132,005 Currency translation –associates - 317,593 317,593 Revaluation surplus on property (443) - (443) Deferred tax on revaluation surplus 260 - 260
At end of year 31 March 2012 9,059 440,356 449,415 At 1 April 2012 9,059 440,356 449,415 Currency translation – associates - 156,709 156,709 Amortisation of revaluation surplus (577) - (577) Deferred tax on revaluation reserve 318 - 318
At 31 March 2013 8,800 597,065 605,865
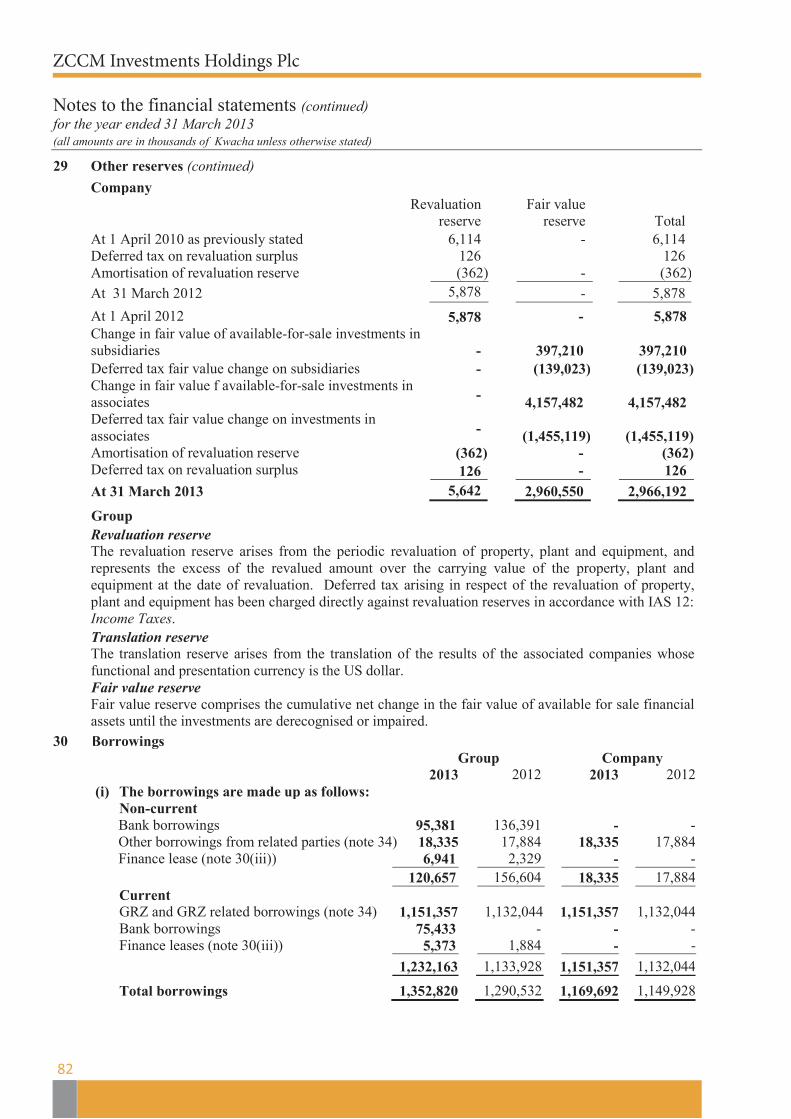
ZCCM Investments Holdings PlcZCCM Investments Holdings Plc
Notes to the financial statements (continued) for the year ended 31 March 2013 (all amounts are in thousands of Kwacha unless otherwise stated)
82
29 Other reserves (continued)
Company Revaluation
reserve Fair value reserve
Total At 1 April 2010 as previously stated 6,114 - 6,114 Deferred tax on revaluation surplus 126 126 Amortisation of revaluation reserve (362) - (362) At 31 March 2012 5,878 - 5,878
At 1 April 2012 5,878 - 5,878 Change in fair value of available-for-sale investments in
subsidiaries
- 397,210 397,210 Deferred tax fair value change on subsidiaries - (139,023) (139,023) Change in fair value f available-for-sale investments in
associates - 4,157,482 4,157,482 Deferred tax fair value change on investments in
associates - (1,455,119) (1,455,119) Amortisation of revaluation reserve (362) - (362) Deferred tax on revaluation surplus 126 - 126 At 31 March 2013 5,642 2,960,550 2,966,192
Group
Revaluation reserve The revaluation reserve arises from the periodic revaluation of property, plant and equipment, and represents the excess of the revalued amount over the carrying value of the property, plant and equipment at the date of revaluation. Deferred tax arising in respect of the revaluation of property, plant and equipment has been charged directly against revaluation reserves in accordance with IAS 12: Income Taxes.
Translation reserve The translation reserve arises from the translation of the results of the associated companies whose functional and presentation currency is the US dollar. Fair value reserve Fair value reserve comprises the cumulative net change in the fair value of available for sale financial assets until the investments are derecognised or impaired.
30 Borrowings Group Company 2013 2012 2013 2012 (i) The borrowings are made up as follows: Non-current Bank borrowings 95,381 136,391 - - Other borrowings from related parties (note 34) 18,335 17,884 18,335 17,884 Finance lease (note 30(iii)) 6,941 2,329 - - 120,657 156,604 18,335 17,884 Current
GRZ and GRZ related borrowings (note 34) 1,151,357 1,132,044 1,151,357 1,132,044 Bank borrowings 75,433 - - - Finance leases (note 30(iii)) 5,373 1,884 - -
1,232,163 1,133,928 1,151,357 1,132,044
Total borrowings 1,352,820 1,290,532 1,169,692 1,149,928
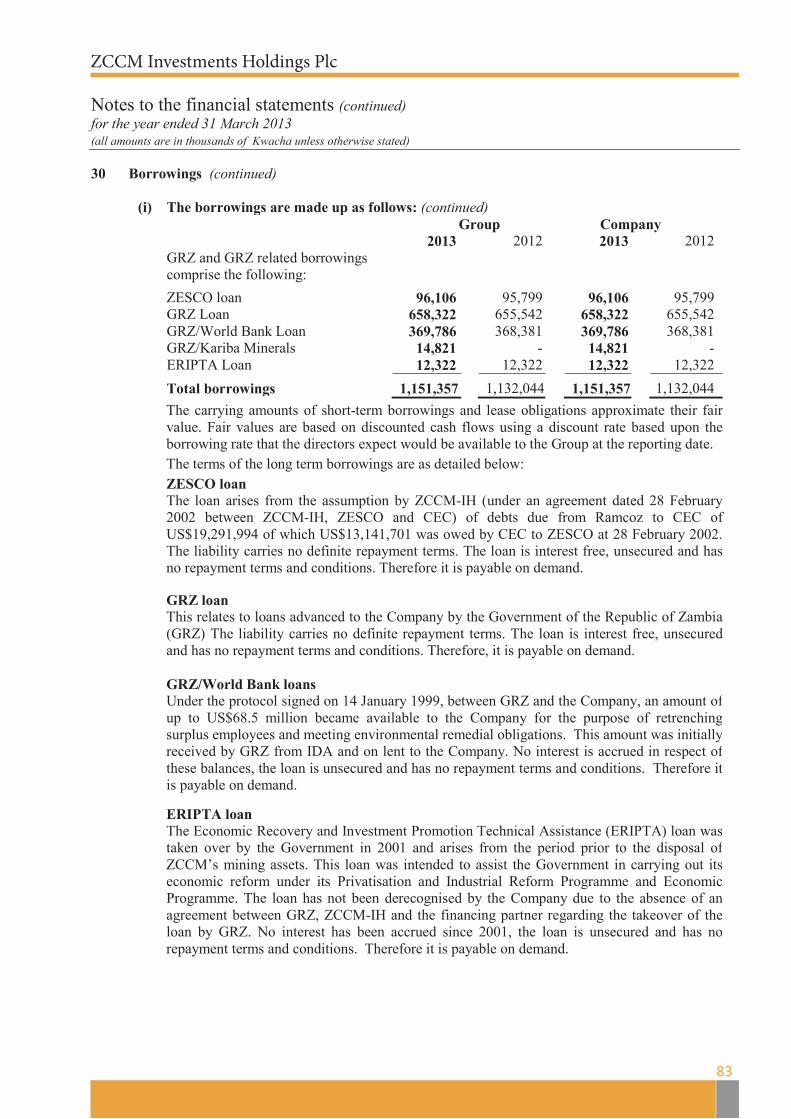
ZCCM Investments Holdings PlcZCCM Investments Holdings Plc
Notes to the financial statements (continued) for the year ended 31 March 2013 (all amounts are in thousands of Kwacha unless otherwise stated)
83
30 Borrowings (continued) (i) The borrowings are made up as follows: (continued)
Group Company 2013 2012 2013 2012
GRZ and GRZ related borrowings comprise the following:
ZESCO loan 96,106 95,799 96,106 95,799 GRZ Loan 658,322 655,542 658,322 655,542 GRZ/World Bank Loan 369,786 368,381 369,786 368,381 GRZ/Kariba Minerals 14,821 - 14,821 - ERIPTA Loan 12,322 12,322 12,322 12,322
Total borrowings 1,151,357 1,132,044 1,151,357 1,132,044
The carrying amounts of short-term borrowings and lease obligations approximate their fair value. Fair values are based on discounted cash flows using a discount rate based upon the borrowing rate that the directors expect would be available to the Group at the reporting date.
The terms of the long term borrowings are as detailed below:
ZESCO loan The loan arises from the assumption by ZCCM-IH (under an agreement dated 28 February 2002 between ZCCM-IH, ZESCO and CEC) of debts due from Ramcoz to CEC of US$19,291,994 of which US$13,141,701 was owed by CEC to ZESCO at 28 February 2002. The liability carries no definite repayment terms. The loan is interest free, unsecured and has no repayment terms and conditions. Therefore it is payable on demand.
GRZ loan This relates to loans advanced to the Company by the Government of the Republic of Zambia (GRZ) The liability carries no definite repayment terms. The loan is interest free, unsecured and has no repayment terms and conditions. Therefore, it is payable on demand.
GRZ/World Bank loans Under the protocol signed on 14 January 1999, between GRZ and the Company, an amount of up to US$68.5 million became available to the Company for the purpose of retrenching surplus employees and meeting environmental remedial obligations. This amount was initially received by GRZ from IDA and on lent to the Company. No interest is accrued in respect of these balances, the loan is unsecured and has no repayment terms and conditions. Therefore it is payable on demand.
ERIPTA loan The Economic Recovery and Investment Promotion Technical Assistance (ERIPTA) loan was taken over by the Government in 2001 and arises from the period prior to the disposal of ZCCM’s mining assets. This loan was intended to assist the Government in carrying out its economic reform under its Privatisation and Industrial Reform Programme and Economic Programme. The loan has not been derecognised by the Company due to the absence of an agreement between GRZ, ZCCM-IH and the financing partner regarding the takeover of the loan by GRZ. No interest has been accrued since 2001, the loan is unsecured and has no repayment terms and conditions. Therefore it is payable on demand.

ZCCM Investments Holdings PlcZCCM Investments Holdings Plc
Notes to the financial statements (continued) for the year ended 31 March 2013 (all amounts are in thousands of Kwacha unless otherwise stated)
84
30 Borrowings (continued)
Bank borrowings A bridging finance amounting to US$ 25 million (approximately K136 million) was secured on a short term basis and will be refinanced by the facility still under discussion with Standard Bank of South Africa. The loan attracts interest of 4.75% per annum. It is repayable in 60 months commencing 30 June 2013 and has charges over receivables from mine customers plus a fixed and floating charge over the Ndola Lime Company Limited’s assets.
Other borrowings In May 2005, the Board of Directors of Chambishi Metals Plc resolved to undertake a rights issue of 25,000,000 new shares at par value of US$1 per share. ZCCM-IH was offered 2,500,000 ordinary shares at a par value of US$1 representing 10% of the shareholding of the new shares to be issued. The ZCCM-IH subscription was converted into a deferred loan for 10 years to be serviced by dividend payments when due from Chambishi Metals Plc and Luanshya Copper Mines Plc. The loan carries interest at LIBOR + 3%.
Group Company 2013 2012 2013 2012
(ii) Subordinated loan 865,445 865,445 865,445 865,445
Since 1983 amounts due to certain of the Company’s lenders became payable to GRZ following arrangements between GRZ and the Governments of the countries in which those lenders are situated. These amounts described as the Paris Club loans were reported in the financial statements of ZCCM Limited up to 31 March 1998 as long term borrowings and as deferred liabilities. In February 1999, the Company and GRZ entered into an agreement whereby the Paris Club loans totalling US $ 311.3 million were consolidated into one loan denominated in Kwacha due to GRZ. Previously the loans were denominated in US Dollars, French Francs and Pounds Sterling. The agreement with GRZ provided for the subordination of the new loan to all other creditors of the Company.
Accordingly, at 31 March 2013 an amount of K865.4 million (31 March 2012: K865.4 million) was separately reported as a subordinated loan. This loan is interest free and payable on demand (see note 37 for subsequent events).
(iii) Finance leases
Finance lease liabilities – minimum lease repayments: Group 2013 2012
Not later than 1 year 6,046 2,203 Later than 1 year and not later than 5 years 7,588 2,526 13,634 4,729 Future finance charges (1,320) (516)
12,314 4,213
Finance leases
The present value of finance lease liabilities may be analysed as: Group 2013 2012
Not later than 1 year 5,373 1,884 Later than 1 year and not later than 5 years 6,941 2,329
12,314 4,213
There was no contingent rent payable, evaluation changes and restrictions imposed by the lease arrangements.

ZCC
M In
vest
men
ts H
oldi
ngs P
lcZC
CM
Inve
stm
ents
Hol
ding
s Plc
N
otes
to th
e fin
anci
al st
atem
ents
(con
tinue
d)
for t
he y
ear e
nded
31
Mar
ch 2
013
(all
amou
nts a
re in
thou
sand
s of
Kw
acha
unl
ess o
ther
wis
e st
ated
)
85
31
Def
erre
d ta
x G
roup
D
efer
red
tax
was
cal
cula
ted
usin
g th
e en
acte
d in
com
e ta
x ra
te o
f 35%
(201
2: 3
5%).
A
sset
s
Lia
bilit
ies
N
et
Rec
ogni
sed
defe
rred
tax
asse
ts a
nd li
abili
ties
20
13
20
12
2013
2012
2013
201
2
Prop
erty
pla
nt a
nd e
quip
men
t
28,6
80
-
-
25,9
32
28,6
80
25,9
32
Unr
ealis
ed e
xcha
nge
gain
s
5,31
1
-
-
19,9
71
5,
311
19
,971
Pr
ovis
ions
for g
ratu
ity a
nd le
ave
pay
-
(878
)
(861
)
-
(861
)
(878
) O
ther
pro
visi
ons
-
(5
9,89
4)
(65,
921)
-
(6
5,92
1)
(59,
894)
Em
ploy
ee p
rovi
sion
-
(1,7
21)
(2
,256
)
-
(2,2
56)
(1
,721
) C
hang
e on
fina
ncia
l ass
ets a
t fai
r val
ue th
roug
h pr
ofit
or lo
ss
14
3,04
1
-
-
122,
314
14
3,04
1
122,
314
Envi
ronm
enta
l pro
visi
on
-
(1
5,71
1)
(15,
711)
-
(1
5,71
1)
(15,
711)
U
nrea
lised
exc
hang
e lo
sses
-
(5,8
35)
(2
,723
)
-
(2,7
23)
(5
,835
) Ta
x lo
sses
-
(19,
721)
(1
30,9
37)
-
(1
30,9
37)
(1
9,72
1)
177,
032
(1
03,7
60)
(2
18,4
09)
16
8,21
7
(4
1,37
7)
64,4
57
Mov
emen
t in
tem
pora
ry d
iffer
ence
s du
ring
the
year
Bal
ance
at 3
1
Rec
ogni
sed
in p
rofit
or
Rec
ogni
sed
B
alan
ce a
t 31
Rec
ogni
sed
in p
rofit
R
ecog
nise
d
B
alan
ce a
t
Mar
201
1
loss
in
equ
ity
M
ar 2
012
or
loss
in e
quity
31
Mar
201
3
Prop
erty
pla
nt a
nd e
quip
men
t 20
,071
5,
601
26
0
25,9
32
3,
066
(3
18)
28
,680
U
nrea
lised
exc
hang
e ga
ins
- 19
,971
-
19,9
71
(1
4,66
0)
-
5,
311
Prov
isio
ns fo
r gra
tuity
and
leav
e pa
y
(865
) (1
3)
-
(878
)
17
-
(8
61)
Oth
er p
rovi
sion
s (4
4,92
0)
(14,
974)
-
(5
9,89
4)
(6,0
27)
-
(6
5,92
1)
Empl
oyee
pro
visi
on
(1,6
35)
226
(312
)
(1,7
21)
(3
48)
(1
87)
(2
,256
) C
hang
e on
fina
ncia
l ass
ets a
t fai
r val
ue th
roug
h pr
ofit
or lo
ss
30
9,50
9
(187
,195
)
-
12
2,31
4
20,7
27
-
14
3,04
1 En
viro
nmen
tal p
rovi
sion
(1
5,71
1)
-
-
(15,
711)
-
-
(15,
711)
U
nrea
lised
exc
hang
e lo
sses
(1
3,39
3)
7,5
58
-
(5
,835
)
3,11
2
-
(2,7
23)
Tax
loss
es
- (1
9,72
1)
-
(19,
721)
(1
11,2
16)
-
(1
30,9
37)
25
3,05
6 (1
88,5
47)
(5
2)
64,4
57
(1
05,3
29)
(5
05)
(4
1,37
7)
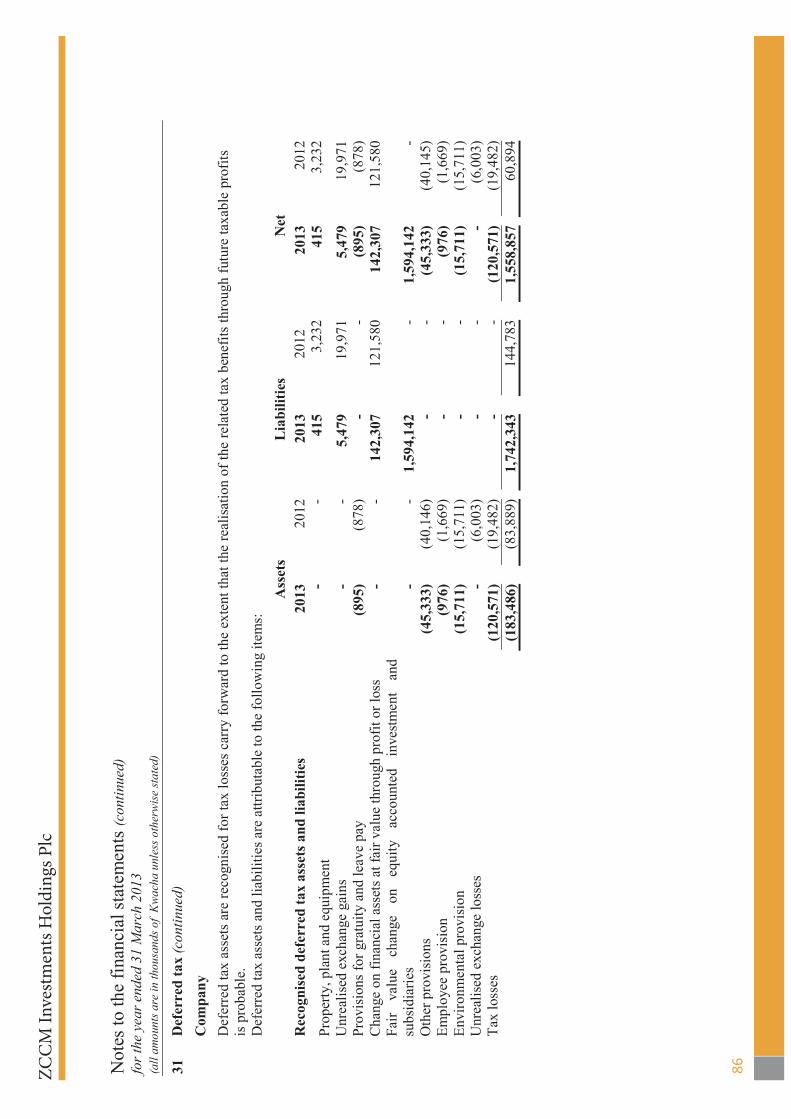
ZCC
M In
vest
men
ts H
oldi
ngs P
lc
ZCC
M In
vest
men
ts H
oldi
ngs P
lc
Not
es to
the
finan
cial
stat
emen
ts (c
ontin
ued)
fo
r the
yea
r end
ed 3
1 M
arch
201
3 (a
ll am
ount
s are
in th
ousa
nds o
f K
wac
ha u
nles
s oth
erw
ise
stat
ed)
86
31
Def
erre
d ta
x (c
ontin
ued)
C
ompa
ny
Def
erre
d ta
x as
sets
are
reco
gnis
ed fo
r tax
loss
es c
arry
forw
ard
to th
e ex
tent
that
the
real
isat
ion
of th
e re
late
d ta
x be
nefit
s thr
ough
futu
re ta
xabl
e pr
ofits
is
pro
babl
e.
Def
erre
d ta
x as
sets
and
liab
ilitie
s are
attr
ibut
able
to th
e fo
llow
ing
item
s:
Ass
ets
L
iabi
litie
s
Net
R
ecog
nise
d de
ferr
ed ta
x as
sets
and
liab
ilitie
s 20
13
20
12
2013
2012
2013
20
12
Pr
oper
ty, p
lant
and
equ
ipm
ent
-
- 41
5
3,23
2
415
3,23
2
U
nrea
lised
exc
hang
e ga
ins
-
- 5,
479
19
,971
5,
479
19,9
71
Pr
ovis
ions
for g
ratu
ity a
nd le
ave
pay
(895
)
(878
) -
-
(8
95)
(878
)
Cha
nge
on fi
nanc
ial a
sset
s at f
air v
alue
thro
ugh
prof
it or
loss
-
-
142,
307
12
1,58
0
142,
307
121,
580
Fa
ir va
lue
chan
ge
on
equi
ty
acco
unte
d in
vestm
ent
and
subs
idia
ries
-
-
1,59
4,14
2
-
1,
594,
142
-
Oth
er p
rovi
sion
s (4
5,33
3)
(40,
146)
-
-
(4
5,33
3)
(40,
145)
Empl
oyee
pro
visi
on
(976
)
(1,6
69)
-
-
(976
) (1
,669
)
Envi
ronm
enta
l pro
visi
on
(15,
711)
(1
5,71
1)
-
-
(15,
711)
(1
5,71
1)
U
nrea
lised
exc
hang
e lo
sses
-
(6
,003
) -
-
-
(6
,003
)
Tax
loss
es
(120
,571
)
(19,
482)
-
-
(1
20,5
71)
(1
9,48
2)
(183
,486
)
(83,
889)
1,
742,
343
14
4,78
3
1,55
8,85
7
60,8
94
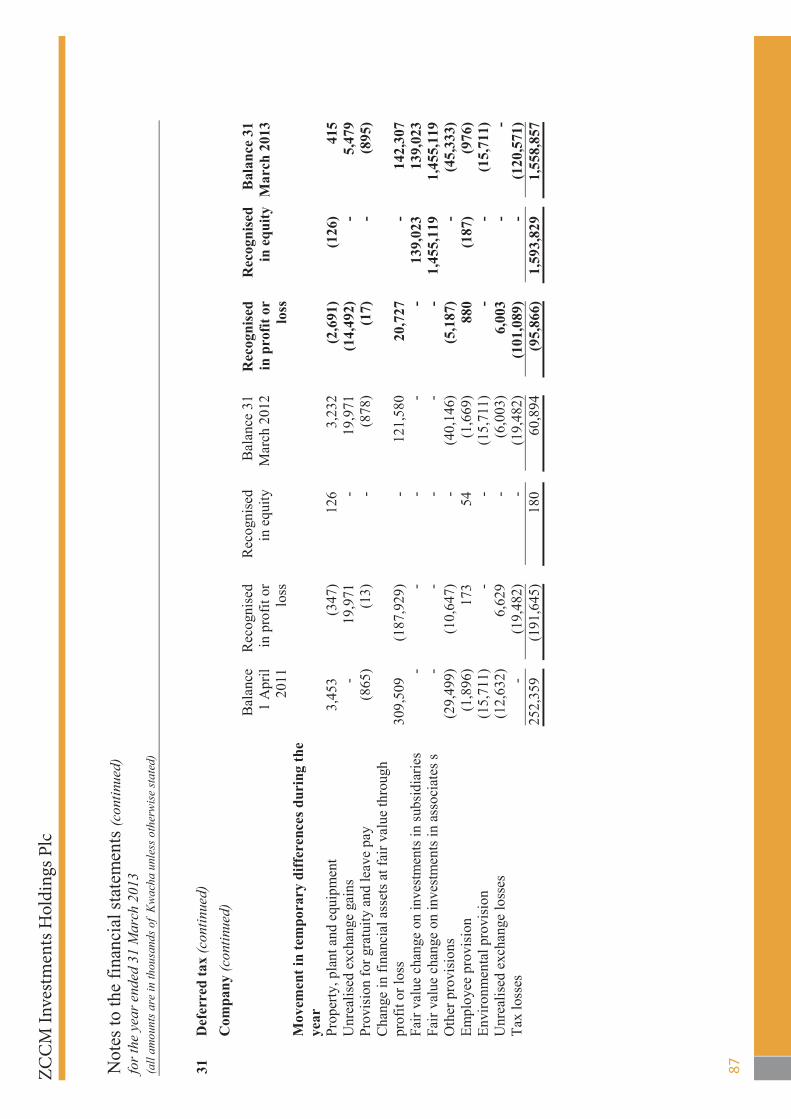
ZCC
M In
vest
men
ts H
oldi
ngs P
lcZC
CM
Inve
stm
ents
Hol
ding
s Plc
N
otes
to th
e fin
anci
al st
atem
ents
(con
tinue
d)
for t
he y
ear e
nded
31
Mar
ch 2
013
(all
amou
nts a
re in
thou
sand
s of
Kw
acha
unl
ess o
ther
wis
e st
ated
)
87
31
D
efer
red
tax
(con
tinue
d)
Com
pany
(con
tinue
d)
Bal
ance
1
Apr
il 20
11
Rec
ogni
sed
in p
rofit
or
loss
Rec
ogni
sed
in e
quity
B
alan
ce 3
1 M
arch
201
2
Rec
ogni
sed
in p
rofit
or
loss
Rec
ogni
sed
in e
quity
B
alan
ce 3
1 M
arch
201
3
M
ovem
ent i
n te
mpo
rary
diff
eren
ces d
urin
g th
e ye
ar
Pr
oper
ty, p
lant
and
equ
ipm
ent
3,45
3
(347
)
126
3,
232
(2
,691
)
(126
)
415
U
nrea
lised
exc
hang
e ga
ins
-
19,9
71
-
19,9
71
(14,
492)
-
5,
479
Pr
ovis
ion
for g
ratu
ity a
nd le
ave
pay
(865
) (1
3)
-
(878
)
(17)
-
(8
95)
C
hang
e in
fina
ncia
l ass
ets a
t fai
r val
ue th
roug
h pr
ofit
or lo
ss
30
9,50
9
(187
,929
)
-
121
,580
20,7
27
-
14
2,30
7
Fair
valu
e ch
ange
on
inve
stm
ents
in su
bsid
iarie
s -
-
-
-
-
139,
023
13
9,02
3
Fair
valu
e ch
ange
on
inve
stm
ents
in a
ssoc
iate
s s
- -
-
-
-
1,
455,
119
1,
455,
119
O
ther
pro
visi
ons
(29,
499)
(1
0,64
7)
-
(40,
146)
(5
,187
)
-
(45,
333)
Empl
oyee
pro
visi
on
(1,8
96)
173
54
(1,6
69)
88
0
(187
)
(976
)
Envi
ronm
enta
l pro
visi
on
(15,
711)
-
-
(
15,7
11)
-
-
(1
5,71
1)
U
nrea
lised
exc
hang
e lo
sses
(1
2,63
2)
6,62
9
-
(6,0
03)
6,
003
-
-
Ta
x lo
sses
-
(1
9,48
2)
-
(1
9,48
2)
(1
01,0
89)
-
(1
20,5
71)
252,
359
(1
91,6
45)
18
0
60,8
94
(9
5,86
6)
1,5
93,8
29
1,
558,
857
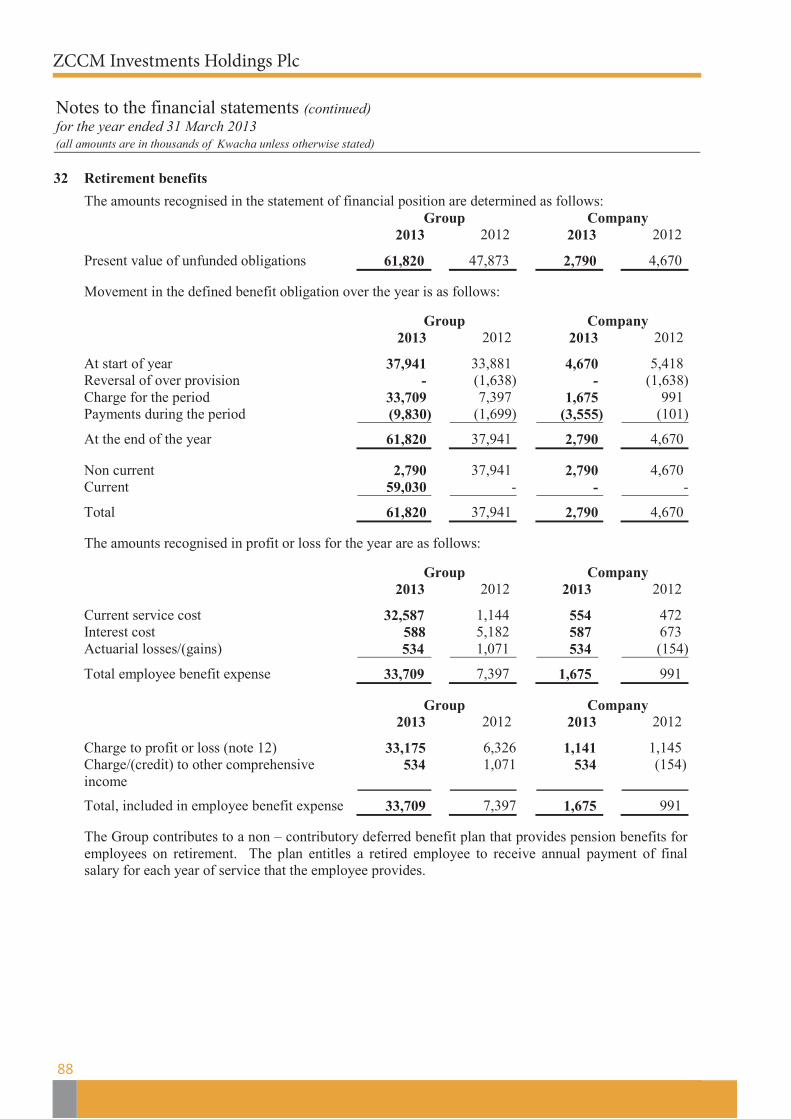
ZCCM Investments Holdings PlcZCCM Investments Holdings Plc
Notes to the financial statements (continued) for the year ended 31 March 2013 (all amounts are in thousands of Kwacha unless otherwise stated)
88
32
Retirement benefits
The amounts recognised in the statement of financial position are determined as follows: Group Company 2013 2012 2013 2012
Present value of unfunded obligations 61,820 47,873 2,790 4,670 Movement in the defined benefit obligation over the year is as follows:
Group Company 2013 2012 2013 2012
At start of year 37,941 33,881 4,670 5,418 Reversal of over provision - (1,638) - (1,638) Charge for the period 33,709 7,397 1,675 991 Payments during the period (9,830) (1,699) (3,555) (101)
At the end of the year 61,820 37,941 2,790 4,670 Non current 2,790 37,941 2,790 4,670 Current 59,030 - - -
Total 61,820 37,941 2,790 4,670 The amounts recognised in profit or loss for the year are as follows:
Group Company 2013 2012 2013 2012
Current service cost 32,587 1,144 554 472 Interest cost 588 5,182 587 673 Actuarial losses/(gains) 534 1,071 534 (154)
Total employee benefit expense 33,709 7,397 1,675 991
Group Company 2013 2012 2013 2012
Charge to profit or loss (note 12) 33,175 6,326 1,141 1,145 Charge/(credit) to other comprehensive income
534 1,071 534 (154)
Total, included in employee benefit expense 33,709 7,397 1,675 991 The Group contributes to a non – contributory deferred benefit plan that provides pension benefits for employees on retirement. The plan entitles a retired employee to receive annual payment of final salary for each year of service that the employee provides.
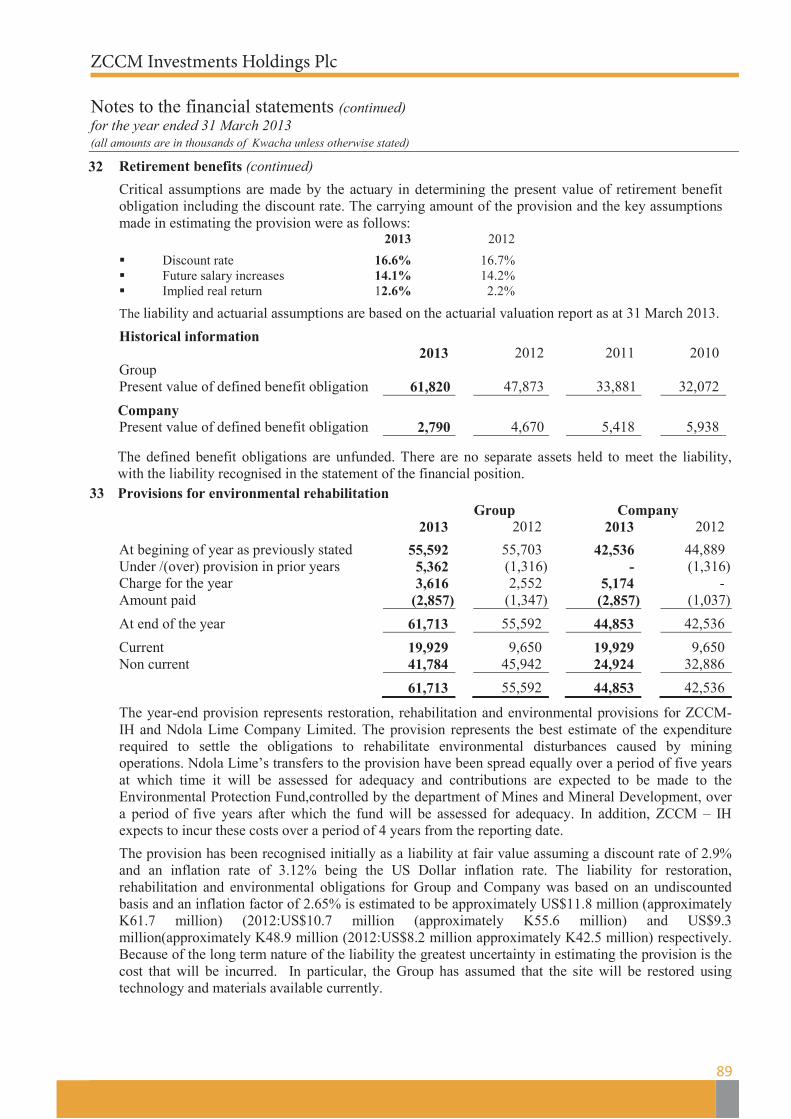
ZCCM Investments Holdings PlcZCCM Investments Holdings Plc
Notes to the financial statements (continued) for the year ended 31 March 2013 (all amounts are in thousands of Kwacha unless otherwise stated)
89
32 Retirement benefits (continued)
Critical assumptions are made by the actuary in determining the present value of retirement benefit obligation including the discount rate. The carrying amount of the provision and the key assumptions made in estimating the provision were as follows: 2013 2012
Discount rate 16.6% 16.7% Future salary increases 14.1% 14.2% Implied real return 12.6% 2.2%
The liability and actuarial assumptions are based on the actuarial valuation report as at 31 March 2013.
Historical information
Group 2013 2012 2011 2010
Present value of defined benefit obligation 61,820 47,873 33,881 32,072
Company
Present value of defined benefit obligation 2,790 4,670 5,418 5,938 The defined benefit obligations are unfunded. There are no separate assets held to meet the liability,
with the liability recognised in the statement of the financial position.
33 Provisions for environmental rehabilitation Group Company
2013 2012 2013 2012
At begining of year as previously stated 55,592 55,703 42,536 44,889 Under /(over) provision in prior years 5,362 (1,316) - (1,316) Charge for the year 3,616 2,552 5,174 - Amount paid (2,857) (1,347) (2,857) (1,037)
At end of the year 61,713 55,592 44,853 42,536
Current 19,929 9,650 19,929 9,650 Non current 41,784 45,942 24,924 32,886
61,713 55,592 44,853 42,536
The year-end provision represents restoration, rehabilitation and environmental provisions for ZCCM-IH and Ndola Lime Company Limited. The provision represents the best estimate of the expenditure required to settle the obligations to rehabilitate environmental disturbances caused by mining operations. Ndola Lime’s transfers to the provision have been spread equally over a period of five years at which time it will be assessed for adequacy and contributions are expected to be made to the Environmental Protection Fund,controlled by the department of Mines and Mineral Development, over a period of five years after which the fund will be assessed for adequacy. In addition, ZCCM – IH expects to incur these costs over a period of 4 years from the reporting date.
The provision has been recognised initially as a liability at fair value assuming a discount rate of 2.9% and an inflation rate of 3.12% being the US Dollar inflation rate. The liability for restoration, rehabilitation and environmental obligations for Group and Company was based on an undiscounted basis and an inflation factor of 2.65% is estimated to be approximately US$11.8 million (approximately K61.7 million) (2012:US$10.7 million (approximately K55.6 million) and US$9.3 million(approximately K48.9 million (2012:US$8.2 million approximately K42.5 million) respectively. Because of the long term nature of the liability the greatest uncertainty in estimating the provision is the cost that will be incurred. In particular, the Group has assumed that the site will be restored using technology and materials available currently.
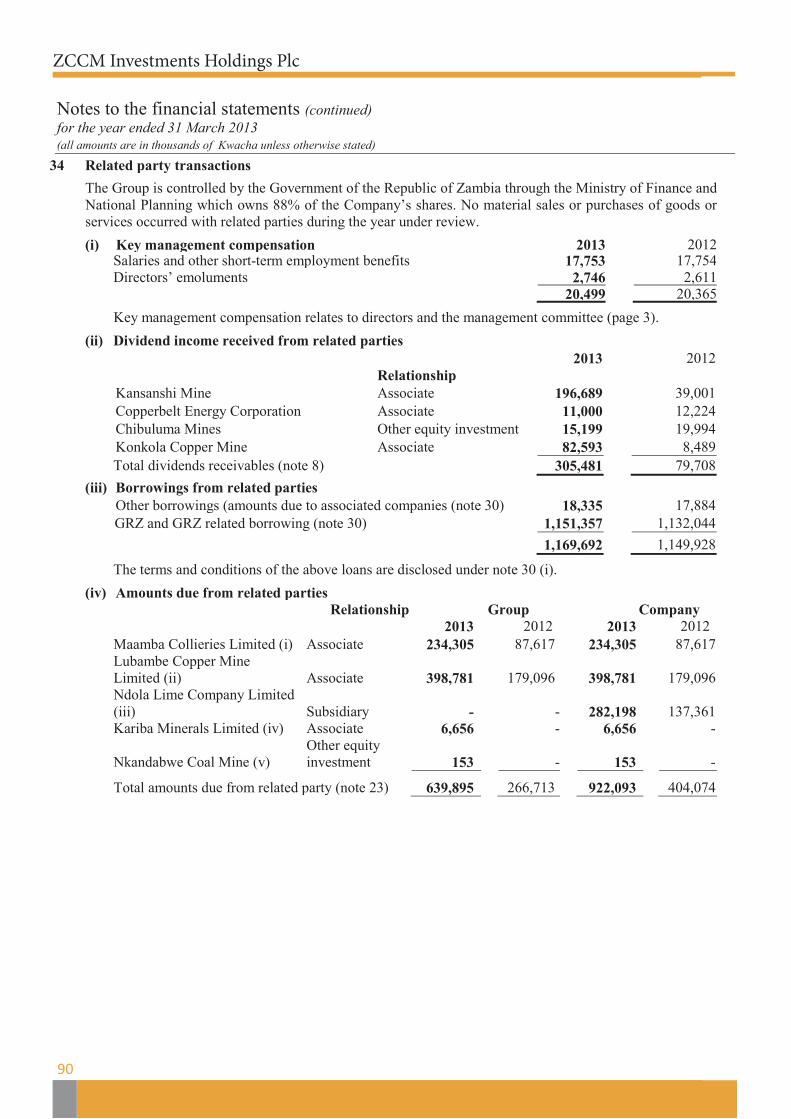
ZCCM Investments Holdings PlcZCCM Investments Holdings Plc
Notes to the financial statements (continued) for the year ended 31 March 2013 (all amounts are in thousands of Kwacha unless otherwise stated)
90
34 Related party transactions
The Group is controlled by the Government of the Republic of Zambia through the Ministry of Finance and National Planning which owns 88% of the Company’s shares. No material sales or purchases of goods or services occurred with related parties during the year under review.
(i) Key management compensation 2013 2012 Salaries and other short-term employment benefits 17,753 17,754 Directors’ emoluments 2,746 2,611
20,499 20,365
Key management compensation relates to directors and the management committee (page 3).
(ii) Dividend income received from related parties
Relationship 2013
2012
Kansanshi Mine Associate 196,689 39,001 Copperbelt Energy Corporation Associate 11,000 12,224 Chibuluma Mines Other equity investment 15,199 19,994 Konkola Copper Mine Associate 82,593 8,489 Total dividends receivables (note 8) 305,481 79,708
(iii) Borrowings from related parties Other borrowings (amounts due to associated companies (note 30) 18,335 17,884 GRZ and GRZ related borrowing (note 30) 1,151,357 1,132,044
1,169,692 1,149,928
The terms and conditions of the above loans are disclosed under note 30 (i).
(iv) Amounts due from related parties Relationship Group Company
2013 2012 2013 2012 Maamba Collieries Limited (i) Associate 234,305 87,617 234,305 87,617 Lubambe Copper Mine Limited (ii) Associate 398,781
179,096
398,781 179,096
Ndola Lime Company Limited (iii) Subsidiary - -
282,198 137,361
Kariba Minerals Limited (iv) Associate 6,656 - 6,656 - Nkandabwe Coal Mine (v)
Other equity investment 153 -
153 -
Total amounts due from related party (note 23) 639,895 266,713 922,093 404,074

ZCCM Investments Holdings PlcZCCM Investments Holdings Plc Notes to the financial statements (continued)for the year ended 31 March 2013(all amounts are in thousands of Kwacha unless otherwise stated)
91
34 Related party transactionsShareholder loans(i) Maamba Collieries Limited
As at 31 March 2013, ZCCM –IH had committed to provide an amount of US$23.53 million as shareholder loans as part of its contribution towards the implementation of the Integrated Mining Project and the establishment of the 300MW Thermal Power plant project. As at year end a total amount of K234 million (2012: K87 million) had been advanced by the Company to Maamba Collieries Limited.
(ii) Lubambe Copper Mines LimitedOn 15 September 2012, ZCCM – IH entered into an intercompany loan agreement with Lubambe Copper Mines Limited, for a cash call loan amount of US$60 million. The loan is not repayable until the mine’s commercial production commences. The outstanding principal is repayable after the expiry of the availability period in 12 equal quarterly instalments. The loan attracts an interest rate of Libor plus 5% and is not secured.
(iii) Ndola Lime Company Limited Ndola Lime Company Limited obtained loans of K137.8 million in the 2012 financial year and K132.6 million in the current financial year carrying interest at 14% per annum. The tenor of the loan agreements is 84 months and commenced on 30 September 2011 and 31 January 2013 respectively. These shareholder loans are not secured over any Ndola Lime Company assets.
(iv) Kariba Minerals Limited.On 10 December 2012, ZCCM-IH and Kariba Minerals Limited entered into an intercompany loan agreement for a cash advance of US$1.25 million. Repayment will commence at the end of the 12 months from the date of disbursement and will be paid annually. The loan attracts an interest rate of 6 % per annum.
(v) Nkandabwe Coal MinesDuring the year, ZCCM – IH advanced a loan to Nkandabwe Coal Mine of K158,000. There are no repayment terms and it is interest free and is not secured.
(vi) Government valuation departmentFees of K 20,000 were paid to the Government valuation department in respect of the valuation of investment property described at note 19. These fees were incurred after the year end.
35 Contingent liabilitiesThe Company is defending a number of cases involving ZCCM’s former employees and suppliers. Due to a large number of cases there is likelihood that some could involve a material liability. However, the quantum of the potential liability cannot be reliably estimated at their respective stages in the litigation processes.The Company has made a full assessment of the total expenditure on environmental remedial obligations which may have to be incurred in respect of the Company’s past operations. However, in the conditions precedent to the privatisation sales agreements, the Government has given an undertaking to fund the residual environmental liabilities relating to the Company’s past operations.The National Pension Scheme Authority (NAPSA) made an assessment of penalties from the year 2000 to 2008 for underpayment of contributions as a result of an error in the mode of calculation used to arrive at the contribution. The assessed liability amounting to K25.9 million has not been included as a liability because Ndola Lime Company contested the liability and obtained a legal opinion from their lawyers who advised that it was unlikely that NAPSA would enforce the liability given the facts of the case. NAPSA has not made any subsequent claims of the assessment from 31 March 2013 up to the date of these financial statements.
(iii) Ndola Lime Company Limited
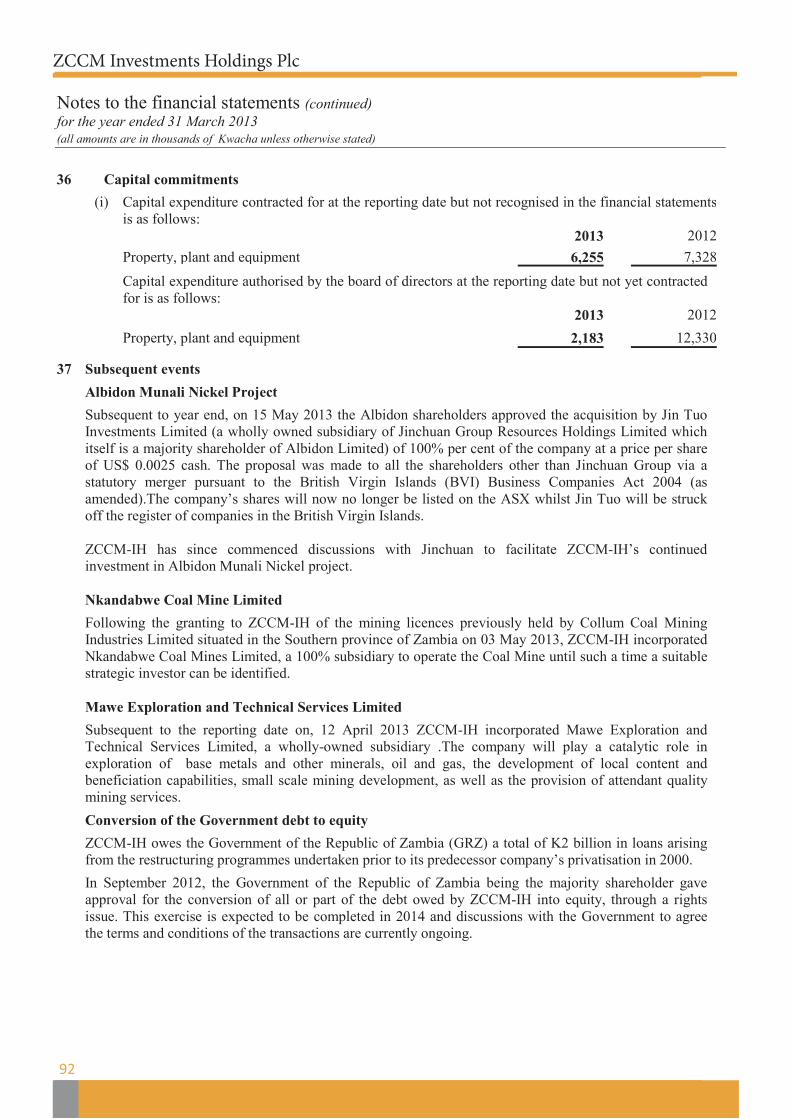
ZCCM Investments Holdings PlcZCCM Investments Holdings Plc
Notes to the financial statements (continued) for the year ended 31 March 2013 (all amounts are in thousands of Kwacha unless otherwise stated)
92
36 Capital commitments
(i) Capital expenditure contracted for at the reporting date but not recognised in the financial statements is as follows:
2013 2012 Property, plant and equipment 6,255 7,328
Capital expenditure authorised by the board of directors at the reporting date but not yet contracted for is as follows:
2013 2012
Property, plant and equipment 2,183 12,330
37
Subsequent events
Albidon Munali Nickel Project
Subsequent to year end, on 15 May 2013 the Albidon shareholders approved the acquisition by Jin Tuo Investments Limited (a wholly owned subsidiary of Jinchuan Group Resources Holdings Limited which itself is a majority shareholder of Albidon Limited) of 100% per cent of the company at a price per share of US$ 0.0025 cash. The proposal was made to all the shareholders other than Jinchuan Group via a statutory merger pursuant to the British Virgin Islands (BVI) Business Companies Act 2004 (as amended).The company’s shares will now no longer be listed on the ASX whilst Jin Tuo will be struck off the register of companies in the British Virgin Islands. ZCCM-IH has since commenced discussions with Jinchuan to facilitate ZCCM-IH’s continued investment in Albidon Munali Nickel project. Nkandabwe Coal Mine Limited
Following the granting to ZCCM-IH of the mining licences previously held by Collum Coal Mining Industries Limited situated in the Southern province of Zambia on 03 May 2013, ZCCM-IH incorporated Nkandabwe Coal Mines Limited, a 100% subsidiary to operate the Coal Mine until such a time a suitable strategic investor can be identified. Mawe Exploration and Technical Services Limited
Subsequent to the reporting date on, 12 April 2013 ZCCM-IH incorporated Mawe Exploration and Technical Services Limited, a wholly-owned subsidiary .The company will play a catalytic role in exploration of base metals and other minerals, oil and gas, the development of local content and beneficiation capabilities, small scale mining development, as well as the provision of attendant quality mining services.
Conversion of the Government debt to equity
ZCCM-IH owes the Government of the Republic of Zambia (GRZ) a total of K2 billion in loans arising from the restructuring programmes undertaken prior to its predecessor company’s privatisation in 2000.
In September 2012, the Government of the Republic of Zambia being the majority shareholder gave approval for the conversion of all or part of the debt owed by ZCCM-IH into equity, through a rights issue. This exercise is expected to be completed in 2014 and discussions with the Government to agree the terms and conditions of the transactions are currently ongoing.
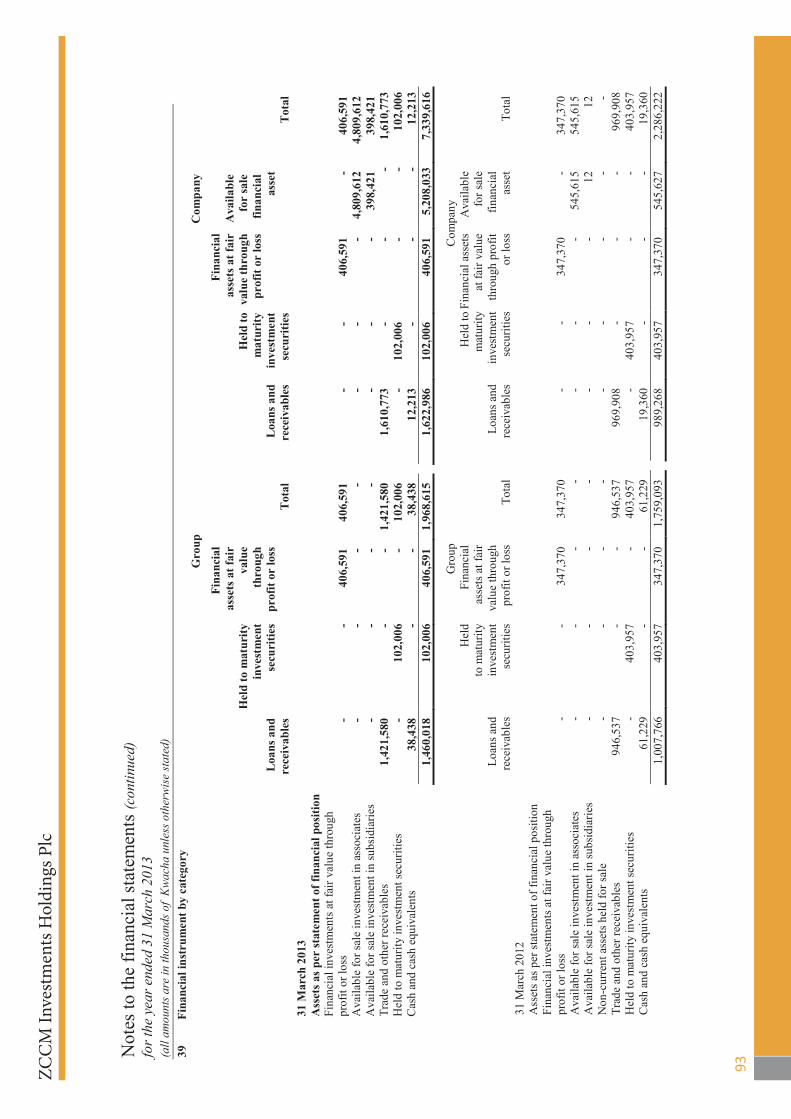
ZCC
M In
vest
men
ts H
oldi
ngs P
lc
ZCC
M In
vest
men
ts H
oldi
ngs P
lc
Not
es to
the
finan
cial
stat
emen
ts (c
ontin
ued)
fo
r the
yea
r end
ed 3
1 M
arch
201
3 (a
ll am
ount
s are
in th
ousa
nds o
f K
wac
ha u
nles
s oth
erw
ise
stat
ed)
93
39
Fina
ncia
l ins
trum
ent b
y ca
tego
ry
G
roup
Com
pany
Loa
ns a
nd
rece
ivab
les
H
eld
to m
atur
ity
inve
stm
ent
secu
ritie
s
Fina
ncia
l as
sets
at f
air
valu
e th
roug
h pr
ofit
or lo
ss
T
otal
Loa
ns a
nd
rece
ivab
les
H
eld
to
mat
urity
in
vest
men
t se
curi
ties
Fina
ncia
l as
sets
at f
air
valu
e th
roug
h pr
ofit
or lo
ss
A
vaila
ble
for
sale
fin
anci
al
asse
t
T
otal
31 M
arch
201
3
A
sset
s as p
er st
atem
ent o
f fin
anci
al p
ositi
on
Fina
ncia
l inv
estm
ents
at f
air v
alue
thro
ugh
prof
it or
loss
-
-
406,
591
40
6,59
1
- -
40
6,59
1 -
40
6,59
1
Ava
ilabl
e fo
r sal
e in
vest
men
t in
asso
ciat
es
- -
- -
-
- -
4,80
9,61
2 4,
809,
612
A
vaila
ble
for s
ale
inve
stm
ent i
n su
bsid
iarie
s -
- -
-
- -
- 39
8,42
1 39
8,42
1
Trad
e an
d ot
her r
ecei
vabl
es
1,42
1,58
0 -
- 1,
421,
580
1,
610,
773
- -
- 1,
610,
773
H
eld
to m
atur
ity in
vest
men
t sec
uriti
es
- 10
2,00
6 -
102,
006
-
102,
006
- -
102,
006
C
ash
and
cash
equ
ival
ents
38,4
38
- -
38,4
38
12
,213
-
- -
12,2
13
1,46
0,01
8 10
2,00
6 40
6,59
1 1,
968,
615
1,
622,
986
102,
006
406,
591
5,20
8,03
3 7,
339,
616
G
roup
Com
pany
Loan
s and
re
ceiv
able
s
Hel
d to
mat
urity
in
vest
men
t se
curit
ies
Fina
ncia
l as
sets
at f
air
valu
e th
roug
h pr
ofit
or lo
ss
To
tal
Loan
s and
re
ceiv
able
s
Hel
d to
m
atur
ity
inve
stm
ent
secu
ritie
s Fina
ncia
l ass
ets
at fa
ir va
lue
thro
ugh
prof
it or
loss
Ava
ilabl
e fo
r sal
e fin
anci
al
asse
t
To
tal
31
Mar
ch 2
012
Ass
ets a
s per
stat
emen
t of f
inan
cial
pos
ition
Fi
nanc
ial i
nves
tmen
ts a
t fai
r val
ue th
roug
h pr
ofit
or lo
ss
- -
34
7,37
0
347,
370
-
-
347,
370
-
347,
370
A
vaila
ble
for s
ale
inve
stm
ent i
n as
soci
ates
-
- -
-
- -
- 54
5,61
5 54
5,61
5
Ava
ilabl
e fo
r sal
e in
vest
men
t in
subs
idia
ries
- -
- -
-
- -
12
12
N
on-c
urre
nt a
sset
s hel
d fo
r sal
e -
- -
-
- -
- -
-
Trad
e an
d ot
her r
ecei
vabl
es
946,
537
- -
946,
537
96
9,90
8 -
- -
969,
908
H
eld
to m
atur
ity in
vest
men
t sec
uriti
es
- 40
3,95
7 -
403,
957
-
403,
957
- -
403,
957
C
ash
and
cash
equ
ival
ents
61,2
29
- -
61,2
29
19
,360
-
- -
19,3
60
1,00
7,76
6 40
3,95
7 34
7,37
0 1,
759,
093
98
9,26
8 40
3,95
7 34
7,37
0 54
5,62
7 2,
286,
222
ZCCM Investments Holdings Plc
94
ZCCM Investments Holdings Plc Annual Report for the year ended 31 March 2013 CORPORATE INFORMATION Registered and Corporate Office
Mukuba Pension House 5309 Dedan Kimathi Road P O Box 30048 Lusaka 10101, Zambia
UK Registrars
CAPITA Registrars Limited Bourne House 34 Beckenham Road Beckenham Kent BR3 4TU England
Depository for American Shares
JP Morgan Chase & Co. 60 Wall Street New York, NY 10260-0060 USA
Joint Brokers for Lusaka Stock Exchange Listing
Stockbrokers Zambia Limited 2nd Floor Design House Dar Es Salaam Place Cairo Road P O Box 38956 Lusaka, Zambia
Pangaea/EMI Securities (Zambia) Limited 1st Floor, Lusaka Stock Exchange Building 2A Cairo Road P O Box 30163 Lusaka, Zambia
Auditors
KPMG Chartered Accountants First Floor, Elunda 2 Addis Ababa Roundabout P O Box 31282 Lusaka, Zambia

ZCCM Investments Holdings Plc
95
ZCCM Investments Holdings Plc Annual Report (continued) for the year ended 31 March 2013 CORPORATE INFORMATION (continued) Principal Bankers: Barclays Bank (Zambia) Plc Standard Chartered Bank (Zambia) Plc Zambia National Commercial Bank Plc Transfer Secretaries: Corpserve Transfer Agents Ltd 6 Mwaleshi Road, Olympia Park P O Box 37522 Lusaka 10101, Zambia Phone : +260 211 256969/70 Fax : +260 211 256975 Email : [email protected] Shareholder Contact Chabby Chabala Company Secretary Charles Mjumphi Corporate Officer Joseph Malani Lungu Investor Relations Officer Phone : +260 211 221023/228833 Fax : +260 211 220727 Website: www.zccm-ih.com.zm E-mail : [email protected]