ZaZa Energy Corporation - Ningapi.ning.com/.../ZaZaCorporatePresentation.pdf · 2 ForwardLooking...
25
ZaZa Energy Corporation Corporate Presentation NASDAQ: ZAZA
-
Upload
truonghuong -
Category
Documents
-
view
218 -
download
1
Transcript of ZaZa Energy Corporation - Ningapi.ning.com/.../ZaZaCorporatePresentation.pdf · 2 ForwardLooking...

ZaZa Energy Corporation
Corporate PresentationNASDAQ: ZAZA

2
Forward Looking StatementsAll statements other than statements of historical facts included in this presentation, including, without limitation, statements containing the words "believes,""anticipates," "intends," "expects," "assumes," "trends" and similar expressions, constitute "forward‐looking statements" within the meaning of the PrivateSecurities Litigation Reform Act of 1995. Forward‐looking statements are based upon current plans, expectations and projections. However, such statements involveknown and unknown risks, uncertainties and other factors that may cause the actual results, performance or achievements of the Company, ZaZa and the combinedcompany to be materially different from any future results, performance or achievements expressed or implied by such forward‐looking statements. These factorsinclude, among others, certain risks and uncertainties inherent in petroleum exploration, development and production, including, but not limited to, the combinedcompany’s need and ability to raise additional capital; the combined company’s ability to execute our business strategy; the loss of senior management or keyemployees; political, legal and economic risks; disruptions in production and exploration activities in the Eagleford, Eaglebine and Paris Basin; integrating theCompany and ZaZa; declines in prices for crude oil; the combined company’s ability to obtain equipment and personnel; extensive regulation to which we and ZaZaare subject; terrorist activities; the combined company’s success in development, exploitation and production activities; reserves estimates turning out to beinaccurate; differences between the present value and market value of the combined company’s reserves and other risks and uncertainties described in theCompany's and ZaZa’s filings with the U.S. Securities and Exchange Commission (“SEC”). Any one or more of these factors or others could cause actual results todiffer materially from those expressed in any forward‐looking statement. All written and oral forward‐looking statements attributable to Toreador, ZaZa or personsacting on their behalf are expressly qualified in their entirety by the cautionary statements disclosed herein. The historical results achieved by Toreador and ZaZa arenot necessarily indicative of the combined company’s future prospects. Toreador and the combined company undertake no obligation to publicly update or reviseany forward looking‐statements, whether as a result of new information, future events or otherwise.
Cautionary Note regarding Hydrocarbon DisclosuresThe SEC permits oil and gas companies, in their filings, to disclose only resources that qualify as “reserves” as defined by SEC rules. We may use terms describinghydrocarbon quantities in this presentation, including “original oil in place” (OOIP), “oil in place” (OIP), “barrels in place” and “EUR” (estimated ultimate recovery),that the SEC does not allow in our filings. These estimates are more speculative than estimates of proved reserves prepared in accordance with SEC rules. Investorsare urged to consider closely the reserves disclosures in the Company’s merger proxy statement, the Company’s Annual Report on Form 10‐K for the year endedDecember 31, 2011, in its other filings with the SEC. In this presentation, the terms other than “proved reserves” refer to the internal estimates of hydrocarbonvolumes that may be discovered through exploratory drilling or recovered with additional drilling or recovery techniques. Those estimates are based on economicassumptions that differ from those required by the SEC to be used in calculating proved reserves and may not constitute reserves within the meaning of the Societyof Petroleum Engineer’s Petroleum Resource Management System or the SEC’s rules. The terms “original oil in place” and “oil in place” are not intended to reflectrecoverable volumes, which are dependent upon achievable recovery rates using available technologies. Unless otherwise stated, hydrocarbon volume estimateshave not been risked by Company management. Factors affecting ultimate recovery include the scope of our drilling program, which will be directly affected bycapital availability, drilling and production costs, commodity prices, availability of services and equipment, permit expirations, transportation constraints, regulatoryapprovals and other factors, and actual drilling results, including geological and mechanical factors affecting recovery rates. Accordingly, actual quantities that maybe recovered from our interests will differ from our estimates, and could be significantly less than our targeted recovery rate. In addition, our estimates may changesignificantly as we receive additional data.
What Makes Us Unique
Emerging resource play expertise
In-house capabilities to apply innovative well technology
Proven geoscience & operations track record
High quality Eagle Ford acreage with room to grow
Solid platform to build scale
3

4
2011 in review

Year in Review
France
Spent US$5 million in 2011 capex of which US$3 million carried (industry-wide voluntary moratorium on drilling)
Exited 2011 with total production of 854 Boe/d, 100% liquids
Currently producing net 850 Boe/d, 100% liquids
Performed 35 workovers
US
Spent US$262 million in 2011 capex of which US$253 million carried
Drilled 28 gross wells, 4 drilling at year end
Completed 21 wells
Exited 2011 with total production of 200 boe/d, 67% liquids
Currently producing 420 boepd, 77% liquids
Current number of wells drilled 37
5

Proven and Probable Reserves
6
Source: US data audited by Morris (March 14, 2012), French data audited by Gaffney Cline (February 12, 2012)
PDPTotal
proved ProbableTotal proved
probableOil MBbls 162 944 2,860 3,804Gas MMcf 529 4,129 7,221 11,350
Subtotal US Mboe 250 1,632 4,064 5,696
France Oil MBbls 5,344 5,771 3,047 8,818
ZaZa Total Mboe 5,594 7,403 7,111 14,514
US
As at 12.31.2011

7
Forward Outlook

Growth Strategy
Build on our in-house technical and commercial skills
Prospecting and de-risking resource plays
Executing on drilling schedules
Identifying external growth
Scale up core assets
Eaglebine
Eagle Ford
France
Focus on safe execution
Remain a JV partner of choice
Maintain financial discipline
8
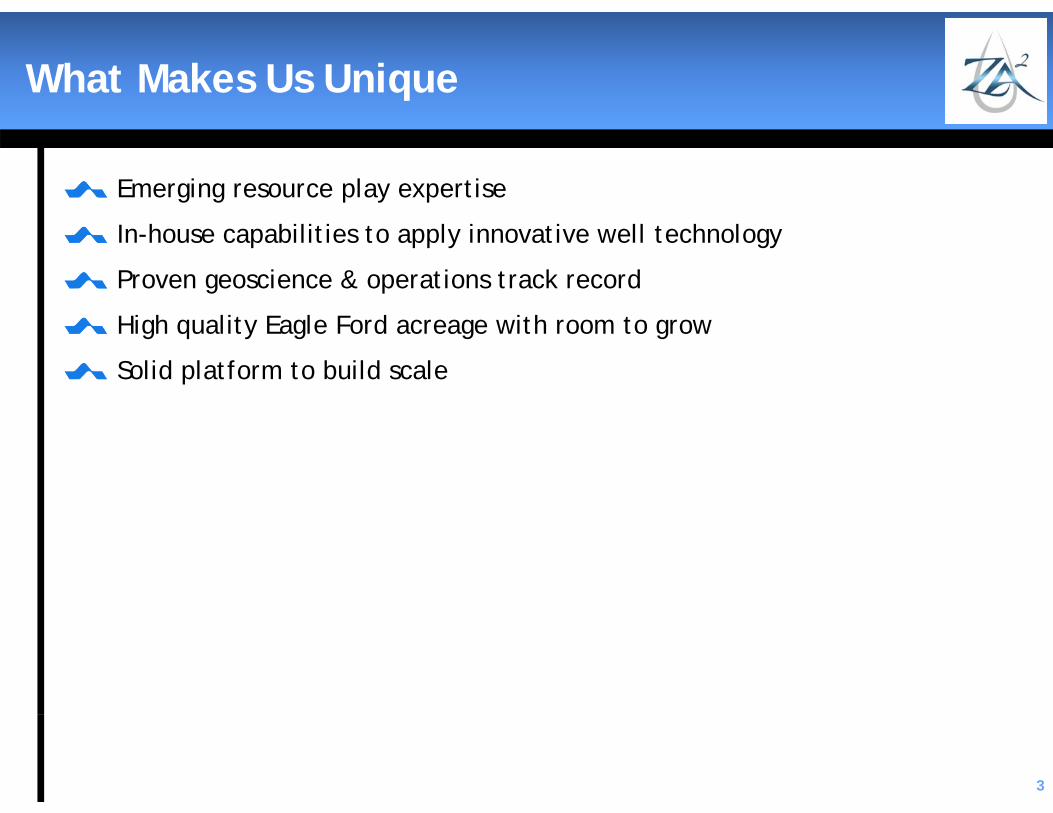
2012 Plan
9
• EF JV drilling• EB expansion• Preparation for
drilling PBL• Acquire EB
data• Monitor new
opportunities
• Accelerate EF either in JV or 100%
• Commence EB drilling program
• Drill PBL phase 1 wells
• Drill PBC well• Consider EB
partnering
• Launch execution plan
Execute Grow Expand
• Expand EB program• Consider new
resource plays• External growth
Today
EF Eagle FordEB EaglebinePBC Paris Basin ConventionalPBL Paris Basin Liassic
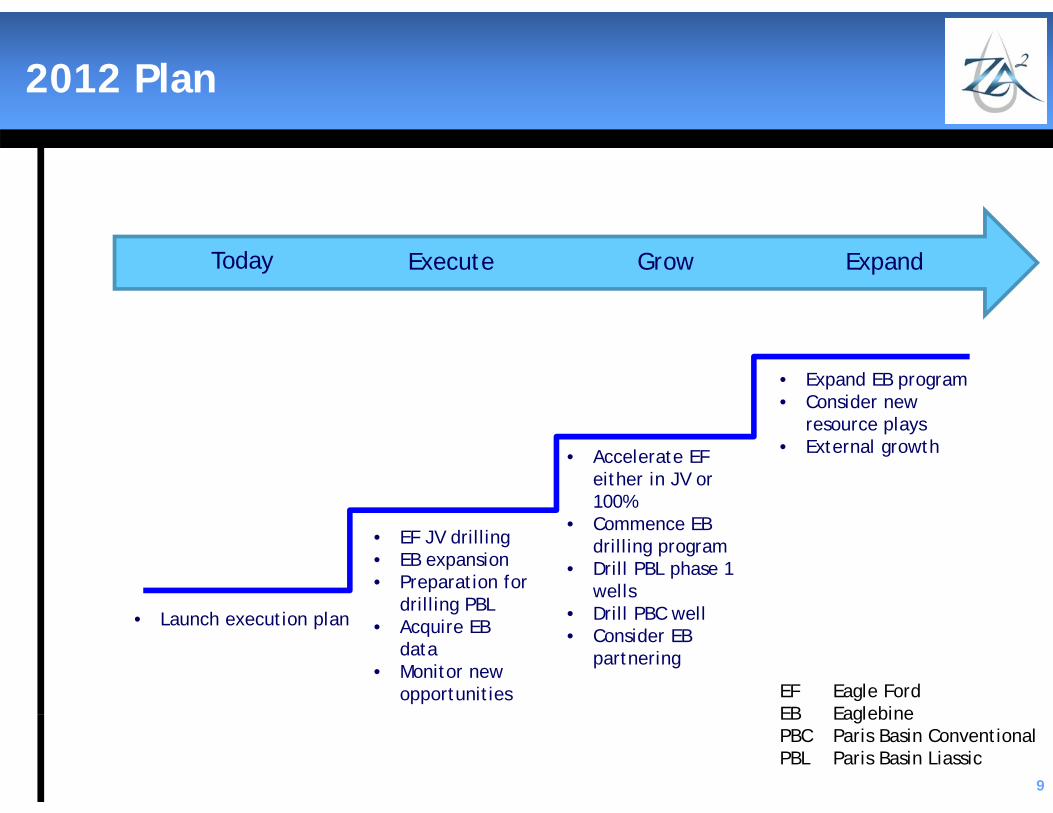
Financing Our Growth
Senior secured notes
Face value: US$100MM
Duration: 5 years, 3 year put / call
Coupon: 8% p.a.
Warrant coverage: 26.3MM warrants
Carve out for certain senior reserve-based loans
Use of proceeds
Drilling (outside JV, 100%)
Acreage
Refinancing existing indebtedness
Costs associated with the merger
Additional funding on project basis
10

Capital Plan 2012
11Note: Company estimates. Actual expenditure may vary significantly as a function of capital and rig availability.
(expressed in US$ million, unless otherwise indicated)
Carried capital expenditure
(gross)
ZaZa direct capital
expenditure Total
Gross Net
Eagle Ford plan 42 4.2 336 ‐ $336Eagle Ford target 58 5.8 464 ‐ $464Eaglebine 6 5.0 ‐ 42 $42Paris Basin Lias 4 2.0 70 ‐ $70Paris Basin 1 0.5‐1.0 ‐ 3‐6 $3‐6Land & infrastructure 25 $25
111 17.5‐18 870 70‐73 $943
Wells drilled

Production Outlook
12Note: Company estimates. Actual timing may vary significantly as a function of capital and rig availability.
0
2,000
4,000
6,000
8,000
10,000
12,000
14,000
16,000
18,000
20,000Jan‐12
Mar‐12
May‐12
Jul‐1
2Sep‐12
Nov‐12
Jan‐13
Mar‐13
May‐13
Jul‐1
3Sep‐13
Nov‐13
Jan‐14
Mar‐14
May‐14
Jul‐1
4Sep‐14
Nov‐14
Jan‐15
Mar‐15
May‐15
Jul‐1
5Sep‐15
Nov‐15
Jan‐16
Mar‐16
May‐16
Jul‐1
6Sep‐16
Nov‐16
boep
d
Net to ZaZa
Base France + EF (drilled)Eagle Ford JV 3 rigs
Eagle Ford JV additional 5-9 rigs
Eaglebine 1 rig
Eaglebine6 net wells

13
Asset Portfolio
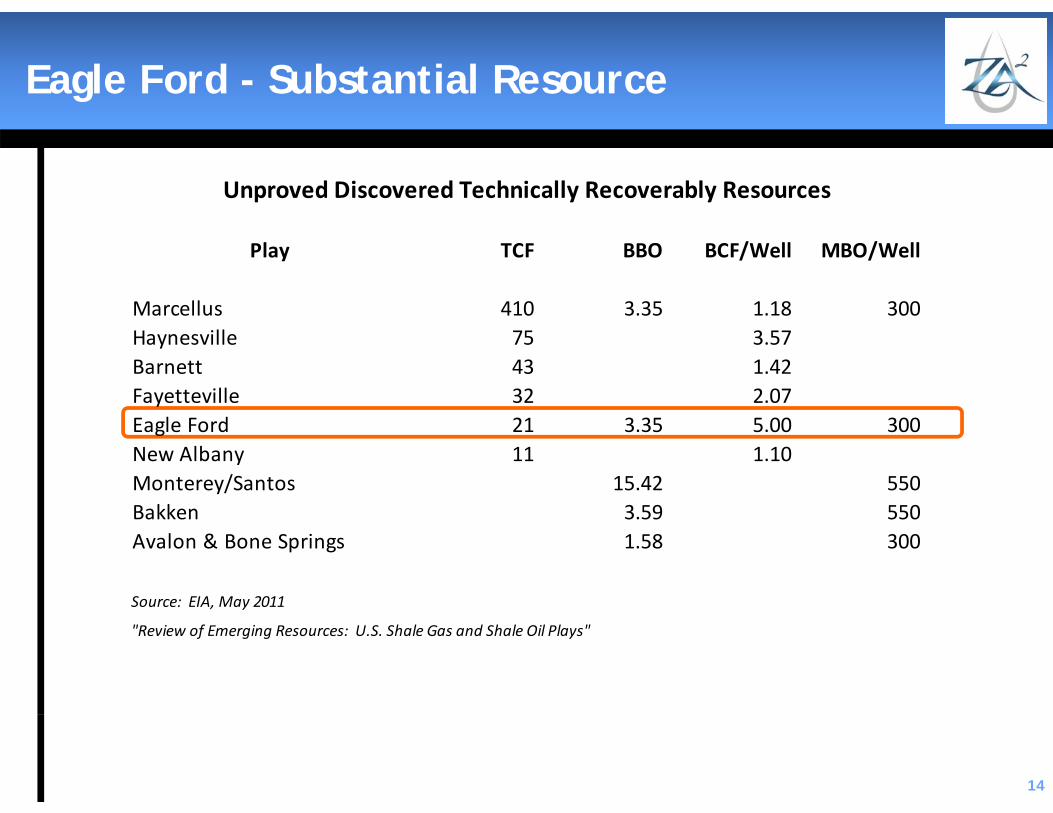
Eagle Ford - Substantial Resource
14
Play TCF BBO BCF/Well MBO/Well
Marcellus 410 3.35 1.18 300Haynesville 75 3.57Barnett 43 1.42Fayetteville 32 2.07Eagle Ford 21 3.35 5.00 300New Albany 11 1.10Monterey/Santos 15.42 550Bakken 3.59 550Avalon & Bone Springs 1.58 300
Source: EIA, May 2011
"Review of Emerging Resources: U.S. Shale Gas and Shale Oil Plays"
Unproved Discovered Technically Recoverably Resources
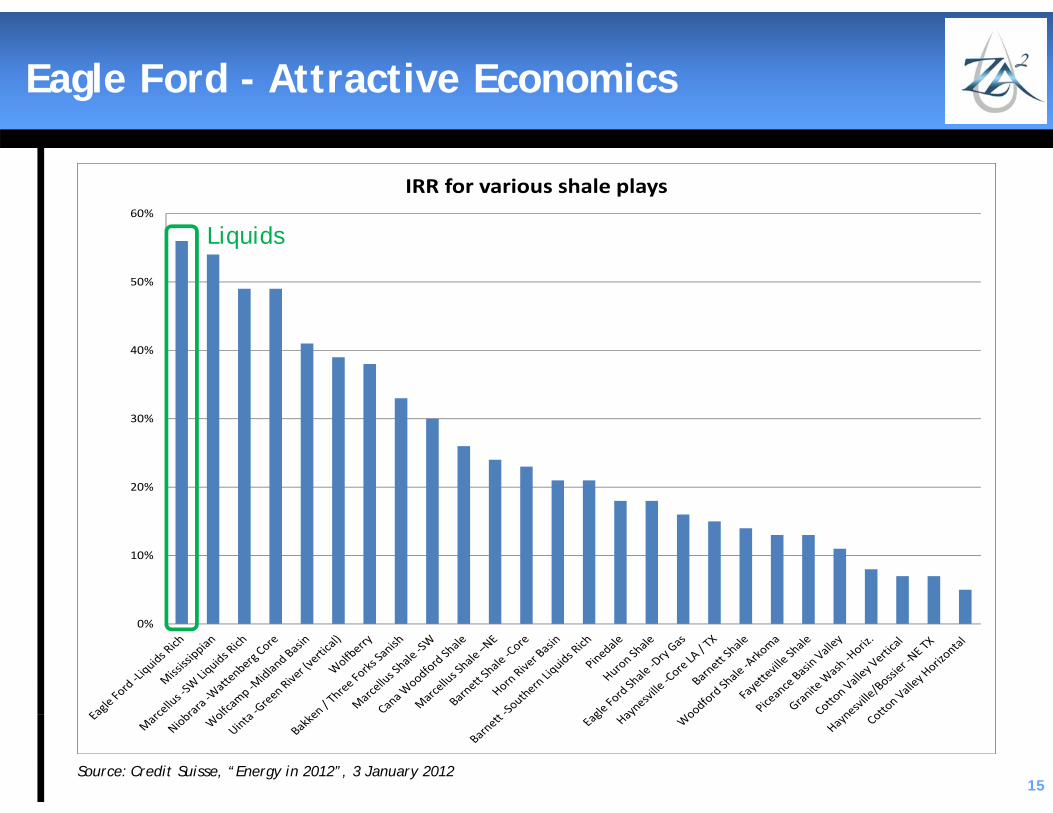
Eagle Ford - Attractive Economics
15
0%
10%
20%
30%
40%
50%
60%
IRR for various shale plays
Source: Credit Suisse, “Energy in 2012”, 3 January 2012
Liquids

Eagle Ford – ZaZa Position
16
Cotulla AreaLasalle/Frio/Dimmit
~51,000 gross acres
Moulton AreaFayette/Gonzalez/Lavaca
~12,000 gross acres
Hackberry CreekLavaca/Colorado
~25,000 gross acres
Sweethome AreaDewitt/Lavaca
~39,000 gross acres
Total123,000 acres
12,300 net to ZaZa
Grow position within JV and 100% owned

Rathjen A-1H 556 BOEPD
Grahmann 1H551 BOEPD
Crab Ranch A-1H371 BOEPD
Bridwell 3H 646 BOEPD
Briggs B2H 432 BOEPD
Bridwell 2H784 BOEPD
Wright Ranch B-3H 426 BOEPD
Briggs 1H 414 BOEPD
Eagle Ford – 30 Day ZaZa Well Performance
Restricted rates allowing for better long term well
performance
17

Eagle Ford – Performance vs. Industry
18
Log probability chart of first month production (boe)
Mean first month production of ZaZa wells is 3,000 Bblshigher than industry mean
1st month cumulative(industry)
1st month cumulative(ZaZa)
Higher production = better wells
10.00
12.00
14.00
16.00
18.00
20.00
22.00
24.00
26.00
28.00
30.00
Dec‐10 Apr‐11 Jul‐11 Aug‐11 Nov‐11 Nov‐11
Average Cycle Time
(Spu
d to Spu
d)
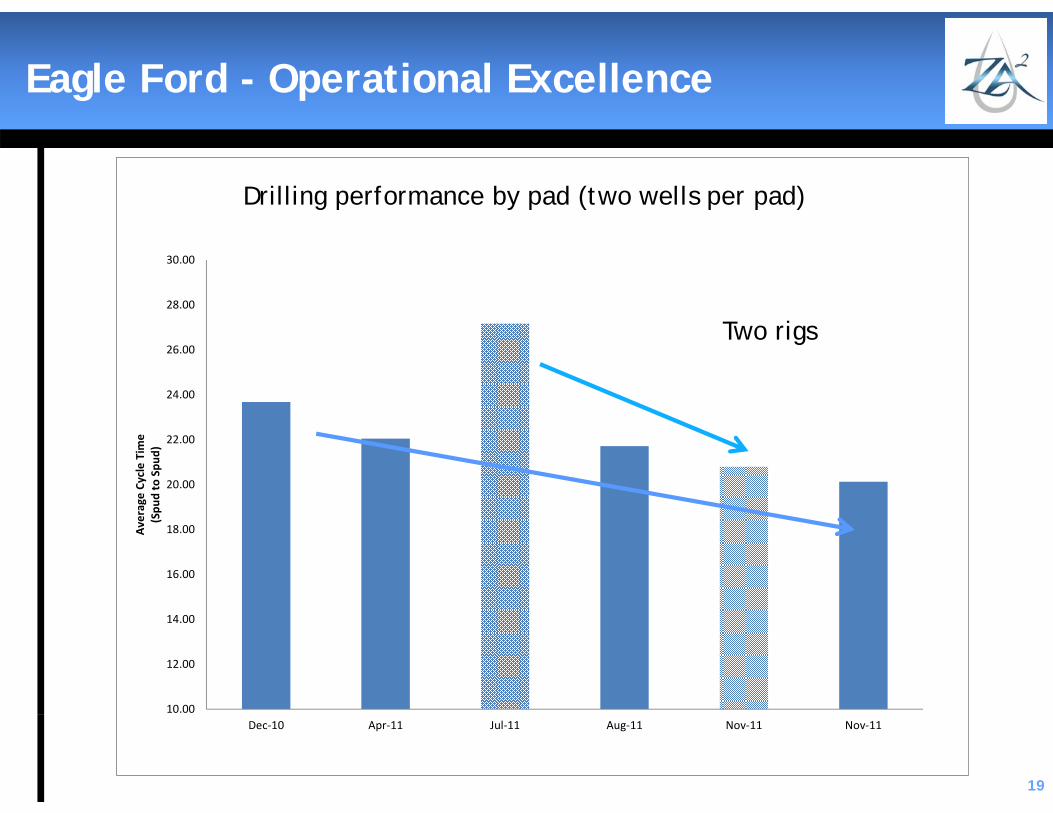
Drilling Performance by Pad(Two Wells per Pad)
Rig 1 ‐ Solid DataRig 2 ‐ Cross‐Hatched Data
Eagle Ford - Operational Excellence
19
Drilling performance by pad (two wells per pad)
Two rigs

Eaglebine – Continuing the Trend
20
Total63,000 net
83,000 gross
100% owned
Stacked play=
Acreage multiplier
7 conventional plays
3 resource plays
ZaZa
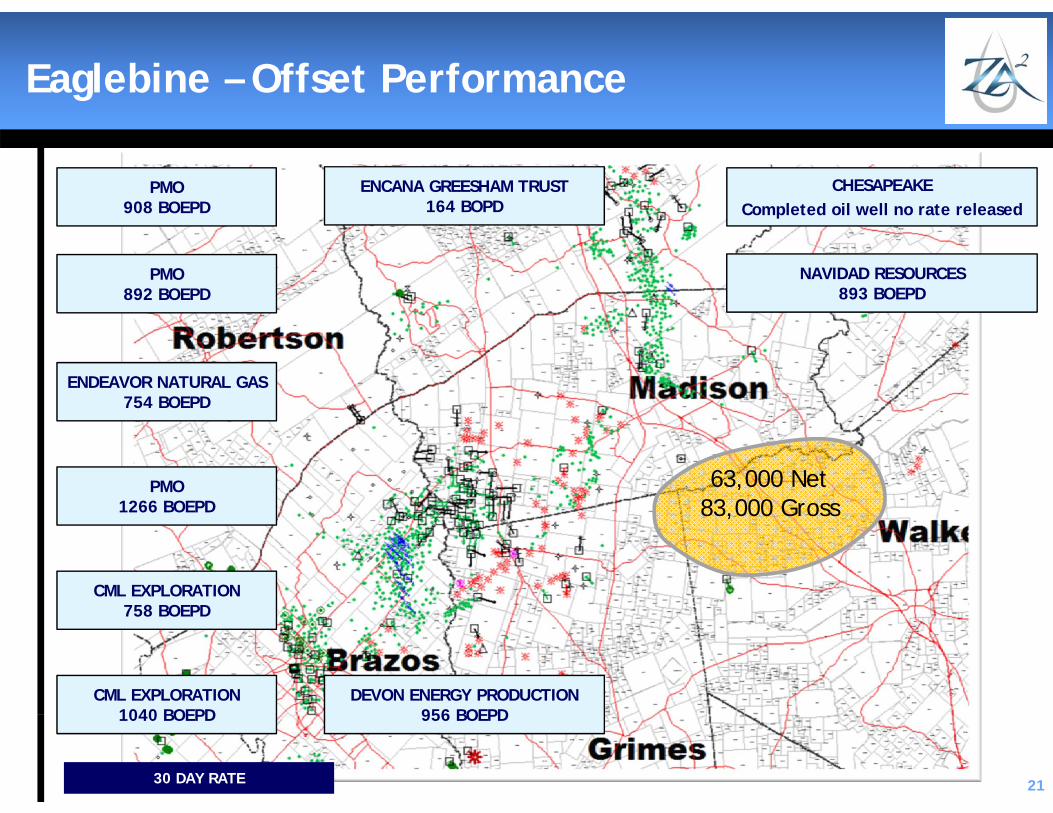
PMO 1266 BOEPD
CML EXPLORATION758 BOEPD
PMO892 BOEPD
PMO908 BOEPD
ENDEAVOR NATURAL GAS754 BOEPD
ENCANA GREESHAM TRUST164 BOPD
CHESAPEAKECompleted oil well no rate released
CML EXPLORATION1040 BOEPD
30 DAY RATE
DEVON ENERGY PRODUCTION956 BOEPD
NAVIDAD RESOURCES893 BOEPD
Eaglebine – Offset Performance
63,000 Net83,000 Gross
21
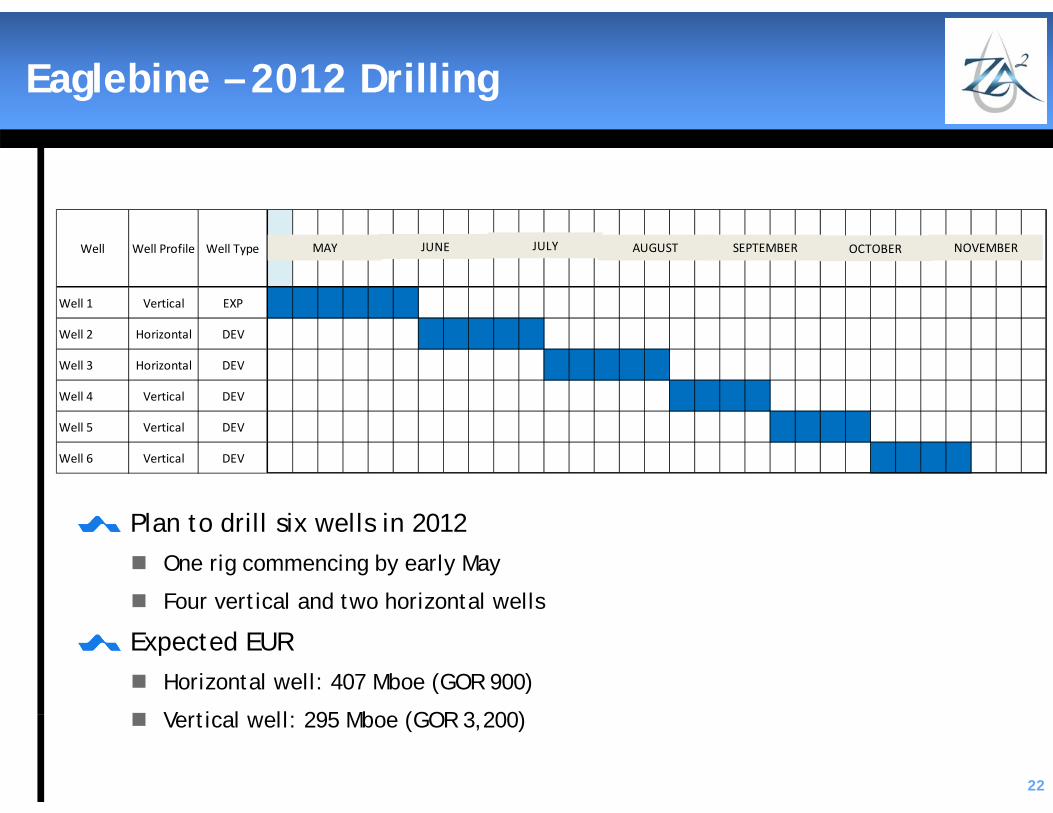
Eaglebine – 2012 Drilling
22
Plan to drill six wells in 2012 One rig commencing by early May
Four vertical and two horizontal wells
Expected EUR Horizontal well: 407 Mboe (GOR 900)
Vertical well: 295 Mboe (GOR 3,200)
Well Well Profile Well Type
Well 1 Vertical EXP Y Y Y Y Y Y
Well 2 Horizontal DEV Y Y Y Y Y
Well 3 Horizontal DEV Y Y Y Y Y
Well 4 Vertical DEV Y Y Y Y
Well 5 Vertical DEV Y Y Y Y
Well 6 Vertical DEV Y Y Y Y
MAY JUNE JULY AUGUST SEPTEMBER OCTOBER NOVEMBER

Paris Basin
23
1,000,000 gross acres awarded and pending
Exploration permits: 16 (average w.i. >40%)
Concessions: 2 (100%)
Conventional prospects: 15
Permitting for 16 infill locations (100%)
Liassic phase 1 underway (pad preparation, rig tender)
New legislative framework (hydraulic fracturing banned)

Conclusion
New company momentum
Proven track record to execute with in-house capabilities
Focusing on core assets: Eagle Ford and Eaglebine Eagle Ford continues to provide base incline
Eaglebine drilling about to commence: high impact
Paris Basin continues as long term growth option
Numerous value-adding external growth options exist
24