Yue Chang - TU Darmstadt publication servicetuprints.ulb.tu-darmstadt.de/3799/1/Diss Yue...
222
Greywater treatment within semi-centralised supply and treatment systems by the example of the People’s Republic of China Herausgeber: Verein zur Förderung des Instituts der TU Darmstadt e.V. Schriftenreihe 208 Yue Chang
Transcript of Yue Chang - TU Darmstadt publication servicetuprints.ulb.tu-darmstadt.de/3799/1/Diss Yue...

Greywater treatment within semi-centralised supply and treatment systems by the example of the People’s Republic of China
Herausgeber:Verein zur Förderung des Instituts der TU Darmstadt e.V.
Schriftenreihe 208
Yue Chang

Hrsg.: Verein zur Förderung des Instituts der TU Darmstadt e.V. .
(Schriftenreihe 208)
ISBN 978-3-940897-04-6
Alle Rechte vorbehalten. Wiedergabe nur mit Genehmigung des Vereins zur Förderung des Instituts der Technischen Universität Darmstadt e.V., Fontanestraße 8, D-64291 Darmstadt.
Herstellung: Lasertype GmbH, Holzhofallee 19 64295 Darmstadt
Vertrieb: Institut TU Darmstadt, Petersenstraße 13, D-64287 Darmstadt. Telefon: 06151 / 16 2748 Telefax: 06151 / 16 3759
Greywater treatment within semi-centralised supply and treatment systems by the example of the People’s Republic of China | Yue Chang

Diese Arbeit wird meiner Mutter gewidmet
For my mother
献给我的母亲


Das wahre Licht heißt nicht ewig ohne Dunkelheit, sondern es wird nie von der Dunkelheit verdeckt. (FU Lei) 真正的光明决不是没有黑暗,只是永不被黑暗所遮蔽罢了 傅雷 于《Jean Christophe》译者序

Mein aller herzlicher Dank gilt
Herrn Prof. Peter Cornel, der mir die Chance gegeben hat, während meiner Tätig-
keit am Institut interessante und herausfordernde Projekte bearbeiten und beglei-
ten zu können, für die Veranlassung des Themas, die Unterstützung und die Dis-
kussionsbereitschaft sowie für die kritische Durchsicht dieser Arbeit;
Herrn Prof. Wolfgang F. Günthert, für die Übernahme des Korreferats und das
Interesse an meiner Arbeit;
Herrn Prof. Martin Wagner für wertvolle Zusammenarbeit und anregende Diskus-
sionen während meiner gesamten Dienstzeit am Institut;
aller ArbeitskollegInnen vom FG Abwassertechnik des Instituts IWAR, insbesondere
Alessandro Meda und Jochen Henkel, für das tolle Arbeitsklima im Büro und für
die guten Zeiten auf dem Versuchsfeld in Darmstadt-Eberstadt;
aller Labor- und WerkstattmitarbeiterInnen, die immer gute Ideen für die Gestal-
tungen der Versuchsanlage und praktische Durchführungen der Versuche beige-
tragen haben;
aller meiner damaligen studentischen Hilfskräften und Diplomanden, gute Arbei-
ten für die gesamten Projektbearbeitung mitgetragen haben;
Nadine, Rosie (Wei) und Osman, die mir während der letzten Schreibphase mei-
ner Dissertation immer weiter motiviert und volle Unterstützung geleistet haben;
meinen Eltern und meiner ganzen Familie für ihren jahrelangen Beistand und ihre
grenzenlose Unterstützung.
Die vorliegende Arbeit wurde in den Jahren 2004 bis 2009 am Fachgebiet Abwas-
sertechnik Institut IWAR der Technischen Universität Darmstadt, unter der Leitung
von Herrn Prof. Dr.-Ing. Peter Cornel, durchgeführt.


Kurzfassung
Die vorliegende Arbeit entstand während meiner Tätigkeit am Institut IWAR der Technischen Universität Darmstadt, basierend auf den vom BMBF geförderten Forschungsprojekten „Semizentrale Ver- und Entsorgungssysteme für schnell wachsende urbane Räume Chinas“. Die chinesischen Städte weisen seit über 30 Jahren hohe Zuwachsraten auf, aber in den vergangenen 15 Jahren hat die Dynamik dieser Entwicklung stark zuge-nommen. Nicht nur die geographische Größe sonder auch die Urbanisierungspro-zesse fordern die Weiterentwicklung der mangelnden Infrastrukturen in urbanen Räumen. Dazu kommen die regionalen Knappheit der Wasserressourcen. Um die Fortschritte der Stadtentwicklung zu unterstützen, müssen alternative Entwick-lungskonzepte hinsichtlich der Ver- und Entsorgungsinfrastrukturen neben den konventionellen Systemen in Betracht gezogen werden. Die vorliegende Arbeit fokussiert einen Baustein dieser Systeme und thematisiert die Grauwasserbehandlung zur innenstädtischen Wasserwiederverwendung im Kontext semizentraler Ver- und Entsorgungssysteme. Zuerst werden sowohl rechtliche als auch technische Rahmenbedingungen darge-stellt. Basiert auf diesen Grundlagen werden technische Untersuchungen zur Machbarkeiten der Grauwasserbehandlung hinsichtlich verschiedener Aspekte mittels einer halbtechnischen Versuchsanlage (SBR Verfahren) untersucht und entsprechende technische Empfehlungen zur praktischen Anwendung abgeleitet. Darauf aufbauend werden Untersuchungen zur modularen Bauweise von Grau-wasserbehandlungsanlagen mittels einer dynamischen Kostenvergleichsberech-nung durchgeführt. Ergänzt wird dieses durch einen Vergleich verschiedenen Behandlungsverfahren zur Grauwasseraufbereitung hinsichtlich ihrer technischen, ökonomischen und ökologischen Aspekte. Grauwasserbehandlung mittels des untersuchten SBR-Verfahrens zwecks inner-städtischer Wasserwiederverwendung für urbane Räume ist eine der wichtigsten Systemkomponenten eines semizentralen Ver- und Entsorgungssystems. Die modu-lare Bauweise der Grauwasserbehandlungsanlage bietet große Flexibilitäten hin-sichtlich der Anpassungsfähigkeit an dynamische Entwicklung des Einzugsgebietes im Kontext semizentrale Ver- und Entsorgungssysteme.


Summary
This thesis was written during my work as research assistant at the Institute IWAR, the Technical University of Darmstadt. It bases on the subject corresponding to the research project “Semi-centralised supply and treatment systems for rapidly grow-ing urban areas of P. R. China”. Chinese cities are increasing rapidly for over 30 years, especially during the last 15 years. Not only the physical size but also the increasing urbanization processes challenge the on-going development of the urban infrastructure. The regional scarcity of water resources compounds the severe situation additionally. To sup-port the progress of urban development, alternative concepts regarding supply and treatment infrastructures have to be taken into consideration in addition to the conventional systems applied generally. This work regards the greywater treat-ment for intra-urban water reuse, one of the basic system components of semi-centralised supply and treatment systems. Firstly, both legal and technical frameworks and available boundary conditions are summarised for the followed investigations. Investigations of the technical feasibil-ity using a SBR pilot plant are carried out then, followed by derived appropriate technical recommendations for the practical application. Furthermore, discussions with regard to a modular construction of the large-scale greywater treatment plant are carried out by means of dynamic cost comparison calculation. Finally, different greywater treatment techniques are compared with regards to technical, economi-cal and ecological aspects. Greywater treatment using the SBR for intra-urban water reuse is one of the essen-tial system components of semi-centralised supply and treatment system for urban areas. The technical feasibility of greywater treatment with modular construction offers great flexibilities adapting to the dynamic development of the catchment area accordingly.


i
Table of Content Table of Content i List of Figures iii List of Table vi Abbreviation vi 1 ..... Background and objectives 1 1.1 Development of population and urbanisation in China 1 1.2 Natural water resources V.S. water consumption 4 1.3 Status of water quality 10 1.4 Objectives 14 2 ..... Semi-centralised supply and treatment systems for
rapidly growing urban areas 17 2.1 Status of centralized water supply and sanitation
infrastructures in China 17 2.1.1 Legislation and framework in China and Germany 18
2.1.2 Quantity of wastewater 21
2.1.3 Status of centralized municipal wastewater treatment plants 22
2.2 Status of the decentralized water sector in China 27 2.3 An alternative concept for urban areas in China –
Semi-centralised Supply and Treatment Systems 28 2.3.1 What is a Semi-centralised Supply and Treatment System (SSTS) 29
2.3.2 Advantages of Semi-centralised Supply and Treatment Systems 31
3 ..... Utilisation-oriented greywater treatment for intra-urban water reuse 35 3.1 Guidelines of water reuse for different purposes in China 35 3.2 Characteristics of greywater according to
published investigations 40 3.3 Techniques chosen for greywater treatment
based on published investigations 44 4 ..... Greywater treatment using Sequencing Batch Reactor (SBR) 55 4.1 Pilot plant 55

ii
4.2 Methods 62 4.3 Results 66 4.3.1 General evaluation regarding the treatment performance 66
4.3.2 Evaluation of further experiment results 71
4.3.3 Oxygen transfer measurements in greywater 85
4.4 Summary of the experimental results and according determination of key design parameters for a large-scale SBR plant for greywater treatment 87
5 ..... Design of a large-scale greywater treatment plant using SBR as part of a semi-centralised supply and treatment system 89
5.1 Design input data 89 5.2 Design and description of the greywater treatment
plant using SBR 96 5.3 Modularisation of the greywater treatment plant
in context of the dynamic development of the semi-centralised supply and treatment systems 103
5.3.1 Calculation basis and procedures applied according to LAWA (2005) 103
5.3.2 Results of the dynamic comparative cost calculation concerning specific net present values of the greywater treatment plant 107
6 ..... Comparison of three treatment techniques (BAF, MBR and SBR) for greywater reuse 115
6.1 Technical aspects 116 6.2 Ecological aspects 121 6.3 Economic aspects 124 6.4 Summary of the comparison of greywater treatment techniques
(BAF, MBR and SBR) 130 7 ..... Summary and future prospects 133 References 137 Appendix 149

iii
List of Figures Figure 1: Population development in Chinese cities
[data chart according to NBS 1995-2008, MOHURD 2007] 2
Figure 2: Development of the urbanisation rate in China [data chart according to NBS 1995-2008, MOHURD 2007] 3
Figure 3: Natural available water resources [data chart according to NBS 2007] 5
Figure 4: Domestic water consumption in China by province [data chart according to NBS 2007] 10
Figure 5: Water quality of surface waters [data chart according to MEP 1998-2007] 11
Figure 6: Total quantity of discharged wastewater in China since 1988 [data chart according to MEP 1998-2007] 21
Figure 7: Total number of municipal WWTPs in China [according to NBS 1995 – 2008] 22
Figure 8: Rate of treated municipal wastewater in China [data chart according to MEP 1998-2007] 23
Figure 9: Average used capacity of WWTPs in China [data chart according to MEP 1998-2007] 24
Figure 10 Rate of the used capacity of WWTPs in China [data chart according to MEP 2007] 25
Figure 11 Citywide structure of semi-centralised supply and treatment systems (left) and material and energy flows within semi-centralised supply and treatment systems (right) as example (Bieker et al. 2009; Weber et al. 2007, both modified) 30
Figure 12 Illustration of material and energy flows within a STC, taking the example of City Qingdao [Cornel et al. 2007] 32
Figure 13 Material and energy flows within a centralised system for comparison [Cornel et al. 2007] 33
Figure 14 Process chain of SBR [own drawing] 48
Figure 15 Categories of membrane filtration with different filter pore sizes (from micro-filtration to reserve osmosis) [KASEI 2008] 50

iv
Figure 16 Process scheme of the SBR pilot plant 56
Figure 17 Flow simulation in the reactor (left: without stream breakers; right: with stream breakers) 57
Figure 18 Modified injector for the pilot plant 58
Figure 19 Real flow pictures in the reactor during the filling process with clean water (1. water jet with straight outlet of ejector; 2. water jet with modified ejector; 3. stream breakers in the reactor (installed staggered above and below the injector outlet); 4. fully mixed water and air in the reactor) 59
Figure 20 Pilot plant for the scientific investigation of greywater treatment using the specially configured SBR reactor 61
Figure 21 Concentrations of the main parameters in the influents and effluents of all experimental phases (Phase II to Phase VII) (above: BOD5 [mg/L] and turbidity [NTU]; below: anionic surfactants [mg/L] and NH4-N [mg/L]) 67
Figure 22 COD [mg/L] and turbidity [NTU] of the effluent as function of the F/M ratio [kgBOD5/(kgMLSS·d)] 68
Figure 23 COD [mg/L] and turbidity [NTU] of the effluent as function of the water temperature [°C] with F/M ratios of 0.1-0.27 kgBOD5/(kgMLSS·d) (above) and of 0.04-0.09 kgBOD5/(kgMLSS·d) (below) 69
Figure 24 COD [mg/L] and turbidity [NTU] of the effluent as functions of the F/M ratio [kgBOD5/(kgMLSS·d)] in different water temperatures [°C] 70
Figure 25 Modified Ross-Miles method [DIN 53902 Part 2, ISO 696-1975] 72
Figure 26 Foaming heights of different concentrations of anionic surfactants [mg/L] in greywater according to DIN 53902 Part 2 (respectively ISO 696-1975, modified Ross-Miles method) 73
Figure 27 Adsorption of anionic surfactants [%] using two types of biomass based on the concentration of anionic surfactants [mg/L] 75
Figure 28 SVI [L/kg] as function of the F/M ratios [kgBOD5/(kgMLSS·d)] 76

v
Figure 29 SVI [L/kg] as function of the water temperature [°C] 77
Figure 30 the effluent turbidity [NTU] as function of SVI [L/kg] (above: experimental phases with F/M ratios of 0.1-0.27 kgBOD5/(kgMLSS·d), below: experimental phases with F/M ratios of 0.04-0.09 kgBOD5/(kgMLSS·d)) 78
Figure 31 the effluent turbidity [NTU] as function of SVI [L/kg] (above: 15/18°C; below: 25°C) 79
Figure 32 SVI [L/kg] and the effluent turbidity [NTU] as function of c<7.5 (c=compaction coefficient (dried solidssed. Biomass: MLSS); above: experimental phases with F/M ratios of 0.04-0.09 kgBOD5/(kgMLSS·d), below: experimental phases with F/M ratios of 0.1-0.27 kgBOD5/(kgMLSS·d)) 80
Figure 33 SVI [L/kg] and effluent turbidity [NTU] as function of c<7.5 (c=compaction coefficient (dried solidssed. Biomass: MLSS); above: experimental phases with lower average water temperatures, below: experimental phases with higher average water temperatures) 81
Figure 34 Correlations between COD [mg/L], turbidity [NTU] and suspended solids [mg/L] of the effluent 82
Figure 35 Impact of the net energy inputs [W/m³] on the effluent turbidity [NTU], tests with different water temperatures [°C] 83
Figure 36 Experiment series with polyamine dosing of 10 mg/L 84
Figure 37 Foaming before adaptation of the biomass (left); adapted biomass (right) 86
Figure 38 Tap water demand [L/(C·d)] in private households of City Qingdao [Bi 2004] 90
Figure 39 24-hour time variation curve of greywater flow rates in two published studies [Knerr et al. 2007, Eriksson et al. 2007] 92
Figure 40 24-hour time variation curve of tap water use (above: water work with supply capacity of 200,000 m³/d [Edu 2006, translated]; below: supply curve of the secondary pump station in a Chinese housing estate [Libang 2008, translated]) 93
vi
Figure 41 assumed 24-hour time-variation curves of the greywater flow rate and the flow rate of toilet flushing for the design of the GTP 94
Figure 42 Layout of the GTP, exemplified for using three SBR reactors (water and sludge flows) 101
Figure 43 Side view of the GTP, exemplified for using three SBR reactors 102
Figure 44 Increasing moving-in of the population into the catchment area compared to constant moving-in (plotted according to [Bieker 2009]) 105
Figure 45 Population-specific investment costs [€/C] of the GTP using SBR (conversion based on Reicherter (2003) and Mutschmann (1995)) 106
Figure 46 Specific operation costs of WWTPs in function of population equivalents (PE), with varied capacity utilization (adjusted and anew plotted according to [Reicherter 2003]) 107
Figure 47 specific net present value [€/(C·a)] of the GTP (52,000 inhabitants) with modular construction (different module sizes) and conventional construction (above) and the comparison in percentage using the SNPV of the conventional construction as 100% (below) 108
Figure 48 the total annual costs of the GTP with combined modular construction under the increasing development of the catchment area compared to the conventional construction (as 100%) 110
Figure 49 the specific total costs of the STC in conventional construction considering the under-loaded treatment capacity in different size of the STCs (new plotted according to Bieker (2009)) 111
Figure 50 the specific net present value (above) of GTP (208,000 inhabitants) with modular construction) and the percentage (below) compare with that (52,000 inhabitants) with both conventional as 100% (below) and modular construction 112
Figure 51 Process schemes for GTPs using BAF, MBR and SBR 115
vii
Figure 52 CO2 emission by using different fuels for power generation, [GLIZIE 2008, translated] 123
Figure 53 specific investment costs of BAFs [DM/C] as function of the treatment capacity (Capita) [price level 1995 (net), Barjenbruch 1997, modified and anew plotted] 125
Figure 54 Bench mark of membrane plants without construction part [as function of the membrane flux [m³/h], price level 2003 (net), Wedi 2005, modified] 126
Figure 55 Average investment costs of MBR plants with flux from 50 to 400 m³/h [price level 2003 (net), modified costs curve based on Wedi 2005] 127
Figure 56 Estimated specific investment costs of GTPs using BAF, MBR and SBR 129

viii
ix
List of Table
Table 1: calculated WIUIs, exemplarily presented for Beijing, Shanghai und Qingdao; based on the published statistical data [BJBS 2008, BWRB 2008, SHHBS 2008, SHHWRB 2008, QD 2007, QWCB 2009] 8
Table 2: calculated WIUIs concerning the regional water quantity (cp. Table 1) and water quality, exemplarily presented for Beijing, Shanghai und Qingdao based on the published statistical data [BJBS 2008, BWRB 2008, SHHBS 2008, SHHWRB 2008, QD 2007, QWCB 2009] 13
Table 3: Chinese guideline for the discharge of treated municipal wastewater [GB 18918-2002] 19
Table 4: German guideline for the discharge of treated municipal wastewater [AbwV 2004] 20
Table 5: Water quality standard for urban miscellaneous water consumption [GB/T 18920-2002 (excerpts translated)] 36
Table 6: Water quality standard for scenic environmental use [GB/T 18921-2002 (excerpts translated)] 37
Table 7: Standard for irrigation water quality [GB 5084-2005 (excerpts translated)] 38
Table 8: Water quality standard for groundwater recharge [GB/T 19772-2005 (excerpts translated)] 39
Table 9: Greywater characteristics in different investigations (I) – discharge from baths/shower and hand wash basins 41
Table 10: Greywater characteristics in different investigations (II) – discharge from baths/shower, hand wash basins and washing machines 42
Table 11: Key parameters for dimensioning BAF in municipal WWTPs [DWA 2000, summarised] 46
Table 12: Suggested design parameters of BAF with sub-continuous backwash for a large-scale greywater treatment plant [Meda et al. 2009] 48

x
Table 13: Consumption statistics of washing products in Germany [Henkel 2005] 62
Table 14: Operation parameters of the SBR pilot plant 65
Table 15: Physical and chemical parameters of greywater for the design of the biological treatment process according to [based on GB 50014-2006] 95
Table 16: Overview of the design input data 97
Table 17: Design results of the GTP, exemplified for using three SBR reactors 98
Table 18: Installed machinery in the GTP using SBR process 103
Table 19: Comparison under technical aspects [BMBF 2009, translated] 117
Table 20: Comparison of ecological aspects 124

xi
Abbreviation BAF biological aerated filters CAPEX capital expenditure GTP greywater treatment plant MBR membrane bioreactors OPEX operating expense SBR sequencing batch reactor SNPV specific net present value STC semi-centralised supply and treatment centre SSTS semi-centralised supply and treatment systems WWTP wastewater treatment plant
BOD5 [mg/L] biochemical oxygen demand in five days CODCr /COD [mg/L] chemical oxygen demand (using potassium-dichromate as oxidant according DIN) DS [kg/m³, g/L] dried solids DO [mg/L] dissolved oxygen F/M ratio [kgBOD5/(kgMLSS·d)] food/mass ratio HRT [h] hydraulic retention time mC [h] number of cycles per day MLSS [kg/m³, g/L] mixed liquor suspended solids Ntotal [mg/L] total nitrogen Ptotal [mg/L] total phosphorus Qd, total [m³/d] daily total flow rate Q18h-average [m³/h] 18 hours average flow rate SS [mg/L] suspended solids SRT [d] sludge retention time SVI [L/kg] sludge volume index TDS [mg/L] total dissolved salts tC [h] total cycle time in SBR reactors tR [h] active reaction period in SBR reactors tF [h] filling period in SBR reactors tS [h] sedimentation period in SBR reactors tD [h] discharge period in SBR reactors
xii
VER [%] volume exchange ratio WIUI [%] Water Intensity Use Index


Chapter 1 Background and objectives 1
1 Background and objectives Since 1978 (the beginning of the economic reform), the rapid economic growth in China with annual increase of more than 10% on average is getting more and more attention worldwide. Besides the economic development, there are many new challenges, which have been neglected in the last thirty years. Problems such as the reform of social systems, environmental pollution, etc., must be con-sidered and focused on intensively. Many conflicts prevail between further eco-nomic development and environmental protection. Current environmental prob-lems, e.g. air pollution, desertification, sand storms, over-exploitation and pollu-tion of both surface water resources and groundwater, vary regionally, depend-ing on geographic conditions and economic activities. Thus, locally adapted solutions are asked for. While Northern China is confronted with severe water scarcity, over-exploitation of water resources, desertification and migration of sand storms, etc., Southern China is suffering under excessive pollution of avail-able water resources, increasing flood and extreme weather events [CMA 2007-2009]. 1.1 Development of population and urbanisation in China With ongoing industrialisation and economic development, urbanisation which describes the population in the cities, increased parallel to the further growth of the overall population. From 1952 to 2007, the total Chinese population in-creased from almost 600 million to over 1.3 billion. Within 56 years, the popula-tion growth in the cities was about 520 million in total. After 1996, there was politically accelerated urbanisation. Until 2007, the population growth in Chi-nese cities was about 220 million within 10 years (see Figure 1).

Chapter 1 Background and objectives 2
0
500
1000
150019
52
1957
1970
1980
1990
2000
2007
mil
lion
inha
bita
nts
city rural
ca. 300 m.
ca. 220 m.
Figure 1: Population development in Chinese cities [data chart according to NBS 1995-2008, MOHURD 2007]
The more people live in cities in comparison to rural areas, the higher is the urbanisation rate. The registration as “urban” population is strictly controlled by the Chinese government. In the last 55 years, the urbanisation rate increased from 12.5% in 1952 to 45% in 2007. In 1996, about 30% of the total population in China was registered as urban population. Within 12 years (1996 – 2007), the urbanisation rate increased 14.5% while in the previous period (1952 – 1995) the urbanisation rate had increased 18% within 44 years (see Figure 2). Due to the strictly controlled immigration into the cities, the urbanisation of Chinese cities has developed in a different manner compared to the urbanisation process observed in Western European cities.

Chapter 1 Background and objectives 3
0%
20%
40%
60%
80%
100%19
52
1957
1970
1980
1990
2000
2007
city rural
18%
14.5%
Figure 2: Development of the urbanisation rate in China [data chart according to NBS 1995-2008, MOHURD 2007]
“City” is defined as large mounts of houses and buildings, in which the people live and work with own administrations [Langenscheidts 1999]. According to Chinese Law of City Planning [MOHURD 1989] and GB/T 50280-98, the cities in China are established by National Administration Authorities. According to GB 50223-2008 [MOHURD 2008], the size of the cities is de-fined by population registered as “urban” population. The cities with less than 200,000 inhabitants are “small” cities; with from 200,000 to 500,000 inhabitants are “middle” cities; with from 500,000 to one million inhabitants are “large” cities; and with more than one million in-habitants are “mega” cities. In 1949, when the People's Republic of China was founded, there were 132 cities [NBS 1996]. The political restructuring of the cities in 1995 and 1996 went along with an atypically rapid growth of the cities and thus the urban population within the last thirteen years. In 1995, there were already 640 cities [NBS 1996]. However, the number of cities did not increase significantly thereafter, and in 2007 there were total 655 cities [NBS 2008]. The significant increase in urban population due to political restructuring was first observed in 1996 (see Figures 1 and 2). Since then, the urban population has increased rather than the number of cities.
Chapter 1 Background and objectives 4
Despite the rapidly city growth, urbanisation rates of 45% are relatively low compared to those of industrialized countries. According to published statistics, the average urbanisation rate in Europe is 76.6% [Wandinger 2001] and 88% in Germany [SBD 2004]. The fast increase in urban population in short periods of time not only includes the increasing of the population in cities, but also increas-ing numbers of cities and, in particular an excessive growth of the cities. The politically related restructuring of the cities is an accelerated urbanisation, which is different than the development in industrialised countries, where it took more than a century to reach these high urbanisation rates. Calculating the overall increase in the population of 655 cities, on average Chi-nese cities grew about 33,000 inhabitants per year per city. Considering urbani-sation rates on a regional basis, in the coastal regions of China (14 cities and 4 special economic regions) including the four autonomic cities (Beijing, Shanghai, Tianjin and Chongqing), there has been an increase of about 180,000 inhabitants per year per city on average. For example, in Shanghai the population increased from 16 million in 2000 and to 18.2 million in 2006, i.e. an annual increase of approximately 345,000 inhabitants on average. Furthermore, the actually in-crease from 2006 to 2007 was about 430,000 residents. These published statistic data concerning the population registered as city status do not include inhabitants in the 22 cities who live there permanently, but with-out corresponding registration, e.g. migrant workers. It is estimated that due to these unregistered inhabitants the real number of the inhabitants in cities and urban areas is about 35 % higher than published in the official statistics [NBS 2008, SHHBS 2008, BJBS 2008]. 1.2 Natural water resources V.S. water consumption According to the Chinese statistical yearbook 2007, the available natural water resources were 1,916 m³/(C·a) on average without the quantities of precipita-tion. At first view, these data do not indicate any water scarcity, which is defined as the average available quantity of water resources per capita and year includ-ing the precipitation [Jimenez et al. 2008]:

Chapter 1 Background and objectives 5
> 1,700 m³/(C·a) no water stress 1,700 – 1,000 m³/(C·a) water stress 1,000 – 500 m³/(C·a) permanent water scarcity < 500 m³/(C·a) absolute water scarcity.
However, looking at the regional distribution of natural water resources in the Chinese provinces, the situation becomes clearer. As Figure 3 shows, over 50% of all 31 provinces of China are suffering from water shortage, about 26% (eight provinces) in Central East China are suffering from absolute water scarcity, about 10% (three other provinces) are seriously affected with permanent water scar-city. The water scarcity covers almost the entire north-eastern part of China, where is also the most important economic areas of China.
Figure 3: Natural available water resources [data chart according to NBS 2007]

Chapter 1 Background and objectives 6
As Figure 3 only summarizes the provincial data, the acute water scarcity in urban areas cannot be seen from this illustration. To introduce the water scarcity in urban areas more clearly, the Water Use Intensity Index is used for the follow-ing discussion. The Water Intensity Use Index (WIUI, [Jimenez et al. 2008]) describes the ratio of the total water demand to the total available water resources (sum of the natural available water resources and the annual quantities of precipitation) in percentage. The higher the WIUIs, the graver the acute water scarcity in the respective areas is. To demonstrate the situation of acute water scarcity in Chi-nese urban areas, WIUIs are calculated exemplarily for three cities (Beijing, Shanghai and Qingdao) each with the respective region and the densely urban area (city centres). The three cities are chosen concerning their regional repre-sentation (north and south of China) of the water resources and water demands as well as concerning the different city sizes (metropolis and medium-size city). Beijing is a typical metropolis in the north of China, showing absolute water scarcity with regard to the available natural water resources of 148 m³/(C·a) (see Figure 3 in blue cycle above). Thereof, only 16% are surface water [BWRB 2008]. Two large water reservoirs (Reservoir Guanting and Reservoir Miyun), located 138 km and 65 km, respectively, from the city centre of Beijing are – together with groundwater – the main supply sources. In 2007, the available amounts of water from the two water reservoirs declined 30% and 47%, respec-tively [BWRB 2008]. The groundwater in the whole Region Beijing was over-utilized, and its level declined from about 5 m in 1980 to 22.8 m in 2007 below surface [BWRB 2008]. In 2007, the total water demand amounted to 217 m³/(C·a) in the Beijing region [NBS 2007]. About 50% of the total water consumption (108.5 m³/(C·a)) were used in urban areas, the remaining is used in industry and agriculture [BWRB 2008]. Shanghai is a typical metropolis in South China. The available natural water resources in Shanghai amounted to 188 m³/(C·a) (see Figure 3 in blue cycle below) [NBS 2007]. Flowing waters, such as Yangtze River, add sufficient quan-tities of surface water to the apparently scarce quantities of water resources in the region Shanghai [SHHWRB 2008]. However, in the statistics, these water resources are not counted as local natural water resources. The water supply in Shanghai was mainly (99.7%) covered by surface water resources

Chapter 1 Background and objectives 7
[SHHWRB 2008]. With 655 m³/(C·a) the total water demand was in the Region Shanghai is comparably high [NBS 2007]. This is mainly caused by a high degree of industrialisation and partly by densely populated urban areas. Only 19% (124.5 m³/(C·a)) were urban consumption, the remaining was used in industry and agriculture [SHHWRB 2008]. Qingdao is a typical medium-sized city in Northeast China. The available natural water resources in Qingdao amounted to about 370 m³/(C·a) [QWCB 2009]. For water supply, about 56% were used from surface water and 44% from ground-water. A very small percentage (0.2%) was covered by desalinated sea water and only used in industry. The total water demand was about 114 m³/(C·a) in the Region Qingdao [QWCB 2009]. 39% of the total water demand (44.5 m³/(C·a)) was used in urban areas, the remaining was used in industry and agriculture [QWCB 2009]. Based on the statistical data on water resources presented before, water demand [m³/(C·a)] and total population [C], the respective surface area [km²] and an-nual precipitation quantities [mm/a], WIUIs are calculated for the following four cases: WIUI (I): based on total water demand and available natural water re-
sources in the region; WIUI (II): based on total water demand and total available water resources
in the region; WIUI (III): based on urban water demand and available natural water re-
sources in urban areas (city centres); WIUI (IV): based on urban water demand and total available water re-
sources in urban areas (city centres). It is assumed that a maximum of 50% of the annual precipitation quantities can be collected and contribute to the general water supply as part of the total avail-able water resources. Jimenez et al. (2008, Page 6) supposed that a WIUI of > 20% means acute water scarcity in the respective regions and that these regions therefore have severe water supply problems. Regardless of previous planning, they are forced to reuse water, to overexploit groundwater and to desalinate sea water. Integrated water management programs, including water reuse are essential for the economic development [Jimenez et al. 2008].

Chapter 1 Background and objectives 8
Table 1: calculated WIUIs, exemplarily presented for Beijing, Shanghai und Qingdao; based on the published statistical data [BJBS 2008, BWRB 2008, SHHBS 2008, SHHWRB 2008, QD 2007, QWCB 2009]
Beijing Shanghai Qingdao No.
city centre
region city
centre region
city centre
region
1 inhabitants [millions]
10.1 16.3 6.5 18.4 2.8 8.4
2 area [m²] 1,368 16,410 289 6,341 253 10,654 3 precipitation
[mm/a] 480 484 k. A. 1,209 1,239 942
4 quantity ofprecipitation ([m³/(C·a)], 2X3)
657 7941 54 418 112 1,195
5 available natu-ral water re-sources [m³/(C·a)]
148 188 169 370
6 total available water re-sources ([m³/(C·a)], 50% X 4+5)
477 4,119 215 397 225 968
7 total water demand [m³/(C·a)]
217 655 114
8 urban water demand [m³/(C·a)]
109 125 45
9 WIUI (I) – (7/5)
147% 348% 31%
10 WIUI (II) – (7/6)
--- 5% --- 165% --- 12%
11 WIUI (III) – (8/5)
46% --- 66% --- 26% ---
12 WIUI (IV) – (8/6)
23% --- 58% --- 20% ---

Chapter 1 Background and objectives 9
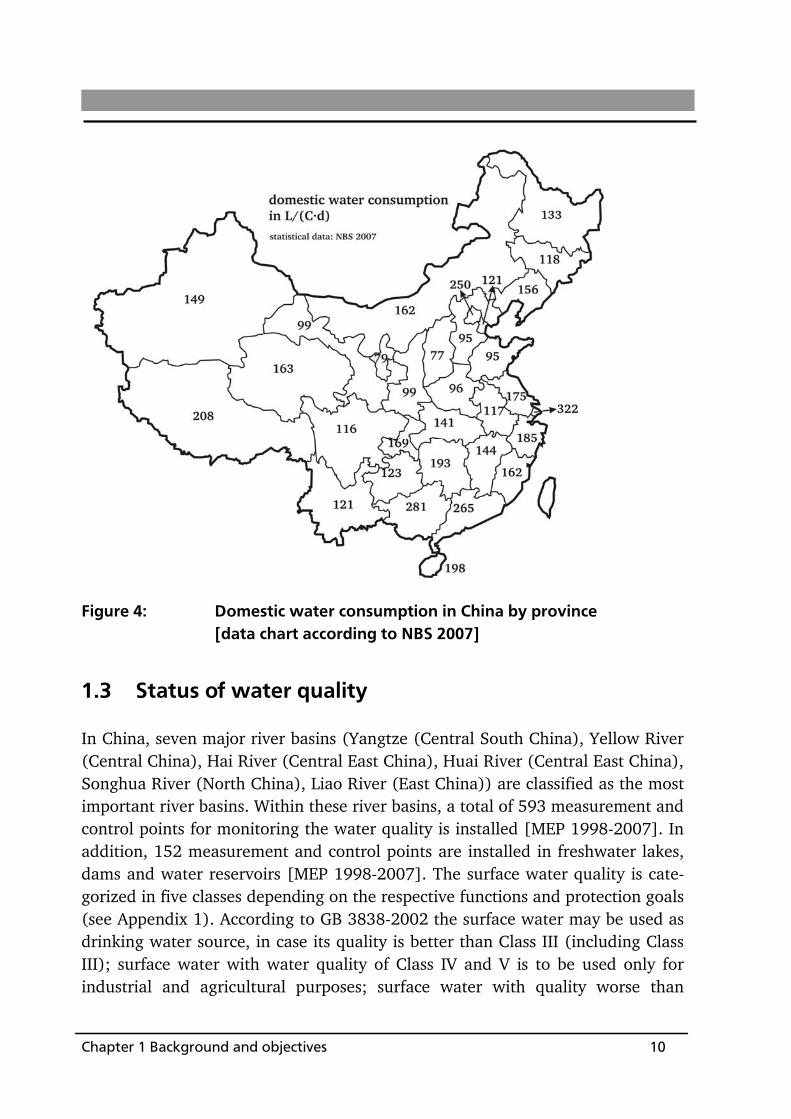
The exemplary calculations show that absolute water scarcity occurs in densely populated urban areas – the "city centres" – in all three cities despite different conditions of available water resources. Even in the case that 50% of the rainfall is collected and used, the WIUIs in urban areas would still be high. The urban water scarcity in mega cities (Beijing, Shanghai) is more severe than in the me-dium-sized city (Qingdao). The general urban water demand, including domestic water use, small industries and other intra-urban uses, increased from 2000 to 2007. The ongoing improve-ment of living conditions leads to the continuous increase of the domestic water demand. The average domestic water demand in China amounted to 125 L/(C·d) in 2000 and 148 L/(C·d) in 2007 [NBS 2007]. The water demand varies region-ally, from just 80 L/(C·d) up to 322 L/(C·d) (see Figure 4). The large range de-pends not only on the available local water resources, but also on the regionally different way of living and living standards. In provinces with natural water resources less than 500 m³/(C·a), the domestic water demand is less than 100 L/(C·d) in the respective region, with the exception of Beijing, Tianjin and Shanghai (see Figures 3 and 4). The domestic water demand of these three cities is extremely high with respect to the available water resources, i.e. absolute water scarcity (<200 m³/(C·a), cp Figure 3).
Chapter 1 Background and objectives 10
Figure 4: Domestic water consumption in China by province [data chart according to NBS 2007]
1.3 Status of water quality In China, seven major river basins (Yangtze (Central South China), Yellow River (Central China), Hai River (Central East China), Huai River (Central East China), Songhua River (North China), Liao River (East China)) are classified as the most important river basins. Within these river basins, a total of 593 measurement and control points for monitoring the water quality is installed [MEP 1998-2007]. In addition, 152 measurement and control points are installed in freshwater lakes, dams and water reservoirs [MEP 1998-2007]. The surface water quality is cate-gorized in five classes depending on the respective functions and protection goals (see Appendix 1). According to GB 3838-2002 the surface water may be used as drinking water source, in case its quality is better than Class III (including Class III); surface water with water quality of Class IV and V is to be used only for industrial and agricultural purposes; surface water with quality worse than
Chapter 1 Background and objectives 11
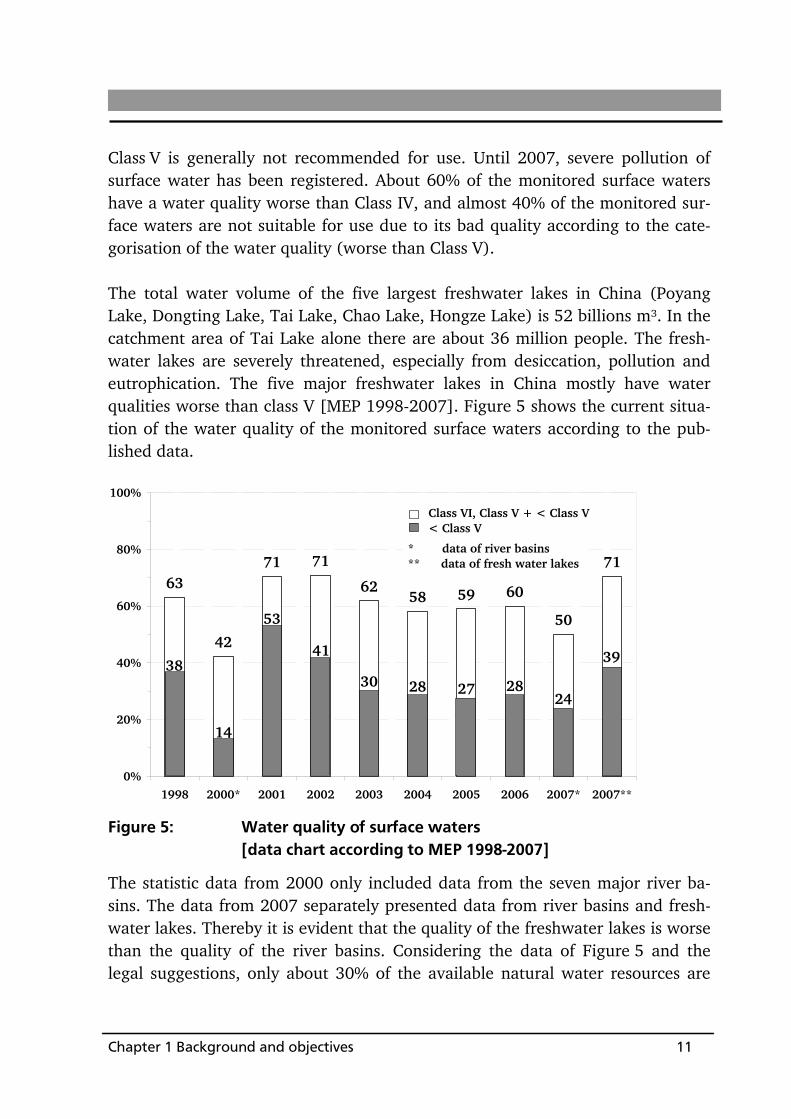
Class V is generally not recommended for use. Until 2007, severe pollution of surface water has been registered. About 60% of the monitored surface waters have a water quality worse than Class IV, and almost 40% of the monitored sur-face waters are not suitable for use due to its bad quality according to the cate-gorisation of the water quality (worse than Class V). The total water volume of the five largest freshwater lakes in China (Poyang Lake, Dongting Lake, Tai Lake, Chao Lake, Hongze Lake) is 52 billions m³. In the catchment area of Tai Lake alone there are about 36 million people. The fresh-water lakes are severely threatened, especially from desiccation, pollution and eutrophication. The five major freshwater lakes in China mostly have water qualities worse than class V [MEP 1998-2007]. Figure 5 shows the current situa-tion of the water quality of the monitored surface waters according to the pub-lished data.
71
50
60595862
7171
42
63
0%
20%
40%
60%
80%
100%
1998 2000* 2001 2002 2003 2004 2005 2006 2007* 2007**
Class VI, Class V + < Class V< Class V
38
14
53
41
30 28 27 28
39
24
* data of river basins** data of fresh water lakes
Figure 5: Water quality of surface waters [data chart according to MEP 1998-2007]
The statistic data from 2000 only included data from the seven major river ba-sins. The data from 2007 separately presented data from river basins and fresh-water lakes. Thereby it is evident that the quality of the freshwater lakes is worse than the quality of the river basins. Considering the data of Figure 5 and the legal suggestions, only about 30% of the available natural water resources are

Chapter 1 Background and objectives 12
suitable for the production of drinking water, i.e. 575 m³/(C·a) on average for overall China (cp Chapter 1.2). Therefore, in general, the chronic water stress in China is caused by the bad quality of the surface waters. In China, the protection and utilization of water resources was regulated compa-rably late [bfai 2006]. By now, the legal frameworks are relatively clearly de-fined. Nonetheless, pollution and wasting of water resources are a daily occur-rence until today, because punitive measures defined in regulations and frame-works can only grasp via regular and intensive controls. However, the relevant institutions, i.e. Ministry of Environmental Protection (MEP, former SEPA) and the Ministry of Water Resources (MWR) which are entrusted with these tasks, have neither the personnel, nor technical, nor institutional sources to push the environmental protection against local economic interests [bfai 2006]. Below, the examples of Beijing, Shanghai and Qingdao are looked at closer with regard to water quality and the regional situation of water resources based on Table 1. In Beijing, 40% of the surface water is classified worse than Class V, 5% are within Class IV and Class V, and only 55% in class I to class III [BWRB 2008]. Groundwater from the deeper aquifers which is used for the Beijing water supply shows the following qualities: 18% of the groundwater had the quality bad to very bad, 82% were medium to very good. Groundwater from the first aquifer was classified: 39% had the water quality bad to very bad, 61% were medium to very good [BWRB 2008]. This means that there were only 97 m³/(C·a), equiva-lent to about 66% of the total natural water resources, were suitable for drinking water production (cp Table 1 and Figure 3). In Shanghai, more than 56% of the surface water was classified worse than Class V, 31% were Class IV and Class V, and only 13% were Class I to Class III [SHHWRB 2008]. This means, in the whole city of Shanghai the usable water resources were 24 m³/(C·a) theoretically, i.e. 13% of the total natural water resources are suitable for drinking water production (cp Table 1 and Figure 3). The large deficits of the water demand in Shanghai can be only partly covered by water from the Yangtze River due to lacking of the water transport infrastructure from Yangtze River to the respectively water works.

Chapter 1 Background and objectives 13
In Qingdao, 41% of the surface water was classified as Class I to Class III. 41% of the groundwater showed a quality medium to very good [QWCB 2009]. Thus, the natural water resources in the whole region of Qingdao for drinking water production actually available were about 152 m³/(C·a), and in city centre about 69 m³/(C·a), corresponding to 41% of total natural resources. Based on the usable water resources, the situation of water scarcity in urban areas (WIUIs), as exemplarily, is more severe than shown in Table 1 (see Ta-ble 2).
Table 2: calculated WIUIs concerning the regional water quantity (cp. Table 1) and water quality, exemplarily presented for Beijing, Shanghai und Qingdao based on the published statistical data [BJBS 2008, BWRB 2008, SHHBS 2008, SHHWRB 2008, QD 2007, QWCB 2009]
Beijing Shanghai Qingdao
city centre
region city
centre region
city centre
region
usable natural water resources [m³/(C·a)]
97 24 69 152
total usable water resources [m³/(C·a)] 426 4068 51 233 125 750
total water demand [m³/(C·a)] 217 655 114
urban water demand [m³/(C·a)]
109 125 45
WIUI (I) 224% 2729% 75%
WIUI (II) --- 5.3% --- 281% --- 15%
WIUI (III) 51% --- 519% --- 64% ---
WIUI (IV) 25.5% --- 244% --- 36% ---

Chapter 1 Background and objectives 14
1.4 Objectives The rapid growth of the urban population and the cities as well as the ongoing industrialisation lead to more and more environmental pollution due to lacking protective measures on both the governmental and the legal level. The economy is therefore more and more confronted with dramatic environmental problems. Each year, there is a large number of environmental disasters endangering hu-man life and accounting for high economic damages. Environmental problems challenge the further economic, industrial and social development and, there-fore, in the future, environmental protection must not be neglected any more. Environmental pollution, which has accumulated over the last 30 years, has to be disposed/cleaned up in future years with regard to both technical and legal measures. The Chinese water supply and sanitation infrastructure is realised mostly by the state centralised. The reform in water supply and sanitation infrastructures is mainly focused on the asset investment of treatment facilities concerning of the private-public-partnership funding models (PPP) and tariff systems, which does not include the transport infrastructure. Appropriation and construction of trans-port infrastructures are still state controlled and financed. For future urban de-velopment, supply and sanitation infrastructures (transport, energy, water, wastewater and solid wastes etc.) must be expanded. Thereby, the development of infrastructures in densely populated urban areas asks for alternative and sus-tainable concepts instead of conventional systems, which obtain their limits dur-ing the rapid urbanisation process of cities. This work presents the following topics regarding environmental challenges especially in the field of urban supply and sanitation infrastructure systems in the future development of the Chinese cities. Firstly, the need and the description of an alternative water and sanitation approach (the semi-centralised supply and treatment systems) for Chinese urban areas are outlined. Based on the presented alternative approach, an utilisation-oriented greywater treatment for urban water reuse in China and a first comparison of the treatment techniques selected ac-cording to scientific studies will be presented. The chosen technical process (SBR) for greywater treatment will be investigated in detail, and main design parameters for a large-scale plant will be deduced there from. Based on these key parameters of SBR greywater treatment, a greywater treatment plant for 52,000

Chapter 1 Background and objectives 15
inhabitants will be designed in large-scale. The technical modularisation of the greywater treatment plant will then be discussed based on results of the spatial development of the catchment area which was investigated by Bieker (2009). Finally, a second comparison in respect of technical, economic and environ-mental aspects regarding the design of the large-scale greywater treatment plant will be carried out.

Chapter 1 Background and objectives 16

Chapter 2 Semi-centralised supply and treatment systems 17
2 Semi-centralised supply and treatment systems for rapidly growing urban areas
To begin with, the current status of centralised and decentralised water supply and sanitation infrastructures and systems in China is described below. The ne-cessity of finding alternative solutions is shown thereafter. The semi-centralised supply and treatment systems (SSTS) as a potential solution will be explained briefly. The definitions of centralised, decentralised and semi-centralised systems in this work are definitions without exact statements of system sizes concerning con-nected populations. “Centralised” systems are systems applying “End-of-Pipe” technology for the whole concerned city. All potable water is purified by one large water work and distributed by one overall pipeline system; all wastewater is collected by one canalisation system and treated by one wastewater treatment plant (WWTP). “Decentralised” systems are defined as house-based (one or several houses) supply and sanitation solutions. Each decentralised system func-tions as an independent system separated to the other neighbourhoods. No large and systematically supply and sanitation facilities are applied for a large regions beyond the house-based systems. “Semi-centralised” systems are defined as district-based supply and sanitation systems. Semi-centralised systems combine the advantages of centralised and decentralised systems. In semi-centralised systems technical solutions and components are applied and the served catch-ment areas of semi-centralised systems are limited in neighbouring large residen-tial areas. 2.1 Status of centralized water supply and sanitation in-
frastructures in China In general, the urban water supply and sanitation infrastructures in China are state-run and centrally organised tasks. The regional/city administration is the legal representative and responsible for providing and safeguarding water supply and sanitation infrastructures. Investors of real estates are only responsible for the respective connection of the newly built housing estates to the centralised infrastructure systems. Published statistical data regarding water supply and sanitation infrastructures include the registered infrastructures facilities and the
Chapter 2 Semi-centralised supply and treatment systems 18
respective quantities of tap water and wastewater. In China, the connection rate of the urban centralised infrastructures – urban population with access to tap water – amounted to about 93% on average, and to generally more than 77% (regarding several different provinces [NBS 2008]). These data, however, only contain the statistics on the tap water supply in the Chinese cities. Regionally, it is allowed, to install secondary treatment facilities to improve tap water from the centralised pipelines within housing estates into a “potable” water quality. 2.1.1 Legislation and framework in China and Germany The latest Chinese guideline of drinking water quality [GB 5749-2006] comprises a total of 106 parameters (replacing 35 parameters in the older version). They include microbiological indicators, indicators for disinfection, inorganic and organic pollutants as well as odour/taste, physical and radioactive indicators. The German guideline of drinking water quality (Trinkwasserverordnung vom 21. Mai 2001) comprises a total of 96 monitoring parameters. The limit values of the monitored parameters are comparable in both guidelines. The limit values of the latest Chinese guideline (see Table 3) for the discharge of treated municipal wastewater are similar to the German guidelines. However, they are categorised depending on the classification of the receiving water bodies (cp Appendix 1), whereas the limit values are classified according to their daily treated BOD5 loads according to the German guideline [AbwV 2004].
Chapter 2 Semi-centralised supply and treatment systems 19
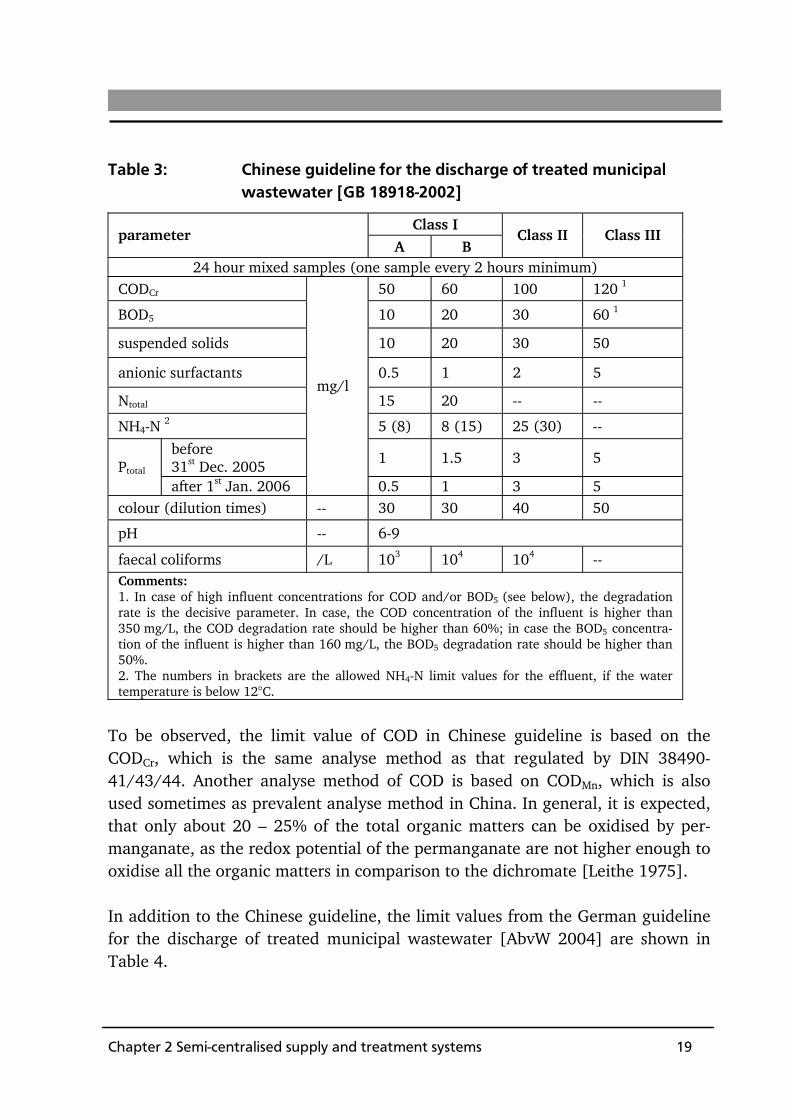
Table 3: Chinese guideline for the discharge of treated municipal wastewater [GB 18918-2002]
Class I parameter
A B Class II Class III
24 hour mixed samples (one sample every 2 hours minimum) CODCr 50 60 100 120 1
BOD5 10 20 30 60 1
suspended solids 10 20 30 50
anionic surfactants 0.5 1 2 5
Ntotal 15 20 -- --
NH4-N 2 5 (8) 8 (15) 25 (30) --
before 31st Dec. 2005 1 1.5 3 5
Ptotal
after 1st Jan. 2006
mg/l
0.5 1 3 5 colour (dilution times) -- 30 30 40 50
pH -- 6-9
faecal coliforms /L 103 104 104 -- Comments: 1. In case of high influent concentrations for COD and/or BOD5 (see below), the degradation rate is the decisive parameter. In case, the COD concentration of the influent is higher than 350 mg/L, the COD degradation rate should be higher than 60%; in case the BOD5 concentra-tion of the influent is higher than 160 mg/L, the BOD5 degradation rate should be higher than 50%. 2. The numbers in brackets are the allowed NH4-N limit values for the effluent, if the water temperature is below 12°C.
To be observed, the limit value of COD in Chinese guideline is based on the CODCr, which is the same analyse method as that regulated by DIN 38490-41/43/44. Another analyse method of COD is based on CODMn, which is also used sometimes as prevalent analyse method in China. In general, it is expected, that only about 20 – 25% of the total organic matters can be oxidised by per-manganate, as the redox potential of the permanganate are not higher enough to oxidise all the organic matters in comparison to the dichromate [Leithe 1975]. In addition to the Chinese guideline, the limit values from the German guideline for the discharge of treated municipal wastewater [AbvW 2004] are shown in Table 4.

Chapter 2 Semi-centralised supply and treatment systems 20
Table 4: German guideline for the discharge of treated municipal wastewater [AbwV 2004]
COD BOD5 NH4-N Ntotal Ptotal
[mg/L] classification of wastewater treatment plants
qualified samples or 2-hour mixed samples
I < 60 kgBOD5/d 150 40 -- -- --
II 60 – 300 kgBOD5/d 110 25 -- -- --
III 300 – 600 kgBOD5/d 90 20 10 -- --
IV 600 – 6000 kgBOD5/d 90 20 10 18 2
V > 6000 kgBOD5/d 75 15 10 13 1
The control parameters in the German AbwV 2004 include only chemical pa-rameters, whereas the Chinese GB 18918-2002 also contains several physical monitoring parameters as well as microbial parameters and a limit value for anionic surfactants. However, sampling intervals as defined in the Chinese guide-line are less strict than those of the German guideline. The classifications Class IA and IB are more often assigned to sensitive water bodies (as receiving waters) to avoid the further deterioration of the quality of the natural water bodies. Besides, the limit values for both classes (Class IA und Class IB) are very strict and even stricter than those of the AbwV 2004. Even so, the ongoing deterioration of the quality of the water bodies could not be stopped, as the penalties regularised by laws could only be enforced by intensive controls. These, however, are only ef-fective in severe cases of damage, but not on a day-to-day basis.

Chapter 2 Semi-centralised supply and treatment systems 21
2.1.2 Quantity of wastewater Since the 1980s, the development of urban infrastructure in China, especially in the water supply and sanitation sector, mainly follows the conventional central-ised “End-of-Pipe” system. Housing estates and other urban buildings are pro-gressively connected to centralised supply and sanitation infrastructure systems. The total annual quantity of municipal wastewater was continuously increasing, whereas the total annual quantity of industrial wastewater decreased slightly and stayed at a stable level in spite of the increasing industrialisation (see Figure 6).
0
10
20
30
40
1988
1994
2000
2006
bill
ion
m³
municipal industrial
Figure 6: Total quantity of discharged wastewater in China since 1988 [data chart according to MEP 1998-2007]
Since 1999, the total quantity of municipal wastewater has exceeded the total quantity of industrial wastewater. The quantity of municipal wastewater has increased more than 30% from 1999 to 2007. In 2007, the total quantity of mu-nicipal wastewater was 31 billion m³, whereas the quantity of industrial waste-water was approximately 25 billion m³ (as indirect dischargers). Hereby, two facts play a decisive role. Controls and monitoring of the discharge of treated wastewater by large industrial enterprises, especially in large industrial parks, are very strict. On the one hand, industrial wastewater treatment is in the direct responsibility of the respective company (“pollution source”). This means,
Chapter 2 Semi-centralised supply and treatment systems 22
regulatory control and monitoring of indirect dischargers can be carried out very efficiently. On the other hand, during the last years, industrial production tech-nologies have progressed enormously and internal water reuse incorporated in production processes is aimed at, thus the water consumption per production unit is reduced significantly. The total water consumption and the quantity of industrial wastewater therefore remain at a relatively stable level. 2.1.3 Status of centralized municipal wastewater treat-
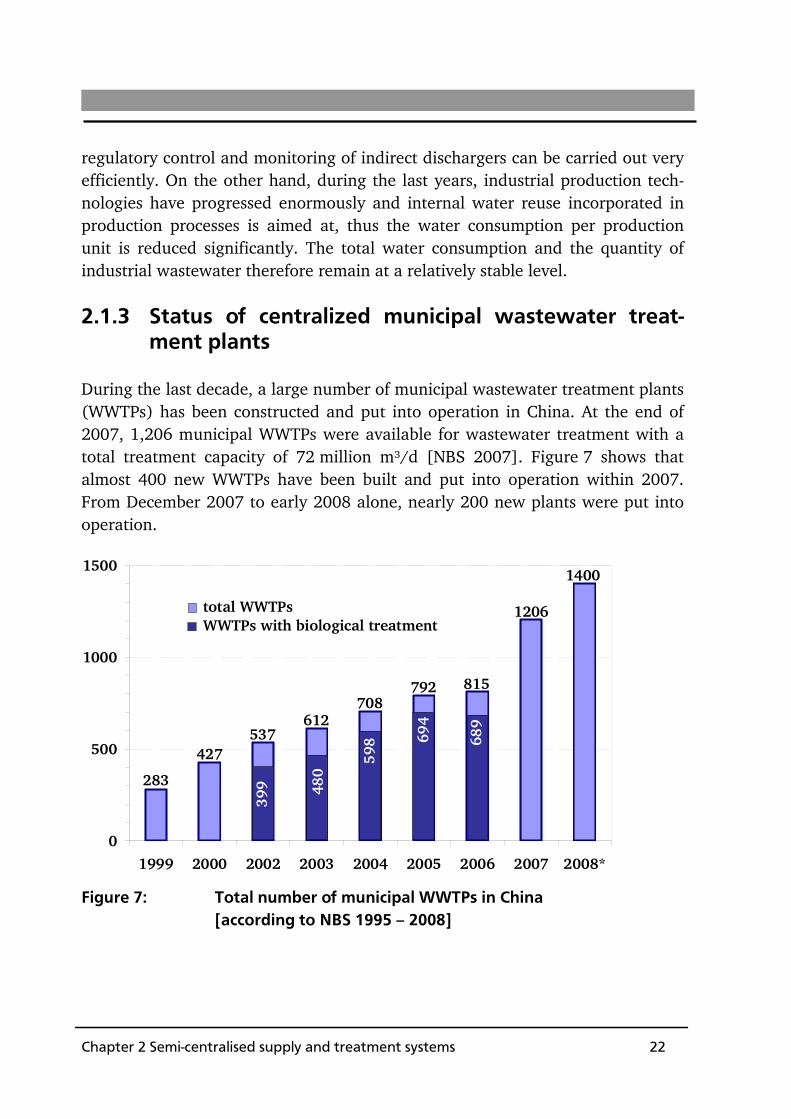
ment plants During the last decade, a large number of municipal wastewater treatment plants (WWTPs) has been constructed and put into operation in China. At the end of 2007, 1,206 municipal WWTPs were available for wastewater treatment with a total treatment capacity of 72 million m³/d [NBS 2007]. Figure 7 shows that almost 400 new WWTPs have been built and put into operation within 2007. From December 2007 to early 2008 alone, nearly 200 new plants were put into operation.
283
427
1400
1206
815792708
612537
0
500
1000
1500
1999 2000 2002 2003 2004 2005 2006 2007 2008*
total WWTPsWWTPs with biological treatment
399 48
0
598 69
4
689
Figure 7: Total number of municipal WWTPs in China [according to NBS 1995 – 2008]

Chapter 2 Semi-centralised supply and treatment systems 23
Until 2006, 84% of the municipal WWTPs were equipped with biological treat-ment processes. Since then, newly built WWTPs must be fitted with biological treatment processes, as required national regulations. Older municipal WWTPs without biological treatment processes must be upgraded during expansion and reconstruction phases. Newly constructed and upgraded municipal WWTPs, however, can only contrib-ute very limitedly to improving the environmental situation. The statistical data on treated wastewater volumes are based on the collected wastewater quantities. This means, the municipal wastewater which has not been collected via existing sewer systems or due to lacking sewer systems, was not included in published statistical data. In 2007, nearly 50% of the collected municipal wastewater were treated. From 2001 to 2007, the average rate of treated wastewater increased more than 30% (see Figure 8).
49,143,8
18,522,3 25,8
32,337,4
0%
20%
40%
60%
80%
100%
2001 2002 2003 2004 2005 2006 2007
Figure 8: Rate of treated municipal wastewater in China [data chart according to MEP 1998-2007]
The total treatment capacity of the WWTPs increased from 12 million m³/d in 1999 to 72 million m³/d in 2007, while the total quantity of municipal wastewa-ter increased from 55 million m³/d to 85 million m³/d [MEP 1998-2007]. How-ever, as the capacity utilization of the existing WWTPs did not increase as much, the average rate of treated wastewater did not increase at the same time. The

Chapter 2 Semi-centralised supply and treatment systems 24
analysis of the statistical data of the existing WWTPs showed that the average capacity utilization of the WWTPs was only about 63% in 2001 and increased to 74% in 2007 (see Figure 9, [MEP 1998-2007]).
73,967,667,764,761,962,7
0%
20%
40%
60%
80%
100%
2002 2003 2004 2005 2006 2007
Figure 9: Average used capacity of WWTPs in China [data chart according to MEP 1998-2007]
Generally, a WWTP with 80% capacity utilization is considered as fully-utilised, as 20% of the intended treatment capacity should be left as buffer capacity of a WWTP. Looking in detail at the capacity utilization of the WWTPs in China, there was a total of 1,178 municipal WWTPs based on the data from November 2007 [MEP 2007], thereof only about 50% are fully utilised (see Figure 10).

Chapter 2 Semi-centralised supply and treatment systems 25
0%
5%
10%
15%
20%
25%<
10%
~ 2
0%
~ 3
0%
~ 4
0%
~ 5
0%
~ 6
0%
~ 7
0%
~ 8
0%
~ 9
0%
~ 1
00%
>10
0%
utilised capacity of WWTPs
Figure 10 Rate of the used capacity of WWTPs in China [data chart according to MEP 2007]
According to the annual reports of the Chinese Ministry of Environmental Protec-tion in 2007, most of the existing WWTPs are under-utilised as a result of lacking sewer systems. The construction of municipal sewer systems is a centralised governmental task and their realizations (both financial and constructional) are much slower than the construction of municipal WWTPs. In 2007, in the Chinese cities the overall length of the centralised sewers was 261,000 km [MOHURD 2007], as comparison to about 515,000 km in Germany according to WVGW (2008). Thereby, one has to take into account that Germany is 27 times smaller than China with regard to the total surface area. Li et al. (2008) reported that the technical performance was sufficient in only 50% of the municipal WWTPs in China. 50% of the WWTPs in 68 cities fulfilled the quality requirements for the discharge of treated wastewater, and only 8% of the WWTPs in the other 590 cities [Li et al. 2008]. Municipal WWTPs have be-come part of the pollution sources because of the strong deficits in their opera-tion. Fu et al. (2008) reported that the Chinese urban water sector has long been operated and managed as a welfare system. The lack of capital is one of the main problems that Chinese water sector faces. The government is still in full charge of

Chapter 2 Semi-centralised supply and treatment systems 26
the water and wastewater infrastructures. For national security reasons, the tap water pipeline and the sewer systems are currently completely excluded from the sectoral reform of the water infrastructure system. The diverse experimental financing models regarding the asset investment are not applied to those of the pipeline and sewer systems. Almost all of the possible financing models were utilized within the 17 case studies, which were reported and investigated by Fu et al. (2008) as examples of the reform. However, there were no examples con-sidering the reform of the financing model in the construction of the tap water pipelines and the sewer systems. Due to this fact, the development of the pipeline systems for tap water and the sewer systems for wastewater are not in the same status of the reform of tap water production and wastewater treatment plants. This difference led to a much more sophisticated level of the development of the treatment facilities than that of the tap water pipelines and the sewer systems. The current public water tariff system consists of four parts and is adjusted dif-ferently to the respective regional water pricing systems. In April 2004, the State Council issued the notice on promoting a water pricing reform, promoting water saving measures and protecting water resources. Furthermore, the four compo-nents of urban water pricing are defined: the water resource fee, the price of water engineering, the urban water price and the wastewater treatment fee. According to [Fu et al. 2008], the existing water tariff system actually includes only two or maximal three fractions instead of the mentioned four fractions of the fee system. The public hearing procedure is one of the permission processes for general tariff systems regarding public affairs in China. Both their application and changes must be granted by the public hearing procedures first. Regarding tariff systems within the urban water sector, up to now, most cities only ask for wastewater treatment fees into the public hearing procedure. However, a few cities are in the process of including the water resource price in the public hear-ing procedure [Fu et al. 2008]. The current price for domestic water consumption including the wastewater treatment fee is 1.5 – 3.5 Yuan/m³ (0.15 – 0.35 Cent/m³). Thereby, the waste-water treatment fee is about one third of the total price. As up to now the service pipe networks (tap water pipeline and sewer systems) are in the central respon-sibility of the Chinese government, service costs of investment and maintenance for pipe networks are not provided for in the water tariff system. However, the majority of assets in the urban water sector is tied up in property, of which pipe-

Chapter 2 Semi-centralised supply and treatment systems 27
line assets account for over 50% [Fu et al. 2008]. These huge fixed costs and the subsequently slower progress in the reform of the financial and operating models of the pipeline infrastructures slow down the entire progress in the urban water sector and burden the governmental foundation of water infrastructures more and more [Fu et al. 2008]. As long as the current water tariff system is not changed, water supply in China cannot be operated cost efficiently. 2.2 Status of the decentralized water sector in China As explained above, centralised water supply and sanitation systems are common practise in China. Decentralised and privatised supply of tap water is forbidden by law [Chinese Water Act (2002); Chinese Directive for Urban Water Supply (1994)]. There are few exceptions. With a special authorisation procedure, large industrial companies may install and operate their own water treatment plant, separately from the centralised water supply systems. In this way, the enormous industrial water consumption does not stress the centralised supplying pipelines. Furthermore, because of the high population density in Chinese cities there are currently few practical examples regarding totally decentralised water supply and sanitation systems. More and more approaches regarding decentralised solu-tions or combined decentralised and centralised solutions are discussed with the relocation of the further economic development from cities to the urban-rural and even the rural areas. One example thereof is the model project “Eco-Town: Erdos” in the province Inner Mongolia. A decentralised wastewater drainage, treatment and waste treatment facility was installed in a large housing estate with currently 2,500 inhabitants (to be expanded to 7,000 inhabitants in the future). In this model project, faeces, urine and greywater are discharged via different pipes. Faeces and urine are stored for waste composting and planned to be used in agriculture nearby. Greywater is reused for toilet flushing after treat-ment with aerated septic tanks, which is modified from conventional septic tanks with aeration equipments installed, and storage ponds [Zhu et al. 2006]. How-ever, the city of Dongsheng is not a typical big city as is the focus of this work with a higher population density, which is only about 140 inhabitants per km² in this model project in Erdos. There are different approaches of decentralised projects, especially with regard-ing to public toilets in cities. The public toilets system in China belongs to an

Chapter 2 Semi-centralised supply and treatment systems 28
independent public authority, which is often in charge of the solid waste treat-ment at the same time. The approach is to collect faeces and urine from public toilets, not to be mixed with other wastewater flows, for direct reuse in agricul-ture organized without advanced treatments. Because of the water scarcity in the large and mega cities (cp Chapter 1), many city administrations have brought out local regulations for the reuse of treated wastewater either decentralised or centralised. In 1997, the City of Beijing issued the first administration notes in China about the installation of treatment facili-ties for water reuse in large buildings, i.e. hotels with more than 20,000 m² con-struction areas and public buildings more than 30,000 m² construction areas. Thereafter, more and more cities, especially in North China, brought out similar regulations of decentralised water reuse. As bfai (2006) reported, the responsible public authority (MEP and its regional agencies) is not able to control the execu-tion of these regulations, neither with personnel nor technically. For example, there is few detailed information about the more than 300 – 400 decentralised treatment units in Beijing with a total reclamation capacity of 50,000 to 60,000 m³/d [Mels et al. 2008]. 2.3 An alternative concept for urban areas in China –
Semi-centralised Supply and Treatment Systems On the one hand, water reuse in Chinese cities is urgently needed due to acute water scarcity in urban areas (cp Chapter 1). On the other hand, centralized infrastructure systems in the water sector have reached their limits because of the rapid urbanisation and the over-proportional size of the cities. In the densely populated areas, decentralized infrastructure systems (on-site or house-based systems, cp Page 14) in the water sector can’t solve the actual problems and assure the basic requirements on hygiene and health standards in the large cities. Therefore, alternative and sustainable solutions have to be found to for the rap-idly city development. Fu et al. (2008) reported that in recent years large municipal WWTPs have been established in cities such as Beijing, Tianjin and other cities. The discharge from these WWTPs undergoes further treatment to be used in scenic water courses and lakes or as public service and industrial cooling water. This way, freshwater

Chapter 2 Semi-centralised supply and treatment systems 29
resources are preserved and treated municipal wastewater is recycled, thus pro-vide considerable economic and environmental benefits. As reported before, on the one hand, the recycled water industry is still in its early stages and has a long way to go. On the other hand, a large centralised distribution system similar to that of tap water supply has to be built for trans-porting the reuse water back to the city, as most of the municipal WWTPs are located far outside. In addition, rapidly growing peri-urban areas, a multitude of new residential areas as well as small-service industries require the fast realisa-tion of infrastructure systems for water supply and sanitation. Administrative agencies are often forced to recommend decentralised solutions, as asset and maintenance costs of centralised infrastructures in the water sector are not finan-cially feasible any more [bfai 2006]. Until now, there are no actually practicable solutions for the described challenges in urban areas in China. Further progresses in environmental protection and the protection of the water resources stand as the most important duty in the next 11th governmental Five-Year-Planning. Official governmental statements also advise that economic growth will not be given the highest priority any more as in the past. Sustainabil-ity and social compatibility will be more important in future economic policies [bfai 2006]. The semi-centralised supply and treatment system (SSTS) is hereby a new and alternative approach of a supply and sanitation system for the development of urban infrastructures in place of the conventional supply and sanitation system (“End-of-Pipe” system). Intra-urban water reuse therefore plays an important role in achieving an optimal overall concept with tap water production, treat-ment of wastewater and solid wastes as well as the reuse of resources in urban areas of large and mega cities. 2.3.1 What is a Semi-centralised Supply and Treatment
System (SSTS) A semi-centralised size describes a dimension, which goes beyond individual housing units but clearly stays away from conventional central systems, supply-ing whole cities or even regions – a system divided into several separate units [Böhm et al. 2006]. Semi-centralised systems should be as small as possible and

Chapter 2 Semi-centralised supply and treatment systems 30
as large as necessary [Chang et al. 2007]. SSTSs offer integrated treatment facili-ties for tap water, wastewater and domestic solid wastes, provides refuse derived fuels, possibly excessive energy and service water for households and intra-urban use, e.g. irrigation of public greens, for an entire district within a city [Böhm et al. 2006]. No centralised supply and sanitation facilities would be built for a complete city regarding the long-term urban development of more than 15 years, as is normally considered in practice. As Figure 11 shows, each new built district in the city features its own Semi-centralised Supply and Treatment Centre (STC).
residual & biowaste
semi-centralisedsupply and
treatment centre(STC)
blackwater
greywater
raw/ tap water
stabilised waste
caloric heat
service water
potable water
treated wastewater
energy
electric energy
semi-centralised system
-/
districtsresidual & biowaste
semi-centralisedsupply and
treatment centre(STC)
blackwater
greywater
raw/ tap water
stabilised waste
caloric heat
service water
potable water
treated wastewater
energy
electric energy
semi-centralised system
-/
districtsdistricts
Figure 11 Citywide structure of semi-centralised supply and treatment systems (left) and material and energy flows within semi-centralised supply and treatment systems (right) as example (Bieker et al. 2009; Weber et al. 2007, both modified)
In STCs, each treatment unit to be used includes the (optional) implementation of technical solutions and treatment methods to optimize material and energy flows, e.g. combined treatment of organic waste and sludge from wastewater treatment, separate treatment of greywater and blackwater, seasonally optimized operation for water reuse and optimized interconnection of heating and cooling, etc. For applying the optimal solution, one has to investigate input and output material flows for each STC. Input flows are raw water (respectively tap water), wastewater (separated into greywater and blackwater) and domestic solid wastes. Output flows - after different treatment processes - are service water, treated wastewater, stabilized wastescaloric heat as well potable water. The operation and maintenance of the STC should be carried out by qualified personnel, thus assuring maximum reliability in achieving high quality standards, hygiene in water distribution, water and energy reuse as well as control of mate-rial flows. These techniques lead to an increase of the system efficiency and a

Chapter 2 Semi-centralised supply and treatment systems 31
reduction in the amount of residues to be disposed. The proximity between con-sumers and STCs allows short sewer and supply pipeline systems, leads to the complete separation of municipal and industrial wastewater, results in a conven-ient water reuse within the intra-urban areas [Cornel et al. 2009]. Service water, which is generated from greywater by compact, robust and simple treatment processes, can be used directly in the respective residential areas for toilet flush-ing or the irrigation of public greens. Waste treatment facilities nearby minimize transport ways, realise and optimize the recycling of resources as well as energy recovery. The exceptional particularity of the STC is the principle of modular construction kits, into which the treatment facilities for all the technical treatment processes are built stepwise as modules, thereby regarding the development dynamics of the catchment areas and the local/regional conditions. The extension to further supply and treatment units is possible. Regarding the modular construction prin-ciple of the STCs, it may be expected that semi-centralised systems will be planned and implemented faster and more flexible than conventional centralised systems. They will be adapted even better to respective local conditions. [Cornel et al. 2007]. 2.3.2 Advantages of Semi-centralised Supply and Treat-
ment Systems The SSTSs have to be developed and implemented, combining the advantages of centralised and de-centralised systems but avoiding their disadvantages. In order to illustrate the saving potentials in resources and to show the advantages of the SSTS, a calculation example based on the data of City Qingdao is shown below. The following material flows are included in the analysis: “tap water” directly from centralised supply pipelines, “blackwater and greywater” in wastewater treatment, “sludge” and “solid waste from private households” in waste treat-ment (see Figure 12).

Chapter 2 Semi-centralised supply and treatment systems 32
tap water76 L/(C·d)
service water 33 L/(C·d)
1 kg/(C·d)
solid wastes
rest for disposal
RDFwaste / sludge
treatment
receiving water
blackwater68 L/(C·d)
68 L/(C·d)
blackwater treatment
greywater41 L/(C·d)
greywater treatment
8 L/(C·d)
irrigation or other reuse
sludge
el. energy
el. energy
el. energysludge
ther
m.
ener
gy
process w
ater
0.6 kg/(C·d)
0.25 kg/(C·d)
25*-50** Wh/(C·d)
55* Wh/(C·d)
200 Wh/(C·d)
* activated sludge treatment process** membrane bioreactor
el. energy100 Wh/(C·d)
STC
Figure 12 Illustration of material and energy flows within a STC, taking the example of City Qingdao [Cornel et al. 2007]
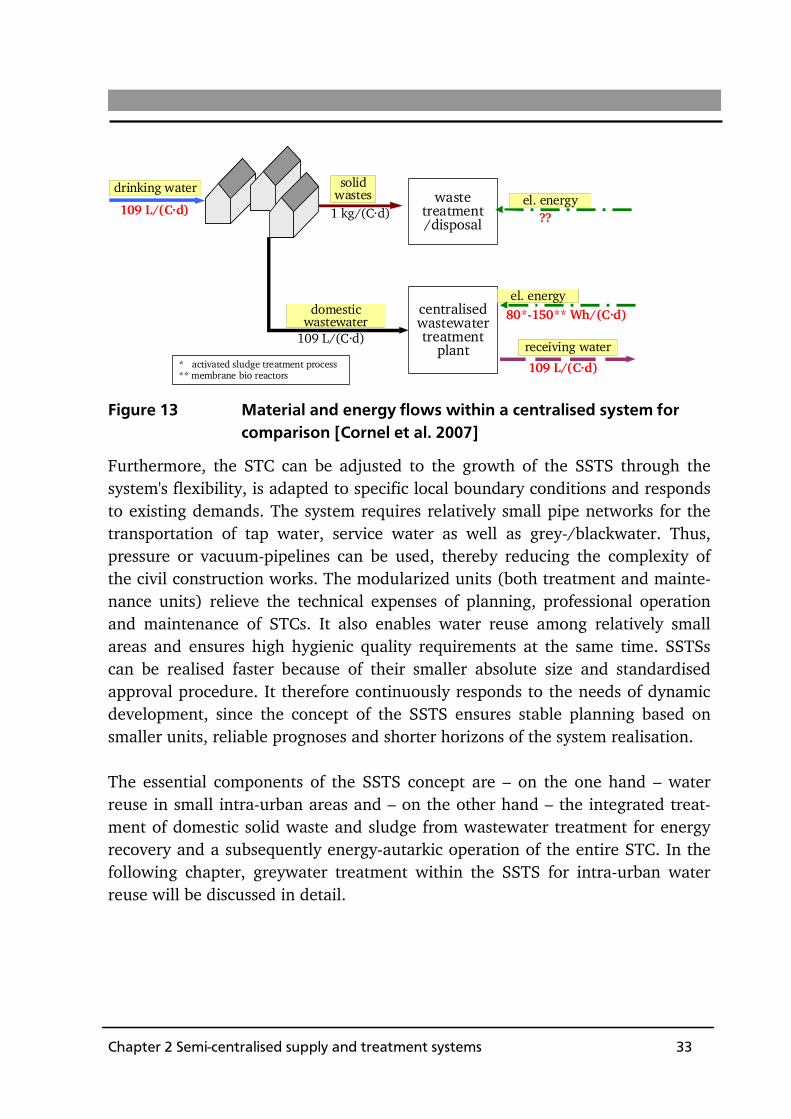
In the City of Qingdao, the current tap water demand is about 109 L/(C·d) and the solid waste from private household about 1 kg/(C·d) [Bi 2004]. By applying the integrated semi-centralised approach, the tap water consumption can be reduced by approximately 30%, as service water is used for toilet flushing in private households. A 40% mass reduction of the solid wastes as residues for disposal can be achieved as well as a 25% production of refuse derived fuels for external energy recovery. The total energy production through combined waste/sludge treatment is sufficient to cover the complete energy consumption of the STC and with an excess of more than 100 Wh/(C·d) (see Figure 12). For comparison, Figure 13 shows a conventional treatment system. In the given case, the tap water demand totals 109 instead of 76 L/(C·d). All the solid waste has to be transported away from the residential area for further treatment or disposal outside the city. The whole wastewater has to be treated in centralised WWTPs. Different to the concept of the STC described above, the energy balance is difficult to determine, as the energy needed for solid waste transport could not be calculated exactly.
Chapter 2 Semi-centralised supply and treatment systems 33
drinking water
109 L/(C·d) 1 kg/(C·d)
solid wastes waste
treatment/disposal
receiving water
domestic wastewater
109 L/(C·d)
109 L/(C·d)
centralisedwastewater treatment
plant
el. energy80*-150** Wh/(C·d)
* activated sludge treatment process** membrane bio reactors
el. energy??
Figure 13 Material and energy flows within a centralised system for comparison [Cornel et al. 2007]
Furthermore, the STC can be adjusted to the growth of the SSTS through the system's flexibility, is adapted to specific local boundary conditions and responds to existing demands. The system requires relatively small pipe networks for the transportation of tap water, service water as well as grey-/blackwater. Thus, pressure or vacuum-pipelines can be used, thereby reducing the complexity of the civil construction works. The modularized units (both treatment and mainte-nance units) relieve the technical expenses of planning, professional operation and maintenance of STCs. It also enables water reuse among relatively small areas and ensures high hygienic quality requirements at the same time. SSTSs can be realised faster because of their smaller absolute size and standardised approval procedure. It therefore continuously responds to the needs of dynamic development, since the concept of the SSTS ensures stable planning based on smaller units, reliable prognoses and shorter horizons of the system realisation. The essential components of the SSTS concept are – on the one hand – water reuse in small intra-urban areas and – on the other hand – the integrated treat-ment of domestic solid waste and sludge from wastewater treatment for energy recovery and a subsequently energy-autarkic operation of the entire STC. In the following chapter, greywater treatment within the SSTS for intra-urban water reuse will be discussed in detail.

Chapter 2 Semi-centralised supply and treatment systems 34

Chapter 3 Utilisation-oriented greywater treatment 35
3 Utilisation-oriented greywater treatment for intra-urban water reuse
Greywater treatment for intra-urban reuse is one of the essential system compo-nents within a semi-centralised supply and treatment concept. To begin with, below, the Chinese guidelines of quality requirements regarding different reuse purposes are compiled in an overview. It is then explained why greywater dis-charged from private households is a suitable source for service water reuse, and the characteristics of greywater as published by different authors are summed up. Different treatment techniques commonly used in the treatment of municipal wastewater may also be suited for greywater treatment. To assess their suitabil-ity, a comparison of three treatment processes, which are chosen to be suitable techniques for greywater treatment in intra-urban treatment facilities (STC), is carried out using data from published investigations. Generally, the selection of treatment processes for greywater treatment should be utilisation-oriented. This means, the treatment process should be adapted to the respective reuse purpose of the treated wastewater, i.e. exactly fulfilling the quality requirements, not more and not less. 3.1 Guidelines of water reuse for different purposes
in China Since 2002, there have been various amendments of the technical guidelines for water reuse with respect to different reuse purposes. The technical guidelines include almost all possible reuse possibilities:
GB/T 18920-2002: Water quality standard for urban miscellaneous water consumption
GB/T 18921-2002: Water quality standard for scenic environmental use
GB 5084-2005: Standard for irrigation water quality GB/T 19772-2005: Water quality standard for groundwater
recharge GB/T 19923-2005: Water quality standard for industrial uses.
These technical guidelines are listed below in Tables 5–9 summarizing the re-spective essential monitoring parameters. Generally, there are quite strict regula-
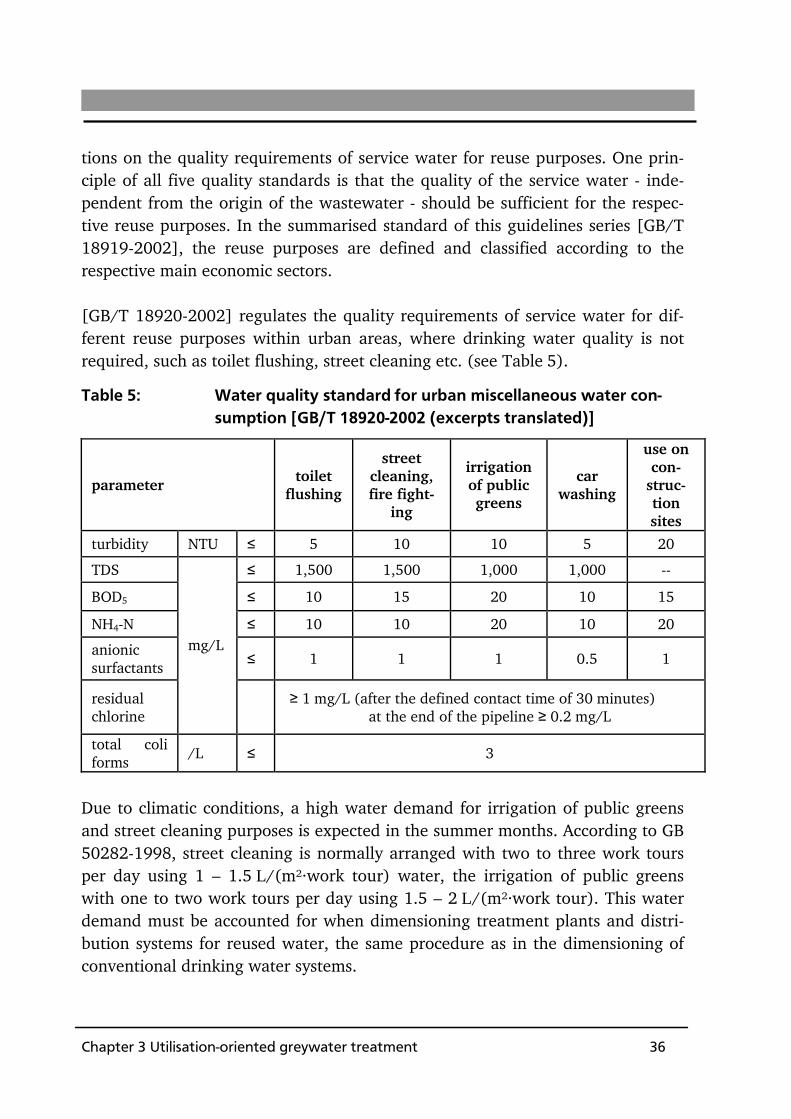
Chapter 3 Utilisation-oriented greywater treatment 36
tions on the quality requirements of service water for reuse purposes. One prin-ciple of all five quality standards is that the quality of the service water - inde-pendent from the origin of the wastewater - should be sufficient for the respec-tive reuse purposes. In the summarised standard of this guidelines series [GB/T 18919-2002], the reuse purposes are defined and classified according to the respective main economic sectors. [GB/T 18920-2002] regulates the quality requirements of service water for dif-ferent reuse purposes within urban areas, where drinking water quality is not required, such as toilet flushing, street cleaning etc. (see Table 5).
Table 5: Water quality standard for urban miscellaneous water con-sumption [GB/T 18920-2002 (excerpts translated)]
parameter toilet
flushing
street cleaning, fire fight-
ing
irrigation of public greens
car washing
use on con-
struc-tion sites
turbidity NTU ≤ 5 10 10 5 20
TDS ≤ 1,500 1,500 1,000 1,000 --
BOD5 ≤ 10 15 20 10 15
NH4-N ≤ 10 10 20 10 20
anionic surfactants ≤ 1 1 1 0.5 1
residual chlorine
mg/L
≥ 1 mg/L (after the defined contact time of 30 minutes)
at the end of the pipeline ≥ 0.2 mg/L
total coli forms
/L ≤ 3
Due to climatic conditions, a high water demand for irrigation of public greens and street cleaning purposes is expected in the summer months. According to GB 50282-1998, street cleaning is normally arranged with two to three work tours per day using 1 – 1.5 L/(m²·work tour) water, the irrigation of public greens with one to two work tours per day using 1.5 – 2 L/(m²·work tour). This water demand must be accounted for when dimensioning treatment plants and distri-bution systems for reused water, the same procedure as in the dimensioning of conventional drinking water systems.
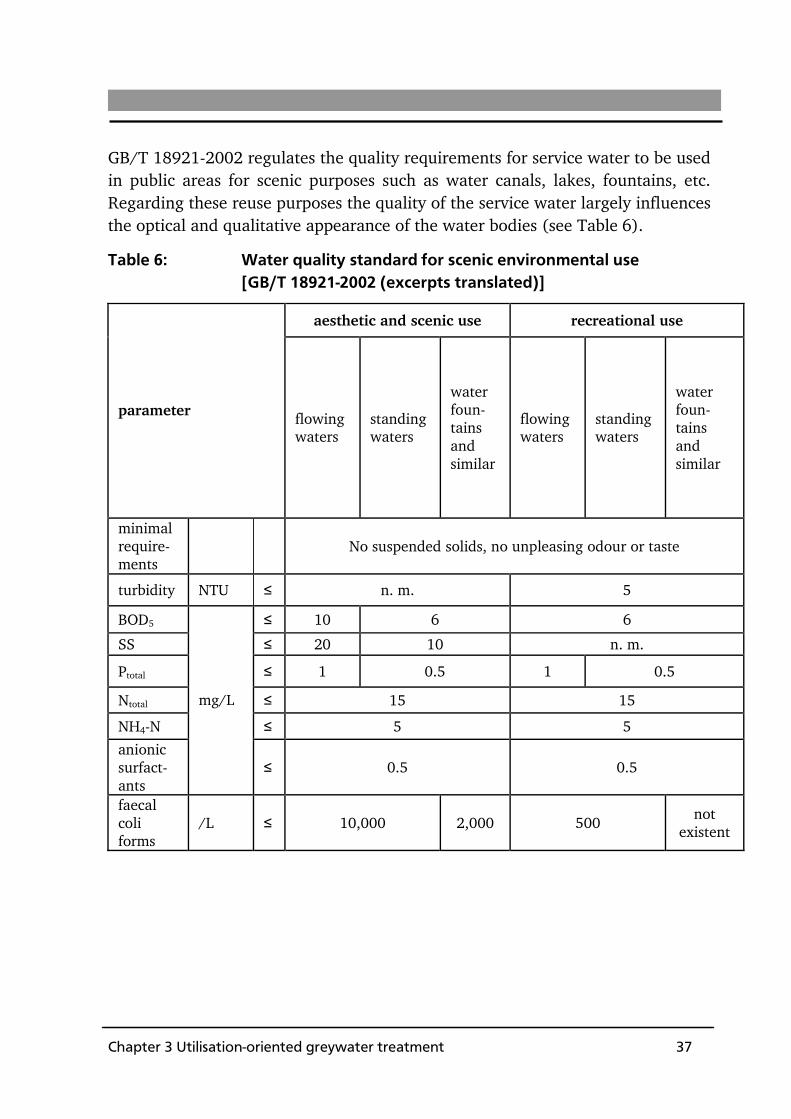
Chapter 3 Utilisation-oriented greywater treatment 37
GB/T 18921-2002 regulates the quality requirements for service water to be used in public areas for scenic purposes such as water canals, lakes, fountains, etc. Regarding these reuse purposes the quality of the service water largely influences the optical and qualitative appearance of the water bodies (see Table 6).
Table 6: Water quality standard for scenic environmental use [GB/T 18921-2002 (excerpts translated)]
aesthetic and scenic use recreational use
parameter flowingwaters
standingwaters
water foun-tains and similar
flowing waters
standing waters
water foun-tains and similar
minimal require-ments
No suspended solids, no unpleasing odour or taste
turbidity NTU ≤ n. m. 5
BOD5 ≤ 10 6 6
SS ≤ 20 10 n. m.
Ptotal ≤ 1 0.5 1 0.5
Ntotal ≤ 15 15
NH4-N ≤ 5 5
anionic surfact-ants
mg/L
≤ 0.5 0.5
faecal coli forms
/L ≤ 10,000 2,000 500 not
existent
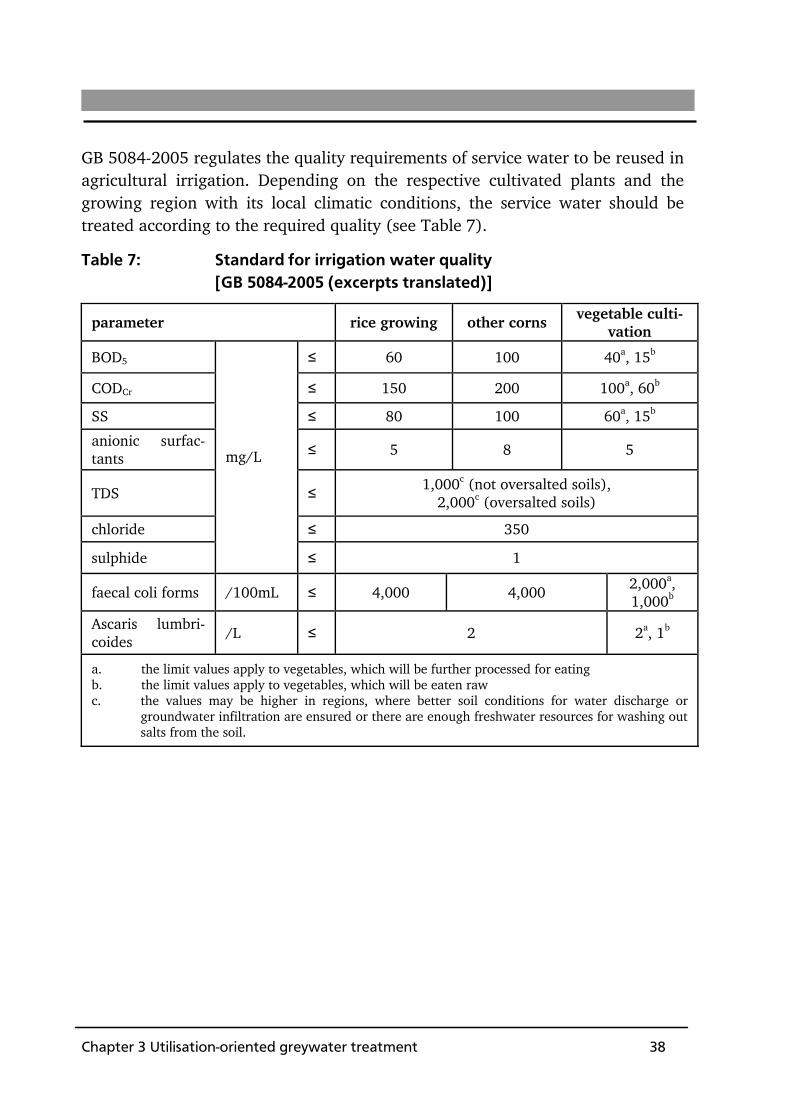
Chapter 3 Utilisation-oriented greywater treatment 38
GB 5084-2005 regulates the quality requirements of service water to be reused in agricultural irrigation. Depending on the respective cultivated plants and the growing region with its local climatic conditions, the service water should be treated according to the required quality (see Table 7).
Table 7: Standard for irrigation water quality [GB 5084-2005 (excerpts translated)]
parameter rice growing other corns vegetable culti-vation
BOD5 ≤ 60 100 40a, 15b
CODCr ≤ 150 200 100a, 60b
SS ≤ 80 100 60a, 15b
anionic surfac-tants ≤ 5 8 5
TDS ≤ 1,000c (not oversalted soils),
2,000c (oversalted soils)
chloride ≤ 350
sulphide
mg/L
≤ 1
faecal coli forms /100mL ≤ 4,000 4,000 2,000a, 1,000b
Ascaris lumbri-coides
/L ≤ 2 2a, 1b
a. the limit values apply to vegetables, which will be further processed for eating b. the limit values apply to vegetables, which will be eaten raw c. the values may be higher in regions, where better soil conditions for water discharge or
groundwater infiltration are ensured or there are enough freshwater resources for washing out salts from the soil.
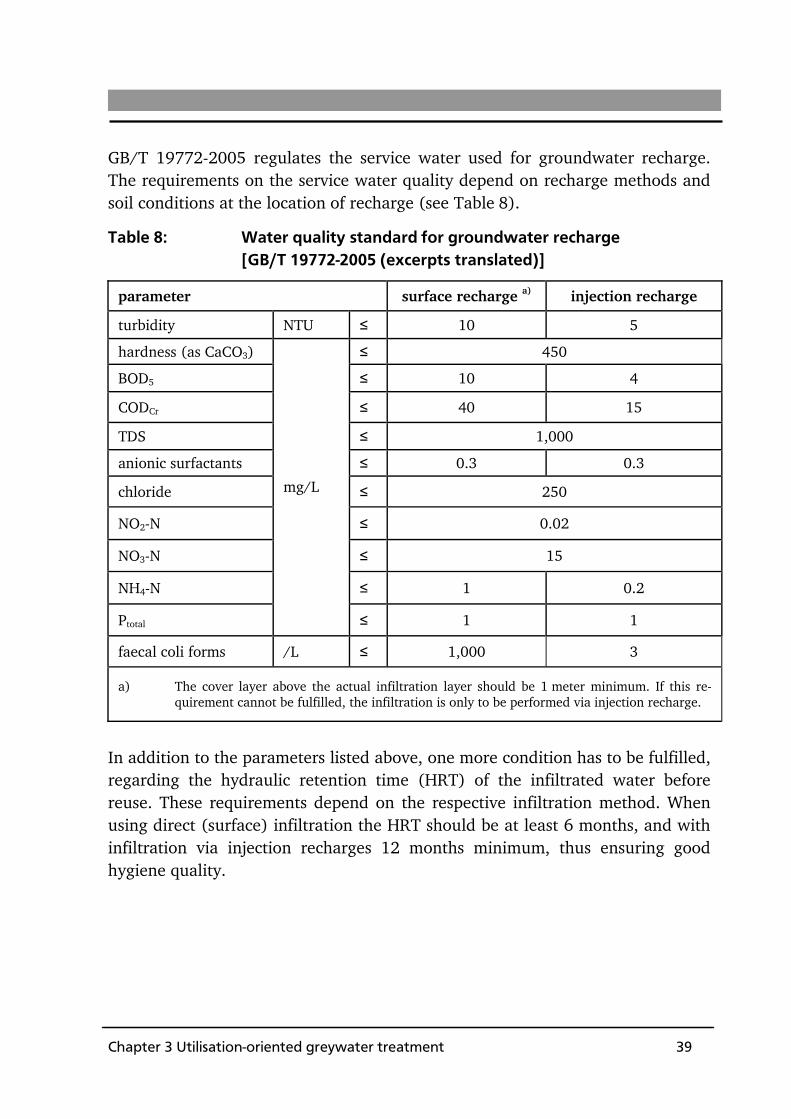
Chapter 3 Utilisation-oriented greywater treatment 39
GB/T 19772-2005 regulates the service water used for groundwater recharge. The requirements on the service water quality depend on recharge methods and soil conditions at the location of recharge (see Table 8).
Table 8: Water quality standard for groundwater recharge [GB/T 19772-2005 (excerpts translated)]
parameter surface recharge a) injection recharge
turbidity NTU ≤ 10 5
hardness (as CaCO3) ≤ 450
BOD5 ≤ 10 4
CODCr ≤ 40 15
TDS ≤ 1,000
anionic surfactants ≤ 0.3 0.3
chloride ≤ 250
NO2-N ≤ 0.02
NO3-N ≤ 15
NH4-N ≤ 1 0.2
Ptotal
mg/L
≤ 1 1
faecal coli forms /L ≤ 1,000 3
a) The cover layer above the actual infiltration layer should be 1 meter minimum. If this re-quirement cannot be fulfilled, the infiltration is only to be performed via injection recharge.
In addition to the parameters listed above, one more condition has to be fulfilled, regarding the hydraulic retention time (HRT) of the infiltrated water before reuse. These requirements depend on the respective infiltration method. When using direct (surface) infiltration the HRT should be at least 6 months, and with infiltration via injection recharges 12 months minimum, thus ensuring good hygiene quality.

Chapter 3 Utilisation-oriented greywater treatment 40
3.2 Characteristics of greywater according to published investigations
In general, greywater is defined as discharge from private households except the discharge from toilets [DWA 2008]. Wastewater discharges from baths/showers, hand wash basins and washing machines are often called "light" greywater. Dis-charges from baths/showers and hand wash basins are much less polluted than the other kinds of greywater with kitchen sinks, washing machines. Since more than two decades, greywater treatment and the reuse of treated greywater in various applications have attracted increasing attention. The com-position of greywater may vary widely due to different origins. Tables 9 and 10 show data on the characteristics of greywater published on investigations after 2001. Hereby, data on two kinds of greywater from private households (and similar) have been included: discharge from baths/shower and hand wash basins (Table 9) and discharge from baths/shower, hand wash basins and washing machines (Table 10). There have also been many other research projects, (a) projects before the year 2001 and (b) greywater from other sources. As these data have been comprehensively used as basis for later research projects, they are not listed below.

Chapter 3 Utilisation-oriented greywater treatment 41
Table 9: Greywater characteristics in different investigations (I) – discharge from baths/shower and hand wash basins
main parameters
COD SS NH4-N Ntotal Ptotal literature quantity [L/(C·d)]
[mg/L]
Coli forms /E. Coli [/100mL] [mg/L]
Wilhelm, 2004 (Germany)
90 132 / 200
65 /20
--- 6.4 --- ---
fbr,2005 (Germany)
70 150 -400
35 -70
--- 4-16 --- 0.5-
4
Laine, 2001 (UK)
--- 367 -587
58 -153
--- / 2·103
±6·103 ---
6.6 -10.4
0.2-0.8
Birks and Hills, 2005 (UK)
92.5 96.3 36.8 -- /
3.9·105 4.6 < 4
Prathapar et al. 2005 (Oman)
106 266 361 --- --- --- ---
Eriksson et al. 2007 (Den-mark)
--- 142 -600 ---
1.4·105 / --- 5.2 --- 0.66
Goncalves et al. 2007 (Brazil)
24 500 11.8 1.9·107 / 5.4·105
--- --- ---
Pidou et al 2008 (UK)
--- 144 ±63
--- --- 0.7±7 7.6 ±3
0.5±0.2
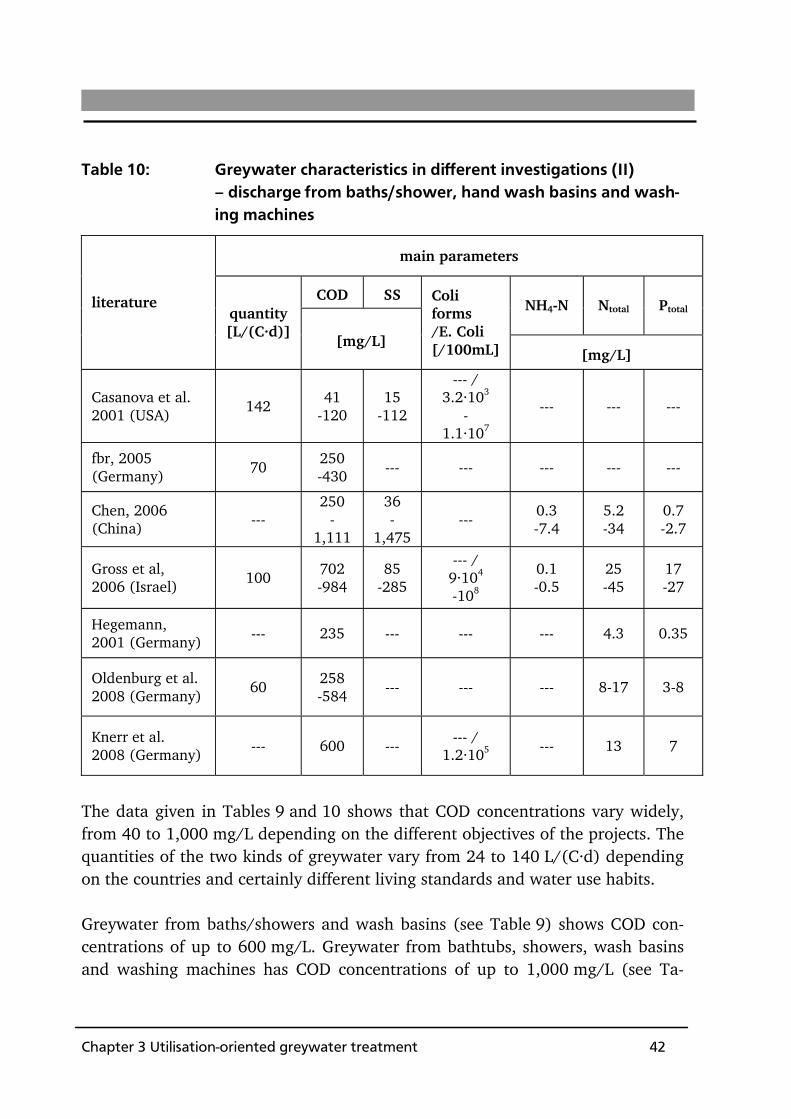
Chapter 3 Utilisation-oriented greywater treatment 42
Table 10: Greywater characteristics in different investigations (II) – discharge from baths/shower, hand wash basins and wash-ing machines
main parameters
COD SS NH4-N Ntotal Ptotal literature
quantity [L/(C·d)]
[mg/L]
Coli forms /E. Coli [/100mL] [mg/L]
Casanova et al. 2001 (USA)
142 41
-120 15
-112
--- / 3.2·103
- 1.1·107
--- --- ---
fbr, 2005 (Germany)
70 250 -430
--- --- --- --- ---
Chen, 2006 (China)
--- 250
-1,111
36 -
1,475 ---
0.3 -7.4
5.2 -34
0.7 -2.7
Gross et al, 2006 (Israel)
100 702 -984
85 -285
--- / 9·104
-108
0.1 -0.5
25 -45
17 -27
Hegemann, 2001 (Germany)
--- 235 --- --- --- 4.3 0.35
Oldenburg et al. 2008 (Germany)
60 258 -584
--- --- --- 8-17 3-8
Knerr et al. 2008 (Germany)
--- 600 --- --- /
1.2·105 --- 13 7
The data given in Tables 9 and 10 shows that COD concentrations vary widely, from 40 to 1,000 mg/L depending on the different objectives of the projects. The quantities of the two kinds of greywater vary from 24 to 140 L/(C·d) depending on the countries and certainly different living standards and water use habits. Greywater from baths/showers and wash basins (see Table 9) shows COD con-centrations of up to 600 mg/L. Greywater from bathtubs, showers, wash basins and washing machines has COD concentrations of up to 1,000 mg/L (see Ta-

Chapter 3 Utilisation-oriented greywater treatment 43
ble 10). The reason of these higher pollutant concentrations is the discharge from washing machines. Regarding the microbial parameters such as total coli-forms and E. coli, greywater is not much “cleaner” than municipal wastewater. E. coli concentrations mostly vary from 103 to 107 per 100 mL. Special focus should be given to higher concentrations of surfactants (anionic, non-ionic and cationic) in greywater compared to municipal wastewater, caused by washing agents and personal care products. Henau et al. (1986) reported anionic surfactants concentration in municipal wastewater between 1 and 10 mg/L. Shafran et al. 2006 found out that concentrations of anionic surfactants in greywater ranged from 0.7 to 70 mg/L, depending on temporal (during the day) variations in the greywater flow. Random samples, taken by the author from separate discharges of showers and washing machines, also showed an enrichment of anionic surfactants (about 300 mg/L in the shower discharge and 70 mg/L in the discharge from the washing machine), most probably depending on the respective user. In general, anionic surfactants used in modern washing agents show high biological degradability (over 95%) and are not considerer problematic. However, there is no investigation on the impact of highly concen-trated anionic surfactants in greywater on biological treatment processes. Furthermore, due to the origins of greywater, higher water temperatures are expected in greywater compared to municipal wastewater, especially in case of a SSTS with significantly shorter sewers from the discharge sites (e.g. the bath-rooms) to the treatment facilities. Theoretically, higher water temperatures facili-tate biological treatment. As concentrations of nitrogen and phosphorus are low in greywater, no elimination of nutrients is required in greywater treatment. However, nutrients removal is possibly needed for the treatment of greywater from kitchen sinks. In addition, the ratio of carbon and nutrients should be inves-tigated to enable the selection of the respective appropriate greywater treatment process according to the given parameters. In general, the configuration of grey-water treatment process is much simpler compared to municipal wastewater treatment. The above presented characteristics of greywater from baths/showers, hand wash basins and washing machines lead to a relatively simple configuration of the required greywater treatment process, including shorter distribution systems
Chapter 3 Utilisation-oriented greywater treatment 44
of service water in the context of a SSTS, provide cost advantages of service water (treated greywater for reuse) compared the use of drinking water. 3.3 Techniques chosen for greywater treatment based
on published investigations In recent years, in Europe and in Germany, there have been several research and pilot projects on greywater treatment for reuse, using different small-scale plants [DEUS21 2005; Knerr et al. 2008; Gethke et al. 2007, Eriksson et al. 2007, Hernández et al. 2008, Oldenburg et al. 2008, Paris et al. 2009]. The focus of these studies was on the provision of treated greywater for water reuse in office buildings, hotels and small housing estates (< 500 PE). International investiga-tions and pilot projects showed that the reuse of treated greywater is a sensible alternative to common water supply and sanitation concepts. Greywater treat-ment facilities are also proved economically viable [Bullermann et al. 2001]. In recent years, different pilot projects for greywater treatment using simple treatment processes have been installed and are operated mostly in hotels, hous-ing estates or university campus in the People's Republic of China. However, there is still no generally applicable statistical and technical data about grey-water, even though a relatively strict technical guideline for intra-urban water reuse [GB/T 18920-2002] already exists. In general, all treatment techniques currently applied in municipal wastewater treatment – both aerobe and anaerobe – as well as subnatural and technical process are suitable for greywater treat-ment. However, the anaerobic wastewater treatment process as a special applica-tion is not discussed here. Aerobic wastewater treatment is a commonly applied process in the municipal wastewater treatment, and is categorised in subnatural process such as wetland and soil filter and fully technical process such as the activated sludge process and the biofilm process. Against the background of applying SSTS in fast growing urban areas in China, the focus of this study is on technical treatment processes, which are applicable as compact, indoor applica-ble, efficient and cost-coverable processes. Commonly applied technical processes for wastewater treatment are the acti-vated sludge process and the biofilm process. In practise, a multitude of configu-rations of the activated sludge process can be observed. In this study, three tech-

Chapter 3 Utilisation-oriented greywater treatment 45
nical aerobic processes (BAF, SBR and MBR) are chosen for detailed investiga-tion and comparative studies and are described below. BAF is one of the widely used biofilm processes. The biggest advantage of BAF is the compactness of its treatment facilities because of applied high volume loads of organics. Both SBR and MBR belong to the conventional activated sludge process with respective modifications. In SBR, the biomass sedimentation step, which in common processes occurs in separate tanks (secondary clarifier), is integrated in the reactor of biological treatment. SBR offers a simplified treat-ment process as no nutrient removal is required in greywater treatment. In MBR, the separation of biomass from water is carried out via physical filtration instead of the sedimentation process in the secondary clarifier. Therefore, MBR offers the best effluent quality for potential direct reuse.
BAF (Biological Aerated Filter) BAFs belong to one of the established techniques in wastewater treatment. In general, the BAF reactor consists of a vertical filter filled with carrier materials, and the wastewater flows vertically through the filter bed. The surface of the carrier materials serves as fixed growth areas for the biomass. On the one hand, the particular substances in wastewater are retained by filtration through the carrier materials. On the other hand, biological degradation takes place in biofilm which have settled on the surface of the carrier materials. The excess biomass is removed by backwashing processes. BAFs differ in the flow direction of the influent (downflow or upflow) and the operation modus (continuous or discontinuous) as well as the operation modus (dried or submerged filters). When using filters with discontinuous backwashing processes, in certain intervals the inflow is stopped, the filter bed is rinsed thoroughly with air and water and thus the excess biomass is removed. With continuous filters (the influent always flows from the bottom of the filter to the top), the carrier material at the bottom of the filter, which have the highest load, is continuously withdrawn by an airlift pump during normal operation. Backwash measures both scrub the carrier mate-rial to remove the old biofilm and refresh the young biofilm to improve biological degradation. BAFs with continuous backwash do not need several parallel filters as it is obligatory in filters with discontinuous backwash. In municipal WWTPs, BAFs may fulfil various treatment tasks, either the com-plete treatment process or single treatment steps, i.e. nitrification and/or de-

Chapter 3 Utilisation-oriented greywater treatment 46
nitrification following other treatment steps. Barjenbruch (2006) reported that in Germany there were currently 42 municipal WWTPs using BAF serving about 10 million population equivalents (PE). Thereof, 6 WWTPs used BAFs as main bio-logical treatment process with a total capacity of about 693.000 inhabitants. Worldwide, there were approximately 500 BAFs with a total treatment capacity of 50 million PE [Rogalla 2003; Rother et al. 2006]. Considering a model plant for 100.000 PE, a BAF plant only needed about 25% of the construction area and 30% of the construction volume of a conventional WWTP with activated sludge process [Rother 2005]. For dimensioning a BAF used as main biological treatment stage in municipal WWTPs, in 2000 DWA compiled a detailed list of the key design parameters (e.g. volume load of organics, water velocity in the filter, air velocity for the oxygen supply of the biological process, main parameters for backwashing processes) as well as a brief overview of operation experiences and investment cost of operat-ing BAFs in Germany. Key parameters of BAF in the municipal WWTP are listed in Table 11 [DWA 2000].
Table 11: Key parameters for dimensioning BAF in municipal WWTPs [DWA 2000, summarised]
treatment process
main parameters value unit
water velocity in the filter (average) 2 – 8 m³/(m²·h)
water velocity in the filter (maximum) 10 – 15 m³/(m²·h)
volume load of COD 7 – 10 kg/(m³·d)
volume load of BOD5 4 – 7 kg/(m³·d)
air flow rate 4 – 25 m³N/(m²·h)
filter bed height 2 – 4
(sporadically with 6) m
SS in influent < 50 – 75 mg/L
excess sludge 0.4 – 0.6 kg dry solids /kg CODelimated
loss of carrier material 1 – 4%
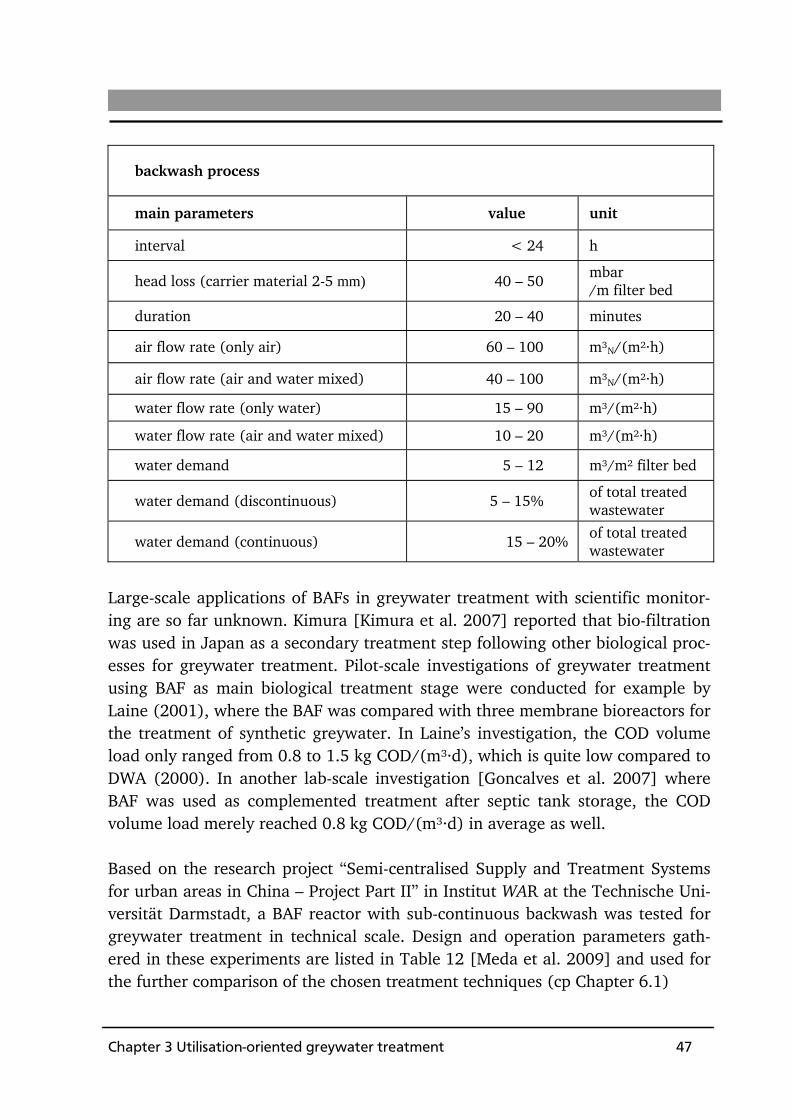
Chapter 3 Utilisation-oriented greywater treatment 47
backwash process
main parameters value unit
interval < 24 h
head loss (carrier material 2-5 mm) 40 – 50 mbar /m filter bed
duration 20 – 40 minutes
air flow rate (only air) 60 – 100 m³N/(m²·h)
air flow rate (air and water mixed) 40 – 100 m³N/(m²·h)
water flow rate (only water) 15 – 90 m³/(m²·h)
water flow rate (air and water mixed) 10 – 20 m³/(m²·h)
water demand 5 – 12 m³/m² filter bed
water demand (discontinuous) 5 – 15% of total treated wastewater
water demand (continuous) 15 – 20% of total treated wastewater
Large-scale applications of BAFs in greywater treatment with scientific monitor-ing are so far unknown. Kimura [Kimura et al. 2007] reported that bio-filtration was used in Japan as a secondary treatment step following other biological proc-esses for greywater treatment. Pilot-scale investigations of greywater treatment using BAF as main biological treatment stage were conducted for example by Laine (2001), where the BAF was compared with three membrane bioreactors for the treatment of synthetic greywater. In Laine’s investigation, the COD volume load only ranged from 0.8 to 1.5 kg COD/(m³·d), which is quite low compared to DWA (2000). In another lab-scale investigation [Goncalves et al. 2007] where BAF was used as complemented treatment after septic tank storage, the COD volume load merely reached 0.8 kg COD/(m³·d) in average as well. Based on the research project “Semi-centralised Supply and Treatment Systems for urban areas in China – Project Part II” in Institut WAR at the Technische Uni-versität Darmstadt, a BAF reactor with sub-continuous backwash was tested for greywater treatment in technical scale. Design and operation parameters gath-ered in these experiments are listed in Table 12 [Meda et al. 2009] and used for the further comparison of the chosen treatment techniques (cp Chapter 6.1)

Chapter 3 Utilisation-oriented greywater treatment 48
Table 12: Suggested design parameters of BAF with sub-continuous backwash for a large-scale greywater treatment plant [Meda et al. 2009]
main parameters value unit
water velocity in the filter (average)
3.5 – 4.25 m³/(m²·h)
COD volume load 7 – 8.5 kg/(m³·d)
air flow rate 10 m³N/(m²·h)
head loss 40 mbar/m filter bed
water demand for backwash 15% of total treated wastewater
SBR (Sequencing Batch Reactor) The sequencing batch reactor (SBR) is based on the conventional activated sludge process. The whole process including the integrated sedimentation of biomass takes place in one reactor. The basic process chain of SBR is shown in Figure 14.
Figure 14 Process chain of SBR [own drawing]

Chapter 3 Utilisation-oriented greywater treatment 49
Municipal WWTPs using SBR as main biological treatment normally need a com-plex process chain due to the requirement of nutrient removal as well as biologi-cal/chemical phosphorus removal Reactor volumes include biological treatment (both aerated and non-aerated phases) and sedimentation instead of separate secondary clarifying. The dimensioning of the SBR biological process is based on the normal process design of WWTPs using activated sludge treatment processes. Key parameters of the SBR are number of used reactors, cycle time, active reaction time, MLSS, sludge volume index (SVI) and volume exchange ratio (VER). Thereof, one of the most important parameters in is the VER which describes the ratio of the dis-charged water volume in each cycle to the total water volume in the reactor. The higher the VER, the higher is the concentration gradient in the reactor at the start of the reaction phase, thereby exposing the significant influence on settling behaviour and biomass characteristics. In addition, the duration of the filling phase and the water temperature are relevant for treatment performance as well as the SVI. The configuration of the reactors, the operation process as well as the ratio of filling time to reaction time, which cause a hydraulic crush feeding, have an important impact on SVI. In addition to the normal process design based on the activated sludge process, the design of SBR should be verified according to both hydraulic and biological boundary conditions. Depending on the operation strategies, three reactors and buffer tanks respectively should be budgeted for parallel operation and buffering the hydraulic peak flow. Wilderer et al. (2001) reported that until 1999 in Germany a total of 138 mu-nicipal WWTPs were using the SBR process, mainly for small counties and large housing estates. The size of the WWTPs ranged from 400 up to 25,000 PE. 102 WWTPs thereof had a treatment capacity less than 5,000 PE each. The VER of the reported SBRs was about 30% in average, which caused bulking sludge in the biological treatment processes in some cases [Wilderer et al. 2001]. Most studies investigating greywater treatment with SBR have so far been carried out using lab-scale reactors with volumes less than 500 litres. In practice, the SBR process is primarily used in small treatment facilities with less than 50 PE. Since July 2005, a compact SBR plant with 21 m³ reactor volume (14 tanks with 1.5 m³ each, successively switched) is used for the treatment of greywater from 35 showers and 32 hand wash basins in the Hamburger Stadtreinigung. The
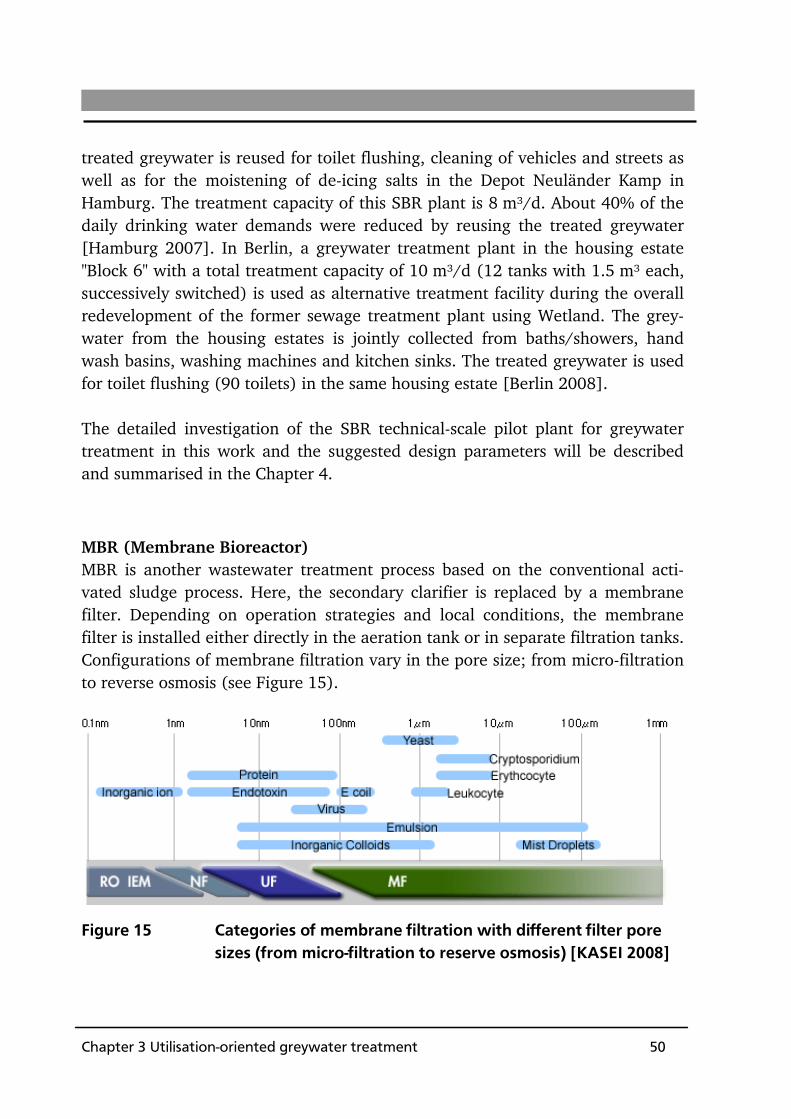
Chapter 3 Utilisation-oriented greywater treatment 50
treated greywater is reused for toilet flushing, cleaning of vehicles and streets as well as for the moistening of de-icing salts in the Depot Neuländer Kamp in Hamburg. The treatment capacity of this SBR plant is 8 m³/d. About 40% of the daily drinking water demands were reduced by reusing the treated greywater [Hamburg 2007]. In Berlin, a greywater treatment plant in the housing estate "Block 6" with a total treatment capacity of 10 m³/d (12 tanks with 1.5 m³ each, successively switched) is used as alternative treatment facility during the overall redevelopment of the former sewage treatment plant using Wetland. The grey-water from the housing estates is jointly collected from baths/showers, hand wash basins, washing machines and kitchen sinks. The treated greywater is used for toilet flushing (90 toilets) in the same housing estate [Berlin 2008]. The detailed investigation of the SBR technical-scale pilot plant for greywater treatment in this work and the suggested design parameters will be described and summarised in the Chapter 4.
MBR (Membrane Bioreactor) MBR is another wastewater treatment process based on the conventional acti-vated sludge process. Here, the secondary clarifier is replaced by a membrane filter. Depending on operation strategies and local conditions, the membrane filter is installed either directly in the aeration tank or in separate filtration tanks. Configurations of membrane filtration vary in the pore size; from micro-filtration to reverse osmosis (see Figure 15).
Figure 15 Categories of membrane filtration with different filter pore sizes (from micro-filtration to reserve osmosis) [KASEI 2008]

Chapter 3 Utilisation-oriented greywater treatment 51
In general, two types of installations are applied in the praxis: the sub-merged membrane with plate or hollow fibre modules, which are integrated mostly into the aeration tanks; the external installed membranes with tubular modules, which have own filtration units separated from the aeration tanks. Membranes with a pore size < 0.2 μm (respectively ultra-filtration) retain all bacteria existent in the wastewater, thus allowing for the direct use of the per-meate (effluent of the filtration) as service water. However, the smaller the pore size, the higher the energy demand and the higher investment and maintenance costs. Moreover, the membrane blocking due to fouling/scaling caused by or-ganic and inorganic matters in the wastewater, are only to be avoided via inten-sive aeration and thus providing sufficient cross-flow on the surface of the mem-branes. The additional energy needed for the cross-flow is about two to three times higher than for conventional treatment using the activated sludge process. Moreover, maintenance costs of MBR are mainly caused by fouling/scaling con-trol and resulting membrane cleaning procedures. In principle, the process design of MBR plants is based on the dimensioning of conventional activated sludge processes. Because of higher MLSS (up to 15 g/L) in the MBR process, the volume of the biological treatment reactor is 3 times smaller than the conventional activated sludge process with a MLSS of 4 – 5 g/L by the same Sludge Retention Time (SRT), which is an another very important parameter of the MBR process. The SRT in MBR process is recommended to be > 25 days minimum, preferably > 30 days. In comparison, the SRT in conventional activated sludge processes is 10 – 15 days taking in account different wastewa-ters and complete nutrient removal. According to various investigations, the high SRT in MBR processes is needed to ensure a stable membrane operation process and avoid fast fouling/scaling. Shorter SRTs lead to significantly faster membrane blocking and therefore the increase of cleaning measures. This means, the volume advantage of the mem-brane (via higher MLSS) is compensated by long SRTs. Especially in greywater treatment, where nutrient removal is not required in biological treatment, the much higher SRTs require an overall higher volume of the treatment facilities, which cannot be compensated by the positive influence from higher MLSS con-centrations. In addition, for controlling the fouling/scaling process of mem-
Chapter 3 Utilisation-oriented greywater treatment 52
branes, the hydraulic retention time (HRT) of the wastewater in the MBR reactor should not be < 4 hours. The first pilot-plant scale researches of greywater treatment with the MBR proc-ess were carried out at the end of the 1990s. Nowadays, there are more and more greywater treatment plants with accompanying scientific monitoring and research:
Mori building in Tokyo, Japan [Laine 2001],
Sport club “Association Culturelle et Sportive de l’Agriculture (ACSA)”
in Rabat, Morocco [Merz et al. 2007],
Multi-story buildings on the university campus in Haifa, Israel [Friedler
et al. 2006],
Office building of the KfW bank group “Ostarkade” in Frankfurt am
Main, Germany [Ecosan 2005],
Hotel am Kurpark Späth in Bad Windsheim, Germany
[Paris et al. 2009],
Student dormitory “Eastsite” in Mannheim, Germany [Sellner 2009].
Regarding the published investigations on greywater treatment using MBR for water reuse, in the majority of cases the respective effluent quality was sufficient as to the local requirements. However, siltation problems occurred in some cases, mainly caused by insufficient primary clarifying. Therefore, primary treatment, especially the separation of hair should be considered via a sieve with mesh size < 1 mm. Above, three technical treatment processes (BAF, SBR and MBR) are described, using data from published investigations. Each of the processes shows advan-tages and disadvantages in their use as greywater treatment process, as far as regarding the published data. The SBR process mainly provides advantages in greywater treatment; i.e. the most simplified operation process, which is one of the most important advantages for urban treatment facilities in P. R. China.
Chapter 3 Utilisation-oriented greywater treatment 53
Therefore, in this work, the SBR will be investigated in detail, using a pilot plant in technical scale. In Chapter 6, aspects such as operational stability, service water quality and economics will be discussed in detail based on the calculated examples.

Chapter 3 Utilisation-oriented greywater treatment 54
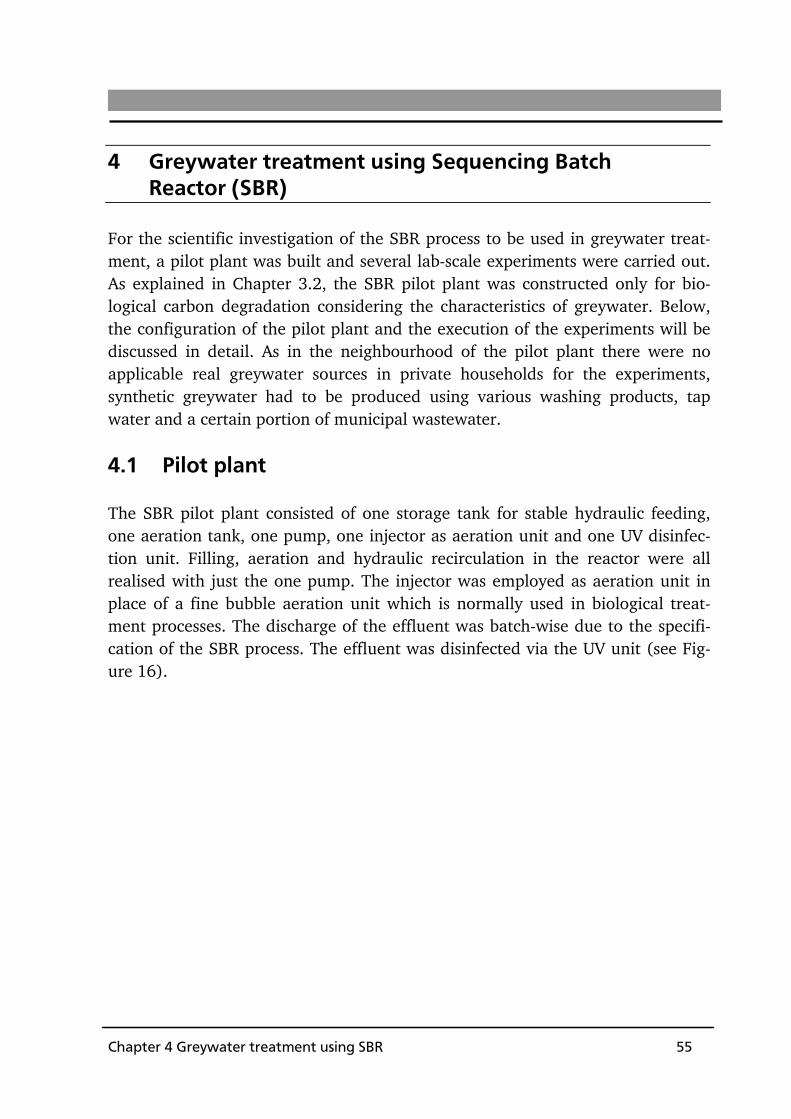
Chapter 4 Greywater treatment using SBR 55
4 Greywater treatment using Sequencing Batch Reactor (SBR)
For the scientific investigation of the SBR process to be used in greywater treat-ment, a pilot plant was built and several lab-scale experiments were carried out. As explained in Chapter 3.2, the SBR pilot plant was constructed only for bio-logical carbon degradation considering the characteristics of greywater. Below, the configuration of the pilot plant and the execution of the experiments will be discussed in detail. As in the neighbourhood of the pilot plant there were no applicable real greywater sources in private households for the experiments, synthetic greywater had to be produced using various washing products, tap water and a certain portion of municipal wastewater. 4.1 Pilot plant The SBR pilot plant consisted of one storage tank for stable hydraulic feeding, one aeration tank, one pump, one injector as aeration unit and one UV disinfec-tion unit. Filling, aeration and hydraulic recirculation in the reactor were all realised with just the one pump. The injector was employed as aeration unit in place of a fine bubble aeration unit which is normally used in biological treat-ment processes. The discharge of the effluent was batch-wise due to the specifi-cation of the SBR process. The effluent was disinfected via the UV unit (see Fig-ure 16).

Chapter 4 Greywater treatment using SBR 56
Figure 16 Process scheme of the SBR pilot plant
The average flow rate of the SBR pilot plant was designed for 1 m³/h. However, the flow rates varied according to the different experimental phases (details in Chapter 4.2). The reactor is a cylindrical reactor with a diameter of 1.5 meter, a total height of 6.3 meter and a maximum usable water depth of 5.2 meter. The actually used water depth during all experimental phases was 4.7 meter. The geometry – slim reactor with small footprint – was chosen according to the in-tended use in densely populated urban areas, where available surface areas for treatment facilities are scarce. In place of the fine bubble aeration unit a self-suctioned injector was installed as aeration unit in the pilot plant. “Self-suctioned” means that no pressured air should be blown into water through a separate blower. This installation (with the injector) minimised the overall amount of equipments in the pilot plant and thus in future large-scale applications. The self-suctioned injector has an allowed maximal submerged depth of 3.5 meter. Therefore, the injector could not be installed on the bottom of the reactor as would have been done normally when using a slim configuration as in the pilot plant. To use the maximum available reactor depth, the injector was installed 1.7 meter above the bottom of the reac-tor. This way, the overall water velocities in reactor had to be verified to exceed

Chapter 4 Greywater treatment using SBR 57
0.1 cm/s for ensuring a fully mixed liquor of water/biomass in which the bio-mass would not settle down. Only a fully mixed liquor of water/biomass in the reactor allows a stable and effective biological degradation process. As the reac-tor has a cylindrical geometry, several stream breakers were installed (staggered) above and below the entry of the ejector to distribute the flow evenly. Figure 17 shows the computer simulated water flow velocities in the reactor concerning with and without stream breakers.
Figure 17 Flow simulation in the reactor (left: without stream breakers; right: with stream breakers)
The first simulation shows a reactor without stream breakers in the left picture of Figure 17 (done by ITT Water & Wastewater AB, Stockholm). The water veloci-ties in the reactor were not distributed evenly. Especially at the top of the reactor (one third of the total height), the water velocity evidently was below 0.2 m/s. The water velocities in the reactor with stream breakers were spread more evenly and above 0.1 m/s in most areas. However, at the bottom the water velocity seemed very low, which could indicate potential biomass sedimentation in this zone. To improve the water velocity in this zone, the injector was modified with a 45° angle pipe for changing the flow direction of the water from horizontal (as shown in Figure 17) to the bottom of the reactor (see Figure 18).

Chapter 4 Greywater treatment using SBR 58
Figure 18 Modified injector for the pilot plant
As the direction changer had been installed at the end of the injector, the mixing function of the ejector and therefore the performance of the injector as to the oxygen transfer were not impaired through this installation. The water velocity at the bottom of the reactor and the mixing status in the reactor were improved significantly (see Figure 19). In addition, for the later experiments the injector was also modified with dosing points for chemicals and an adjustment flange with a rubber-gasketed joint to provide a flexible inserting depth into the reactor (see Figure 18). With these changes, the conventional aeration injector was modified into a multi-functional injector for the simplified SBR process in grey-water treatment.

Chapter 4 Greywater treatment using SBR 59
Figure 19 Real flow pictures in the reactor during the filling process with clean water (1. water jet with straight outlet of ejector; 2. water jet with modified ejector; 3. stream breakers in the reactor (installed staggered above and below the injector outlet); 4. fully mixed water and air in the reactor)
To control the filling process and the exchanged water volume as well as to pro-tect the pump, two level control points were installed in the storage tank and in the reactor, respectively. The pump installed in the pilot plant is a centrifugal pump, which is commonly used as submerged pump for injector aeration in water, but in this case it was used as a multi-functional pump for filling, aeration and mixing. It could be used for decantation – if required – in large-scale applica-tions as well. The pump was installed outside the reactor, because of his multiple functions and the slim geometry of the reactor (see Figure 16). This installation also facilitates maintenance measures. The volume exchange ratio (VER) in the treatment process was preset at 60%, which is much higher than usually applied in municipal WWTPs (cp Chapter 3.2) and leads to different characteristics of the biomass (cp Chapter 4.3.2). The MLSS in the reactor during the fully mixed status was set at 7 g/L and 4 g/L for the experimental phases testing different F/M ratios. Without nutrient removal, the cycle procedure was 4 hours of cycle time and 2 hours of active reaction time (aeration phase). The investigations on varied hydraulic loads and F/M ratios were carried out by varying operation modes and cycles (cp Chapter 4.2).
Chapter 4 Greywater treatment using SBR 60
The injector used is the smallest in the product line. Nonetheless, according to the manufacturer the specified capacity of oxygen transfer is still much higher than actually needed. To avoid an excessive oxygen input, the operation of the injector was controlled via online O2 (dissolved oxygen (DO)) measurements. The sensor was installed about 50 cm below the water surface (see Figure 17), thus facilitating maintenance works during the experimental phases. The DO concentration was set between 3 to 5 mg/L. In comparison, to minimise the energy demand of the aeration systems, the DO concentrations in municipal WWTPs are usually set not to exceed 0.5 mg/L in the aeration tanks (for carbon degradation only) [DWA A-131]. According to several check during the test operation of the pilot plant, the DO concentrations at the bottom of the reactor (4.7 meter below the water surface) were about 0.5 mg/L and even lower, whereas about 3 mg/L were measured at the installa-tion level. Aeration was activated when the monitored DO concentrations in the reactor fell below 3 mg/L and turned off (by closing the valve of the air pipe) after the measured value had exceeded 5 mg/L. Batch-wise aeration was applied in the reaction phases instead of continuous aeration as commonly used in fine bubble aeration systems. After the DO concentration had reached 5 mg/L and the valve had been turned off, the water was pumped in circulation to get nearly full mix-ing in the reactor and to avoid biomass settling, thus ensuring a continuous op-timum biological treatment process during the inactive aeration phases. After a time-controlled sedimentation phase, the effluent of the pilot plant flowed off by free fall through the magnetic-pneumatic valves which automati-cally switched on/off depending on the water depth in the reactor. In large-scale applications, the effluent could be discharged via commonly used decanters, possibly via the same (influent) pumps. Due to the quality requirements for the reuse as service water, SBR effluents have to be disinfected. In the pilot plant, one UV-disinfection unit was installed for primary disinfection. According to the manufacturer’s specifications, the UV unit could be operated with a maximal flow rate of 2.4 m³/h, and an average UV-dosage of 400 J/m², as recommended for effluent disinfection in municipal WWTPs [DWA M 209]. The reactor volume of the UV-disinfection unit amounts to 1.6 litre. The irradiation

Chapter 4 Greywater treatment using SBR 61
intensity of the UV is measured by the integrated UV-sensor in the disinfection unit. The influent to the UV-disinfection unit was controlled by using inductive flow measurement. The UV-dosage is calculated then by the following formula: UV dosage [J/m²] = irradiation density [W/m²]·transmission of the medium [%/cm]·HRT [s] by HRT [s] = effective volume of irradiation [m³] / Q [m³/s] The variations of UV dose in the experiments were controlled via flow rate as the total reactor volume of the UV unit was fixed. As the water has to contain certain concentrations of residual chlorine at the end of the distribution systems (respec-tively the end-user) to assure a long-term disinfection impact (cp Table 5), chlo-rine should be dosed in large-scale applications after UV disinfection as polishing disinfection. Compared to dosages usually applied in conventional municipal wastewater treatment, the chlorine dosage after UV disinfection can be reduced considerably. The chlorine disinfection was not applied in the pilot plant.
Figure 20 Pilot plant for the scientific investigation of greywater treat-ment using the specially configured SBR reactor

Chapter 4 Greywater treatment using SBR 62
With the above described configuration, maintenance and reparation needs were low for all installed equipment and during the whole experiment period from March 2007 to July 2008 (see Figure 20). A well thought-through process auto-mation could provide an additional assurance of process stability and reliability. 4.2 Methods The definition “greywater” used in this work is defined as discharges from baths/showers, hand wash basins and washing machines. Discharges from kitchen sinks are not included as they contain high organic loads (BOD), nitro-gen and phosphorous as well as suspended solids. A more complicated treatment process (with nutrient removal) would be necessary rather than only carbon degradation. As mentioned before, the used greywater was produced synthetically with wash-ing products, tap water and a certain portion of municipal wastewater as organic matters. The composition of the washing products based on the statements in the annual consumption statistics of Henkel AG in Germany [Henkel 2005] (see Table 13).
Table 13: Consumption statistics of washing products in Germany [Henkel 2005]
products quantities
toothpaste 2.53 mL/(C·d)
shower gel 3.05 mL/(C·d)
soap 0.17 g/(C·d)
liquid soap 0.17 g/(C·d)
cleaning products 7.44 g/(C·d)
oil / body lotion 0.26 mL/(C·d)
shampoo 4.63 mL/(C·d)
bubble bath 1.81 mL/(C·d)
washing powder 15.15 g/(C·d)
other washing agents 10.14 g/(C·d)
fabric softener 0.22 g/(C·d)
Chapter 4 Greywater treatment using SBR 63
It is thoroughly comprehensible that the Chinese consumption habits of washing products generally differ to those in Germany. Smulders (2002) reported on the different use of laundry detergents in European and Asian markets. For example, LAS (linear alkylbenzenesulfonates) are used as main surfactants (about 71% of all used surfactants) in washing products in the Asia/Pacific markets, compared to only about 36% in European markets together with other anionic surfactants. Smulders (2002) reported on the composition of powder heavy-duty detergent formulations which is comparable in China and Europe with regard to the used surfactants, builders and fillers. These three compounds are the main compo-nents of powder heavy-duty detergents. As there is no published statistics about the consumption of washing products in China, the data from Germany were used for the production of the synthetic greywater. At first, the washing products were mixed to get a paste and then tap water was added to get a 250-times "greywater" concentrate. This concentrate was diluted again by dosing more tap water until a "normal" greywater composition was achieved. Finally, a defined proportion of municipal wastewater (3-4% of the total influent flow rate of greywater) was added to serve as organic matter and to add micro-organisms. Due to expected difficulties in the technical handling, hair, fabric and personal adipose as well as particular matters were not included in the pilot-plant tests. The concentration of the synthetically produced grey-water in term of chemical parameters and microbiological parameters e.g. Coli-forms and E Coli was similar to the average concentrations of light polluted greywater according to published investigations (cp Figure 21 and Table 10, [Chang et al. 2007]). After the nutrient deficits had been observed in the test operation of the pilot plant, urea and potassium dehydrogenated phosphates were added to the greywater to improve the basic nutrient ratios for the biologi-cal process. Samples of the reactor influent and effluent as well as biomass samples were taken during the experiments periods. All the water samples were homoge-nised and analysed as follows: Physical parameters: pH, water temperature, turbidity,
conductivity; Chemical parameters: COD, Ntotal, NH4-N, NO3-N, Ptotal,
nionic surfactants, SS, dry solids contents,

Chapter 4 Greywater treatment using SBR 64
volatile SS as well as volatile dry solids contents.
The BOD5 of the water samples was analysed every two days instead of daily analysis. Biomass samples (activated sludge) were taken daily from one of the operation cycles and analysed for sludge volume index (SVI), dried solids, and volatile dried solids as well as MLSS and MLVSS. Samples of excess sludge were taken before discharge and analysed for the same parameters as the activated sludge, except SVI. The performance of the disinfection unit was controlled daily for a total of 3 months, by taking samples from the influent and the effluent of the UV unit. According to the quality requirements, total coliforms and E. coli were the main analysis parameters. The measurement of total coliforms and E. Coli (MPN/100mL) were taken by using the IDEXX Quanti-Tray®/2000 for the influ-ent samples and Quanti-Tray® for the effluent samples [IDEXX 2009]. From April 2007 to July 2008, a total of seven experimental phases plus the run-in phase were carried out in the pilot plant. The process operation parameters during the experimental phases are shown in Table 14:

Chapter 4 Greywater treatment using SBR 65
Table 14: Operation parameters of the SBR pilot plant
Phase Operation
features I II III IV V VI VII
flow [m³/d] -- 27.3 14.7 19.2 28.8
average water temperature [°C]
-- 15 25 25 18 20 23
tC [hours] 6 4 4 4
tR [hours] 4 2 2 2
MLSS [g/L] 4-7.7 7 4
cycles per day
varied 6
2 by day, recircula-
tion at night
3 by day, recircula-
tion at night
6
comments test phase main measurement
phases
optimisa-tion of
dosing of polyamine
dosage of polyamine 10 mg/L at the end of each cycle
by day
The first phase (August 2007) was the test operation of the pilot plant after the run-in period. The analysed parameters from this phase were not included in the overall evaluation of the results. The second and third experimental phases (Phase II and Phase III, September to December 2007) were carried out with relatively high F/M ratios [kgBOD5/(kgMLSS·d)] and two water temperatures (15°C and 25°C). The further two experimental phases (Phase IV and Phase V, April to June 2008) were carried out with relatively low F/M ratios [kgBOD5/(kgMLSS·d)] and two water temperatures (18°C and 25°C) as well. The main investigation regarding the performance of the SBR process in greywater treatment took place in these four experimental phases. In July 2008, two more experiment series (Phase VI and Phase VII) focused on the improvement of the effluent quality with regard to turbidity.
Chapter 4 Greywater treatment using SBR 66
4.3 Results 4.3.1 General evaluation regarding the treatment
performance Independent of the configuration of the different experimental phases, the bio-logical degradation process kept very stable, as BOD5 and anionic surfactants analyses show (see Figure 21). In general, their concentrations in the effluent were fulfilled the quality requirements (10 mg/L and 1 mg/L, respectively, cp Table 5 and Figure 21) while all the experimental phases. The effluent turbidity, however, did not fulfil the quality requirements (< 5 NTU) in the main experi-mental phases (Phase II to Phase V).
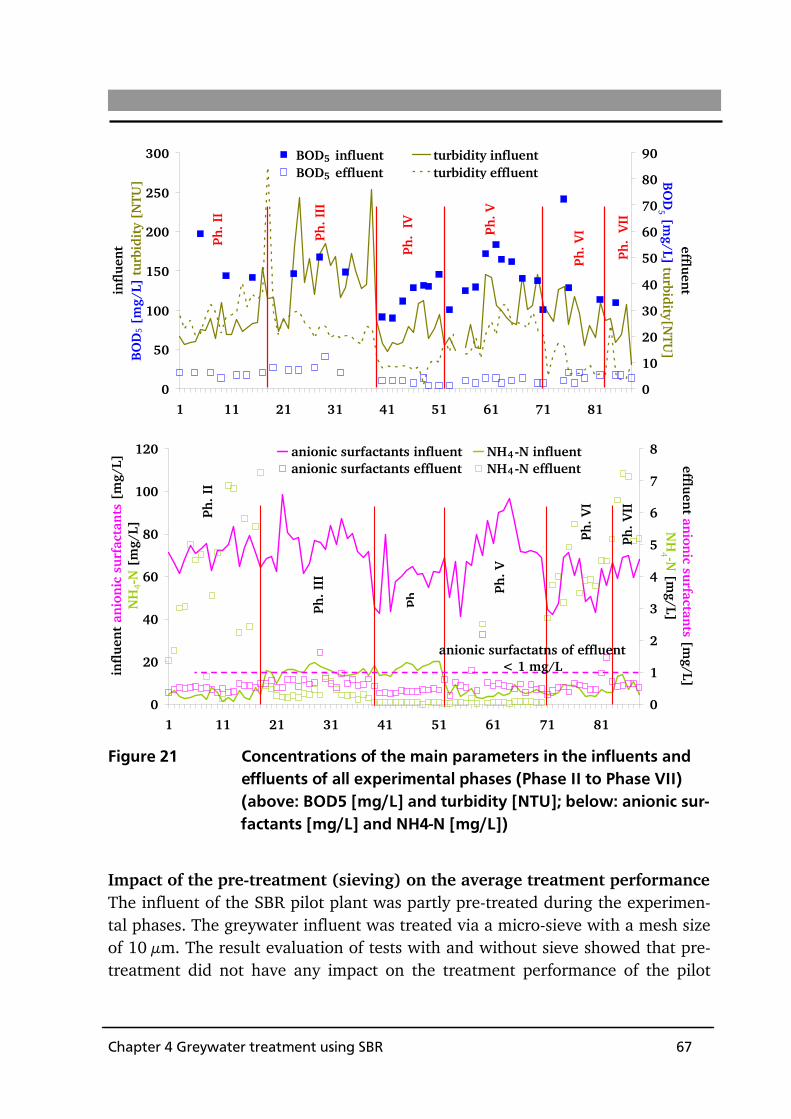
Chapter 4 Greywater treatment using SBR 67
0
50
100
150
200
250
300
1 11 21 31 41 51 61 71 81
infl
uent
BO
D5
[mg/
L] t
urbi
dity
[N
TU]
0
10
20
30
40
50
60
70
80
90
effluent B
OD
5 [mg/L] turbidity[N
TU]
BOD influent turbidity influentBOD effluent turbidity effluent
Ph. I
I
Ph. I
II
Ph.
IV Ph. V
Ph. V
I
Ph.
VII
5
5
0
20
40
60
80
100
120
1 11 21 31 41 51 61 71 81
infl
uen
t an
ion
ic s
urf
acta
nts
[m
g/L]
N
H4-
N [
mg/
L]
0
1
2
3
4
5
6
7
8
effluent
anion
ic surfactan
ts [mg/L]
NH
4 -N [m
g/L]
anionic surfactants influent NH -N influentanionic surfactants effluent NH -N effluent
Ph. I
I
Ph. I
II
Ph. Ph
. V
Ph. V
I
Ph. V
II
4
anionic surfactatns of effluent < 1 mg/L
4
Figure 21 Concentrations of the main parameters in the influents and effluents of all experimental phases (Phase II to Phase VII) (above: BOD5 [mg/L] and turbidity [NTU]; below: anionic sur-factants [mg/L] and NH4-N [mg/L])
Impact of the pre-treatment (sieving) on the average treatment performance The influent of the SBR pilot plant was partly pre-treated during the experimen-tal phases. The greywater influent was treated via a micro-sieve with a mesh size of 10 μm. The result evaluation of tests with and without sieve showed that pre-treatment did not have any impact on the treatment performance of the pilot

Chapter 4 Greywater treatment using SBR 68
plant. This is explained by the fact that no hair, fabric, etc. were added to the synthetic greywater (cp Chapter 4.2), thus making pre-treatment dispensable in this case. However pre-treatment using sieves with 1 mm mesh should be consid-ered for removing hair, fabric, etc., in large-scale applications. Impact of the F/M ratio on effluent COD and turbidity The impact of different F/M ratios on the average treatment performance was investigated in the main experimental phases (Phase II to Phase V). The per-formance of the biological degradation of BOD5 and anionic surfactants was very stable (degradation rates of more than 95% and 99%, respectively) in all phases after the adaptation of the biomass. The F/M ratios did not show any impact on the biological degradation rate (COD, BOD5, N and P) within the investigated limits. However, the effluent turbidity was affected critically. Figure 22 shows the COD and the effluent turbidity as function with the F/M ratios.
0
10
20
30
40
50
60
0.0 0.1 0.2 0.3F/M ratio [kgBOD5/(kgMLSS·d)]
CO
D [
mg/
L]tu
rbid
ity
[NT
U]
turbidityCOD
Figure 22 COD [mg/L] and turbidity [NTU] of the effluent as function of the F/M ratio [kgBOD5/(kgMLSS·d)]
The effluent turbidity in the main experimental phases was insufficient and did not fulfil the quality requirement for service water (< 5 NTU). Changes in the F/M ratio result in changes in turbidity, as is clearly shown in increasing effluent concentrations for turbidity and COD with an almost parallel increase of the F/M ratios.

Chapter 4 Greywater treatment using SBR 69
Impact of the water temperature on effluent COD and turbidity In Figure 23, the COD and turbidity in the effluent are plotted as function of the water temperature in two phases of F/M ratios.
0
20
40
60
80
10 20 30water temperature [°C]
CO
D [
mg/
L]
tu
rbid
ity
[NT
U]
turbidity COD
0
20
40
60
80
10 20 30water temperature [°C]
CO
D [
mg/
L]tu
rbid
ity
[NT
U]
turbidity COD
Figure 23 COD [mg/L] and turbidity [NTU] of the effluent as function of the water temperature [°C] with F/M ratios of 0.1-0.27 kgBOD5/(kgMLSS·d) (above) and of 0.04-0.09 kgBOD5/(kgMLSS·d) (below)
No explicit correlation between the COD of the effluent and the water tempera-tures can be observed in both cases, whereas the turbidity shows an obvious correlation with the water temperature. With increasing water temperatures, the effluent turbidity decreases in both cases. Impact of both F/M ratio and water temperature on effluent COD and tur-bidity

Chapter 4 Greywater treatment using SBR 70
Based on the data analyses above, the COD (left) and the turbidity (right) of the effluent are plotted again separately as functions of the F/M ratios and sepa-rately for different water temperatures (see Figure 24).
0
10
20
30
40
50
60
70
0.0 0.1 0.2 0.3F/M ratio [kgBOD5/(kgMLSS·d)]
CO
D [
mg/
L]
15/18°C25°C
0
10
20
30
40
0.0 0.1 0.2 0.3F/M ratio [kgBOD5/(kgMLSS·d)]
turb
idit
y [N
TU
]
15/18°C25°C
Figure 24 COD [mg/L] and turbidity [NTU] of the effluent as functions of the F/M ratio [kgBOD5/(kgMLSS·d)] in different water temperatures [°C]
It is clearly shown that – with the same F/M ratio – the effluent turbidity is up to 50% lower at the higher water temperature (25°C) than at the low water tem-peratures (15/18°C). This means, the higher water temperature has a positive impact on the effluent turbidity. However, the turbidity tends to increase – both at lower and higher water temperatures – with increasing F/M ratios. The COD values as function of the F/M ratios show a similar trend as the turbidity. How-ever, the COD of the effluent is up to 30% higher at the higher water tempera-ture (25°C) than that at the lower water temperatures (15/18°C), which is con-trary to the turbidity.

Chapter 4 Greywater treatment using SBR 71
4.3.2 Evaluation of further experiment results Below, experiment results regarding additional parameters, such as foaming capacity of anionic surfactants, absorption behaviour o biomass, SVI, etc, are discussed. Foaming capacity of anionic surfactants in greywater As explained in Chapter 4.2, the greywater used in the pilot plant experiments was produced by mixing washing products. Investigations by other authors showed that anionic surfactants in greywater could be a challenge regarding agricultural irrigation because of soil adsorption [Shafran 2006]. The aerobic biodegradability of anionic surfactants to be used in washing products must be over 80% according to WRMG (2007). High concentrations of anionic surfactants (up to 70 mg/L and more) indicate potential foaming in the reactor. However, up to now no reports have been published on the impact of anionic surfactants on the treatment process of greywater. Generally, DIN 53902 Part 2 (respectively ISO 696-1975, modified Ross-Miles method) is used for the determination of the foaming power of surfactants. In this work, the measuring of the foaming power of greywater was performed using the same principle, however in a simplified procedure. Lab-scale measuring equipment, its dimensions a proportional down-scale to the SBR pilot plant was used (see Figure 25).
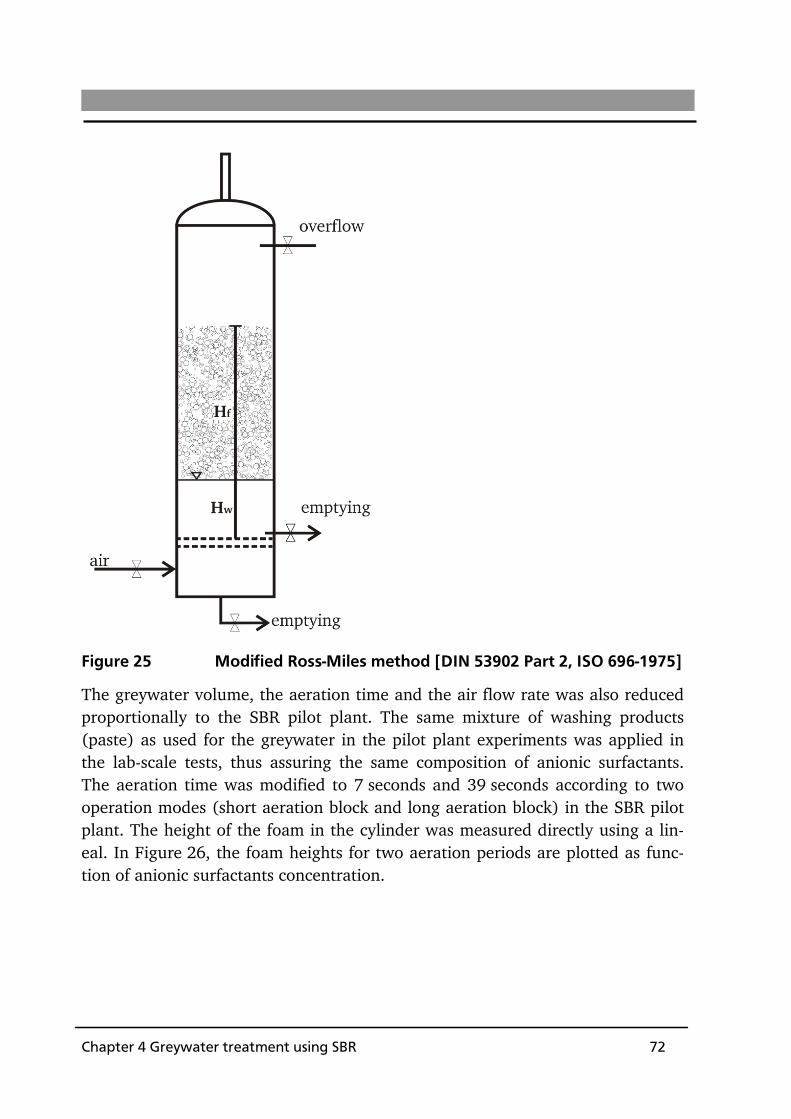
Chapter 4 Greywater treatment using SBR 72
Figure 25 Modified Ross-Miles method [DIN 53902 Part 2, ISO 696-1975]
The greywater volume, the aeration time and the air flow rate was also reduced proportionally to the SBR pilot plant. The same mixture of washing products (paste) as used for the greywater in the pilot plant experiments was applied in the lab-scale tests, thus assuring the same composition of anionic surfactants. The aeration time was modified to 7 seconds and 39 seconds according to two operation modes (short aeration block and long aeration block) in the SBR pilot plant. The height of the foam in the cylinder was measured directly using a lin-eal. In Figure 26, the foam heights for two aeration periods are plotted as func-tion of anionic surfactants concentration.
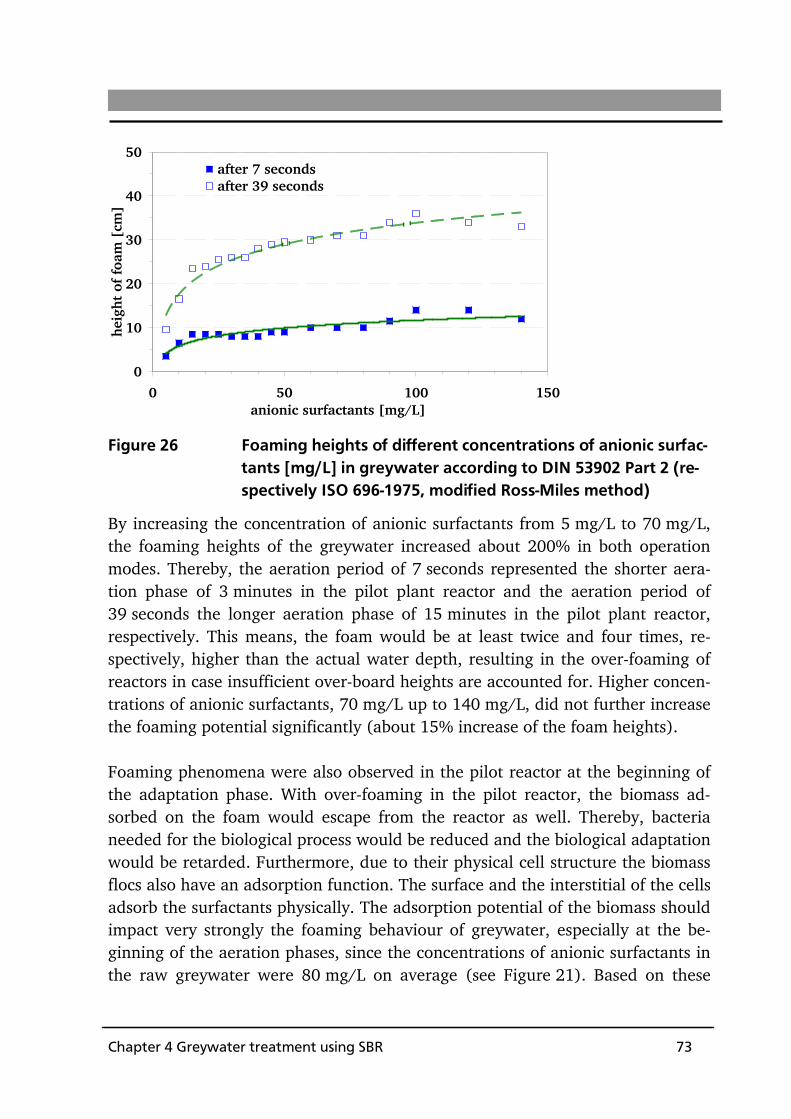
Chapter 4 Greywater treatment using SBR 73
0
10
20
30
40
50
0 50 100 150anionic surfactants [mg/L]
heig
ht o
f fo
am [
cm]
after 7 secondsafter 39 seconds
Figure 26 Foaming heights of different concentrations of anionic surfac-tants [mg/L] in greywater according to DIN 53902 Part 2 (re-spectively ISO 696-1975, modified Ross-Miles method)
By increasing the concentration of anionic surfactants from 5 mg/L to 70 mg/L, the foaming heights of the greywater increased about 200% in both operation modes. Thereby, the aeration period of 7 seconds represented the shorter aera-tion phase of 3 minutes in the pilot plant reactor and the aeration period of 39 seconds the longer aeration phase of 15 minutes in the pilot plant reactor, respectively. This means, the foam would be at least twice and four times, re-spectively, higher than the actual water depth, resulting in the over-foaming of reactors in case insufficient over-board heights are accounted for. Higher concen-trations of anionic surfactants, 70 mg/L up to 140 mg/L, did not further increase the foaming potential significantly (about 15% increase of the foam heights). Foaming phenomena were also observed in the pilot reactor at the beginning of the adaptation phase. With over-foaming in the pilot reactor, the biomass ad-sorbed on the foam would escape from the reactor as well. Thereby, bacteria needed for the biological process would be reduced and the biological adaptation would be retarded. Furthermore, due to their physical cell structure the biomass flocs also have an adsorption function. The surface and the interstitial of the cells adsorb the surfactants physically. The adsorption potential of the biomass should impact very strongly the foaming behaviour of greywater, especially at the be-ginning of the aeration phases, since the concentrations of anionic surfactants in the raw greywater were 80 mg/L on average (see Figure 21). Based on these
Chapter 4 Greywater treatment using SBR 74
experiments, further lab-scale experiments targeted at the determination of the adsorption potential of the biomass were carried out and are described below. Adsorption potential of the biomass regarding anionic surfactants in grey-water The experiments were carried out in lab-scales using 1-Litre glasses. Two types of biomass, which had been adapted in two biological processes (SBR and MBR) with identical raw greywater, were used for the experiments. At first, the bio-mass was settled to achieve a higher MLSS as starting point for the experiments and then it was diluted stepwise with greywater for the experiments. A short test period was chosen to avoid the beginning of biological degradation. Each meas-urement took 5 minutes for mixing with greywater and 5 minutes for sedimenta-tion. Subsequently, the concentration of anionic surfactants in the clear super-natant, i.e. residual anionic surfactants after adsorption, was analysed. The su-pernatant of the settled biomass before the experiments series was analysed for residual anionic surfactants. This value was subtracted from the measured value of residual anionic surfactants after the adsorption tests, to get the absolute con-centration of residual free anionic surfactants. The difference value in raw grey-water and the supernatants after adsorption tests describes the concentrations and (converted) loads of anionic surfactants, which were adsorbed by the bio-mass. The biomass from the SBR differs to that from the MBR from the F/M ratios, as the biomass was cultivated differently due to the specifications of the two pilot plants. The "MBR biomass" had very low F/M ratio (0.03 kgBOD5/(kgMLSS·d) on average) due to the extremely long SRT (cp Chapter 3.3) in the membrane bio-reactor, which was up to 120 days SRT in the special case here, while the "SBR biomass" was adapted with relatively high F/M ratio (0.15 kgBOD5/(kgMLSS·d) on average). The adsorption rate was calculated as function of the adsorbed anionic surfactants concentration and the anionic surfactants loads in the dosed raw greywater (see Figure 27).

Chapter 4 Greywater treatment using SBR 75
0
20
40
60
80
100
0 5 10 15 20 25MLSS [g/L]
adso
rpti
on r
ate
[%]
0.15 kgBOD5/(kgMLSS·d)
0.03 kgBOD5/(kgMLSS·d)
Figure 27 Adsorption of anionic surfactants [%] using two types of biomass based on the concentration of anionic surfactants [mg/L]
The biomass cultured at high F/M ratios showed a much better adsorption poten-tial than the biomass cultured at low F/M ratios significantly, although – as ex-plained before – the greywater influent was identical for both pilot plants. With the same MLSS concentrations (4 g/L), the biomass cultured at higher F/M ratios adsorbed about 80% anionic surfactants, approximately 20% more than the biomass cultured at low F/M ratios (about 60% adsorption), whereas 90% of anionic surfactants were adsorbed with 12 g/L MLSS cultured at high F/M ratios, 80% were adsorbed cultured at low F/M ratios. The biomass cultured at high F/M ratios had about the threefold potential to adsorb similar concentrations of anionic surfactants than the biomass cultured at low F/M ratios. This means, with anionic surfactants concentrations of 70 mg/L in greywater, the concentra-tions of free anionic surfactants – which influence foaming and aeration systems – were about 15 mg/L after contacting with 4 g/L MLSS biomass cultured at high F/M ratios and 12 mg/L with 12 g/L MLSS biomass cultured at low F/M ratios. These concentrations of free anionic surfactants in greywater are in a similar range (up to 15 mg/L) as the influent of municipal WWTPs. Such concentration levels would not cause serious problems in terms of excessive foaming during the aerobic biological treatment process [Henau et al. 1986]. Furthermore, with 70 mg/L of anionic surfactants in raw greywater and the same MLSS concentration of 4 g/L, the residual free anionic surfactants should be

Chapter 4 Greywater treatment using SBR 76
about 15 mg/L after contact with biomass cultured at high F/M ratios and about 27 mg/L after contact with biomass cultured at low F/M ratios. When applying constant aeration, 27 mg/L of free anionic surfactants would lead to an about 25% higher foaming potential than with 15 mg/L. This means, this higher con-centration of free anionic surfactants would cause problems of excessive foaming (cp Figure 27). Impact of F/M ratios on the sludge volume index (SVI) Beside the adsorption characteristics of biomass cultured at high F/M ratios, the biomass in the pilot plant also showed some other special properties. The sludge volume index (SVI) describes the settling behaviour of the biomass. The lower the value of the SVI, the better is the settling. The SVI of the biomass was 35 L/kg on average during the entire experimental work. In Figure 28, the SVI is plotted as function of the F/M ratios during the whole experiment periods.
0
10
20
30
40
50
0.0 0.1 0.2 0.3F/M ratio [kgBOD5/(kgMLSS·d)]
SVI
[L/k
g]
Figure 28 SVI [L/kg] as function of the F/M ratios [kgBOD5/(kgMLSS·d)]
It is evident that higher F/M ratios improved the settling characteristics of the biomass, as indicated by decreasing SVI values. According to DWA M-210, the SVI in SBR systems of municipal WWTPs normally is 120 L/kg. This means, the SVI achieved here, i.e. below 50 L/kg, offers a comparably more than 2-times better settling behaviour of the biomass.

Chapter 4 Greywater treatment using SBR 77
Impact of water temperatures on the sludge volume index (SVI) In Figure 29, the SVI is plotted as function of the water temperature. In none of the experimental phases there was any significant correlation observed between the SVI and the water temperature. In contrast, the SVI values stayed relatively stable between 20 and 45 L/kg independent of the respective variations of the water temperature.
0
10
20
30
40
50
10 20 30water temperature [°C]
SVI
[L/k
g]
Phase II Phase IIIPhase IV Phase V
Figure 29 SVI [L/kg] as function of the water temperature [°C]

Chapter 4 Greywater treatment using SBR 78
Correlation between the settling characteristics of the biomass (SVI) and the effluent turbidity As explained before, the settling characteristics of the biomass are described by the SVI. To determine the impact of the SVI on the effluent turbidity, in Fig-ure 30, the effluent turbidity is plotted as function of the SVI. The values are illustrated separately experimental phases with different F/M ratios.
0
10
20
30
40
20 30 40 50SVI [L/kg]
turb
idit
y [N
TU
]
0
10
20
30
40
20 30 40 50SVI [L/kg]
turb
idit
y [N
TU
]
Figure 30 the effluent turbidity [NTU] as function of SVI [L/kg] (above: experimental phases with F/M ratios of 0.1-0.27 kgBOD5/(kgMLSS·d), below: experimental phases with F/M ratios of 0.04-0.09 kgBOD5/(kgMLSS·d))
According to the plotted curves, the SVI does not show any direct correlations to the effluent turbidity with regard to different F/M ratios. The conclusion, which can be drawn from these diagrams, that there is a positive impact of the higher F/M ratio on the SVI, as here the SVI was 25 L/kg on average (60% higher) whereas the SVI was 40 L/kg on average during the phases with low F/M ratios.

Chapter 4 Greywater treatment using SBR 79
When plotting the values separately for different water temperatures (25°C and 15/18°C), in both cases the SVI tends to decrease with increasing effluent turbid-ity (see Figure 31).
0
10
20
30
40
20 30 40 50SVI [L/kg]
turb
idit
y [N
TU
]
15/18°C
0
10
20
30
40
20 30 40 50SVI [L/kg]
turb
idit
y [N
TU
]
25°C
Figure 31 the effluent turbidity [NTU] as function of SVI [L/kg] (above: 15/18°C; below: 25°C)

Chapter 4 Greywater treatment using SBR 80
Correlation between the compaction coefficient of the biomass (c = dried solidssed. Biomass: MLSS), the SVI and the effluent turbidity Samples of the settled biomass were taken by day at the end of each cycle. Dried solids (DS) and volatile dried solids (vDS) of the settled biomass were deter-mined then. Here, a compaction coefficient (c) is defined by Author as the ratio of the dried solids content of the settled biomass at the end of each cycle to the MLSS in the reactor during the aeration phase of each cycle. In Figure 32, the SVI and the effluent turbidity are plotted as function of the compaction coeffi-cient (c) with c < 7.5, separately for the experimental phases with different F/M ratios.
0
10
20
30
40
50
0 2 4 6 8c < 7.5 (c = dried solidssed. biomass: MLSS)
SVI
[L/k
g]
turb
idit
y [N
TU
]
turbiditySVI
0
10
20
30
40
50
0 2 4 6 8c < 7.5 (c = dried solidssed. biomass: MLSS)
SVI
[L/k
g]
turb
idit
y [N
TU
]
turbiditySVI
Figure 32 SVI [L/kg] and the effluent turbidity [NTU] as function of c<7.5 (c=compaction coefficient (dried solidssed. Biomass: MLSS); above: experimental phases with F/M ratios of 0.04-0.09 kgBOD5/(kgMLSS·d), below: experimental phases with F/M ratios of 0.1-0.27 kgBOD5/(kgMLSS·d))

Chapter 4 Greywater treatment using SBR 81
In both cases the SVI did not show any significant correlation to the compaction coefficient (c), whereas the effluent turbidity in the experimental phases with low F/M ratios correlates with the compaction coefficient, showing a significant decrease (almost linear) with the increasing c-values. This means, by the F/M ratios of 0.04-0.09 kgBOD5/(kgMLSS·d) (picture left), the compaction coefficient is higher, and the effluent quality concerning the effluent turbidity is the better. In Figure 33, the SVI and the effluent turbidity are plotted as function of the compaction coefficient (c) with c < 7.5 separately for the experimental phases with higher and lower average water temperatures.
0
10
20
30
40
50
0 2 4 6 8c < 7.5 (c = dried solidssed. biomass: MLSS)
SVI
[L/k
g]
turb
idit
y [N
TU
]
turbiditySVI
15/18°C
0
10
20
30
40
50
0 2 4 6 8c < 7.5 (c = dried solidssed. biomass: MLSS)
SVI
[L/k
g]
turb
idit
y [N
TU
]
turbiditySVI
25°C
Figure 33 SVI [L/kg] and effluent turbidity [NTU] as function of c<7.5 (c=compaction coefficient (dried solidssed. Biomass: MLSS); above: experimental phases with lower average water tem-peratures, below: experimental phases with higher average water temperatures)

Chapter 4 Greywater treatment using SBR 82
In both cases, the SVI increased with increasing c-values, and the effluent turbid-ity was improved with increasing c-values. However, there are no related and similar investigations known from municipal WWTPs using SBR process. As this phenomenon was not the main focus of this work, no further experiments were carried out. However, there should be detailed investigation in future to prove these observed correlations. Correlations between COD, turbidity and suspended solids of the effluent In Figure 34, COD and effluent turbidity are plotted, in each case as function of the suspended solids for checking the hypothesis that there are correlations be-tween COD, turbidity and suspended solids of the effluent, as expected before starting the pilot plant experiments.
0
10
20
30
40
0 20 40 60 80suspended solids [mg/L]
turb
idit
y [N
TU
]
0
20
40
60
80
0 20 40 60 80suspended solids [mg/L]
CO
D [
mg/
L]
Figure 34 Correlations between COD [mg/L], turbidity [NTU] and sus-pended solids [mg/L] of the effluent
As Figure 34 shows, the turbidity has an almost linear correlation to the sus-pended solids of the effluent, whereas the COD does not show any recognisable

Chapter 4 Greywater treatment using SBR 83
correlation. The higher the concentration of the suspended solids, the higher is the effluent turbidity. Impact of specific energy inputs on the effluent turbidity In the pilot plant, filling, aeration and recirculation in the reactor were per-formed jointly by the same centrifugal pump (cp Chapter 4.1). Centrifugal pumps are known for mechanical crushing of particles which then increase the turbidity in the effluent. The biomass was exposed to high mechanical shear forces during the active operating phases (aeration and circulation) in the pilot plant. In Figure 35, the effluent turbidity is plotted in following as function of the spe-cific energy inputs separately for the experimental phases with two different water temperatures (15/18°C and 25°C).
15/18°C
0
10
20
30
40
90 100 110 120 130specific energy input [W/m³]
turb
idit
y [N
TU
]
25°C
0
10
20
30
40
90 100 110 120 130specific energy input[W/m³]
turb
idit
y [N
TU
]
Figure 35 Impact of the net energy inputs [W/m³] on the effluent tur-bidity [NTU], tests with different water temperatures [°C]

Chapter 4 Greywater treatment using SBR 84
In both cases, the effluent turbidity increased with increasing specific net me-chanic loads. In the phases with 25°C water temperature, the effluent turbidity was reduced from 30 NTU to below 10 NTU, while the specific net energy inputs were reduced from 115 W/m³ to below 100 W/m³. In the phases with the water temperature of 15/18°C, the reduction trend is the same, yet not as precipitous; the effluent turbidity was reduced only from 35 NTU to below 15 NTU and the specific net energy input from 118 W/m³ to 92 W/m³. The results show that the effluent turbidity is caused by the energy inputs. To fulfil the quality requirements for the effluent turbidity, further experiments (Phase VI and Phase VII) were carried out. Here, the operation was optimised by dosing polyamine as flocculation aid. The experiment results are shown in Fig-ure 36. The effluent turbidity stayed below the limit value of 5 NTU when using a dosage of 10 mg/L polyamine at the end of each cycle by day.
0
10
20
30
40
1 2 3 4 5 6 7 8 9 10 11 12 13 14 15 16 17cycles
CO
D [
mg/
L] t
urbi
dity
[N
TU
] turbidity COD
cycles at night no dosing
Figure 36 Experiment series with polyamine dosing of 10 mg/L
Evaluation of the effluent disinfection As described, 3-4% municipal wastewater was added into the synthetical grey-water to serve as organic matter and to add micro-organisms. The concentration of microbiological parameters of the synthetical greywater measured was in the similar range (10³ to 108) as the values of the investigation published with real greywater (cp. Table 9 and 10). The effluent of the pilot plant therefore has to be disinfected to fulfil the quality requirements, i.e. total coliforms < 3 per litre. As
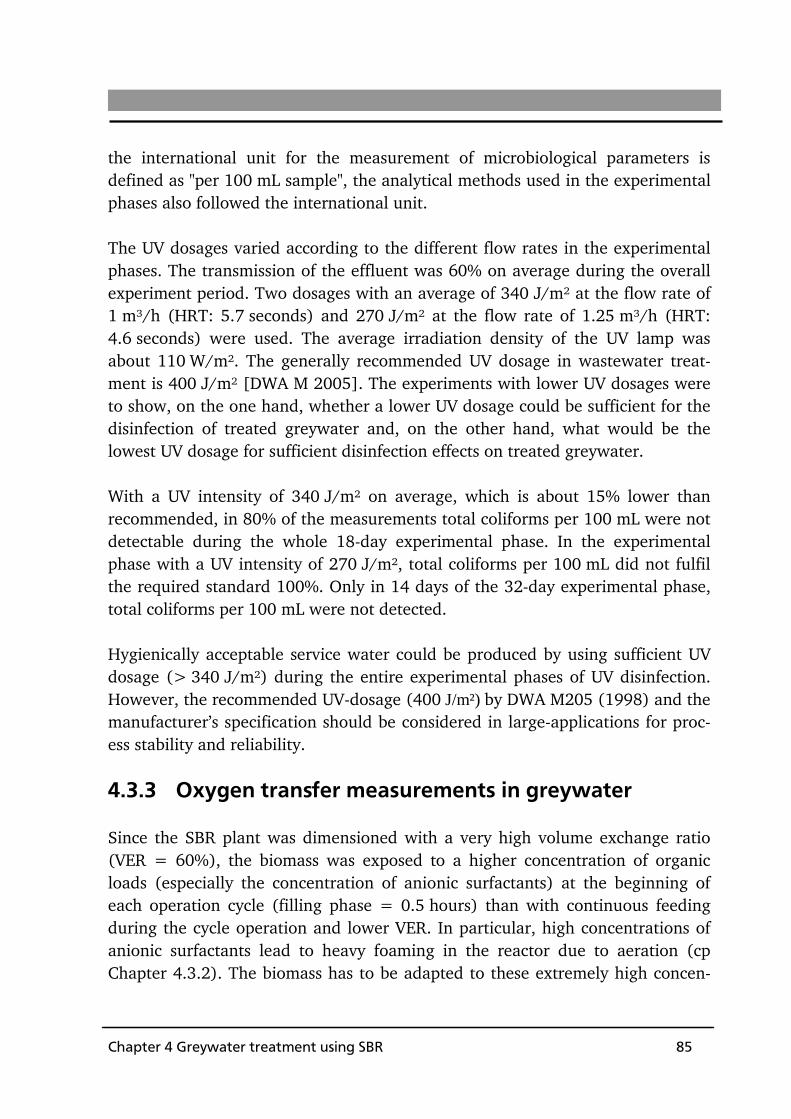
Chapter 4 Greywater treatment using SBR 85
the international unit for the measurement of microbiological parameters is defined as "per 100 mL sample", the analytical methods used in the experimental phases also followed the international unit. The UV dosages varied according to the different flow rates in the experimental phases. The transmission of the effluent was 60% on average during the overall experiment period. Two dosages with an average of 340 J/m² at the flow rate of 1 m³/h (HRT: 5.7 seconds) and 270 J/m² at the flow rate of 1.25 m³/h (HRT: 4.6 seconds) were used. The average irradiation density of the UV lamp was about 110 W/m². The generally recommended UV dosage in wastewater treat-ment is 400 J/m² [DWA M 2005]. The experiments with lower UV dosages were to show, on the one hand, whether a lower UV dosage could be sufficient for the disinfection of treated greywater and, on the other hand, what would be the lowest UV dosage for sufficient disinfection effects on treated greywater. With a UV intensity of 340 J/m² on average, which is about 15% lower than recommended, in 80% of the measurements total coliforms per 100 mL were not detectable during the whole 18-day experimental phase. In the experimental phase with a UV intensity of 270 J/m², total coliforms per 100 mL did not fulfil the required standard 100%. Only in 14 days of the 32-day experimental phase, total coliforms per 100 mL were not detected. Hygienically acceptable service water could be produced by using sufficient UV dosage (> 340 J/m²) during the entire experimental phases of UV disinfection. However, the recommended UV-dosage (400 J/m²) by DWA M205 (1998) and the manufacturer’s specification should be considered in large-applications for proc-ess stability and reliability. 4.3.3 Oxygen transfer measurements in greywater Since the SBR plant was dimensioned with a very high volume exchange ratio (VER = 60%), the biomass was exposed to a higher concentration of organic loads (especially the concentration of anionic surfactants) at the beginning of each operation cycle (filling phase = 0.5 hours) than with continuous feeding during the cycle operation and lower VER. In particular, high concentrations of anionic surfactants lead to heavy foaming in the reactor due to aeration (cp Chapter 4.3.2). The biomass has to be adapted to these extremely high concen-

Chapter 4 Greywater treatment using SBR 86
trations of anionic surfactants (cp Chapter 4.2) besides the usual biological adap-tation for wastewater. After the adaptation phase of the biomass (up to 8 weeks depending on the operation conditions), foaming did not occur any more (see Figure 37). High concentrations of anionic surfactants did not impair the process stability after the biomass had been adapted.
Figure 37 Foaming before adaptation of the biomass (left); adapted biomass (right)
The impact of anionic surfactants on the oxygen transfer rate should be verified additionally, since there were no known investigations especially related to high concentration of anionic surfactants in the greywater treatment accordingly. The oxygen transfer rate and respectively the a-value are the most important pa-rameters in the design of aeration systems. To determine the a-value in grey-water treatment, oxygen transfer measurements were carried out both in clean water and greywater by using pure oxygen and desorption methods according to the work regulation DWA M-209 (2007). Totally, three measurement points were installed in three different levels (positioned both horizontal and vertical) of the reactor. The measurement system consisted of one online measurement of the air flow rate (HÖNTZSCH), three online sensors (ORBISPHERE) for measur-ing of dissolved oxygen in water and one data logger system (Advantech) for online data collection. Water temperature, air pressure and air temperature were noted manually for the data evaluation via computer software (OACW and evaluation tables via EXCEL). The experiments in greywater were performed with two volume specific air flow rates (2.3 m³N/(m³·h) and 3.3 m³N/(m³·h)) and two respective concentrations of MLSS (7 g/L and 4 g/L). The biomass was kept under endogenous respiration during the measurements in greywater. The a-value under both measurements conditions at 7 g/L MLSS (thereof 52% MLVSS) and at 4 g/L (thereof 46%

Chapter 4 Greywater treatment using SBR 87
MLVSS) amounted to 0.7-0.85. These values are in a comparable range as those measured in municipal wastewater treatment plant. The a-value for the design of the aeration systems in the greywater treatment can be assumed as the com-monly applied values in the design of municipal wastewater treatment plants. 4.4 Summary of the experimental results and according
determination of key design parameters for a large-scale SBR plant for greywater treatment
In summary of the above presented experimental results, it can be concluded, therefore, that the tested SBR process using defined configurations is suitable for greywater treatment. The pilot plant used in this work follows a simple, robust and reliable process concept. The treatment performance could fulfil the requirements of the Chinese guide-lines for service water as toilet flushing water after process optimisation with dosage of polymers. The quality requirements of the service water with regard to TDS, BOD5, NH4-N and anionic surfactants could be met after the adaptation of the biomass. The required standard regarding total coliforms was maintained after respective UV disinfection. Compliance with the quality requirements to-wards effluent turbidity could be realised through operation optimisation or optional dosing of polymers if required. The biomass in the special configured SBR shows also different properties con-cerning the much better settling behaviours, compact cell structures and higher adsorption potential of the anionic surfactants compared to the “normal” loaded biomass in the municipal WWTPs as well as in the MBR. In large-scale applications of greywater treatment using the tested SBR process, the quality requirements towards effluent turbidity could be met through im-proved conformation of the mechanical aggregates for reducing the mechanical shear forces without additional operation and maintenance expenses. Based on the tested pilot plant, the following design data are recommended for design of a SBR plant for greywater treatment in large-scale applications:
Chapter 4 Greywater treatment using SBR 88
buffer tanks upstream of the SBR reactors should be installed for pro-viding a smooth influent into the SBR reactors;
a sieve with 1 mm mesh should be installed for protecting the down-stream equipment;
the VER of the reactors should be between 40 % and 60 %;
the cycle time of 4 hours in greywater treatment is sufficient for com-plete biological degradation of carbon organics: preset with 0.5 hours for filling, 2 hours for aeration, 1 hour for sedimentation and 0.5 hours for discharge;
MLSS in reactor with 4 g/L;
SVI with 50 L/kg up to max. 70 L/kg (for process stability);
a-value with 0.7 at MLSS of 4 g/L for dimensioning the aeration system;
a sufficient adaptation period considering the degradation of high con-centrations of anionic surfactants in greywater should be provided for at the beginning of the operation processes.
Chapter 5 Design and discussion of a large scale GTP using SBR 89
5 Design of a large-scale greywater treatment plant using SBR as part of a semi-centralised supply and treatment system
In this chapter, a large-scale greywater treatment plant (GTP) using the investi-gated SBR process is designed and described in context of a semi-centralised supply and treatment system (SSTS) for urban areas in China. Following the design and the description of the greywater treatment plant, the next focus is to discuss the possibilities of technical modularisation of greywater treatment in context of the dynamic development of the SSTS. 5.1 Design input data The overall boundary conditions, e.g. water demands of toilet flushing, grey-water flow rates etc., are defined and used as basis for the technical plant design. As explained in Chapter 4, greywater in this work is defined as discharges from washing machines, baths/showers and hand wash basins from private house-holds. The data are based on statistics for the City Qingdao from Bi (2004). Size of the catchment area of the exemplary SSTS First, the size of the exemplary SSTS has to be determined, before designing the greywater treatment plant (GTP) with SBR. Bieker (2009) worked on the identi-fication of the optimum size of the catchment area for a SSTS, considering their varying boundary conditions, e.g. used techniques, energy prices, land prices as well as the dynamic moving-in mechanism in the catchment area. It was con-cluded by Bieker 2009 that a catchment area with 52,000 inhabitants is the op-timum size for the application of a SSTS. Based on Bieker’s investigation, the exemplary GTP using SBR is designed for 52,000 inhabitants. The catchment area is then divided into four supra cells, the surface areas of which should be allocated to the different functional utilisations according to the Chinese guide-line for planning housing estates [GB 50180-1993, amended in 2002] The total areas are split into four main functional areas: public greens 16%, areas with house buildings 56%, areas of public streets 20% and areas for public facilities 8% [BMBF 2006].

Chapter 5 Design and discussion of a large scale GTP using SBR 90
Total flow rate of greywater and demands on service water The total tap water demand in private household amounts to 109 L/(C·d) in the City Qingdao ([Bi 2004], see Figure 38). Thereof, the population-specific flow rate of greywater is 41 L/(C·d) from baths/showers and washing machines.
toilets flushing33 L/(C·d)
drinking3 L/(C·d)
shower/bathing33 L/(C·d)
washing machines8 L/(C·d)
cooking/dish washing25 L/(C·d)
cleaning7 L/(C·d)
Figure 38 Tap water demand [L/(C·d)] in private households of City Qingdao [Bi 2004]
In this exemplary case, the intended purpose of service water reuse in the hous-ing estates is toilet flushing, which amounts to 33 L/(C·d) on average (see Fig-ure 38). Nonetheless, , the service water could also be used as irrigation water for public greens and cleaning water for streets areas. However, the use for toilet flushing in the housing estates should be guaranteed as top priority. The service water demand for public use in the exemplary SSTS should be converted from the area-specific demands (by m²) into population-specific demands (cp Chapter 3.1). In the exemplary case, the population-specific water demand for public use of irrigation and streets cleaning is calculated by the total area of streets and public greens, two work tours per day and 2 L/(m²·work tour) for irrigation and 1.5 L/(m²·work tour) for street cleaning. The population-specific water demands amount to 6 L/(C·d) for each irrigation of public greens and street cleaning. Service water for these public purposes is only needed in the summer months (from Mai to September). This means that in the summer months the total de-mand of service water within a SSTS amounts to about 45 L/(C·d), which ex-ceeds the totally available service water of 38 L/(C·d) considering the volume of the withdrawal in the treatment process (7% of the total influent, cp Table 19).

Chapter 5 Design and discussion of a large scale GTP using SBR 91
If needed, the treated blackwater could be used to cover the deficit of service water in the summer months. The total treatment capacity of the GTP is 2,132 m³/d based on the above pre-sented data. The average flow rate of greywater (118 m³/h, (18 hours average, cp Table 16)) is used as the influent flow rate for the design of the SBR, thus requiring a buffer tank to balance varying influent flows. The available service water amounts to 1,983 m³/d, whereas the water demand for toilet flushing within the exemplary case amounts to 1,716 m³/d. The excessive service water amounts to 267 m³/d, which could be used for other purposes both within the semi-centralised treatment centre or the overall area of the SSTS. Time-variation curves of greywater influent and toilet flushing For the design of the GTP, the hydraulic feeding must be determined for the dimensioning of the influent buffer tank. In the last years, there have not been many published data regarding time-varied flow rates of greywater in large hous-ing estates. Knerr et al. (2007) and Eriksson et al. (2008) reported on their stud-ies in two domestic buildings, with 15 inhabitants in Kaiserslautern (Germany) and 84 apartments in Copenhagen (Denmark). In both cases, greywater included the discharge from baths/showers, hand wash basins, washing machines and kitchen (dish washing machines). The daily flow rate of greywater were about 1.2 m³/d in the investigation of Knerr et al. (2007) and about 4.5 m³/d in the investigation of Eriksson et al. (2007). The results of both studies are plotted in Figure 39.

Chapter 5 Design and discussion of a large scale GTP using SBR 92
0
5
10
15
0 4 8 12 16 20 24hours
[%]
[Knerr et al 2007]
[Eriksson et al 2008]
Figure 39 24-hour time variation curve of greywater flow rates in two published studies [Knerr et al. 2007, Eriksson et al. 2007]
The percentage of the hourly flow rate to the daily total flow rate is plotted as function of the hours. Evidently, the peak hours of greywater flow are in the morning between 5 and 10 o’clock and in the evening between 18 and 22 o’clock. The flow rates in the peak hours between 5 and 10 o’clock were twice as high as those between 18 and 22 o’clock. Although both studies took place in small housing units with less than 5 m³/d, they were assumed as technical basis for large housing estates. Living habits in China are different from those in Europe. Figure 40 shows time variation curves of tap water supply for two cases. The illustration above is the supply curve of a water work [Edu 2006] and the one below is the supply curve of the secondary pump station in a housing estate [Libang 2008]. It is evident that the maximal peak flow occurs between 19 and 22 o’clock in the both cases and the second peak flow between 7 and 9 o’clock in the pump station of the water work and around 12 o’clock at noon in the housing estates. Looking at the supply curve of the secondary pump station in the housing estate, the maximal peak of the tap water demand is between 19 and 22 o’clock, which is contrary to the described investigations in Europe. This phenomenon has to be accounted for when generating the 24-hour time variation curve of greywater for the exem-plary design.
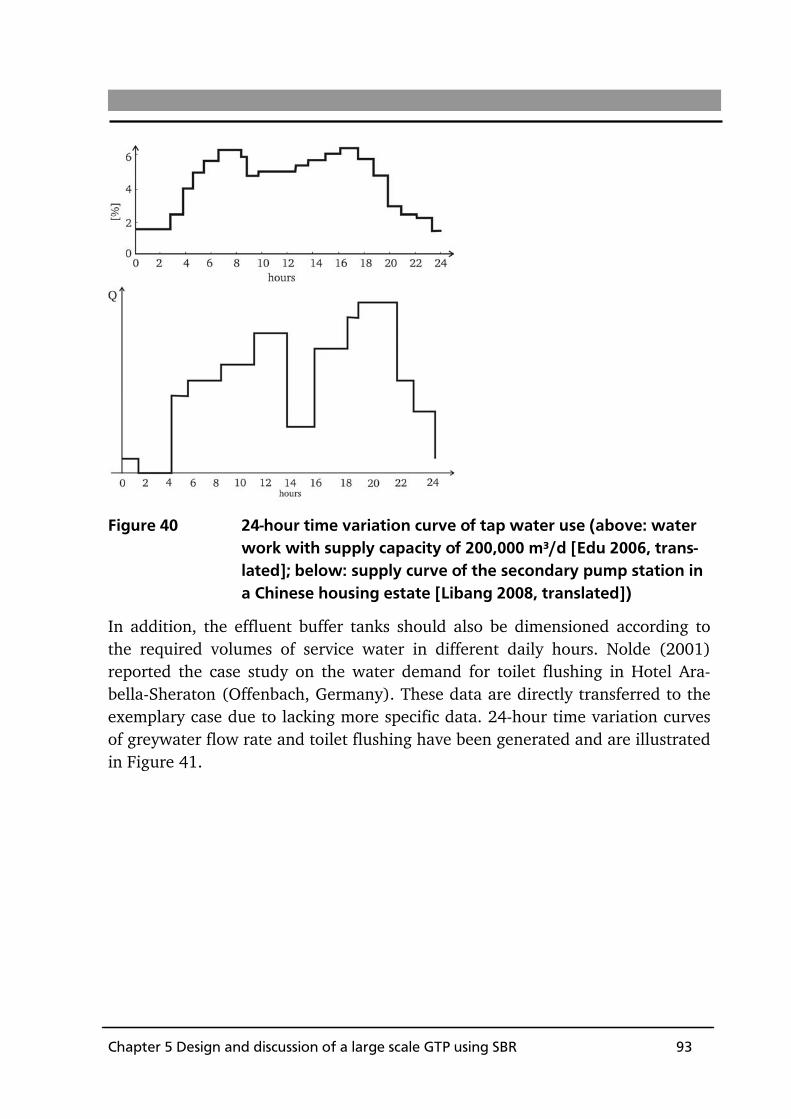
Chapter 5 Design and discussion of a large scale GTP using SBR 93
Figure 40 24-hour time variation curve of tap water use (above: water work with supply capacity of 200,000 m³/d [Edu 2006, trans-lated]; below: supply curve of the secondary pump station in a Chinese housing estate [Libang 2008, translated])
In addition, the effluent buffer tanks should also be dimensioned according to the required volumes of service water in different daily hours. Nolde (2001) reported the case study on the water demand for toilet flushing in Hotel Ara-bella-Sheraton (Offenbach, Germany). These data are directly transferred to the exemplary case due to lacking more specific data. 24-hour time variation curves of greywater flow rate and toilet flushing have been generated and are illustrated in Figure 41.
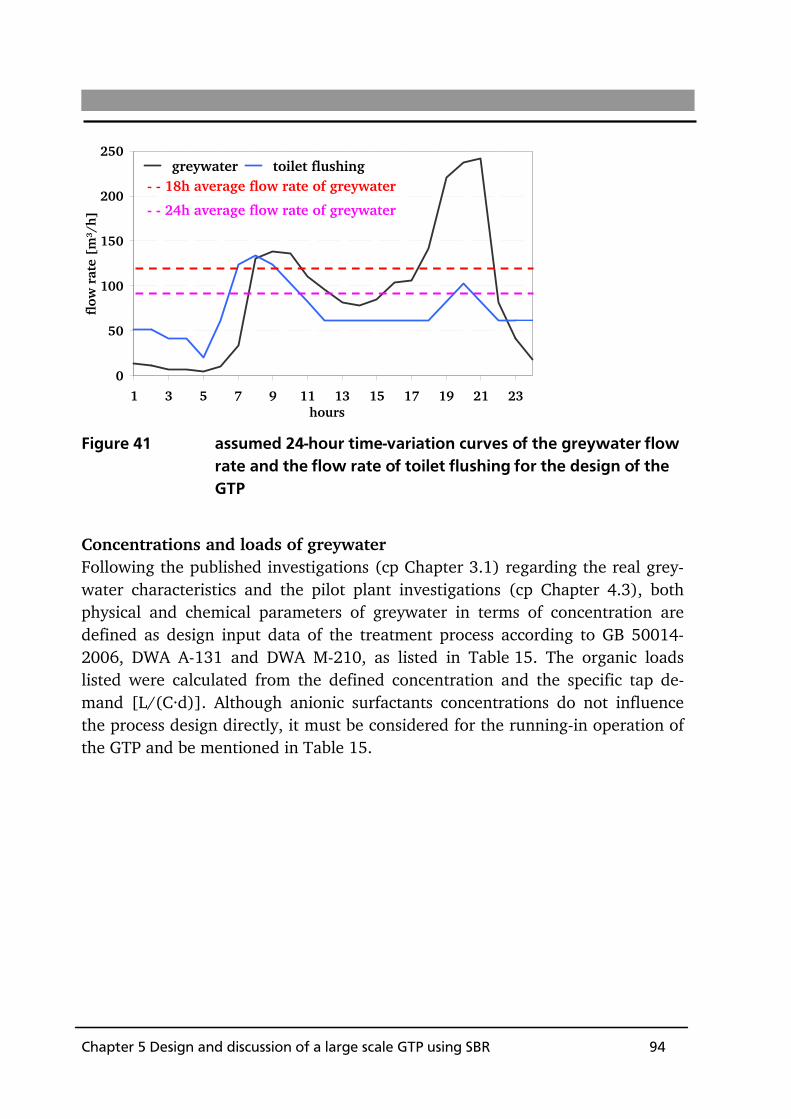
Chapter 5 Design and discussion of a large scale GTP using SBR 94
0
50
100
150
200
250
1 3 5 7 9 11 13 15 17 19 21 23hours
flow
rat
e [m
³/h]
greywater toilet flushing- - 18h average flow rate of greywater
- - 24h average flow rate of greywater
Figure 41 assumed 24-hour time-variation curves of the greywater flow rate and the flow rate of toilet flushing for the design of the GTP
Concentrations and loads of greywater Following the published investigations (cp Chapter 3.1) regarding the real grey-water characteristics and the pilot plant investigations (cp Chapter 4.3), both physical and chemical parameters of greywater in terms of concentration are defined as design input data of the treatment process according to GB 50014-2006, DWA A-131 and DWA M-210, as listed in Table 15. The organic loads listed were calculated from the defined concentration and the specific tap de-mand [L/(C·d)]. Although anionic surfactants concentrations do not influence the process design directly, it must be considered for the running-in operation of the GTP and be mentioned in Table 15.

Chapter 5 Design and discussion of a large scale GTP using SBR 95
Table 15: Physical and chemical parameters of greywater for the design of the biological treatment process according to [based on GB 50014-2006]
water temperature 20°C ± 5°C
concentration load
mg/L g/(C·d)
COD 300±75 12.3±3.1
BOD 120±30 4.9±1.2
SS 250±100 10.3±4.1
N 7±3 0.3±0.12
P 4±1 0.2±0.04
anionic surfactants 50±15 2.1±0.6
According to GB 50014-2006, the assumed total BOD5 load of the municipal WWTPs is 50 g/(C·d) which is usually taken as maximum value for the design of a new plant in China. According to this value, the respective greywater loads are about 10% of the total loads of the municipal wastewater. Based on the BOD5 load, the treatment capacity of the GTP is 5,200 PE (population equivalents) Design parameters of the SBR process The basic design of the SBR process includes three reactors to be used as mini-mum number to assure continuous stable operation. The following key design parameters of the specified SBR reactors are based on the pilot investigations (cp Chapter 4.4):
SRT = 4 days, MLSS = 4 g/L, VER = 60%, a = 0.7 (for the design of the aeration systems), SVI = 50 L/kg, total preset cycle time: tC = 4 hours, split into filling period tF =
0.5 hours, reaction period tR = 2 hours, settling period tS = 0.5 hours and discharge of the effluent tD = 0.5 hours.
Chapter 5 Design and discussion of a large scale GTP using SBR 96
Design parameters of the UV disinfection unit The UV disinfection units are dimensioned according to both the experimental results presented in Chapter 4.3.2 and DWA M-205 (1998). For GTP in the ex-emplary case, DWA M-205 suggests a UV dosage of 300 to 450 J/m², hereby regarding experiences from municipal WWTPs. With regard to the radiation densities (5 to 400 W/m²), the UV radiator is specified as low-pressure radiator by the manufacturer [DWA M-205]. According to the experimental results, the radiation density of the UV radiator is assumed to be 110 W/m² for the design of the UV disinfection units, the HRT in the disinfection unit 6 seconds and the transmission of the treated greywater 60% (cp Chapter 4.3.2). The power con-sumption of the UV radiator is 100 W/radiator according to the manufacturer’s specification. Based on the assumptions above, the proposed UV dose is about 400 J/m², which provides sufficient disinfection for the treated greywater. The respective electric power input of the UV disinfection is calculated to be about 40 Wh/m³ treated water, according to DWA M-205. 5.2 Design and description of the greywater treatment
plant using SBR The process design of used the biological treatment is according to DWA A-131 and the processs design of the SBR is according to DWA M-210. For the biologi-cal treatment process, only carbon degradation is considered in the dimensioning since the nutrient loads are just sufficient for normal biological treatment. The input data are listed in Table 16.

Chapter 5 Design and discussion of a large scale GTP using SBR 97
Table 16: Overview of the design input data
52,000 inhabitants
41 L/(C·d)
Q d, total 2,132 m³/d
Q 18h-average 118 m³/h
COD 300 mg/L
BOD5 120 mg/L
SS 250 mg/L
daily BOD5-load 256 kg/d
MLSS in reactor 4 kg/m³
SVI 50 L/kg
SRT 4 day
VER 60 %
tC (total cycle duration) 4 h
mC (number of cycles) 6 d-1
tF (filling time) 0.5 h
tR (reaction time) 2 h
tS (settling time) 1 h
tD (decantation time) 0.5 h
a-value 0.7 --
average UV dose 400 J/m²
The design results of the GTP using SBR are shown in Table 17 for the calcula-tion example of using three reactors. The results are classified into the compo-nents output data of the process design, dimension of the reactors and tanks, dimension of the UV disinfection units and aeration systems.

Chapter 5 Design and discussion of a large scale GTP using SBR 98
Table 17: Design results of the GTP, exemplified for using three SBR reactors
Output data of the process design units
excess sludge production kg/d 436.4
total reactor volume m³ 790
specific treatment volume L/C 15.2
DV m³ (each reactor) 158
capacity of the decanter m³/h (each reactor) 316
Dimension of the reactors
size of each reactor in quadratic length(surface) m (m²) 7 (49)
water depth (hw) m 5.4
height of the reactor m 6
minimal water depth (hw, min) m 2.15
sludge depth (hs) m 0.80
Dh = hw,min – hs (> 25 cm and 0.1·hw according DWA M-210)
m 1.38
settling velocity of the sludge (vS) m/h 4.35
installed height of the injector in the reactor m 1.87
Dimension of the influent buffer tank
total needed buffer volume (incl. reserve volume)
m³ 375
size of tank m (m²) 5 X 15 (75)
water depth (hw) m 5
total depth of the tank m 5.5
specific volume of the tank L/C 7.2

Chapter 5 Design and discussion of a large scale GTP using SBR 99
Dimension of the effluent storage tank
total needed storage volume (cp Chapter 6) m³ 600
size of tank m (m²) 5 X 24 (120)
water depth (hw) m 5
total depth of the tank m 5.5
specific volume of the tank L/C 11.5
Dimension of the UV disinfection units
required effective irradiation volume litre 530
length of the disinfection channel m 1.5
width of the disinfection channel m 0.6
water depth (hw) m 0.6
total depth of the channel m 1.0
Dimension of the aeration systems
specific oxygen demand kgO2/kgBOD5 0.99
daily oxygen demand kgO2/d 254
maximal oxygen demand kgO2/h 26.5
needed oxygen supply capacity kgO2/h 39.5
needed oxygen supply capacity, per reactor kgO2/h per reactor 13.2
Based on the dimensioning results, the GTP using the SBR process is illustrated exemplary in Figures 42 and Figures 43. They show a possible arrangement of a compact SBR plant for greywater treatment in plan view (Figures 42) and side view (Figures 43) with the respective layout of machinery and flow directions, whereby the GTP is only one part of the semi-centralised treatment centre (STC). The applying dimensions are the net dimensions of the construction for demon-stration. No constructional dimensions are considered and shown in both illustra-

Chapter 5 Design and discussion of a large scale GTP using SBR 100
tions. Three SBR reactors with their associated machineries (a pump and an injector for each reactor) are arranged side by side aboveground with the UV-disinfection unit and the control centre (construction and installations in black lines). Each pump serves as inlet, outlet and recirculation pump as well as a part of aeration unit together with the injector following the basic idea of the pilot plant (cp. Chapter 4.1). Both the influent and the effluent storage tank, the influent screening plant are arranged underground (constructions and installations in brown lines) under the SBR reactors to reduce the absolute foot print of the entire GTP. The excess sludge will be pumped via a separated sludge pump for the further treatment within the STC.
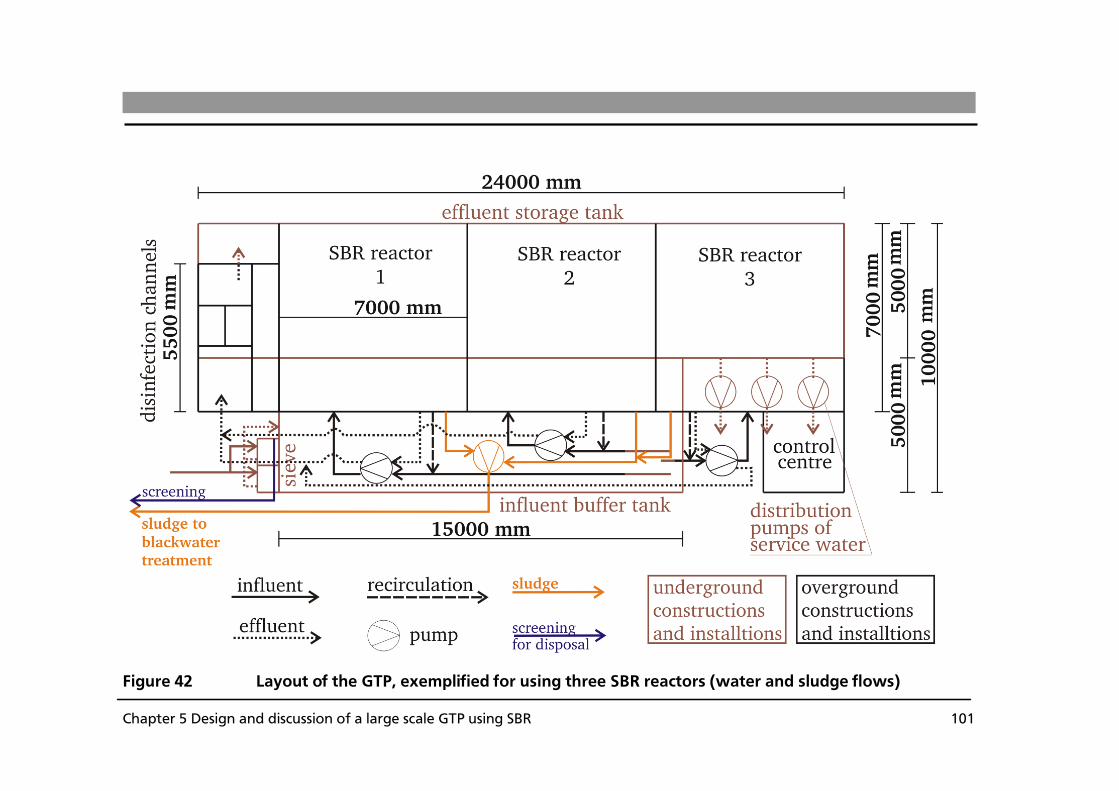
Chapter 5 Design and discussion of a large scale GTP using SBR 101
Figure 42 Layout of the GTP, exemplified for using three SBR reactors (water and sludge flows)

Chapter 5 Design and discussion of a large scale GTP using SBR 102
Figure 43 Side view of the GTP, exemplified for using three SBR reactors

Chapter 5 Design and discussion of a large scale GTP using SBR 103
The installed machineries in the GTP are listed in Table 18.
Table 18: Installed machinery in the GTP using SBR process
influent/decanter pumps m³/h (per reactor) 316
influent sieves 2 lines à 160 m³/h
installed injector (numbers X oxygen supply capacity)
kgO2/h per reactor 3 X 4.7
(numbers X power input) kW/reactor 3 X 5.9
total power input of the pumps kW 17.7
UV-disinfection units 2 lines à 160 m³/h
energy consumption of UV-disinfection units
kW/d 85
sludge pump (assumed power input 5 kW)
m³/h 20
5.3 Modularisation of the greywater treatment plant
in context of the dynamic development of the semi-centralised supply and treatment systems
5.3.1 Calculation basis and procedures applied according
to LAWA (2005) The above designed example of a GTP using SBR process is based on the conven-tional construction mode, which means, the treatment plant is built according to the designed capacity and will start its operation under-loaded. Over the years, with the development of the connected catchment area, the treatment capacity will be fully utilised step by step. In the SSTS, the dynamic growth of large resi-dential areas should be considered when constructing the STC. The main advan-tage of the modular construction of the STC facilities is the potential of flexible adjustment to the development of the SSTS (cp Chapter 2.3.2). The technical modularisation of the treatment facilities is therefore one of the essential compo-nents for the overall technical development of the STC (cp Chapter 2.3.2). How-ever, in context of the SSTS it has not been investigated until now. An appropri-
Chapter 5 Design and discussion of a large scale GTP using SBR 104
ate modularisation of the STC construction would provide additional advantages for the SSTS regarding the dynamic adjustment of the treatment facilities. No treatment facility should be under-utilised long-term while waiting for the com-plete moving-in of the inhabitants, and no treatment facility would be over-loaded due to lacking of treatment capacities. Bieker (2009) investigated the dynamic growth of large residential areas regard-ing different sizes of catchment areas and their dynamic developments. The date of full capacity of the STC depends on the different moving-in scenarios. Besides the selected treatment systems and the price of energy and land, the moving-in mechanism of a new residential area impacts mostly on the total specific invest-ment costs of the STC, especially considering the under-utilised treatment facili-ties. For the investigation, four basic scenarios were assembled considering the moving-in mechanism of large residential areas [Bieker 2009]. According to the four scenarios, the complete moving-in of all 52,000 inhabitants – the optimum size of the SSTS catchment area – takes 12, 24, 30 or 48 months, i.e. 250 to 1,000 inhabitants per week moving-in. Bieker’s investigation (2009) showed that higher specific investment costs in [€/(C·d)] were caused by the fact that the treatment facilities were built wide ahead of the development of the catchment area. However, Bieker’s investigation regarded only the impacts of the dynamic devel-opment of the catchment area and the technical components of the SSTS, but not the modularisation of each technical component in SSTS. In this work the techni-cal modularisation will be discussed by example of the optimum size of a SSTS catchment area using a dynamic comparative cost calculation. The compared dynamic cost calculation is based the German KVR guidelines [LAWA 2005] and in term of specific net present value [€/(C·a)] [Maurer 2009] including capital expenditure (CAPEX), reinvestment costs and operating expense (OPEX) for a total of 25 years depreciation period. The CAPEX and the OPEX of the GTPs using SBR process considering different construction modes – conventional con-struction and modular construction – are investigated regarding published inves-tigations (cp Chapter 6.3). Further assumptions were taken for the compared calculation of SNPV in following:
1. five module sizes with each 2,500, 5,000, 10,000, 15,000 and 20,000 inhabitants per reactor unit;
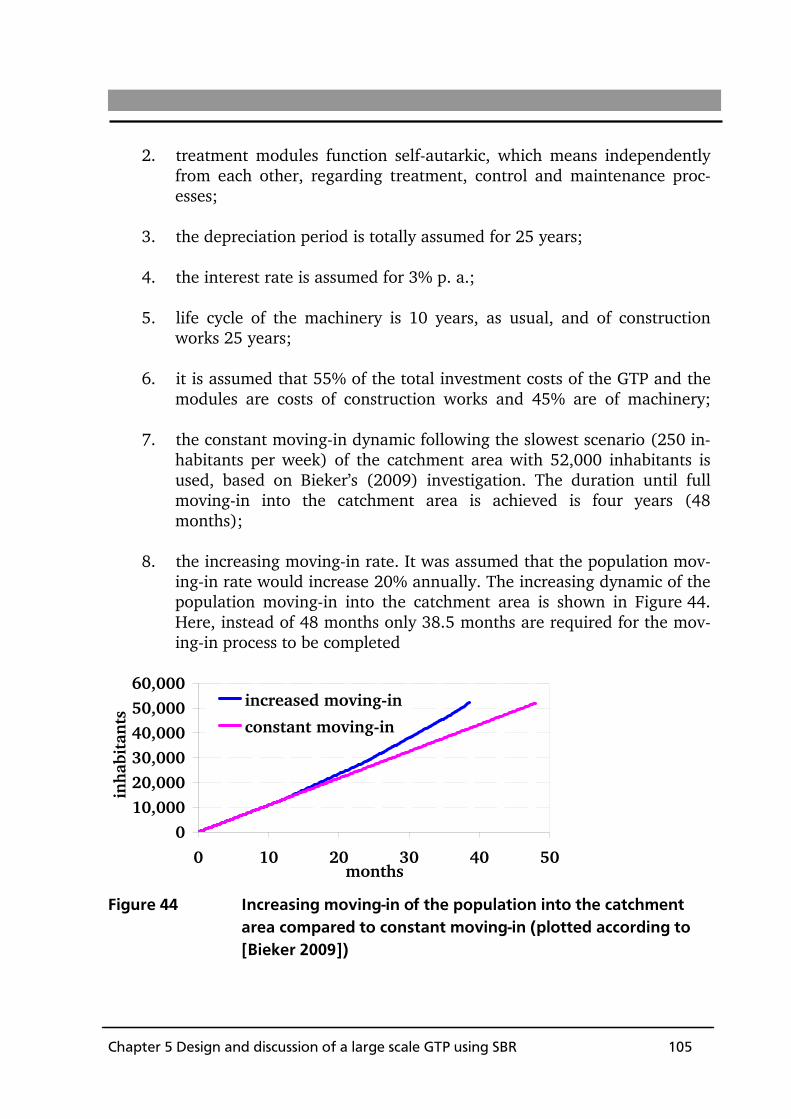
Chapter 5 Design and discussion of a large scale GTP using SBR 105
2. treatment modules function self-autarkic, which means independently from each other, regarding treatment, control and maintenance proc-esses;
3. the depreciation period is totally assumed for 25 years;
4. the interest rate is assumed for 3% p. a.;
5. life cycle of the machinery is 10 years, as usual, and of construction works 25 years;
6. it is assumed that 55% of the total investment costs of the GTP and the modules are costs of construction works and 45% are of machinery;
7. the constant moving-in dynamic following the slowest scenario (250 in-habitants per week) of the catchment area with 52,000 inhabitants is used, based on Bieker’s (2009) investigation. The duration until full moving-in into the catchment area is achieved is four years (48 months);
8. the increasing moving-in rate. It was assumed that the population mov-ing-in rate would increase 20% annually. The increasing dynamic of the population moving-in into the catchment area is shown in Figure 44. Here, instead of 48 months only 38.5 months are required for the mov-ing-in process to be completed
010,00020,00030,00040,00050,00060,000
0 10 20 30 40 50months
inha
bita
nts
increased moving-in
constant moving-in
Figure 44 Increasing moving-in of the population into the catchment area compared to constant moving-in (plotted according to [Bieker 2009])
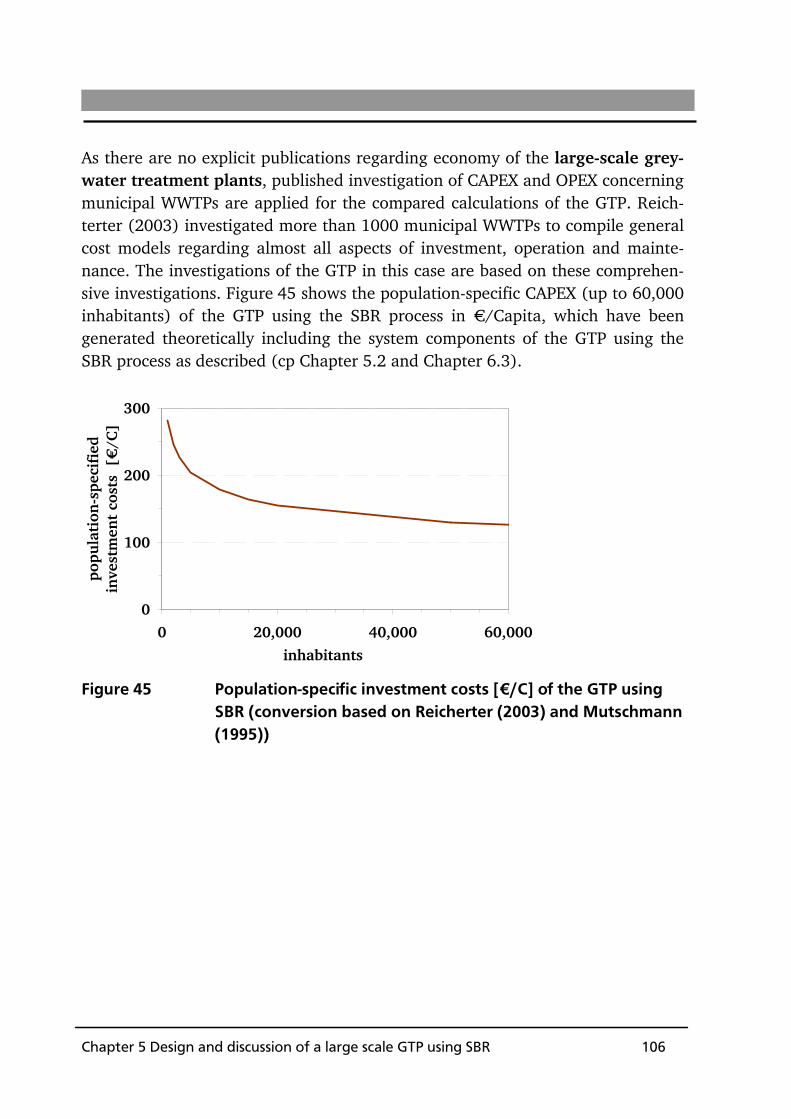
Chapter 5 Design and discussion of a large scale GTP using SBR 106
As there are no explicit publications regarding economy of the large-scale grey-water treatment plants, published investigation of CAPEX and OPEX concerning municipal WWTPs are applied for the compared calculations of the GTP. Reich-terter (2003) investigated more than 1000 municipal WWTPs to compile general cost models regarding almost all aspects of investment, operation and mainte-nance. The investigations of the GTP in this case are based on these comprehen-sive investigations. Figure 45 shows the population-specific CAPEX (up to 60,000 inhabitants) of the GTP using the SBR process in €/Capita, which have been generated theoretically including the system components of the GTP using the SBR process as described (cp Chapter 5.2 and Chapter 6.3).
0
100
200
300
0 20,000 40,000 60,000
inhabitants
popu
lati
on-s
peci
fied
in
vest
men
t co
sts
[€
/C]
Figure 45 Population-specific investment costs [€/C] of the GTP using SBR (conversion based on Reicherter (2003) and Mutschmann (1995))

Chapter 5 Design and discussion of a large scale GTP using SBR 107
Figure 46 shows population-specific OPEX of municipal WWTPs in function of their treatment capacity in population equivalents and with regard to three cate-gories of utilised treatment capacity, according to Reicherter’s investigations (2003). As greywater only covers 10% of the total municipal wastewater loads (cp Chapter 5.2), the modules also include only 10% of the served inhabitants as their population equivalents for the calculation. On the one hand, the smaller each module unit, the higher are the population-specific CAPEX accordingly, as well as the population-specific OPEX (see Figures 45 and 46). On the other hand, the larger each module, the longer is the treatment unit under-utilised, which causes up to 50% more specific OPEX than fully utilised units. The red lines extrapolates the investigated results, while the blue areas show the ranges used in the module calculations hereafter (see Figure 46).
Figure 46 Specific operation costs of WWTPs in function of population equivalents (PE), with varied capacity utilization (adjusted and anew plotted according to [Reicherter 2003])
5.3.2 Results of the dynamic comparative cost calculation
concerning specific net present values of the grey-water treatment plant
Specific net present values (SPNV) [€/(C·a)] of GTPs using the SBR process for 52,000 inhabitants are compared, (a) with conventional construction (complete construction at the beginning, under-utilised treatment for the first four years), and (b) with modular construction concerning different module sizes. All calcu-

Chapter 5 Design and discussion of a large scale GTP using SBR 108
lation data with defined parameters and applied sizes of module units are shown specified detailed in Appendix 2-8. Figure 47 above shows the calculation results of each module size and the con-ventional construction of the GTP for 52,000 inhabitants and below the compari-son in percentage using the SNPV of the conventional construction as 100%.
0
100
200
300
0 5 10 15 20 25year
spec
ific
net
pre
sen
t va
lue
[€/(
C·a
)]
2500 5000 10000 15000 20000
GTP (52,000 inh.) with conv. construction
module size (inh.)
0%
50%
100%
150%
200%
0 5 10 15 20 25year
2500 5000 10000 15000 20000
module size (inh.)
GTP (52,000 inh.) with conv. construction
Figure 47 specific net present value [€/(C·a)] of the GTP (52,000 inhabi-tants) with modular construction (different module sizes) and conventional construction (above) and the comparison in per-centage using the SNPV of the conventional construction as 100% (below)
In the first year, the starting SNPV vary in a large range, from about 125 €/(C·a) by using a start module size of 15,000 inhabitants to more than 320 €/(C·a) by using the conventional construction for 52,000 inhabitants. By using the modular construction concerning different module sizes, the SNPV in the first year amounts from 122 to 260 €/(C·a), are approximately 20% up to 63% lower than

Chapter 5 Design and discussion of a large scale GTP using SBR 109
by using the conventional construction. The overall annual costs of the GTP with conventional construction is about 12 €/(C·a), which is about 30% to 70% lower than that with modular construction concerning different sizes of module units(see Figure 47). The SNPV of the 25th year of the GTP with modular con-struction vary between 16 and 20 €/(C·a). Although the CAPEX of each module unit are much lower than the CAPEX of the conventional construction of the GTP for 52,000 inhabitants, the OPEX of the smaller module unit sizes, besides the reinvestment costs within the 25 years depreciation period, cause higher annual expenses which both significantly im-pact on the total SNPV. The total annual costs (20 €/(C·a)) of the smallest module unit (2,500 inhabi-tants) are up to 25% higher compared to the larger modules of the GTP, whereas the total annual costs of the four larger module sizes vary around 10% from 16 to 18 €/(C·a). Therefore, it could be concluded that the technical module size could be applied and combined flexibly depending in the needs of the constant moving-in dynamic. The STC could be started with reasonably small units, which is suggested by the author here, starting with a minimal module size of 5,000 inhabitants to be adjusted and supplemented with other modules, when re-quired. A second calculation was carried out to determine the impact of the increasing moving-in dynamic on the SNPV and the overall annual costs of the GTP with combined modular construction in comparison to the conventional construction. As the results from the first calculation show, the overall annual costs of the module unit sizes between 5,000 and 20,000 inhabitants, only differ within 10%, the module units for 52,000 inhabitants can therefore be configured flexibly depending on the development of the catchment area. It is assumed that the development of the catchment area starts slowly, so that smaller module units (5,000 inhabitants) are used at the beginning. Larger module units (10,000 and 15,000 inhabitants) are implemented later to cover the faster increase of the capacity demands of the GTP. As most technical system components of the modular construction of the GTP as well as the STC have a comparative small treatment capacity concerning the population equivalents, the units can be manufactured offsite and erected then
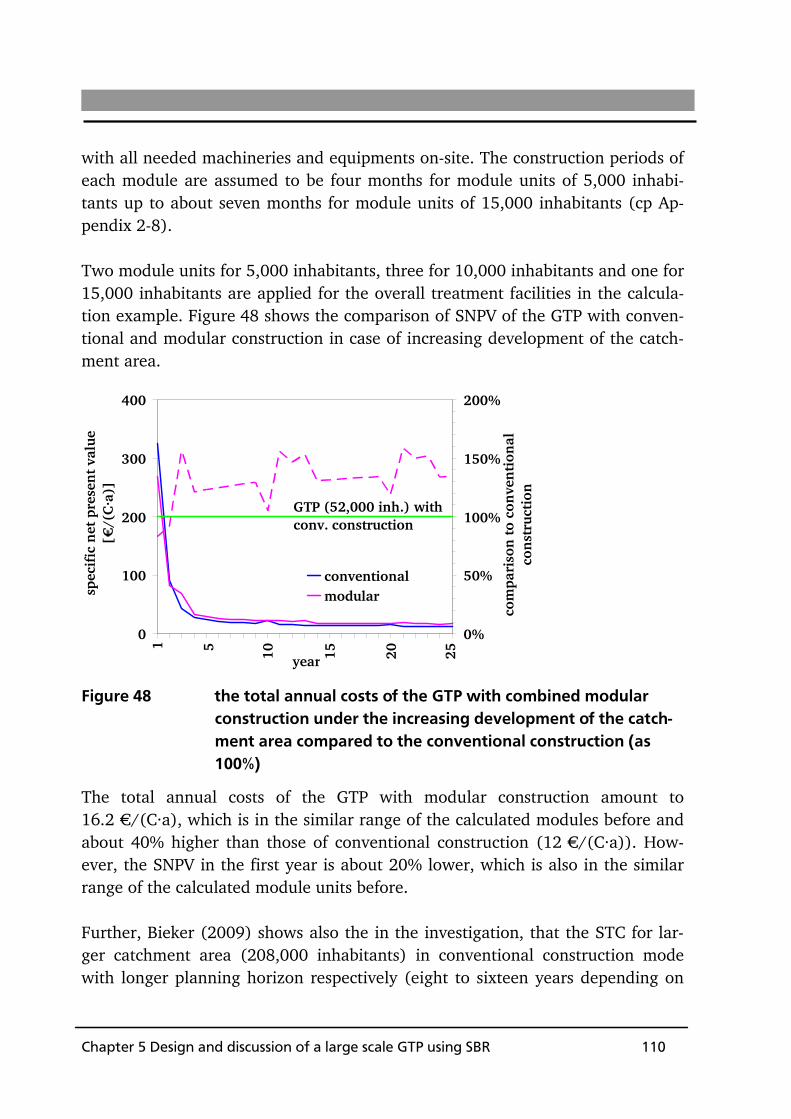
Chapter 5 Design and discussion of a large scale GTP using SBR 110
with all needed machineries and equipments on-site. The construction periods of each module are assumed to be four months for module units of 5,000 inhabi-tants up to about seven months for module units of 15,000 inhabitants (cp Ap-pendix 2-8). Two module units for 5,000 inhabitants, three for 10,000 inhabitants and one for 15,000 inhabitants are applied for the overall treatment facilities in the calcula-tion example. Figure 48 shows the comparison of SNPV of the GTP with conven-tional and modular construction in case of increasing development of the catch-ment area.
0
100
200
300
400
1 6 11 16 21
spec
ific
net
pre
sen
t va
lue
[€/(
C·a
)]
0%
50%
100%
150%
200%
year
com
pari
son
to
con
ven
tion
al
con
stru
ctio
n
conventionalmodular
GTP (52,000 inh.) with conv. construction
15 20105
25
Figure 48 the total annual costs of the GTP with combined modular construction under the increasing development of the catch-ment area compared to the conventional construction (as 100%)
The total annual costs of the GTP with modular construction amount to 16.2 €/(C·a), which is in the similar range of the calculated modules before and about 40% higher than those of conventional construction (12 €/(C·a)). How-ever, the SNPV in the first year is about 20% lower, which is also in the similar range of the calculated module units before. Further, Bieker (2009) shows also the in the investigation, that the STC for lar-ger catchment area (208,000 inhabitants) in conventional construction mode with longer planning horizon respectively (eight to sixteen years depending on

Chapter 5 Design and discussion of a large scale GTP using SBR 111
the development dynamics has significantly higher overall annual cost (more than 30%) than the STC for the optimal catchment area (52,000 inhabitants) due to the under-loaded treatment facilities at beginning phase of the catchment area (see Figure 49).
0
0,1
0,2
0,3
0,4
0,5
13 26 52(a) 52 (b) 104 (a) 104 (b) 208
10³ inhabitants
spec
ific
tot
al c
ost
[€/(
C·d
)] o
f ST
C in
con
ven
tioa
l con
stru
ctio
n
constant and continious moving-inslow moving-in at the beginning and increasing
Figure 49 the specific total costs of the STC in conventional construction considering the under-loaded treatment capacity in different size of the STCs (new plotted according to Bieker (2009))
The technical modularisation with reasonable chosen module size should com-pensate this costs overrun due to the under-loaded treatment capacities. There-fore, the example considering the technical modularisation of a GTP using SBR in STC with 208,000 inhabitants is calculated for comparison (cp Appendix 9). Totally, one unit for 5,000 inhabitants, one for 10,000 inhabitants, one for 15,000 inhabitants and nine units for 20,000 inhabitants are applied for the overall treatment facilities in the calculation example.

Chapter 5 Design and discussion of a large scale GTP using SBR 112
1
100
0 5 10 15 20 25year
spec
ific
net
pre
sen
t va
lue
[€/(
C·a
)]
52,000 inh. conv. 52,000 inh. modular208,000 inh. modular
0%
100%
200%
0 5 10 15 20 25year
52,000 ihn. conv. 52,000 ihn. modular208,000 inh. modular
Figure 50 the specific net present value (above) of GTP (208,000 inhabi-tants) with modular construction) and the percentage (be-low) compare with that (52,000 inhabitants) with both con-ventional as 100% (below) and modular construction
Figure 50 illustrates, on the one side, the SNPV in the first year and the overall annual cost of the calculation example (208,000 inhabitants) amount each with 190 €/(C·a) and 11.4 €/(C·a), which is even up to 40% lower than the respec-tively costs of the GTP in STC (52,000 inhabitants) with conventional construc-tion (320 €/(C·a) and 12 €/(C·a)). On the other hand, the SNPV of the the GTP (208,000 inhabitants) with modular construction are much higher (about 30 – 80%) from the third to the eighth years due to the consecutively investments of new module units.

Chapter 5 Design and discussion of a large scale GTP using SBR 113
Based on the theoretical comparative calculation of the SNPV and the overall annual costs considering varied sizes of module units and a combined module construction, on the one side, a high flexibility of technical application and ad-justment of the GTP is given, as shown above. The free combination of different sizes of module units (> 5,000 inhabitants) does not impact the final costs sig-nificantly. Moreover, the free technical combination guarantees the optimum adjustment to the dynamic development of the respective catchment areas. In the first two to four years, the SNPV of the GTP with modular construction are even up to 60% lower than those with conventional construction, thus significantly minimising the starting risks and difficulties for investors. On the other hand, in the whole 25-year depreciation period, the overall annual costs of the GTP with modular construction depending on applied sizes of mod-ule units are up to 60% higher than those with conventional construction. This is caused by consecutively CAPEX at the beginning, higher reinvestments costs of machines during the depreciation period and higher OPEX of the autarkic opera-tion of smaller modules. Although the OPEX are included in the dynamic com-parative costs calculation of the total annual costs, it should be mentioned that not only the OPEX affect financial costs, the technical and personnel issues are also more complicated than in GTP with conventional construction and opera-tion. The longer the planning horizon and the larger the expected catchment areas, the much more significantly costs compensation concerning the overall annual costs through the reasonable chosen modularisation of the technical greywater treatment units in comparison of the investigation of Bieker (2009). In the calcu-lated example, the overall annual cost for greywater treatment units in STC of 208,000 inhabitants is up to similar range of that in STC of 52,000 inhabitants through the modularisation (cp Figure 49 and Figure 50).

Chapter 5 Design and discussion of a large scale GTP using SBR 114

Chapter 6 Comparison of three treatment techniques 115
6 Comparison of three treatment techniques (BAF, MBR and SBR) for greywater reuse
A first comparison of the three chosen techniques for greywater treatment (cp Chapter 3) evaluating technical data from published investigations shows that BAF, MBR and SBR are all principally suitable for greywater treatment. Below, a detailed comparison of BAF, MBR and SBR as integrated part of large-scale greywater treatment under technical, ecological and economic aspects is pre-sented. Figure 51 shows the processes and respective facility components for dimensioning a large-scale greywater treatment plant (GTP).
influent SBR storage
MBR(incl. influent buffer tank)
sieve (1 mm)
storageinfluent
BAFsieve (1 mm) storage
influent disinfection reuseinfluent buffer tank
sieve (1 mm)
disinfection reuse
disinfection reuseinfluent buffer tank
Figure 51 Process schemes for GTPs using BAF, MBR and SBR
Pre-treatment in all three technical processes, is carried out via a sieve of 1 mm mesh size. Thereby, suspended solids, especially hair and fabrics are removed from greywater in order to protect the following equipments. Generally, the concentrations of suspended solids in the influent of the BAF should be below 100 mg/L, even lower than 75 mg/L to minimise the risk of filter blockage and ensure a stable operation [DWA 2000]. In the optimal case, the mesh size of the sieve for the pre-treatment of the BAF process should be reduced to 0.2 mm, depending on the actual composition of the respective greywater. The influent buffer tanks of the BAF and the SBR are to ensure a smooth hydraulic feeding of the biological treatment process. Regarding the SBR, the influent buffer tank could be integrated in the main reactor volume via operation with a varied VER (see Chapter 3.2 – SBR) if required. For comparison, in the MBR process, varia-tions in the hydraulic feedings are balanced with variable water depths in the reactor. Although, both configurations (varied VERs in SBR and varied water depths in MBR) do not require the construction of influent buffer tanks, there are additional expenses for large reactor volumes and automatic operation controls
Chapter 6 Comparison of three treatment techniques 116
as well as additional chambers for the membrane modules. To assure the compli-ance with national water quality requirements and a reliable distribution of ser-vice water, effluent storage tanks downstream of the effluent disinfection unit are essential in all three treatment processes and intended to be identical in this work. The effluent storage tank volumes are dimensioned for 10 L/C, which ensures one toilet flushing minimum per person at the daily peak time. An addi-tional 10 – 15% should be allowed for as work volume. 6.1 Technical aspects Below, technical parameters, treatment performance, such as fulfilments of the quality requirements of service water for intra-urban reuse (effluent concentra-tions of BOD5, NH4-N, anionic surfactants, turbidity etc., GB/T 18920-2002), quantity of the excess sludge, sludge retention time (SRT) as well as other key parameters will be evaluated together with a comparison in technical aspects. Table 19 shows the comparison in overview. The listed values are based on the dimensioning of a large-scale GTP using the key parameters identified in the investigated pilot plant. To facilitate the evaluation, all values are presented based on per Capita [C] or per m³ treated water, as far as possible.
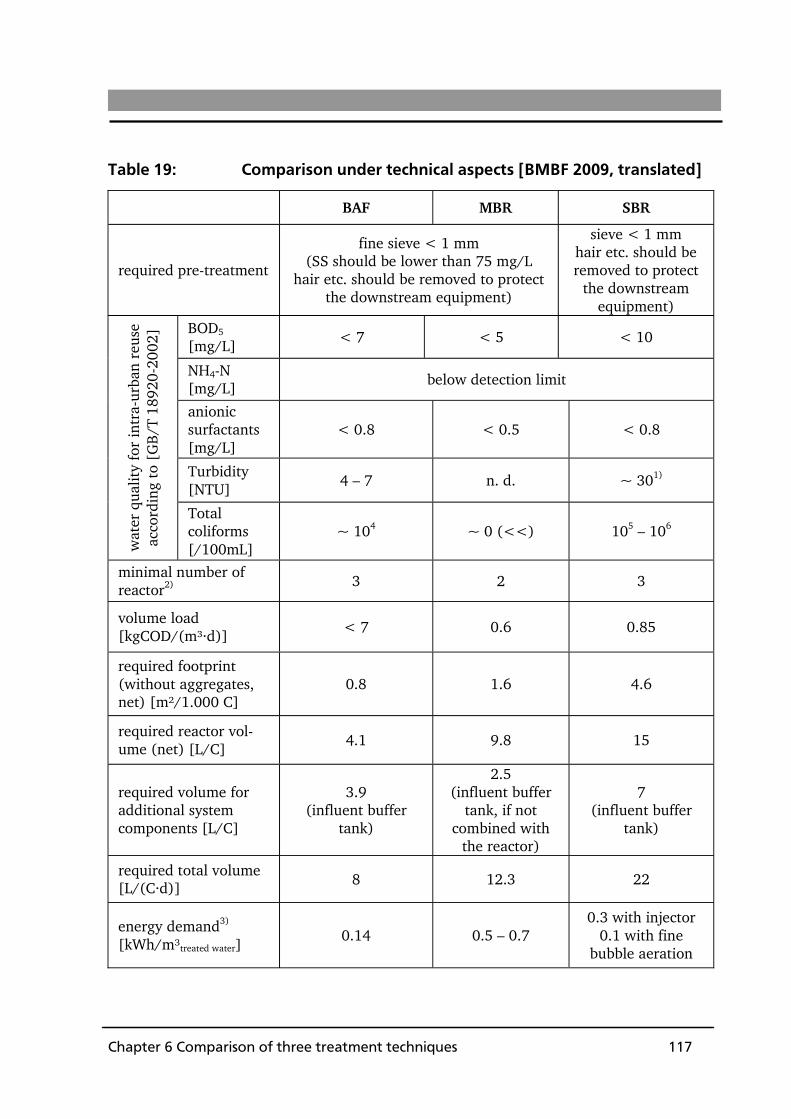
Chapter 6 Comparison of three treatment techniques 117
Table 19: Comparison under technical aspects [BMBF 2009, translated]
BAF MBR SBR
required pre-treatment
fine sieve < 1 mm (SS should be lower than 75 mg/L
hair etc. should be removed to protect the downstream equipment)
sieve < 1 mm hair etc. should be removed to protect
the downstream equipment)
BOD5 [mg/L]
< 7 < 5 < 10
NH4-N [mg/L] below detection limit
anionic surfactants [mg/L]
< 0.8 < 0.5 < 0.8
Turbidity [NTU]
4 – 7 n. d. ~ 301)
wat
er q
ualit
y fo
r in
tra-
urba
n re
use
acco
rdin
g to
[G
B/T
189
20-2
002]
Total coliforms [/100mL]
~ 104 ~ 0 (<<) 105 – 106
minimal number of reactor2)
3 2 3
volume load [kgCOD/(m³·d)]
< 7 0.6 0.85
required footprint (without aggregates, net) [m²/1.000 C]
0.8 1.6 4.6
required reactor vol-ume (net) [L/C]
4.1 9.8 15
required volume for additional system components [L/C]
3.9 (influent buffer
tank)
2.5 (influent buffer
tank, if not combined with
the reactor)
7 (influent buffer
tank)
required total volume [L/(C·d)] 8 12.3 22
energy demand3) [kWh/m³treated water]
0.14 0.5 – 0.7 0.3 with injector
0.1 with fine bubble aeration

Chapter 6 Comparison of three treatment techniques 118
BAF MBR SBR
MLSS [g/L] --- 10 – 12
(20 only in extreme case)
3 – 4
SRT [d] --- 304) 3 – 4
specific oxygen demand [kgO2/kgBOD5]
0.6 1 1
specific excess sludge production [kgSS/kgBOD5]
0.6 (theoretical value)
0.6 1.7
Key
par
amet
ers
for
tech
nica
l des
ign
of
the
GTP
s
Other technical specifications
COD volume load < 7 kgCOD/(m³·d)
water velocity in filter 5 m³/(m²·h)
HRT > 4 hours; air flow rate of the cross-flow is the control pa-
rameter for dimensioning the aeration systems
in MBR
VER: 60%, cycle time (4 hrs), reaction time (2 hrs), number of reactors
backwash water + excess sludge [Vol.-%]
16 5 7
aeration system coarse bubble,
(0.8 bar) fine bubble (0.8 bar)
injector or fine bubble
required qualification of the technical staff) moderate/high high moderate
maintenance cost5) moderate/high high normal
number of control nodes for a optimised operation of GTPs6)
5 6 3 (4)
„worst-case“ scenarios blockage and
mechanical inci-dents of filters
damage of mem-brane surfaces ,
serious deteriora-tion of filtration performance due
to foul-ing/scaling of membranes
possible bulk-ing sludge,
increased SS in effluent

Chapter 6 Comparison of three treatment techniques 119
1) The turbidity of the SBR effluent could be reduced below 5 NTU by dosing 10 mg/L polyamine at the end of each reaction cycle.
2) A minimal number of reactors are required to guarantee operational stability. If need be, one of the reactor lines of the MBR process could run with maximum hydraulic feeding for a short time to assure the con-tinuous operation of the GTP.
3) The total specific energy demand was calculated by estimating the power consumption of the overall needed aggregates. The results of this estimation are comparable to those published various investigations on the energy demand of municipal WWTPs.
4) To reduce membrane fouling/scaling, the sludge retention time (SRT) in the MBR process should be more than 30 days according to most of the published investigations.
5) The estimated maintenance costs for GTPs are based on the operation and maintenance experiences of municipal WWTPs using comparable activated sludge processes. The control nodes are defined as the key measurement points, which are required for an optimal operation process of the GTPs. Depending on the treatment process, the key measurement points vary from simple time-controlled points to complex online controlled measuring sensors for chemical and/or physical parameters. The numbers of essential con-trol nodes define the complexity of the respective treatment process in this work. The more control nodes are used, the more complex is the treatment process. In this context, only the essential control nodes of the BAF, MBR and SBR processes are listed. Regular control nodes for the other process components, e.g. influent storage tanks, which have standard control processes, are not discussed here. Below, the control nodes of the three treatment processes are described in detail: BAF: 1. control node for filter backwash: measuring point “Pressure” in
the filter bed: The backwash process in BAF is released via the measured pressure in the filter bed. The limiting value of the pressure is preset to avoid filter bed blockage. The backwash process fol-
Chapter 6 Comparison of three treatment techniques 120
lows a defined procedure to remove the abraded excess sludge, i.e. normally 5 minutes air flushing followed by 10 minutes mixed air and water flushing and 5 minutes water flushing. A continuous filter does not require a separate backwash proc-ess, since the carrier materials are continuously shifted in the internal cycle via the air lift. However, measuring the pressure in the filter bed is essential for monitoring the process and ac-tivating additional backwash processes manually;
2. control node for the process air supply: measuring points of the air flow rate and the air pressure: The air flow rate for the BAF is normally preset at a fixed value. Hereby, the control node is required for the adjustment of the air flow rate during the adjustment of the hydraulic feeding. In case additional filter cells are activated during peak flow periods, more air must be supplied via the activation of additional blower capacity. The air pressure in the pipe lines should be monitored as well;
3. control node regarding the water flow rate for the adjustment of hydraulic feedings during peak times;
4. control node for the activation and deactivation of filter cells according to varying hydraulic feedings caused by variations in the influent flow rates;
5. control node for the alternate operation of filter cells in case not all the filter cells are activated, thus avoiding the inactiva-tion of the filter due to the long-term standby modus.
MBR: 1. control node for the air flow rate via online measuring of the
DO concentration in the reactor in case that the membrane chambers and the biological reactor are used separately;
2. control node for the scheduled operation intervals (suction, backwash, relaxation of membranes etc.);
3. control node for the activation of the additional backwash processes in the membrane filter chambers, besides the regular membrane backwash via measuring the trans-membrane pres-

Chapter 6 Comparison of three treatment techniques 121
sure (TMP);
4. control node for scheduled backwash with chemicals;
5. control node for variable suction processes of the permeate during peak times;
6. control node for the scheduled air supply to ensuring the cross-flows of the membranes.
SBR: 1. control node for level measuring during filling and discharge
processes in the reactor;
2. control node for the process air supply via online measuring sensor of the DO concentration in the water;
3. control node via the scheduled points for the operation cycle (filling, reaction, sedimentation and discharge);
4. control node for dosing of polyamine (time scheduled), if dos-age of polyamine applied.
6.2 Ecological aspects Below, the three technical processes are compared under ecological aspects. Criteria are the required chemicals during the treatment process and the total CO2 emissions according to the energy consumption in the treatment processes. The chemicals required during the process vary, depending on the respective treatment processes. Using the BAF process, no chemicals are required during normal operation. In the MBR process, chemicals are required in regular cleaning measures during normal operation to ensure long-term stable filtration performance (flux) of the membranes. There are no standardised regulations for membrane clean-up, as they vary depending on the manufacturer’s specification. The most commonly prescribed or recommended chemicals are hypochlorite and citric acid. Some manufacturers offer special anti-fouling lotions as individual membrane deter-
Chapter 6 Comparison of three treatment techniques 122
gent. This variability according to the clean-up process makes it difficult to de-termine the average chemical demand in the MBR process. When using the SBR process, dosing polyamine as flocculation aid to reduce the effluent turbidity is necessary as the results of pilot experiments have shown. The dosage is about 10 mg/L and is added at the end of each cycle. It is important to note that the experiment results were obtained with an oversized injector for aeration (cp Chapter 4.1). In case critical amounts of suspended solids are found in the effluent (indicating a sub-optimal operation), a further reduction by using chemicals is possible and essential The CO2 emissions of the technical processes are calculated via the energy de-mand of each process. The respective energy demands are listed in Table 19. The CO2 emissions of the electricity generation in power plants vary from 0.2 to 1.2 kgCO2/kWh depending on type of fuel used in the power plant (see Fig-ure 52, [GLIZIE 2008]). Since the design of the technical processes is based on Chinese data, the CO2 emissions are therefore calculated according to the current power generation in China. At present, there is a total 251 large power plants in the People's Republic of China. Thereof, 202 power plants are operated with hard coal or lignite as fuels [MEP 2008]. For the comparative calculation there-fore a CO2 emission value of 1.08 kgCO2/kWh (mean value of CO2 emissions of power plants using hard coal with 0.95 kgCO2/kWh and plants using lignite with 1.2 kgCO2/kWh (see Figure 52)) is taken.

Chapter 6 Comparison of three treatment techniques 123
Figure 52 CO2 emission by using different fuels for power generation, [GLIZIE 2008, translated]
CO2 emissions from the disposal of solid residues (screening etc.) are calculated via the volume of residual material and a transport distance of 15 km from the WWTP (here STC) to the landfill. Usually, 7.5 tonne trucks are used for the transportation of residual materials. It is assumed that an average fuel consump-tion of such a vehicle is about 18 litres diesel per 100 km. The CO2 emission of diesel fuel is 2.65 kgCO2/L [GLIZIE 2008]. The specific residue amounts from greywater treatment (<5 kg/(C·a)) are so little that CO2 emissions caused by their transport are less than 5 gCO2/(C·a). This is negligible in comparison to the CO2 emissions from aeration systems (> 2 kgCO2/(C·a), see Table 20) in the technical treatment processes.

Chapter 6 Comparison of three treatment techniques 124
Table 20: Comparison of ecological aspects
BAF MBR SBR
chemicals required?
(yes/no) no yes may be
used chemicals
hypochlorite,
citric acid, possibly spe-
cial anti-fouling agents
polyamine
required quantities of
chemicals 10 mg/L
dosing frequency of
chemicals
---
regular demand,
but no standardised
specifications about the
cleaning processes of
membranes (strongly
depending on the type of
membrane and manufac-
turer specifications)
at the end of
each cycle
CO2 emissions of the
treatment processes
[kgCO2/(C·a)]
(based on the specific
flow rate of greywater
41 L/(C·d))
2.2 7.9 – 11.1
4.7 (with injector)
1.6 (with fine bub-
ble aeration systems,
calculated)
6.3 Economic aspects The economic comparison is based on the evaluation of literature data. As no studies have been carried out, especially regarding the GTP as part of a semi-centralised supply and treatment concept (on a scale of 10,000 to 200,000 in-habitants, Final Report of the Project Part I), literature data for municipal WWTPs are used as basis for the comparative evaluation. The factor conversion of the GTP is based on the population-specific BOD5 loads of greywater, which account to 10% of the population-specific BOD5 loads of municipal wastewater (cp Chapter 5.1). Thus, the comparable size of a GTP is 1,000 PE to 20,000 PE (PE: population equivalents). Costs for which there are no published price levels of the year 2008(net) will be converted via price indices published by DESTATIS.
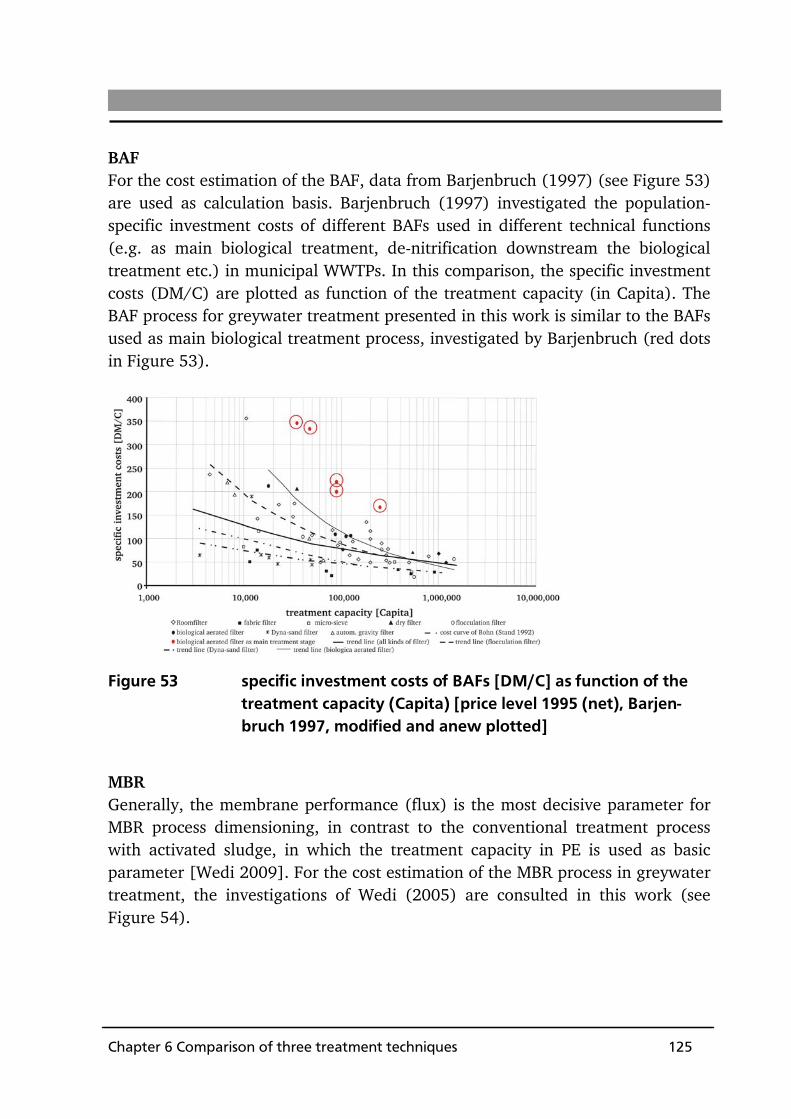
Chapter 6 Comparison of three treatment techniques 125
BAF For the cost estimation of the BAF, data from Barjenbruch (1997) (see Figure 53) are used as calculation basis. Barjenbruch (1997) investigated the population-specific investment costs of different BAFs used in different technical functions (e.g. as main biological treatment, de-nitrification downstream the biological treatment etc.) in municipal WWTPs. In this comparison, the specific investment costs (DM/C) are plotted as function of the treatment capacity (in Capita). The BAF process for greywater treatment presented in this work is similar to the BAFs used as main biological treatment process, investigated by Barjenbruch (red dots in Figure 53).
Figure 53 specific investment costs of BAFs [DM/C] as function of the treatment capacity (Capita) [price level 1995 (net), Barjen-bruch 1997, modified and anew plotted]
MBR Generally, the membrane performance (flux) is the most decisive parameter for MBR process dimensioning, in contrast to the conventional treatment process with activated sludge, in which the treatment capacity in PE is used as basic parameter [Wedi 2009]. For the cost estimation of the MBR process in greywater treatment, the investigations of Wedi (2005) are consulted in this work (see Figure 54).

Chapter 6 Comparison of three treatment techniques 126
Figure 54 Bench mark of membrane plants without construction part [as function of the membrane flux [m³/h], price level 2003 (net), Wedi 2005, modified]
According to DWA (2005), the specific investment cost of a wastewater treat-ment plant with MBR is significantly higher than of WWTPs with activated sludge process. This is caused by the essential and costly mechanical pre-treatment, the costs of membrane modules, high-performance aeration systems, required chemical storage and dosing equipment as well as the overall required electrical and control system. Investment costs for sieves as pre-treatment and the construction of aeration tanks are less important in proportion to the overall specific investment costs of membrane filtration [DWA 2005]. The construction of the plant and the necessary equipment for mechanical pre-treatment are not included in the investigation by Wedi (2005) which is only based on the fictitious costs of MBR filtration. The investment costs of a membrane filtration unit in-cluding electronics, instrumentation and control systems are approximately 34% of the overall investment costs of WWTPs [Wedi 2005]. In recent years, investment costs of WWTPs using the MBR process have de-creased significantly due to the falling prices of membranes modules. Wedi (2009) stated that the published specific costs [€/(m³·h)] have dropped by 1,000 € (per flux unit) compared to the cost basis of 2003 (net) in all concerned flow rates of membranes (cp Figure 54). Furthermore, the data presented in Figure 55 are only based on data from WWTPs, which have flux rates of > 100 m³/h. Smaller WWTPs with flux rates < 100 m³/h are not included in the shown cost curve, as the costs of such WWTPs differ strongly from the curve shown by Wedi (2005). Based on a personal recommendation by Wedi (2009),
flux of membrane [m³/h]
specific cost [€/(m
³/h)]
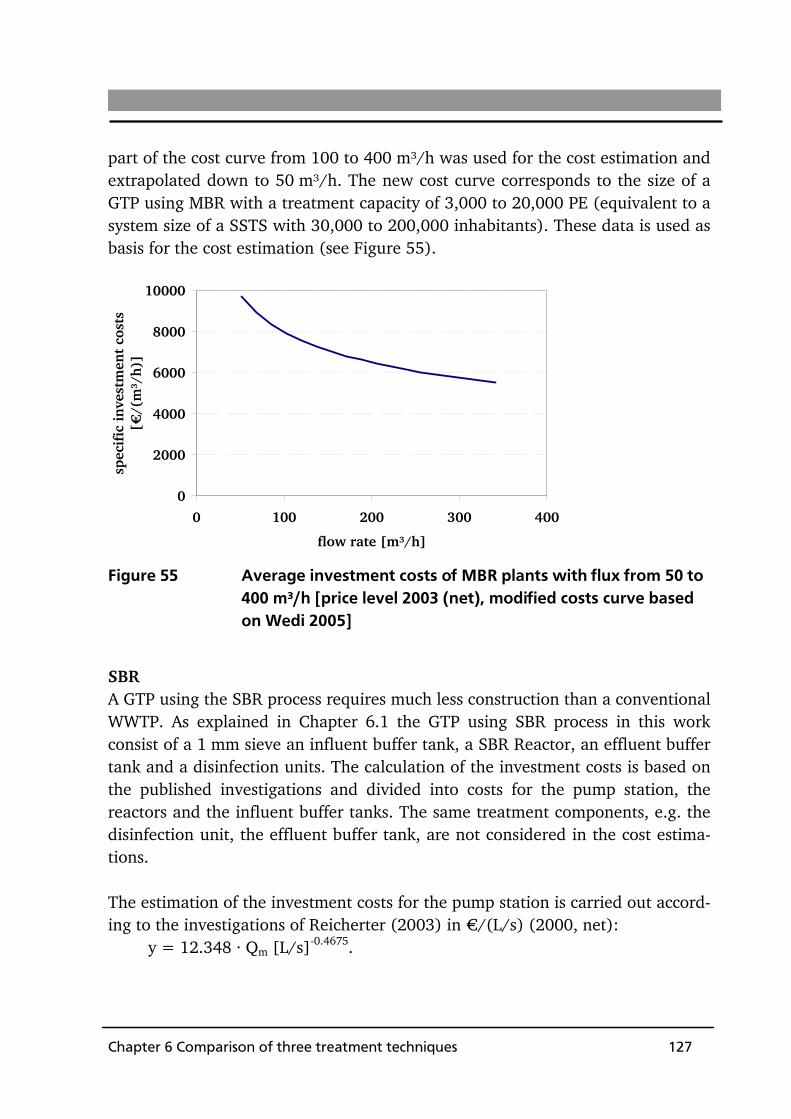
Chapter 6 Comparison of three treatment techniques 127
part of the cost curve from 100 to 400 m³/h was used for the cost estimation and extrapolated down to 50 m³/h. The new cost curve corresponds to the size of a GTP using MBR with a treatment capacity of 3,000 to 20,000 PE (equivalent to a system size of a SSTS with 30,000 to 200,000 inhabitants). These data is used as basis for the cost estimation (see Figure 55).
0
2000
4000
6000
8000
10000
0 100 200 300 400
flow rate [m³/h]
spec
ific
inve
stm
ent
cost
s [€
/(m
³/h)
]
Figure 55 Average investment costs of MBR plants with flux from 50 to 400 m³/h [price level 2003 (net), modified costs curve based on Wedi 2005]
SBR A GTP using the SBR process requires much less construction than a conventional WWTP. As explained in Chapter 6.1 the GTP using SBR process in this work consist of a 1 mm sieve an influent buffer tank, a SBR Reactor, an effluent buffer tank and a disinfection units. The calculation of the investment costs is based on the published investigations and divided into costs for the pump station, the reactors and the influent buffer tanks. The same treatment components, e.g. the disinfection unit, the effluent buffer tank, are not considered in the cost estima-tions. The estimation of the investment costs for the pump station is carried out accord-ing to the investigations of Reicherter (2003) in €/(L/s) (2000, net): y = 12.348 · Qm [L/s]-0.4675.
Chapter 6 Comparison of three treatment techniques 128
The investment costs calculated by the flow rate are converted into the popula-tion-specific costs in €/Capita. Since the SBR process combines the aeration tank and the sedimentation tank of the municipal wastewater treatment process using activated sludge process, the cost estimation of the SBR reactors includes costs of the aeration tank with con-struction and machines and the secondary clarifier only with construction ac-cording to the investigations of Reicherter (2003) in €/m³ (2000, net) regarding municipal WWTPs: secondary clarifier (construction) in €/m³, net 2000: y = 1,818.8 · V [m³] -0.2987 aeration tank (construction) in €/m³, net 2000: y = 1,554.8 · V [m³] -0.2857 and aeration tank (machines) in €/m³, net 2000: y = 783.5 · V [m³] -0.2809. As the calculated investment costs by Reicherter 2003 are volume-specific, they have to be converted to population-specific costs by using population-specific tank volumes. The volume of the aeration tank (without nitrification) is assumed to be about 40 L/PE, and that of the secondary clarifier tanks about 150 L/PE following the values of conventional WWTPs [Imhoff et al. 2007]. The cost estimation of the influent buffer tank is based on the volumes according to Mutschmann (1995) and a calculation formula is generated in €/C: y = 33.246 · C -0.2061. By summing up the specific cost curves in €/C for the pump station, the reactors and the influent buffer tanks, one gets the total specific investment costs of a GTP using the SBR process. Figure 56 shows the theoretical estimated specific investment costs of GTPs, data for BAF, MBR and SBR. As can be seen the MBR plant is the most expensive plant, while the SBR plant is the cheapest of the three GTPs.

Chapter 6 Comparison of three treatment techniques 129
0
200
400
600
800
1,000 100,000
inhabitants
popu
lati
on-s
peci
fied
in
vest
men
t co
sts
[€/C
]
20,000
BAF
MBR
SBR
Figure 56 Estimated specific investment costs of GTPs using BAF, MBR and SBR
Chapter 6 Comparison of three treatment techniques 130
6.4 Summary of the comparison of greywater treatment techniques (BAF, MBR and SBR)
Given the technical aspects, BAF is the most compact treatment process. The influent to a BAF plant has to be pre-treated in order to remove impurities (espe-cially suspended solids) as far as possible. The operation procedure is relatively complicated, thus demanding the technical staff to be specially trained according to the requirements for optimum plant operation. Chemicals are not needed for stable operation processes. The effluent is almost free of suspended solids. Back-wash water as well as excess sludge discharge (up to 16% of the total greywater volume) has to be taken into account in the design of the BAF plant. The service water production in the GTP using BAF process amounts to 34 L/(C·d), which covers curtly the demands for the toilet flushing in the private households. For catchment areas with only limited available footprint, the compact BAF plant is a good solution. The MBR process provides the best service water quality. Pre-treatment is essen-tial for the influent of a MBR plant and has to be configured according to the type of membrane used, e.g. hollow fibre module. For optimum plant operation qualified technical personnel with specialised knowledge is required. For a long-term stable performance and operation of the MBR plant, regular membrane cleaning is essential, the chemicals depending on the manufacturer specifica-tions. The MBR effluent is completely free of bacteria and suspended solids, and can be used directly as service water for all intended purposes. The service water production in the GTP using BAF process amounts to 39 L/(C·d). For catchment areas, where the quality of service water is considered as the highest priority, the MBR plant is a good solution. The SBR process is the most simple and robust treatment process. The influent of a SBR plant should be pre-treated with a sieve for protecting downstream equipment, e.g. pumps and valves. The process operation is the most simple of the three compared treatment processes, so that technical personnel with general knowledge of wastewater treatment are suited for technical operation. The efflu-ent of the SBR plant might contain suspended solids. This can be helped by op-erational process optimization, e.g. the dosing of respective chemicals. The ser-vice water production in the GTP using BAF process amounts to 38 L/(C·d). In countries, where few technical personnel are available and training and employ-

Chapter 6 Comparison of three treatment techniques 131
ment of technical personnel are difficult or not possible, or a robust and easy to be operated plant is required, the SBR plant is a good solution. Given the ecological aspects, the BAF process has the lowest total CO2 emis-sions, because its energy demand for process operation is the lowest of the three treatment processes. Furthermore, the BAF plant does not need any chemicals and, therefore, no environmental pollution is generated. The SBR process re-quires more energy input due to the injector aeration system and thus produces higher CO2 emissions. In case, chemicals are necessary during the operation, there is additional environmental hazard. In MBR processes, the highest CO2 emissions are produced, due to the high energy consumption for minimising fouling/scaling processes of membranes using cross-flow aeration. Regular use of chemicals is required for membrane cleaning, thus generating additional envi-ronmental hazard. Given the economic aspects, the MBR plant is the most expensive of the three treatment processes, due to high investment costs of membranes and associated facilities. The SBR plant is the cheapest. With a treatment capacity of 3,000 to 20,000 PE (equivalent to a SSTS of 30,000 to 200,000 inhabitants) the specific investment costs of the BAF plant are about 10% to 30% lower and the SBR plant about 20% to 50% lower than the MBR plant.

Chapter 6 Comparison of three treatment techniques 132
Chapter 7 Summary and future prospects 133
7 Summary and future prospects Summary The environmental challenges in the People’s Republic China, especially the challenge of the current situation of water resources, which resulted from negli-gence of environmental protection during the economic and industrial develop-ment in the last thirty years, require immediate, long-term and sustainable solu-tions for the overall improvement of the environment and the protection of re-sources. The rapid development of cities and urban areas in China challenge and exceed the limits of conventional infrastructure systems. The future development of urban infrastructure systems in the water sector with regard to supply, treat-ment and transport systems has extensive needs of alternative and adaptable solutions for cities in the future. The introduced semi-centralised supply and treatment system (SSTS) serves as an alternative solution for the rapid urban development in China, regarding flexible application, improved planning adaptability because of relatively small areas and relatively limited planning horizons as well as the technical feasibility of applied techniques. The self-autarkic principle of the SSTS concept provides the additional advantages of more than 30% saving of water resources and the recovery of the energy within the SSTS. Intra-urban water reuse and energy recovery can be realised more flexibly and efficiently within the SSTS concept. Greywater treatment, the principal theme of this work, is one of the important system components in the overall SSTS concept. Intra-urban water reuse is en-sured primarily through greywater treatment, which is realised by simplified treatment techniques. In particular, in this work, it is shown that – according to the pilot plant experiments – the SBR with its simplified and reliable configura-tion is suitable for treating greywater focused on the reuse as service water in intra-urban areas. Higher needs of service water, which exceed the supplying capacity of the greywater from housing estates, could be covered via supplemen-tary reuse of treated blackwater. The overall investigation and consideration hereby should be carried out regarding the local needs and the entire technical configuration of the SSTS concept.

Chapter 7 Summary and future prospects 134
The compared techniques (BAF, MBR and SBR) for greywater treatment are all suitable for application in context of the SSTS concept. Each technique has its advantages and disadvantages with regard to technical, ecological and economic aspects. The best technique for greywater treatment is that one, which is most sufficiently adaptable to the local demands. The adaptation of the technical components on the dynamic development of the catchment area is one of the most important aspects of the development of the SSTS as well as the respective STC. The modular construction of the technical components is the basic principle and instrument for planning specifications towards the integration of the local demands into the development of the SSTS. The investigation based lastly on one defined case (52,000 inhabitants). In this case with the defined boundary conditions, the modular construction of the GTP requires up to 55% lower investment costs for the starting up, but up to 50% higher overall annual costs, whereas the conventional construction is burdened by the entire the investment costs and therefore higher investment risks at the beginning of the construction, but has lower total annual costs, specifically seen over the whole 25-year recovery period. The flexible application of combined module units allows the most flexible adaption of the technical components. The appreciation of either the lower overall annual costs or the flexible adaption of the technical components should be supported by thorough planning and consideration of the city development and is finally determined by the deci-sion maker. Future prospects The investigation of greywater treatment shows its general technical feasibility for the application in intra-urban water reuse as large-scaled applications. Grey-water treatment within semi-centralised supply and treatment systems should be considered together with all the other technical components, such as blackwater treatment, waste treatment, heating and energy recovery, etc. The mass flow of water, wastewater and waste as well as the overall energy flow including transport systems within the catchment areas should be jointly investi-gated for an overall optimisation of the STC. This optimisation, however, should include not only technical and operational aspects, but also ecological and eco-nomic aspects. This first investigation of the modular construction of technical

Chapter 7 Summary and future prospects 135
components in greywater treatment is only the beginning. The technical modu-larisation compensates the costs overrun due to the under-loaded treatment facility through the flexibly application and adjustment of the development dy-namic of the catchment area. For larger SSTS the technical modularisation should be discussed and further investigated combined both the technical and spatial planning aspect to find out the optimal size of each technical module, e.g. blackwater treatment, waste treatment, etc. Further investiga-tion should be carried out with regard to the practical capability of modular constructions of other technical components in the STC. The present work has only considered the situation in new-built urban areas. In addition, the challenges worldwide in this field also regard the existing built-up urban areas in mega cities, in developing regions and countries. There, advanced and alternative infrastructure systems are required as well or the existing has to be improved, where conventional “End-of-Pipe” systems are not technically ap-plicable any more. The semi-centralised supply and treatment systems should be applied as flexible and adaptable alternative solution for such mega-cities with extremely large urban areas.

Chapter 7 Summary and future prospects 136

References 137
References AbwV 2004: German Regulation on requirements for the discharge of wastewater into recieving waters Verordnung über Anforderungen an das Einleiten von Abwasser in Gewässer (Abwasser-verordnung - AbwV), in der Fassung der Bekanntmachung vom 17. Juni 2004 (BGBl. I S. 1108, 2625), geändert durch Artikel 1 der Verordnung vom 19. Oktober 2007 (BGBl. I S.2461) (in German)
bfai 2006: Special, Industry study - Water technology and water management in the P.R. China Spezial, Branchenstudie – Wassertechnik und Wassermanagement in der VR China, Bun-desagentur für Außenwirtschaft (Abk. bfai), in Kooperation mit Delegierte der Deutschen Wirtschaft, Beijing, Deutsche Vereinigung für Wasserwirtschaft, Abwasser und Abfall e.V. (DWA), ISBN 3-86643-466-9, Köln, 2006 (in German)
Barjenbruch 1997: Performance and cost of filters for municipal wastewater treatment M. Barjenbruch: Leistungsfähigkeit und Kosten von Filtern in der kommunalen Abwasser-reinigung, Dissertation am Institut für Siedlungswasserwirtschaft und Abfalltechnik der Universität Hannover (Heft 97), Herausgeber Prof. Dr.- Ing. K.H. Rosenwinkel, Hannover 1997 (in German)
Barjenbruch 2006: M. Barjenbruch: Benchmarking of BAF Plants: Operational Experience on 40 full-scale installations in Germany, Tagungsband der Konferenz Biofilm Systems IV, 24. – 27.9.2006, Amsterdam
Berlin 2008: Block 6 – integrated water concept, eocological overall concept Block 6 – integriertes Wasserkonzept, ökologisches Gesamtkonzept, Senatverwaltung für Stadtentwicklung Berlin, Stand 2008 (in German)
Bi 2004: data for the corporate proejct – Semi-centralised supply and treatment systems for urban areas in China X. Bi, Projektdaten “Semizentrale Ver- und Entsorgungssysteme für urbane Räume Chinas – Teilprojekt 1”, BMBF-Förderkennzeichen 02WD0398, Projektzeitraum 2003-2005, Institut WAR, TU Darmstadt, Berichtstand 2006 (in German)
Bieker 2009: Semi-centralised supply and treatment systems – new solutions for the fast-growing urban areas, S. Bieker: Ph.D. thesis, Semizentrale Ver- und Entsorgungssysteme – neue Lösungen für schnell wachsende urbane Räume, WAR-Schriftenreihe 200, ISBN 3-932518-96-9, publis-hed by Förderverein WAR, Technische Universität Darmstadt, Juli 2009 (in German)

References 138
Bieker et al. 2009: S. Bieker, P. Cornel, M. Wagner, Semicentralized Supply and Treatment Systems – Inte-grated Infrastructure Solutions for Fast Growing Urban Areas. In: Conference Proceedings of the 6th IWA Leading Edge Conference on Water and Waste Water Technologies. Singa-pore, 22-26 June 2009
Birks et al. 2005: R. Birks, S. Hills, Characterisation of indicator organisms and pathogens in domestic grey-water for recycling, Thames water Research & Development, IWA Specialty Conference, Wastewater Reclamation & Reuse for Sustainability, 8th -11th November 2005, Jeju, Korea
BJBS 2008: Statistical Yearbook of City Beijing, Statistics Bureau, City of Beijing, 2008, (in Chinese)
BMBF 2006: Project report – Semi-centralised supply and treatment systems for urban areas in China, Part I Projektbericht “Semizentrale Ver- und Entsorgungssysteme für urbane Räume Chinas – Teilprojekt 1”, BMBF-Förderkennzeichen 02WD0398, Projektzeitraum 2003-2005, Insti-tut WAR, TU Darmstadt, Berichtstand 2006 (in German)
BMBF 2009: Project report – Semi-centralised supply and treatment systems for urban areas in China, Part II Projektbericht “Semizentrale Ver- und Entsorgungssysteme für urbane Räume Chi-nas – Teilprojekt 2”, BMBF-Förderkennzeichen 02WD0607, Projektzeitraum 2005-2008, Institut WAR, TU Darmstadt, Berichtstand 2009 (in German)
Böhm et al. 2006: H.R. Böhm, S. Bieker, A. Selz, Semi-centralised Infrastructure Systems – Integrated Systems for a Sustainable Development of Fast Growing Urban Areas, the 12th annual international sustainable development research conference, Hongkong, 2006
Bullerman et al. 2001: Using of greywater and storm water in Kassel-Hasenhecker, Hygienic and operational accompanying technical studies L. Bullermann, K. Mehlhart, Grau- und Regenwassernutzung Kassel-Hasenhecke, Hygieni-sche und betriebstechnische Begleituntersuchungen, Schriftenreihe fbr 7, 2001 (in Ger-man)
BWRB 2008: Annual Reports of the Water Resources, Beijing Water Authority, 2007, (in Chinese)
Casanova et al. 2001: L. M. Casanova, C. Gerba, M. Karpiscak, Chemical and microbial characterization of Household Graywater, Journal of Environmental Science and Health, 2001, Vol. 36, No. 4, pp. 395-401, 2001
Chang et al. 2007: Y. Chang, P. Cornel, M. Wagner, Treatment of greywater for urban water reuse, IWA Con-ference – Advanced Sanitation, Aachen, 12 – 13 March 2007, Germany

References 139
Chen, 2006: H. Chen, Own measurement data of grey water characters from a housing estate of Tongji University, Shanghai 2006 (in Chinese)
CMA 2000-2009: China Meteorological Administration: diverse weather reports between 2000 and 2009 (in Chinese)
Cornel et al. 2007: P. Cornel, M. Wagner, Y. Chang, Semi-centralised supply and treatment systems for fast growing urban areas, IWA International Symposium Water Supply and Sanitation for All, Berching, 27th/28th September 2007
Cornel et al. 2009: P. Cornel, S. Bieker, A. Meda, M. Wagner, Y. Chang, Intra-urban Reuse of Water and En-ergy Recovery – Integrated Solutions for Fast Growing Urban Areas, 7th International Conference on Water Reclamation & Reuse, Brisbane, November 2009, Australia
DESTATIS: Online data bank of German Federal Statistical Office DESTATIS: Statistisches Bundesamt Deutschland, online Datenbank, Stand August 2009 (in German)
DEUS 21 2005: DEUS 21: research project “DEzentral Urbanes Infrastruktur-System”, IGB Fraunhofer Stuttgart and ISI Fraunhofer Karlsruhe, financed by Federal Ministry of Education and Research, Germany (in German)
DIN 53902 Part 2 1997: Testing of surface active agents; determination of foaming power, modified Ross-Miles-method Prüfung von Tensiden, Bestimmung des Schäumvermögens, modifiziertes Ross-Miles-Verfahren, Fachnormenausschuß Materialprüfung (FNM) im DIN Deutsches Institut für Normung e.V., Dezember 1997 (in German)
DWA 2000: ATV-DVWK work reports: biological filter for wastewater treatment ATV-DVWK Arbeitsbericht „Biofilter für Abwasserreinigung“, Deutsche Vereinigung für Wasserwirtschaft, Abwasser and Abfall e.V. ISBN 3-933707-36-6, GFA Verlag, Hennef, März 2000 (in German)
DWA 2005: the 2nd Work Report of the DWA Technical Committee: KA-7 wastewater treatment using membran bioreactors, DWA Fachausschuss KA-7 Membranbelebungsverfahren, 2. Arbeits-bericht 19. Jan. 2005 (in German)
DWA 2008: DWA topics: advanced sanitation systems DWA Themen: Neuartige Sanitärsysteme, DWA Fachausschuss KA 1, Deutsche Vereinigung

References 140
für Wasserwirtschaft, Abwasser and Abfall e.V. ISBN 978-3-941089-37-2, Hennef, Dezem-ber 2008 (in German)
DWA A-131: Dimensioning of Single-Stage Activated Sludge Plants Bemessung von einstufigen Belebungsanlagen, ISBN: 978-3-933707-41-3, DWA – Deutsche Vereinigung für Wasserwirtschaft, Abwasser und Abfall e.V., Hennef, Mai 2000 (in Ger-man)
DWA M-205: Disinfection of Biologically Treated Wastewater Merkblatt DWA M-205, Desinfektion von biologisch gereinigtem Abwasser, ISBN: 3-927729-75-2, DWA – Deutsche Vereinigung für Wasserwirtschaft, Abwasser und Abfall e.V., Hennef, Juli 1998 (in German)
DWA M-209: Measurement of the Oxygen Transfer in Activated Sludge Aeration Tanks with Clean Water and in Mixed Liquor Merkblatt DWA M-209, Messung der Sauerstoffzufuhr von Belüftungseinrichtungen in Belebungsanlagen in Reinwasser und in belebtem Schlamm, ISBN: 978-3-939057-78-9, DWA – Deutsche Vereinigung für Wasserwirtschaft, Abwasser und Abfall e.V., Hennef, April 2007 (in German)
DWA M-210: Dimensioning og Sequencing Batch Reactor (SBR) Merkblatt DWA M-210, Belebungsanlagen mit Aufstaubetrieb (SBR), ISBN: 978-3-941089-72-3, DWA – Deutsche Vereinigung für Wasserwirtschaft, Abwasser und Abfall e.V., Hen-nef, Juli 2009 (in German)
Edu 2006: Choise of operational procedures for the drinking water supply concerning energy saving 供水系统调节方式的节能选择, http://www.eduzhai.net/lunwen/65/96/lunwen_106302.html, published 2006, (in Chine-se)
EPA 1995: Design Manual Municipal Wastewater Disinfection, EPA/625/1-86/021, Environmental Protection Agency Cincinnati, Ohio USA, 1995
Ecosan 2005: Vacuum sewerage and greywater recycling, office building “Ostarkade” of the KfW Banken-gruppe, http://www.gtz.de/de/dokumente/en-ecosan-pds-001-germany-frankfurt-kfW-2005.pdf
Eriksson et al. 2007: E. Eriksson, X. Yan, M. Lundsbye, T. S. Madsen, H. R. Andersen, A. Ledin, Variation in grey wastewater quality reused for toilet flushing. In Proceeding of the 6th IWA Specialist Con-ference on Wastewater Reclamation and Reuse of Sustainability, 9th – 12th October 2007, Antwerp, Belgium

References 141
fbr, 2005: fbr information sheet H 201, Greywater Recycling – Planning fundamentals and operation information, fbr – Hinweiseblatt H201, Grauwasser-Recycling, Planungsgrundlagen und Betriebshinwei-se, Fachvereinigung Betriebs- und Regenwassernutzung e.V. (fbr), Darmstadt, 2005 (in German)
Friedler et al. 2006 E. Friedler, M. Hadari, Economic feasibility of on-site grey water reuse in multi-story build-ings. Desalination, 190 (1-3), 221-234
Fu et al. 2008: T. Fu, M. Chang, L. Zhong, Reform of China’s urban water sector, Report part of the Wa-ter21 Market Briefing Series, IWA Publishing, 2008, ISBN: 1-84339-143-0, London.
GB 50180-1993: Code of urban residential areas – planning & design, updated version 2002, Ministry of Housing and Urban-Rural Development, (former Ministry of Construction), P. R. China, (in Chinese)
GB/T 50280-98: Standard of basic terminology of city planning, Ministry of Housing and Urban-Rural De-velopment, (former Ministry of Construction), P. R. China, 1998, (in Chinese)
GB 50282-1998: Code for Urban Water Supply Engineering Planning, Ministry of Housing and Urban-Rural Development, (former Ministry of Construction), P. R. China, 1999, (in Chinese)
GB 3838-2002: Environmental quality standard for surface water, Ministry of Housing and Urban-Rural Development, (former Ministry of Construction), P. R. China, 2002, (in Chinese)
GB/T 18918-2002: Discharge standard of pollutants for municipal wastewater treatment plant, Ministry of Environmental Protection (former State Environmental Protection Agency), P. R. China, 2002, (in Chinese)
GB/T 18919-2002: The reuse of urban recycling water – Classified standard, Ministry of Environmental Protec-tion (former State Environmental Protection Agency), P. R. China, 2002, (in Chinese)
GB/T 18920-2002: Water quality standard for urban miscellaneous water consumption, Ministry of Housing and Urban-Rural Development, (former Ministry of Construction), P. R. China, 2002, (in Chinese)
GB/T 18921-2002: Water quality standard for scenic environmental use, Ministry of Housing and Urban-Rural Development, (former Ministry of Construction), P. R. China, 2002, (in Chinese)

References 142
GB 5084-2005: Standard for irrigation water quality, Ministry of Agriculture, P. R. China, 2005, (in Chi-nese)
GB/T 19772-2005: Water quality standard for groundwater recharge, Ministry of Housing and Urban-Rural Development, (former Ministry of Construction), P. R. China, 2005, (in Chinese)
GB/T 19923-2005: Water quality standard for industrial uses, Ministry of Housing and Urban-Rural Develop-ment, (former Ministry of Construction), P. R. China, 2005, (in Chinese)
GB 50014-2006: Code for design of outdoor wastewater engineering, Ministry of Housing and Urban-Rural Development, (former Ministry of Construction), P. R. China, 2006, (in Chinese)
GB 50223-2008: Standard for classification of seismic protection of building constructions, Ministry of Hous-ing and Urban-Rural Development, (former Ministry of Construction), P. R. China, 2008, (in Chinese)
GB 5749-2006: Standard of drinking water quality, Ministry of Health, P. R. China, 2006, (in Chinese)
Gethke et al. 2007: K. Gethke, H. Herbst, Grey water reuse in hotel and catering industry. In Proceeding of the 6th IWA Specialist Conference on Wastewater Reclamation and Reuse of Sustainability, 9th – 12th October 2007, Antwerp, Belgium
GLIZIE 2008: CO2-Emission, GLIZIE GmbH Ingenieurbüro für Umwelttechnik, Zugriff Jan. 2009 (in German)
Goncalves et al. 2007: R. Franci Goncalves, B. Bazzarella, S. T. Cassini, Graywater reuse in edifications using combined anaerobic / aerobic compact treatment system. In Proceeding of 6th IWA special-ist conference on wastewater reclamation & reuse for sustainability, 9th – 12th October 2007, Antwerp, Belgium
Gross et al, 2006: A. Gross, O. Shmueli, Z. Ronen, E. Raveh, Recycled vertical flow constructed wetland (RVFCW) a –novel method of recycling greywater for irrigation in small communities and households, Chemsophere, 2006
Gunnar et al. 1999: J. Gunnar, J. Forsberg, F. Mahgoub, K. Palmqvist, Sustainability of local water supply and sewage system – a case study in a vulnerable environment. Ecological Engineering 15, 147–153, 1999

References 143
Hamburg 2007: Annual report of the sustainabilty 2007 Nachhaltigkeitsbericht 2007, Stadtreinigung Hamburg, Anstalt des öffentlichen Rechts, Hamburg, Februar, 2007 (in German)
Hegemann, 2001: aerobe greywater treatment – operational experiences and acceptances W. Hegemann, Aerobe Verfahren zur Grauwasserbehandlung – Betriebliche Erfahrungen und Akzeptanz, in Berichte aus Wassergüte- und Abfallwirtschaft, TU München, Band 161, 2001 (in German)
Henau et al. 1986: Henau, D.H., Mathijs, E., Hopping, D.W., Linear alkylbenzene sulfonates (LAS) in sewage sludges, soils and sediments: analytical determination and environmental safety considera-tions. Int. J. Environ. Anal. Chem. 26, 279–293, 1986
Henkel 2005: sale statistics of the washing products in Germany, Henkel AG, 2005 (in German)
Hernández 2008: Biological treatment of grey water: comparison of three systems, IWA Conference on Sani-tation Challenge, Wageningen, 19th – 21st May, 2008 Netherland
IDEXX 2009: Product information about Quanti-Tray® and Quanti-Tray®/2000 IDEXX: Produktinformation von Quanti-Tray@ und Quanti-Tray@/2000, http://www.idexx.de, IDEXX GmbH Deutschland (IDEXX Laboratories, Inc., USA), Stand 2009
Imhoff 2007: pocket book of urban drainage, 30th edition Karl und Klaus M. Imhoff, Taschenbuch der Stadtentwässerung, 30. Auflage, ISBN: 3-8356-3094-6, Oldenbourg Industrieverlag, Dezember 2006, Essen
Jimenez et al. 2008: Edited by Blanca Jimenez and Takashi Asano, Water Reuse – A International Survey of current practice, issues and needs, IWA Scientific and Technical Report No. 20, IWA Pub-lishing, 2008, ISBN 1-843-3908-92, London
Judd 2006: Simon Judd, the MBR Book, Principles and Applications of Membrane Bioreactors in Water and Wastewater Treatment, ISBN 978-1-85-617481-7, Elsever Publishing Ltd., London, 2006
KASEI 2008: product website, http://www.asahi-kasei.co.jp/membrane/microza/en/about_microza.html, Stand 2009
Kimura et al. 2007: K. Kimura, D. Mikami, N. Funamizu, Onsite wastewater reclamation and reuse in individual

References 144
buildings in Japan, in Proceeding of 6th IWA specialist conference on wastewater reclama-tion & reuse for sustainability, 9th – 12th October 2007, Antwerp, Belgium
Knerr et al. 2007: H. Knerr, M. Engelhardt, J. Hansen, G. Sagawe, H. Steinmetz, the Project KOMPLETT – A new approach for closed loop urban water cycles, 2nd International Conference SmallWat07 on Wasteweater Treatment in Small Units, 11th – 15th November 2007, Sevilla/Spanien
Knerr 2008: H. Knerr, Separated grey- and blackwater treatment by the Komplett water recycling sys-tem - A possibility to close domestic water cycle, IWA Conference on Sanitation Challenge, Wageningen, 19th – 21st May, 2008 Netherland
Laine, 2001: A. T. Laine, Technologies for Greywater Recycling in Buildings, Ph.D. Thesis, School of Water Sciences, Cranfield University, United Kingdom, 2001
Langenscheidts 1999: Langenscheidts Dictionary – German as foreign language Langenscheidts Großwörterbuch – Deutsch als Fremdsprache, ISBN 3-468-49026-7, Lan-genscheidt KG, Berlin und München, 1999, (in German)
LAWA 2005, Guidelines for the implementation of dynamic calculations of cost comparison Leitlinien zur Durchführung dynamischer Kostenvergleichsrechnungen (KVR-Leitlinien), ISBN 3-88961-240-7, Länderarbeitsgemeinschaft Wasser (LAWA), 2005, Kulturbuchverlag Berlin, (in German)
Leithe 1975, The Analyse of the organic pollution in drinking water, service water and wastewater W. Leithe, Die Analyse der organischen Verunreinigung in Trink-, Brauch- und Abwässern Wissenschaftliche Verlagsgesellschaft, Stuttgart 1975, (in German)
Libang 2008: http://www.libangkj.cn/_d269000354.htm, Project information of Shanxi Libang Envi-ronmental Protection Science and Technology Engineering Co., Ltd. 2008, Stand 2009 (in Chinese)
Li et al 2008: Statements of employees on-job training for operating on the Chinese wastewater treat-ment plants – expe-riences in the Sino-German cooperation L. Li, Vortrag zum Zustand der Weiterausbildung von Betriebspersonal auf chinesischen Kläranlagen - Erfahrungsbericht in Deutsch-Chinesischen Zusammenarbeiten, IFAT Shang-hai, 23. Sept. 2008, Shanghai
Maurer 2009: M. Maurer, Specific net present value: An improved method for assessing modularisation costs in water services with growing demand, Water Research 43 (2009), p. 2121-2130, IWA Publishing, Elsevier Ltd.
References 145
Meda et al. 2009: A. Meda, P. Cornel, Grey Water Treatment with Biological Aerated Filter (BAF) for Urban Water Reuse, 1st IWA Development Conference, 15th – 19th November 2009, Mexico City
Mels et al. 2008: A. Mels, S. Guo, C. Zhang, X. Li, H. Wang, Z. Jun and O. Braadbaart, Decentralised waste-water reclamation systems in Beijing – adoption and performance under fields conditions, IWA Conference on Sanitation Challenge, 19th – 21st May, 2008, Wageningen, Netherland
MEP 1998-2007: Annual Environmental Reports 1998-2007, Ministry of Environmental Protection (former State Environmental Protection Agency (SEPA)), P. R. China, (in Chinese)
Merz et al. 2007: Membrane bioreactor technology for the treatment of greywater from a sports and leisure club, Desalination 215, 37-43., 2007
MOHURD 2007: Annual report of civil construction 2007 Jahresbericht zum Städtebau 2007, Ministry of housing and rural development, (former Ministry of Construction), P. R. China (in Chinese)
Mutschmann 1995: Pockebook of water supply Taschenbuch der Wasserversorgung, 11. überarbeitete und aktualisierte Auflage, ISBN 3-440-07024-7, Franckh-Kosmos Verlags-GmbH, Stuttgart, 1995 (in German)
NBS 1995-2008: Chinese statistical Yearbook 1995-2008, National Bureau of Statistics, China Statistics Press Publishing, (in Chinese)
Nolde 2001: Using of greywater in Arabella-Sheraton E. Nolde, Grauwassernutzung im Arabella-Sheraton, fbr-Schriftenreihe, Band 8: Regenwas-sernutzung und -bewirtschaftung im internationalen Kontext - Internationale Regenwasser-tage 2001 Mannheim, ISBN 3-9804111-7-6, fbr, 2001 (in German)
Oldenburg 2008: Vacuum Sewerage and Greywater treatment – Experience of 8 years of operation, IWA Conference on Sanitation Challenge, Wageningen, 19th – 21st May, 2008 Netherland
Paris et al. 2009: Retrofitting of sanitation systems in a hotel S. Paris, C. Schlapp, Nachrüsten eines Hotels im laufenden Betrieb, fbr-wasserspiegel 1/09, P. 8 -10 (in German)
Pidou, M. 2006: Hybrid membrane processes for water reuse. Ph.D Thesis, Cranfield University, 2006

References 146
Pidou et al. 2008: M. Pidou, L. Avery, T. Stephenson, P. Jeffrey, S. A. Parsons, S. Liu, F. A. Memon, B.ruce Jefferson, Chemical solutions for greywater recycling, Chemosphere 71 147–155, 2008
Prathapar et al. 2005, S.A. Prathapar, A. Jamrah, M. Ahmed., S. Al Adawi, S. Al Sidairi, A. Al Harassi, Overcom-ming constraints in treated grey water reuse in Oman, Desalination 186 (2005) 177-186
QWCB 2009: Annual Reports of the Water Resources, Qingdao Water Conservancy Bureau, 2007, (in Chinese)
QD 2007, http://www.qingdao.gov.cn/n172/n85546/index.html, Qingdao government affairs online, 青岛政务网, stand 2009, (in Chinese)
Reicherter 2003: Studies of key figures as a basis for cost considerations in the wastewater treatment and disposal E. Reicherter, Untersuchungen zu Kennzahlen als Grundlage für Kostenbetrachtungen in der der Abwasserentsorgung, Dissertation am Institut für Wasserwesen (Mitteilungen Heft 84), ISBN 3-486-26553-9, Bundeswehr Universität München, 2003 (in German)
Rother 2005: E. Rother, Optimising design and operation of the biofiltration process for municipal wastewater treatment, Dissertation, WAR Schriftenreihen, Band 163, ISBN 3-932518-59-4, Darmstadt
Rother 2006: E. Rother, P. Cornel, Biofilter Configuration for Advanced Municipal Wastewater Treat-ment, Tagungsband der Konferenz Biofilm Systems IV, 24. – 27.9.2006, Amsterdam
SBD 2004: Statistisches Jahresbuch 2004, Statistisches Bundesamt Deutschland (in German)
Sellner, M. 2009: GEP greywater treatment facility in the student dormitory „Eastsite“ in Mannheim GEP-Grauwasseranlage im Studentenwohnheim „Eastsite“ in Mannheim, fbr-Wasserspiegel 1/09, 2009 (in German)
Shafran et al. 2006: A. Wiel-Shafran, Z. Ronen, N. Weisbrod, E. Adar, A. Gross, Potential changes in soil proper-ties following irrigation with surfactant-rich greywater, Ecological Engineering 26 (2006) 348-354, 2006
SHHBS 2008: Statistical Yearbook of City Shanghai, Bureau of Statistics City of Shanghai, 2007, (in Chinese)
SHHWRB 2008: Annual Reports of the Water Resources, Shanghai Water Authority, 2007, (in Chinese)

References 147
Smulders 2002: Editor: Eduard Smulders, Laundry Detergents, Wiley-VCH Publishing, Henkel AG, 2002
Vera et al. 2007: Submerged membranes for reclamation technology of greywater in hotels of the Canary Islands. In Proceeding of the 6th IWA Specialist Conference on Wastewater Reclamation and Reuse of Sustainability, 9th – 12th October 2007, Antwerp, Belgium
Wandinger 2001: Causes of conflicts and wars in the 21 Century, the consequences for the Western industri-alized countries T. M. Wandinger, Ursachen von Konflikten und Kriegen im 21. Jahrhundert, Konsequenzen für die westlichen Industriestaaten, http://www.bpb.de/publikationen/LTV7P9.html, Bundeszentrale für politische Bildung, Stand 2001 (in German)
Weber et al. 2007: B. Weber, P. Cornel, M. Wagner, Semi-centralised supply and treatment systems for (fast growing) urban areas, Water Science & Technology 55:1-2/2007, 349-356, IWA Publish-ing, London
Wedi 2005: Efficiency and energy consumption of membrane bioreactors D. Wedi, Wirtschaftlichkeit und Energiebedarf von Membranbelebungsanlagen, 3. DWA-Membrantage, 21. – 23. June 2005, Osnabrück (in German)
Wedi 2009: personal statements of Mr. Dip.-Ing. Detlef Wedi persönliche Mitteilung von Herrn Dipl.-Ing. Detlef Wedi, Jan. 2009
Wilderer et al. 2001: Sequencing Batch Reactor Technology, IWA Scientific and Technical Report No. 10, IWA Publishing, 2001, London
Wilhelm, 2004: Greywater recycling in a residential estate in Peking C. Wilhelm, Grauwasserrecycling in der Wohnbebauung in Peking, Vortrag auf der Tagung „Grauwasser-Recycling – Chance für die deutsche Wirtschaft“, February 2004 (in German)
WRMG 2007: German law on Environmental Impact of detergents and cleaning products BGBl. I S. 600 Gesetz über die Umweltverträglichkeit von Wasch- und Reinigungsmitteln, (Wasch- und Reinigungsmittelgesetz – WRMG), on 29th April 2007, (in German)
WVGW 2008: Branch overview of the German water economy 2008 Branchenbild der deutschen Wasserwirtschaft 2008, wvgw Wirtschafts- und Verlagsgesell-schaft, Bonn, Februar 2008, (in German)
Zhu et al. 2006: EcoSanRes, Model project in Erdos, SiDA project, Vortrag GTZ, Eschborn 2006

References 148
Appendix 149
Appendix Appendix 1: quality classification of the surface water
according to GB3838-2002 Class I: surface water as usable water and national natural protection
areas Class II: surface water as quells for the tap water supply, Protection
Class II. Habitat zones of the rare creatures in water; food and spawn regions for the young water creatures
Class III: surface water as water sources for centralised drinking water supplying with protection class II. Hibernation zones and trails of water creatures; breeding zones of aquacultures, such as fishes; bathing water zones
Class IV: common waters for industrial application; waters for recrea-tional and sport applications without directly contact to hu-man beings
Class V: waters for agricultural applications and common scenic appli-cations
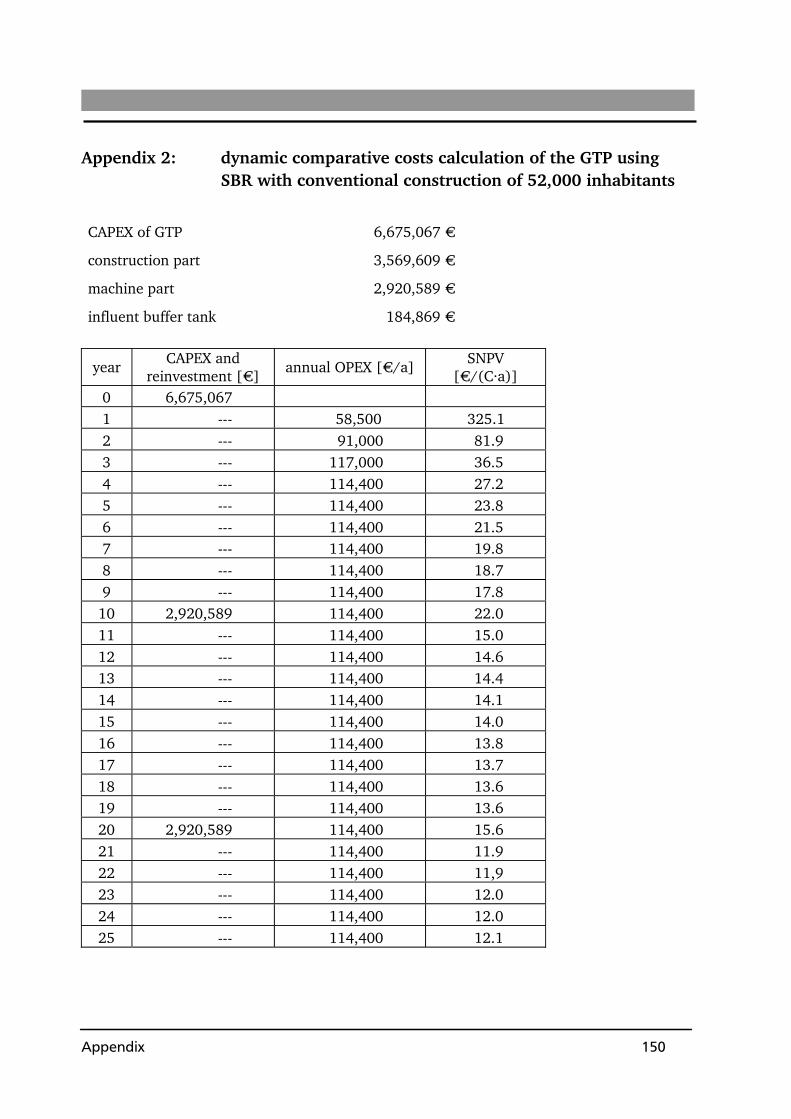
Appendix 150
Appendix 2: dynamic comparative costs calculation of the GTP using SBR with conventional construction of 52,000 inhabitants
CAPEX of GTP 6,675,067 €
construction part 3,569,609 €
machine part 2,920,589 €
influent buffer tank 184,869 €
year CAPEX and
reinvestment [€] annual OPEX [€/a]
SNPV [€/(C·a)]
0 6,675,067 1 --- 58,500 325.1 2 --- 91,000 81.9 3 --- 117,000 36.5 4 --- 114,400 27.2 5 --- 114,400 23.8 6 --- 114,400 21.5 7 --- 114,400 19.8 8 --- 114,400 18.7 9 --- 114,400 17.8
10 2,920,589 114,400 22.0 11 --- 114,400 15.0 12 --- 114,400 14.6 13 --- 114,400 14.4 14 --- 114,400 14.1 15 --- 114,400 14.0 16 --- 114,400 13.8 17 --- 114,400 13.7 18 --- 114,400 13.6 19 --- 114,400 13.6 20 2,920,589 114,400 15.6 21 --- 114,400 11.9 22 --- 114,400 11,9 23 --- 114,400 12.0 24 --- 114,400 12.0 25 --- 114,400 12.1

Appendix 151
Appendix 3: dynamic comparative costs calculation of the GTP using SBR with modular construction with regard to the con-stant development of the catchment area (size of module units: 2,500 inhabitants)
months 0 2.3 4.6 6.9 9.2 11.5
incurred inhabitants
0 2,500 5,000 7,500 10,000 12,500
number of the modules 1 2 3 4 5 6
months 13.9 16.2 18.5 20.8 23.1 25.4
incurred inhabitants
15,000 17,500 20,000 22,500 25,000 27,500
number of the modules
7 8 9 10 11 12
months 27.7 30 32.3 34.6 36.9 39.2
incurred inhabitants
30,000 32,500 35,000 37,500 40,000 42,500
number of the modules
13 14 15 16 17 18
months 41.5 43.9 46.2 48
incurred inhabitants 45,000 47,500 50,000 52,000
number of the modules
19 20 21 22
CAPEX of unit 586,176 €
construction part 313,317 €
machine part 256,351 €
influent buffer tank 16,508 €
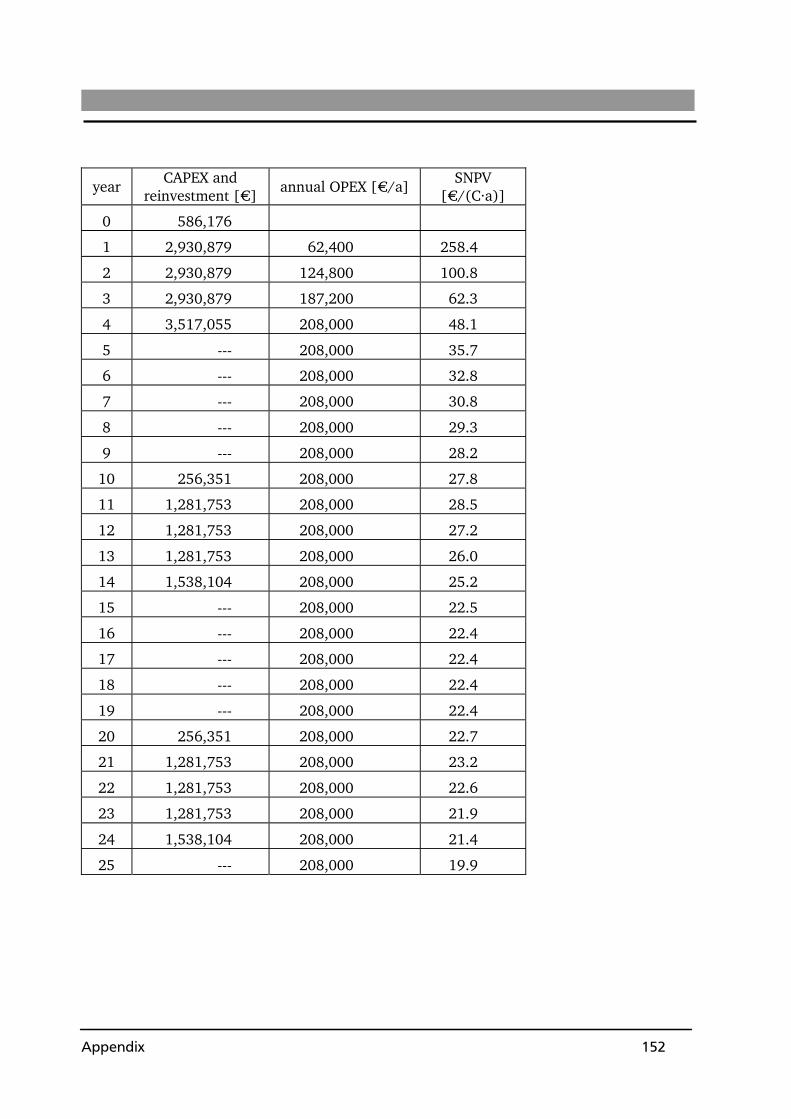
Appendix 152
year CAPEX and
reinvestment [€] annual OPEX [€/a]
SNPV [€/(C·a)]
0 586,176
1 2,930,879 62,400 258.4
2 2,930,879 124,800 100.8
3 2,930,879 187,200 62.3
4 3,517,055 208,000 48.1
5 --- 208,000 35.7
6 --- 208,000 32.8
7 --- 208,000 30.8
8 --- 208,000 29.3
9 --- 208,000 28.2
10 256,351 208,000 27.8
11 1,281,753 208,000 28.5
12 1,281,753 208,000 27.2
13 1,281,753 208,000 26.0
14 1,538,104 208,000 25.2
15 --- 208,000 22.5
16 --- 208,000 22.4
17 --- 208,000 22.4
18 --- 208,000 22.4
19 --- 208,000 22.4
20 256,351 208,000 22.7
21 1,281,753 208,000 23.2
22 1,281,753 208,000 22.6
23 1,281,753 208,000 21.9
24 1,538,104 208,000 21.4
25 --- 208,000 19.9

Appendix 153
Appendix 4: dynamic comparative costs calculation of the GTP using SBR with modular construction with regard to the con-stant development of the catchment area (size of module units: 5,000 inhabitants)
months 0 4.6 9.2 13.9 18.5 23.1
incurred inhabitants 0 5,000 10,000 15,000 20,000 25,000
number of the modules 1 2 3 4 5 6
months 27.7 32.3 36.9 41.5 46.2 48
incurred inhabitants
30,000 35,000 40,000 45,000 50,000 52,000
number of the modules
7 8 9 10 11 11
CAPEX of unit 1,021,653 €
construction part 546,145 €
machine part 446,846 €
influent buffer tank 28,662 €

Appendix 154
year CAPEX and
reinvestment [€] annual OPEX [€/a]
SNPV [€/(C·a)]
0 1,021,653
1 2,043,306 58,000 210.7
2 3,064,959 106,000 98.3
3 2,043,306 164,000 52.9
4 3,064,959 212,000 42.5
5 --- 212,000 31.7
6 --- 212,000 29.2
7 --- 212,000 27.4
8 --- 212,000 26.1
9 --- 212,000 25.2
10 446,846 212,000 25.2
11 893,692 212,000 25.0
12 1,340,538 212,000 24.5
13 893,692 212,000 22.8
14 1,340,538 212,000 22.5
15 --- 212,000 20.2
16 --- 212,000 20.1
17 --- 212,000 20.1
18 --- 212,000 20.1
19 --- 212,000 20.1
20 446,846 212,000 20.5
21 893,692 212,000 20.6
22 1,340,538 212,000 20.4
23 893,692 212,000 19.4
24 1,340,538 212,000 19.3
25 --- 212,000 17.9

Appendix 155
Appendix 5: dynamic comparative costs calculation of the GTP using SBR with modular construction with regard to the con-stant development of the catchment area (size of module units: 10,000 inhabitants)
months 0 9.2 18.5 27.7 36.9 46.2 48
incurred inhabitants
0 10,000 20,000 30,000 40,000 50,000 52,000
number of the modules
1 2 3 4 5 6 6
CAPEX of unit 1,780,652 €
construction part 951,987 €
machine part 778,899 €
influent buffer tank 49,765 €

Appendix 156
year CAPEX and
reinvestment [€] annual OPEX [€/a]
SNPV [€/(C·a)]
0 1,780,652 1 1,780,652 49,400 226.3
2 1,780,652 97,000 80.5
3 1,780,652 140,000 47.3
4 3,561,303 210,000 41.9
5 --- 210,000 30.2
6 --- 210,000 30.0
7 --- 210,000 27.1
8 --- 210,000 25.2
9 --- 210,000 24.0
10 778,899 210,000 23.6
11 778,899 210,000 22.8
12 778,899 210,000 22.0
13 778,899 210,000 21.4
14 1,557,798 210,000 21.8
15 --- 210,000 19.3
16 --- 210,000 20.2
17 --- 210,000 19.7
18 --- 210,000 19.4
19 --- 210,000 19.3
20 778,899 210,000 19.3
21 778,899 210,000 19.0
22 778,899 210,000 18.7
23 778,899 210,000 18.4
24 1,557,798 210,000 18.6
25 --- 210,000 17.2

Appendix 157
Appendix 6: dynamic comparative costs calculation of the GTP using SBR with modular construction with regard to the con-stant development of the catchment area (size of module units: 15,000 inhabitants)
months 0 13.9 27.7 41.5 48
incurred inhabitants 0 15,000 30,000 45,000 52,000
number of the modules
1 2 3 4 4
CAPEX of unit 2,464,428 €
construction part 1,317,638 €
machine part 1,078,068 €
influent buffer tank 68,722 €

Appendix 158
year CAPEX and
reinvestment [€] annual OPEX
[€/a] SNPV
[€/(C·a)]
0 2,464,428
1 --- 49,400 122.2
2 2,464,428 94,500 81.7
3 2,464,428 130,500 50.5
4 2,464,428 156,000 37.0
5 --- 156,000 27.9
6 --- 156,000 25.6
7 --- 156,000 23.9
8 --- 156,000 22.8
9 --- 156,000 21.9
10 1,078,068 156,000 23.0
11 --- 156,000 20.1
12 1,078,068 156,000 21.2
13 1,078,068 156,000 20.2
14 1,078,068 156,000 19.3
15 --- 156,000 17.4
16 --- 156,000 17.3
17 --- 156,000 17.3
18 --- 156,000 17.3
19 --- 156,000 17.3
20 1,078,068 156,000 18.1
21 --- 156,000 16.2
22 1,078,068 156,000 17.5
23 1,078,068 156,000 17.0
24 1,078,068 156,000 16.4
25 --- 156,000 15.7

Appendix 159
Appendix 7: dynamic comparative costs calculation of the GTP using SBR with modular construction with regard to the con-stant development of the catchment area (size of module units: 20,000 inhabitants)
months 0 18.5 36.9 48
incurred inhabitants
0 20,000 40,000 52,000
number of the modules
1 2 3 3
CAPEX of unit 3,103,520 €
construction part 1,659,412 €
machine part 1,357,701 €
influent buffer tank 86,406 €
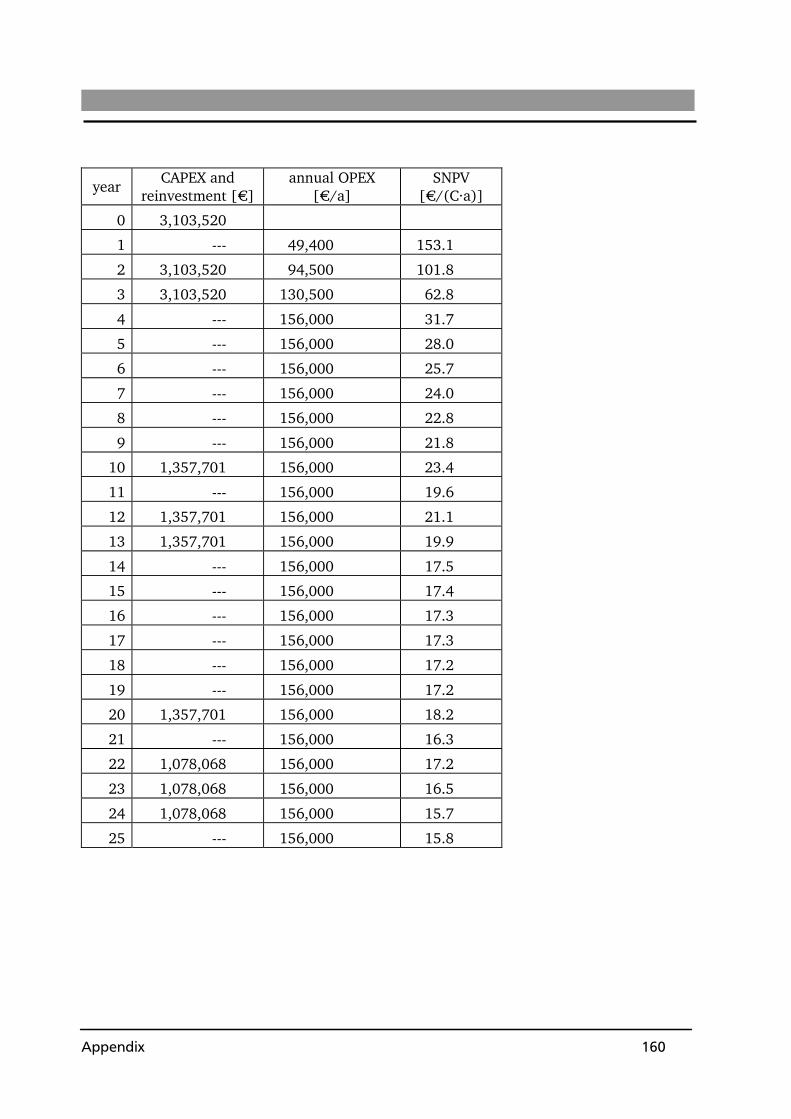
Appendix 160
year CAPEX and
reinvestment [€] annual OPEX
[€/a] SNPV
[€/(C·a)]
0 3,103,520
1 --- 49,400 153.1
2 3,103,520 94,500 101.8
3 3,103,520 130,500 62.8
4 --- 156,000 31.7
5 --- 156,000 28.0
6 --- 156,000 25.7
7 --- 156,000 24.0
8 --- 156,000 22.8
9 --- 156,000 21.8
10 1,357,701 156,000 23.4
11 --- 156,000 19.6
12 1,357,701 156,000 21.1
13 1,357,701 156,000 19.9
14 --- 156,000 17.5
15 --- 156,000 17.4
16 --- 156,000 17.3
17 --- 156,000 17.3
18 --- 156,000 17.2
19 --- 156,000 17.2
20 1,357,701 156,000 18.2
21 --- 156,000 16.3
22 1,078,068 156,000 17.2
23 1,078,068 156,000 16.5
24 1,078,068 156,000 15.7
25 --- 156,000 15.8
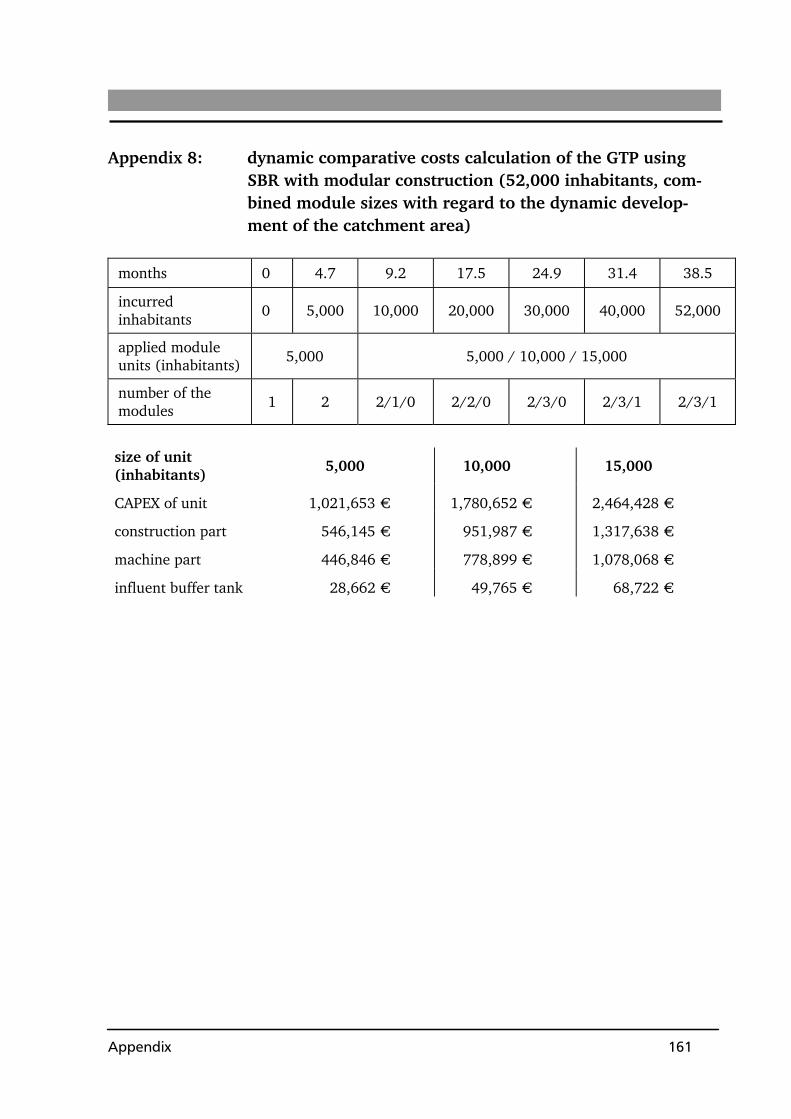
Appendix 161
Appendix 8: dynamic comparative costs calculation of the GTP using SBR with modular construction (52,000 inhabitants, com-bined module sizes with regard to the dynamic develop-ment of the catchment area)
months 0 4.7 9.2 17.5 24.9 31.4 38.5
incurred inhabitants
0 5,000 10,000 20,000 30,000 40,000 52,000
applied module units (inhabitants)
5,000 5,000 / 10,000 / 15,000
number of the modules
1 2 2/1/0 2/2/0 2/3/0 2/3/1 2/3/1
size of unit (inhabitants)
5,000 10,000 15,000
CAPEX of unit 1,021,653 € 1,780,652 € 2,464,428 €
construction part 546,145 € 951,987 € 1,317,638 €
machine part 446,846 € 778,899 € 1,078,068 €
influent buffer tank 28,662 € 49,765 € 68,722 €

Appendix 162
year CAPEX and
reinvestment [€] annual OPEX
[€/a] SNPV
[€/(C·a)]
0 1,021,653
1 2,802,305 54,400 268.8
2 1,780,652 110,000 75.2
3 4,245,079 174,400 57.0
4 --- 190,000 32.9
5 --- 190,000 29.2
6 --- 190,000 26.8
7 --- 190,000 25.1
8 --- 190,000 23.9
9 --- 190,000 22.9
10 446,846 190,000 23.0
11 1,225,745 190,000 23.3
12 778,899 190,000 21.4
13 1,857,015 190,000 21.9
14 --- 190,000 18.4
15 --- 190,000 18.3
16 --- 190,000 18.3
17 --- 190,000 18.2
18 --- 190,000 18.2
19 --- 190,000 18.2
20 446,846 190,000 18.5
21 1,225,745 190,000 18.8
22 778,899 190,000 17.8
23 1,857,015 190,000 18.1
24 --- 190,000 16.1
25 --- 190,000 16.2
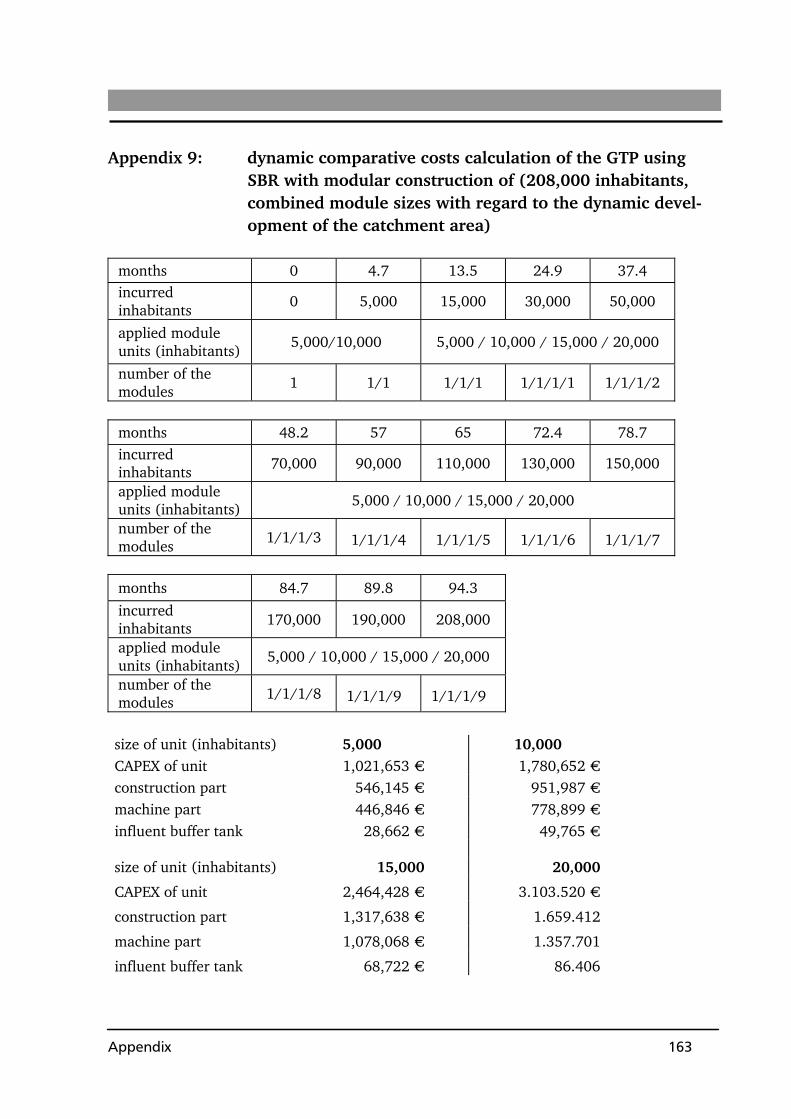
Appendix 163
Appendix 9: dynamic comparative costs calculation of the GTP using SBR with modular construction of (208,000 inhabitants, combined module sizes with regard to the dynamic devel-opment of the catchment area)
months 0 4.7 13.5 24.9 37.4 incurred inhabitants
0 5,000 15,000 30,000 50,000
applied module units (inhabitants)
5,000/10,000 5,000 / 10,000 / 15,000 / 20,000
number of the modules
1 1/1 1/1/1 1/1/1/1 1/1/1/2
months 48.2 57 65 72.4 78.7 incurred inhabitants 70,000 90,000 110,000 130,000 150,000
applied module units (inhabitants)
5,000 / 10,000 / 15,000 / 20,000
number of the modules
1/1/1/3 1/1/1/4 1/1/1/5 1/1/1/6 1/1/1/7
months 84.7 89.8 94.3
incurred inhabitants
170,000 190,000 208,000
applied module units (inhabitants)
5,000 / 10,000 / 15,000 / 20,000
number of the modules
1/1/1/8 1/1/1/9 1/1/1/9
size of unit (inhabitants) 5,000 10,000 CAPEX of unit 1,021,653 € 1,780,652 € construction part 546,145 € 951,987 € machine part 446,846 € 778,899 € influent buffer tank 28,662 € 49,765 € size of unit (inhabitants) 15,000 20,000
CAPEX of unit 2,464,428 € 3.103.520 €
construction part 1,317,638 € 1.659.412
machine part 1,078,068 € 1.357.701
influent buffer tank 68,722 € 86.406
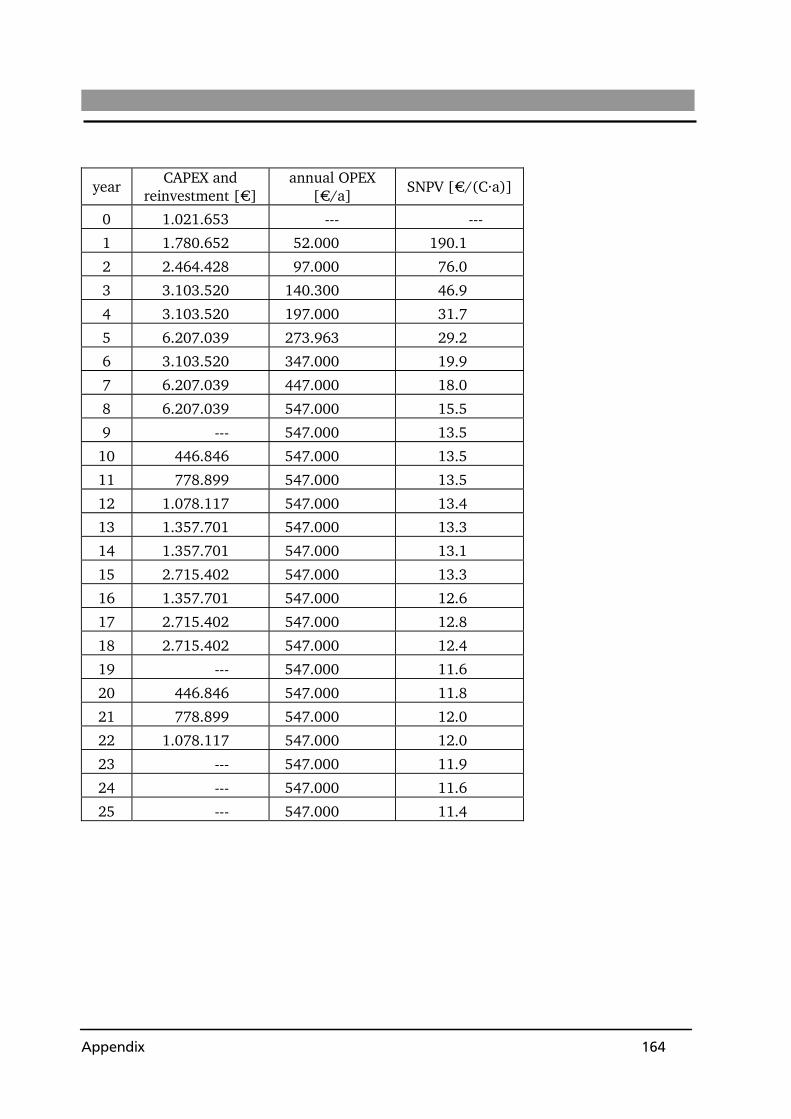
Appendix 164
year CAPEX and
reinvestment [€] annual OPEX
[€/a] SNPV [€/(C·a)]
0 1.021.653 --- ---
1 1.780.652 52.000 190.1
2 2.464.428 97.000 76.0
3 3.103.520 140.300 46.9
4 3.103.520 197.000 31.7
5 6.207.039 273.963 29.2
6 3.103.520 347.000 19.9
7 6.207.039 447.000 18.0
8 6.207.039 547.000 15.5
9 --- 547.000 13.5
10 446.846 547.000 13.5
11 778.899 547.000 13.5
12 1.078.117 547.000 13.4
13 1.357.701 547.000 13.3
14 1.357.701 547.000 13.1
15 2.715.402 547.000 13.3
16 1.357.701 547.000 12.6
17 2.715.402 547.000 12.8
18 2.715.402 547.000 12.4
19 --- 547.000 11.6
20 446.846 547.000 11.8
21 778.899 547.000 12.0
22 1.078.117 547.000 12.0
23 --- 547.000 11.9
24 --- 547.000 11.6
25 --- 547.000 11.4


165
In der Schriftenreihe WAR sind erschienen: WAR 1 Brunnenalterung
Wassertechnisches Seminar am 13.10.1978, TH Darmstadt, 1980
10,30 €
WAR 2 Festschrift zum 60. Geburtstag von Prof. Dr.-Ing. Günther Rincke. TH Darmstadt, 1979
vergriffen
WAR 3 Gniosdorsch, Lothar Georg: Ein Beitrag über den Einfluß der in Abhängigkeit von der verfahrensmäßigen Durchführung der biologischen Abwasserreinigung bedingten Schlammeigen-schaften auf die Schlammentwässe-rung und anschließende Verbrennung. Dissertation, FB 13, TH Darmstadt, 1979
vergriffen
WAR 4 Grundwassergewinnung mittels Filterbrunnen. 2. Wassertechnisches Seminar am 11.04.1980, TH Darmstadt, 1981
vergriffen
WAR 5 Rudolph, Karl-Ulrich: Die Mehrdimensionale Bilanzrechnung als Ent-scheidungsmodell der Wassergütewirtschaft. Dissertation, FB 13, TH Darmstadt, 1980
vergriffen
WAR 6 Hantke, Hartmut: Vergleichende Bewertung von Anlagen zur Grund-wasseranreicherung. Dissertation, FB 13, TH Darmstadt, 1981
vergriffen
WAR 7 Riegler, Günther: Eine Verfahrensgegenüberstellung von Varianten zur Klärschlammstabilisierung. Dissertation, FB 13, TH Darmstadt, 1981
vergriffen
WAR 8 Technisch-wissenschaftliche Grundlagen für Was-serrechtsverfahren in der öffentliche Wasserversor-gung. 3. Wassertechnisches Seminar am 05.und 06.03.1981, TH Darmstadt, 1982
25,60 €
WAR 9 Geruchsemissionen aus Abwasseranlagen. 4. Wassertechnisches Seminar am 15.10.1981, TH Darmstadt, 1982
vergriffen

166
WAR 10 Stadtplanung und Siedlungswasserwirtschaft in Entwicklungsländern.- Aspekte der Pro-jektdurchführung. Vorträge in den Jahren 1980 - 1981. TH Darmstadt, 1982
vergriffen
WAR 11 Hierse, Wilfried: Untersuchungen über das Verhalten phosphathalti-ger Schlämme unter anaeroben Bedingungen. Dissertation, FB 13, TH Darmstadt, 1982
vergriffen
WAR 12 Gossel, Hans: Untersuchungen zum Verhalten von Belebungsan-lagen bei Stoßbelastungen. Dissertation, FB 13, TH Darmstadt, 1982
vergriffen
WAR 13 Hanel, Robert: Der Sauerstoffeintrag und seine Messung beim Belebungsverfahren unter besonderer Beachtung der Viskosität und Oberflächenspannung. Dissertation, FB 13, TH Darmstadt, 1982
vergriffen
WAR 14 Cichorowski, Georg: Regionale Differenzierung in der Gewässergüte-wirtschaft. Dissertation, FB 13, TH Darmstadt, 1982
vergriffen
WAR 15 Schreiner Horst: Stofftausch zwischen Sediment und Wasserkörper in gestauten Fließgewässern. Dissertation, FB 13, TH Darmstadt, 1982
vergriffen
WAR 16 Grundwasserbewirtschaftung - Grundwassermodel-le, Grundwasseranreicherung 5. Wassertechnisches Seminar am 08.10.1982, TH Darmstadt, 1982
vergriffen
WAR 17 Rüthrich, Wulf: Abhängigkeit des Verhaltens der Wohnbevölkerung von Verkehrsimmissionen. Dissertation, FB 13, TH Darmstadt, 1982
vergriffen
WAR 18 Hill, Stefan: Untersuchungen über die Wechselwirkungen zwi-schen Porenverstopfung und Filterwiderstand mit-tels Tracermessungen. Dissertation, FB 13, TH Darmstadt, 1983
25,60 €

167
WAR 19 Kaltenbrunner, Helmut: Wasserwirtschaftliche Auswirkungen der Kühlver-fahren von Kraftwerken und von Abwärmeeinlei-tungen in Fließgewässern. Dissertation, FB 13, TH Darmstadt, 1983
25,60 €
WAR 20 Roeles, Gerd: Auswirkungen von Müllverbrennungsanlagen auf die Standortumgebung - Analyse der Wahrneh-mungen von Störungen und Belästigungen. Dissertation, FB 13, TH Darmstadt, 1982
vergriffen
WAR 21 Niehoff, Hans-Hermann: Untersuchungen zur weitergehenden Abwasserrei-nigung mit vorwiegend biologischen Verfahrens-schritten unter besonderer Berücksichtigung der Grundwasseranreicherung. Dissertation, FB 13, TH Darmstadt, 1983
vergriffen
WAR 22 Biologische Verfahren in der Wasseraufbereitung. 6. Wassertechnisches Seminar am 06.04.1984, TH Darmstadt, 1985
vergriffen
WAR 23 Optimierung der Belüftung und Energieeinsparung in der Abwassertechnik durch Einsatz neuer Belüf-tungssysteme. 7. Wassertechnisches Seminar am 16.11.1984, TH Darmstadt, 1985
vergriffen
WAR 24 Wasserverteilung und Wasserverluste. 8. Wassertechnisches Seminar am 30.05.1985, TH Darmstadt, 1985
vergriffen
WAR 25 Professor Dr. rer. nat. Wolters zum Gedächtnis - 1. Januar 1929 bis 26. Februar 1985. Beiträge von Kollegen, Schülern und Freunden. TH Darmstadt, 1986
vergriffen
WAR 26 Naturnahe Abwasserbehandlungsverfahren im Leistungsvergleich - Pflanzenkläranlagen und Ab-wasserteiche -. 9. Wassertechnisches Seminar am 07.11.1985, TH Darmstadt, 1986
vergriffen

168
WAR 27 Heuser, Ernst-Erich: Gefährdungspotentiale und Schutzstrategien für die Grundwasservorkommen in der Bundesrepublik Deutschland. Dissertation, FB 13, TH Darmstadt, 1986
vergriffen
WAR 28 Rohrleitungen und Armaturen in der Wasserversor-gung 10. Wassertechnisches Seminar am 24.04,1986, TH Darmstadt, 1986
vergriffen
WAR 29 Bau, Kurt: Rationeller Einsatz der aerob-thermophilen Stabili-sierung durch Rohschlamm-Vorentwässerung. Dissertation, FB 13, TH Darmstadt, 1986
vergriffen
WAR 30 Wehenpohl, Günther: Selbsthilfe und Partizipation bei siedlungswasser-wirtschaftlichen Maßnahmen in Entwicklungslän-dern -Grenzen und Möglichkeiten in städtischen Gebieten unterer Einkommensschichten. Dissertation, FB 13, TH Darmstadt, 1987
vergriffen
WAR 31 Stickstoffentfernung bei der Abwasserreinigung - Nitrifikation und Denitrifikation -. 11. Wassertechnisches Seminar am 13.11.1986, TH Darmstadt, 1987
vergriffen
WAR 32 Neuere Erkenntnisse beim Bau und Betrieb von Vertikalfilterbrunnen. 12. Wassertechnisches Seminar am 14.05.1987, TH Darmstadt, 1987
vergriffen
WAR 33 Ist die landwirtschaftliche Klärschlammverwertung nutzbringende Düngung oder preiswerte Abfallbe-seitigung?- Standpunkte und Argumente -. 13. Wassertechnisches Seminar am 12.11.1987, TH Darmstadt, 1988
vergriffen
WAR 34 Automatisierung in der Wasserversorgung - auch für kleinere Unternehmen 14. Wassertechnisches Seminar am 09.06.1988, TH Darmstadt, 1988
33,20 €

169
WAR 35 Erkundung und Bewertung von Altlasten -Kriterien und Untersuchungsprogramme-. 15. Wassertechnisches Seminar am 12.10.1988, TH Darmstadt, 1989
vergriffen
WAR 36 Bestimmung des Sauerstoffzufuhrvermögens von Belüftungssystemen in Reinwasser und unter Be-triebsbedingungen. Workshop am 15. u. 16.03.1988, TH Darmstadt, 1989
vergriffen
WAR 37 Belüftungssysteme in der Abwassertechnik - Fort-schritte und Perspektiven -. 16. Wassertechnisches Seminar am 10.11.1988, TH Darmstadt, 1989
vergriffen
WAR 38 Farinha, Joao António Muralha Ribeiro: Die stufenweise Versorgung mit Anlagen der Tech-nischen Infrastruktur in Abhängigkeit von der Ent-wicklung der sozioökonomischen Verhältnisse der Bevölkerung - dargestellt am Beispiel der Bairros Clandestinos der Region Lissabon-. Dissertation, FB 13, TH Darmstadt, 1989
vergriffen
WAR 39 Sicherstellung der Trinkwasserversorgung Maß-nahmen und Strategien für einen wirksamen Grundwasserschutz zur langfristigen Erhaltung der Grundwassergewinnung. 17. Wassertechnisches Seminar am 01.06.1989, TH Darmstadt, 1989
33,20 €
WAR 40 Regenwassernutzung in privaten und öffentlichen Gebäuden -Qualitative und quantitative Aspekte, technische Anlagen-. Studie für den Hessischen Minister für Umwelt und Reaktorsicherheit. TH Darmstadt, 1981
vergriffen
WAR 41 Folgenutzen kontaminierter Betriebsflächen unter besonderer Berücksichtigung der Sanierungsgren-zen. 18. Wassertechnisches Seminar am 11.10.1989, TH Darmstadt, 1989
vergriffen

170
WAR 42 Privatisierung öffentlicher Abwasseranlagen -Ein Gebot der Stunde ? 19. Wassertechnisches Seminar am 09.11.1989, TH Darmstadt, 1989
30,70 €
WAR 43 Pöpel, H. Johannes; Joachim Glasenapp; Holger Scheer: Planung und Betrieb von Abwasserreinigungsanla-gen zur Stickstoffelimination. Gutachten für das Hess. Ministerium für Umwelt und Reaktorsicher-heit, TH Darmstadt, 1990
35,80 €
WAR 44 Abfallentsorgung Hessen. Standpunkte - Gegensät-ze - Perspektiven Abfallwirtschaftliches Symposium am 31.10.1989, TH Darmstadt, 1990
30,70 €
WAR 45 Brettschneider, Uwe: Die Bedeutung von Sulfaten in der Siedlungswas-serwirtschaft und ihre Entfernung durch Desulfuri-kation. Dissertation, FB 13, TH Darmstadt, 1990
vergriffen
WAR 46 Grabenlose Verlegung und Erneuerung von nicht begehbaren Leitungen -Verfahren, Anwendungs-grenzen, Erfahrungen und Perspektiven-. 20. Wassertechnisches Seminar am 29.03.1990, TH Darmstadt, 1990
35,80 €
WAR 47 Härtel, Lutz: Modellansätze zur dynamischen Simulation des Belebtschlammverfahrens. Dissertation, FB 13, TH Darmstadt, 1990
vergriffen
WAR 48 Pflanzenkläranlagen - besser als ihr Ruf? 21. Wassertechnisches Seminar am 18.09.1990, TH Darmstadt, 1990
vergriffen
WAR 49 Umweltverträglichkeitsprüfung (UVP) in der Was-serwirtschaft - administrativer Wildwuchs oder ökologische Keule? Dokumentation der Beiträge zum Interdisziplinären Kolloquium am 23.02.1990 und zum Sachverstän-digengespräch am 23.02.1990, TH Darmstadt, 1991
vergriffen

171
WAR 50 UVP in der abfallwirtschaftlichen Planung. 22. Wassertechnisches Seminar am 18.10.1990, TH Darmstadt, 1991
vergriffen
WAR 51 Biologische und chemische Phosphatelimination - Technische Möglichkeiten und Grenzen -. 23. Wassertechnisches Seminar am 15.11.1990, TH Darmstadt, 1991
35,80 €
WAR 52 Pöpel, H. Johannes; Tankred Börner: Wurzelraum-Modellanlage Hofgeismar-Beberbeck -Pilotprojekt des Landes Hessen. Gutachten für das Hess. Ministerium für Umwelt und Reaktorsicher-heit. TH Darmstadt, 1991
vergriffen
WAR 53 Wagner, Martin: Einfluß oberflächenaktiver Substanzen auf Stoffaus-tauschmechanismen und Sauerstoffeintrag. Dissertation, FB 13, TH Darmstadt, 1991
35,80 €
WAR 54 Belüftungssysteme in der Abwassertechnik 1991 - Fortschritte und Perspektiven -. 1. gemeinsames Abwassertechnisches Seminar mit der Hochschule für Architektur und Bauwesen Weimar am 11. und 12.04. 1991 in Weimar, TH Darmstadt, 1991
30,70 €
WAR 55 Neuere gesetzliche Anforderungen und moderne technische Lösungen zur Sicherung der Wasserver-sorgung - Erkennen, Vermeiden und Beseitigen von Schadstoffen - 24. Wassertechnisches Seminar am 16.05.1991 TH Darmstadt, 1991
vergriffen
WAR 56 Zhang, Jiansan: Energiebilanzierung anaerob-mesophiler Stabilisie-rungsanlagen mit vorgeschalteter aerob-thermophiler Stufe Dissertation, FB 13, TH Darmstadt, 1991
vergriffen
WAR 57 Glasenapp, Joachim: Leistungsfähigkeit und Wirtschaftlichkeit von Ver-fahrensvarianten zur Sickstoffelimination beim Belebtschlammverfahren. Dissertation, FB 13, TH Darmstadt, 1992
vergriffen

172
WAR 58 Börner, Tankred: Einflußfaktoren für die Leistungsfähigkeit von Pflanzenkläranlagen. Dissertation, FB 13, TH Darmstadt, 1992
vergriffen
WAR 59 Erzmann, Michael: Untersuchungen zur biologischen Elimination von chlorierten Lösemitteln aus Abwasser. Dissertation, FB 13, TH Darmstadt, 1992
35,80 €
WAR 60 Erfassung und Sanierung schadhafter Abwasserka-näle. 26. Wassertechnisches Seminar am 28.11.1991 TH Darmstadt, 1992
35,80 €
WAR 61 Realisierung von Entsorgungsanlagen Umsetzungs-probleme und Lösungsansätze aus planerischer, verwaltungsrechtlicher und politischer Sicht. 25. Wassertechnisches Seminar am 07.11.1991, TH Darmstadt, 1992
vergriffen
WAR 62 Koziol, Matthias: Umwelteffekte durch Förderung von Energieein-sparmaßnahmen in innerstädtischen Althausgebie-ten. Dissertation, FB 13, TH Darmstadt, 1992
25,60 €
WAR 63 Lautner, Gerd: Einführung in das Bauordnungsrecht. 7. erw. Auflage TH Darmstadt, 1992
vergriffen
WAR 64 Abwasserkanäle - Bemessung, Ausführung, Sanie-rung - 2. gemeinsames Seminar -Abwassertechnik- mit der Hochschule für Architektur und Bauwesen Weimar am 18. und 19.03.1992 in Weimar, TH Darmstadt, 1992
vergriffen
WAR 65 Optimierung der Grundwassergewinnung über Filterbrunnen Neue Bau- und Betriebserkenntnisse - 27. Wassertechnisches Seminar am 21.05.1992, TH Darmstadt, 1992
vergriffen

173
WAR 66 Kläschlammbehandlung und Klärschlammentsor-gung -Stand und Entwicklungstendenzen- 31. Darmstädter Seminar -Abwassertechnik- am 12.11.1992, TH Darmstadt, 1992
35,80 €
WAR 67 Kreislaufwirtschaft Bau - Stand und Perspektiven beim Recycling von Baurestmassen- 32. Darmstädter Seminar -Abfalltechnik- am 09.03.1993, TH Darmstadt, 1993
30,70 €
WAR 68 Bewertung von Geruchsemissionen und -immissionen 29. Darmstädter Seminar -Immissionsschutz- am 08.10.1992, TH Darmstadt, 1993
25,60 €
WAR 69 Möglichkeiten und Grenzen der Klärschlamment-sorgung 3. gemeinsames Seminar -Abwassertechnik- mit der Hochschule für Architektur und Bauwesen Weimar am 31.03. und 01.04.1993, TH Darmstadt, 1993
46,-- €
WAR 70 Sichere Wasserversorgung durch moderne Rohrlei-tungstechnik 33. Darmstädter Seminar -Wasserversorgungstechnik- am 11.03.1993, TH Darmstadt, 1993
30,70 €
WAR 71 Aktuelle Aufgaben der Abwasserreinigung und Schlammbehandlung 35. Darmstädter Seminar -Abwassertechnik- am 05. + 06.05.1993, TH Darmstadt, 1993
46,-- €
WAR 72 Raumordnungsverfahren mit Umweltverträglich-keitsprüfung und Umweltleitbilder für die Landes- und Regionalplanung 28. und 30. Darmstädter Seminar -Raumplanung- am 17.09. + 05.11.1992, TH Darmstadt, 1993
40,90 €

174
WAR 73 Grohmann, Walter: Vergleichende Untersuchungen von Belüftungs- und Durchmischungssystemen zur bioverfahrenstechni-schen Optimierung der aerob-thermophilen Stabili-sation (ATS). Dissertation, FB 13, TH Darmstadt, 1993
35,80 €
WAR 74 Dioxinimmissionen und Quellen 34. Darmstädter Seminar -Immissionsschutz- am 15.04.1993, TH Darmstadt, 1994
30,70 €
WAR 75 Betrieb von Abwasserbehandlungsanlagen Optimie-rung, Prozeßstabilität, Kosteneinsparung 36. Darmstädter Seminar -Abwassertechnik- am 04.11.1993 in Darmstadt und 5. gemeinsames Seminar -Abwassertechnik- mit der Fakultät Bauingenieurwe-sen der Hochschule für Architektur und Bauwesen Weimar am 23. und 24.03.1994 in Weimar, TH Darmstadt, 1994
46,-- €
WAR 76 Umweltgerechte Ausweisung und Erschließung von Gewerbegebieten 4. gemeinsames Seminar -Umwelt- und Raumpla-nung- mit der Fakultät Architektur, Stadt- und Regionalplanung der Hochschule für Architektur und Bauwesen Weimar am 08. und 09.09.1993 in Weimar, TH Darmstadt, 1994
vergriffen
WAR 77 Von der Umweltverträglichkeitsprüfung zum ko-operativen Planungsmanagement. -Das Scoping-Verfahren als erste Stufe!?- 37. Darmstädter Seminar -Umwelt- und Raum-planung- am 11.11.1993, TH Darmstadt, 1994
vergriffen
WAR 78 Modellbildung und intelligente Steuerungssysteme in der Umwelttechnik. 38. Darmstädter Seminar -Abfalltechnik- am 24.02.1994, TH Darmstadt, 1994
vergriffen
175
WAR 79 Brauchwassernutzung in Haushalten und Gewerbe-betrieben - Ein Gebot der Stunde? 39. Darmstädter Seminar -Wasserversorgungstechnik- am 17.03.1994, TH Darmstadt, 1994
25,60 €
WAR 80 Restabfallbehandlung in Hessen 41. Darmstädter Seminar -Abfalltechnik- mit dem Hessischen Ministerium für Umwelt, Energie und Bundesangelegenheiten -HMUEB- am 16.06.1994, TH Darmstadt, 1994
vergriffen
WAR 81 Umweltbeeinflussung durch biologische Abfallbe-handlungsverfahren 42. Darmstädter Seminar -Abfalltechnik- mit dem Institut für Hygiene der FU Berlin und dem Institut für Meteorologie der TH Darmstadt am 08. und 09.09.1994 in Berlin, TH Darmstadt, 1994
46,-- €
WAR 82 Zeitgemäße Planung von Anlagen der Ortsentwäs-serung -Kanäle, Bauwerke, Sonderbauwerke- 6. gemeinsames Seminar -Abwassertechnik- mit der Fakultät Bauingenieur-wesen der Hochschule für Architektur und Bauwesen Weimar am 15. und 16.03.1995 in Weimar, TH Darmstadt, 1995
vergriffen
WAR 83 Grundwasseranreicherung -Stand der Technik und neuere Entwicklungen- 44. Darmstädter Seminar -Wasserversorgungstechnik- mit dem Verein des Gas- und Wasserfaches e.V. -DVGW- am 26.04.1994, TH Darmstadt, 1995
30,70 €
WAR 84 Auswirkungen der Phosphorelimination auf die Schlammbehandlung Theoretische Erkenntnisse und praktische Erfah-rungen Workshop vom 24. bis 25. November 1994, TH Darmstadt, 1995
30,70 €

176
WAR 85 Stickstoffelimination mit oder ohne externe Sub-strate ? - Erfahrungen und Überlegungen - 43. Darmstädter Seminar -Abwassertechnik- in Abstimmung mit der Abwassertechnischen Vereini-gung e.V. (ATV) am 09.11.1994, TH Darmstadt, 1995
Vergriffen
WAR 85 Stickstoffelimination mit oder ohne externe Sub-strate ? - Erfahrungen und Überlegungen - 2. Auflage Wiederholung des 43. Darmstädter Seminars -Abwassertechnik- in Abstimmung mit der Abwas-sertechnischen Vereinigung e.V. (ATV) am 01.02.1996 in Düsseldorf TH Darmstadt, 1996
35,80 €
WAR 86 Möglichkeiten und Grenzen der Einsparung von Investitions- und Betriebskosten bei der Abwasser-behandlung 47. Darmstädter Seminar -Abwassertechnik- am 15.11.1995, TH Darmstadt, 1995
40,90 €
WAR 87 Jardin, Norbert: Untersuchungen zum Einfluß der erhöhten biologi-schen Phosphorelimination auf die Phosphordyna-mik bei der Schlammbehandlung. Dissertation, FB 13, TH Darmstadt, 1996
35,80 €
WAR 88 Thermische Restabfallbehandlung für kleine Pla-nungsräume. 45. Darmstädter Seminar -Abfalltechnik- am 22.06.1995 in Hanau, TH Darmstadt, 1996
35,80 €
WAR 89 Ferber, Uwe: Aufbereitung und Revitalisierung industrieller Brachflächen in den traditionellen Industrieregio-nen Europas. Sonderprogramme im Vergleich. Dissertation, FB 13, TH Darmstadt 1996
25,60 €

177
WAR 90 Mechanisch-biologische Restabfallbehandlung unter Einbindung thermischer Verfahren für Teilfraktio-nen. 48. Darmstädter Seminar -Abfalltechnik- am 29.02.1996, TH Darmstadt, 1996
40,90 €
WAR 91 Neuere Erkenntnisse bei Planung, Bau, Ausrüstung und Betrieb von Abwasserbehandlungsanlagen. 7. gemeinsames Seminar -Abwassertechnik- mit der Fakultät Bauingenieur-wesen der Bauhaus-Universität Weimar am 11. und 12.09.1996 in Weimar, TH Darmstadt, 1996
40,90 €
WAR 92 Hygiene in der Abfallwirtschaft. 50. Darmstädter Seminar -Abfalltechnik- am 17.10.1996, TH Darmstadt, 1996
30,70 €
WAR 93 Europäische Richtlinien und Normen zur Abwasser-technik -Konsequenzen und Folgerungen für die Praxis in Deutschland-. 51. Darmstädter Seminar -Abwassertechnik- am 14.11.1996, TH Darmstadt, 1996
25,60 €
WAR 94 Dickhaut, Wolfgang: Möglichkeiten und Grenzen der Erarbeitung von Umweltqualitätszielkonzepten in kooperativen Planungsprozessen. -Durchführung und Evaluie-rung von Projekten-. Dissertation, FB 13, TH Darmstadt 1996
30,70 €
WAR 95 Lautner, Gerd: Einführung in das Baurecht. 8. erweiterte und aktualisierte Auflage, TH Darmstadt, 1997
15,40 €
WAR 96 Reichert, Joachim: Bilanzierung des Sauerstoffeintrags und des Sauer-stoffverbrauchs mit Hilfe der Abluftmethode. Dissertation, FB 13, TH Darmstadt 1997
46,-- €

178
WAR 97 Kuchta, Kerstin: Produktion von Qalitätsgütern in der Abfallbehand-lung. Dargestellt am Beispiel der Produktion in der ther-mischen Abfallbehandlung. Dissertation, FB 13, TH Darmstadt 1997
30,70 €
WAR 98 Görg, Horst: Entwicklung eines Prognosemodells für Bauabfälle als Baustein von Stoffstrom-betrachtungen zur Kreislaufwirtschaft im Bauwesen. Dissertation, FB 13, TH Darmstadt, 1997
46,-- €
WAR 99 Tiebel-Pahlke, Christoph: Abfallentsorgungsplanung – Beeinflussung der Umweltauswirkungen von Deponien. Dissertation, FB 13, TH Darmstadt, 1997
30,70 €
WAR 100 Wagner, Martin: Sauerstoffeintrag und Sauerstoffertrag von Belüf-tungssystemen und deren Bestimmung mit moder-nen Meßmethoden. Habilitation, FB 13, TH Darmstadt, 1997
vergriffen
WAR 101 Neue Trends bei der Behandlung und Entsorgung kommunaler und industrieller Klärschlämme. 8. gemeinsames Seminar -Abwassertechnik- mit der Fakultät Bauingenieur-wesen der Bauhaus-Universität Weimar am 10. und 11.09.1997 in Weimar, TH Darmstadt, 1997
35,80 €
WAR 102 Senkung der Betriebskosten von Abwasserbehand-lungsanlagen. 52. Darmstädter Seminar -Abwassertechnik- am 06.11.1997 in Darmstadt, TU Darmstadt, 1997
35,80 €
WAR 103 Sanierung und Rückbau von Bohrungen, Brunnen und Grundwassermessstellen. 53. Darmstädter Seminar -Wasserversorgung- am 13.11.1997 in Darmstadt mit dem Deutschen Ver-ein des Gas- und Wasserfaches e.V. –DVGW-, TU Darmstadt, 1997
30,70 €

179
WAR 104 Wünschmann, Gabriele: Untersuchungen zur Kompostierbarkeit von Rest-stoffen der Papierindustrie und Altpapier unter besonderer Berücksichtigung von Schadstoffbilan-zierungen. Dissertation, FB 13, TU Darmstadt, 1997
25,60 €
WAR 105 Mechanisch-biologische Restabfallbehandlung unter Einbindung thermischer Verfahren für Teilfraktio-nen. 54. Darmstädter Seminar -Abfalltechnik- am 06.02.1998 in Darmstadt mit dem Hessischen Mi-nisterium für Umwelt, Energie, Jugend, Familie und Gesundheit und der Südhessischen Arbeitsgemein-schaft Abfall-wirtschaft (SAGA)-. TU Darmstadt, 1998
40,90 €
WAR 106 Zentrale oder dezentrale Enthärtung von Trinkwas-ser – Konkurrenz oder sinnvolle Ergänzung ? 55. Darmstädter Seminar -Wasserversorgung- am 14.05.1998 in Darmstadt mit dem Deutschen Ver-ein des Gas- und Wasserfaches e.V. -DVGW- TU Darmstadt, 1998
35,80 €
WAR 107 Dach, Joachim: Zur Deponiegas- und Temperaturentwicklung in Deponien mit Siedlungsabfällen nach mechanisch-biologischer Abfallbehandlung. Dissertation, FB 13, TU Darmstadt, 1998
35,80 €
WAR 108 Einsparung von Kosten für Betriebsmittel, Energie und Personal auf Abwasserbehandlungsanlagen. 9. gemeinsames Seminar -Abwassertechnik- am 16. und 17.09.1998 in Weimar mit der Fakultät Bauin-genieurwesen der Bauhaus-Universität Weimar, TU Darmstadt, 1998
40,90 €
WAR 109 Fortschritte in der Abwassertechnik – 15 Jahre Forschungs- und Entwicklungstätigkeit von Prof. Dr.-Ing. H. Johannes Pöpel. 56. Darmstädter Seminar -Abwassertechnik- am 05.11.1998 in Darmstadt TU Darmstadt, 1998
40,90 €
180
WAR 110 Qualitativer und Quantitativer Grundwasserschutz –Stand und Perspektiven-. 57. Darmstädter Seminar -Wasserversorgung- am 10.06.1999 in Darmstadt mit dem Deutschen Ver-ein des Gas- und Wasserfaches e.V. -DVGW- TU Darmstadt, 1999
35,80 €
WAR 111 Schwing, Elke: Bewertung der Emissionen der Kombination me-chanisch-biologischer und thermischer Abfallbe-handlungsverfahren in Südhessen. Dissertation, FB 13, TU Darmstadt, 1999
30,70 €
WAR 112 Schade, Bernd: Kostenplanung zur Analyse der Wirtschaftlichkeit von biologischen Restabfallbehandlungsanlagen. Dissertation, FB 13, TU Darmstadt, 1999
30,70 €
WAR 113 Lohf, Astrid: Modellierung der chemisch-physikalischen Vorgän-ge im Müllbett von Rostfeuerungsanlagen. Dissertation, FB 13, TU Darmstadt, 1999
25,60 €
WAR 114 Stackelberg, Daniel von: Biologische Festbettdenitrifikation von Grundwas-ser mit abbaubarem Trägermaterial. Dissertation, FB 13, TU Darmstadt, 1999
30,70 €
WAR 115 Folgerungen aus 10 Jahren Abwasserbeseitigung in den neuen Bundesländern -Erfahrungen und Perspektiven- 10. gemeinsames Seminar –Abwassertechnik- am 01. und 02.09.1999 in Weimar mit der Fakultät Bauingenieurwesen der Bauhaus-Universität Wei-mar, TU Darmstadt, 1999
40,90 €
WAR 116 Abwasserwiederverwendung in wasserarmen Regi-onen - Einsatzgebiete, Anforderungen, Lösungsmöglich-keiten -. 58. Darmstädter Seminar –Abwassertechnik- am 11.11.1999 in Darmstadt, TU Darmstadt, 1999
vergriffen
181
WAR 117 Reinhardt, Tim: Untersuchungen zur Dynamik biologischer Prozesse in drei-Phasen-Systemen am Beispiel der Restabfall-rotte unter besonderer Berücksichtigung anaerober Teilprozesse. Dissertation, FB 13, TU Darmstadt, 1999
30,70 €
WAR 118 Umweltfachpläne und Umweltgesetzbuch -Ein Beitrag zur Fortentwicklung des Umweltfach-planungssystems- und „Von der Landschaftsplanung zur Umweltleitpla-nung?“ 46. Darmstädter Seminar -Umwelt- und Raumpla-nung- am 28.09.1995 in Darmstadt, TU Darmstadt, 1999
30,70 €
WAR 119 Herr, Christian: Innovative Analyse und primärseitige Prozeßfüh-rungsoptimierung thermischer Abfallbehandlungs-prozesse – am Beispiel der Mülleingangsklassifizie-rung bei der Rostfeuerung. Dissertation, FB 13, TU Darmstadt, 2000
33,20 €
WAR 120 Neumüller, Jürgen: Wirksamkeit von Grundwasserabgaben für den Grundwasserschutz – am Beispiel des Bundeslandes Hessen. Dissertation, FB 13, TU Darmstadt, 2000
35,80 €
WAR 121 Hunklinger, Ralph: Abfalltechnische Kennzahlen zur umweltgerechten Produktentwicklung. Dissertation, FB 13, TU Darmstadt, 2000
30,70 €
WAR 122 Wie zukunftsfähig sind kleinere Wasserversor-gungsunternehmen? 60. Darmstädter Seminar -Wasserversorgung- am 29. Juni 2000 in Darmstadt. TU Darmstadt, 2000
35,80 €
182
WAR 123 Massnahmen zur Betriebsoptimierung von Pump-werken, Kanalisations-systemen und Abwasserb-handlungsanlagen. 11. gemeinsames Seminar -Abwassertechnik- in Weimar am 20. und 21. September 2000 mit der Fakultät Bauingenieurwesen der Bauhaus-Universität Weimar. TU Darmstadt, FB 13, 2000
40,90 €
WAR 124 Mohr, Karin: Entwicklung einer on-line Emissionsmeßtechnik zur quasi-kontinuierlichen Bestimmung von Organoha-logen-Verbindungen in Abgasen thermischer Pro-zesse. Dissertation, FB 13, TU Darmstadt, 2000
30,70 €
WAR 125 El-Labani, Mamoun: Optimierte Nutzung bestehender Abfallverbren-nungsanlagen durch Errichtung vorgeschalteter Reaktoren zur Behandlung heizwertreicher Abfälle. Dissertation, FB 13, TU Darmstadt, 2000
25,60 €
WAR 126 Durth, Anke: Einfluß von Temperatur, Anlagenkonfiguration und Auslastung auf die Ablaufkonzentration bei der biologischen Abwasserreinigung. Dissertation, FB 13, TU Darmstadt, 2000
25,60 €
WAR 127 Meyer, Ulrich: Untersuchungen zum Einsatz von Fuzzy-Control zur Optimierung der Stickstoffelimination in Abwasser-behandlungsanlagen mit vorgeschalteter Denitrifi-kation. Dissertation, FB 13, TU Darmstadt, 2000
33,20 €
WAR 128 Kommunale Klärschlammbehandlung vor dem Hintergrund der neuen europäischen Klärschlamm-richtlinie. 61. Darmstädter Seminar -Abwassertechnik- am 09.11.2000 in Darmstadt, TU Darmstadt, FB 13, 2000
35,80 €

183
WAR 129 Mengel, Andreas: Stringenz und Nachvollziehbarkeit in der fachbezo-genen Umweltplanung. Dissertation, FB 13, TU Darmstadt, 2001
46,-- €
WAR 130 Kosteneinsparungen durch neuartige Automatisie-rungstechniken in der Wasserversorgung. 62. Darmstädter Seminar -Wasserversorgung- am 07.06.2001 in Darmstadt, TU Darmstadt, FB 13, 2001
30,70 €
WAR 131 Aktive Zukunftsgestaltung durch Umwelt- und Raumplanung. Festschrift zum 60. Geburtstag von Prof. Dr.-Ing. Hans Reiner Böhm. TU Darmstadt, FB 13, 2001
25,60 €
WAR 132 Aktuelle Ansätze bei der Klärschlammbehandlung und -entsorgung. 12. gemeinsames Seminar -Abwassertechnik- in Weimar am 05. und 06. September 2001 mit der Fakultät Bauingenieurwesen der Bauhaus-Universität Weimar. TU Darmstadt, FB 13, 2001
40,90 €
WAR 133 Zum Bodenwasser- und Stoffhaushalt auf unter-schiedlich bewirtschafteten Flächen unter Einbezie-hung ökonomischer Aspekte Interdisziplinäre Projektstudie der Technischen Universität Darmstadt (TUD) mit Partner. TU Darmstadt, FB 13, 2001
30,70 €
WAR 134 Neues zur Belüftungstechnik - Probleme, Lösungsmöglichkeiten, Entwicklungen - 64. Darmstädter Seminar -Abwassertechnik- am 15.11.2001 in Darmstadt, TU Darmstadt, FB 13, 2001
35,-- €
WAR 135 Auswirkungen der Verordnung über die umweltver-trägliche Ablagerung von Siedlungsabfällen und über biologische Abfallbehandlungsanlagen. 63. Darmstädter Seminar -Abfalltechnik- am 12. und 13.11.2001 in Darmstadt, TU Darmstadt, FB 13, 2001
35,-- €
184
WAR 136 Bockreis, Anke: Infrarot-Thermographie zur Überwachung von Flächenbiofiltern. Dissertation, FB 13, TU Darmstadt, 2001
35,-- €
WAR 137 Luft, Cornelia: Luftgetragene mikrobielle Emissionen und Immissi-onen an aeroben mechanisch-biologischen Abfall-behandlungsanlagen. Dissertation, FB 13, TU Darmstadt, 2002
30,-- €
WAR 138 Danhamer, Harald: Emissionsprognosemodell für Deponien mit mecha-nisch-biologisch vorbehandelten Abfällen - Schwer-punkt: Modellierung des Gashaushaltes. Dissertation, FB 13, TU Darmstadt, 2002
25,-- €
WAR 139 Lieth, Sabine: Stickstoffelimination aus kommunalem Abwasser mit getauchten Festbetten nach Vorbehandlung mit HCR-Reaktoren. Dissertation, FB 13, TU Darmstadt, 2002
35,-- €
WAR 140 Streit, Hans-Ulrich: Optimierung des Kombinationsbetriebs eines Ad-vanced Oxidation Process mit einer Stripp-Anlage zur Grundwassersanierung. Dissertation, FB 13, TU Darmstadt, 2002
25,-- €
WAR 141 Spura, Patrik: Ein Vergleich des anlagebezogenen tschechischen Luftreinehalterechts mit jenem der Europäischen Union vor dem Hintergrund des anstehenden Bei-tritts. Dissertation, Univ. Frankfurt a.M., 2002
40,-- €
WAR 142 Hilligardt, Jan: Nachhaltige Regionalentwicklung durch freiwillige regionale Kooperation - Faktoren einer erfolgrei-chen Initiierung untersucht an der Region Starken-burg. Dissertation, FB 13, TU Darmstadt, 2002
30,-- €

185
WAR 143 Heiland, Peter: Vorsorgender Hochwasserschutz durch Raumord-nung, interregionale Koopera- tion und ökonomischen Lastenausgleich. Dissertation, FB 13, TU Darmstadt, 2002
30,-- €
WAR 144 Dapp, Klaus: Informationsmanagement in der Planung am Bei-spiel des vorsorgenden Hochwasserschutzes. Dissertation, FB 13, TU Darmstadt, 2002
25,-- €
WAR 145 Schüler, Doris: Untersuchungen an der Technikumsanlage VERO-NA zur Bildung und zum Abbau von polyhaloge-nierten Dioxinen und Furanen und anderen Orga-nohalo-genverbindungen in Verbrennungsprozes-sen. Dissertation, FB 13, TU Darmstadt, 2002
25,-- €
WAR 146 Grundwasserproblematik im Hessischen Ried : Eine unlösbare Aufgabe? 65. Darmstädter Seminar -Wasserversorgung- am 23.10.2002 in Darmstadt, TU Darmstadt, FB 13, 2002
30,-- €
WAR 147 Rückgewinnung von Phosphor aus Klärschlamm und Klärschlammasche. 66. Darmstädter Seminar -Abwassertechnik- am 07.11.2002 in Darmstadt, TU Darmstadt, FB 13, 2002
35,-- €
WAR 148 Schneider, Andreas: Role of LCA concepts at the Research and Devel-opment phase of a new process for waste treatment - The Trefoil Kiln process subject to IPPC and BAT requirements. Dissertation, FB 13, TU Darmstadt, 2002
25,-- €
WAR 149 Sonnenburg, Alexander: Untersuchungen zur Denitrifikation von Grundwas-ser in Schüttungen mit abbaubarem Trägermaterial. Dissertation, FB 13, TU Darmstadt, 2002
vergriffen

186
WAR 150 Emissionen aus der Abfallbehandlung. Energie - Emissionen – Messtechnik. 67. Darmstädter Seminar -Abfalltechnik- am 13. Februar 2003 in Darmstadt, TU Darmstadt, FB 13, 2003
35,-- €
WAR 151 Rationalisierungsmaßnahmen in der Wasserversor-gung. Umsetzungsstatus und künftige Entwicklungen. 68. Darmstädter Seminar -Wasserversorgung- am 15. Oktober 2003 in Darmstadt, TU Darmstadt, FB 13, 2003
vergriffen
WAR 152 Verantwortungspartnerschaft beim vorsorgenden Hochwasserschutz. 69. Darmstädter Seminar - Umwelt- und Raumpla-nung - am 16. Oktober 2003 in Darmstadt, TU Darmstadt, FB 13, 2003
vergriffen
WAR 153 Biofiltration. Renaissance eines Verfahrens durch erhöhte Anforderungen im In- und Ausland ? 70. Darmstädter Seminar -Abwassertechnik- am 06. November 2003 in Darmstadt, TU Darmstadt, FB 13, 2003
35,-- €
WAR 154 Seiler, Kainan: Planung der Abwasserentsorgung im ländlichen Raum anhand von räumlichen Einflussfaktoren. Dissertation, FB 13, TU Darmstadt, 2004
30,-- €
WAR 155 Ludwig, Thomas: Entwicklung der Emissionsmessanlage DioxinCop Dissertation, FB 13, TU Darmstadt, 2004
25,-- €
WAR 156 Haffner, Yvonne: Sozialwissenschaftliche Modellierung zur Privatisie-rung der Wasserversorgung. Dissertation, FB 2, TU Darmstadt, 2004
vergriffen
WAR 157 Geruch Messung – Wirkung – Minderung 71. Darmstädter Seminar -Abfalltechnik- am 24. Juni 2004 in Darmstadt, TU Darmstadt, FB 13, 2004
35,-- €

187
WAR 158 Qualitätssicherung bei Wassergewinnungsanlagen. -Umsetzung und aktuelle Entwicklung im Regel-werk- 72. Darmstädter Seminar –Wasserversorgung– am 06.10.2004 in Darmstadt TU Darmstadt, 2004
vergriffen
WAR 159 Wasserwiederverwendung - eine ökologische und ökonomische Notwendigkeit wasserwirtschaftlicher Planung weltweit ? - 73. Darmstädter Seminar –Abwassertechnik– am 04.11.2004 in Darmstadt TU Darmstadt, 2004
vergriffen
WAR 160 Weil, Marcel: Ressourcenschonung und Umweltentlastung bei der Betonherstellung durch Nutzung von Bau- und Abbruchabfällen. Dissertation, FB 13, TU Darmstadt, 2004
35,-- €
WAR 161 Unendlicher Wachstum auf unendlicher Fläche ? 74. Darmstädter Seminar –Umwelt- und Raumpla-nung– am 27.01.2005 in Darmstadt TU Darmstadt, 2005
vergriffen
WAR 162 Gernuks, Marko: Entwicklung einer Methode zur Bewertung von Umweltaspekten mit der Ableitung von Umweltzie-len im Rahmen von EMAS. Dissertation, FB 13, TU Darmstadt, 2004
35,-- €
WAR 163 Rother, Elmar: Optimising Design and Operation of the Biofiltra-tion Process for Municipal Wastewater Treatment. Dissertation, FB 13, TU Darmstadt, 2005
35,-- €
WAR 164 Hilligardt, Jan: Regionale Kooperation der Landkreise, Städte und Gemeinden Stand – Potenziale – Perspektiven. Habilitation, FB 13, TU Darmstadt, 2005
vergriffen

188
WAR 165 Gramel, Stefan: Privatisierung von Wasserversorgungsunternehmen – Auswirkungen auf den Umwelt- und Ressourcen-schutz? Dissertation, FB 13, TU Darmstadt, 2004
35,-- €
WAR 166 Krause, Stefan: Untersuchungen zum Energiebedarf von Membran-belebungsanlagen. Dissertation, FB 13, TU Darmstadt, 2005
35,-- €
WAR 167 Rückgewinnung von Phosphor aus Abwasser und Klärschlamm Konzepte - Verfahren - Entwicklungen 75. Darmstädter Seminar –Abwassertechnik– am 12./13.12.2005 in Darmstadt TU Darmstadt, 2005
vergriffen
WAR 168 Hora, Maike: Abfallverursacher Elektrogeräte. Ansätze zur pro-spektiven Bilanzierung von Abfallströmen in der umweltgerechten Produktentwicklung. Dissertation, FB 13, TU Darmstadt, 2005
30,-- €
WAR 169 Zhang, Wensheng: Ökologische siedlungswasserwirtschaftliche Kon-zepte für urbane Räume Chinas unter Berücksichti-gung deutscher Techniken und Erfahrungen. Dissertation, FB 13, TU Darmstadt, 2005
30,-- €
WAR 170 Steinberg, Iris: Untersuchungen zur Effizienzsteigerung von biolo-gischen und nicht-thermi-schen Abluftreinigungs-verfahren bei der biologischen Abfallbehandlung. Dissertation, FB 13, TU Darmstadt, 2005
30,-- €
WAR 171 Haupter, Birgit: Transnationale Förderprogramme zur Raument-wicklung. Untersuchungen zur Wirkung für die räumliche Planung zum Hochwasserschutz. Dissertation, FB 13, TU Darmstadt, 2006
35,-- €
WAR 172 Ott, Carsten: Straßenkehrichtentsorgung: Anlagenkonzept und Nachhaltigkeitsanalyse. Dissertation, FB 13, TU Darmstadt, 2006
30,-- €
189
WAR 173 1 Jahr Abfallablagerungsverordnung Wo bleibt der Müll? 76. Darmstädter Seminar –Abfalltechnik– am 1.06.2006 in Darmstadt TU Darmstadt, 2006
35,-- €
WAR 174 Wachstumsregion – Handlungsansätze für mehr Nachhaltigkeit. 77. Darmstädter Seminar –Umwelt- und Raumpla-nung– am 11.09.2006 in Darmstadt TU Darmstadt, 2006
30,-- €
WAR 175 Interdisziplinarität in der Umwelt- und Raumpla-nung. - Theorie und Praxis - Festschrift für Professor Böhm TU Darmstadt, 2006
40,-- €
WAR 176 Neue maschinen- und verfahrenstechnische Mög-lichkeiten zur Einsparung von Betriebskosten bei der Abwasserbehandlung. 78. Darmstädter Seminar –Abwassertechnik– am 02.11.2006 in Darmstadt TU Darmstadt, 2006
35,-- €
WAR 177 Einsparpotenziale in der Trinkwasserversorgung durch Optimierung von Wasserverteilungsnetzen. 79. Darmstädter Seminar –Wasserversorgung– am 05.10.2006 in Darmstadt TU Darmstadt, 2006
30,-- €
WAR 178 Meyer, Lutz: Exergiebasierte Untersuchung der Entstehung von Umweltbelastungen in Energieumwandlungspro-zessen auf Komponentenebene: Exergoökologische Analyse. Dissertation, FB 13, TU Darmstadt, 2006
35,--
WAR 179 Gasafi, Edgard: Entwicklung einer lebenswegbasierten Screening-Methode zur Entscheidungsunterstützung in frühen Phasen der Verfahrensentwicklung. Dissertation, FB 13, TU Darmstadt, 2006
35,-- €

190
WAR 180 Treskatis, Christoph: Bewirtschaftung von Grundwasserressourcen -Planung, Bau und Betrieb von Grundwasserfassun-gen-. Habilitation, FB 13, TU Darmstadt, 2006
45,-- €
WAR 181 Uihlein, Andreas: Modellierung der Kohlenstoffströme zur Untersu-chung der Nutzung von Kohlenstoffträgern in Deutschland. Dissertation, FB 13, TU Darmstadt, 2006
35,-- €
WAR 182 den Boer, Emilia: A Novel Approach for Integrating Heavy Metals Emissions from Landfills into Life Cycle Assessment - Consideration of Waste Pretreatment, Landfill Processes and Long-Term Effects Dissertation, FB 13, TU Darmstadt, 2006
30,-- €
WAR 183 Klimawandel – Anpassungsstrategien in Deutsch-land und Europa. 80. Darmstädter Seminar –Umwelt- und Raumpla-nung– am 29.03.2007 in Darmstadt TU Darmstadt, 2007
25,-- €
WAR 184 Stephan, Henrik Bewertungsmethodik für Fertigungsverfahren im Karosseriebau aus Sicht des betrieblichen Umwelt-schutzes. Dissertation, FB 13, TU Darmstadt, 2007
vergriffen
WAR 185 Schaum, Christian A.: Verfahren für eine zukünftige Klärschlammbehand-lung -Klärschlammkonditionierung und Rückgewinnung von Phosphor aus Klärschlammasche-. Dissertation, FB 13, TU Darmstadt, 2007
35,-- €
WAR 186 Rohde, Clemens: Milchsäurefermentation von biogenen Abfällen. Dissertation, FB 13, TU Darmstadt, 2007
35,-- €
WAR 187 Risikoanalyse von Trinkwassereinzugsgebieten und Fassungen. 81. Darmstädter Seminar -Wasserversorgung- am 11.10.2007 in Darmstadt TU Darmstadt, 2007
30,-- €
191
WAR 188 Cangahuala Janampa, Ana: Wasserverlustmanagement in Wasserverteilungsan-lagen in Entwicklungs- ländern am Beispiel von Peru. Anwendung ver-schiedener Methoden zur multikriteriellen Ent-scheidungsunterstützung. Dissertation, FB 13, TU Darmstadt, 2007
vergriffen
WAR 189 Pollmann, Olaf: Optimierung anthropogener Stoffströme am Bei-spiel des Papierrecyclings. Dissertation, FB 13, TU Darmstadt, 2007
vergriffen
WAR 190 Wie sieht die Abwasserbehandlung der Zukunft aus? -vierte, fünfte, sechste Reinigungsstufe? 82. Darmstädter Seminar -Abwassertechnik- am 15.11.2007 in Darmstadt TU Darmstadt, 2007
35,-- €
WAR 191 Koffler, Christoph: Automobile Produkt-Ökobilanzierung. Dissertation, FB 13, TU Darmstadt, 2007
35,-- €
WAR 192 Koch, Michael: Untersuchungen zum Einfluss der Energiedissipati-onsdichte auf Reaktionsabläufe im "Highloaded Compact Reactor" (HCR®). Dissertation, FB 13, TU Darmstadt, 2007
35,-- €
WAR 193 Den Boer, Jan: Sustainability Assessment for Waste Management Planning - Development and Alternative Use of the LCA-IWM Waste Management System Assessment Tool. Dissertation, FB 13, TU Darmstadt, 2007
30,-- €
WAR 194 Biogas Klimaretter oder Ressourcenverschwender 83. Darmstädter Seminar -Abfalltechnik- am 11.12.2007 in Darmstadt TU Darmstadt, 2007
vergriffen
WAR 195 Scheck, Natalie: Die Strategische Umweltprüfung als Instrument zur Förderung einer nachhaltigen Entwicklung – Unter-suchung am Beispiel der Regionalplanung Südhes-sen. Dissertation, FB 13, TU Darmstadt, 2007
30,-- €

192
WAR 196 Klimawandel – Markt für Strategien und Technolo-gien?! 84. Darmstädter Seminar –Abfalltechnik und Um-welt- und Raumplanung – am 26.06.2008 in Darmstadt TU Darmstadt, 2008
vergriffen
WAR 197 Hähnlein, Christian: Numerische Modellierung zur Betriebsoptimierung von Wasserverteilnetzen Dissertation, FB 13, TU Darmstadt, 2008
30,-- €
WAR 198 Berger, Jan: Biologische Methanoxidation in Deponieabdeck-schichten Dissertation, FB 13, TU Darmstadt, 2008
35,-- €.
WAR 199 Wellge, Steffen: Evaluation von betrieblichen Umweltmanagement-systemen Dissertation, FB 13, TU Darmstadt, 2009
35,-- €
WAR 200 Bieker, Susanne: Semizentrale Ver- und Entsorgungssysteme: neue Lösungen für schnell wachsende urbane Räume. Untersuchung empfehlenswerter Größenordnungen Dissertation, FB 13, TU Darmstadt, 2009
35,-- €
WAR 201 Hoffmann, Karl Peter: Reduzierung von CO2-Emissionen durch den Ein-satz von Erdgas aus Biogas in dezentralen Stirling-KWK-Anlagen Dissertation, FB 13, TU Darmstadt, 2009
30,-- €
WAR 202 Loock, Peter: Veränderung der Leistungsfähigkeit feinblasiger Membranbelüftungselemente unter abwassertech-nischen Betriebsbedingungen Dissertation, FB 13, TU Darmstadt, 2009
35,-- €
WAR 203 Warsen, Jens: Validierung von Stoffflussdaten in der Ökobilanz durch Daten aus dem öffentlichen Berichtswesen Dissertation, FB 13, TU Darmstadt, 2009
35,-- €
WAR 204 Klärschlammfaulung und –verbrennung: das Be-handlungskonzept der Zukunft? 85. Darmstädter Seminar -Abwassertechnik- am 13.04.2010 in Darmstadt TU Darmstadt, 2010
35,-- €

193
WAR 205 Neue Herausforderungen und Chancen in der Was-serversorgung. Darmstädter Seminar -Wasserversorgung und Grundwasserschutz- im Rahmen des 1. Darmstädter Ingenieurkongresses Bau und Umwelt am 14. und 15.09.2009 in Darmstadt TU Darmstadt, 2010
35,-- €
WAR 206 Pennekamp, Sandra: Raumentwicklung im Spannungsfeld zwischen Wachstum und Schrumpfung - was können überregionale Partnerschaften leis-ten? Dissertation, FB 13, TU Darmstadt, 2010
35,-- €
WAR 207 Frommer, Birte: Regionale Anpassungsstrategien an den Klimawan-del – Akteure und Prozess Dissertation, FB 13, TU Darmstadt, 2010
35,-- €
IWAR 208 Chang, Yue: Greywater treatment within semi-centralised supply and treatment systems by the example of the Peo-ple’s Republic of China Dissertation, FB 13, TU Darmstadt, 2010
35,-- €

ISBN 978-3-940897-04-6
Zur AutorinYue Chang, geboren 1975 in Qingdao, V. R. China, studierte am College of Civil Engineering Wuhan, V. R. China Siedlungswasserwirtschaft und an der Technischen Universität Darmstadt Bauingenieurwesen mit dem Schwerpunkt Siedlungswasserwirtschaft. Anschließend war sie dort als wissenschaftliche Mitarbeiterin am Fachgebiet Abwassertechnik, Institut IWAR tätig. Schwerpunkt ihrer Tätigkeit war die Untersuchung der Grauwasserbehandlung zur innerstäd-tischen Wasserwiederverwendung im Rahmen der semizentralen Ver- und Entsorgungssysteme für schnell wachsende urbane Räume.
Zum InhaltDie vorliegende Arbeit befasst sich mit der Untersuchung der Grauwasserbehandlung zur innerstädtischen Wasserwiederverwendung im Rahmen von semizentralen Ver- und Entsor-gungssystemen. Die technisch-wissenschaftliche Untersuchung der Grauwasserbehandlung wurde an einer halbtechnischen Versuchsanlage durchgeführt. Die weiteren Betrachtungen hinsichtlich technischer, ökologischer und ökonomischer Aspekte wurden im Rahmen der Entwicklung des gesamten semizentralen Konzeptes durchgeführt.