Yuan Chen project266d China auto mkt JTRF...
30
1 The Chinese Automobile Industry and Government Policy 1 Yuan Chen, C.-Y. Cynthia Lin Lawell, and Yunshi Wang October 2019 Abstract China is experiencing rapid economic growth and, along with it, rapid growth in vehicle ownership. The rapid growth in vehicle ownership and vehicle usage is linked to increasing global warming, emissions, air pollution, and other problems. In this paper, we discuss the Chinese automobile industry and government policy, and review the literature on vehicle markets and policy in China. Using a comprehensive annual data set we have collected and constructed of all the car models marketed from the year 2004 to year 2013 in the Chinese automobile industry, we then discuss and describe the characteristics of vehicles in the Chinese automobile industry. The detailed information, description, research, and data presented in this paper have important implications for those in industry, government, society, academia, and non-governmental organizations interested in the Chinese automobile market, the automobile industry, and transportation policy. Keywords: automobile market, China, alternative vehicles JEL codes: L62, L13, Q58
Transcript of Yuan Chen project266d China auto mkt JTRF...

1
The Chinese Automobile Industry and Government Policy1
Yuan Chen, C.-Y. Cynthia Lin Lawell, and Yunshi Wang
October 2019
Abstract
China is experiencing rapid economic growth and, along with it, rapid growth in vehicle ownership. The rapid growth in vehicle ownership and vehicle usage is linked to increasing global warming, emissions, air pollution, and other problems. In this paper, we discuss the Chinese automobile industry and government policy, and review the literature on vehicle markets and policy in China. Using a comprehensive annual data set we have collected and constructed of all the car models marketed from the year 2004 to year 2013 in the Chinese automobile industry, we then discuss and describe the characteristics of vehicles in the Chinese automobile industry. The detailed information, description, research, and data presented in this paper have important implications for those in industry, government, society, academia, and non-governmental organizations interested in the Chinese automobile market, the automobile industry, and transportation policy.
Keywords: automobile market, China, alternative vehicles JEL codes: L62, L13, Q58

2
INTRODUCTION
China is experiencing rapid economic growth and, along with it, rapid growth in vehicle
ownership. Evidence from Chinese cities suggests average annual growth rates in per capita
vehicle ownership of 10% to 25% (Darido, Torres, and Mehndiratta 2014). According to data
from the China Statistical Yearbook (1990-2011), vehicle ownership increased by nearly 56 times
between 1990 and 2011 (Liu and Lin Lawell 2019). The rapid growth in vehicle ownership and
vehicle usage is linked to increasing global warming, emissions, air pollution, and other problems.
In this paper, we discuss the Chinese automobile industry and government policy, and
review the literature on vehicle markets and policy in China. Using a comprehensive annual data
set we have collected and constructed of all the car models marketed from the year 2004 to year
2013 in the Chinese automobile industry, we then discuss and describe the characteristics of
vehicles in the Chinese automobile industry.
The detailed information, description, research, and data presented in this paper have
important implications for those in industry, government, society, academia, and non-
governmental organizations (NGOs) interested in the Chinese automobile market, the automobile
industry, and transportation policy.
CHINA’S AUTOMOBILE INDUSTRY
In 2009, China’s automobile market became the largest in the world, surpassing the U.S.
automobile market both in sales and production. The annual gross product of the China’s
automobile industry has exceeded 5% of the country’s annual GDP every year since 2002, and
was as high as 7.4% of its GDP in 2010.2 According to China’s National Bureau of Statistics
(National Bureau of Statistics of China 2002-2010), the total number of civilian passenger vehicles
owned in China increased from 17.35 million to 123.27 million from 2004 to 2014, with an annual
growth rate of 21.69%. The total number of civilian vehicles owned in China, including civilian
trucks, was 145.98 million in 2014.
The Chinese automobile industry underwent several phases of growth since the start of
China’s economic reform in 1978. At that time, Chinese automobile manufacturing had low
productivity. In the year 1980, total vehicle output was only around five thousand vehicles. As
incomes grew, household demand for passenger vehicles grew rapidly, which resulted in a large

3
amount of cars being imported to China. In order to protect the vulnerable and immature domestic
Chinese automobile industry, tariffs were set as high as 250% (Li, Xiao and Liu 2015).
Several large state-owned automobile enterprises in China tried to partner with foreign auto
manufacturers to form joint ventures to increase their capacity and enhance their technical
capabilities. However, foreign ownership was capped at 50% to protect domestic producers. In
1994, China’s National Development and Reform Commission (NDRC) initiated an automobile
industry policy encouraging state-owned firms to partner with international car makers to form
joint ventures (Li, Xiao and Liu 2015). Following this policy, more joint ventures were formed
between large state-owned automobile companies and foreign auto manufacturers (Li, Xiao and
Liu 2015). Meanwhile, local and private producers also entered the market.
In 2001, China entered the World Trade Organization (WTO). In order to fulfill its
commitment under the WTO, the Chinese government gradually cut the tariffs on foreign
automobiles from 100% to 25% during the five-year transition period. However, the market shares
of imports further dropped from about 6% in 2001 to 3% in 2006 and it has stayed at that level
since then (Li, Xiao and Liu 2015). One reason why the market shares of imported vehicles
dropped even though tariffs on foreign automobiles fell is that foreign car companies have found
other ways to collaborate with Chinese automobile companies and sell automobiles to Chinese
consumers. Instead of exporting cars to China, foreign car companies can form joint ventures with
Chinese car makers to directly produce cars in China.
The Chinese manufacturers of passenger vehicles can be categorized into two different
types: indigenous-brand manufacturers, such as BYD, Geely, and Chery; and joint ventures
between domestic manufacturers and foreign manufacturers, such as Shanghai Automotive
Investment Company (SAIC) with Hyundai, and Dongfeng with Honda.
In Figure 1, adapted from Hu, Xiao and Zhou (2014), we present the market structure of
the Chinese automobile industry. Chinese firms that are at least partially state-owned are in bold
rectangles. Private Chinese firms are in bold dashed rectangles. International car companies are
in rounded rectangles. Lines connecting firms indicate joint ventures between firms. The large
boxes around state-owned firms and the international car companies with which they form joint
ventures indicate the largest state-owned automobile groups in China.
According to Chinese automobile policy, a Chinese automobile company can form joint
ventures with multiple foreign car manufacturers. For example, as seen in Figure 1, Shanghai

4
Auto has cooperated with General Motors and Volkswagen. Dongfeng Motors partners with
Nissan, Honda, Kia, and PSA. On the other hand, under Chinese policy, a foreign car manufacturer
is only allowed to form joint ventures with up to two Chinese automobile companies.3 For
example, Honda partners with both Dongfeng Group and Guangzhou Auto. Toyota, another
Japanese automobile firm, cooperates with both Fist Auto Work and Guangzhou Auto. In addition
to large stated-owned auto groups, private car makers in China also partner with foreign car
makers. Huachen Auto cooperates with BMW. Joint ventures with international car companies
account for two thirds of the passenger vehicle market, with the rest mostly taken up by indigenous
brands (Li, Xiao and Liu 2015).
Figure 2 presents the location of the automobile firms listed in Figure 1. Most of the
automobile firms are located along the east of the continent. Two of the “China Automobile Group
Four” are located in the east, with First Auto Work in the northeast, and Shanghai Automotive
Investment Company (SAIC) in the Southeast. For the other two, Dongfeng Group is in the middle
east of the country, while Chang’an Automobile Group is in central China. Two large indigenous
firms, Geely and Chery, are located in the southeast part of China.
On April 17, 2018, the Chinese government announced that it plans to change its policies
that cap ownership of vehicle manufacturing by foreign automakers at 50% (O’Kane 2018), and
that in five years it will end a two-decade restriction that requires global automakers to work with
state-owned companies (Welitzkin 2018). In particular, the Chinese government says that it will
lift those restrictions on makers of electric vehicles sometime in 2018, and that it will remove them
for commercial vehicles in 2020, and for conventional passenger vehicles in 2022 (O’Kane 2018).
In 2005, CAAM, the statistical organization of the Chinese automobile industry that
categorizes vehicles, reclassified vehicles into two broad categories: passenger vehicles and
commercial vehicles. CAAM further divided passenger vehicle into four types: Basic Passenger
Vehicles (BPV), Sport Utility Vehicle (SUV), Multi-purpose Vehicle (MPV), and others
(including crossover vehicles resembling traditional station wagons that combine features of
passenger vehicles and sport utility vehicles). According to the China Automobile Industry Year
Book (2012), China’s output in 2012 was 10.767 million BPVs, 491,896 MPVs, and 1.999 million
SUVs. Total output for passenger vehicles in 2012 was 13.258 million and total sales of passenger
vehicles in 2012 was 13.239 million.
5
In September 2004, China introduced its first fuel economy standards for light duty
passenger vehicles (GB 19578-2004), targeting a fuel consumption of 6.9 liter/100km by 2015,
which translates to an estimated 167 g/km of CO2 emissions. The standards were initially outlined
in two phases with different national standards for the fuel consumption of passenger cars. The
national standard limits are set for 16 categories of curb weight, which is the weight of a vehicle
including all kinds of filled liquids (such as gasoline and lubricant oil), interior decorations, and
spare tire but without any passengers or goods; and also differentiate between manual transmission
and automatic transmission.
The first phase of the fuel economy standards began in July 2005 for new vehicle
production, and a year later for existing vehicle production. The second phase began in January
2008 for new vehicle production, and full segment production compliance was implemented in
2009. The cars initially included in the fuel economy standard were passenger cars, SUVs, and
light commercial vehicles (LCVs). These vehicles are collectively defined as M1-type vehicles
by the European Union, and are defined in the Chinese standard as vehicles with a minimum speed
of 50 km/h and a maximum weight of 3500 kg.
The third phase of the passenger vehicle fuel economy standard includes a Corporate
Average Fuel Consumption (CAFC) target (GB 27999-2011), which went into effect in 2012 and
is intended to bind in 2015. Together with the passenger car fuel limits standard (GB 19678-2004),
the CAFC is designed to realize an ambitious average fuel consumption target of 6.9 liter/100km
by 2015. The fourth phase, which recently went into effect, provides gradual implementation
guidelines towards a CAFC target of 5.0 liter/100km which is intended to bind in 2020.
A firm’s CAFC is calculated by plugging in data on the firm’s vehicle model, year, and
annual sales into the following sales-weighted average for fuel consumption based on the New
European Driving Cycle (NEDC):
(1) i i
i
ii
FC VCAFC
V
,
where iFC is the fuel consumption of model i and iV is the annual sales of model i.
The CAFC target CAFCT for each firm is based on the following sales weighted average of
individual vehicle fuel consumption targets:

6
(2) i i
iCAFC
ii
T VT
V
,
where iT is the fuel consumption target of model i and iV is the annual sales of model i.
In calculating the sales-weighted averages for the CAFC standard, the government uses
higher weights for alternative fuel vehicles to encourage their production. Until 2015, a multiplier
of five, five, five, and three times the quantity sales was used for pure-electric, fuel-cell electric,
plug-in hybrid, and energy saving vehicles, respectively. The weights are to gradually decrease
thereafter (Innovation Center for Energy and Transportation 2015). Table 1 presents the
multipliers imposed on the annual sales/imports of alternative fuel vehicles in the CAFC
calculation. One possible explanation why the multipliers for alternative fuel vehicles are to
decline over time is that is that the government may be expecting an increase in the overall market
share of alternative vehicles due to the policy encouragement in the first few years. With more
and more market penetration of alternative vehicles, there may be less need for such generous
policy encouragement, which may be why the government has specified a smaller multiplier in the
future.
The national standard (GB 27999) target implementation status is indicated by CAFC
CAFC
T.
The CAFC requirement was enacted in 2012 and allows automobile manufacturers until 2015 to
gradually reduce the fuel consumption levels (3% each year), towards the CAFC binding period
starting in 2015 (100% compliance).
In addition to fuel economy standards, in 2010 the Chinese government established a
project called “energy saving projects”, which uses a fiscal subsidy to encourage energy saving.
Under this policy, Chinese automobile firms receive a subsidy for producing vehicles with engine
displacement less than 1.6 liter.4
VEHICLE MARKETS AND POLICY IN CHINA
In this section, we review the literature on vehicle markets and policy in China. Huo et al.
(2007) develop a methodology to project growth trends of the motor vehicle population and
associated oil demand and carbon dioxide emissions in China through 2050. In particular, the
numbers of highway vehicles, motorcycles, and rural vehicles are projected under three scenarios

7
of vehicle growth by following different patterns of motor vehicle growth in Europe and Asia.
Projections show that by 2030 China could have more highway vehicles than the United States has
today.
According to many forecasts, including those from the Chinese government, ExxonMobil,
the International Energy Agency, the U.S. Energy Information Administration, and Argonne
National Laboratory, China’s vehicle population is forecasted to grow 6-11% per year into the
foreseeable future (Wang, Teter and Sperling 2011). Barring aggressive policy intervention or a
collapse of the Chinese economy, Wang, Teter and Sperling (2011) suggest that those forecasts
are conservative. They analyze the historical vehicle growth patterns of seven of the largest vehicle
producing countries at comparable times in their motorization history. They estimate vehicle
growth rates for this analogous group of countries to be 13-17% per year, roughly twice the annual
rate forecasted for China by others. Applying these higher growth rates to China results in the total
vehicle fleet reaching considerably higher volumes, implying far higher global oil use and carbon
emissions, than forecasted by the International Energy Agency and others.
Lin and Zeng (2013) estimate the price and income elasticities of demand for gasoline in
China. Their estimates of the intermediate-run price elasticity of gasoline demand range between
-0.497 and -0.196, and their estimates of the intermediate-run income elasticity of gasoline demand
range between 1.01 and 1.05. They also extend previous studies to estimate the vehicle miles
traveled (VMT) elasticity and obtain a range from -0.882 to -0.579.
Lin and Zeng (2014) calculate the optimal gasoline tax for China using a model developed
by Parry and Small. They calculate the optimal adjusted Pigovian tax in China to be $1.58 /gallon
which is 2.65 times more than the current level. Of the externalities incorporated in this Pigovian
tax, the congestion costs are taxed the most heavily, at $0.82/gallon, followed by local air pollution,
accident externalities, and finally global climate change.
Hu, Xiao and Zhou (2014) apply a non-nested hypothesis test methodology to data on
Chinese passenger vehicles to identify whether price collusion exists within corporate groups or
across groups. Their empirical results support the assumption of Bertrand Nash competition in the
Chinese passenger-vehicle industry. No evidence for within or cross-group price collusion is
found.
Xiao and Ju (2014) explore the effects of consumption-tax and fuel-tax adjustments in the
Chinese automobile industry. In particular, they conduct a comparative static analysis of

8
equilibrium prices and sales, fuel consumption, and social welfare before and after tax adjustments.
Their empirical findings suggest that the fuel tax is effective in decreasing fuel consumption at the
expense of social welfare, while the consumption tax does not significantly affect either fuel
consumption or social welfare.
Li, Xiao and Liu (2015) document the evolution of automobile prices in China and
investigate the sources of price decline, paying attention to both market structure and cost factors.
They estimate a market equilibrium model with differentiated multiproduct oligopoly using
market-level sales data in China together with information from household surveys. Their
counterfactual simulations show that (quality-adjusted) vehicle prices have dropped by 33% from
2004 to 2009. The decrease in markup from intensified competition accounts for about one third
of this change and the rest comes from cost reductions through learning by doing and other
channels.
Liu and Lin Lawell (2019) examine the effects of public transportation and the built
environment on the number of civilian vehicles in China. They use a two-step GMM instrumental
variables model and apply it to city-level panel data over the period 2001 to 2011. The results
show that increasing the road area increases the number of civilian vehicles. In contrast, increasing
the public transit passenger load decreases the number of civilian vehicles. However, the effects
vary by city population. For larger cities, increases in the number of public buses increase the
number of civilian vehicles, but increases in the number of taxis and in road area decrease the
number of civilian vehicles. They also find that land use diversity increases the number of civilian
vehicles, especially in the higher income cities and in the extremely big cities. Finally, they find
no significant relationship between civilian vehicles and per capita disposable income except in
mega cities.
Both market-based and non-market based mechanisms are being implemented in China’s
major cities to distribute limited vehicle licenses as a measure to combat worsening traffic
congestion and air pollution. While Beijing employs non-transferable lotteries, Shanghai uses an
auction system. Li (2018) empirically quantifies the welfare consequences of the two mechanisms
by taking into account both allocation efficiency and automobile externalities post-allocation. His
analysis shows that different allocation mechanisms lead to dramatic differences in social welfare.
Although the lottery system in Beijing has a large advantage in reducing externalities from
automobile use than a uniform price auction, the advantage is offset by the significant welfare loss

9
from misallocation. As a consequence, the lottery system resulted in a deadweight loss of nearly
36 billion yuan (or $6 billion) in Beijing in 2012 alone. A uniform-price auction would have
generated 21.6 billion yuan to Beijing municipal government, more than covering all the subsidies
to the local public transit system.
Sun et al. (2018) analyze the sales impacts of a nationwide consumer boycott of Japanese
brands in China in 2012 that was triggered by a territorial dispute and heavily influenced by
historical animosity between citizens of the two countries on automobile brands from different
countries-of-origin using detailed monthly automobile sales data by vintage-model from 2008 to
2013. Their results show that the boycott led to: (1) dramatically reduced market share of Japanese
brands, both luxury and non-luxury; (2) increased sales of Chinese brands; (3) heterogeneous
impacts on brands from other countries and among consumers with different demographic
characteristics, media exposure, and historical relationships with Japan; and (4) ongoing
significant impacts one year after the boycott began.
While China has made great strides in transforming its centrally-planned economy to a
market-oriented economy, there still exist widespread interregional trade barriers, such as policies
and practices that protect local firms against competition from non-local firms. Barwick, Gao and
Li (2017) document the presence of local protectionism and quantify its impacts on market
competition and social welfare in the context of China's automobile market, the largest automobile
market in the world. They show that joint ventures and especially state-owned enterprises
command much higher market shares in their headquarter province than at the national level, and
that local protectionism such as subsidies of local brands is the leading contributing factor.
According to their results, local protectionism leads to significant consumer welfare loss arising
from choice distortions (Barwick, Gao and Li 2017).
Chen and Lin Lawell (2019b) develop and estimate a structural econometric model to
estimate demand and cost parameters for all vehicles in China. Their structural econometric model
of a mixed oligopolistic differentiated products market allows different consumers to vary in how
much they like different car characteristics on the demand side and that allows state-owned
automobile companies to have different objectives than private automobile companies on the
supply side.
One unique feature of Chinese automobile industry is that a number of domestic car
companies form joint ventures with international car companies. Chen and Lin Lawell (2019b)

10
show that forming joint ventures with car companies in the US and Japan are associated with
decreases in the marginal cost of technology-related vehicle characteristics on net. In contrast,
forming joint ventures with international car companies from other countries is associated with a
higher marginal cost of technology-related car characteristics on net.
In comparing international joint ventures with car companies in US and Japan, Chen and
Lin Lawell (2019b) find that for fuel efficiency, the net correlations appear more negative for
Japanese firms than for US firms, which suggests that joint ventures with Japanese firms may be
associated with more of a decrease in the marginal costs of fuel efficiency than joint ventures with
US firms are. For horsepower, the opposite appears to be the case: in general, with the exception
of Honda, the net correlations appear more negative for US firms than for Japanese firms, which
suggests that joint ventures with US firms may be associated with more of a decrease in the
marginal costs of horsepower than joint ventures with Japanese firms are. These results may reflect
a possible relative preference for horsepower in the US, and a possible relative preference for fuel
efficiency in Japan (Chen and Lin Lawell 2019b).
In terms of government policy, Chen and Lin Lawell (2019a) find that China’s Corporate
Average Fuel Consumption (CAFC) standard is inefficient, in part because the CAFC standard
does not require that each vehicle model achieve a minimum fuel efficiency target, but instead
allows firms to average across all the vehicle models that they produce; in part because not all
firms meet the CAFC standard; and in part because there is already a fuel economy standard in
place. The alternative vehicle market share, consumer surplus, private firm profits, and state-
owned firm utility would all increase if the CAFC standard were removed and the target under
China’s fuel economy standard were raised instead (Chen and Lin Lawell 2019a).
DATA
We have collected and constructed a comprehensive annual data set of all the car models
marketed from the year 2004 to year 2013 in the Chinese automobile industry. Since some models
have different engine displacements, we further delineate cars by “model displacement”, which
we define as a combination of a model with a specific engine displacement. For example, the
Toyota Camry model comes in displacements of 1.6 liter and 1.8 liter, which we categorize as two
different model displacements. The data set we have collected and constructed includes the price

11
and quantity sales of each model displacement. Furthermore, for each model displacement, we
also gathered information on vehicles characteristics for each style within that model displacement.
The quantity sales data from year 2004 to year 2013 of each model displacement was
collected from the China Auto Market Almanac, which includes the quantity sales of all vehicles
sold by car manufactures in China, both indigenous firms and joint ventures.
We have collected two sets of price data, both in units of 10,000 yuan. We obtained data
on prices for each model displacement from the China Automotive Industry Yearbook. Since there
are different styles for each model displacement, we also obtained data on prices for each style of
each model displacement from www.autohome.com.cn, which is one of the largest vehicle websites
in China. The price is listed as nominal manufacturer's suggested retail price (MSRP).
We obtain information about vehicle characteristics for each style for each vehicle model
displacement from www.autohome.com.cn. For each style of a certain vehicle model displacement,
its characteristics could be divided into the following 10 categories:
(1) Basic information: the year when such vehicle was produced; vehicle manufacturer;
and vehicle type (e.g., sedan, SUV, MPV, pick-up, or sports car);
(2) Information about vehicle engines: cylinder layout types and number of cylinders;
(3) Information about powertrain: top speed (km/h); acceleration from 0 to 100km/h (in
seconds); horsepower (in units of Pferdestärke (PS), which is the German term for metric
horsepower); transmission type; number of transmission speeds; drivetrain; type of four-wheel
drive; and type of power steering;
(4) Information about fuel: dummy variable for which type of fuel the vehicle is powered
on; fuel efficiency (100km/liter), which is the reciprocal of energy intensity (liter/100km); engine
displacement (in ml and liter); air intake system; and turbo boost;
(5) Dimensions: length, width, height, wheelbase, number of doors, and passenger
capacity (number of seats);
(6) Safety equipment: frontal driver air bag, side airbag, anti-lock braking system (ABS),
front radar, rear radar, back-up camera, remote control key, remote keyless ignition, and remote
keyless entry;
(7) Exterior features: electronic sunroof and panorama sunroof;
(8) Interior features: heated front seats; heated rear seats, ventilated front seats, ventilated
rear seats, global positioning system (GPS), bluetooth interface, built-in TV, and air conditioner;

12
(9) Advanced technologies: park assist and side assist;
(10) For alternative fuel vehicles for which electricity is one of the power sources, there is
also information about the electric engine: total power of electric engine (kilowatt); the torque of
the electric engine (Newton-metre);5 and the charge-depleting range (km).
One unique feature of the Chinese automobile industry is that some of the car
manufacturers are state-owned. Among the 64 car makers in our sample, 49 of them are state-
owned. Since the majority of car companies in China are operated under shareholding system,
there are few car companies that are 100% state owned. However, governments do hold a majority
of the stocks of some of the companies. We define a stated-owned firm as a car manufacturer for
which a majority of stock of its parent company (greater than 50%) is held by governments (either
central government or local government), although some of its stock might be held by foreign
companies, including those with which the firm forms an international joint venture. Information
about the ownership of the car companies are inferred from baike.baidu.com and from China
Industry Business Performance Data (2004-2013).
CHARACTERISTICS OF VEHICLES IN THE CHINESE AUTOMOBILE
INDUSTRY
Our comprehensive annual data set of all the vehicle models marketed from the year 2004
to year 2013 in the Chinese automobile industry includes 6,821 vehicle models, of which 28
vehicle models are powered by alternative fuel sources. These alternative fuel vehicles include
hybrid cars powered on both gasoline and electricity, purely electric cars, plug-in hybrid cars, and
extended range electric vehicles. Of the 28 alternative vehicle models, 21 were produced after
2010.
Table 2 presents summary statistics of the vehicle characteristics of all the car models
marketed from the year 2004 to year 2013 in the Chinese automobile industry for the
characteristics that are continuous variables. The price for the vehicles varies from as low as
26,800 yuan to as high as 899,500 yuan. The number of cylinder has an average value around four,
and ranges from three to eight. The highest maximum speed of all the vehicles in the data set is
265 km/h. The average time for official acceleration from zero to 100km/h is around 11.63 seconds,
and it can be as short as five seconds. The peak horsepower varies from 16 to 350 PS, with a mean

13
of 38.94 PS. On average there are about five transmission speeds but some vehicles have as many
as nine speeds.
The official fuel intensity averages at 7.88 liter/100km (i.e. in order to travel 100km, the
car needs 7.88 liter of gasoline). The official fuel intensity varies a lot across different vehicles,
from 4.3 to 13.3 liter/100km. Another characteristic to measure energy efficiency is engine
displacement. The mean engine displacement is 1.8 liter, but some cars could have an engine
displacement of as high as 4.7 liter.
Vehicles are on average 4.456 meters long, 1.756 meters wide, and 1.533 meters high, with
a wheelbase of 2.630 meters and a curb weight of 1347 kg. Of the vehicle model-years in our data
set, 67.8% are manufactured by firms that are at least partially state-owned.
For alternative vehicles, the electric engine has a mean total power of 49.096 kilowatt and
a mean torque of 196.625 Newton-meter, and a mean charge-depleting range of 136.7 km.
Figures 3 and 4 present histograms of the vehicle characteristics of all the car models
marketed from the year 2004 to year 2013 in the Chinese automobile industry for the
characteristics that are categorical variables and dummy variables, respectively. For model style
(Figure 3a), the majority of the cars are compact cars, followed by small cars and medium cars.
Within SUVs, the top two best sellers are small SUVs and medium-large SUVs. Small SUVs
account for around one quarter of the small car models.
In terms of body style (Figure 3b), most of the vehicle model-years, over 3,000 have a
three-box design (e.g., a sedan). The number of vehicle model-years that have a two-box design
(e.g., a hatchback) is less than one half of the number of vehicle model-years that have a three-box
design, followed by SUVs and MPVs.
In our dataset, there are five different types of transmission (Figure 3c), of which manual
transmission constitutes the majority and automatic transmission ranks second, with a few vehicle
models having dual-clutch transmission, automated manual transmission, and continuously
variable transmission. In terms of drivetrain (Figure 3d), most of the cars are front engine front
drive. The amount is just below 6,000. The other two types that make up the rest are front engine
rear drive and front engine four-wheel drive.
For power steering (Figure 3e), over 4,000 vehicle model-years use hydraulic power
steering, followed by less than 2,000 using electric power steering. The third most common type
is electric hydraulic and only a few are mechanical power steering.

14
For fuel type (Figure 3f), conventional cars (i.e. those cars powered by gasoline) make up
the majority of the vehicle models in China over the years 2004-2013.
For the number of doors (Figure 3g), the majority of the model-years have either four doors
or five doors, with a few having two doors for sports cars. For the number of seats (Figure 3h),
which measures car capacity, almost all of the cars have five seats, with a few with seven seats
and an even smaller number with four seats. As for whether the cars are equipped with an air
conditioner (Figure 3i), more than half of the model-years in China over the period 2004-2013
have manual air conditioners and around half have the option to set automatic conditioners.
For cylinder layout (Figure 3j), in-line and V-type represent the major two types of cylinder
layout, with in-line being the most common. For vehicle models that are four-wheel drive (Figure
3k), the majority are front engine rear drive, the amount being over 150, followed by front engine
four-wheel drive, and then front engine front drive. For the air intake system (Figure 3l), almost
all of the model-years use naturally aspirated air intake system and a few use turbo boost systems.
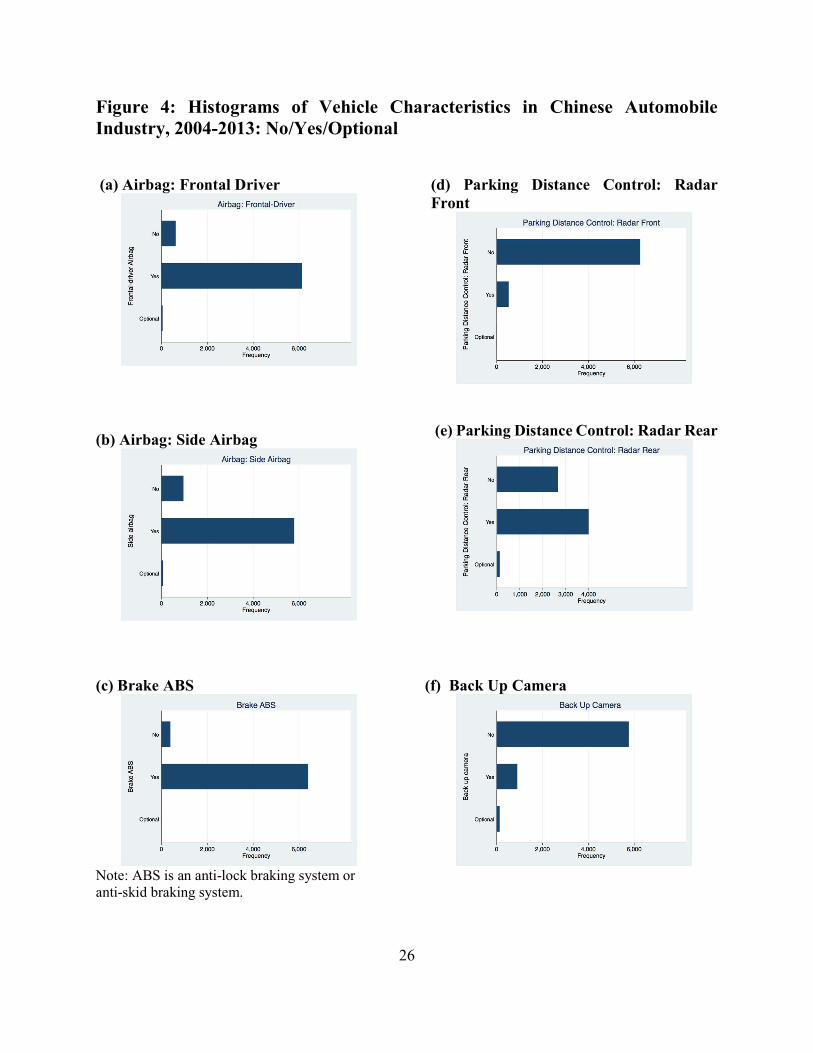
Figure 4 shows the histograms of vehicle characteristics which are discrete variables with
values “Yes”, “No” and “Optional”. The value of “Optional” means that the feature could be added
to the car but needs to pay extra.
We start with the description of safety features. Most of the cars are equipped with frontal
driver airbag (Figure 4a) and side airbag (Figure 4b), however, there are still around 600 cars do
not have frontal driver airbag and 960 cars don’t have side airbag. The majority of the cars are set
with anti-lock braking system (Figure 4c), the amount being 6400, nevertheless, around 400 do
not have anti-lock braking system. Almost all of the cars do not have the front radar for parking
distance control (Figure 4c), however, around 60% of the cars in our dataset are equipped with
rear radar for parking distance control (Figure 4d). There are fewer vehicle model-years with a
back up camera (Figure 4f), around 900.
The majority of the cars have a remote control key (Figure 4g). However, only 1,000 have
the feature of remote keyless ignition (Figure 4h). The number of model-years that have remote
keyless entry (Figure 4i) is even smaller, only 650. Regarding the exterior features, around 3300
are equipped with electronic sunroof (Figure 4j), but those equipped with panoramic sunroof are
very rare (Figure 4k). In terms of interior features, only 1100 cars have the feature of heated front
seats (Figure 4l), even fewer have heated rear seat (Figure 4m), about 180. Few have ventilated
front seats (Figure 4n) or ventilated rear sears (Figure 4o).
15
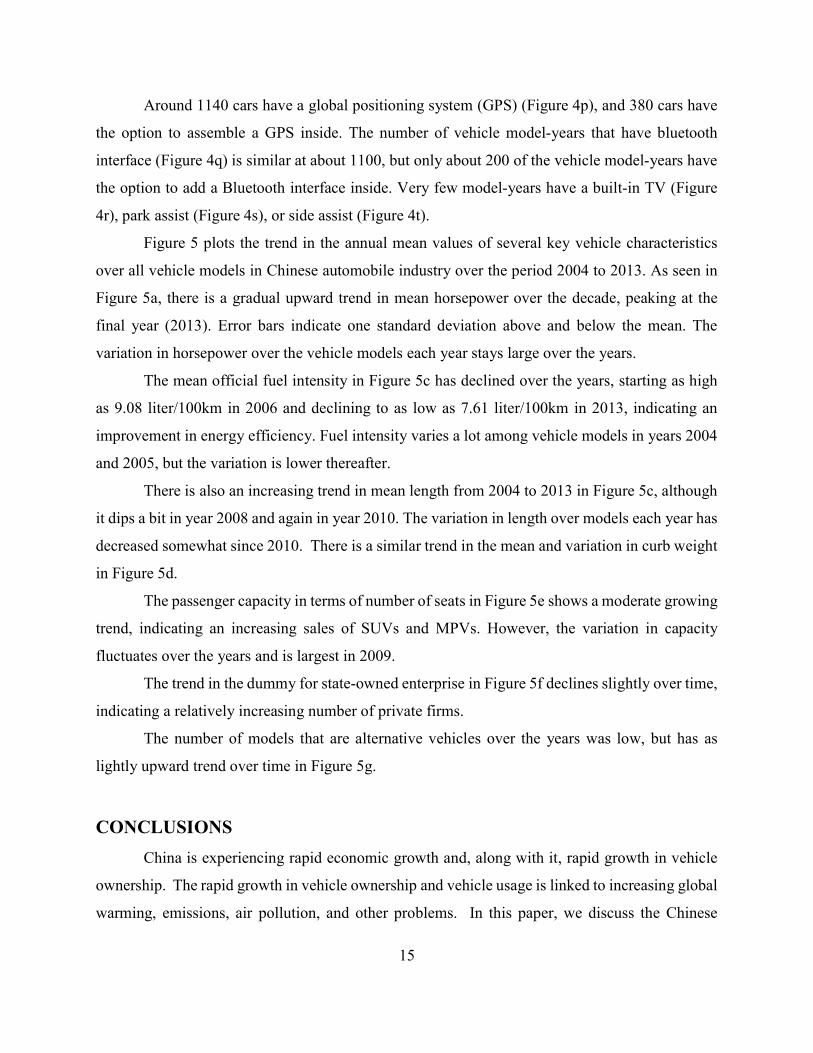
Around 1140 cars have a global positioning system (GPS) (Figure 4p), and 380 cars have
the option to assemble a GPS inside. The number of vehicle model-years that have bluetooth
interface (Figure 4q) is similar at about 1100, but only about 200 of the vehicle model-years have
the option to add a Bluetooth interface inside. Very few model-years have a built-in TV (Figure
4r), park assist (Figure 4s), or side assist (Figure 4t).
Figure 5 plots the trend in the annual mean values of several key vehicle characteristics
over all vehicle models in Chinese automobile industry over the period 2004 to 2013. As seen in
Figure 5a, there is a gradual upward trend in mean horsepower over the decade, peaking at the
final year (2013). Error bars indicate one standard deviation above and below the mean. The
variation in horsepower over the vehicle models each year stays large over the years.
The mean official fuel intensity in Figure 5c has declined over the years, starting as high
as 9.08 liter/100km in 2006 and declining to as low as 7.61 liter/100km in 2013, indicating an
improvement in energy efficiency. Fuel intensity varies a lot among vehicle models in years 2004
and 2005, but the variation is lower thereafter.
There is also an increasing trend in mean length from 2004 to 2013 in Figure 5c, although
it dips a bit in year 2008 and again in year 2010. The variation in length over models each year has
decreased somewhat since 2010. There is a similar trend in the mean and variation in curb weight
in Figure 5d.
The passenger capacity in terms of number of seats in Figure 5e shows a moderate growing
trend, indicating an increasing sales of SUVs and MPVs. However, the variation in capacity
fluctuates over the years and is largest in 2009.
The trend in the dummy for state-owned enterprise in Figure 5f declines slightly over time,
indicating a relatively increasing number of private firms.
The number of models that are alternative vehicles over the years was low, but has as
lightly upward trend over time in Figure 5g.
CONCLUSIONS
China is experiencing rapid economic growth and, along with it, rapid growth in vehicle
ownership. The rapid growth in vehicle ownership and vehicle usage is linked to increasing global
warming, emissions, air pollution, and other problems. In this paper, we discuss the Chinese

16
automobile industry and government policy, and review the literature on vehicle markets and
policy in China. Using a comprehensive annual data set we have collected and constructed of all
the car models marketed from the year 2004 to year 2013 in the Chinese automobile industry, we
then discuss and describe the characteristics of vehicles in the Chinese automobile industry.
One unique feature of Chinese automobile industry is that a number of domestic car
companies form joint ventures with international car companies. Joint ventures with international
car companies account for two thirds of the passenger vehicle market, with the rest mostly taken
up by indigenous brands (Li, Xiao and Liu 2015). We find that the fraction of vehicle models
produced by state-owned firms has declined slightly over time over the period 2004 to 2013,
indicating a relatively increasing number of private firms.
China has implemented fuel economy standards and a Corporate Average Fuel
Consumption (CAFC) target. Likely owing at least in part to these standards, there has been a
decline in mean official fuel intensity in vehicle models in the Chinese automobile industry over
the period 2004 to 2013, indicating an improvement in energy efficiency.
Our comprehensive annual data set of all the vehicle models marketed from the year 2004
to year 2013 in the Chinese automobile industry includes 6,821 vehicle models, of which 28
vehicle models are powered by alternative fuel sources. These alternative fuel vehicles include
hybrid cars powered on both gasoline and electricity, purely electric cars, plug-in hybrid cars, and
extended range electric vehicles. Of the 28 alternative vehicle models, 21 were produced after
2010. Although the number of models that are alternative vehicles is low, it has a slight upward
trend over time, perhaps owing in part to China’s fuel economy standards and a Corporate Average
Fuel Consumption (CAFC) target.
Over the period 2004 to 2013, there has been an increasing trend in mean horsepower,
mean length, mean curb weight, and mean number of seats in vehicle models in the Chinese
automobile industry.
The detailed information, description, research, and data presented in this paper have
important implications for those in industry, government, society, academia, and NGOs interested
in the Chinese automobile market, the automobile industry, and transportation policy.

17
Biography of the Authors Yuan Chen
Yuan Chen is an Assistant Professor at the Shanghai University of International Business and Economics; a Faculty Associate at the Cornell University Think-tank for Resources, Energy, and the Environment: Science and Policy-related Economic Analysis and Research (TREESPEAR); and a Faculty Associate at Dynamics, Economics, Econometrics, Policy, and Games: Rigorous Environmental, Energy, Natural Resource, Agriculture, and Development Analysis and Research (DEEP-GREEN-RADAR) at Cornell University. She received her Ph.D. in Transportation Technology and Policy from the University of California at Davis. Professor Chen has received numerous prestigious awards for her research, including the Best Paper Award at the Transportation Research Forum 2017 Annual Conference; the National Center for Sustainable Transportation Dissertation Grant; the Nissan Corporate Affiliate Fellowship; the UC-Davis Transportation Technology and Policy Fellowship; and the Shell Corporate Affiliate Fellowship. In addition to the Transportation Research Forum Annual Conference, Professor Chen has also presented her research at the U.S. Association for Energy Economics North American Conference; the Interdisciplinary Ph.D. Workshop in Sustainable Development at Columbia University; the Southern Economic Association Annual Conference; the Asian Meeting of the Econometric Society; the China Meeting of the Econometric Society; and the South Lake Innovation Forum for International Young Talents at Huazhong Agricultural University. C.-Y. Cynthia Lin Lawell
C.-Y. Cynthia Lin Lawell is an Associate Professor and the Robert Dyson Sesquicentennial Chair in Environmental, Energy and Resource Economics in the Charles H. Dyson School of Applied Economics and Management at Cornell University. Professor Lin Lawell has received numerous awards for her research, including the International Society for New Institutional Economics Award for the Best Ph.D. Dissertation; the Harvard University Stone Fellow Award for Best Paper Written by a Doctoral Student in Environmental and Resource Policy; the Hellman Fellowship; and Honorable Mention in the 2015-2016 Bacon Public Lectureship and White Paper Competition. She was a 2017 Cornell University Knowledge Matters Fellow. Her research has been featured in such media outlets as the New York Times, the Washington Post, the Guardian, Platt’s blog, and Bloomberg View. Professor Lin Lawell received her bachelor's degree, summa cum laude, in Environmental Science and Public Policy from Harvard College in 2000 and her Ph.D. in Economics from Harvard University in 2006.
Yunshi Wang
Yunshi Wang is the director of the China Center for Energy and Transportation of the UC-Davis Institute of Transportation Studies, and the co-director of the China–U.S. ZEV Policy Lab. He worked as a research fellow at the MIT Sloan School of Management, conducting research on the Chinese economy with Dean Emeritus and Professor Lester Thurow. As an energy economist, he has worked with the World Bank on China-related energy projects and energy demand projection, as well as with the Japanese government in Asia, Africa, and Latin America. He also worked as a researcher at the United Nations Development Program. He received a master's degree in International Development from the American University, and a master’s degree in English from Boston University. He earned his bachelor's degree from Shanghai Maritime University in English and Shipping Law and Business.

18
Endnotes
1 Chen: Shanghai University of International Business and Economics; [email protected]. Lin Lawell: Cornell University; [email protected]. Wang: University of California at Davis; [email protected]. We are indebted to Erich Muehlegger and Jim Wilen for their mentorship, support, and encouragement throughout this project. We thank Erich Muehlegger, Jim Wilen, Michael Babcock, Jim Bushnell, Michael Canes, Aureo de Paula, Yueyue Fan, Lew Fulton, Hamed Ghoddusi, Wuyang Hu, Khaled Kheiravar, Christina Korting, Shanjun Li, Patrick McCarthy, Joan Ogden, Avralt-Od Purevjev, Yueming (Lucy) Qiu, Irvin Rojas, Stephen Ryan, John Rust, Jim Sallee, Louis Sears, Ashish Sen, Brian Shin, Dan Sperling, James Sweeney, Arthur van Benthem, Jeremy Weber, C.K. Woo, Junji Xiao, Jianwei Xing, Xiaohua Yu, Saleh Zakerinia, and Junjie Zhang for helpful comments and discussions. We also benefited from comments from seminar participants at UC-Davis Sustainable Transportation Energy Pathways research seminars; and conference participants at the Transportation Research Forum Annual Conference. We are grateful to Xinbiao Gu for helping us collect the data. We received financial support from a National Center for Sustainable Transportation Dissertation Grant, a Nissan ITS-Davis Corporate Affiliate Fellowship, the China Center for Energy and Transportation of the UC-Davis Institute of Transportation Studies, an ITS-Davis Travel Grant, a UC-Davis Graduate Student Travel Award, an Agricultural and Applied Economics Association Travel Grant, a U.S. Association for Energy Economics Conference Registration Fee Scholarship, a UC-Davis Transportation Technology and Policy Fellowship, and a Shell ITS-Davis Corporate Affiliate Fellowship. All errors are our own.
2 These statistics were calculated using GDP data from the National Bureau of Statistics of China (2002-2010) and automobile industry gross product data from Chinese Automobile Industry Yearbook (China Automotive Technology and Research Center, 2002-2013). 3 According to “Chinese Automobile Industry Development Policy, 2009 edited edition”: http://www.china.com.cn/policy/txt/2009-08/31/content_18430768_5.htm 4 Announcement published by the Ministry of Finance of the People’s Republic of China. http://jjs.mof.gov.cn/zhengwuxinxi/zhengcefagui/201006/t20100601_320724.html 5 Torque is a measure of how much a force acting on an object causes that object to rotate. The units used to measure torque are in the form of force times distance. The metric unit for torque is the newton-metre (N∙m). In English units, torque is measured in pound-foot (lb-ft) or pound-inch (lb-in).

19
References Barwick, P.J., S. Cao, and S. Li. “Local Protectionism, Market Structure, and Social Welfare: China's
Automobile Market.” NBER Working Paper No. w23678, 2017. Chen, Y. and C.-Y.C. Lin Lawell. “Fuel Efficiency Policies in the Chinese Automobile Market: Evidence
from A Random Coefficients Mixed Oligopolistic Differentiated Products Model.” Working paper, Cornell University, 2019a.
Chen, Y. and C.-Y.C. Lin Lawell. “Supply and Demand in the Chinese Automobile Market: A Random Coefficients Mixed Oligopolistic Differentiated Products Model.” Working paper, Cornell University, 2019b. URL: http://clinlawell.dyson.cornell.edu/China_auto_mkt_supply_demand_paper.pdf
China Auto Market Almanac, 2004-2013. China Automobile Industry Year Book, 2004-2013. China Automotive Technology and Research Center. China Automobile Industry Yearbook, 2002-2013. China Industry Business Performance Data, 2004-2013. China Statistical Yearbook, 1990-2011. Darido, G., M. Torres-Montoya, and S. Mehndiratta. “Urban Transport and CO2 Emissions: Some
Evidence from Chinese Cities.” Wiley Interdisciplinary Review: Energy and Environment 3 (2), (2014): 122-155.
Hu, W.-M., J. Xiao, and X. Zhou. “Collusion or Competition? Interfirm Relationships in the Chinese Auto Industry.” Journal of Industrial Economics 62 (1), (2014): 1-40.
Huo, H., M. Wang, L. Johnson, and D. He. “Projection of Chinese Motor Vehicle Growth, Oil Demand, and C02 Emissions through 2050.” Transportation Research Record 2038, (2007): 69-77.
Innovation Center for Energy and Transportation. 2015 Annual Report of Chinese Passenger Vehicle Fuel Consumption, 2015.
Li, S. “Better Lucky than Rich?: Welfare Analysis of Automobile License Allocations in Beijing and Shanghai.” Review of Economic Studies 85 (4), (2018): 2389-2428.
Li, S., J. Xiao, and Y. Liu. “The Price Evolution in China’s Automobile Market.” Journal of Economics & Management Strategy 24 (4), (2015): 786-810.
Lin, C.-Y.C. and J.(J.) Zeng. “The Elasticity of Demand for Gasoline in China.” Energy Policy 59, (2013): 189-97.
Lin, C.-Y.C. and J.(J.) Zeng. “The Optimal Gasoline Tax for China.” Theoretical Economics Letters, 4 (4), (2014): 270-278.
Liu, Q. and C.-Y.C. Lin Lawell. “The Effects of Public Transportation and the Built Environment on the Number of Civilian Vehicles in China.” Working paper, Cornell University, 2019.
O’Kane, S. “New Rules on Making Cars in China Could Help Tesla -- Or Give It Even More To Worry About.” The Verge, 17 April 2018. URL: https://www.theverge.com/2018/4/17/17247412/tesla-model-3-china-import-taxes-tariffs
National Bureau of Statistics of China. (2002-2010). Sun, Q., F. Wu, S. Li, and R. Grewaj. “Boycott and Demand Spillovers Related to Country-of-Origin: The
Automobile Market in China.” Working paper, Cornell University, 2018. Wang, Y., J. Teter, and D. Sperling. “China’s Soaring Vehicle Population: Even Greater than Forecasted?
Energy Policy 39, (2011): 3296-3306. Welitzkin, P. “Rules Eased on Foreign Autos; Sorghum Taxed.” China Daily, 18 April 2018. URL:
http://usa.chinadaily.com.cn/a/201804/18/WS5ad6dc00a3105cdcf6519112.html Xiao, J. and H. Ju. “Market Equilibrium and the Environmental Effects of Tax Adjustments in China’s
Automobile Industry.” Review of Economics and Statistics 96 (2), (2014): 306-317.

20
Figure 1: Market Structure of Chinese Automobile Industry
Notes: Chinese firms that are at least partially state-owned are in bold rectangles. Private Chinese firms are in bold dashed rectangles. International car companies are in rounded rectangles. Lines connecting firms indicate joint ventures between firms. The large boxes around state-owned firms and the international car companies with which they form joint ventures indicate the largest state-owned automobile groups in China.

21
Figure 2: Geographical Location of Chinese Automobile Companies
FAW Group
SAIC Group
Dongfeng Group
Guangdong Auto Group
Beijing Group
Chang‘an Automotive Group
Chery
Geely
BYD

22
Table 1: Multipliers on Alternative Fuel Vehicles in CAFC Calculation
Type of Alternative Fuel Vehicle Year(s) pure-electric fuel-cell electric plug-in hybrid energy saving ~ 2015 5 5 5 3
2016-2017 5 5 5 3.5
2018-2019 3 3 3 2.5
2020 2 2 2 1.5 Note: This table presents the multipliers imposed on the annual sales/imports of alternative fuel vehicles in the CAFC calculation.

23
Table 2: Summary Statistics of Vehicle Characteristics in Chinese Automobile Industry, 2004-2013: Continuous Variables # Obs Mean Std. Dev. Min Max Year 6821 2009.727 2.677 2004 2013 Manufacturer's suggested retail price (MSRP) (10,000 yuan) 6821 14.937 10.946 2.88 89.96 Dummy variable if the model style is imported 6821 0 0 0 0 Minimum price of model style within each model-displacement-year (10,000 yuan) 3608 11.821 8.051 2.68 53.8 Maximum price of model style within each model-displacement-year (10,000 yuan) 3610 18.361 14.713 3.8 89.95 Number of cylinders 6794 4.128 0.539 3 8 Maximum speed (km/h) 5588 182.396 22.857 110 265 Official acceleration 0-100km/h (second) 2598 11.626 2.818 5 35 Peak horsepower (PS) 6802 130.246 38.940 16 350 Maximum power (Kw) 6817 95.754 28.626 12 257 Number of transmission speeds 6815 5.190 1.009 1 9 Official fuel intensity (liture/100km) 3928 7.88 1.35 4.3 13.3 Displacement (ml) 6673 1795.832 449.240 970 4700 Displacement (liter) 6815 1.808 0.456 1 4.7 Length (mm) 6821 4456.209 359.680 3400 6870 Width (mm) 6821 1755.911 78.352 1495 1997 Height (mm) 6821 1533.149 118.915 1325 1937 Wheelbase (mm) 6815 2630.707 158.776 2296 4950 Curb weight (kg) 5898 1346.930 255.769 815 2940 Dummy for state-owned enterprise 6821 0.678 0.4672 0 1 For alternative vehicles for which electricity is one of the power sources: Total power of the electric engine (kilowatt) 26 49.096 37.512 12 105 The torque of the electric engine (Newton-meter) 24 196.625 130.227 60 450 Charge-depleting range (km) 6 136.667 80.416 100 300

24
Figure 3: Histograms of Vehicle Characteristics in Chinese Automobile Industry, 2004-2013: Categorical Variables (a) Model Style
(b) Body Style
(c) Transmission
Notes: MT= Manual Transmission. AT = Automatic Transmission. DCT = Dual-clutch transmission. AMT = Automated Manual Transmission. CVT= Continuously Variable Transmission.
(d) Drivetrain
(e) Power Steering
Notes: MPS= Mechanical Power Steering. HPS = Hydraulic Power Steering. EHPS = Electric Hydraulic Power Steering. EPS = Electric Power Steering.
(f) Fuel type

25
(g) Number of Doors
(h) Number of Seats
(i) Air Conditioner
(j) Cylinder Layout
(k) Four-Wheel Drive
(l) Air Intake System
26
Figure 4: Histograms of Vehicle Characteristics in Chinese Automobile Industry, 2004-2013: No/Yes/Optional (a) Airbag: Frontal Driver
(b) Airbag: Side Airbag
(c) Brake ABS
Note: ABS is an anti-lock braking system or anti-skid braking system.
(d) Parking Distance Control: Radar Front
(e) Parking Distance Control: Radar Rear
(f) Back Up Camera

27
(g) Remote Control Key
(h) Remote Keyless Ignition
(i) Remote Keyless Entry
(j) Electronic Sunroof
(k) Panoramic Sunroof
(l) Heated Front Seats
(m) Heated Rear Seat
(n) Ventilated Front Seats

28
(o) Ventilated Rear Seat
(p) Bluetooth Interface
(q) Built-in TV
(r) Park Assist
(s) Side Assist

29
Figure 5: Annual Trend in Mean Vehicle Characteristics in Chinese Automobile Industry: 2004-2013 (a) Peak horsepower (PS)
Note: Error bars indicate one standard deviation above and below the mean. (b) Official fuel intensity (liter (L) / 100km)
Note: Error bars indicate one standard deviation above and below the mean.
(c) Length (mm)
Note: Error bars indicate one standard deviation above and below the mean. (d) Curb weight (kg)
Note: Error bars indicate one standard deviation above and below the mean.

30
(e) Passenger capacity in terms of number of seats
Note: Error bars indicate one standard deviation above and below the mean. (f) Dummy for state-owned enterprise
Note: Error bars indicate one standard deviation above and below the mean.
(g) Number of alternative vehicles
Note: There are no alternative vehicles in the data set in the years 2004 and 2008.


![s/EK ^hZ W E E/ - PMI Michigan Capital Area · Æ u ] ] µ ] } v 7ls ±)rfxv pruh rq 3urjudp /lih &\foh ,q wkh h[dp li \rx vfruh µwdujhw¶ µderyh wdujhw¶ lq](https://static.fdocuments.in/doc/165x107/605c6dbf2be4391b8f078cfc/sek-hz-w-e-e-pmi-michigan-capital-area-u-v-7ls-rfxv-pruh-rq.jpg)


![Ch 5: ARIMA model · 1.1 Non-Stationary Data [ToC] Dow Jones Index From Aug. 28 to Dec. 18, 1972 l l l l l ll l l l l l l l l l l l l l l l l l l l l l l l l l l l l l l l l l l l](https://static.fdocuments.in/doc/165x107/5ee0213ead6a402d666b5f8b/ch-5-arima-model-11-non-stationary-data-toc-dow-jones-index-from-aug-28-to.jpg)


