Faster, Faster, Faster: The True Story of a Mobile Analytics Data Mart on Hive

© Siemens 2015. All rights reserved.
Siemens Solutions for Data CentersYour Partner for Smart, Efficient, and Sustainable Data Centers

© Siemens 2015. All rights reserved.
• We understand your challenges:
• Maximizing uptime and reliability
• Faster time to market
• Minimizing energy usage and carbon footprint
• Standardized service delivery
• Comprehensive solutions from one key, global supplier
Tailoring our Solutions to Meet Your Needs
© Siemens 2015. All rights reserved.
Green Data Center SolutionsReaching higher levels of efficiency without compromising uptime
© Siemens 2015. All rights reserved.
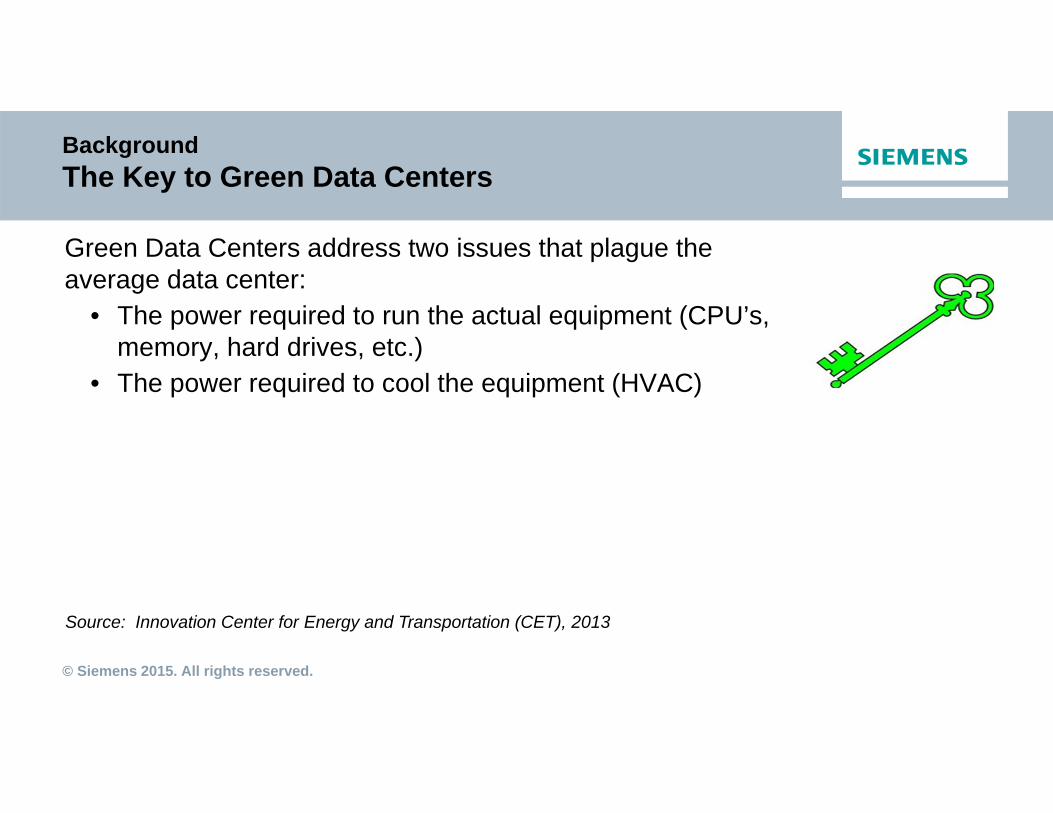
Green Data Centers address two issues that plague the average data center:
• The power required to run the actual equipment (CPU’s, memory, hard drives, etc.)
• The power required to cool the equipment (HVAC)
Background The Key to Green Data Centers
Source: Innovation Center for Energy and Transportation (CET), 2013
© Siemens 2015. All rights reserved.
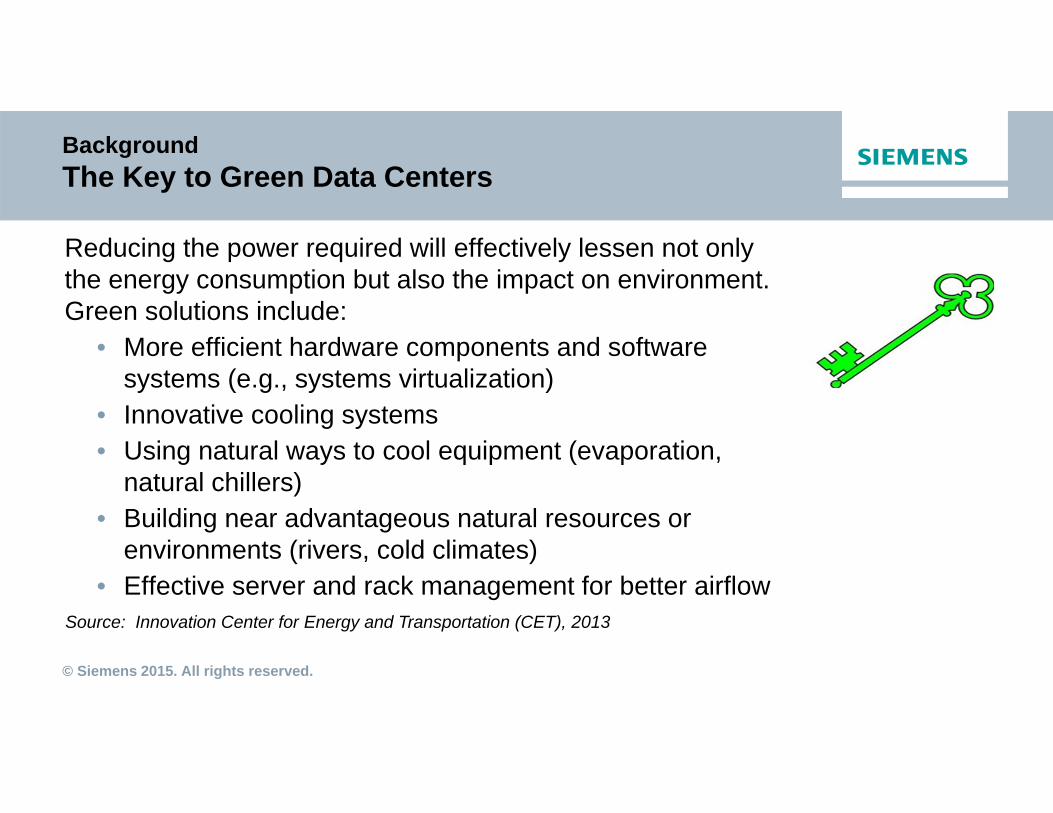
Reducing the power required will effectively lessen not only the energy consumption but also the impact on environment. Green solutions include:
• More efficient hardware components and software systems (e.g., systems virtualization)
• Innovative cooling systems• Using natural ways to cool equipment (evaporation,
natural chillers)• Building near advantageous natural resources or
environments (rivers, cold climates)• Effective server and rack management for better airflow
Background The Key to Green Data Centers
Source: Innovation Center for Energy and Transportation (CET), 2013
© Siemens 2015. All rights reserved.
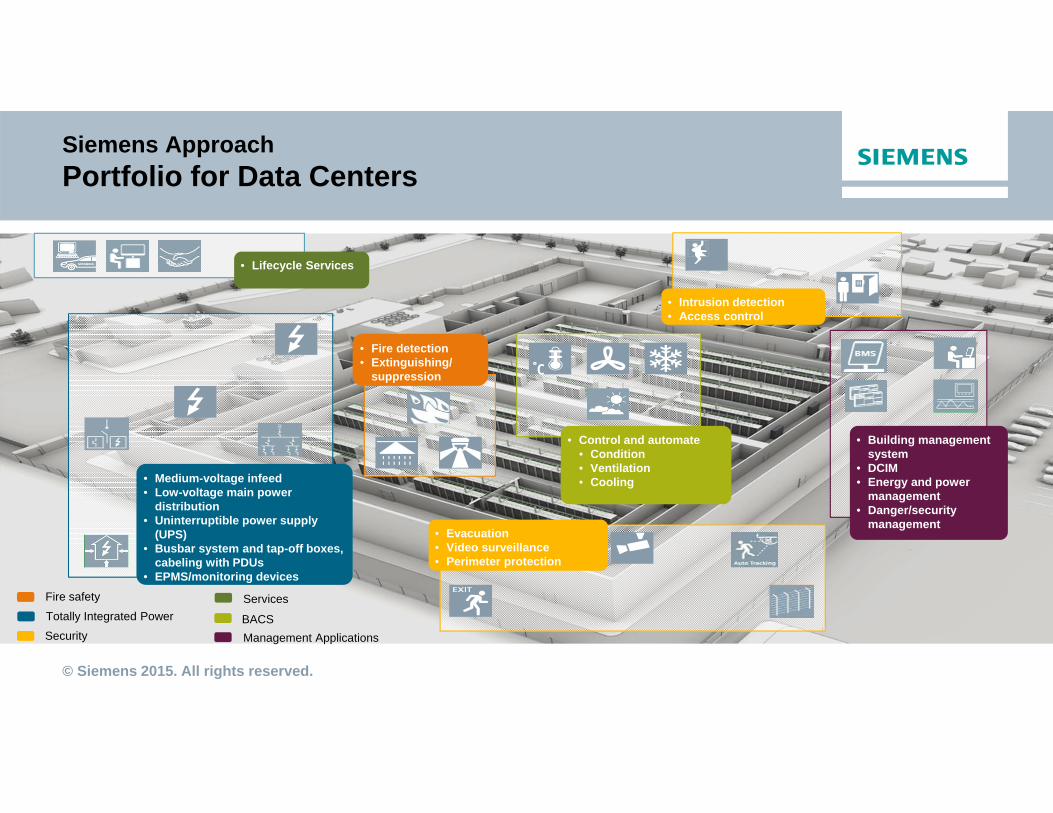
Siemens ApproachPortfolio for Data Centers
• Building managementsystem
• DCIM• Energy and power
management• Danger/security
management
• Fire detection• Extinguishing/
suppression
• Intrusion detection• Access control
• Medium-voltage infeed• Low-voltage main power
distribution• Uninterruptible power supply
(UPS)• Busbar system and tap-off boxes,
cabeling with PDUs• EPMS/monitoring devices
• Evacuation• Video surveillance• Perimeter protection
• Control and automate• Condition • Ventilation• Cooling
C
Fire safety
Totally Integrated Power
SecurityBACSManagement Applications
• Lifecycle Services
Services

© Siemens 2015. All rights reserved.
Siemens ApproachGreen Data Center Solutions
• Our Green Data Center Solution is a comprehensive set of programs geared to improve visibility of energy usage (e.g. PUE), reduce energy cost, and maintain optimal operations over the facility life cycle.
• The Green Data Center Solution approach is: Comprehensive Consistent Proven Scalable

© Siemens 2015. All rights reserved.
Component
PotentialCustomer
Deliverables
CustomerValue
Assessment
Assess:• Regulatory compliance &
safety• Energy efficiency • Current operational baseline
Confirm Design/ Operational Baseline
Assessment Guide
Energy Checklist
PUE Tool
Assessment Report Template
TechnicalSolutions (FIMs)
Monitor/Control:• Enhance & ensure regulatory
compliance• Enhance energy
consumption & efficiency
Metering (fixed)
Demand Flow (CHW)
Control Optimization
CRAC/CRAH (fan VFD retrofit)
New Baseline
InformationManagement
Manage:• Total facility operation with
monitoring, reporting, & data archiving capabilities
Desigo CC
Datacenter Clarity LCTM
WinPM
Service Solutions
Maintain:• Protect investment• Maximize compliance• Maximize energy efficiency
(based on new baseline)
Continuous Optimization
Proven Outcomes
Energy Performance
Fire Detection
Automation
Demand Flow - MBCx
Calibration
Continuous Commissioning
Siemens ApproachGreen Data Center Solutions

© Siemens 2015. All rights reserved.
Energy assessment of a data center is one of the most important steps in a Green Data Center project. It identifies opportunities to optimize energy performance and improve facility and IT operation.
The focus of each energy assessment will include: cooling and ventilation, and electrical issues related to IT equipment.
Siemens ApproachAssessment
© Siemens 2015. All rights reserved.
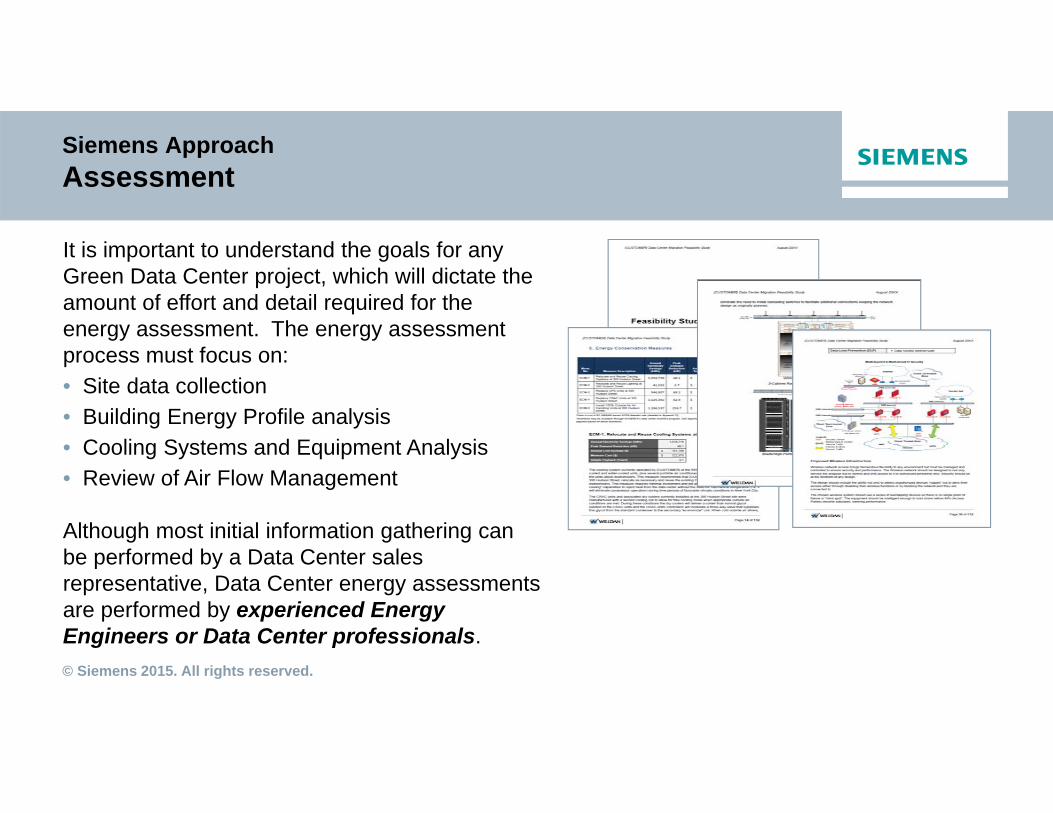
It is important to understand the goals for any Green Data Center project, which will dictate the amount of effort and detail required for the energy assessment. The energy assessment process must focus on: • Site data collection• Building Energy Profile analysis• Cooling Systems and Equipment Analysis• Review of Air Flow Management
Although most initial information gathering can be performed by a Data Center sales representative, Data Center energy assessments are performed by experienced Energy Engineers or Data Center professionals.
Siemens ApproachAssessment

© Siemens 2015. All rights reserved. For internal use only
FIM – CRAC/CRAH (Fan VFD Retrofit)
DescriptionConvert air distribution from CV to VAV• Apply VFD to CRAC/CRAH units• Match air volume to data center cooling load
Potential Savings 20% air volume reduction 49% savings• Fan energy cost reduction• Understand data center cooling performance
A 100 HP fan running at half speed onlyrequires the energy of a 16 HP motor.
Percent fan Speed Percent HP required0% 020% 0.8%30% 2.7%40% 6.4%50% 12.5%60% 21.6%70% 34.3%80% 51.2%90% 72.9%100% 100.0%0%
10%
20%
30%
40%
50%
60%
70%
80%
90%
100%
0% 20% 30% 40% 50% 60% 70% 80% 90% 100%
Perce
nt HP
Requ
ired
Percent Fan Speed
© Siemens 2015. All rights reserved. For internal use only
FIM – Control Optimization FIM
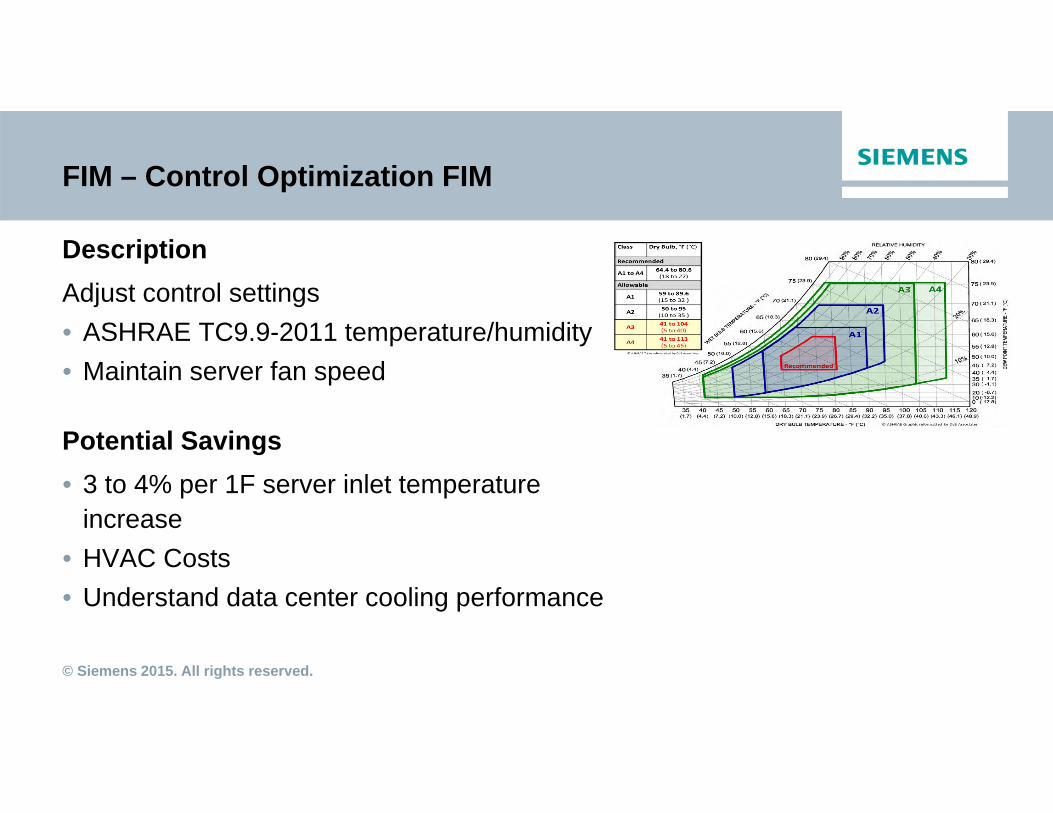
DescriptionAdjust control settings • ASHRAE TC9.9-2011 temperature/humidity• Maintain server fan speed
Potential Savings• 3 to 4% per 1F server inlet temperature
increase• HVAC Costs • Understand data center cooling performance

© Siemens 2015. All rights reserved.
FIM - Energy Metering for PUEPower Usage Effectiveness (PUE)
DescriptionPUE is broken down into 3 levels based on meter location and measurement frequency.
Level 1 Level 2 Level 3
Meter location uninterruptible power supply (UPS) output
Power Distribution Unit (PDU) output
IT equipment input
Measurement interval
Monthly/weekly Daily/hourly Continuous (15 min or less)

© Siemens 2015. All rights reserved. For internal use only
Siemens Approach - Information ManagementWhy Is It Important
One of the biggest challenges in a data center is managing the life cycle of data center equipment in a way that optimizes performance while reducing downtime. There are a lot of moving parts in a data center – servers, power and cooling equipment, fire detection, security & access control, etc.
Thorough assessments are just the first step in a holistic process. Its important to have the proper monitoring tools in place.
• Baselines can be established• Improvements can be identified with established targets• Improvements are then implemented• Before and after analysis is completed with on-going management• Key metrics via high level dashboards is continually monitored to verify operational improvements and watch for
negative variations
Siemens offers comprehensive management tools for this purpose.
Desigo® CC WinPM.NETDatacenter Clarity LC™

© Siemens 2015. All rights reserved.
• Mainly Monitor• Visualization & graphics• Power quality & reliability• Integration capabilities
EPMSPower Distribution
Primary UserFacility Engineer
• Monitor Only• DC asset management• Visualization • Graphics in 4D• Libraries• Workflow
management• Cable management• CFD• Integration capabilities
into ITSM tools
DCIM
Data CenterInfrastructurePrimary UserData Center Operations
Siemens ApproachInformation Management
• Command & Control• Visualization• Graphics & libraries• Automation control• HVAC management• Energy efficiency • Safety & security• Power management• Lighting management• Alarm management• Integration capabilities
BMS/BAS
Facility InfrastructurePrimary User
Facility Manager
• Desigo CC• Apogee Insight• Desigo Insight• Simatic WinCC
• Datacenter Clarity LC
• Sentron powermanager• WinPM.Net
GraphicsMonitor
Integration
© Siemens 2015. All rights reserved.
Siemens Approach – Information ManagementDatacenter Clarity LC™
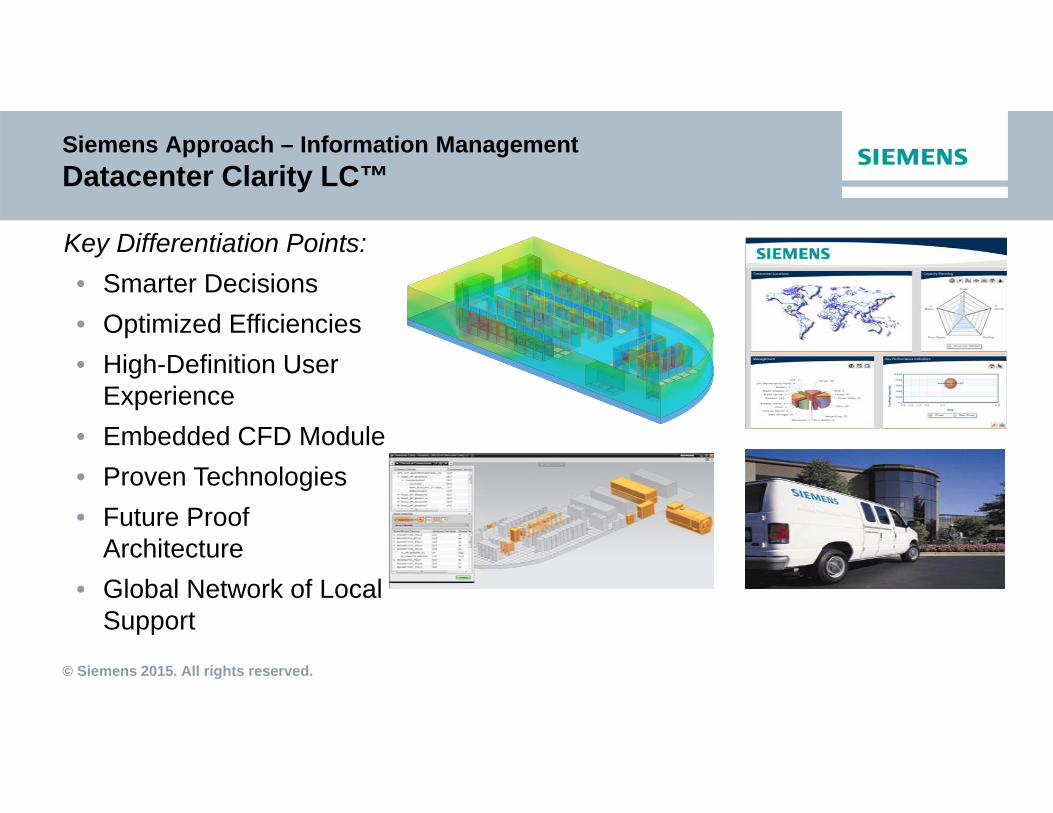
Key Differentiation Points:• Smarter Decisions• Optimized Efficiencies• High-Definition User
Experience• Embedded CFD Module• Proven Technologies• Future Proof
Architecture• Global Network of Local
Support
© Siemens 2015. All rights reserved.
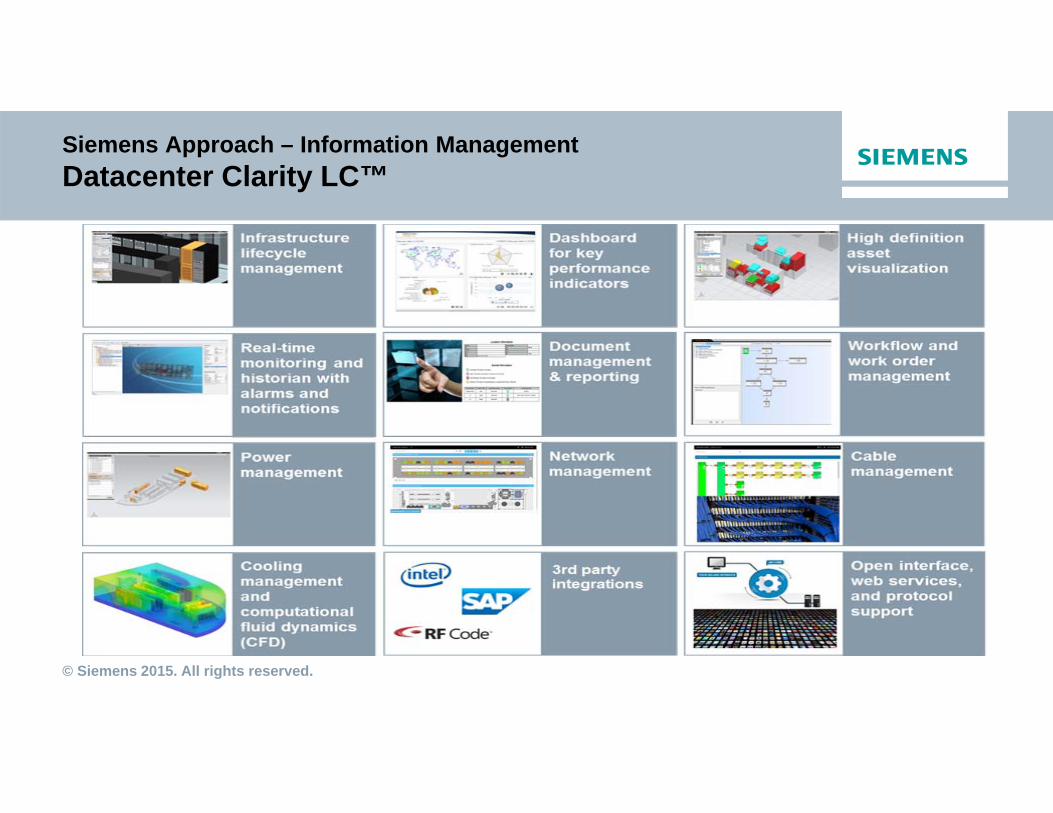
Siemens Approach – Information ManagementDatacenter Clarity LC™
© Siemens 2015. All rights reserved.
Siemens Approach – Information ManagementDesigo® CC

© Siemens 2015. All rights reserved.
APOGEE & Desigo CC3
21
Simple navigation
Power monitoring Reporting
Visualization - context sensitive drill downEvent normalization
Dashboards
Fire
Det
ectio
nE
xtin
guis
hing
Wat
er F
low
Bui
ldin
g 4
Bui
ldin
g 5
Bui
ldin
g 6
Enu
ncia
tion
Building Automation
Hea
ting
Coo
ling
Hum
idifi
catio
n
Dat
a C
ente
rC
entra
l Pla
ntB
uild
ing
3
Dam
pers
Applications
Gra
phic
sE
ngin
eerin
g M
ode
Rep
orts
Vid
eoS
ched
ulin
gTr
endi
ng
Rem
ote
Not
ifica
tion
Sec
urity
Buildings
Facilities Manager
IT Operations Manager
Building Automation
Dat
a C
ente
r
Applications
Gra
phic
s
Rep
orts
Vid
eoS
ched
ulin
gTr
endi
ng
Rem
ote
Not
ifica
tion
BuildingsFire
System access
Siemens Approach – Information ManagementDesigo® CC

© Siemens 2015. All rights reserved.
Integrated Software SolutionsEPMS Stand-Alone or Integrated Applications
EPMS Integration to Siemens BMS, DCIM, SCADA solutions!
EPMS (Power Monitoring)
DCIM
BMS
Dashboard
Enterprise Power Management System (EPMS)
Web Based Platform
WinPM.Net 6.0

© Siemens 2015. All rights reserved. For internal use only
Integrated Software SolutionsWeb-Enabled EPMS Software Solutions
Fully Integrated Power Monitoring/Power Quality Enterprise Management Software Package containing:
• Standard tables, screens, and dashboards• Graphic configuration tools for custom HMI• Reporting in Excel, PDF, HTML, and more• Logging (SQL) with OPC• Alarm Annunciation• Web Based Clients with reporting• Advanced Real-Time Power Quality Analysis tools• Extensive third party integration• Able to integrate with Siemens family of BMS,
SCADA, DCIM, and more

© Siemens 2015. All rights reserved.
Siemens Approach – Information ManagementComprehensive Approach
DCIM Desigo CC Web Clients WinPM.Net
Desigo CC Web Page with WL Breaker Shown. Uses WinPM as a host for the screens!

© Siemens 2015. All rights reserved.
We Tailor Your Green Data Center Program to Meet Your Needs by:
• Minimizing energy usage and carbon footprint
• Standardizing service delivery
• Maximizing uptime and reliability
• Allowing faster time to market
• Providing comprehensive solutions from one key, global supplier
Conclusion

© Siemens 2015. All rights reserved.
Benefits of a Green Data Center Program:Delivered properly, a Green Data Center program can help customers address a number of critical needs for their business, including:• Limiting the risk of downtime• Extending the equipment lifecycle• Regulatory compliance• Increased safety• Energy efficiency• PUE reduction • Reducing operating cost
Conclusion
© Siemens 2015. All rights reserved.
Siemens Automation SystemsIntelligent building automation systems reduce energy consumption without sacrificing comfort

© Siemens 2015. All rights reserved.
Siemens Desigo CC
Common Tools for Data Center
FacilitiesHistory & Trends Reporting
SchedulingEvent Management
Graphics
ConfigurationUser Management
Data Integration

© Siemens 2015. All rights reserved.
System Integration, EnterpriseIntegration, and Application Support
Fire Suppression
Fire Detection
DCIM
Easy to Use
Smart
Flexible
Open

© Siemens 2015. All rights reserved.
APOGEE Integrated Network for Data Center

© Siemens 2015. All rights reserved.
Data Center Management for Colocation
Main Terminal
Key System Dashboards• White Space• Real-Time Data• Fire Detection• Security\Access Control• KPIs• Electrical One-Lines• Power Systems• Cooling Systems• Analysis
Monitoring & Control
Historical Information
Alarm Management
User Activity
Main Web Portal
Tenant Dashboards
Tenant 1 Dashboard
• SLA metrics• QoMs• Power usage• Camera display (optional)• Space temperatures
Tenant 2 Dashboard
• SLA metrics• QoMs• Power usage• Camera display (optional)• Space temperatures
Tenant 3 Dashboard
• SLA metrics• QoMs• Power usage• Camera display (optional)• Space temperatures

© Siemens 2015. All rights reserved.
Siemens Demand Flow®
A unique and proven energy and operational cost-saving application for water-cooled, central chilled water systems

© Siemens 2015. All rights reserved.
xc
Data Center EcosystemHolistic View
On-site generation
Photo-voltaic
GasWind
Power grid
Energy
Cooling
Demand planning
Heated air/water
Own reuse of heat
Water
Other reuse of heat
Storage
• Central Plant• White Space• Dynamic Load
Management

© Siemens 2015. All rights reserved.
• Downtime is not an option for data centers. Precise cooling, stable and reliable conditions, and system flexibility for expansion are all critical.
• Demand Flow has been installed in some of the most protected data centers in the United States without interruption, even when switching between mechanical cooling and free cooling.
• Demand Flow improves PUE and typically reduces chilled water system energy use by 20% to 40%.
Powerful Solution
• Federal Financial Institution, Atlanta, GA• Georgia Bureau of Investigation, Atlanta, GA• Technology Firm, Research Triangle Park, NC• Technology Firm, East Fishkill, NY• Regions Bank (ROC), Birmingham, AL
• Federal Building, Eagan, MN• Financial Institution, Stamford, CT• Financial Institution , Shelton, CT• Financial Institution, Bridgewater, NJ• Technology Firm, Burlington, NJ• Trading Headquarters, New York, NY
Proven Results at over 11 Data Centers
Demand Flow® for Data Centers
© Siemens 2015. All rights reserved.
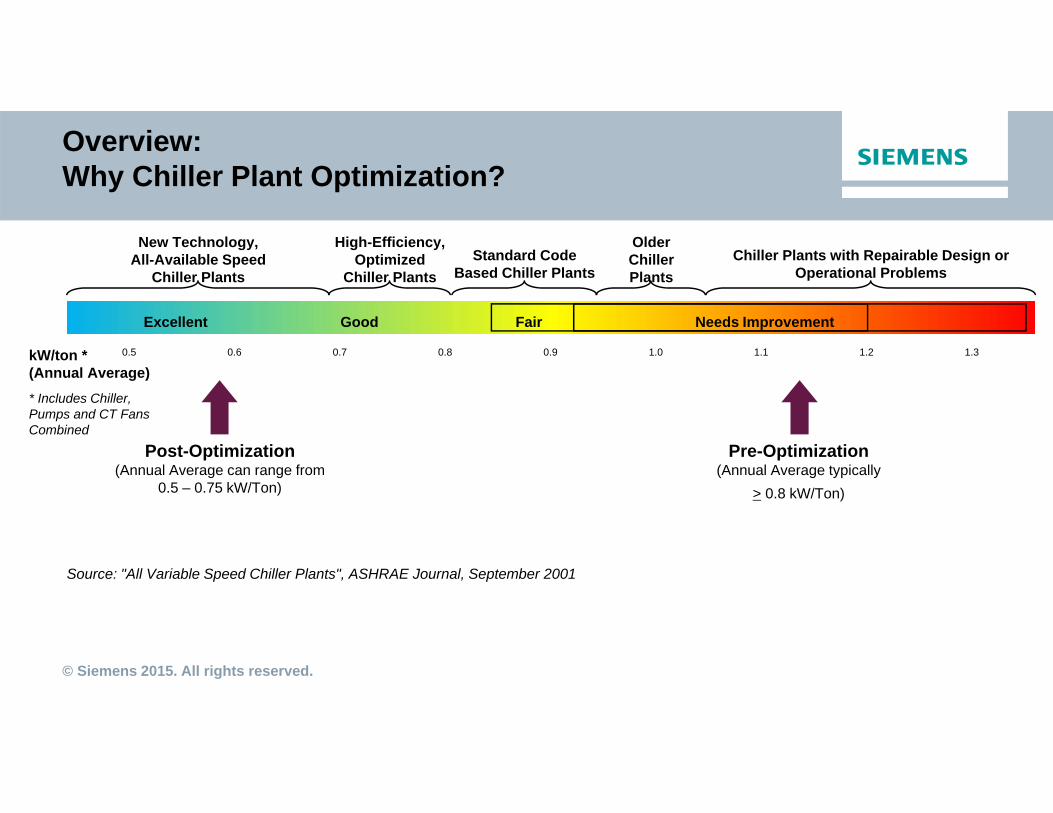
Overview:Why Chiller Plant Optimization?
Source: "All Variable Speed Chiller Plants", ASHRAE Journal, September 2001
0.5 0.6 0.7 0.8 0.9 1.0 1.1 1.2 1.3
Standard Code Based Chiller Plants
New Technology, All-Available Speed
Chiller Plants
High-Efficiency, Optimized
Chiller Plants
Older ChillerPlants
Chiller Plants with Repairable Design or Operational Problems
Excellent Good Fair Needs Improvement
Pre-Optimization(Annual Average typically
> 0.8 kW/Ton)
Post-Optimization(Annual Average can range from
0.5 – 0.75 kW/Ton)
kW/ton *(Annual Average)* Includes Chiller, Pumps and CT Fans Combined
© Siemens 2015. All rights reserved.
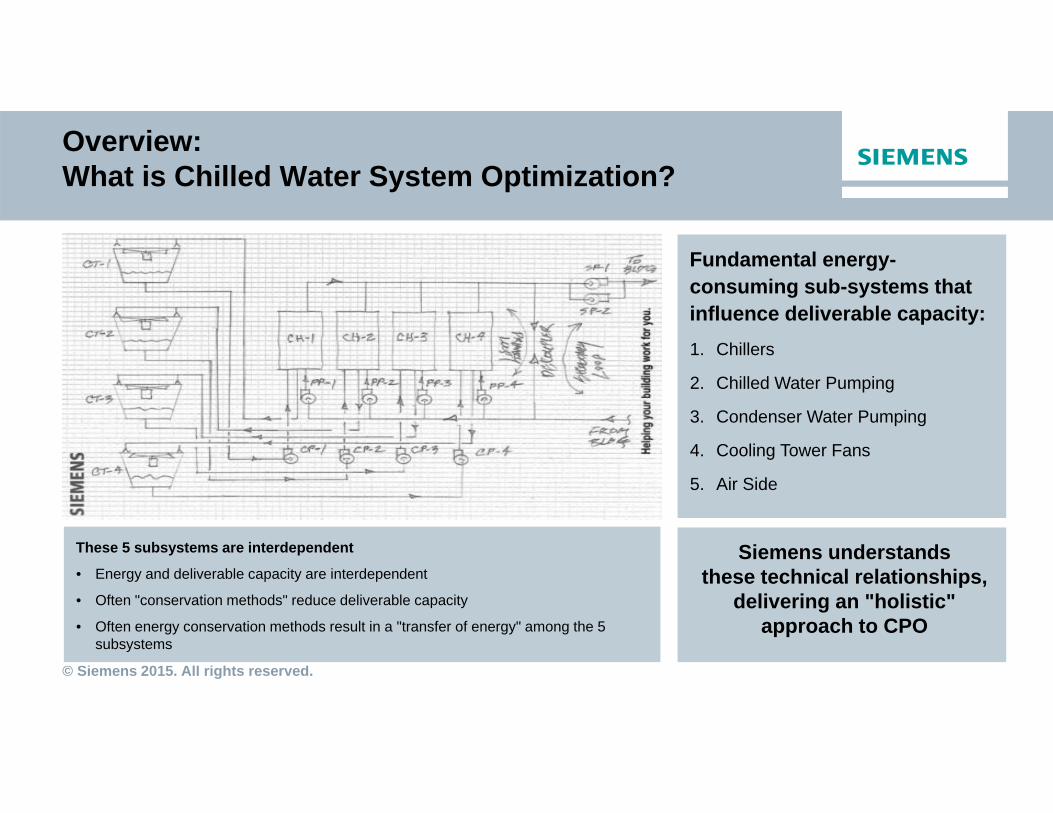
Overview: What is Chilled Water System Optimization?
Fundamental energy-consuming sub-systems that influence deliverable capacity:1. Chillers
2. Chilled Water Pumping
3. Condenser Water Pumping
4. Cooling Tower Fans
5. Air Side
These 5 subsystems are interdependent
• Energy and deliverable capacity are interdependent
• Often "conservation methods" reduce deliverable capacity
• Often energy conservation methods result in a "transfer of energy" among the 5 subsystems
Siemens understandsthese technical relationships,
delivering an "holistic" approach to CPO
© Siemens 2015. All rights reserved.
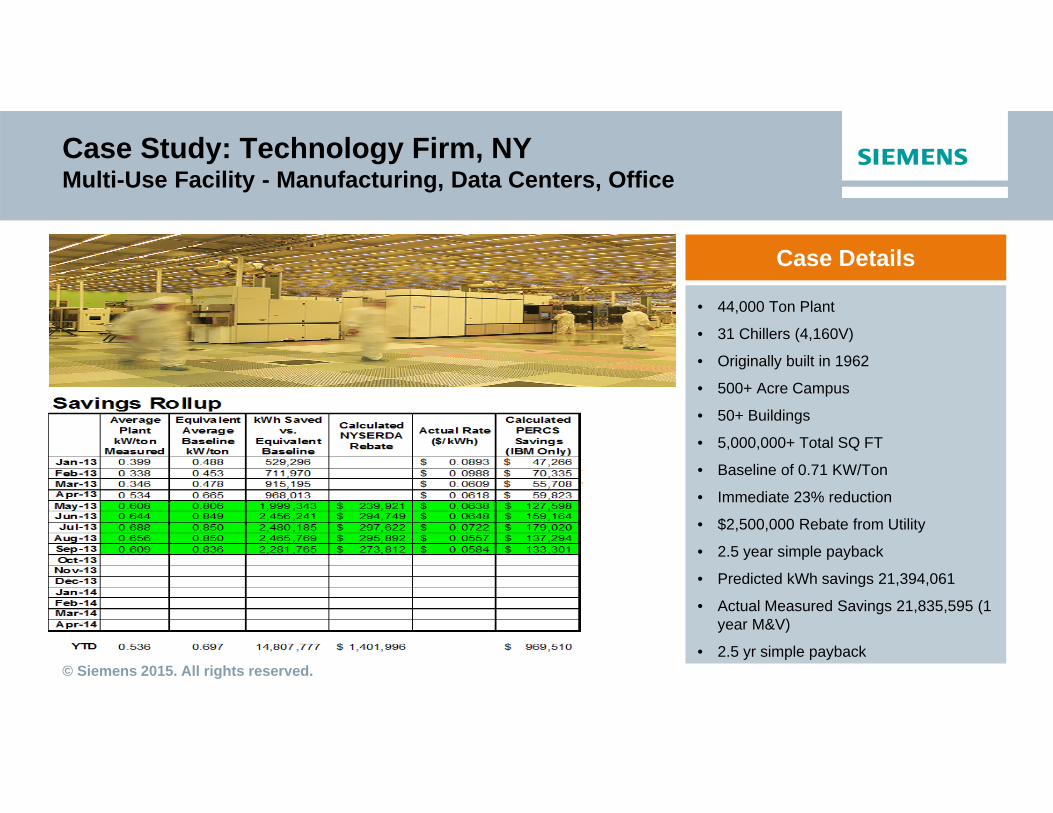
Case Study: Technology Firm, NYMulti-Use Facility - Manufacturing, Data Centers, Office
Case Details
• 44,000 Ton Plant
• 31 Chillers (4,160V)
• Originally built in 1962
• 500+ Acre Campus
• 50+ Buildings
• 5,000,000+ Total SQ FT
• Baseline of 0.71 KW/Ton
• Immediate 23% reduction
• $2,500,000 Rebate from Utility
• 2.5 year simple payback
• Predicted kWh savings 21,394,061
• Actual Measured Savings 21,835,595 (1 year M&V)
• 2.5 yr simple payback
© Siemens 2015. All rights reserved.
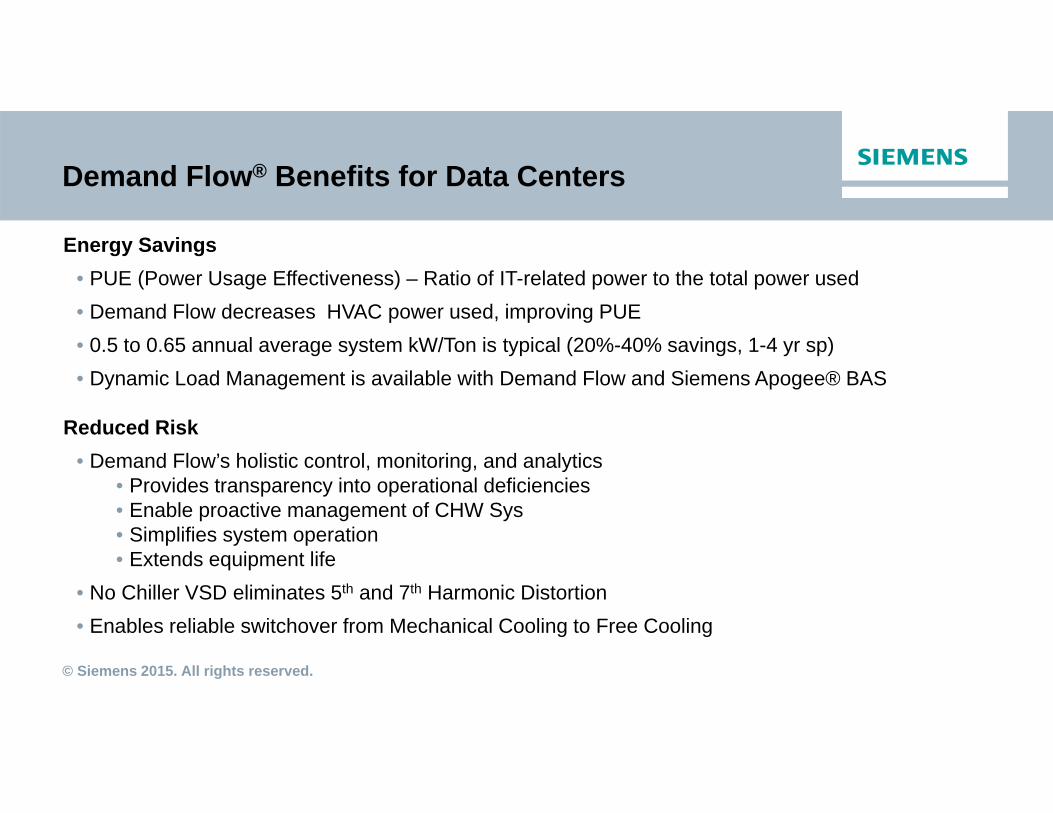
Demand Flow® Benefits for Data Centers
Energy Savings• PUE (Power Usage Effectiveness) – Ratio of IT-related power to the total power used• Demand Flow decreases HVAC power used, improving PUE• 0.5 to 0.65 annual average system kW/Ton is typical (20%-40% savings, 1-4 yr sp)• Dynamic Load Management is available with Demand Flow and Siemens Apogee® BAS
Reduced Risk• Demand Flow’s holistic control, monitoring, and analytics
• Provides transparency into operational deficiencies• Enable proactive management of CHW Sys • Simplifies system operation• Extends equipment life
• No Chiller VSD eliminates 5th and 7th Harmonic Distortion• Enables reliable switchover from Mechanical Cooling to Free Cooling
© Siemens 2015. All rights reserved.
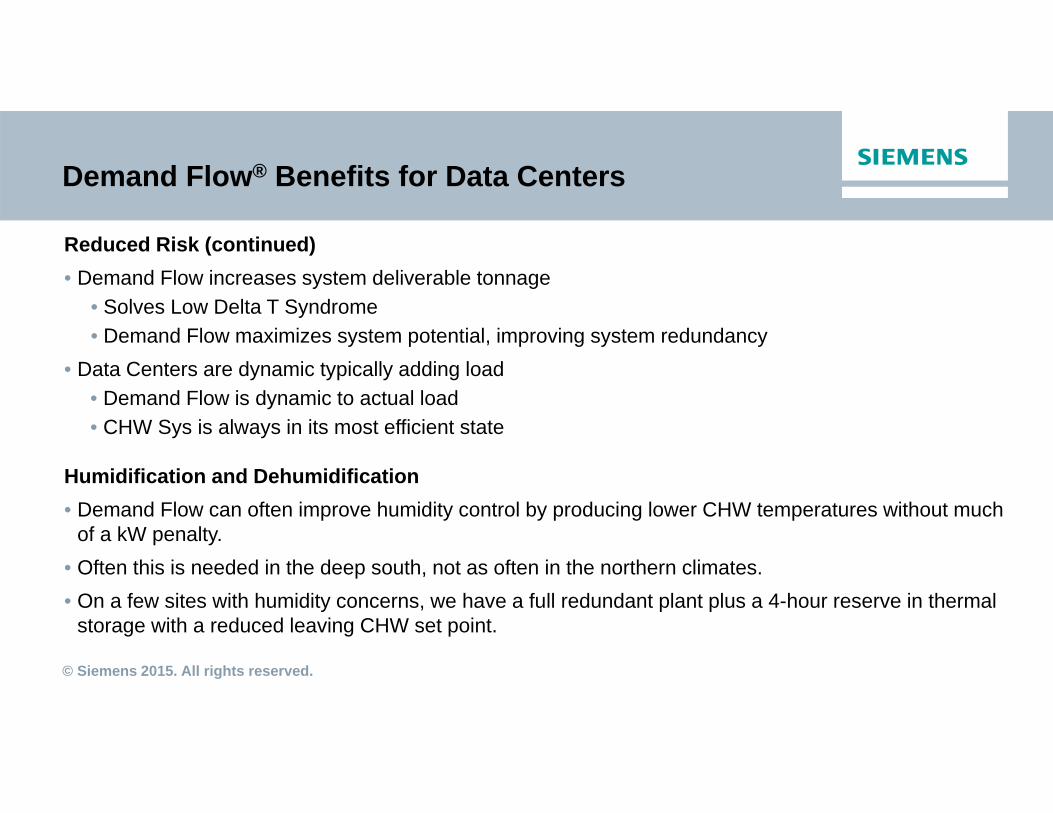
Demand Flow® Benefits for Data Centers
Reduced Risk (continued)• Demand Flow increases system deliverable tonnage
• Solves Low Delta T Syndrome• Demand Flow maximizes system potential, improving system redundancy
• Data Centers are dynamic typically adding load• Demand Flow is dynamic to actual load• CHW Sys is always in its most efficient state
Humidification and Dehumidification• Demand Flow can often improve humidity control by producing lower CHW temperatures without much
of a kW penalty.• Often this is needed in the deep south, not as often in the northern climates.• On a few sites with humidity concerns, we have a full redundant plant plus a 4-hour reserve in thermal
storage with a reduced leaving CHW set point.

© Siemens 2015. All rights reserved.
• A revolutionary, energy-saving solution for water-cooled central chiller plants.
• Proven in over 100 facilities nationwide.
• Consistently improves plant performance, and has saved customers over $15 million in energy costs.
Facility Prime™

© Siemens 2015. All rights reserved.
Siemens Security Systems and Technology
Security Solutions and Services

© Siemens 2015. All rights reserved.
Secure and Positive Authentication
• Secure, fast, easy to use
• Auto Focus Dual Iris Capture
• Optional card, pin options
• Highly scalable solution
• Interfaces with existing access control security solutions
• Identification from 14 inches away in 2 seconds
New 4th Generation iCAM7000 SeriesMultifactor Iris Recognition Biometric Reader

© Siemens 2015. All rights reserved.
Data Center Security – Iris Recognition Technology

© Siemens 2015. All rights reserved.
Data Center Security

© Siemens 2015. All rights reserved.
• Orange turns to green when user is at correct distance
• Easy User Interface – Simple, Fast, Accurate
iCAM7000 Iris Recognition User Interface

© Siemens 2015. All rights reserved.
Flexible Fire Protection Engineered for Data Centers
Very Early Warning Detection Systems & Technologies

© Siemens 2015. All rights reserved.
Fire Suppression Solution – Sinorix™ 227
Automatic, waterless suppression solution used to protect any organization’s most vital assets, such as data centers.
• HFC227ea is a clean agent that suppresses fire
• Electrically non-conductive and safe for electronic equipment
• Safe for human exposure at design concentrations
• Zero “0” Ozone depletion potential
• Leaves no residue
• Approved (UL, ULC, and FM)

© Siemens 2015. All rights reserved.
Fire Suppression Solution – Sinorix™ 1230
Environmentally friendly suppression solution, based on 3M™ Novec™ 1230 Fire Protection Fluid• Flooding within 10 seconds ensures fastest suppression• Innovative 25-bar (360 PSI) technology ensures highest
suppression efficiency and flexibility in engineering • Harmless* to people (highest safety margin) • Outstanding environmental profile:
• Zero “0” ozone depletion potential (ODP = 0) • Lowest contribution to global warming (GWP = 1) • Lowest atmospheric life time of 5 days (ALT)
• Approved system (UL-, ULC-, FM-Approved)
Note: At designed concentrations*
010002000300040005000600070008000
Novec™ 1230
FM‐200 FE‐25 Halon 1301
Global Warming Potential

© Siemens 2015. All rights reserved.
Fire Safety Process for Integratedand Tailored Fire Protection Solutions
We integrate fire detection, fire evacuation, and suppression systems into a single, comprehensive safety solution – providing optimum protection for your data center.

© Siemens 2015. All rights reserved.
Robust Fire Protection that’s Customizable to Your Unique Site and Specific Needs
Dual optical thermal
Dual optical thermal & CO
Siemens multi-criteria ASAtechnologyTM with a “No False Alarm” Guarantee
VESDA aspirating detection
High-level interface to broad portfolio of VESDA devices
Siemens FireFinder® XLS
Intelligent Spot Detection Aspirating Detection
Cost-Effective Alternative for High-Sensitivity Smoke Detection!

© Siemens 2015. All rights reserved.
Typical Application with Siemens and VESDA
• Single point of control to view/control any VESDA detector or spot detector• Reduces complexity and cost –no monitor modules required• 4 levels of alarm, detailed fault codes, scan signals, obscuration levels appear at user interface• No need for VESDA displays

© Siemens 2015. All rights reserved.
Addressable Smoke Detection per Cabinet

© Siemens 2015. All rights reserved.
What makes detectors with ASAtechnology unique?
1
2
3
4
5
6
1
5
Two IR light sources1
Scattered light from smoke (Forward & Backward)2
Optic Receiver3
Patented labyrinth4
Two redundant temperaturesensors measure thetemperature
5
Monitored CO sensormeasures the CO concentration
6
Only Siemens offers UL listed Forward and Backward Light Scattering Detection

© Siemens 2015. All rights reserved.
-
+
+
-
PatentedTechnology!
SureWireTM
SureWire™ Technology
• The detector field wiring of the XLS is the ONLY polarity-insensitive field device wiring in the market –we call it SureWire™!
• Accidentally-flipped wires at one junction box have no effect on the operation of the detectors.• The device "corrects" the connections automatically.• With competitors, the loop crashes if one device is reversed; this situation is very difficult to
troubleshoot.• Technology so unique…its patented!

© Siemens 2015. All rights reserved.
Proven Outcomes Servicesfor Data Centers
Service programs tailored to meet performance goals
© Siemens 2015. All rights reserved.
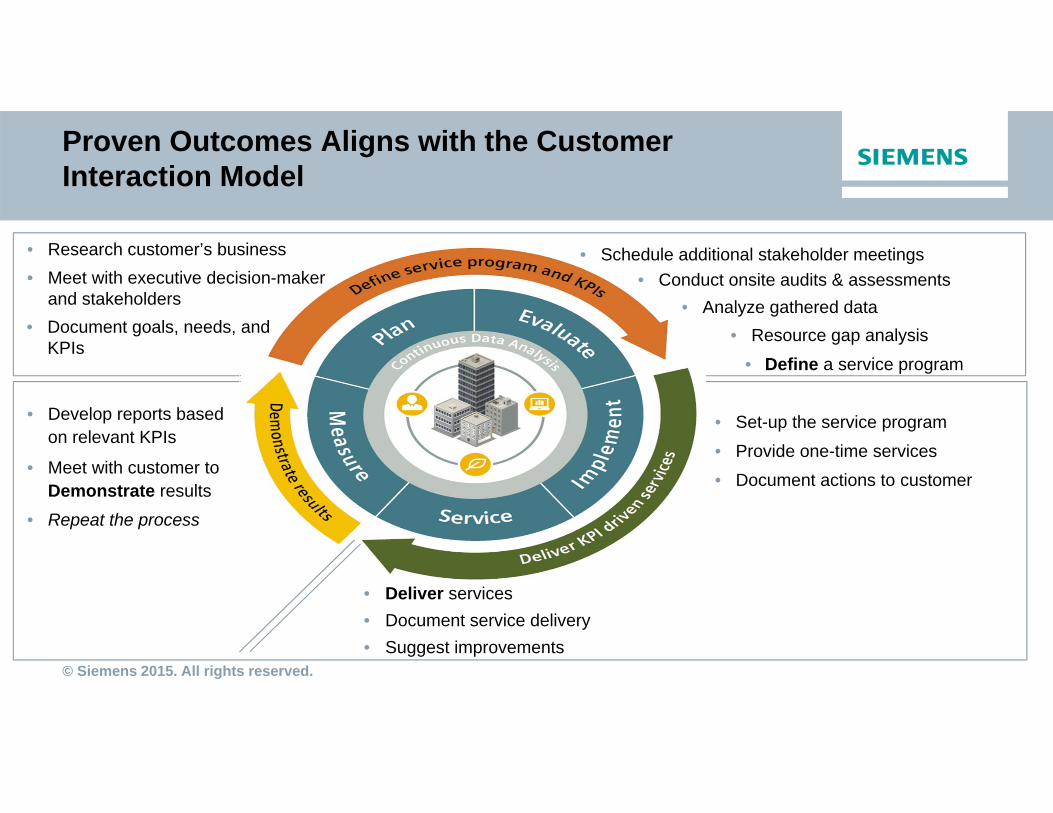
Proven Outcomes Aligns with the Customer Interaction Model
• Research customer’s business• Meet with executive decision-maker
and stakeholders
• Develop reports based on relevant KPIs
• Meet with customer to Demonstrate results
• Repeat the process
• Schedule additional stakeholder meetings
• Set-up the service program • Provide one-time services• Document actions to customer
• Deliver services• Document service delivery• Suggest improvements
• Analyze gathered data• Conduct onsite audits & assessments
• Resource gap analysis• Define a service program
• Document goals, needs, and KPIs

© Siemens 2015. All rights reserved.
Siemens 3D Service Approach

© Siemens 2015. All rights reserved.
Benefits

© Siemens 2015. All rights reserved.
Siemens Service Solution


![ModelingNonlinearPowerAmplifiersinOFDMSystems ... · 4/19/2002 · following nonlinear models was carried out: Saleh’s model [1], envelope polynomial models (EPMs) with memory](https://static.fdocuments.in/doc/165x107/5f7024e2d3ad193ed546c978/modelingnonlinearpowerampliiersinofdmsystems-4192002-following-nonlinear.jpg)