Yi fan Ch en F i n al P r o to typ e S tr ai n G au g e P ...
11
Strain Gauge Project Final Prototype Yifan Chen Zhicheng Jiang Tianpai Le Ziyu Wei Rui Xu Summer 2021 Project Sponsor: Department of Mechanical Engineering, NAU Faculty Advisor, Sponsor Mentor & Instructor: Dr. David Trevas
Transcript of Yi fan Ch en F i n al P r o to typ e S tr ai n G au g e P ...

Strain Gauge Project
Final Prototype
Yifan ChenZhicheng Jiang
Tianpai LeZiyu WeiRui Xu
Summer 2021
Project Sponsor: Department of Mechanical Engineering, NAU
Faculty Advisor, Sponsor Mentor & Instructor: Dr. David Trevas

OVERVIEWAs part of Strain Gauge Team’s demonstration of the project, the team built a prototype at the end of firstsemester. In general, the building of the prototype follows the schematic diagram (Figure 1) of a strainmeasurement device, which turned out to be a preliminary system including strain gauges, a completecircuit, and computer output through programs. Based on that, the team also conducted some simulationtests on the prototype, where a shot of the entire system (Figure 2) was taken at the scene.
Figure 1: Schematic Diagram of Strain Measurement Device
Figure 2: Overview of the Prototype

LIMITATIONSDue to the stage of the project, there are some limitations with the prototype. First, instead of testingstrain under all four load types, the team only put bending in trial. This was because the team was unableto find a metal piece with appropriate dimensions, meaning the part needs to be replaced without affectingtoo much on the measurement. For bending, a plastic ruler could be a decent replacement of the metal bar,especially for its susceptibility to deform, which could generate a wider range of results.
Also, because of the limited time, the team was only able to construct one configuration of strain gauges,which is a half bridge with both strain gauges sharing one route in the circuit. The configuration couldcoordinate with bending strain measurements.
PROTOTYPE DECOMPOSITION & TESTING PROCEDUREThe figure below (Figure 3) shows the strain gauges on the plastic ruler, which were roughly glued to themidpoint of the ruler on both sides. An object (around 10 grams) was placed on the further end of theruler. By changing the position of the object, the team was able to get different strain readings from theprototype.
Figure 3: Strain Gauges on Ruler
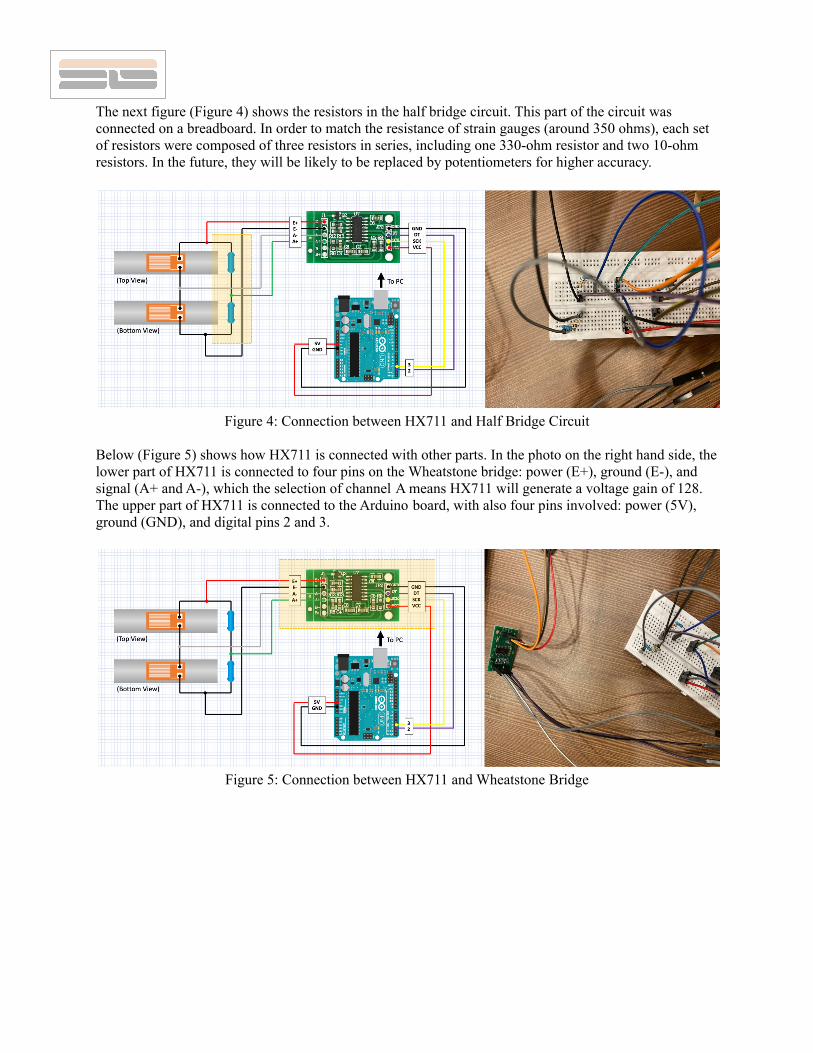
The next figure (Figure 4) shows the resistors in the half bridge circuit. This part of the circuit wasconnected on a breadboard. In order to match the resistance of strain gauges (around 350 ohms), each setof resistors were composed of three resistors in series, including one 330-ohm resistor and two 10-ohmresistors. In the future, they will be likely to be replaced by potentiometers for higher accuracy.
Figure 4: Connection between HX711 and Half Bridge Circuit
Below (Figure 5) shows how HX711 is connected with other parts. In the photo on the right hand side, thelower part of HX711 is connected to four pins on the Wheatstone bridge: power (E+), ground (E-), andsignal (A+ and A-), which the selection of channel A means HX711 will generate a voltage gain of 128.The upper part of HX711 is connected to the Arduino board, with also four pins involved: power (5V),ground (GND), and digital pins 2 and 3.
Figure 5: Connection between HX711 and Wheatstone Bridge

The following figure (Figure 6) shows the Arduino board and how it is connected. The interface on its leftis connected to a computer through a USB port, and data is displayed on the computer through twoprograms. The first one was programmed on Arduino, which sends clock signals to HX711 andtransforms its feedback (in the form of voltage levels) to a digital reading. The reading can be convertedto a voltage difference between two signal pins on the Wheatstone bridge, and therefore be turned to astrain value with the help of some additional mathematical equations. The second program was written onProcessing, which is more of an application designed for artists, was used for some graphics design andthe final display of the above results.
The codes for both programs can be seen in the appendices at the end of this document.
Figure 6: Arduino Board and Its Connections
RESULT & CONCLUSIONAfter the team applied the force on the plastic ruler, the strain gauge changed while making the resistanceof the gauge changed. That change will be captured and enlarged by the HX711. The data can bedisplayed on the computer after processing by Arduino. You can see the final reading for the computerscreen in the figure.
Figure 7: Program Interface & A Shot of Computer Reading

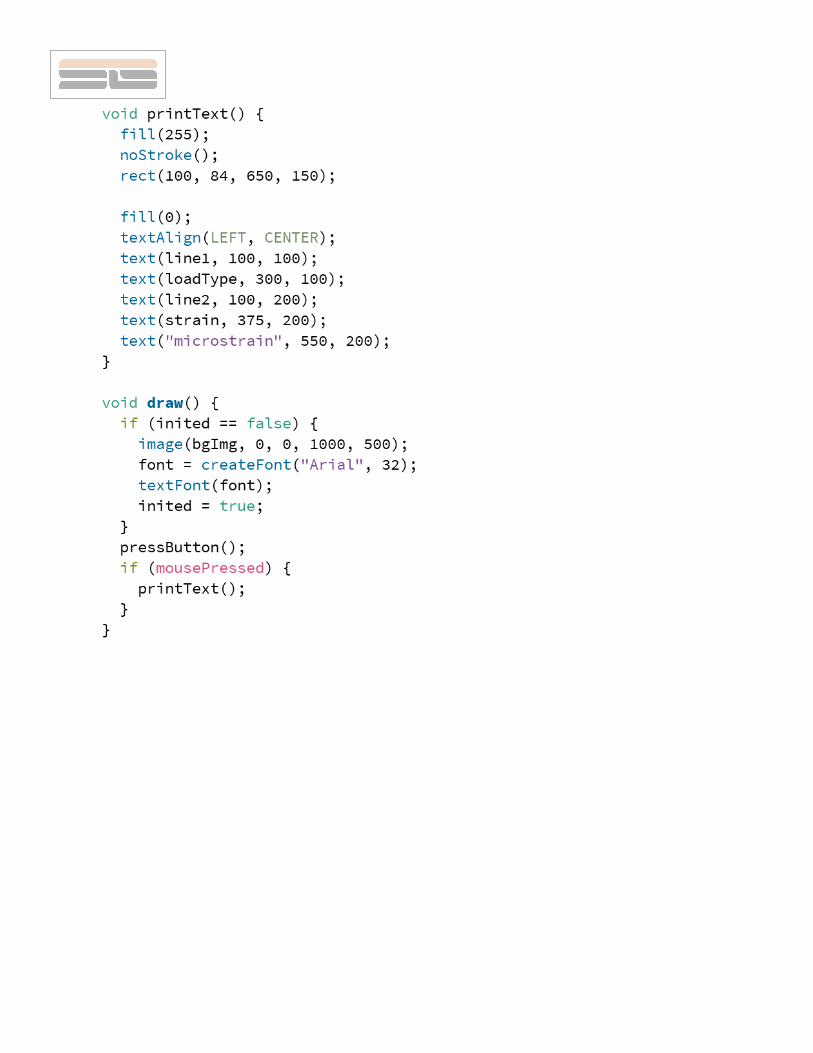
APPENDIX A: ARDUINO CODES


APPENDIX B: PROCESSING CODES