Yearbook KeyStats2013 rev0 - au.int · Communauté Economique des Etats de l’Afrique Centrale (...
292
KeyStats on African Integration sur l’Intégration africaine 2013 African Union Commission – Commission de l’Union africaine
Transcript of Yearbook KeyStats2013 rev0 - au.int · Communauté Economique des Etats de l’Afrique Centrale (...

KeyStats 2008
KeyStats on African Integration sur l’Intégration africaine
2013
African Union Commission – Commission de l’Union africaine

Statistics Division Department of Economic Affairs
African Union Commission P.O. Box 3243,
Addis Ababa, Ethiopia Tel: (251-11) 51 82 674 Fax: (251-11) 55 19 287
Email: [email protected] http://austat.org
Website: www.au.int

KeyStats 2013

Published by the African Union Commission P.O. Box 3243 Addis Ababa, Ethiopia ISSN: © 2013 African Union Commission All rights reserved Data from this publication may be reproduced, applied or processed, provided the African Union Commission is acknowledged as the source of data.

Content Content i Preface ii Production Team iv Abbreviation v Symbols v 2007 Summary 1 I - AMU 3 II - CEN-SAD 33 III - COMESA 63 IV - EAC 93 V - ECCAS 123 VI - ECOWAS 153 VII - IGAD 183 VIII - SADC 213
Sommaire Sommaire i Préface iii Equipe de Production iv Abréviation v Symboles v Résumé 2007 1 I -UMA 3 II - CEN-SAD 33 III - COMESA 63 IV - CAE 93 V - CEEAC 123 VI - CEDEAO 153 VII - IGAD 183 VIII - SADC 213

Preface
The African Union Commission is pleased to introduce KeyStats on African Integration, a source of statistical information on the African integration process, to data users and political authorities of the Union.
The 2013 edition of KeyStats on African Integration presents an overview of the status of the integration process in the eight Regional Economic Communities (RECs): Arab Maghreb Union (AMU), the Community of Sahel-Saharan States (CEN-SAD), Common Market for Eastern and Southern Africa (COMESA), East African Community (EAC), Economic Community of Central African States (ECCAS), Economic Community of West African States (ECOWAS), Inter-Governmental Authority on Development (IGAD) and Southern African Development Community (SADC).
For each REC, the presentation of data is structured around the following four sectors:
the real sector, comprising, among other things, information on Gross Domestic Product (GDP) and inflation;
government finance, comprising revenue, expenditures, and fiscal balance;
the monetary and financial sector, including monetary aggregates and interest rates ; and
the external sector, comprising, among other things, data on trade, international reserves and external
Préface La Commission de l’Union africaine est heureuse de mettre à la disposition des utilisateurs de données statistiques et des autorités politiques de l’Union « KeyStats sur l’Intégration Africaine », une source d’information statistique sur le processus d’intégration en Afrique. L’édition 2013 de « KeyStats sur l’Intégration Africaine » présente un aperçu de l’état du processus d’intégration dans les huit Communautés économiques régionales (CER), à savoir : Union du Maghreb Arabe (UMA), Communauté des Etats Sahélo-sahariens (CEN-SAD), Marché Commun de l’Afrique Orientale et Australe (COMESA), Communauté de l’Afrique de l‘Est (CAE), Communauté Economique des Etats de l’Afrique Centrale ( CEEAC), Communauté Economique des Etats de l’Afrique de l’Ouest (CEDEAO), Autorité Intergouvernementale sur le Développement (IGAD) et Communauté de Développement de l’Afrique Australe (SADC). Pour chaque CER, la présentation des données se structure autour des quatre secteurs suivants : le secteur réel, comprenant, entre autres, des
informations sur le Produit Intérieur Brut (PIB) et l’inflation ;
les finances publiques, comprenant les recettes, dépenses, et le solde budgétaire ;
le secteur monétaire et financier, comprenant les agrégats monétaires et le taux d’intérêt ; et

debt
The data used in this yearbook essentially come from Regional Economic Communities, National Statistics Offices, Central Banks of Member States, the World Bank, the International Monetary Fund, and the United Nations Conference on Trade and Development.
We would like to acknowledge RECs, Members States who have been kind enough to provide us with economic and financial data on their countries, and call upon all African countries to send us the economic and financial data of their countries annually to enable us to update and produce the 2014 yearbook. An active involvement of Member States will allow for the significant improvement of the KeyStats, in order to ultimately provide users of economic and monetary statistics with reference statistics on the status of African integration.
Furthermore, our hope is that this yearbook will be used as a guiding tool for African decision makers on the actions to undertake for the consolidation and acceleration of the African integration process.
Director of Economic Affairs
le secteur extérieur, comprenant, entre autres, des données sur le commerce, les réserves internationales et la dette extérieure.
Les données utilisées dans l’élaboration de cet annuaire proviennent essentiellement des Communautés économiques régionales, des Instituts nationaux de Statistiques, des Banques Centrales des Etats Membres, de la Banque Mondiale, du Fonds Monétaire International, et de la Conférence des Nations Unies sur le Commerce et le Développement. Nous voudrions saisir cette occasion pour remercier les CER, Etats Membres qui ont bien voulu nous faire parvenir leurs données économiques et financières, et lancer un appel à l’endroit de tous les pays africains pour nous communiquer l’ensemble de leurs données économiques et financières afin de nous permettre de les actualiser en vue de la production de l’édition 2014. Une implication active des Etats Membres permettra une amélioration significative de KeyStats, dans le but ultime de mettre à la disposition des utilisateurs des statistiques économiques et monétaires des statistiques de référence sur l’état de l’intégration africaine. Par ailleurs, notre souhait est que cet annuaire soit utilisé comme un outil pour éclairer les décideurs africains sur les actions à entreprendre en vue de la consolidation et de l’accélération du processus d’intégration africaine.
Directeur des Affaires Economiques

Production Team “KeyStats on African Integration, 2013” is one of the publications of the Department of Economic Affairs. Under the leadership of H.E. Dr. Anthony Mothae Maruping, Commissioner for Economic Affairs, and the supervision of Dr. René N’Guettia Kouassi, Director of the Department of Economic Affairs, the production team comprised Mr. Dossina Yeo, Mr. Jose Awong Alene, Mr. Gildas Crepin Nzingoula, Mr. Samson Bel-Aube Nougbodohoue; Mrs. Selamawit Mussie, Mr. Adjewoda Koami Kutoati, all staff of the Statistics Division.
Contribution from RECs ECOWAS: Mr Ajaero Christopher; COMESA: Mr Walakira Anthony; ECCAS: Mr Jules Touka; SADC: Mr Ackim Jere; and CEN-SAD: Mr Mamadi Kourma.
Equipe de Production “KeyStats sur l’Intégration Africaine, 2013” est l’une des publications du Département des Affaires Economiques. Sous le leadership de S.E. Dr. Anthony Mothae Maruping, Commissaire aux affaires économiques, et la supervision de Dr. René N’Guettia Kouassi, Directeurs des affaires économiques, l’équipe de production était composée de M. Dossina Yeo, M. Jose Awong Alene, M. Crepin Nzingoula Gildas Crepin, M. Samson Bel-Aube Nougbodohoue, Mme. Selamawit Mussie, M. Adjewoda Koami Kutoati, tous de la Division de Statistiques. Contribution des CER
CEDEAO: M. Ajaero Christopher; COMESA: M. Walakira Anthony; CEEAC: M. Jules Touka; SADC: M. Ackim Jere; et CEN-SAD: M. Mamdi Kourma.

Abbreviations AMU: Arab Maghreb Union CAR: Central African Republic CEN-SAD: The Community of Sahel-Saharan
States COMESA: Common Market for Eastern and
Southern Africa EAC: East African Community ECCAS: Economic Community of Central
African States ECOWAS: Economic Community of West
African States GDP: Gross Domestic Product GNI: Gross National Income PPP: Purchasing Power Parity IGAD: Inter-Governmental Authority on
Development SADC: Southern African Development
Community UNCTAD United Nations Conference on
Trade and Development COMTRADE United Nations Commodity Trade
Statistics Databse Symbols ... Data not available __ Non applicable 0 ou 0.0, etc. Figure too small to publish * Provisional
Abbreviations AMU: Arab Maghreb Union CAR: Central African Republic CEN-SAD: The Community of Sahel-Saharan
States COMESA: Common Market for Eastern and
Southern Africa EAC: East African Community ECCAS: Economic Community of Central
African States ECOWAS: Economic Community of West
African States GDP: Gross Domestic Product GNI: Gross National Income PPP: Purchasing Power Parity IGAD: Inter-Governmental Authority on
Development SADC: Southern African Development
Community UNCTAD United Nations Conference on
Trade and Development COMTRADE United Nations Commodity Trade
Statistics Databse Symbols ... Data not available __ Non applicable 0 ou 0.0, etc. Figure too small to publish * Provisoire

General notes Notes générales The statistics presented in the KeyStats are, as far as possible in accordance with international recommendations and definitions. Where important deviations are known to exist, they are indicated in footnotes at the end of each country’s table. Owing to the rounding of figures, the totals shown in tables do not always correspond exactly to the sum of their component items. I. Social and Demographic Sector Population Data presented in this section, are derived mainly from the following publications: «World Population Prospects, estimates and projections of the UN Secretariat Population Division”, “World Urbanization Prospects” and «Labour Force Estimates and Projections, 1980-2020» prepared by the International Labour Organization (ILO). Regional Economic Communities (RECs) sources have been used to supplement missing data when comparable with the UN series.
Les statistiques présentées dans KeyStats sont, autant que possible, conformes aux recommandations et définitions internationales. Lorsque des divergences importantes sont connues, elles sont indiquées dans les notes figurant à la fin du tableau de chaque pays concerné. A cause des arrondis, les totaux indiqués dans certains tableaux ne correspondent pas toujours exactement à la somme de leurs composantes. I. Secteur Sociodémographiques Population Les données présentées dans cette section sont tirées principalement des publications: «Perspectives d’avenir de la population mondiale, estimations et projections», «Perspectives d’Urbanisation Mondiale» de la Division de la Population de l’ONU, «Estimations et Projections de la Main d’Œuvre, 1980-2020» du Bureau International du Travail (BIT). Les sources des Régions Economiques Régionales ont été utilisées pour compléter les données non disponibles, dans la mesure où elles étaient comparables aux séries de l’ONU.

Mid-year population Unless otherwise stated, the figures shown relate to de facto population. Economically active population The economically active population comprises all employed and unemployed persons (including those seeking jobs for the first time). It covers employers, persons working on their own account, salaried employees, wage earners, unpaid family workers, and members of producers’ co-operatives and members of the armed forces.
Population en milieu d’année Sauf indication contraire, les chiffres indiqués se rapportent à la population de fait. Population économiquement active La population active comprend toutes les personnes employées ou non (y compris celles qui sont à la recherche d’un premier emploi). Elle comprend les employeurs, les travailleurs indépendants, les salariés, les rentiers, les travailleurs familiaux non rémunérés, et les membres des coopératives de producteurs et ceux des forces armées.
II. Real Sector Gross Domestic Product (GDP) GDP measures the total final output of goods and services produced by a national economy, excluding provisions for depreciation. GDP per capita Gross domestic product (GDP) divided by annual average population. Agricultural production The data on major crops produced is obtained from the National Statistical Offices. Same countries the data is obtained from the online database of the Food and Agricultural Organization (FAO). For those countries, the five major crops per country are obtained by calculating the average yearly production of each crop produced by a given country (considering only years when the crop is produced); and ranking it in descending order.
II. Secteur Réel Produit Intérieur Brut (PIB) Le produit intérieur brut (PIB) mesure la production finale totale des biens et services de l’économie nationale, en excluant l’amortissement. PIB par habitant Le produit intérieur brut (PIB) divisé par la population annuelle moyenne. Production agricole Les données sur les principales productions agricoles sont obtenues des INS des pays. Quelques pays elles sont tirées de la base de données en ligne de l'Organisation pour l’Alimentation et l’Agriculture (FAO). Pour ces pays, les cinq principales productions agricoles sont obtenues en calculant la production annuelle moyenne du pays (seules les années où le produit est récolté sont retenues) et en les triant par ordre décroissant

Inflation Inflation is measured by the annual percent changes in Consumer price index. Consumer price index (CPI) shows the cost of acquisition of a basket of goods and services purchased by the average consumer. Weights for the computation of the index numbers are obtained from household budget surveys. CPI data are provided by the national statistical systems, mainly by the national bureau of statistics or Central banks.
Inflation L’inflation est mesurée par la variation annuelle de l’indice des prix à la consommation (IPC). L’IPC mesure le coût d’acquisition par le consommateur moyen d’un panier de biens et services. Les coefficients de pondération pour le calcul des indices sont tirés des enquêtes sur les dépenses des ménages. Les données de l’IPC proviennent essentiellement des Instituts nationaux de statistique (INS) ou des Banques centrales.
III. Governance Finance Data for this section primarily collected from National Authorities such as Regional Economic Communities, National Statistics Offices, Ministries of Finance and Central Banks; and where national sources are not available; data from IMF publications (Country Reports) are used. For countries: Botswana, Egypt, Ethiopia, Kenya, Malawi, Mauritius, Namibia, South Africa and Swaziland, the data compiled following their respective fiscal period as annual data. Therefore, the years 2002 - 2010 represent the ending calendar year according to the fiscal period of each country. Revenue and grants It includes all non-repayable receipts, requited and unrequited, current and capital, and non-compulsory, non-repayable, unrequited receipts from other
III. Finances publiques Les données sont principalement collectées par les autorités nationales – CER, INS, ministères des finances et banques centrales ; quand les sources nationales ne sont pas disponibles, on a recours aux données des publications du FMI (rapports pays). NB : Pour le Botswana, l'Egypte, l'Ethiopie, le Kenya, le Malawi, l’île Maurice, la Namibie, l'Afrique du Sud et le Swaziland, les données ont été compilées en fin d’année fiscale, comme données annuelles. Ainsi, les années 2002 à 2010 représentent bien l'année civile selon la période fiscale de chaque pays. Recettes totales et dons Les recettes publiques incluent toutes celles non remboursables par l’Etat, avec ou sans contrepartie, provenant d’autres administrations (locales ou

governments (domestic or foreign) and international institutions. Expenditure and net lending It includes all non-repayable payments by government, whether requited or unrequited and whether current or capital, as well as government transactions in debt and equity claims upon others acquired for purposes of public policy. Current Expenditure It includes all non-repayable payments by government, whether requited or unrequited, other than capital expenditure or grants. Capital Expenditure Expenditure for acquisition of fixed capital assets, stocks, land or intangible assets plus unrequited transfers for the purpose of permitting the recipient to acquire such assets. In order to be classified as a capital asset, an asset acquired must exceed a minimum value and be intended for use for more than one year in the process of production. Fiscal Balance Fiscal balance or Government overall surplus/deficit is defined as total revenue and grants received less total expenditure and net lending.
étrangères) et des institutions internationales. Dépenses et prêts nets Ils comprennent tous les paiements non remboursables effectués par l’Administration publique, avec ou sans contrepartie, y compris les dépenses courantes et en capital, les transactions au titre de la dette publique et les participations au capital. Dépenses courantes Elles comprennent tous les paiements non remboursables effectués par l’Administration publique, avec ou sans contrepartie, autres que les dépenses en capital ou les subventions. Dépenses en capital Il s’agit des dépenses pour l’acquisition d’immobilisations, de stocks, de terrains ou d’actifs incorporels ainsi que les transferts sans contrepartie dans le but de permettre au bénéficiaire d’acquérir ces actifs. Pour être classé comme un capital, un bien acquis doit dépasser une valeur minimale et être destiné à plus d’un an d’utilisation dans le processus de production. Déficit fiscal L’excédent/déficit global des finances publiques est la différence entre les recettes courantes, les recettes en capital et les dons publics reçus et les dépenses totales et les prêts nets des remboursements.
IV. Monetary and Financial Data for this section are essentially obtained from the IMF International Financial Statistics Database and National Central Banks. Money supply (M1) Money supply comprises transferable deposits and currency outside deposit money banks. Quasi money Quasi money comprises time, savings and foreign currency deposits. Domestic credit Domestic credit includes all domestic assets of the banking system. It is the sum of claims on the central government (net), on official entities and the private sector. Credit to the private sector is shown separately but as a subset of domestic credit. Interest rates The amount charged, expressed as a percentage of principal, by a lender to a borrower for the use of assets.
IV. Statistiques monétaire et Financier Les données de cette section proviennent essentiellement des banques centrales africaines et de la base de données sur les Statistiques financières internationales du FMI. La masse monétaire (M1) La masse monétaire au sens strict (M1) comprend les dépôts transférables et la circulation fiduciaire hors banques. La quasi-monnaie La quasi-monnaie englobe les dépôts à terme, les dépôts d’épargne et les dépôts en devises. Le crédit intérieur Le crédit intérieur est égal à la somme des créances nettes sur l’Etat, les entreprises publiques et le secteur privé. Le crédit au secteur privé est présenté séparément comme sous-groupe du crédit intérieur. Taux d’intérêt Le montant facturé, exprimée en pourcentage du principal, par un prêteur à un emprunteur pour l'utilisation d'actifs.

V. External Trade Data for this section are mainly obtained from countries and RECs. In the case where national data could not be found we have used the United Nations COMTRADE online database. The names of major Export and Import commodities have been selected by the reporting countries themselves. For the data obtained from COMTRADE the harmonized system (rev1) classification is used to determine the list of main exports and imports commodities. Unless otherwise indicated the import statistics are reported on CIF valuation base while exports are reported on FOB. Angola, Botswana, Burkina Faso, Burundi, Cameroon, Central African Republic, Comoros, Congo, Côte d'Ivoire, Democratic Republic of Congo, Egypt, Gabon, The Gambia, Guinea, Guinea-Bissau, Kenya, Lesotho, Libyan Arab Jamahiriya, Madagascar, Malawi, Mali, Mauritania, Mauritius, Morocco, Mozambique, Namibia, Nigeria, Rwanda, Senegal, Seychelles, Sierra Leone, Sudan, Tanzania, United Republic of, Tunisia, and Zambia have provided us with their national external trade data for this publication.. Exports and imports of goods and services Exports and imports of goods and services refer to the value of goods and non-factor services provided to or from the rest of the world. They do not include receipts and payments for factor services such as investment income, interest and labor income. The data are generally estimated on the basis of foreign trade statistics and are not directly comparable with those from the balance of payments.
V. Commerce Extérieur Les données sont obtenues majoritairement des pays et des CER. Dans le cas contraire, nous avons eu recours à la base de données en ligne des Nations Unies COMTRADE. Les principaux produits d'exportation et d'importation ont été choisis par les pays eux-mêmes. Pour les données obtenues de COMTRADE la nomenclature du système harmonisé (rev1) a été employée pour déterminer la liste des produits principaux d'exportations et d'importation. Sauf indication contraire, les statistiques d'importation sont valorisées sur la base CAF tandis que les exportations sont valorisées FOB. L'Angola, le Botswana, le Burkina Faso, le Burundi, le Cameroun, la République centrafricaine, les Comores, le Congo, la République démocratique du Congo, la Côte d'Ivoire, l'Egypte, le Gabon, la Gambie, la Guinée, la Guinée-Bissau, le Kenya, le Lesotho, la Jamahiriya arabe libyenne, Madagascar, le Malawi, le Mali, la Mauritanie, l’île Maurice, le Maroc, la Mozambique, la Namibie, le Nigeria, le Rwanda, le Sénégal, les Seychelles, la Sierra Leone, le Soudan, la Tanzanie, la Tunisie et la Zambie ont fournis leurs données nationales du commerce extérieur pour cette publication. Les exportations et importations de biens et services Les exportations et importations de biens et services représentent la valeur des biens et services non facteurs fournis au reste du monde ou reçus de celui-ci. La valeur des revenus et des paiements des services facteurs comme le produit des placements, les intérêts et le revenu du travail, en est exclue. Les données sont généralement estimées sur la base des statistiques du commerce extérieur et ne sont pas directement comparables à celles de la balance des paiements.

Balance of Payments The Balance of payments is a statistical statement that summarizes, for a specific period, the economic transactions of an economy with the rest of the world. Transactions for the most part between residents and non-residents consist of those involving goods, services, and income; those involving financial claims on, and liabilities to, the rest of the world; and those classified as transfers which involve offsetting entries to balance, in an accounting sense, one-sided transactions. Data in this section are obtained from African Central Banks and where data are not available from national sources or if country data do not meet the required quality, IMF Country Reports are also used. Trade balance Trade balance is equal to exports less imports of goods, both measured on the « free-on-board » (f.o.b.) basis - that is, by the value of the goods at the border of the exporting country. Goods cover general merchandise, goods for processing, repairs on goods, goods procured in ports by carriers, and non-monetary gold. Current account balance Current account balance is the sum of net exports of goods and services, net income, and net current transfers.
Balance des paiements Il s’agit d’un état statistique où sont résumées, pour une période donnée, les transactions économiques avec le reste du monde. Les transactions, pour la plupart entre résidents et non-résidents, sont celles qui portent sur les biens, services et revenus ; celles qui font naître des créances financières sur le reste du monde ou des engagements financiers envers celui-ci et celles qui sont considérées comme des transferts, pour lesquels il y a lieu de passer des contre-écritures de manière à solder les transactions à sens unique. Les données proviennent des Banques centrales. Lorsque ces données ne sont pas disponibles ou de mauvaise qualité, les Rapports pays du FMI sont utilisés en remplacement. Balance commerciale Elle est égale à la différence entre les exportations et les importations de biens, évalués sur la base f.à.b (franco à bord) c’est-à-dire à la frontière du pays exportateur. Le poste des biens englobe les marchandises générales, les biens importés ou exportés pour transformation, la valeur des réparations, les biens achetés dans les ports par les transporteurs, et l’or non monétaire. Solde du compte courant La balance des comptes des opérations courantes est la somme des exportations nettes des biens et services, du revenu net et des transferts courants nets.

Capital and financial account The Capital and Financial Account is one of the major components of the Balance of payments. The capital account covers all transactions that involve the receipt of payment of capital transfers and acquisition/disposal of non-produced, non-financial assets. International reserves International reserves consist of the country’s holding of monetary gold, Special Drawing Rights (SDRs) and foreign exchange, as well as its reserve position in the International Monetary Fund (IMF). Total international reserves/average monthly imports Total reserves comprise holdings of monetary gold, special drawing rights, reserves of IMF members held by the IMF, and holdings of foreign exchange under the control of monetary authorities. The gold component of these reserves is valued at year-end (December 31) London prices. This item shows reserves expressed in terms of the number of months of imports of goods and services they could pay for [Reserves/(Imports/12)]. Exchange rates Exchange rates expressed in national currency unit per US dollar unit are reported as end period and period averages of market exchange rates and official rates. The market rate is defined as the rate determined largely by market forces; and the official rate is that determined by the authorities.
Compte des capitaux et des opérations financières Le compte capital et financier est l'une des principales composantes de la balance des paiements. Le compte de capital couvre toutes les transactions qui impliquent la réception du paiement des transferts de capital et les acquisitions / cessions d'actifs non financiers non produits. Les réserves internationales Les réserves internationales comprennent les avoirs du pays en or monétaire, droits de tirage spéciaux (DTS) et devises, ainsi que ses réserves auprès du Fonds monétaire international (FMI). Réserves internationales totales/Importations moyennes mensuelles Les réserves totales comprennent les avoirs en or monétaire, les droits de tirage spéciaux, les réserves des membres du FMI détenues par le FMI et les avoirs en devises sous le contrôle des autorités monétaires. La composante de l'or de ces réserves est évaluée en fin d'année (31 Décembre) des prix pratiqués à Londres. Cet article présente les réserves exprimées en termes du nombre de mois d'importations de biens et services dont ils pourraient payer pour [Réserves / (Imports/12)]. Le taux de change Le taux de change, exprimés en unité de monnaie nationale par rapport au dollar EU, sont les taux de fin de période et les moyennes, sur la période, des taux de change du marché et des taux officiels. Le taux du marché est défini comme le taux déterminé grosso modo par les forces du marché; le taux officiel est celui fixé par les autorités.
VI. External debt and Financial Flows Data in this section are obtained from the following international sources: IMF World Economic Outlook database, OECD Online Database and UNCTAD online database. External Debt External Debt (total outstanding debt) is the amount, at any given time, of disbursed and outstanding contractual liabilities of residents of a country to non-residents to repay principal, with or without interest, or to pay interest with or without principal. It is the sum of public and publicly-guaranteed short and long-term debt, private non-guaranteed short and long-term debt and the use of IMF credit. Official development assistance ODA relates to grants or concessional loans (i.e. with a grant element of at least 25 percent), undertaken by the official sector, whose main objective is the promotion of economic development and welfare. Data in this section are net disbursements of ODA.
VI. Dette extérieure et flux financiers Les données de cette section proviennent de sources internationales : base de données sur les «Perspectives de l’économie mondiale » du FMI, bases de données en ligne de l’OCDE et de la CNUCED. Dette extérieure totale La dette extérieure totale est le montant dû mais non remboursé, à un moment donné, par les résidents d’un pays à des non-résidents, qui se sont engagés à rembourser le principal, avec ou sans intérêt, ou à payer les intérêts avec ou sans le principal. Elle est la somme de la dette publique, de la dette garantie, de la dette privée non garantie à court et long termes, du recours au crédit du FMI. Aide publique au développement L’APD représente les dons et les prêts accordés à des conditions financières privilégiées (avec un élément de libéralité d’au moins 25%) au secteur public dans le but principal de promouvoir le développement économique et le bien-être social. Il s’agit ici des décaissements nets d’APD.

2013 Summary Résumé 2013

KeyStats 2013
Total population Female/ Femmes Urban /Urbaine Eco. active pop. /
Popul. éco. active (‘000)
(in millions) (%) (%) AMU 89.9 50.1 … 30 257 UMA CEN-SAD 563.6 50.1 41.9 196 742 CEN-SAD COMESA 458.7 50.1 34.2 178 988 COMESA EAC 146.0 50.4 19.4 61 689 CAE ECCAS 142.3 50.2 … 55 028 CEEAC ECOWAS 319.8 50.5 56.8 159 626 CEDEAO IGAD 226.9 50.0 32.4 91 663 IGAD SADC 283.7 50.3 37.9 136 879 SADC Africa 1 068 42.5 37.1 403 383 Afrique
GDP at current prices / PIB à prix courant
Real GDP Growth / Croissance réelle du
PIB
Per capita GDP / PIB par habitant
Per capita GNI / RNB par habitant
(millions US$/$ EU) (%) (US$/$ EU) (US$/ $ EU)* AMU 422,355 21.9 25,284 … UMA CEN-SAD 984,064 8.4 35,859 42 100 CEN-SAD COMESA 508,541 9.5 47,891 … COMESA EAC 103,569 5.6 3,126 2 090 CAE ECCAS 236,287 5.4 58,912 … CEEAC ECOWAS 370,943 6.1 15,580 … CEDEAO IGAD 160,311 4.2 5,162 3 590 IGAD SADC 655,142 8.4 56,973 … SADC Africa 2,006,779 8.7 1,878 Afrique

KeyStats 2013
Fiscal balance / Solde budgétaire
Trade balance /Solde commercial
Current account balance / Solde du
compte courant
External debt / Dette extérieure
Debt service / Service de la dette
(% of GDP / du PIB) (% of GDP / du PIB) (millions US$ /$ EU) (% of GDP / du PIB)* (% of exports / % des
exportations)
AMU -1.5 2.4 23,146 35.9 6.5 UMA
CEN-SAD -2.8 -11.0 7,119 29.7 6.9 CEN-SAD
COMESA -2.4 -14.8 -2,773 48.3 7 COMESA
EAC -5.3 -17.3 -142,491 … 7.2 CAE
ECCAS -1 10.7 8,425 13 5.6 CEEAC
ECOWAS -3.95 -14.3 4,236 31.5 6.3 CEDEAO
IGAD -3.5 -15.4 -168,616 0.4 8.2 IGAD
SADC -3.61 -7.5 -28,242 40.9 8.2 SADC
Africa -2.5 2.7 -299,196 22.0 9.1 Afrique
* 2012 figure / chiffre de 2012

I AMU / UMA
The Arab Maghreb Union (AMU), comprising 5 member countries,
was established in February 1989. Its objectives are to strengthen all forms of ties among its Member
States, and to gradually introduce the free circulation of goods,
services and factors of production among them.
L’Union du Maghreb Arabe (UMA), comprenant 5 Pays
Membres, fut créée en février 1980. Elle a pour objectifs de renforcer toutes formes de liens entre se
Etats, et de graduellement introduire la circulation libre des biens, des services et des facteurs
de production entre ceux-ci.

KeyStats 2013 I: AMU / UMA
0 POPULATION POPULATION 0 0.1 Total population
(in Millions) Population totale
(en Millions) 0.1
COUNTRY 2006 2007 2008 2009 2010 2011 2012 PAYS
Algeria 33.4 33.9 34.4 35.0 35.5 36.0 36.5 Algérie
Libya 5.9 6.0 6.1 6.3 6.4 6.4 6.5 Libye
Mauritania 3.1 3.2 3.3 3.4 3.5 3.5 3.6 Mauritanie
Morocco 30.7 31.0 31.3 31.6 32.0 32.3 32.6 Maroc
Tunisia 10.0 10.1 10.2 10.4 10.5 10.6 10.7 Tunisie
AMU 83.1 84.3 85.4 86.6 87.7 88.8 89.9 UMA

KeyStats 2013 I: AMU / UMA
0 POPULATION POPULATION 0 0.2 Population structure
(in percentage of total population) Structure de la population
(en pourcentage de la population totale) 0.2
COUNTRY Female / Femmes Urban / Urbaine
PAYS 2010 2011 2012 2010 2011 2012
Algeria 49.5 49.5 49.5 66.5 67.1 … Algérie
Libya 49.3 49.6 50.1 77.9 78.1 … Libye
Mauritania 49.7 49.7 49.7 41.4 41.7 … Mauritanie
Morocco 51.0 51.0 51.1 58.2 58.8 … Maroc
Tunisia 50.0 50.0 50.0 67.3 67.7 … Tunisie
AMU 49.9 50.0 50.1 62.3 62.7 … UMA

KeyStats 2013 I: AMU / UMA
0 POPULATION POPULATION 0 0.2 Population structure
(cont’d) Structure de la population
(suite) 0.2
COUNTRY
Eco. active population / Population éco. Active (Thousands)
Economically active female / male ratio
PAYS Ratio femmes / Hommes économiquement. actifs
2010 2011 2012 2010 2011 2012
Algeria 15 196 15 527 11 644 16.9 17.2 17.4 Algérie
Libya 2 418 2 465 2 308 28.2 28.5 28.8 Libye
Mauritania 1 435 1 475 1 149 26.5 26.6 26.6 Mauritanie
Morocco 12 190 12 394 11 323 26.4 26.6 26.9 Maroc
Tunisia 3 850 3 911 3 833 27.1 27.2 27.3 Tunisie
AMU 35 090 35 772 30 257 25.0 25.2 25.4 UMA

KeyStats 2013 I: AMU / UMA
1 REAL SECTOR SECTEUR REEL 1 1.1 GDP at current
(in millions of US$) PIB à prix courant
(en millions de $ EU) 1.1
COUNTRY 2007 2008 2009 2010 2011 2012 PAYS
Algeria 135 174 171 718 138 213 161 956 197862 198178 Algérie
Libya 62 668 81 376 58 762 69 823 35699 74959 Libye
Mauritania 2 928 3 585 3 027 3 614 4198 3727 Mauritanie
Morocco 75 223 88 313 90 426 90 988 99279 101275 Maroc
Tunisia 38 910 46 016 41 992 45 380 45991 44216 Tunisie
AMU 314 904 391 009 332 420 371 761 383 029 422 355 UMA
KeyStats 2013 I: AMU / UMA
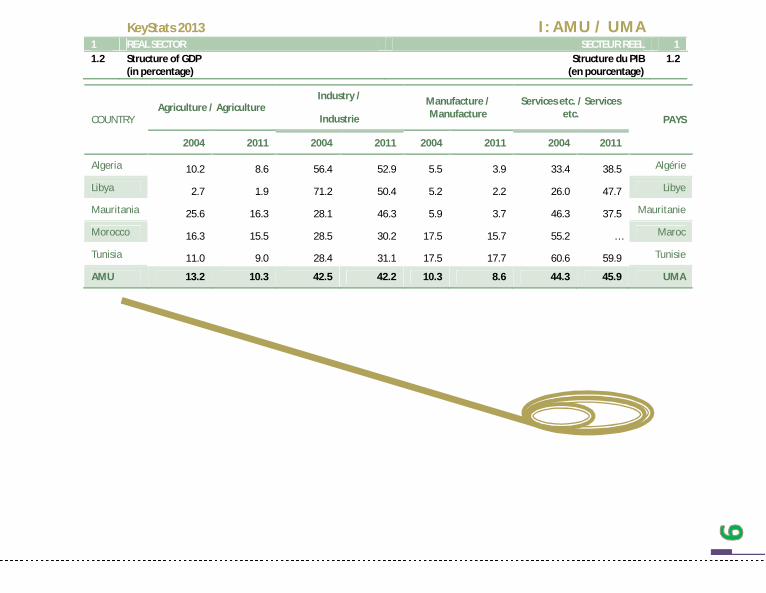
1 REAL SECTOR SECTEUR REEL 1 1.2 Structure of GDP
(in percentage) Structure du PIB
(en pourcentage) 1.2
COUNTRY Agriculture / Agriculture
Industry / Manufacture / Manufacture
Services etc. / Services etc. PAYS Industrie
2004 2011 2004 2011 2004 2011 2004 2011
Algeria 10.2 8.6 56.4 52.9 5.5 3.9 33.4 38.5 Algérie
Libya 2.7 1.9 71.2 50.4 5.2 2.2 26.0 47.7 Libye
Mauritania 25.6 16.3 28.1 46.3 5.9 3.7 46.3 37.5 Mauritanie
Morocco 16.3 15.5 28.5 30.2 17.5 15.7 55.2 … Maroc
Tunisia 11.0 9.0 28.4 31.1 17.5 17.7 60.6 59.9 Tunisie
AMU 13.2 10.3 42.5 42.2 10.3 8.6 44.3 45.9 UMA

KeyStats 2013 I: AMU / UMA
1 REAL SECTOR SECTEUR REEL 1 1.3 Real GDP Growth
(in percentage) Croissance réelle du PIB
(en pourcentage) 1.3
COUNTRY 2007 2008 2009 2010 2011 2012 PAYS
Algeria 3.0 2.4 2.4 3.3 2.4 3.2 Algérie
Libya 5.1 2.7 -0.7 4.2 -59.7 95.5 Libye
Mauritania 1.0 3.5 -1.2 5.2 4.0 4.6 Mauritanie
Morocco 2.7 5.6 4.8 3.7 4.9 2.7 Maroc
Tunisia 6.3 4.5 3.1 3.2 -1.8 3.6 Tunisie
AMU 3.6 3.7 1.7 3.9 -10.1 21.9 UMA

KeyStats 2013 I: AMU / UMA
1 REAL SECTOR SECTEUR REEL 1 1.4 Per capita GDP and GNI
(in US$) PIB et RNB par habitant
(en $ EU) 1.4
COUNTRY Current prices / Prix courant PPP / PPA GNI / RNB
PAYS 2010 2011 2012 2010 2011 2012 2010 2011 2012
Algeria 4 566 5 503 5432 7 112 7 325 … 4 390 4 470 … Algérie
Libya 10 987 5 510 11586 14 460 6 017 … 0 0 … Libye
Mauritania 1 045 1 185 1029 1 937 2 008 2520 1 000 1 000 … Mauritanie
Morocco 2 848 3 084 3107 4 794 5 080 5040 2 850 2 970 … Maroc
Tunisia 4 330 4 317 4130 9 460 9 389 9360 4 140 4 070 … Tunisie
AMU 23 775 19 599 25 284 37 762 29 819 16 920 12 380 12 510 … UMA

KeyStats 2013 I: AMU / UMA
1 REAL SECTOR SECTEUR REEL 1 1.5 Inflation
(in percentage) Inflation
(en pourcentage) 1.5
COUNTRY 2007 2008 2009 2010 2011 2012 PAYS
Algeria 3.6 4.9 5.7 4.1 4.3 9.9 Algérie
Libya 6.3 10.4 2.5 2.5 7.2 … Libye
Mauritania 7.3 7.3 2.2 5.7 6.9 4.0 Mauritanie
Morocco 2.0 3.9 1.0 0.9 0.9 1.3 Maroc
Tunisia 3.2 4.9 3.5 4.4 3.6 5.5 Tunisie
CPI national

KeyStats 2013 I: AMU / UMA
1 REAL SECTOR SECTEUR REEL 1 1.6 Inflation
(in percentage) Inflation
(en pourcentage) 1.6
Country 2007 2008 2009 2010 2011 2012 Pays
Algeria … … … … … … Algérie
Libya … … … … … … Libye
Mauritania … … … … … … Mauritanie
Morocco … … … … … … Maroc
Tunisia … … … … … … Tunisie
AMU … … … … … … UMA
Harmonized CPI

KeyStats 2013 I: AMU / UMA
2 GOVERNMENT FINANCE FINANCES PUBLIQUES 2 2.1a Total revenue plus grants
(in percentage of GDP) Recettes totales plus dons
(en pourcentage du PIB) 2.1a
COUNTRY 2005 2008 2009 2010 2011 2012 PAYS
Algeria 40.8 41.4 36.6 36.4 … … Algérie
Libya 62.9 69.9 56.7 67.8 … … Libye
Mauritania 26.6 22.1 25.5 26.5 … … Mauritanie
Morocco 25.1 29.5 27.2 25.2 … … Maroc
Tunisia 22.2 26.5 23.4 23.4 24.3 … Tunisie
AMU 35.5 37.9 33.9 35.8 … UMA

KeyStats 2013 I: AMU / UMA
2 GOVERNMENT FINANCE FINANCES PUBLIQUES 2 2.1b Total revenue
(in percentage of GDP) Recettes totales
(en pourcentage du PIB) 2.1b
COUNTRY 2005 2008 2009 2010 2011 2012 PAYS
Algeria 40.8 41.4 36.6 36.4 40.5 39.9 Algérie
Libya 62.9 69.9 56.7 67.8 37.9 50.2 Libye
Mauritania 26.6 22.1 25.5 26.5 27.4 27.9 Mauritanie
Morocco 25.1 29.5 27.2 25.2 26.4 26.0 Maroc
Tunisia 22.2 26.5 23.4 23.4 24.3 25.0 Tunisie
AMU 35.5 37.9 33.9 35.8 31.3 33.8 UMA

KeyStats 2013 I: AMU / UMA
2 GOVERNMENT FINANCE FINANCES PUBLIQUES 2 2.2 Total expenditure
(in percentage of GDP) Dépenses totales
(en pourcentage du PIB) 2.2
COUNTRY 2005 2008 2009 2010 2011 2012 PAYS
Algeria 27.2 35.4 43.1 38.5 41.8 43.2 Algérie
Libya 33.5 43.0 50.7 57.1 53.5 37.2 Libye
Mauritania 33.7 29.5 30.6 28.4 28.9 31.6 Mauritanie
Morocco 22.6 29.1 29.4 29.8 33.2 33.6 Maroc
Tunisia 24.5 27.3 26.1 24.6 24.5 31.0 Tunisie
AMU 141.5 164.3 179.9 178.4 181.9 176.6 UMA

KeyStats 2013 I: AMU / UMA
2 GOVERNMENT FINANCE FINANCES PUBLIQUES 2 2.3 Fiscal balance
(Surplus+ / Deficit-) (in percentage of GDP)
Solde budgétaire (Excédent+ / Déficit-)
(en pourcentage du PIB)
2.2
COUNTRY 2005 2008 2009 2010 2011 2012 PAYS
Algeria 13.6 6.0 -6.5 -2.1 -1.3 -3.3 Algérie
Libya 29.4 26.9 6.0 10.7 -15.6 13.1 Libye
Mauritania -7.1 -7.4 -5.1 -1.9 -1.5 -3.6 Mauritanie
Morocco 2.5 0.4 -2.2 -4.6 -6.8 -7.5 Maroc
Tunisia -2.3 -0.8 -2.7 -1.3 -0.2 -6.0 Tunisia
AMU 7.2 5.0 -2.1 0.1 -5.1 -1.5 UMA

KeyStats 2013 I: AMU / UMA
3 MONETARY AND FINANCIAL SECTOR SECTEUR MONETAIRE ET FINANCIER 3 3.1 Money (M1)
(in millions of US$) Monnaie (M1)
(en millions de DEU) 3.1
COUNTRY 2007 2008 2009 2010 2011 2012 PAYS
Algeria 3 689 4 335 4 490 4 903 5 859 ... Algérie
Libya 22 014 33 323 37 392 ... ... ... Libye
Mauritania 171 057 203 056 232 111 ... ... ... Mauritanie
Morocco 428 959 452 624 478 332 511 110 537 627 ... Maroc
Tunisia 1983270 1837240 2146320 2505910 ... ... Tunisie

KeyStats 2013 I: AMU / UMA
3 MONETARY AND FINANCIAL SECTOR SECTEUR MONETAIRE ET FINANCIER 3 3.2 Money plus quasi-money (M2)
(in millions of US$) Monnaie plus quasi-monnaie (M2)
(en millions de DEU) 3.2
COUNTRY 2007 2008 2009 2010 2011 2012 PAYS
Algeria 1 927 2 161 2 229 2 524 2 732 3 191 Algérie
Libya 3 894 5 330 7 992 5 030 4 504 5 036 Libye
Mauritania 40 501 37 576 45 924 48 810 50 329 47 170 Mauritanie
Morocco 226 892 287 344 298 490 319 022 329 675 347 259 Maroc
Tunisia 16 539 19 278 21 427 23 961 24 524 25 724 Tunisie

KeyStats 2013 I: AMU / UMA
3 MONETARY AND FINANCIAL SECTOR SECTEUR MONETAIRE ET FINANCIER 3 3.3 Domestic credit
(in percentage of GDP) Crédit intérieur
(en pourcentage du PIB) 3.3
COUNTRY
provided by banking sector / provenant du secteur bancaire to private sector /
PAYS au secteur privé 2009 2010 2011 2009 2010 2011
Algeria -9.04 -6.45 -4.47 16.50 15.58 14.05 Algérie
Libya -65.93 … … 10.9 … … Libye
Mauritania 52.89 45.99 41.85 31.12 28.02 26.27 Mauritanie
Morocco 99.93 104.25 111.13 64.68 68.67 71.99 Maroc
Tunisia 68.18 73.57 82.05 62.03 68.60 75.47 Tunisie
AMU 29.2 54.3 57.6 37.0 45.2 46.9 UMA

KeyStats 2013 I: AMU / UMA
3 MONETARY AND FINANCIAL SECTOR SECTEUR MONETAIRE ET FINANCIER 3 3.4 Interest rates
(in percentage) Taux d’intérêts
(en pourcentage) 3.4
COUNTRY Deposit rate / Taux de dépôts Discount rate / Taux d’escompte
PAYS 2009 2010 2011 2009 2010 2011
Algeria 1.75 1.75 … 6.25 6.25 … Algérie
Libya 2.50 2.50 … 3.50 3.50 … Libye
Mauritania 8.00 8.00 … 0.80 0.53 … Mauritanie
Morocco 3.81 3.69 … … … … Maroc
Tunisia … … … … … … Tunisie
AMU 4.01 3.99 … 3.52 3.43 … UMA

KeyStats 2013 I: AMU / UMA
4 EXTERNAL SECTOR SECTEUR EXTERIEUR 4 4.1 Imports
(in % of GDP) Importations
(en % du PIB) 4.1
COUNTRY 2007 2008 2009 2010 2011 2012 PAYS
Algeria 23.29 22.91 24.82 21.52 … … Algérie
Libya 29.35 27.47 … … … … Libye
Mauritania 61.19 77.49 59.99 69.30 74.76 94.25 Mauritanie
Morocco 44.86 50.87 39.69 42.93 48.49 49.50 Maroc
Tunisia 53.09 59.38 48.37 54.87 55.85 58.61 Tunisie
AMU 42.36 47.62 43.22 47.16 59.70 67.45 UMA

KeyStats 2013 I: AMU / UMA
4 EXTERNAL SECTOR SECTEUR EXTERIEUR 4 4.2 Exports
(in % of GDP) Exportations
(en % du PIB) 4.2
COUNTRY 2007 2008 2009 2010 2011 2012 PAYS
Algeria 46.61 46.27 29.29 30.87 … … Algérie
Libya 67.56 67.38 … … … … Libye
Mauritania 43.18 55.77 45.00 56.29 64.69 58.02 Mauritanie
Morocco 35.75 37.48 28.70 33.01 34.94 36.87 Maroc
Tunisia 51.18 56.32 45.67 50.11 48.85 47.96 Tunisie
AMU 48.85 52.65 37.17 42.57 49.50 47.62 UMA

KeyStats 2013 I: AMU / UMA
4 EXTERNAL SECTOR SECTEUR EXTERIEUR 4 4.3 Trade balance
(in % of GDP) Solde commercial
(en % du PIB) 4.3
COUNTRY 2007 2008 2009 2010 2011 2012 PAYS
Algeria 25.2 23.3 5.6 8.1 9.0 14.1 Algérie
Libya 39.2 50.6 25.6 32.9 18.0 40.7 Libye
Mauritania 0.8 -4.3 -2.7 11.0 14.7 -7.9 Mauritanie
Morocco -18.7 -21.5 -17.9 -21.1 -22.7 -24.6 Maroc
Tunisia -7.4 -8.9 -8.5 -12.3 -10.8 -10.1 Tunisie
AMU 7.8 7.8 0.4 3.7 1.6 2.4 UMA
KeyStats 2013 I: AMU / UMA
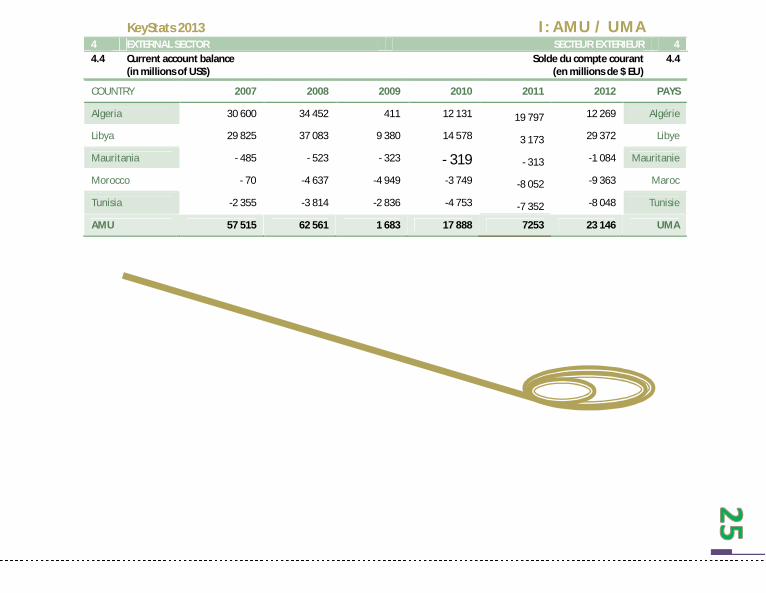
4 EXTERNAL SECTOR SECTEUR EXTERIEUR 4 4.4 Current account balance
(in millions of US$) Solde du compte courant
(en millions de $ EU) 4.4
COUNTRY 2007 2008 2009 2010 2011 2012 PAYS
Algeria 30 600 34 452 411 12 131 19 797 12 269 Algérie
Libya 29 825 37 083 9 380 14 578 3 173 29 372 Libye
Mauritania - 485 - 523 - 323 - 319 - 313 -1 084 Mauritanie
Morocco - 70 -4 637 -4 949 -3 749 -8 052 -9 363 Maroc
Tunisia -2 355 -3 814 -2 836 -4 753 -7 352 -8 048 Tunisie
AMU 57 515 62 561 1 683 17 888 7253 23 146 UMA
KeyStats 2013 I: AMU / UMA
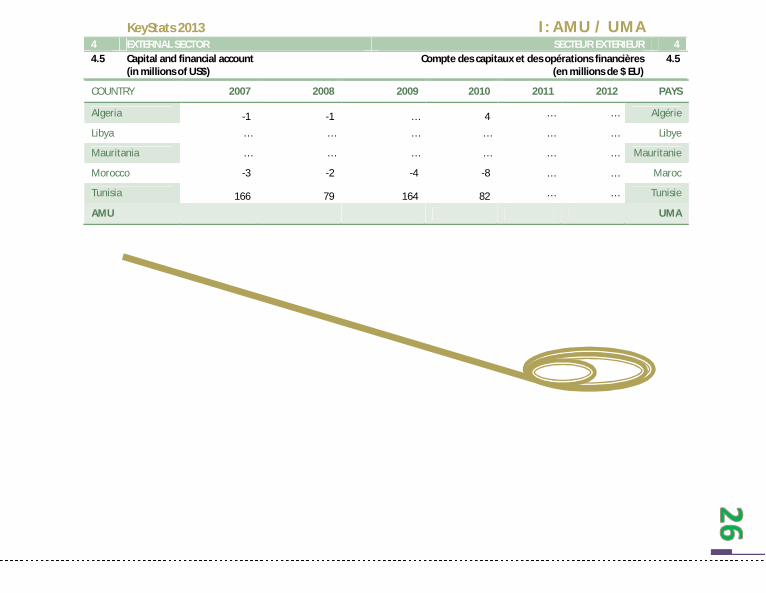
4 EXTERNAL SECTOR SECTEUR EXTERIEUR 4 4.5 Capital and financial account
(in millions of US$) Compte des capitaux et des opérations financières
(en millions de $ EU) 4.5
COUNTRY 2007 2008 2009 2010 2011 2012 PAYS
Algeria -1 -1 … 4 … … Algérie
Libya … … … … … … Libye
Mauritania … … … … … … Mauritanie
Morocco -3 -2 -4 -8 … … Maroc
Tunisia 166 79 164 82 … … Tunisie
AMU UMA

KeyStats 2013 I: AMU / UMA
4 EXTERNAL SECTOR SECTEUR EXTERIEUR 4 4.6 International financial flows
(in millions of US$) Flux financiers internationaux
(en millions de $ EU) 4.6
COUNTRY
Official development assistance (net) / Appui public au développement (net)
Net foreign direct investment /
PAYS Investissement direct étranger net
2009 2010 2011 2009 2010 2011
Algeria 238.7 238.2 199.9 2 746 2 264 2 571 Algérie
Libya 41.1 8.5 642.2 3 310 1 909 0 Libye
Mauritania 373.5 374.4 381.1 - 3 131 45 Mauritanie
Morocco 929.6 992.5 1427.4 1 952 1 574 2 519 Maroc
Tunisia 502.8 550.4 918.3 1 688 1 513 1 143 Tunisie
AMU 2 086 2 164 3568.8 9 693 7 390 6 278 UMA
KeyStats 2013 I: AMU / UMA
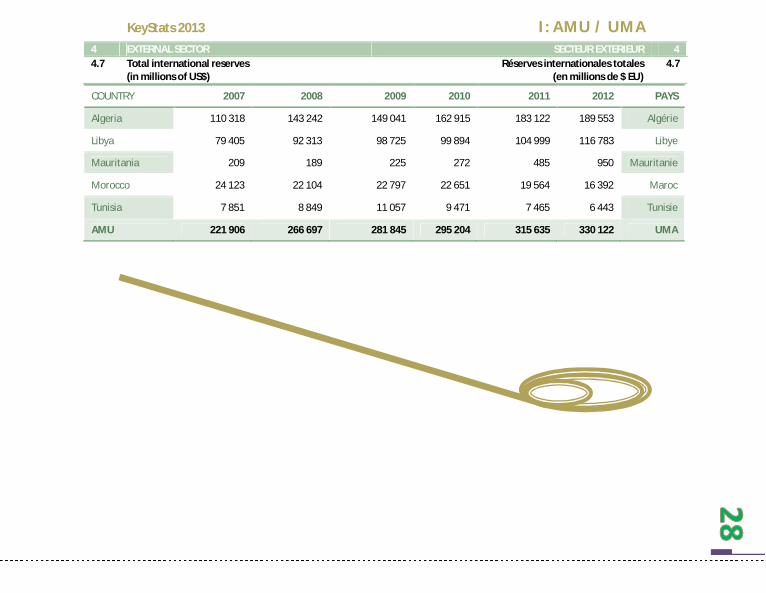
4 EXTERNAL SECTOR SECTEUR EXTERIEUR 4 4.7 Total international reserves
(in millions of US$) Réserves internationales totales
(en millions de $ EU) 4.7
COUNTRY 2007 2008 2009 2010 2011 2012 PAYS
Algeria 110 318 143 242 149 041 162 915 183 122 189 553 Algérie
Libya 79 405 92 313 98 725 99 894 104 999 116 783 Libye
Mauritania 209 189 225 272 485 950 Mauritanie
Morocco 24 123 22 104 22 797 22 651 19 564 16 392 Maroc
Tunisia 7 851 8 849 11 057 9 471 7 465 6 443 Tunisie
AMU 221 906 266 697 281 845 295 204 315 635 330 122 UMA

KeyStats 2013 I: AMU / UMA
4 EXTERNAL SECTOR SECTEUR EXTERIEUR 4 4.8 Total international reserves / average monthly
imports (ratio) Réserves internationales totales / Importations moyennes
mensuelles (ratio) 4.8
COUNTRY 2007 2008 2009 2010 2011 2012 PAYS
Algeria 0.05 0.04 0.04 … … … Algérie
Libya 120.08 130.31 105.81 … … … Libye
Mauritania 0.59 0.37 0.60 0.53 … … Mauritanie
Morocco 9.08 6.30 8.34 7.67 … … Maroc
Tunisia 4.93 4.32 6.92 … … … Tunisie
AMU 26.95 28.27 24.34 … … … UMA

KeyStats 2013 I: AMU / UMA
4 EXTERNAL SECTOR SECTEUR EXTERIEUR 4 4.9 Exchange rate
(National currency / US$) Taux de change
(Monnaie nationale / $ EU) 4.9
COUNTRY
Average Exchange Rate (Nati. Currency per us$)
Taux de change (moyen) (monnaie nat. par dollars) PAYS
2007 2008 2009 2010 2011 2012
Algeria 69.29 64.58 72.60 74.40 … … Algérie
Libya 1.26 1.22 1.25 1.30 … … Libye
Mauritania 250.60 238.20 262.40 275.90 … … Mauritanie
Morocco 8.19 7.80 8.10 8.40 … … Maroc
Tunisia 1.28 1.20 1.40 1.40 … … Tunisie

KeyStats 2013 I: AMU / UMA
4 EXTERNAL SECTOR SECTEUR EXTERIEUR 4 4.10 Total public external debt
(in percentage of GDP) Dette publique extérieure totale
(en pourcentage du PIB) 4.10
COUNTRY 2007 2008 2009 2010 2011 2012 PAYS
Algeria 3.9 3.4 3.2 2.0 2.1 2.0 Algérie
Libya 4.3 3.4 4.6 3.7 … 7.4 Libye
Mauritania 118.9 108.9 123.6 75.5 56.9 93.0 Mauritanie
Morocco 22.0 21.5 23.9 23.7 24.0 24.3 Maroc
Tunisia 39.2 34.6 36.1 32.9 50.5 52.8 Tunisie
AMU 37.6 34.3 38.3 27.6 33.4 35.9 UMA

KeyStats 2013 I: AMU / UMA
4 EXTERNAL SECTOR SECTEUR EXTERIEUR 4 4.11 Debt service
(in percentage of exports) Service de la dette
(en pourcentage des exportations) 4.11
COUNTRY 2007 2008 2009 2010 2011 2012 PAYS
Algeria 2.00 1.43 1.92 1.05 4.2 2.2 Algérie
Libya … … … … … … Libye
Mauritania 7.42 3.08 4.81 12.8 32.6 6.4 Mauritanie
Morocco 9.9 7.8 7.5 6.6 6.1 6.5 Maroc
Tunisia 45.1 40.1 55.3 54.5 55.9 10.7 Tunisie
AMU 16.10 13.09 17.39 18.76 24.70 6.45 UMA
KeyStats 2013 I: AMU / UMA
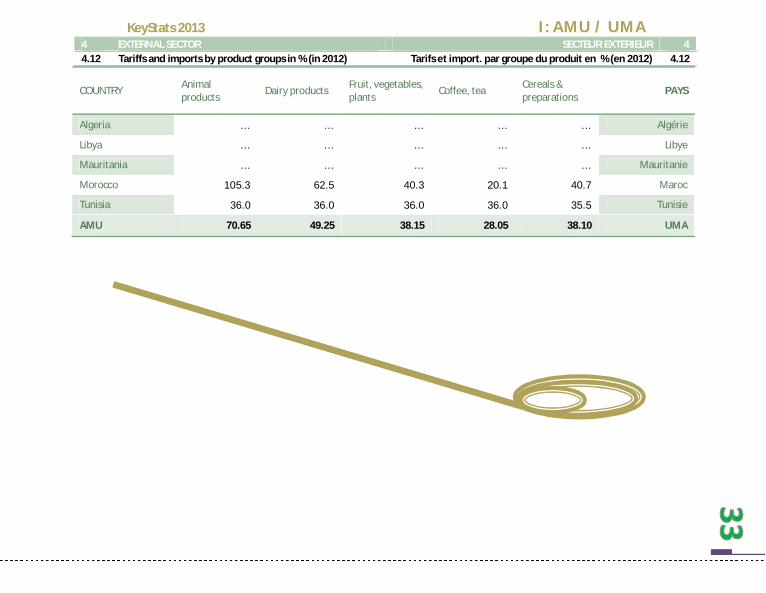
4 EXTERNAL SECTOR SECTEUR EXTERIEUR 4 4.12 Tariffs and imports by product groups in % (in 2012) Tarifs et import. par groupe du produit en % (en 2012) 4.12
COUNTRY Animal products
Dairy products Fruit, vegetables, plants
Coffee, tea Cereals & preparations
PAYS
Algeria … … … … … Algérie
Libya … … … … … Libye
Mauritania … … … … … Mauritanie
Morocco 105.3 62.5 40.3 20.1 40.7 Maroc
Tunisia 36.0 36.0 36.0 36.0 35.5 Tunisie
AMU 70.65 49.25 38.15 28.05 38.10 UMA

KeyStats 2013 I: AMU / UMA
4 EXTERNAL SECTOR SECTEUR EXTERIEUR 4 4.12 Tariffs and imports by product groups in % (in 2012) Tarifs et import. par groupe du produit en % (en 2012) 4.12
COUNTRY Oilseeds, fats & oils
Sugars and confectionery
Beverages & tobacco
Cotton Other
agricultural products
PAYS
Algeria … … … … … Algérie
Libya … … … … … Libye
Mauritania … … … … … Mauritanie
Morocco 20.8 27.9 34.8 2.5 14.5 Maroc
Tunisia 31.4 36.0 35.5 0.0 24.1 Tunisie
AMU 26.10 31.95 35.15 1.25 19.30 UMA
COUNTRY Fish & fish products Minerals & metals Petroleum Chemicals PAYS
Algeria … … … … Algérie
Libya … … … … Libye
Mauritania … … … … Mauritanie
Morocco 15.8 8.9 14.3 5.4 Maroc
Tunisia 34.8 9.3 6.3 5.3 Tunisie
AMU 25.30 9.10 10.30 5.35 UMA
KeyStats 2013 I: AMU / UMA
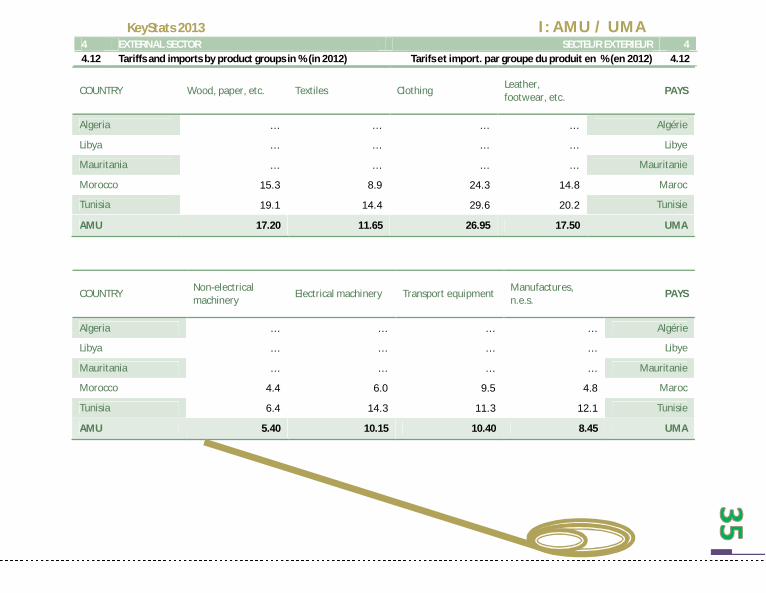
4 EXTERNAL SECTOR SECTEUR EXTERIEUR 4 4.12 Tariffs and imports by product groups in % (in 2012) Tarifs et import. par groupe du produit en % (en 2012) 4.12
COUNTRY Wood, paper, etc. Textiles Clothing Leather, footwear, etc.
PAYS
Algeria … … … … Algérie
Libya … … … … Libye
Mauritania … … … … Mauritanie
Morocco 15.3 8.9 24.3 14.8 Maroc
Tunisia 19.1 14.4 29.6 20.2 Tunisie
AMU 17.20 11.65 26.95 17.50 UMA
COUNTRY Non-electrical machinery
Electrical machinery Transport equipment Manufactures, n.e.s.
PAYS
Algeria … … … … Algérie
Libya … … … … Libye
Mauritania … … … … Mauritanie
Morocco 4.4 6.0 9.5 4.8 Maroc
Tunisia 6.4 14.3 11.3 12.1 Tunisie
AMU 5.40 10.15 10.40 8.45 UMA
KeyStats 2013 I: AMU / UMA
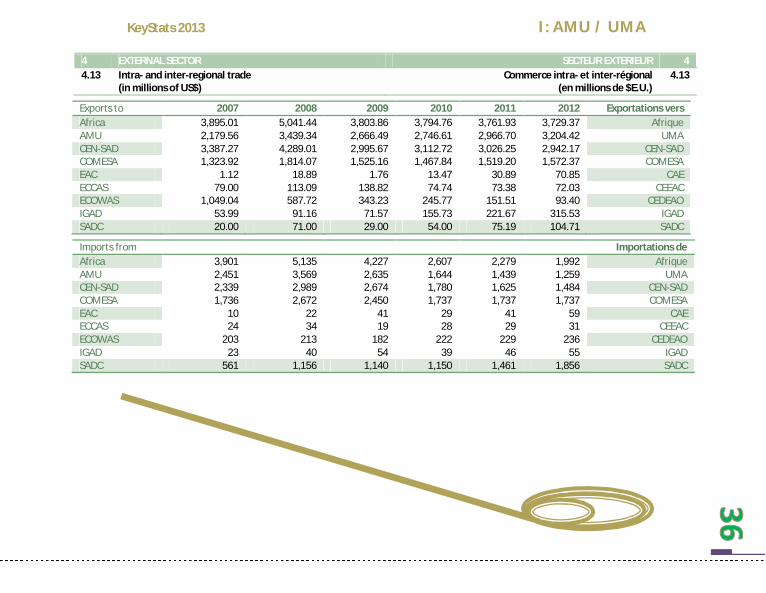
4 EXTERNAL SECTOR SECTEUR EXTERIEUR 4 4.13 Intra- and inter-regional trade
(in millions of US$) Commerce intra- et inter-régional
(en millions de $E.U.) 4.13
Exports to 2007 2008 2009 2010 2011 2012 Exportations vers Africa 3,895.01 5,041.44 3,803.86 3,794.76 3,761.93 3,729.37 Afrique AMU 2,179.56 3,439.34 2,666.49 2,746.61 2,966.70 3,204.42 UMA CEN-SAD 3,387.27 4,289.01 2,995.67 3,112.72 3,026.25 2,942.17 CEN-SAD COMESA 1,323.92 1,814.07 1,525.16 1,467.84 1,519.20 1,572.37 COMESA EAC 1.12 18.89 1.76 13.47 30.89 70.85 CAE ECCAS 79.00 113.09 138.82 74.74 73.38 72.03 CEEAC ECOWAS 1,049.04 587.72 343.23 245.77 151.51 93.40 CEDEAO IGAD 53.99 91.16 71.57 155.73 221.67 315.53 IGAD SADC 20.00 71.00 29.00 54.00 75.19 104.71 SADC
Imports from Importations de Africa 3,901 5,135 4,227 2,607 2,279 1,992 Afrique AMU 2,451 3,569 2,635 1,644 1,439 1,259 UMA CEN-SAD 2,339 2,989 2,674 1,780 1,625 1,484 CEN-SAD COMESA 1,736 2,672 2,450 1,737 1,737 1,737 COMESA EAC 10 22 41 29 41 59 CAE ECCAS 24 34 19 28 29 31 CEEAC ECOWAS 203 213 182 222 229 236 CEDEAO IGAD 23 40 54 39 46 55 IGAD SADC 561 1,156 1,140 1,150 1,461 1,856 SADC
II CEN-SAD
With currently 28 Member States, CEN-SAD’s objective is to establish a comprehensive economic union,
as well as to eliminate all obstacles impeding the unity of its members. It was created in February 1998.
Avec actuellement 28 Etats Membres, la Communauté des Etats sahélo-
sahariens (CEN-SAD) a pour objectifs de mettre en place une union
économique complète, et d’éliminer tous les obstacles pouvant entraver l’unité de ses membres. Elle fut créé
en février 1998

KeyStats 2013 II: CEN-SAD
0 POPULATION POPULATION 0 0.1 Total population
(in millions) Population totale
(en millions) 0.1
COUNTRY 2007 2008 2009 2010 2011 2012 PAYS Benin 8.0 8.2 8.5 8.8 9.1 9.4 Bénin Burkina Faso 14.3 14.7 15.2 15.7 16.2 17.4 Burkina Faso CAR 4.2 4.2 4.3 4.4 4.5 4.5 RCA Chad 10.4 10.7 10.9 11.2 11.5 11.8 Tchad Comoros 0.7 0.7 0.7 0.7 0.8 0.7 Comores Côte d’Ivoire 18.6 19.0 19.4 19.7 20.2 20.5 Côte d’Ivoire Djibouti 0.8 0.9 0.9 0.9 0.9 0.9 Djibouti Egypt 76.9 78.3 79.7 81.1 82.5 83.9 Egypte Eritrea 4.8 4.9 5.1 5.3 5.4 5.5 Érythrée Gambia, The 1.6 1.6 1.7 1.7 1.8 1.8 Gambie Ghana 22.7 23.3 23.8 24.4 25.0 25.5 Ghana Guinea 9.6 9.9 10.2 10.5 10.9 10.4 Guinée Guinea Bissau 1.4 1.5 1.5 1.5 1.5 1.5 Guinée Bissau Kenya 37.5 38.5 38.6 40.5 41.6 42.7 Kenya Liberia 3.5 3.5 3.6 3.7 3.8 4.2 Libéria Libya 6.0 6.1 6.3 6.4 6.4 6.4 Libye Mali 14.0 14.5 14.9 15.4 15.8 16.3 Mali Mauritania 3.2 3.3 3.4 3.5 3.5 3.3 Mauritanie Morocco 31.0 31.3 31.6 32.0 32.3 32.5 Maroc Niger 13.7 14.2 14.7 15.2 15.7 16.6 Niger Nigeria 147.0 150.7 154.5 158.4 162.5 166.6 Nigéria São Tomé 0.2 0.2 0.2 0.2 0.2 0.1 São Tomé Senegal 11.5 11.8 12.2 12.5 12.9 13.1 Sénégal Sierra Leone 5.5 5.6 5.7 5.9 6.0 6.1 Sierra Leone Somalia 8.7 8.9 9.1 9.3 9.6 9.7 Somalie Sudan 37.2 39.2 40.3 41.8 34.0* 35.3 Soudan Togo 5.7 5.8 5.9 6.0 6.2 6.2 Togo Tunisia 10.1 10.2 10.4 10.5 10.6 10.7 Tunisie CEN-SAD 508.8 521.7 533.2 547.2 551.2 563.6 CEN-SAD

KeyStats 2013 II: CEN-SAD
0 POPULATION POPULATION 0 0.2 Population structure
(in percentage of total population) Structure de la population
(en pourcentage de la population totale) 0.2
COUNTRY Female / Femmes Urban / Urbaine
PAYS 2010 2011 2012 2010 2011 2012
Benin 51.0 51.0 50.6 44.1 44.9 45,7 Bénin Burkina Faso 51.8 51.8 50.3 24.0 24,7 25.4 Burkina Faso CAR 50.7 50.7 50.7 38.9 39.2 39.5 RCA Chad 50.3 50.3 50.3 27.6 28.2 28.81 Tchad Comoros 49.6 49.6 49.6 28.2 28.3 28.40 Comores Côte d’Ivoire 49.0 49.1 49.1 50.6 51.3 52,1 Côte d’Ivoire Djibouti 50.0 50.0 50 76.2 76.3 76,3 Djibouti Egypt 49.8 49.8 49.8 43.4 43.5 43.60 Egypte Eritrea 50.7 50.7 50.7 21.6 22.1 22.61 Erythrée Gambia, The 50.6 50.6 50.6 58.1 58.9 59.71 Gambie Ghana 49.1 49.1 49.1 51.5 52.2 50,9 Ghana Guinea 51.0 51.0 49.5 35.4 35.9 36,3 Guinée Guinea Bissau 50.4 50.4 50.4 30.0 30.2 30.40 Guinée Bissau Kenya ... ... 50 22.2 22.5 22.80 Kenya Liberia 49.6 49.6 49.7 47.8 48.2 48.60 Libéria Libya 49.3 49.6 50.1 77.9 78.1 78.30 Libye Mali 50.0 50.0 50 35.9 36.6 37.31 Mali Mauritania 49.7 49.7 49.7 41.4 41.7 42.00 Mauritanie Morocco 51.0 51.0 51.1 58.2 58.8 59.41 Maroc Niger 50.1 50.1 49.7 20.4 21.0 21,7 Niger Nigeria 49.4 49.4 49.3 49.8 50.5 51.21 Nigéria São Tomé 50.5 50.5 50.5 62.2 63.0 63,1 São Tomé Senegal 50.5 50.5 50.4 42.2 42.3 42,4 Sénégal Sierra Leone 51.2 51.1 51.1 38.4 38.8 41,2 Sierra Leone Somalia 50.4 50.4 50.4 37.4 37.9 40.0 Somalie Sudan 48.8 49.2* 49.6 40.1 33.3* 27.65 Soudan Togo 50.5 50.5 50.5 43.4 44.1 37,7 Togo Tunisia 50.0 50.0 50 67.3 67.7 68.10 Tunisie CEN-SAD 50.2 50.2 50.1 43.4 44.3 41.9 CEN-SAD

KeyStats 2013 II: CEN-SAD
POPULATION POPULATION 0 0.2 Population structure (cont’d)
(in percentage of total population) Structure de la population (suite)
(en pourcentage de la population totale) 0.2
COUNTRY Eco. active population / Population éco.
Active (Thousands) Economically active female / male ratio
PAYS Ratio femmes / Hommes économiquement. actifs
2010 2011 2012 2010 2011 2012 Benin 3 462 3 570 3 685 48 48 48 Bénin Burkina Faso 7 369 7 588 7 821 48 48 48 Burkina Faso CAR 1 936 1 984 2 035 47 47 47 RCA Chad 4 214 4 335 4 335 45 45 45 Tchad Comoros 234 240 247 30 31 31 Comores Côte d’Ivoire 7 369 7 570 7 785 38 38 38 Côte d’Ivoire Djibouti 289 298 307 35 35 35 Djibouti Egypt 26 643 27 289 27 929 24 24 25 Egypte Eritrea 2 534 2 616 2 700 49 49 49 Érythrée Gambia, The 724 747 772 48 48 48 Gambie Ghana 9 885 10 163 10 450 48 48 48 Ghana Guinea 5 056 5 213 4 162 45 45 45 Guinée Guinea Bissau 624 639 656 47 47 47 Guinée Bissau Kenya 14 860 15 335 15 815 46 46 46 Kenya Liberia 1 375 1 426 1 416 48 48 48 Libéria Libya 2 333 2 328 2 308 28 29 29 Libye Mali 4 220 4 362 4 513 35 35 35 Mali Mauritania 1 085 1 117 1 149 27 27 27 Mauritanie Morocco 10 956 11 138 11 323 26 27 27 Maroc Niger 4 956 5 135 5 325 31 31 31 Niger Nigeria 47 331 48 648 50 035 43 43 43 Nigéria São Tomé 57 59 61 38 38 38 São Tomé Senegal 5 678 5 855 5 560 44 44 44 Sénégal Sierra Leone 2 221 2 273 2 273 51 51 51 Sierra Leone Somalia 2 867 2 933 3 007 34 34 34 Somalie Sudan 13 991 14 437 14 255 29 29 30 Soudan Togo 2 823 2 903 2 985 51 51 50 Togo Tunisia 3 698 3 766 3 833 27 27 27 Tunisie CEN-SAD 188 790 193 967 196 742 40 40 40 CEN-SAD
KeyStats 2013 II: CEN-SAD
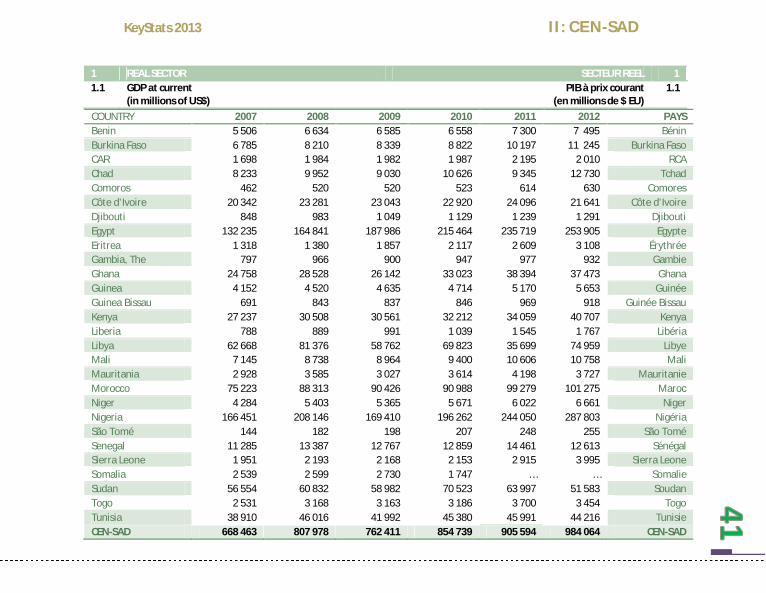
1 REAL SECTOR SECTEUR REEL 1 1.1 GDP at current
(in millions of US$) PIB à prix courant
(en millions de $ EU) 1.1
COUNTRY 2007 2008 2009 2010 2011 2012 PAYS Benin 5 506 6 634 6 585 6 558 7 300 7 495 Bénin Burkina Faso 6 785 8 210 8 339 8 822 10 197 11 245 Burkina Faso CAR 1 698 1 984 1 982 1 987 2 195 2 010 RCA Chad 8 233 9 952 9 030 10 626 9 345 12 730 Tchad Comoros 462 520 520 523 614 630 Comores Côte d’Ivoire 20 342 23 281 23 043 22 920 24 096 21 641 Côte d’Ivoire Djibouti 848 983 1 049 1 129 1 239 1 291 Djibouti Egypt 132 235 164 841 187 986 215 464 235 719 253 905 Egypte Eritrea 1 318 1 380 1 857 2 117 2 609 3 108 Érythrée Gambia, The 797 966 900 947 977 932 Gambie Ghana 24 758 28 528 26 142 33 023 38 394 37 473 Ghana Guinea 4 152 4 520 4 635 4 714 5 170 5 653 Guinée Guinea Bissau 691 843 837 846 969 918 Guinée Bissau Kenya 27 237 30 508 30 561 32 212 34 059 40 707 Kenya Liberia 788 889 991 1 039 1 545 1 767 Libéria Libya 62 668 81 376 58 762 69 823 35 699 74 959 Libye Mali 7 145 8 738 8 964 9 400 10 606 10 758 Mali Mauritania 2 928 3 585 3 027 3 614 4 198 3 727 Mauritanie Morocco 75 223 88 313 90 426 90 988 99 279 101 275 Maroc Niger 4 284 5 403 5 365 5 671 6 022 6 661 Niger Nigeria 166 451 208 146 169 410 196 262 244 050 287 803 Nigéria São Tomé 144 182 198 207 248 255 São Tomé Senegal 11 285 13 387 12 767 12 859 14 461 12 613 Sénégal Sierra Leone 1 951 2 193 2 168 2 153 2 915 3 995 Sierra Leone Somalia 2 539 2 599 2 730 1 747 … … Somalie Sudan 56 554 60 832 58 982 70 523 63 997 51 583 Soudan Togo 2 531 3 168 3 163 3 186 3 700 3 454 Togo Tunisia 38 910 46 016 41 992 45 380 45 991 44 216 Tunisie CEN-SAD 668 463 807 978 762 411 854 739 905 594 984 064 CEN-SAD

KeyStats 2013 II: CEN-SAD
1 REAL SECTOR SECTEUR REEL 1 1.2 Structure of GDP
(in percentage) Structure du PIB
(en pourcentage) 1.2
COUNTRY Agriculture / Agriculture
Industry / Manufacture / Manufacture
Services etc. / Services etc. PAYS Industrie
2004 2011 2004 2011 2004 2011 2004 2011 Benin 35.9 36.9 14.8 14.7 8.7 8.5 49.2 48.3 Bénin Burkina Faso 34.5 33.7 21.2 25.4 14.4 7.5 44.3 40.8 Burkina Faso CAR 55.7 54.1 14.1 13.8 6.1 6.6 30.2 32.1 RCA Chad 28.9 16.2 31.1 43.4 7.0 5.6 39.9 40.3 Tchad Comoros 41.1 39.6 11.1 11.8 4.2 5.2 47.1 48.6 Comores Côte d’Ivoire 25.3 32.1 25.2 25.3 14.6 13.1 49.5 42.6 Côte d’Ivoire Djibouti 3.5 3.7 16.2 22.4 2.6 2.6 80.2 73.9 Djibouti Egypt 15.2 14.5 36.9 37.6 18.3 16.5 48.0 47.9 Egypte Eritrea 11.6 17.0 21.3 24.1 9.3 6.1 67.1 58.9 Érythrée Gambia, The 29.6 23.7 15.0 15.5 6.2 6.1 55.4 60.8 Gambie Ghana 41.5 25.6 27.1 25.9 9.6 6.7 31.4 48.5 Ghana Guinea 25.1 20.6 32.8 42.7 6.1 7.4 42.2 36.7 Guinée Guinea Bissau 43.4 47.8 16.1 13.0 13.9 11.3 40.5 39.2 Guinée Bissau Kenya 28.0 27.7 18.2 17.1 11.2 10.7 53.7 55.1 Kenya Liberia 74.7 73.3 9.3 11.8 5.1 6.0 16.0 14.9 Libéria Libya 2.7 1.9 71.2 50.4 5.2 2.2 26.6 47.7 Libye Mali 38.8 39.2 24.0 22.2 10.4 6.4 38.0 38.6 Mali Mauritania 25.6 16.3 28.1 46.3 5.9 3.7 46.3 37.5 Mauritanie Morocco 16.3 15.5 28.5 30.2 17.5 15.7 55.2 54.3 Maroc Niger 43.9 43.1 13.0 16.0 6.7 5.5 43.2 40.9 Niger Nigeria 34.2 31.1 42.1 44.3 3.1 1.9 23.7 24.7 Nigéria São Tomé 21.0 22.0 18.0 17.7 7.6 7.1 61.0 60.2 São Tomé Senegal 15.9 14.8 24.9 25.0 16.3 14.8 59.2 60.2 Sénégal Sierra Leone 51.8 57.6 12.6 8.4 2.8 2.4 35.6 33.9 Sierra Leone Somalia … … … … … … … … Somalie Sudan 35.2 34.8 20.9 27.7 8.4 8.9 43.8 37.5 Soudan Togo 39.7 47.0 18.8 18.4 9.0 8.3 41.5 34.6 Togo Tunisia 11.0 9.0 28.4 31.1 17.5 17.7 60.6 59.9 Tunisie CEN-SAD 30.7 29.6 23.7 25.3 9.2 7.9 45.5 45.1 CEN-SAD

KeyStats 2013 II: CEN-SAD
REAL SECTOR SECTEUR REEL 1 1.3 Real GDP Growth
(in percentage) Croissance réelle du PIB
(en pourcentage) 1.3
COUNTRY 2007 2008 2009 2010 2011 2012 PAYS Benin 4.6 5.0 2.7 2.6 3.5 6.1 Bénin Burkina Faso 3.6 5.2 3.2 7.9 4.2 5.8 Burkina Faso CAR 3.7 2.0 1.7 3.0 3.3 3.1 RCA Chad 8.4 3.4 4.1 14.6 1.8 5.9 Tchad Comoros 0.8 0.2 1.2 1.8 2.2 2.7 Comores Côte d’Ivoire 1.8 2.3 3.8 2.4 -4.7 8.6 Côte d’Ivoire Djibouti 5.0 5.0 5.5 4.5 4.5 4.8 Djibouti Egypt 7.1 7.3 4.9 4.8 1.8 2.2 Egypte Eritrea 1.4 - 9.8 3.9 2.2 8.7 5.5 Érythrée Gambia, The 4.0 6.5 6.7 5.5 3.3 1.0 Gambie Ghana 6.5 8.4 4.0 7.7 14.4 7.1 Ghana Guinea 1.8 4.9 - 0.3 1.9 3.9 3.9 Guinée Guinea Bissau 3.2 3.2 3.0 3.5 5.3 2.8 Guinée Bissau Kenya 7.0 1.5 2.6 5.6 4.4 4.2 Kenya Liberia 8.6 8.1 7.8 7.3 8.2 8.9 Libéria Libya 5.1 2.7 - 0.7 4.2 -59.7 95.5 Libye Mali 4.3 5.0 4.5 5.8 2.7 - 1.5 Mali Mauritania 1.0 3.5 - 1.2 5.2 4.0 4.6 Mauritanie Morocco 2.7 5.6 4.8 3.7 4.9 2.7 Maroc Niger 3.1 9.6 - 0.7 8.2 2.3 13.1 Niger Nigeria 6.4 6.0 7.0 7.9 7.4 6.6 Nigéria São Tomé 2.4 9.4 4.8 4.5 4.9 4.0 São Tomé Senegal 4.9 3.7 2.1 4.1 2.6 3.8 Sénégal Sierra Leone 6.0 4.0 3.2 4.9 6.0 18.2 Sierra Leone Somalia 2.6 2.6 2.6 2.6 … 2.6 Somalie Sudan 8.1 7.8 6.1 6.4 -4.5 (-)0.6 Soudan Togo 2.1 2.4 3.4 3.7 4.9 5.0 Togo Tunisia 6.3 4.5 3.1 3.2 -1.8 3,6 Tunisie CEN-SAD 4.4 4.3 3.3 5.0 1.8 8.4 CEN-SAD
KeyStats 2013 II: CEN-SAD
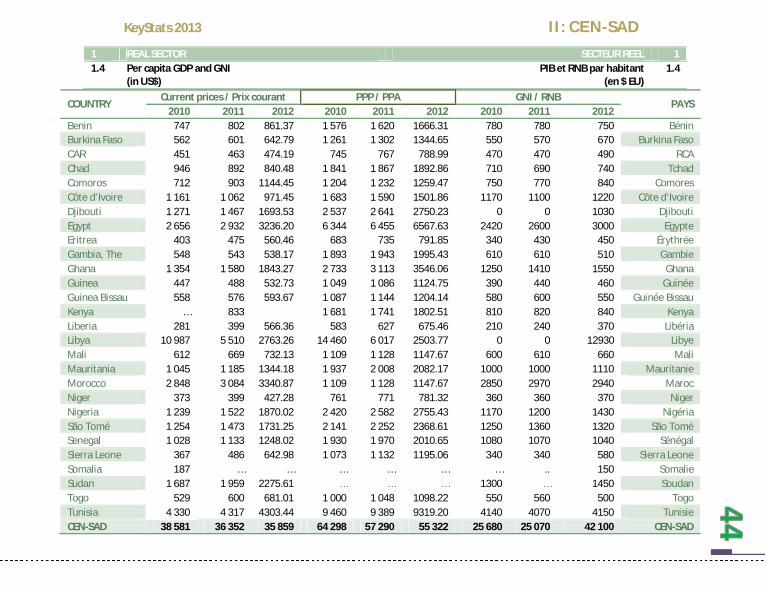
1 REAL SECTOR SECTEUR REEL 1 1.4 Per capita GDP and GNI
(in US$) PIB et RNB par habitant
(en $ EU) 1.4
COUNTRY Current prices / Prix courant PPP / PPA GNI / RNB
PAYS 2010 2011 2012 2010 2011 2012 2010 2011 2012
Benin 747 802 861.37 1 576 1 620 1666.31 780 780 750 Bénin Burkina Faso 562 601 642.79 1 261 1 302 1344.65 550 570 670 Burkina Faso CAR 451 463 474.19 745 767 788.99 470 470 490 RCA Chad 946 892 840.48 1 841 1 867 1892.86 710 690 740 Tchad Comoros 712 903 1144.45 1 204 1 232 1259.47 750 770 840 Comores Côte d’Ivoire 1 161 1 062 971.45 1 683 1 590 1501.86 1170 1100 1220 Côte d’Ivoire Djibouti 1 271 1 467 1693.53 2 537 2 641 2750.23 0 0 1030 Djibouti Egypt 2 656 2 932 3236.20 6 344 6 455 6567.63 2420 2600 3000 Egypte Eritrea 403 475 560.46 683 735 791.85 340 430 450 Érythrée Gambia, The 548 543 538.17 1 893 1 943 1995.43 610 610 510 Gambie Ghana 1 354 1 580 1843.27 2 733 3 113 3546.06 1250 1410 1550 Ghana Guinea 447 488 532.73 1 049 1 086 1124.75 390 440 460 Guinée Guinea Bissau 558 576 593.67 1 087 1 144 1204.14 580 600 550 Guinée Bissau Kenya … 833 1 681 1 741 1802.51 810 820 840 Kenya Liberia 281 399 566.36 583 627 675.46 210 240 370 Libéria Libya 10 987 5 510 2763.26 14 460 6 017 2503.77 0 0 12930 Libye Mali 612 669 732.13 1 109 1 128 1147.67 600 610 660 Mali Mauritania 1 045 1 185 1344.18 1 937 2 008 2082.17 1000 1000 1110 Mauritanie Morocco 2 848 3 084 3340.87 1 109 1 128 1147.67 2850 2970 2940 Maroc Niger 373 399 427.28 761 771 781.32 360 360 370 Niger Nigeria 1 239 1 522 1870.02 2 420 2 582 2755.43 1170 1200 1430 Nigéria São Tomé 1 254 1 473 1731.25 2 141 2 252 2368.61 1250 1360 1320 São Tomé Senegal 1 028 1 133 1248.02 1 930 1 970 2010.65 1080 1070 1040 Sénégal Sierra Leone 367 486 642.98 1 073 1 132 1195.06 340 340 580 Sierra Leone Somalia 187 … … … … … … .. 150 Somalie Sudan 1 687 1 959 2275.61 … … … 1300 … 1450 Soudan Togo 529 600 681.01 1 000 1 048 1098.22 550 560 500 Togo Tunisia 4 330 4 317 4303.44 9 460 9 389 9319.20 4140 4070 4150 Tunisie CEN-SAD 38 581 36 352 35 859 64 298 57 290 55 322 25 680 25 070 42 100 CEN-SAD

KeyStats 2013 II: CEN-SAD
1 REAL SECTOR SECTEUR REEL 1 1.5 Inflation
(in percentage) Inflation
(en pourcentage) 1.5
COUNTRY 2007 2008 2009 2010 2011 2012 PAYS Benin 1.3 7.9 2.2 1.5 2.8 6.7 Bénin Burkina Faso -0.3 10.7 2.5 -0.8 2.8 3.6 Burkina Faso CAR 0.9 9.3 3.5 1.7 1.0 3.5 RCA Chad -8.4 10.3 10.1 -2.3 2,0 7.0 Tchad Comoros 4.4 4.9 -3.1 2.1 3.2 5.6 Comores Côte d’Ivoire 1.9 6.3 1.0 0.9 4.8 2.1 Côte d’Ivoire Djibouti 5.0 12.0 1.7 4.0 5.1 5.0 Djibouti Egypt 9.4 18.3 11.9 11.1 10.1 8.7 Egypte Eritrea 9.3 19.9 34.7 20.5 13.3 17.0 Érythrée Gambia, The 5.4 4.4 4.6 5.1 4.8 4.2 Gambie Ghana 10.7 16.5 19.3 10.8 8.7 9.2 Ghana Guinea 18.7 6.4 3.7 6.8 10.3 13.1 Guinée Guinea Bissau 4.6 10.4 -1.6 -0.2 3.5 2.1 Guinée Bissau Kenya 9.8 26.2 19.6 4.1 14.0 9.6 Kenya Liberia 11.4 17.5 7.4 7.5 8.5 6.9 Libéria Libya 6.3 10.4 2.5 2.5 7.2 6.9 Libye Mali 1.4 9.2 2.2 1.2 3.3 5.3 Mali Mauritania 7.3 7.3 2.2 5.7 6.9 4.9 Mauritanie Morocco 2.0 3.9 1.0 0.9 0.9 1.3 Maroc Niger 0.4 11.3 4.3 -0.3 4.9 3.9 Niger Nigeria 6.6 11.6 12.5 13.7 10.8 12.0 Nigéria São Tomé 27.6 24.8 16.1 12.3 10.6 9.5 São Tomé Senegal 4.9 7.4 -2.3 1.3 3.4 2.5 Sénégal Sierra Leone 11.6 14.8 9.3 17.8 18.5 11.6 Sierra Leone Somalia ... ... ... ... ... ... Somalie Sudan 8.1 14.3 11.2 13.0 18.1 36.0 Soudan Togo 0.9 8.7 2.9 1.4 3.7 2.3 Togo Tunisia 3.2 4.9 3.5 4.4 3.6 5.6 Tunisie
CPI national

KeyStats 2013 II: CEN-SAD
1 REAL SECTOR SECTEUR REEL 1 1.5 Inflation
(in percentage) Inflation
(en pourcentage) 1.5
COUNTRY 2007 2008 2009 2010 2011 2012 PAYS Benin Bénin Burkina Faso … … … … … … Burkina Faso CAR … … … … … … RCA Chad … … … … … … Tchad Comoros … … … … … … Comores Côte d’Ivoire … … … … … … Côte d’Ivoire Djibouti … … … … … … Djibouti Egypt … … … … … … Egypte Eritrea … … … … … … Érythrée Gambia, The … … … … … … Gambie Ghana … … … … … … Ghana Guinea … … … … … … Guinée Guinea Bissau … … … … … … Guinée Bissau Kenya … … … … … … Kenya Liberia … … … … … … Libéria Libya … … … … … … Libye Mali … … … … … … Mali Mauritania … … … … … … Mauritanie Morocco … … … … … … Maroc Niger … … … … … … Niger Nigeria … … … … … … Nigéria São Tomé … … … … … … São Tomé Senegal … … … … … … Sénégal Sierra Leone … … … … … … Sierra Leone Somalia … … … … … … Somalie Sudan … … … … … … Soudan Togo … … … … … … Togo Tunisia … … … … … … Tunisie CEN-SAD … … … … … … CEN-SAD
CPI Harmonized CPI

KeyStats 2013 II: CEN-SAD
2 GOVERNMENT FINANCE FINANCES PUBLIQUES 2 2.1a Total revenue plus grants
(in percentage of GDP) Recettes totales plus dons
(en pourcentage du PIB) 2.1a
COUNTRY 2005 2008 2009 2010 2011 2012 PAYS Benin … … … … … … Bénin Burkina Faso … … … … … … Burkina Faso CAR … … … … … … RCA Chad … … … … … … Tchad Comoros … … … … … … Comores Côte d’Ivoire … … … … … … Côte d’Ivoire Djibouti … … … … … … Djibouti Egypt … … … … … … Egypte Eritrea … … … … … … Érythrée Gambia, The … … … … … … Gambie Ghana … … … … … … Ghana Guinea … … … … … … Guinée Guinea Bissau … … … … … … Guinée Bissau Kenya … … … … … … Kenya Liberia … … … … … … Libéria Libya … … … … … … Libye Mali … … … … … … Mali Mauritania … … … … … … Mauritanie Morocco … … … … … … Maroc Niger … … … … … … Niger Nigeria … … … … … … Nigéria São Tomé … … … … … … São Tomé Senegal … … … … … … Sénégal Sierra Leone … … … … … … Sierra Leone Somalia … … … … … … Somalie Sudan … … … … … … Soudan Togo … … … … … … Togo Tunisia … … … … … … Tunisie CEN-SAD … … … … … … CEN-SAD

KeyStats 2013 II: CEN-SAD
2 GOVERNMENT FINANCE FINANCES PUBLIQUES 2 2.1b Total revenue
(in percentage of GDP) Recettes totales
(en pourcentage du PIB) 2.1b
COUNTRY 2005 2008 2009 2010 2011 2012 PAYS Benin 18.9 21.3 21.0 19.2 20.1 20.5 Bénin Burkina Faso 17.3 17.2 19.6 20.1 20.8 23.1 Burkina Faso CAR 12.4 15.1 41.8 16.7 14.9 15.7 RCA Chad 12.7 27.3 14.7 20.5 22.5 23.1 Tchad Comoros 20.0 24.7 24.3 30.3 … 21.6 Comores Côte d’Ivoire 18.1 20.3 24.4 32.9 28.8 32.5 Côte d’Ivoire Djibouti 37.1 41.9 37.0 35.4 35.5 36.1 Djibouti Egypt 20.4 3.2 27.1 22.2 19.3 18.6 Egypte Eritrea ... ... … … … … Érythrée Gambia, The 15.7 22.8 20.6 18.8 21.1 19.9 Gambie Ghana 29.1 28.4 18.5 19.1 20.8 24.7 Ghana Guinea 15.2 16.2 15.8 15.8 19.1 26.7 Guinée Guinea Bissau 14.2 … 24.7 20.2 20.8 18.7 Guinée Bissau Kenya 21.5 22.9 22.4 25.2 24.7 25.7 Kenya Liberia 14.8 36.2 23.7 27.7 33.7 27.4 Libéria Libya 62.9 69.9 56.7 67.8 37.9 50.2 Libye Mali 19.9 18.9 21.7 20.2 22.6 16.3 Mali Mauritania 26.6 22.1 25.5 26.5 27.4 27.9 Mauritanie Morocco 25.1 29.5 27.2 25.2 26.4 26.0 Maroc Niger 18.2 29.9 18.7 18.4 21.7 21.4 Niger Nigeria 38.1 33.8 19.2 23.5 27.3 29.2 Nigéria São Tomé 34.3 48.7 30.0 33.3 37.1 38.6 São Tomé Senegal 20.8 21.8 20.4 21.9 22.8 23.1 Sénégal Sierra Leone 23.1 15.9 17.0 18.1 17.2 17.0 Sierra Leone Somalia ... ... … … … … Somalie Sudan 18.3 21.8 14.6 15.7 18.9 12.0 Soudan Togo 16.9 17.5 21.2 22.8 22.7 22.2 Togo Tunisia 22.2 26.5 23.4 23.4 24.3 25.0 Tunisie CEN-SAD 22.8 26.1 24.3 24.6 24.3 24.7 CEN-SAD
KeyStats 2013 II: CEN-SAD
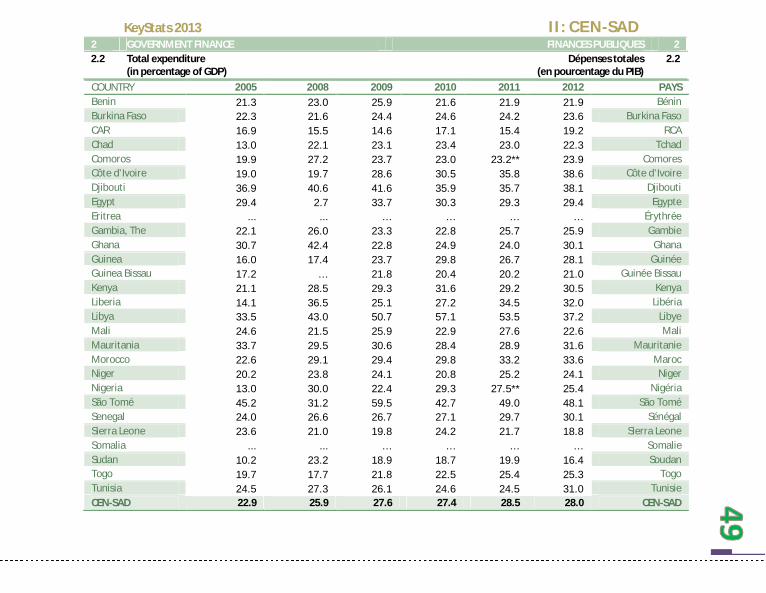
2 GOVERNMENT FINANCE FINANCES PUBLIQUES 2 2.2 Total expenditure
(in percentage of GDP) Dépenses totales
(en pourcentage du PIB) 2.2
COUNTRY 2005 2008 2009 2010 2011 2012 PAYS Benin 21.3 23.0 25.9 21.6 21.9 21.9 Bénin Burkina Faso 22.3 21.6 24.4 24.6 24.2 23.6 Burkina Faso CAR 16.9 15.5 14.6 17.1 15.4 19.2 RCA Chad 13.0 22.1 23.1 23.4 23.0 22.3 Tchad Comoros 19.9 27.2 23.7 23.0 23.2** 23.9 Comores Côte d’Ivoire 19.0 19.7 28.6 30.5 35.8 38.6 Côte d’Ivoire Djibouti 36.9 40.6 41.6 35.9 35.7 38.1 Djibouti Egypt 29.4 2.7 33.7 30.3 29.3 29.4 Egypte Eritrea ... ... … … … … Érythrée Gambia, The 22.1 26.0 23.3 22.8 25.7 25.9 Gambie Ghana 30.7 42.4 22.8 24.9 24.0 30.1 Ghana Guinea 16.0 17.4 23.7 29.8 26.7 28.1 Guinée Guinea Bissau 17.2 … 21.8 20.4 20.2 21.0 Guinée Bissau Kenya 21.1 28.5 29.3 31.6 29.2 30.5 Kenya Liberia 14.1 36.5 25.1 27.2 34.5 32.0 Libéria Libya 33.5 43.0 50.7 57.1 53.5 37.2 Libye Mali 24.6 21.5 25.9 22.9 27.6 22.6 Mali Mauritania 33.7 29.5 30.6 28.4 28.9 31.6 Mauritanie Morocco 22.6 29.1 29.4 29.8 33.2 33.6 Maroc Niger 20.2 23.8 24.1 20.8 25.2 24.1 Niger Nigeria 13.0 30.0 22.4 29.3 27.5** 25.4 Nigéria São Tomé 45.2 31.2 59.5 42.7 49.0 48.1 São Tomé Senegal 24.0 26.6 26.7 27.1 29.7 30.1 Sénégal Sierra Leone 23.6 21.0 19.8 24.2 21.7 18.8 Sierra Leone Somalia ... ... … … … … Somalie Sudan 10.2 23.2 18.9 18.7 19.9 16.4 Soudan Togo 19.7 17.7 21.8 22.5 25.4 25.3 Togo Tunisia 24.5 27.3 26.1 24.6 24.5 31.0 Tunisie CEN-SAD 22.9 25.9 27.6 27.4 28.5 28.0 CEN-SAD
KeyStats 2013 II: CEN-SAD
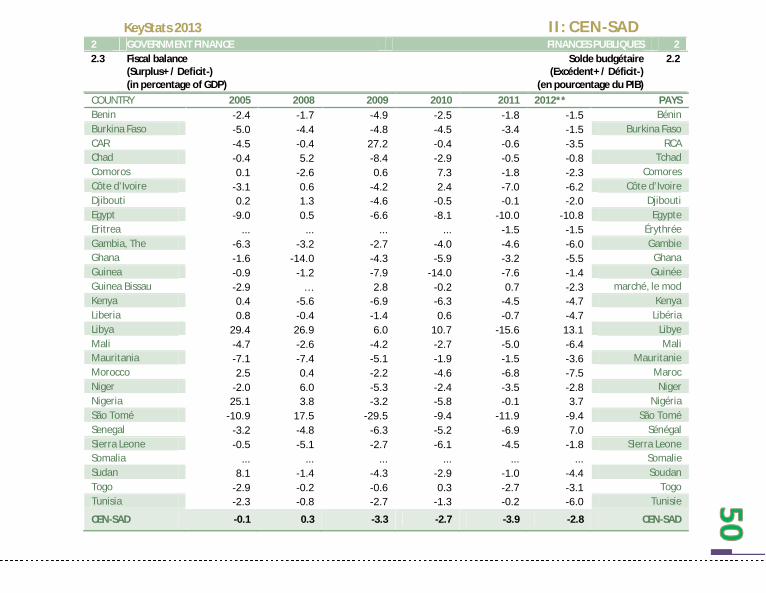
2 GOVERNMENT FINANCE FINANCES PUBLIQUES 2 2.3 Fiscal balance
(Surplus+ / Deficit-) (in percentage of GDP)
Solde budgétaire (Excédent+ / Déficit-)
(en pourcentage du PIB)
2.2
COUNTRY 2005 2008 2009 2010 2011 2012** PAYS Benin -2.4 -1.7 -4.9 -2.5 -1.8 -1.5 Bénin Burkina Faso -5.0 -4.4 -4.8 -4.5 -3.4 -1.5 Burkina Faso CAR -4.5 -0.4 27.2 -0.4 -0.6 -3.5 RCA Chad -0.4 5.2 -8.4 -2.9 -0.5 -0.8 Tchad Comoros 0.1 -2.6 0.6 7.3 -1.8 -2.3 Comores Côte d’Ivoire -3.1 0.6 -4.2 2.4 -7.0 -6.2 Côte d’Ivoire Djibouti 0.2 1.3 -4.6 -0.5 -0.1 -2.0 Djibouti Egypt -9.0 0.5 -6.6 -8.1 -10.0 -10.8 Egypte Eritrea ... ... ... ... -1.5 -1.5 Érythrée Gambia, The -6.3 -3.2 -2.7 -4.0 -4.6 -6.0 Gambie Ghana -1.6 -14.0 -4.3 -5.9 -3.2 -5.5 Ghana Guinea -0.9 -1.2 -7.9 -14.0 -7.6 -1.4 Guinée Guinea Bissau -2.9 … 2.8 -0.2 0.7 -2.3 marché, le mod Kenya 0.4 -5.6 -6.9 -6.3 -4.5 -4.7 Kenya Liberia 0.8 -0.4 -1.4 0.6 -0.7 -4.7 Libéria Libya 29.4 26.9 6.0 10.7 -15.6 13.1 Libye Mali -4.7 -2.6 -4.2 -2.7 -5.0 -6.4 Mali Mauritania -7.1 -7.4 -5.1 -1.9 -1.5 -3.6 Mauritanie Morocco 2.5 0.4 -2.2 -4.6 -6.8 -7.5 Maroc Niger -2.0 6.0 -5.3 -2.4 -3.5 -2.8 Niger Nigeria 25.1 3.8 -3.2 -5.8 -0.1 3.7 Nigéria São Tomé -10.9 17.5 -29.5 -9.4 -11.9 -9.4 São Tomé Senegal -3.2 -4.8 -6.3 -5.2 -6.9 7.0 Sénégal Sierra Leone -0.5 -5.1 -2.7 -6.1 -4.5 -1.8 Sierra Leone Somalia ... ... ... ... ... ... Somalie Sudan 8.1 -1.4 -4.3 -2.9 -1.0 -4.4 Soudan Togo -2.9 -0.2 -0.6 0.3 -2.7 -3.1 Togo Tunisia -2.3 -0.8 -2.7 -1.3 -0.2 -6.0 Tunisie
CEN-SAD -0.1 0.3 -3.3 -2.7 -3.9 -2.8 CEN-SAD
KeyStats 2013 II: CEN-SAD
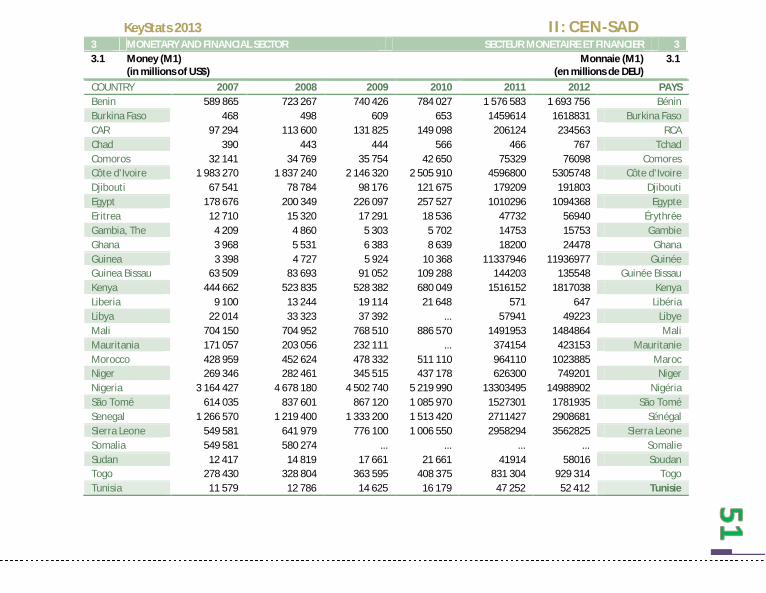
3 MONETARY AND FINANCIAL SECTOR SECTEUR MONETAIRE ET FINANCIER 3 3.1 Money (M1)
(in millions of US$) Monnaie (M1)
(en millions de DEU) 3.1
COUNTRY 2007 2008 2009 2010 2011 2012 PAYS Benin 589 865 723 267 740 426 784 027 1 576 583 1 693 756 Bénin Burkina Faso 468 498 609 653 1459614 1618831 Burkina Faso CAR 97 294 113 600 131 825 149 098 206124 234563 RCA Chad 390 443 444 566 466 767 Tchad Comoros 32 141 34 769 35 754 42 650 75329 76098 Comores Côte d’Ivoire 1 983 270 1 837 240 2 146 320 2 505 910 4596800 5305748 Côte d’Ivoire Djibouti 67 541 78 784 98 176 121 675 179209 191803 Djibouti Egypt 178 676 200 349 226 097 257 527 1010296 1094368 Egypte Eritrea 12 710 15 320 17 291 18 536 47732 56940 Érythrée Gambia, The 4 209 4 860 5 303 5 702 14753 15753 Gambie Ghana 3 968 5 531 6 383 8 639 18200 24478 Ghana Guinea 3 398 4 727 5 924 10 368 11337946 11936977 Guinée Guinea Bissau 63 509 83 693 91 052 109 288 144203 135548 Guinée Bissau Kenya 444 662 523 835 528 382 680 049 1516152 1817038 Kenya Liberia 9 100 13 244 19 114 21 648 571 647 Libéria Libya 22 014 33 323 37 392 ... 57941 49223 Libye Mali 704 150 704 952 768 510 886 570 1491953 1484864 Mali Mauritania 171 057 203 056 232 111 ... 374154 423153 Mauritanie Morocco 428 959 452 624 478 332 511 110 964110 1023885 Maroc Niger 269 346 282 461 345 515 437 178 626300 749201 Niger Nigeria 3 164 427 4 678 180 4 502 740 5 219 990 13303495 14988902 Nigéria São Tomé 614 035 837 601 867 120 1 085 970 1527301 1781935 São Tomé Senegal 1 266 570 1 219 400 1 333 200 1 513 420 2711427 2908681 Sénégal Sierra Leone 549 581 641 979 776 100 1 006 550 2958294 3562825 Sierra Leone Somalia 549 581 580 274 ... ... ... ... Somalie Sudan 12 417 14 819 17 661 21 661 41914 58016 Soudan Togo 278 430 328 804 363 595 408 375 831 304 929 314 Togo Tunisia 11 579 12 786 14 625 16 179 47 252 52 412 Tunisie

KeyStats 2013 II: CEN-SAD
3 MONETARY AND FINANCIAL SECTOR SECTEUR MONETAIRE ET FINANCIER 3 3.2 Money plus quasi-money (M2)
(in millions of US$) Monnaie plus quasi-monnaie (M2)
(en millions de DEU) 3.2
COUNTRY 2007 2008 2009 2010 2011 2012 PAYS Benin 279 472 350 100 424 330 466 744 1,576.6 1,693.8 Bénin Burkina Faso 295 354 433 591 1,459.6 1,618.8 Burkina Faso CAR 21 198 24 343 27 605 29 806 206.1 234.6 RCA Chad 25 30 33 35 465.7 766.7 Tchad Comoros 13 400 16 024 21 817 26 097 75.3 76.1 Comores Côte d’Ivoire 853 324 997 883 1 170 100 1 415 570 4.596.8 5,305.7 Côte d’Ivoire Djibouti 50 491 60 074 64 514 60 298 179.2 191.8 Djibouti Egypt 537 599 591 029 640 257 716 434 1,010.3 1,094.4 Egypte Eritrea 13 159 14 656 17 397 19 267 47.7 56.9 Érythrée Gambia, The 4 065 4 677 6 095 7 270 14.8 15.8 Gambie Ghana 1 986 2 756 3 955 4 998 18.2 24.5 Ghana Guinea 1 980 3 075 3 825 6 380 11,337.9 11,937.0 Guinée Guinea Bissau 5 367 8 481 7 807 13 637 144.2 135.5 Guinée Bissau Kenya 331 042 372 685 515 682 597 485 1,516.2 1,817.0 Kenya Liberia 3 118 4 183 5 884 7 366 0.6 0.6 Libéria Libya 3 894 5 330 7 992 5 030 57.9 49.2 Libye Mali 310 612 264 404 344 368 361 834 1,492.0 1,484.9 Mali Mauritania 40 501 37 576 45 924 ... 374.2 423.2 Mauritanie Morocco 228 405 289 989 301 016 322 311 964.1 1,023.9 Maroc Niger 86 307 106 894 116 182 124 196 626.3 749.2 Niger Nigeria 2 686 840 4 247 830 5 707 990 5 941 370 13,303.5 14,988.9 Nigéria São Tomé 151 165 209 703 266 164 331 373 1,527.3 1,781.9 São Tomé Senegal 703 531 753 459 867 492 991 161 2,711.4 2,908.7 Sénégal Sierra Leone 529 121 654 564 877 499 1 188 480 2,958.3 3,562.8 Sierra Leone Somalia 529 121 560 192 ... ... ... ... Somalie Sudan 7 271 8 049 10 624 13 801 41.9 58.0 Soudan Togo 171 051 195 541 243 774 297 660 831.3 929.3 Togo Tunisia 16 539 19 278 21 427 23 961 47.3 52.4 Tunisie

KeyStats 2013 II: CEN-SAD
3 MONETARY AND FINANCIAL SECTOR SECTEUR MONETAIRE ET FINANCIER 3 3.3 Domestic credit
(in percentage of GDP) Crédit intérieur
(en pourcentage du PIB) 3.3
COUNTRY provided by banking sector / provenant du
secteur bancaire
to private sector /
PAYS au secteur privé
2009 2010 2011 2009 2010 2011 Benin 19.27 18.28 21.70 22.5 23.3 24.50 Bénin Burkina Faso -0.99 9.32 17.60 17.0 17.6 19.40 Burkina Faso CAR 20.01 22.67 25.80 7.2 9.0 10.30 RCA Chad 9.39 9.54 7.00 5.1 5.3 5.60 Tchad Comoros 20.47 23.25 21.20 16.0 19.1 17.80 Comores Côte d’Ivoire 23.04 24.98 25.30 17.3 18.0 18.10 Côte d’Ivoire Djibouti 32.32 … 34.40 29.3 … 30.90 Djibouti Egypt 75.11 69.42 74.60 36.1 33.1 31.20 Egypte Eritrea 113.12 114.36 104.00 16.8 16.0 13.90 Érythrée Gambia, The 28.57 35.32 43.80 13.5 13.9 16.30 Gambie Ghana 28.70 28.37 27.80 15.7 15.3 15.20 Ghana Guinea 21.16 37.30 32.20 3.9 5.7 9.10 Guinée Guinea Bissau 4.93 7.73 13.60 5.6 6.2 14.00 Guinée Bissau Kenya … … 52.00 30.3 33.8 38.10 Kenya Liberia 144.28 37.31 30.90 16.0 19.4 16.40 Libéria Libya -65.93 … … 10.9 … … Libye Mali 10.70 12.26 16.80 17.5 18.0 20.90 Mali Mauritania 52.89 46.72 41.90 30.4 27.9 26.30 Mauritanie Morocco 99.96 105.20 111.10 64.7 68.6 72.20 Maroc Niger 12.55 13.11 14.70 12.5 13.0 14.20 Niger Nigeria 36.89 35.70 37.50 38.6 29.0 21.10 Nigéria São Tomé 25.42 39.41 39.50 … … 38.10 São Tomé Senegal 26.65 29.01 31.10 24.7 25.9 28.60 Sénégal Sierra Leone 10.89 18.40 16.40 9.5 10.4 7.70 Sierra Leone Somalia … … … … … … Somalie Sudan 19.98 20.52 23.00 12.3 11.6 11.40 Soudan Togo 27.33 31.63 34.80 19.8 22.8 29.10 Togo Tunisia 68.32 73.80 82.10 62.2 68.8 75.20 Tunisie CEN-SAD 33.27 35.98 37.72 21.37 22.16 24.06 CEN-SAD

KeyStats 2013 II: CEN-SAD
3 MONETARY AND FINANCIAL SECTOR SECTEUR MONETAIRE ET FINANCIER 3 3.4 Interest rates
(in percentage) Taux d’intérêts
(en pourcentage) 3.4
COUNTRY Deposit rate / Taux de dépôts Discount rate / Taux d’escompte PAYS 2009 2010 2011 2009 2010 2011
Benin 3.50 3.50 3.50 … … … Bénin Burkina Faso 3.50 3.50 3.50 … … … Burkina Faso CAR 3.25 3.25 3.30 … … … RCA Chad 3.25 3.25 3.30 … … … Tchad Comoros 1.88 1.75 1.80 8.63 8.75 … Comores Côte d’Ivoire 3.50 3.50 3.50 … … … Côte d’Ivoire Djibouti 1.37 0.96 1.50 9.72 9.35 … Djibouti Egypt 6.49 6.23 6.70 5.48 4.77 … Egypte Eritrea … … … … … … Érythrée Gambia, The 15.50 14.63 11.80 11.50 12.38 … Gambie Ghana 17.06 … 9.80 … … … Ghana Guinea … … … … … … Guinée Guinea Bissau 3.50 3.50 3.50 … … … Guinée Bissau Kenya 5.97 4.56 5.60 8.84 9.81 … Kenya Liberia 4.11
3.00 10.08 … … Libéria
Libya 2.50 2.50 2.50 3.50 3.50 … Libye Mali 3.50 3.50 3.50 … … … Mali Mauritania 8.00 8.00 8.00 11.50 9.00 … Mauritanie Morocco 3.81 3.69 3.80 … … … Maroc Niger 3.50 3.50 3.50 … … … Niger Nigeria 13.30 6.52 5.70 5.06 11.06 … Nigéria São Tomé … … 12.40 19.19 17.76 … São Tomé Senegal 3.50 3.50 3.50 … … … Sénégal Sierra Leone 9.08 8.95 10.30 13.08 12.30 … Sierra Leone Somalia … … … … … … Somalie Sudan … … … … … … Soudan Togo 3.50 3.50 3.50 … … … Togo Tunisia … … … … … … Tunisie
CEN-SAD 5.62 4.61 5.11 … … … CEN-SAD

KeyStats 2013 II: CEN-SAD
4 EXTERNAL SECTOR SECTEUR EXTERIEUR 4 4.1 Imports
(in % of GDP) Importations
(en % du PIB) 4.1
COUNTRY 2007 2008 2009 2010 2011 2012 PAYS Benin 28.36 27.50 25.10 24.65 26.96 … Bénin Burkina Faso 24.93 26.40 27.79 24.88 28.58 … Burkina Faso CAR 23.47 23.46 21.55 24.60 23.57 … RCA Chad 52.30 50.20 28.29 27.96 25.47 … Tchad Comoros 41.33 48.28 48.18 50.45 51.79 … Comores Côte d’Ivoire 41.94 38.80 … … … … Côte d’Ivoire Djibouti 77.15 … … … … … Djibouti Egypt 34.83 38.64 31.60 26.13 30.05 25.71 Egypte Eritrea 28.79 26.13 23.44 23.35 23.15 22.69 Érythrée Gambia, The 42.07 39.88 41.70 42.11 47.16 … Gambie Ghana 40.83 44.48 42.30 41.07 50.85 54.41 Ghana Guinea 36.42 40.08 30.79 36.53 48.12 65.78 Guinée Guinea Bissau … … … … … … Guinée Bissau Kenya 37.70 41.75 37.48 40.06 46.02 47.72 Kenya Liberia 121.39 144.73 76.43 82.13 93.33 … Libéria Libya 29.35 27.47 … … … … Libye Mali 35.58 43.00 31.37 39.88 36.24 … Mali Mauritania 61.19 77.49 59.99 69.30 74.76 94.25 Mauritanie Morocco 44.86 50.87 39.69 42.93 48.49 49.50 Maroc Niger 29.93 36.32 48.13 50.31 53.28 … Niger Nigeria 25.94 31.20 29.67 29.89 35.62 … Nigéria São Tomé 63.66 61.91 52.30 64.31 57.36 … São Tomé Senegal 47.71 52.43 43.05 43.02 43.76 … Sénégal Sierra Leone 24.70 25.71 27.93 34.51 53.63 … Sierra Leone Somalia … … … … … … Somalie Sudan 22.89 19.92 20.19 17.46 16.34 20.13 Soudan Togo 54.49 52.00 52.35 57.31 57.40 Togo Tunisia 53.09 59.38 48.37 54.87 55.85 58.61 Tunisie CEN-SAD 43.26 45.12 38.59 41.20 44.69 … CEN-SAD

KeyStats 2013 II: CEN-SAD
4 EXTERNAL SECTOR SECTEUR EXTERIEUR 4 4.2 Exports
(in % of GDP) Exportations
(en % du PIB) 4.2
COUNTRY 2007 2008 2009 2010 2011 2012 PAYS Benin 20 20 16 15 15 … Bénin Burkina Faso 11 10 13 17 21 … Burkina Faso CAR 14 11 10 11 12 … RCA Chad 55 53 39 41 41 … Tchad Comoros 15 14 15 16 15 … Comores Côte d’Ivoire 48 47 … … … … Côte d’Ivoire Djibouti 57 … … … … … Djibouti Egypt 30 33 25 21 23 21 Egypte Eritrea 6 4 5 5 14 20 Érythrée Gambia, The 29 23 25 23 29 … Gambie Ghana 25 25 29 29 38 42 Ghana Guinea 29 35 27 28 30 29 Guinée Guinea Bissau … … … … … … Guinée Bissau Kenya 27 28 24 28 29 27 Kenya Liberia 32 34 15 19 27 … Libéria Libya 68 67 … … … … Libye Mali 26 29 24 26 26 … Mali Mauritania 43 56 45 56 65 58 Mauritanie Morocco 36 37 29 33 35 37 Maroc Niger 17 19 21 21 23 … Niger Nigeria 41 43 35 35 40 … Nigéria São Tomé 9 10 10 12 11 … São Tomé Senegal 25 26 24 25 24 … Sénégal Sierra Leone 16 14 13 17 16 … Sierra Leone Somalia … … … … … … Somalie Sudan 22 25 16 20 18 19 Soudan Togo 38 36 37 40 40 … Togo Tunisia 51 56 46 50 49 48 Tunisie
CEN-SAD 30 30 24 26 28 … CEN-SAD

KeyStats 2013 II: CEN-SAD
4 EXTERNAL SECTOR SECTEUR EXTERIEUR 4 4.3 Trade balance
(in % of GDP) Solde commercial
(en % du PIB) 4.3
COUNTRY 2007 2008 2009 2010 2011 2012 PAYS Benin -14.4 -13.7 -11.2 -12.2 -12.7 -12.1 Bénin Burkina Faso -8.8 -10.9 -5.8 -1.4 -0.6 -0.9 Burkina Faso CAR -4.2 -7.6 -7.4 -8.5 -10.0 -5.1 RCA Chad 26.2 28.8 5.1 10.7 14.9 8.1 Tchad Comoros -24.1 -32.9 -27.6 -29.7 -30.6 -30.6 Comores Côte d’Ivoire 8.9 -1.1 -5.2 -4.4 -6.6 7.0 Côte d’Ivoire Djibouti -50.1 -66.9 -50.6 -50.6 -57.5 -34.6 Djibouti Egypt -12.5 -14.4 -13.3 -11.5 -9.4 -9.2 Egypte Eritrea -24.2 -22.0 -19.9 -19.6 -11.0 -4.7 Érythrée Gambia, The -20.8 -21.4 -20.9 -22.0 -21.5 -23.5 Gambie Ghana -15.7 -17.5 -8.5 -11.7 -8.9 -9.7 Ghana Guinea -0.3 -0.6 -0.2 2.5 2.5 -17.1 Guinée Guinea Bissau -41.1 -83.7 -94.9 -84.0 -102.7 -4.2 Guinée Bissau Kenya -15.7 -18.8 -19.5 -22.0 -26.0 -19.3 Kenya Liberia -39.3 -53.5 -46.6 -50.2 -50.9 -49.5 Libéria Libya 39.2 50.6 25.6 32.9 18.0 40.7 40.7 Mali -4.1 -7.8 -3.0 -0.9 -2.3 6.4 Mali Mauritania 0.8 -4.3 -2.7 11.0 14.7 -7.9 Mauritanie Morocco -18.7 -21.5 -17.9 -21.1 -22.7 -24.6 Maroc Niger -5.9 -8.1 -11.8 -15.0 -16.2 -13.7 Niger Nigeria 23.0 22.7 17.5 22.3 26.9 18.0 Nigéria São Tomé -41.8 -47.6 -36.8 -40.1 -42.0 -40.7 São Tomé Senegal -22.0 -25.4 -15.9 -20.1 -22.9 -18.1 Sénégal Sierra Leone -5.7 -10.0 -10.0 -9.9 -12.1 -35.5 Sierra Leone Somalia … … … … … … Somalie Sudan 2.5 5.6 2.1 3.7 5.4 -3.0 Soudan Togo -16.2 -14.7 -13.1 -14.6 -15.3 -12.6 Togo Tunisia -7.4 -8.9 -8.5 -12.3 -10.8 -10.1 Tunisie CEN-SAD - 11 - 15 - 15 - 14 - 15 - 11 CEN-SAD

KeyStats 2013 II: CEN-SAD
4 EXTERNAL SECTOR SECTEUR EXTERIEUR 4 4.4 Current account balance
(in millions of US$) Solde du compte courant
(en millions de $ EU) 4.4
COUNTRY 2007 2008 2009 2010 2011 2012 PAYS Benin - 449 - 455 - 586 - 501 - 728 - 715 Bénin Burkina Faso - 1 - 1 0 0 - 116 - 391 Burkina Faso CAR - 99 - 167 - 164 - 211 - 191 - 141 RCA Chad - 231 227 -1 088 -1 083 191 - 778 Tchad Comoros - 29 - 59 - 35 - 48 - 58 - 92 Comores Côte d’Ivoire 0 0 1 0 1 606 - 705 Côte d’Ivoire Djibouti 0 1 4 1 - 156 - 167 Djibouti Egypt 3 473 1 304 -4 719 -4 290 -6 088 -7 877 Egypte Eritrea - 92 - 83 - 97 - 32 14 66 Érythrée Gambia, The - 57 - 5 56 … - 138 - 105 Gambie Ghana 0 - 1 0 0 -3 549 -4 215 Ghana Guinea - 199 - 119 - 387 … - 845 -1 438 Guinée Guinea Bissau 0 0 0 0 - 62 - 58 Guinée Bissau Kenya - 878 -1 810 -1 793 -2 961 -3 604 -2 738 Kenya Liberia - 5 - 7 - 7 … - 535 - 926 Libéria Libya 27 021 35 451 10 489 21 435 470 20 418 Libye Mali - 527 - 902 - 591 - 754 -1 077 - 84 Mali Mauritania - 409 - 283 - 472 … - 314 - 690 Mauritanie Morocco - 64 -4 054 -4 185 … -7 986 -8 741 Maroc Niger - 319 - 594 -1 185 -1 186 -1 558 -1 509 Niger Nigeria 25 886 25 181 15 248 2 952 8 761 29 895 Nigéria São Tomé 0 0 0 0 - 63 - 58 São Tomé Senegal -1 190 -1 599 - 771 - 781 - 922 -1 087 Sénégal Sierra Leone - 194 - 285 - 260 … -1 524 -1 757 Sierra Leone Somalia … … … … … … Somalie Sudan -1 551 - 747 -1 033 121 - 303 -5 258 Soudan Togo - 196 - 188 - 160 - 209 - 267 - 215 Togo Tunisia - 939 -1 627 -1 102 -2 391 -3 371 -3 518 Tunisie CEN-SAD 48 951 49 179 7 164 10 062 -22 413 7 119 CEN-SAD

KeyStats 2013 II: CEN-SAD
4 EXTERNAL SECTOR SECTEUR EXTERIEUR 4 4.5 Capital and financial account
(in millions of US$) Compte des capitaux et des opérations financières
(en millions de $ EU) 4.5
COUNTRY 2007 2008 2009 2010 2011 2012 PAYS Benin 176 108 161 153 … … Bénin Burkina Faso 292 190 281 … … … Burkina Faso CAR … … … … … … RCA Chad …. … … … … … Tchad Comoros … … … … … … Comores Côte d’Ivoire 95 92 222 … … … Côte d’Ivoire Djibouti 35 54 55 55 60 … Djibouti Egypt 2 - 1 - 19 - 39 - 45 - 119 Egypte Eritrea … … … … … … Érythrée Gambia, The 2 1 … … 4 … Gambie Ghana 188 463 564 338 445 … Ghana Guinea 107 35 40 47 140 … Guinée Guinea Bissau 32 37 70 … … … Guinée Bissau Kenya 157 94 261 240 235 … Kenya Liberia … … … … … … Libéria Libya … … … … … … Libye Mali 323 352 411 251 … … Mali Mauritania … … … … … … Mauritanie Morocco - 3 - 2 0 0 … … Maroc Niger 326 808 255 … … … Niger Nigeria … … … … … … Nigéria São Tomé 254 56 40 40 46 40 São Tomé Senegal 467 238 303 … … … Sénégal Sierra Leone 634 66 74 62 157 … Sierra Leone Somalia … … … … … … Somalie Sudan … … … … 190 320 Soudan Togo 73 656 135 … … … Togo Tunisia 166 79 164 82 184 449 Tunisie CEN-SAD CEN-SAD

KeyStats 2013 II: CEN-SAD
4 EXTERNAL SECTOR SECTEUR EXTERIEUR 4 4.6 International financial flows
(in millions of US$) Flux financiers internationaux
(en millions de $ EU) 4.6
COUNTRY Official development assistance (net) / Appui public au développement (net)
Net foreign direct investment / PAYS Investissement direct étranger net
2009 2010 2011 2009 2010 2011 Benin 682 689 677 135 177 118 Bénin Burkina Faso 1 083 1 062 990 171 35 7 Burkina Faso CAR 242 261 272 42 92 109 RCA Chad 561 486 471 462 1 940 1 855 Tchad Comoros 50 67 52 9 4 7 Comores Côte d’Ivoire 2 402 845 1 437 381 339 344 Côte d’Ivoire Djibouti 167 132 142 100 27 78 Djibouti Egypt 999 592 410 6 712 2 189 2 078 Egypte Eritrea 144 161 163 0 56 19 Érythrée Gambia, The 127 120 135 47 37 36 Gambie Ghana 1 582 1 693 1 815 1 678 2 527 3 222 Ghana Guinea 214 218 208 141 101 956 Guinée Guinea Bissau 147 139 119 14 33 19 Guinée Bissau Kenya 1 776 1 629 2 474 141 178 335 Kenya Liberia 513 1 419 765 218 450 508 Libéria Libya 41 9 642 2 674 1 909 0 Libye Mali 984 1 093 3 004 109 402 291 Mali Mauritania 373 374 370 - 38 131 45 Mauritanie Morocco 930 993 1 237 1 952 1 574 2 519 Maroc Niger 469 263 241 739 940 1 014 Niger Nigeria 1 657 2 062 1 813 54 228 6 099 8 915 Nigéria São Tomé 31 50 0 14 25 18 São Tomé Senegal 1 016 928 1 052 208 237 265 Sénégal Sierra Leone 448 467 429 33 87 49 Sierra Leone Somalia 662 498 1 096 108 112 102 Somalie Sudan 2 289 2 055 1 300 3 034 2 064 2 314 Soudan Togo 499 419 557 50 86 54 Togo Tunisia 503 550 657 1 688 1 513 1 143 Tunisie CEN-SAD 20 591 19 274 22 528 75 050 23 364 26 420 CEN-SAD

KeyStats 2013 II: CEN-SAD
4 EXTERNAL SECTOR SECTEUR EXTERIEUR 4 4.7 Total international reserves
(in millions of US$) Réserves internationales totales
(en millions de $ EU) 4.7
COUNTRY 2007 2008 2009 2010 2011 2012 PAYS Benin 1 209 1 263 1 230 1 200 887 733 Bénin Burkina Faso 1 029 928 1 296 1 068 957 971 Burkina Faso CAR 83 122 211 181 155 166 RCA Chad 955 1 345 617 632 951 952 Tchad Comoros 117 112 150 145 155 171 Comores Côte d’Ivoire 2 519 2 253 3 267 3 624 4 316 3 742 Côte d’Ivoire Djibouti 132 175 242 249 244 253 Djibouti Egypt 30 188 32 216 32 253 33 743 15 046 11 785 Egypte Eritrea 34 58 ... 114 115 117 Érythrée Gambia, The 1 227 1 923 1 993 202 223 217 Gambie Ghana 2 117 2 032 3 165 4 778 5 498 5 383 Ghana Guinea 45 87 165 … 104 105 Guinée Guinea Bissau 113 125 169 156 220 159 Guinée Bissau Kenya 3 355 2 879 3 849 4 320 4 264 5 711 Kenya Liberia 119 161 372 466 513 500 Libéria Libya 79 405 92 313 98 725 99 894 104 999 116 763 Libye Mali 1 087 1 072 1 604 1 344 1 379 1 309 Mali Mauritania 209 189 225 272 485 950 Mauritanie Morocco 24 123 22 104 22 797 22 651 19 564 16 392 Maroc Niger 593 705 656 760 673 894 Niger Nigeria 51 334 53 002 44 763 34 956 35 249 46 442 Nigéria São Tomé 39 61 67 49 51 52 São Tomé Senegal 1 660 1 602 2 123 2 047 1 946 1 775 Sénégal Sierra Leone 217 220 405 409 439 436 Sierra Leone Somalia 217 211 ... … … … Somalie Sudan ... ... ... 1 036 193 … Soudan Togo 438 582 703 715 774 448 Togo Tunisia 7 851 8 849 11 057 9 471 7 465 6 443 Tunisie CEN-SAD 210 415 226 589 232 104 224 482 206 865 222 869 CEN-SAD

KeyStats 2013 II: CEN-SAD
4 EXTERNAL SECTOR SECTEUR EXTERIEUR 4 4.8 Total international reserves / average monthly
imports (ratio) Réserves internationales totales / Importations moyennes
mensuelles (ratio) 4.8
COUNTRY 2007 2008 2009 2010 2011 2012 PAYS Benin 6.63 6.17 6.39 6.02 … … Bénin Burkina Faso 6.99 4.56 7.64 4.83 … … Burkina Faso CAR … … … … … … RCA Chad … … … … … … Tchad Comoros … … … … … … Comores Côte d’Ivoire 3.15 2.49 3.61 3.65 … … Côte d’Ivoire Djibouti 2.73 2.99 5.00 6.05 4.27 0.00 Djibouti Egypt 6.95 5.97 7.36 6.70 3.29 2.49 Egypte Eritrea 0.00 0.00 0.00 0.00 … … Érythrée Gambia, The 4.08 3.43 7.43 7.09 6.82 6.06 Gambie Ghana 2.53 1.90 3.78 4.25 3.41 … Ghana Guinea 0.11 0.05 1.04 0.80 0.48 … Guinée Guinea Bissau 5.50 5.00 6.55 5.97 … … Guinée Bissau Kenya 3.89 2.70 4.01 3.75 3.08 … Kenya Liberia 0.74 0.84 2.42 3.10 1.85 … Libéria Libya 43.77 38.68 43.01 38.56 80.71 … Libye Mali 4.37 3.08 5.75 3.81 … … Mali Mauritania 0.00 0.00 0.00 0.00 … … Mauritanie Morocco 9.06 6.07 7.57 7.24 5.07 4.22 Maroc Niger 5.30 4.22 2.96 3.13 … Niger Nigeria 10.22 7.88 8.43 4.88 3.96 5.67 Nigéria São Tomé 5.50 6.36 7.64 4.71 4.20 4.30 São Tomé Senegal 3.51 2.61 4.54 4.42 … … Sénégal Sierra Leone 4.08 3.86 6.10 4.49 2.74 … Sierra Leone Somalia 0.00 0.00 0.00 0.00 … Somalie Sudan 1.31 1.13 0.97 0.85 0.21 0.22 Soudan Togo 3.58 3.96 4.75 4.40 … Togo Tunisia 4.18 3.71 5.81 4.41 3.31 3.67 Tunisie CEN-SAD 5.53 4.71 6.11 5.32 … … CEN-SAD

KeyStats 2013 II: CEN-SAD
4 EXTERNAL SECTOR SECTEUR EXTERIEUR 4 4.9 Exchange rate
(National currency / US$) Taux de change
(Monnaie nationale / $ EU) 4.9
COUNTRY Average Exchange Rate (Nati. Currency per
us$) Taux de change (moyen) (monnaie nat. par dollars) PAYS
2007 2008 2009 2010 2011 2012 Benin 479.30 448.37 471.78 495.50 471.87 510.53 Bénin Burkina Faso 479.30 448.37 471.78 495.50 471.87 510.53 Burkina Faso CAR 479.30 448.37 471.78 495.50 471.87 510.53 RCA Chad 479.30 448.37 471.78 495.50 471.87 510.53 Tchad Comoros 359.47 336.28 353.83 371.62 353.90 382.90 Comores Côte d’Ivoire 496.14 448.37 471.78 495.50 471.87 510.53 Côte d’Ivoire Djibouti 177.72 177.72 177.72 177.72 177.72 177.72 Djibouti Egypt 5.64 5.44 5.55 5.64 5.93 6.05 Egypte Eritrea 15.00 15.00 15.00 15.00 15.38 15.38 Érythrée Gambia, The 24.93 22.38 26.38 27.42 29.46 31.90 Gambie Ghana 103.2 116.7 155.4 157.9 166.8 198.2 Ghana Guinea 115.2 126.3 131.7 157.1 182.7 192.2 Guinée Guinea Bissau 479.30 448.37 471.78 495.50 471.87 510.53 Guinée Bissau Kenya 67.28 69.12 77.24 79.22 88.81 84.53 Kenya Liberia 58.69 62.89 67.99 70.79 72.23 73.51 Libéria Libya 1.26 1.22 1.25 1.27 1.22 1.26 Libye Mali 479.30 448.37 471.78 495.50 471.87 510.53 Mali Mauritania 257.60 239.80 259.71 274.81 281.12 296.62 Mauritanie Morocco 8.19 7.74 8.08 8.42 8.09 8.63 Maroc Niger 479.30 448.37 471.78 495.50 471.87 510.53 Niger Nigeria 125.63 118.88 149.35 151.12 154.74 156.81 Nigéria São Tomé 128.2 139.2 153.5 175.2 166.9 180.6 São Tomé Senegal 479.30 448.37 471.78 495.50 471.87 510.53 Sénégal Sierra Leone 103.3 103.2 117.2 137.7 150.5 150.4 Sierra Leone Somalia … … … … … … Somalie Sudan 2.11 2.31 2.31 2.67 3.49 Soudan Togo 479.30 448.37 471.78 495.50 471.87 510.53 Togo Tunisia 1.28 1.23 1.35 1.43 1.41 1.56 Tunisie
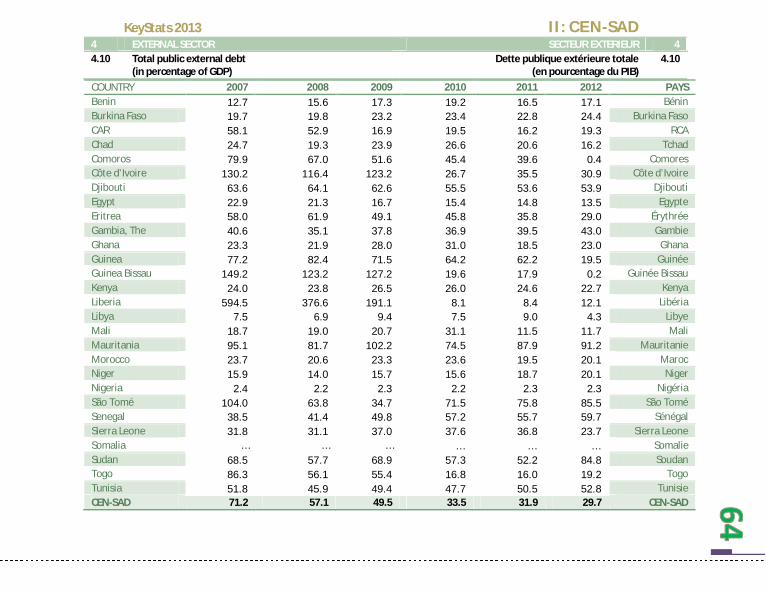
KeyStats 2013 II: CEN-SAD
4 EXTERNAL SECTOR SECTEUR EXTERIEUR 4 4.10 Total public external debt
(in percentage of GDP) Dette publique extérieure totale
(en pourcentage du PIB) 4.10
COUNTRY 2007 2008 2009 2010 2011 2012 PAYS Benin 12.7 15.6 17.3 19.2 16.5 17.1 Bénin Burkina Faso 19.7 19.8 23.2 23.4 22.8 24.4 Burkina Faso CAR 58.1 52.9 16.9 19.5 16.2 19.3 RCA Chad 24.7 19.3 23.9 26.6 20.6 16.2 Tchad Comoros 79.9 67.0 51.6 45.4 39.6 0.4 Comores Côte d’Ivoire 130.2 116.4 123.2 26.7 35.5 30.9 Côte d’Ivoire Djibouti 63.6 64.1 62.6 55.5 53.6 53.9 Djibouti Egypt 22.9 21.3 16.7 15.4 14.8 13.5 Egypte Eritrea 58.0 61.9 49.1 45.8 35.8 29.0 Érythrée Gambia, The 40.6 35.1 37.8 36.9 39.5 43.0 Gambie Ghana 23.3 21.9 28.0 31.0 18.5 23.0 Ghana Guinea 77.2 82.4 71.5 64.2 62.2 19.5 Guinée Guinea Bissau 149.2 123.2 127.2 19.6 17.9 0.2 Guinée Bissau Kenya 24.0 23.8 26.5 26.0 24.6 22.7 Kenya Liberia 594.5 376.6 191.1 8.1 8.4 12.1 Libéria Libya 7.5 6.9 9.4 7.5 9.0 4.3 Libye Mali 18.7 19.0 20.7 31.1 11.5 11.7 Mali Mauritania 95.1 81.7 102.2 74.5 87.9 91.2 Mauritanie Morocco 23.7 20.6 23.3 23.6 19.5 20.1 Maroc Niger 15.9 14.0 15.7 15.6 18.7 20.1 Niger Nigeria 2.4 2.2 2.3 2.2 2.3 2.3 Nigéria São Tomé 104.0 63.8 34.7 71.5 75.8 85.5 São Tomé Senegal 38.5 41.4 49.8 57.2 55.7 59.7 Sénégal Sierra Leone 31.8 31.1 37.0 37.6 36.8 23.7 Sierra Leone Somalia … … … … … … Somalie Sudan 68.5 57.7 68.9 57.3 52.2 84.8 Soudan Togo 86.3 56.1 55.4 16.8 16.0 19.2 Togo Tunisia 51.8 45.9 49.4 47.7 50.5 52.8 Tunisie CEN-SAD 71.2 57.1 49.5 33.5 31.9 29.7 CEN-SAD

KeyStats 2013 II: CEN-SAD
4 EXTERNAL SECTOR SECTEUR EXTERIEUR 4 4.11 Debt service
(in percentage of exports) Service de la dette
(en pourcentage des exportations) 4.11
COUNTRY 2007 2008 2009 2010 2011 2012 PAYS Benin 2.15 3.48 2.48 3.60 5.00 5.70 Bénin Burkina Faso 5.15 4.21 3.72 2.30 3.00 3.70 Burkina Faso CAR … … … 5.90 4.20 9.70 RCA Chad … … … 1.60 1.90 2.10 Tchad Comoros 37.52 15.21 14.85 13.40 7.70 10.60 Comores Côte d’Ivoire 4.37 9.01 9.46 1.40 5.20 7.50 Côte d’Ivoire Djibouti 6.93 7.21 8.01 7.48 8.00 9.20 Djibouti Egypt 6.12 5.61 6.38 6.02 11.60 11.40 Egypte Eritrea … … … 33.50 13.10 8.10 Érythrée Gambia, The 12.41 5.08 6.49 7.24 30.00 31.40 Gambie Ghana 2.95 3.21 3.01 3.36 3.20 4.80 Ghana Guinea 11.94 9.66 11.11 5.65 9.40 7.70 Guinée Guinea Bissau 7.39 5.60 … 667.70 0.40 1.10 Guinée Bissau Kenya 6.28 4.85 5.09 4.41 3.80 5.50 Kenya Liberia 114.18 119.65 13.54 1.28 0.80 1.00 Libéria Libya … … … 0.00 0.00 0.00 Libye Mali 3.19 2.65 3.13 2.52 5.40 6.00 Mali Mauritania 7.42 3.08 4.81 14.40 4.20 6.40 Mauritanie Morocco 14.21 12.08 12.49 10.68 6.40 6.50 Maroc Niger 3.98 2.62
1.30 3.50 1.40 Niger
Nigeria 1.78 0.63 0.83 0.45 0.30 0.50 Nigéria São Tomé 31.75 11.96 9.74 6.54 10.20 11.10 São Tomé Senegal 6.25 4.82
5.80 13.70 7.90 Sénégal
Sierra Leone 2.57 1.63 2.32 2.56 2.70 2.20 Sierra Leone Somalia … … … … … … Somalie Sudan 3.93 3.02 5.51 4.17 2.40 9.50 Soudan Togo 1.54 16.13 4.37 4.70 2.60 3.20 Togo Tunisia 12.10 7.82 10.40 10.36 11.50 10.70 Tunisie CEN-SAD 13.31 11.27 6.89 30.68 6.30 6.85 CEN-SAD

KeyStats 2013 II: CEN-SAD
4 EXTERNAL SECTOR SECTEUR EXTERIEUR 4 4.12 Tariffs and imports by product groups in % (in 2012) Tarifs et importations par groupe des produits en %
(en 2012) 4.12
COUNTRY Animal products Dairy products
Fruit, vegetables, plants
Coffee, tea Cereals & preparations PAYS
Benin 19.0 16.3 17.4 15.6 13.2 Bénin Burkina Faso 19.0 16.3 17.4 15.6 13.2 Burkina Faso CAR 20.0 20.0 26.8 29.9 19.6 RCA Chad 20.0 20.0 26.8 29.9 19.6 Tchad Comoros 8.0 4.9 7.6 16.3 11.1 Comores Côte d’Ivoire 19.0 16.3 17.4 15.6 13.2 Côte d’Ivoire Djibouti 10.0 12.1 10.2 23.8 8.7 Djibouti Egypt 15.6 6.0 8.9 10.5 15.3 Egypte Eritrea … … … … … Érythrée Gambia, The 15.2 12.5 18.8 19.2 18.3 Gambie Ghana … … … … … Ghana Guinea 18.8 12.9 16.9 17.3 13.5 Guinée Guinea Bissau 19.0 16.3 17.4 15.6 13.2 Guinée Bissau Kenya 23.3 43.3 22.1 19.6 23.6 Kenya Liberia 5.3 7.9 10.9 16.2 9.7 Libéria Libya … … … … … Libye Mali 19.0 16.3 17.4 15.6 13.2 Mali Mauritania … … … … … Mauritanie Morocco 105.3 62.5 40.3 20.1 40.7 Maroc Niger 19.0 16.3 17.4 15.6 13.2 Niger Nigeria 18.8 15.6 17.5 15.8 14.4 Nigéria São Tomé … … … … … São Tomé Senegal 19.0 16.3 17.4 15.6 13.2 Sénégal Sierra Leone 19.0 19.5 17.9 17.0 14.3 Sierra Leone Somalia … … … … … Somalie Sudan 34.9 38.9 36.0 28.8 23.6 Soudan Togo 19.0 16.3 17.4 15.6 13.2 Togo Tunisia 36.0 36.0 36.0 36.0 35.5 Tunisie
CEN-SAD 22.8 20.1 19.8 19.3 17.0 CEN-SAD

KeyStats 2013 II: CEN-SAD
COUNTRY Oilseeds, fats & oils
Sugars and confectionery
Beverages & tobacco
Cotton Other agricultural products
PAYS
Benin 10.7 11.3 18.6 5.0 9.1 Bénin Burkina Faso 10.7 11.3 18.6 5.0 9.1 Burkina Faso CAR 20.2 20.0 27.2 10.0 15.9 RCA Chad 20.2 20.0 27.2 10.0 15.9 Tchad Comoros 9.3 8.8 15.0 10.0 11.5 Comores Côte d’Ivoire 10.7 11.3 18.6 5.0 9.1 Côte d’Ivoire Djibouti 13.8 13.3 26.0 26.0 20.6 Djibouti Egypt 3.7 9.7 844.5 4.0 2.4 Egypte Eritrea … … … … … Érythrée Gambia, The 15.3 17.7 20.0 18.0 14.2 Gambie Ghana … … … … … Ghana Guinea 10.8 17.5 18.3 5.0 8.7 Guinée Guinea Bissau 10.7 11.3 18.6 5.0 9.1 Guinée Bissau Kenya 11.3 29.8 25.3 0.0 10.9 Kenya Liberia 8.4 12.9 23.7 5.0 11.7 Libéria Libya … … … … … Libye Mali 10.7 11.3 18.6 5.0 9.1 Mali Mauritania … … … … … Mauritanie Morocco 20.8 27.9 34.8 2.5 14.5 Maroc Niger 10.7 11.3 18.6 5.0 9.1 Niger Nigeria 17.5 13.8 19.0 5.0 9.1 Nigéria São Tomé … … … … … São Tomé Senegal 10.7 11.3 18.6 5.0 9.1 Sénégal Sierra Leone 11.0 14.9 19.5 5.0 10.5 Sierra Leone Somalia … … … … … Somalie Sudan 26.1 22.9 40.0 3.0 22.6 Soudan Togo 10.7 11.3 18.6 5.0 9.1 Togo Tunisia 31.4 36.0 35.5 0.0 24.1 Tunisie CEN-SAD 13.9 16.2 60.2 6.5 12.1 CEN-SAD

KeyStats 2013 II: CEN-SAD
COUNTRY Fish & fish products Minerals & metals Petroleum Chemicals PAYS
Benin 14.4 11.7 7.2 7.2 Bénin Burkina Faso 14.4 11.7 7.2 7.2 Burkina Faso CAR 24.4 17.0 10.0 11.5 RCA Chad 24.4 17.0 10.0 11.5 Tchad Comoros 6.2 9.3 5.0 9.8 Comores Côte d’Ivoire 14.4 11.7 7.2 7.2 Côte d’Ivoire Djibouti 13.1 23.8 25.1 25.3 Djibouti Egypt 5.4 7.9 2.8 5.7 Egypte Eritrea … … … … Érythrée Gambia, The 19.7 12.9 19.2 10.4 Gambie Ghana … … … … Ghana Guinea 14.3 11.1 14.2 7.4 Guinée Guinea Bissau 14.4 11.7 7.2 7.2 Guinée Bissau Kenya 24.7 10.6 4.3 4.0 Kenya Liberia 8.9 7.6 9.2 6.9 Libéria Libya … … … … Libye Mali 14.4 11.7 7.2 7.2 Mali Mauritania … … … … Mauritanie Morocco 15.8 8.9 14.3 5.4 Maroc Niger 14.4 11.7 7.2 7.2 Niger Nigeria 14.4 12.0 8.6 7.6 Nigéria São Tomé … … … … São Tomé Senegal 14.4 11.7 7.2 7.2 Sénégal
Sierra Leone 16.7 10.3 12.4 7.5 Sierra Leone
Somalia … … … … Somalie Sudan 39.5 22.2 9.5 8.1 Soudan Togo 14.4 11.7 7.2 7.2 Togo Tunisia 34.8 9.3 6.3 5.3 Tunisie CEN-SAD 17.2 12.4 9.5 8.4 CEN-SAD

KeyStats 2013 II: CEN-SAD
COUNTRY Wood, paper, etc. Textiles Clothing Leather, footwear, etc. PAYS
Benin 11.2 16.4 20.0 13.0 Bénin Burkina Faso 11.2 16.4 20.0 13.0 Burkina Faso CAR 19.4 19.7 30.0 20.5 RCA Chad 19.4 19.7 30.0 20.5 Tchad Comoros 5.7 10.0 10.0 7.4 Comores Côte d’Ivoire 11.2 16.4 20.0 13.0 Côte d’Ivoire Djibouti 22.5 17.7 12.6 23.6 Djibouti Egypt 11.4 10.9 28.8 12.2 Egypte Eritrea … … … … Érythrée Gambia, The 17.5 15.9 20.0 18.6 Gambie Ghana … … … … Ghana Guinea 11.2 16.4 20.0 13.1 Guinée Guinea Bissau 11.2 16.4 20.0 13.0 Guinée Bissau Kenya 16.0 19.6 25.2 12.7 Kenya Liberia 15.6 11.7 20.0 13.3 Libéria Libya Libye Mali 11.2 16.4 20.0 13.0 Mali Mauritania … … … … Mauritanie Morocco 15.3 8.9 24.3 14.8 Maroc Niger 11.2 16.4 20.0 13.0 Niger Nigeria 12.5 14.1 20.0 12.3 Nigéria São Tomé … … … … São Tomé Senegal 11.2 16.4 20.0 13.0 Sénégal Sierra Leone 11.7 14.6 19.9 16.3 Sierra Leone Somalia … … … … Somalie
Sudan 22.5 27.4 40.0 25.9 Soudan Togo 11.2 16.4 20.0 13.0 Togo Tunisia 19.1 14.4 29.6 20.2 Tunisie CEN-SAD 14.1 16.0 22.3 15.2 CEN-SAD

KeyStats 2013 II: CEN-SAD
COUNTRY Non-electrical machinery
Electrical machinery Transport equipment
Manufactures, n.e.s.
PAYS
Benin 7.0 11.2 8.7 14.4 Bénin Burkina Faso 7.0 11.2 8.7 14.4 Burkina Faso CAR 12.3 16.8 15.6 21.9 RCA Chad 12.3 16.8 15.6 21.9 Tchad Comoros 5.0 9.9 6.5 9.3 Comores Côte d’Ivoire 7.0 11.2 8.7 14.4 Côte d’Ivoire Djibouti 21.4 21.5 21.8 25.7 Djibouti Egypt 4.9 7.9 13.0 11.7 Egypte Eritrea … … … … Érythrée Gambia, The 6.3 17.4 13.3 16.6 Gambie Ghana … … … … Ghana Guinea 6.3 11.3 9.6 14.8 Guinée Guinea Bissau 7.0 11.2 8.7 14.4 Guinée Bissau Kenya 3.2 10.8 6.2 14.8 Kenya Liberia 7.4 9.5 8.3 15.7 Libéria Libya … … … … Libye Mali 7.0 11.2 8.7 14.4 Mali Mauritania … … … … Mauritanie Morocco 4.4 6.0 9.5 4.8 Maroc Niger 7.0 11.2 8.7 14.4 Niger Nigeria 6.2 9.8 8.3 13.5 Nigéria São Tomé … … … … São Tomé Senegal 7.0 11.2 8.7 14.4 Sénégal Sierra Leone 6.6 14.0 7.2 14.4 Sierra Leone Somalia … … … … Somalie Sudan 7.7 15.9 13.5 20.6 Soudan Togo 7.0 11.2 8.7 14.4 Togo Tunisia 6.4 14.3 11.3 12.1 Tunisie CEN-SAD 7.6 12.3 10.4 15.1 CEN-SAD

KeyStats 2013 II: CEN-SAD
4 EXTERNAL SECTOR SECTEUR EXTERIEUR 4 4.13 Intra- and inter-regional trade
(in millions of US$) Commerce intra- et inter-régional
(en millions de $E.U.) 4.13
Exports to 2007 2008 2009 2010 2011 2012 Exportations vers Africa 16,906 20,225 24,194 28,944 34625.11 41421.77 Afrique AMU 3,034 3,629 4,342 5,194 6213.51 7433.17 UMA CEN-SAD 11,975 14,325 17,137 20,501 24525.71 29339.93 CEN-SAD COMESA 3,883 4,645 5,557 6,648 7953.09 9514.23 COMESA EAC 1,531 1,832 2,191 2,622 3136.16 3751.76 CAE ECCAS 1,993 2,384 2,852 3,412 4081.90 4883.15 CEEAC ECOWAS 7,911 9,464 11,322 13,544 16202.65 19383.12 CEDEAO IGAD 2,171 2,597 3,107 3,717 4446.97 5319.88 IGAD SADC 3,040 3,636 4,350 5,204 6,226 7,448 SADC
Imports from Importations de Africa 15,106 16,456 17,928 19,530 21,276 23,179 Afrique AMU 3,964 4,319 4,705 5,126 5,584 6,083 UMA CEN-SAD 11,963 13,032 14,197 15,467 16,850 18,356 CEN-SAD COMESA 3,325 3,622 3,946 4,299 4,683 5,102 COMESA EAC 482 525 571 623 678 739 CAE ECCAS 565 616 671 731 796 868 CEEAC ECOWAS 7,339 7,996 8,710 9,489 10,337 11,262 CEDEAO IGAD 938 1,022 1,113 1,213 1,321 1,439 IGAD SADC 2,688 2,928 3,190 3,475 3,785 4,124 SADC

III COMESA
The Common Market for Eastern and Southern Africa (COMESA) was established in 1993, by 19
countries. It adopts three strategies to promote integration:
market integration, production/project oriented
integration, and development integration.
Le Marché Commun pour l’Afrique de l’Est et Australe
(COMESA) fut créé en 1993, par 19 pays. Il utilise trois stratégies pour promouvoir l’intégration: le
modèle de marché, le modèle orienté production/projet, et le modèle orienté développement.

KeyStats 2013 III: COMESA
0 POPULATION POPULATION 0 0.1 Total population
(in millions) Population totale
(en millions) 0.1
COUNTRY 2007 2008 2009 2010 2011 2012 PAYS Burundi 8.3 8.6 8.9 9.2 9.5 9.8 Burundi Comoros 0.6 0.6 0.7 0.7 0.7 0.7 Comores DR Congo 57.2 58.8 60.5 62.2 63.9 65.7 R. D. Congo Djibouti 0.8 0.8 0.8 0.8 0.8 0.9 Djibouti Egypt 74.2 75.5 76.8 78.1 79.4 80.7 Egypte Eritrea 5.2 5.4 5.6 5.7 5.9 6.1 Érythrée Ethiopia 80.4 82.6 84.8 87.1 89.4 91.7 Ethiopie Kenya 37.8 38.8 39.8 40.9 42.0 43.2 Kenya Libya 5.8 5.9 6.0 6.0 6.1 6.2 Libye Madagascar 19.4 19.9 20.5 21.1 21.7 22.3 Madagascar Malawi 13.7 14.1 14.6 15.0 15.5 15.9 Malawi Mauritius 1.3 1.3 1.3 1.3 1.3 1.3 Maurice Rwanda 9.9 10.2 10.5 10.8 11.1 11.5 Rwanda Seychelles 0.1 0.1 0.1 0.1 0.1 0.1 Seychelles Sudan 33.2 34.0 34.9 35.7 36.4 37.2 Soudan Swaziland 1.1 1.2 1.2 1.2 1.2 1.2 Swaziland Uganda 30.7 31.8 32.9 34.0 35.1 36.3 Ouganda Zambia 12.1 12.5 12.8 13.2 13.6 14.1 Zambie Zimbabwe 12.7 12.8 12.9 13.1 13.4 13.7 Zimbabwe COMESA 404.7 414.9 425.4 436.2 447.3 458.7 COMESA

KeyStats 2013 III: COMESA
0 POPULATION POPULATION 0 0.2 Population structure
(in percentage of total population) Structure de la population
(en pourcentage de la population totale) 0.2
COUNTRY Female / Femmes Urban / Urbaine
PAYS 2010 2011 2012 2010 2011 2012
Burundi 50.9 50.9 50.6 10.6 10.9 11.2 Burundi Comoros 49.6 49.6 49.6 28.0 28.1 28.2 Comores DR Congo 50.3 50.3 50.3 33.7 34.3 34.8 R. D. Congo Djibouti 50.0 50.0 49.8 77.0 77.1 77.2 Djibouti Egypt 49.8 49.8 49.8 43.4 43.5 43.7 Egypte Eritrea 50.7 50.7 50.1 20.9 21.4 21.8 Érythrée Ethiopia 50.2 50.2 50.0 16.8 17.0 17.3 Ethiopie Kenya 50.1 50.1 50.1 23.6 24.0 24.4 Kenya Libya 49.3 49.6 49.6 77.6 77.7 77.9 Libye Madagascar 50.2 50.1 50.2 31.9 32.6 33.2 Madagascar
Malawi 51.2 51.1 49.9 15.5 15.7 15.8 Malawi Mauritius 50.7 50.7 50.6 41.8 41.8 41.8 Maurice Rwanda 50.9 50.9 51.2 18.8 19.1 19.4 Rwanda Seychelles 43.8 44.3 49.0 53.2 53.6 54.0 Seychelles Sudan 48.8 49.2* 49.8 33.1 33.2 33.4 Soudan Swaziland 52.6 52.6 50.7 21.3 21.3 21.2 Swaziland Uganda 50.0 50.0 49.9 15.2 15.6 16.0 Ouganda Zambia 49.9 49.9 50.1 38.7 39.2 39.6 Zambie Zimbabwe 50.7 50.7 50.7 38.1 38.6 39.1 Zimbabwe COMESA 50.0 50.0 50.1 33.6 33.9 34.2 COMESA

KeyStats 2013 III: COMESA
0 POPULATION POPULATION 0 0.2 Population structure (cont’d)
(in percentage of total population) Structure de la population (suite)
(en pourcentage de la population totale) 0.2
COUNTRY Eco. active population / Population éco. Active
(Thousands)
Economically active female / male ratio
PAYS Ratio femmes / Hommes économiquement. actifs
2010 2011 2012 2010 2011 2012 Burundi 4 163 4 278 4 385 51.8 51.7 51.6 Burundi Comoros 234 240 247 30.3 30.5 30.7 Comores DR Congo 24 163 24 944 25 765 49.8 49.7 49.7 R. D. Congo Djibouti 289 298 307 35 35.2 35.4 Djibouti Egypt 26 643 27 289 27 929 24.3 24.4 24.6 Egypte Eritrea 2 534 2 616 2 700 48.6 48.6 48.6 Érythrée Ethiopia 39 262 40 556 41 885 47.5 47.6 47.7 Ethiopie Kenya 14 860 15 335 15 815 46.3 46.3 46.3 Kenya Libya 2 333 2 328 2 308 28.2 28.5 28.8 Libye Madagascar 9 739 10 072 10 419 49.1 49.1 49.1 Madagascar Malawi 4 220 4 362 6 682 51.5 51.4 51.2 Malawi Mauritius 603 607 609 37.8 37.9 38.2 Maurice Rwanda 5 070 5 208 5 358 51.9 51.8 51.8 Rwanda Seychelles ... ... … 0 0 … Seychelles Sudan 13 991 14 437 14 255 29.3 29.4 29.5 Soudan Swaziland 401 411 422 39.7 39.6 39.5 Swaziland Uganda 12 866 13 283 5 555 49.2 49.2 49.1 Ouganda Zambia 5 284 5 416 6 634 45.8 45.7 45.7 Zambie Zimbabwe 6 246 6 420 7 713 49.1 49.1 49 Zimbabwe COMESA 172 903 178 100 178 988 40.3 40.3 42.6 COMESA

KeyStats 2013 III: COMESA
1 REAL SECTOR SECTEUR REEL 1 1.1 GDP at current
(in millions of US$) PIB à prix courant
(en millions de $ EU) 1.1
COUNTRY 2007 2008 2009 2010 2011 2012 PAYS Burundi 922 1 078 1 225 1 380 2 356 2 472 Burundi Comoros 462 520 520 523 614 596 Comores DR Congo 10 029 11 933 11 153 13 191 15 713 17 870 R. D. Congo Djibouti 848 983 1 049 1 129 1 239 … Djibouti Egypt 132 235 164 841 187 986 215 464 235 719 257 286 Egypte Eritrea 1 318 1 380 1 857 2 117 2 609 3 092 Érythrée Ethiopia 19 182 25 866 28 477 26 593 31 715 43 133 Ethiopie Kenya 27 237 30 508 30 561 32 212 34 059 37 338 Kenya Libya 62 668 81 376 58 762 69 823 35 699 … Libye Madagascar 7 343 9 413 8 552 8 739 9 901 9 975 Madagascar Malawi 3 648 4 088 4 726 5 132 5 607 4 264 Malawi Mauritius 7 792 9 641 8 824 9 709 11 268 10 492 Maurice Rwanda 3 741 4 707 5 253 5 624 6 332 7 103 Rwanda Seychelles 1 039 958 842 960 1 017 1 032 Seychelles Sudan 56 554 60 832 58 982 70 523 63 997 58 769 Soudan Swaziland 3 054 3 006 3 170 3 696 3 977 3 747 Swaziland Uganda 13 549 16 378 16 554 17 715 17 425 19 881 Ouganda Zambia 11 541 14 641 12 805 16 190 19 206 20 678 Zambie Zimbabwe 1 630 … 6 133 7 433 9 458 10 814 Zimbabwe COMESA 364 791 442 149 447 433 508 154 507 911 508 541 COMESA

KeyStats 2013 III: COMESA
1 REAL SECTOR SECTEUR REEL 1 1.2 Structure of GDP
(in percentage) Structure du PIB
(en pourcentage) 1.2
COUNTRY Agriculture / Agriculture
Industry / Manufacture / Manufacture
Services etc. / Services etc. PAYS Industrie
2004 2011 2004 2011 2004 2011 2004 2011 Burundi 52.2 41.6 15.5 20.5 10.0 14.6 32.3 37.9 Burundi Comoros 41.1 39.6 11.8 11.8 4.2 5.2 47.1 48.6 Comores DR Congo 24.9 22.2 33.2 37.4 18.4 23.2 41.9 40.4 R. D. Congo Djibouti 3.5 3.7 16.2 22.4 2.6 2.6 80.2 73.9 Djibouti Egypt 15.2 14.5 36.9 37.6 18.3 16.5 48.0 47.9 Egypte Eritrea 11.6 17.0 21.3 24.1 9.3 6.1 67.1 58.9 Érythrée Ethiopia 44.2 45.6 14.1 10.6 5.3 3.9 41.8 43.9 Ethiopie Kenya 28.0 27.7 18.2 17.1 11.2 10.7 53.7 55.1 Kenya Libya 2.7 1.9 71.2 50.4 5.2 2.2 26.0 47.7 Libye Madagascar 28.8 29.0 18.5 18.8 14.7 12.8 52.7 52.2 Madagascar Malawi 34.9 31.6 17.6 17.8 10.1 11.3 47.5 50.6 Malawi Mauritius 6.1 3.6 28.0 25.9 20.1 16.9 66.0 70.6 Maurice Rwanda 41.8 34.8 15.1 17.8 7.5 7.2 43.1 47.4 Rwanda Seychelles 4.3 2.7 18.3 16.5 9.5 8.7 77.4 80.7 Seychelles Sudan 35.2 34.8 20.9 27.7 8.4 8.9 43.8 37.5 Soudan Swaziland 8.9 7.2 45.5 45.9 39.6 42.2 45.6 46.9 Swaziland Uganda 25.0 24.9 24.5 27.3 7.6 9.2 50.4 47.8 Ouganda Zambia 23.4 20.1 28.0 38.6 11.9 8.7 48.6 41.3 Zambie Zimbabwe 7.6 15.6 32.7 36.2 16.8 18.0 59.7 48.1 Zimbabwe COMESA 23.1 22.0 25.7 26.5 12.1 12.0 51.2 51.4 COMESA

KeyStats 2013 III: COMESA
1 REAL SECTOR SECTEUR REEL 1 1.3 Real GDP Growth
(in percentage) Croissance réelle du PIB
(en pourcentage) 1.3
COUNTRY 2007 2008 2009 2010 2011 2012 PAYS Burundi 3.6 4.5 3.5 3.9 4.2 4.0 Burundi Comoros 0.8 0.2 1.2 1.8 2.2 2.5 Comores DR Congo 6.3 6.2 2.8 7.1 6.9 7.1 R. D. Congo Djibouti 5.0 5.0 5.5 4.5 4.5 4.8 Djibouti Egypt 7.1 7.3 4.9 4.8 1.8 2.0 Egypte Eritrea 1.4 - 9.8 3.9 2.2 8.7 7.0 Érythrée Ethiopia 11.5 10.8 8.8 12.6 7.5 7.0 Ethiopie Kenya 7.0 1.5 2.6 5.6 4.4 4.7 Kenya Libya 5.1 2.7 - 0.7 4.2 -59.7 121.9 Libye
Madagascar 6.2 7.1 - 4.1 0.5 1.8 1.9 Madagascar Malawi 9.6 8.3 8.9 6.7 4.3 1.9 Malawi Mauritius 5.8 5.5 3.3 4.1 4.1 3.3 Maurice Rwanda 7.7 11.1 6.2 7.2 8.6 7.7 Rwanda Seychelles 9.9 - 1.0 0.5 6.7 5.1 2.8 Seychelles Sudan 8.1 7.8 6.1 6.4 -4.5 -11.2 Soudan Swaziland 3.5 2.3 1.3 - 1.1 0.3 -1.5 Swaziland Uganda 8.1 10.4 4.2 6.1 5.1 2.6 Ouganda Zambia 6.2 5.7 6.4 7.6 6.6 7.3 Zambie Zimbabwe - 3.3 - 9.9 6.0 9.6 9.4 4.4 Zimbabwe COMESA 5.8 4.0 3.8 5.3 1.1 9.5 COMESA
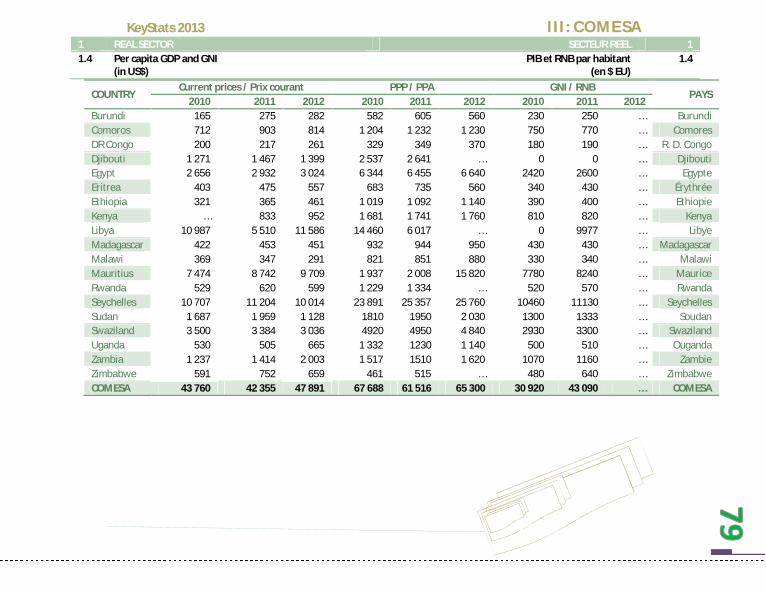
KeyStats 2013 III: COMESA
1 REAL SECTOR SECTEUR REEL 1 1.4 Per capita GDP and GNI
(in US$) PIB et RNB par habitant
(en $ EU) 1.4
COUNTRY Current prices / Prix courant PPP / PPA GNI / RNB
PAYS 2010 2011 2012 2010 2011 2012 2010 2011 2012
Burundi 165 275 282 582 605 560 230 250 … Burundi Comoros 712 903 814 1 204 1 232 1 230 750 770 … Comores DR Congo 200 217 261 329 349 370 180 190 … R. D. Congo Djibouti 1 271 1 467 1 399 2 537 2 641 … 0 0 … Djibouti Egypt 2 656 2 932 3 024 6 344 6 455 6 640 2420 2600 … Egypte Eritrea 403 475 557 683 735 560 340 430 … Érythrée Ethiopia 321 365 461 1 019 1 092 1 140 390 400 … Ethiopie Kenya … 833 952 1 681 1 741 1 760 810 820 … Kenya Libya 10 987 5 510 11 586 14 460 6 017 … 0 9977 … Libye Madagascar 422 453 451 932 944 950 430 430 … Madagascar Malawi 369 347 291 821 851 880 330 340 … Malawi Mauritius 7 474 8 742 9 709 1 937 2 008 15 820 7780 8240 … Maurice Rwanda 529 620 599 1 229 1 334 … 520 570 … Rwanda Seychelles 10 707 11 204 10 014 23 891 25 357 25 760 10460 11130 … Seychelles Sudan 1 687 1 959 1 128 1810 1950 2 030 1300 1333 … Soudan Swaziland 3 500 3 384 3 036 4920 4950 4 840 2930 3300 … Swaziland Uganda 530 505 665 1 332 1230 1 140 500 510 … Ouganda Zambia 1 237 1 414 2 003 1 517 1510 1 620 1070 1160 … Zambie Zimbabwe 591 752 659 461 515 … 480 640 … Zimbabwe COMESA 43 760 42 355 47 891 67 688 61 516 65 300 30 920 43 090 … COMESA

KeyStats 2013 III: COMESA
1 REAL SECTOR SECTEUR REEL 1 1.5 Inflation
(in percentage) Inflation
(en pourcentage) 1.5
COUNTRY 2007 2008 2009 2010 2011 2012 PAYS Burundi 8.4 24.5 10.5 6.5 9.6 18.2 Burundi Comoros 4.4 4.9 -3.1 2.1 3.2 6.4 Comores DR Congo 22.3 44.7 34.8 17.2 7.7 4.0 R. D. Congo Djibouti 5.0 12.0 1.7 4.0 5.1 3.7 Djibouti Egypt 9.5 18.3 11.8 11.1 10.1 7.1 Egypte Eritrea 9.3 19.9 34.7 20.5 13.3 ... Érythrée Ethiopia 15.8 37.8 7.6 17.7 32.0 22.7 Ethiopie Kenya 9.8 26.2 19.6 4.1 14.0 9.6 Kenya Libya 6.3 10.4 2.5 2.5 7.2 ... Libye Madagascar 10.4 9.2 9.0 9.2 9.5 7.4 Madagascar Malawi 8.0 8.7 8.4 7.4 7.6 21.3 Malawi Mauritius 8.8 9.7 2.5 2.9 6.5 3.9 Maurice Rwanda 9.0 15.4 10.0 1.8 3.1 10.3 Rwanda Seychelles 5.3 37.0 31.7 -2.4 2.6 7.1 Seychelles Sudan 8.1 14.3 11.2 13.0 18.1 35.6 Soudan Swaziland 8.1 12.6 7.5 4.5 6.1 8.9 Swaziland Uganda 6.1 12.0 13.0 4.0 18.7 14.0 Ouganda Zambia 8.9 16.6 13.4 8.5 8.6 7.3 Zambie Zimbabwe 12562581.0 ... -7.9 3.1 3.5 3.7 Zimbabwe
CPI National

KeyStats 2013 III: COMESA
1 REAL SECTOR SECTEUR REEL 1 1.5 Inflation
(in percentage) Inflation
(en pourcentage) 1.5
COUNTRY 2007 2008 2009 2010 2011 2012 PAYS Burundi … … … … … … Burundi Comoros … … … … … … Comores DR Congo … … … … … … R. D. Congo Djibouti … … … … … … Djibouti Egypt … … … … … … Egypte Eritrea … … … … … … Érythrée Ethiopia … … … … … … Ethiopie Kenya … … … … … … Kenya Libya … … … … … … Libye Madagascar … … … … … … Madagascar Malawi … … … … … … Malawi Mauritius … … … … … … Maurice Rwanda … … … … … … Rwanda Seychelles … … … … … … Seychelles Sudan … … … … … … Soudan Swaziland … … … … … … Swaziland Uganda … … … … … … Ouganda Zambia … … … … … … Zambie Zimbabwe … … … … … … Zimbabwe
Harmonized CPI

KeyStats 2013 III: COMESA
2 GOVERNMENT FINANCE FINANCES PUBLIQUES 2 2.1a Total revenue plus grants
(in percentage of GDP) Recettes totales plus dons
(en pourcentage du PIB) 2.1a
COUNTRY 2001 2005 2008 2009 2010 2011 PAYS Burundi … … … … … … Burundi Comoros … … … … … … Comores DR Congo … … … … … … R. D. Congo Djibouti … … … … … … Djibouti Egypt … … … … … … Egypte Eritrea … … … … … … Érythrée Ethiopia … … … … … … Ethiopie Kenya … … … … … … Kenya Libya … … … … … … Libye Madagascar … … … … … … Madagascar Malawi … … … … … … Malawi Mauritius … … … … … … Maurice Rwanda … … … … … … Rwanda Seychelles … … … … … … Seychelles Sudan … … … … … … Soudan Swaziland … … … … … … Swaziland Uganda … … … … … … Ouganda Zambia … … … … … … Zambie Zimbabwe … … … … … … Zimbabwe
COMESA … … … … … … COMESA

KeyStats 2013 III: COMESA
2 GOVERNMENT FINANCE FINANCES PUBLIQUES 2 2.1b Total revenue
(in percentage of GDP) Recettes totales
(en pourcentage du PIB) 2.1b
COUNTRY 2005 2008 2009 2010 2011 2012 PAYS Burundi 32.5 30.3 27.4 31.0 26.2 26.3 Burundi Comoros 20.0 24.7 24.3 30.3 21.3 21.6 Comores DR Congo 16.4 20.3 22.7 20.5 19.5 19.6 R. D. Congo Djibouti 37.1 41.9 37.0 35.4 35.5 36.1 Djibouti Egypt 20.4 3.2 27.1 22.2 19.3 18.6 Egypte Eritrea ... ... … … … … Érythrée Ethiopia 18.9 16.4 16.3 17.3 16.7 15.2 Ethiopie Kenya 21.5 22.9 22.4 25.2 24.7 25.7 Kenya Libya 62.9 69.9 56.7 67.8 37.9 50.2 Libye Madagascar 12.3 16.6 12.3 13.3 13.2 12.2 Madagascar Malawi 26.0 29.9 31.9 33.6 30.9 22.2 Malawi Mauritius 21.2 19.5 22.1 21.9 21.3 21.5 Maurice Rwanda 24.0 27.1 24.3 26.2 30.6 25.1 Rwanda Seychelles 43.0 36.4 37.2 35.4 38.2 41.9 Seychelles Sudan 18.3 21.8 14.6 15.7 18.9 12.0 Soudan Swaziland 35.4 33.4 35.1 34.2 24.8 38.9 Swaziland Uganda 17.3 16.2 13.5 13.4 19.6 15.6 Ouganda Zambia 23.3 22.3 20.3 19.6 21.9 21.6 Zambie Zimbabwe ... … 15.9 17.8 32.9 32.6 Zimbabwe COMESA 26.5 26.6 25.6 26.7 25.2 25.4 COMESA

KeyStats 2013 III: COMESA
2 GOVERNMENT FINANCE FINANCES PUBLIQUES 2 2.2 Total expenditure
(in percentage of GDP) Dépenses totales
(en pourcentage du PIB) 2.2
COUNTRY 2005 2008 2009 2010 2011 2012 PAYS Burundi 34.7 33.4 35.8 36.6 40.0 34.6 Burundi Comoros 19.9 27.2 23.7 23.0 22.1 25.5 Comores DR Congo 19.5 19.0 21.8 22.1 29.1 32.9 R. D. Congo Djibouti 36.9 40.6 41.6 35.9 39.2 37.2 Djibouti Egypt 29.4 2.7 33.7 30.3 31.8 33.4 Egypte Eritrea ... ... … … 33.6 30.7 Érythrée Ethiopia 23.1 19.4 17.2 19.0 18.4 17.1 Ethiopie
Kenya 21.1 28.5 29.3 31.6 29.1 30.5 Kenya Libya 33.5 43.0 50.7 57.1 66.6 51.4 Libye Madagascar 21.0 18.5 14.8 14.1 16.0 15.0 Madagascar Malawi 29.8 34.0 37.1 34.4 35.1 43.2 Malawi Mauritius 23.6 22.7 28.0 28.3 24.7 23.3 Maurice Rwanda 23.7 26.7 25.2 26.8 27.0 27.2 Rwanda Seychelles 36.0 39.8 32.0 32.8 35.7 40.9 Seychelles
Sudan 10.2 23.2 18.9 18.7 17.9 15.1 Soudan Swaziland 37.5 30.9 37.0 40.3 31.2 34.3 Swaziland Uganda 18.0 18.6 15.5 17.7 20.6 19.2 Ouganda Zambia 26.0 24.6 22.4 22.7 23.9 25.8 Zambie Zimbabwe ... … 17.5 23.2 34.6 36.6 Zimbabwe COMESA 26.1 26.6 27.9 28.6 30.3 30.2 COMESA

KeyStats 2013 III: COMESA
2 GOVERNMENT FINANCE FINANCES PUBLIQUES 2 2.3 Fiscal balance
(Surplus+ / Deficit-) (in percentage of GDP)
Solde budgétaire (Excédent+ / Déficit-)
(en pourcentage du PIB)
2.2
COUNTRY 2005 2008 2009 2010 2011 2012 PAYS Burundi -2.3 -3.1 -8.4 -5.7 -8.4 -8.0 Burundi Comoros 0.1 -2.6 0.6 7.3 -1.8 -2.3 Comores DR Congo -0.8 -2.4 0.9 -1.6 -1.8 -3.5 R. D. Congo Djibouti 0.2 1.3 -4.6 -0.5 -0.1 -2.0 Djibouti Egypt -9.0 0.5 -6.6 -8.1 -10.0 -10.8 Egypte Eritrea ... ... ... ... ... ... Érythrée Ethiopia -4.2 -3.0 -0.9 -1.7 -1.6 0.2 Ethiopie Kenya 0.4 -5.6 -6.9 -6.3 -4.5 -4.7 Kenya Libya 29.4 26.9 6.0 10.7 -15.6 13.1 Libye Madagascar -8.7 -1.9 -2.5 -0.9 -1.7 -3.1 Madagascar Malawi -3.8 -4.2 -5.1 -0.8 -2.8 -7.2 Malawi Mauritius -2.4 -3.1 -6.0 -6.4 -6.4 -2.9 Maurice Rwanda 0.3 0.5 -0.8 -0.6 5.0 -1.9 Rwanda Seychelles 7.0 -3.3 5.2 2.5 2.5 2.6 Seychelles Sudan 8.1 -1.4 -4.3 -2.9 -1.0 -4.4 Soudan Swaziland -2.1 2.5 -1.9 -6.0 -13.5 3.0 Swaziland Uganda -0.7 -2.3 -2.0 -4.3 -3.6 -3.0 Ouganda Zambia -2.7 -2.2 -2.1 -3.1 -3.4 -4.2 Zambie Zimbabwe ... … -1.6 -5.4 -3.4 -4.0 Zimbabwe COMESA 0.5 -0.2 -2.3 -1.9 -4.0 -2.4 COMESA

KeyStats 2013 III: COMESA
3 MONETARY AND FINANCIAL SECTOR SECTEUR MONETAIRE ET FINANCIER 3 3.1 Money (M1)
(in millions of US$) Monnaie (M1)
(en millions de DEU) 3.1
COUNTRY 2007 2008 2009 2010 2011 2012 PAYS Burundi 3 689 4 335 4 371 4 868 4 850 5 391 Burundi Comoros 32 141 34 769 35 754 42 650 48 820 ... Comores DR Congo 300 273 355 960 432 823 634 990 ... ... R. D. Congo Djibouti 67 541 78 784 98 176 121 675 ... ... Djibouti Egypt 131 290 170 579 182 991 214 040 248 707 ... Egypte Eritrea 12 710 15 320 17 291 18 536 ... ... Érythrée Ethiopia 38 904 49 106 42 113 52 435 76 171 ... Ethiopie Kenya 444 662 523 835 528 382 680 049 765 124 ... Kenya Libya 22 014 33 323 37 392 ... ... ... Libye Madagascar 2 075 2 172 2 308 2 519 ... 3 390 Madagascar Malawi 50 730 70 534 81 658 ... ... ... Malawi Mauritius 47 219 53 186 60 904 63 835 68 117 76 214 Maurice Rwanda 215 000 248 500 261 000 330 600 381 900 ... Rwanda Seychelles 1 602 1 832 2 163 2 569 2 697 2 485 Seychelles Sudan 19 715 22 933 28 315 19 908 24 850 ... Soudan Swaziland 1 666 1 971 2 335 2 530 2 868 ... Swaziland Uganda 2 287 019 2 891 555 3 255 355 4 382 206 4 546 748 5 408 362 Ouganda Zambia 8 426 441 10 634 061 12 991 735 17 916 536 21 804 779 25 698 988 Zambie Zimbabwe 425 445 000 ... 6 14 20 21 Zimbabwe COMESA 437549 691 15192 755 18065 072 24489 960 … … COMESA
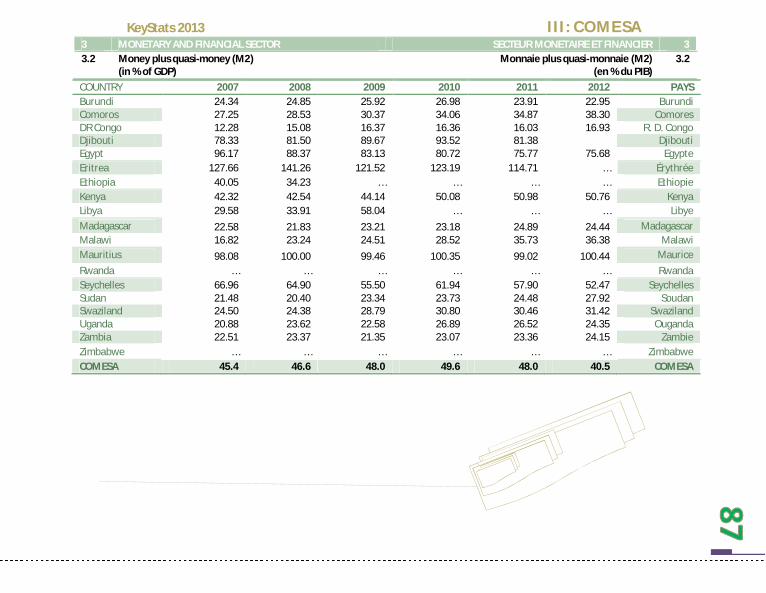
KeyStats 2013 III: COMESA
3 MONETARY AND FINANCIAL SECTOR SECTEUR MONETAIRE ET FINANCIER 3 3.2 Money plus quasi-money (M2)
(in % of GDP) Monnaie plus quasi-monnaie (M2)
(en % du PIB) 3.2
COUNTRY 2007 2008 2009 2010 2011 2012 PAYS Burundi 24.34 24.85 25.92 26.98 23.91 22.95 Burundi Comoros 27.25 28.53 30.37 34.06 34.87 38.30 Comores DR Congo 12.28 15.08 16.37 16.36 16.03 16.93 R. D. Congo Djibouti 78.33 81.50 89.67 93.52 81.38 Djibouti Egypt 96.17 88.37 83.13 80.72 75.77 75.68 Egypte Eritrea 127.66 141.26 121.52 123.19 114.71 … Érythrée Ethiopia 40.05 34.23 … … … … Ethiopie Kenya 42.32 42.54 44.14 50.08 50.98 50.76 Kenya Libya 29.58 33.91 58.04 … … … Libye Madagascar 22.58 21.83 23.21 23.18 24.89 24.44 Madagascar Malawi 16.82 23.24 24.51 28.52 35.73 36.38 Malawi Mauritius 98.08 100.00 99.46 100.35 99.02 100.44 Maurice Rwanda … … … … … … Rwanda Seychelles 66.96 64.90 55.50 61.94 57.90 52.47 Seychelles Sudan 21.48 20.40 23.34 23.73 24.48 27.92 Soudan Swaziland 24.50 24.38 28.79 30.80 30.46 31.42 Swaziland Uganda 20.88 23.62 22.58 26.89 26.52 24.35 Ouganda Zambia 22.51 23.37 21.35 23.07 23.36 24.15 Zambie Zimbabwe … … … … … … Zimbabwe COMESA 45.4 46.6 48.0 49.6 48.0 40.5 COMESA

KeyStats 2013 III: COMESA
3 MONETARY AND FINANCIAL SECTOR SECTEUR MONETAIRE ET FINANCIER 3 3.3 Domestic credit
(in percentage of GDP) Crédit intérieur
(en pourcentage du PIB) 3.3
COUNTRY provided by banking sector / provenant du secteur
bancaire to private sector /
PAYS au secteur privé 2009 2010 2011 2009 2010 2011
Burundi 23.45 26.38 27.91 15.9 18.7 20.8 Burundi Comoros 20.47 23.25 21.22 16.0 19.1 17.8 Comores DR Congo 7.27 0.98 13.05 7.2 6.6 6.6 R. D. Congo Djibouti 32.32 … … 29.3 … … Djibouti Egypt 75.11 69.42 74.62 36.1 33.1 31.2 Egypte Eritrea 113.12 114.36 104.01 16.8 16.0 13.9 Érythrée Ethiopia … … … … … … Ethiopie Kenya 43.04 50.98 50.93 30.3 33.8 37.4 Kenya Libya -65.93 … … 10.9 … … Libye Madagascar 11.61 10.35 11.80 11.6 11.7 11.0 Madagascar Malawi 30.11 29.99 38.00 14.2 19.0 19.8 Malawi Mauritius 106.78 110.93 105.76 82.8 87.9 91.5 Maurice Rwanda … … … … … … Rwanda Seychelles 44.32 51.90 45.77 22.8 27.9 26.0 Seychelles Sudan 21.94 22.27 22.96 12.3 11.6 11.4 Soudan Swaziland 9.09 17.24 26.58 25.0 23.0 27.2 Swaziland Uganda 11.80 17.10 18.65 13.3 15.7 16.3 Ouganda Zambia 18.53 18.91 18.05 12.0 11.5 14.8 Zambie Zimbabwe … … … … … … Zimbabwe COMESA 31.4 40.3 41.4 22.3 24.0 24.7 COMESA

KeyStats 2013 III: COMESA
3 MONETARY AND FINANCIAL SECTOR SECTEUR MONETAIRE ET FINANCIER 3 3.4 Interest rates
(in percentage) Taux d’intérêts
(en pourcentage) 3.4
COUNTRY
Deposit rate / Taux de dépôts
Discount rate
/ Taux d’escompte
PAYS
2009 2010 2011 2009 2010 2011 Burundi … … … … … Burundi Comoros 1.88 1.75 1.75 5.13 5.25 5.54 Comores DR Congo 16.08 16.77 13.36 49.34 39.75 30.40 R. D. Congo Djibouti 1.37 0.96 1.51 9.72 9.35 9.10 Djibouti Egypt 6.49 6.23 6.74 5.48 4.77 4.29 Egypte Eritrea … … … … … … Érythrée Ethiopia … … … … … … Ethiopie Kenya 5.97 4.56 5.63 8.84 9.81 9.42 Kenya Libya 2.50 2.50 2.50 3.50 3.50 3.50 Libye Madagascar 11.50 10.50 10.65 33.50 38.50 41.85 Madagascar Malawi 3.50 3.60 4.11 21.75 21.02 19.64 Malawi Mauritius 8.45 8.35 7.11 0.80 0.53 1.81 Maurice Rwanda … 7.10 … … 9.57 … Rwanda Seychelles 9.77 2.86 2.08 5.58 9.84 … Seychelles Sudan … … … … … … Soudan Swaziland 5.40 3.85 2.85 5.97 5.90 6.15 Swaziland Uganda 9.75 7.69 13.02 11.20 12.49 8.81 Ouganda Zambia 7.09 7.40 7.02 14.97 13.52 11.81 Zambie Zimbabwe … … … … … … Zimbabwe COMESA 6.9 6.0 6.0 13.5 13.1 12.7 COMESA

KeyStats 2013 III: COMESA
4 EXTERNAL SECTOR SECTEUR EXTERIEUR 4 4.1 Imports
(in % of GDP) Importations
(en % du PIB) 4.1
COUNTRY 2007 2008 2009 2010 2011 2012 PAYS Burundi 65.56 29.03 27.92 28.85 36.42 32.28 Burundi Comoros 18.65 30.97 34.39 34.74 32.75 22.79 Comores DR Congo 28.29 33.04 27.55 34.31 34.36 27.00 R. D. Congo Djibouti 190.92 137.93 61.70 124.16 128.40 Djibouti Egypt 20.39 32.05 23.92 24.57 25.00 24.98 Egypte Eritrea 12.70 20.71 14.13 21.59 18.41 9.99 Érythrée Ethiopia 30.17 33.61 27.65 34.70 27.64 27.53 Ethiopie Kenya 37.93 41.89 37.26 37.32 43.79 43.94 Kenya Libya 17.83 20.84 31.87 30.79 21.53 … Libye Madagascar 31.92 18.53 29.99 26.08 29.33 24.92 Madagascar Malawi 36.96 54.86 37.11 45.69 43.21 67.04 Malawi Mauritius 49.08 48.63 41.55 43.72 44.17 48.76 Maurice Rwanda 18.41 24.93 23.95 22.32 21.46 23.28 Rwanda Seychelles 69.05 95.19 90.12 90.46 157.89 96.61 Seychelles Sudan 14.96 24.19 14.57 16.84 14.92 10.53 Soudan Swaziland 38.11 39.57 33.73 47.05 45.33 43.79 Swaziland Uganda 24.21 26.67 26.02 25.68 29.41 30.62 Ouganda Zambia 33.27 34.56 29.62 31.02 37.38 42.65 Zambie Zimbabwe 209.10 … 53.29 63.31 90.29 62.36 Zimbabwe COMESA 49.9 41.5 35.1 41.2 46.4 37.6 COMESA
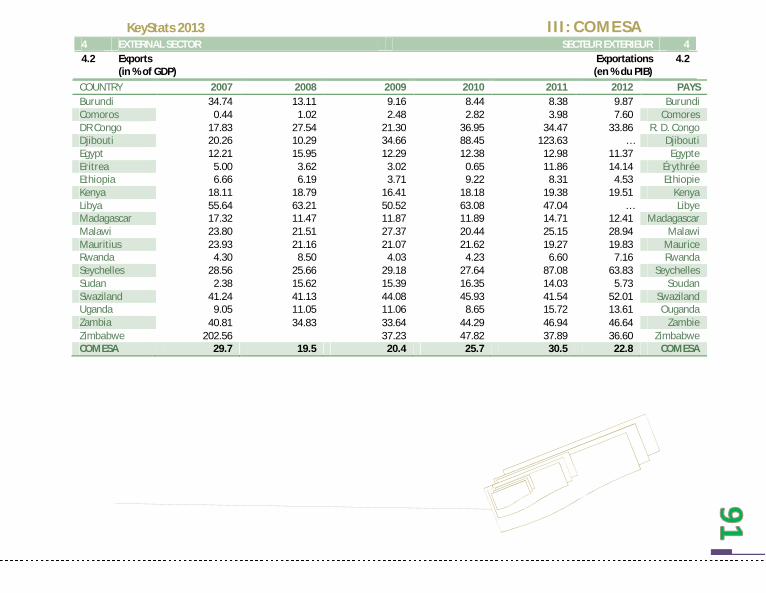
KeyStats 2013 III: COMESA
4 EXTERNAL SECTOR SECTEUR EXTERIEUR 4 4.2 Exports
(in % of GDP) Exportations
(en % du PIB) 4.2
COUNTRY 2007 2008 2009 2010 2011 2012 PAYS Burundi 34.74 13.11 9.16 8.44 8.38 9.87 Burundi Comoros 0.44 1.02 2.48 2.82 3.98 7.60 Comores DR Congo 17.83 27.54 21.30 36.95 34.47 33.86 R. D. Congo Djibouti 20.26 10.29 34.66 88.45 123.63 … Djibouti Egypt 12.21 15.95 12.29 12.38 12.98 11.37 Egypte Eritrea 5.00 3.62 3.02 0.65 11.86 14.14 Érythrée Ethiopia 6.66 6.19 3.71 9.22 8.31 4.53 Ethiopie Kenya 18.11 18.79 16.41 18.18 19.38 19.51 Kenya Libya 55.64 63.21 50.52 63.08 47.04 … Libye Madagascar 17.32 11.47 11.87 11.89 14.71 12.41 Madagascar Malawi 23.80 21.51 27.37 20.44 25.15 28.94 Malawi Mauritius 23.93 21.16 21.07 21.62 19.27 19.83 Maurice Rwanda 4.30 8.50 4.03 4.23 6.60 7.16 Rwanda Seychelles 28.56 25.66 29.18 27.64 87.08 63.83 Seychelles Sudan 2.38 15.62 15.39 16.35 14.03 5.73 Soudan Swaziland 41.24 41.13 44.08 45.93 41.54 52.01 Swaziland Uganda 9.05 11.05 11.06 8.65 15.72 13.61 Ouganda Zambia 40.81 34.83 33.64 44.29 46.94 46.64 Zambie Zimbabwe 202.56 37.23 47.82 37.89 36.60 Zimbabwe COMESA 29.7 19.5 20.4 25.7 30.5 22.8 COMESA

KeyStats 2013 III: COMESA
4 EXTERNAL SECTOR SECTEUR EXTERIEUR 4 4.3 Trade balance
(in % of GDP) Solde commercial
(en % du PIB) 4.3
COUNTRY 2007 2008 2009 2010 2011 2012 PAYS Burundi -30.8 -15.9 -18.8 -20.4 -28.0 -22.4 Burundi Comoros -18.2 -29.9 -31.9 -31.9 -28.8 -15.2 Comores DR Congo -10.5 -5.5 -6.3 2.6 0.1 6.9 R. D. Congo Djibouti -170.7 -127.6 -27.0 -35.7 -4.8 Djibouti Egypt -8.2 -16.1 -11.6 -12.2 -12.0 -13.6 Egypte Eritrea -7.7 -17.1 -11.1 -20.9 -6.5 4.2 Érythrée Ethiopia -23.5 -27.4 -23.9 -25.5 -19.3 -23.0 Ethiopie Kenya -19.8 -23.1 -20.9 -19.1 -24.4 -24.4 Kenya Libya 37.8 42.4 18.6 32.3 25.5 … Libye Madagascar -14.6 -7.1 -18.1 -14.2 -14.6 -12.5 Madagascar Malawi -13.2 -33.4 -9.7 -25.2 -18.1 -38.1 Malawi Mauritius -25.1 -27.5 -20.5 -22.1 -24.9 -28.9 Maurice Rwanda -14.1 -16.4 -19.9 -18.1 -14.9 -16.1 Rwanda Seychelles -40.5 -69.5 -60.9 -62.8 -70.8 -32.8 Seychelles Sudan -12.6 -8.6 0.8 -0.5 -0.9 -4.8 Soudan Swaziland 3.1 1.6 10.4 -1.1 -3.8 8.2 Swaziland Uganda -15.2 -15.6 -15.0 -17.0 -13.7 -17.0 Ouganda Zambia 7.5 0.3 4.0 13.3 9.6 4.0 Zambie Zimbabwe -6.5 … -16.1 -15.5 -52.4 -25.8 Zimbabwe COMESA -20.1 -22.0 -14.6 -15.5 -15.9 -14.8 COMESA

KeyStats 2013 III: COMESA
4 EXTERNAL SECTOR SECTEUR EXTERIEUR 4 4.4 Current account balance
(in millions of US$) Solde du compte courant
(en millions de $ EU) 4.4
COUNTRY 2007 2008 2009 2010 2011 2012 PAYS Burundi 2 2 0 1 - 268 - 387 Burundi Comoros - 29 - 59 - 35 - 48 - 58 - 32 Comores DR Congo - 2 - 2 - 3 -1 814 -2 192 R. D. Congo Djibouti 0 1 4 1 - 156 - 181 Djibouti Egypt 3 473 1 304 -4 719 -4 290 -6 088 -7 928 Egypte Eritrea - 92 - 83 - 97 - 32 14 - 72 Érythrée Ethiopia - 101 - 173 - 186 - 245 201 -2 437 Ethiopie Kenya - 878 -1 810 -1 793 -2 961 -3 604 -3 727 Kenya Libya 27 021 35 451 10 489 21 435 470 29 372 Libye Madagascar 0 0 0 0 - 680 - 782 Madagascar Malawi - 776 - 804 - 620 -1 167 - 333 - 156 Malawi Mauritius - 483 - 940 - 678 - 806 -1 163 -1 149 Maurice Rwanda 0 0 - 1 - 1 - 463 - 786 Rwanda Seychelles - 376 - 343 - 209 - 396 - 219 - 226 Seychelles Sudan -1 551 - 747 -1 033 121 - 303 -6 717 Soudan Swaziland - 153 - 300 - 510 - 391 - 362 - 11 Swaziland Uganda 0 - 1 - 1 - 1 -1 995 -2 285 Ouganda Zambia 0 0 0 0 238 - 711 Zambie Zimbabwe 0 0 0 0 -3 427 -2 366 Zimbabwe COMESA 26 056 31 494 609 11 219 -20 010 -2 773 COMESA

KeyStats 2013 III: COMESA
4 EXTERNAL SECTOR SECTEUR EXTERIEUR 4 4.5 Capital and financial account
(in millions of US$) Compte des capitaux et des opérations financières
(en millions de $ EU) 4.5
COUNTRY 2007 2008 2009 2010 2011 2012 PAYS Burundi 128 141 1025 78 … … Burundi Comoros … … … … … … Comores DR Congo … … … … … … R. D. Congo Djibouti 35 54 55 55 … … Djibouti Egypt 2 - 1 - 19 - 39 … … Egypte Eritrea … … … … … … Érythrée Ethiopia … … … … … … Ethiopie Kenya 157 94 261 240 … … Kenya Libya … … … … … … Libye Madagascar … … … … … … Madagascar Malawi 190 439 409 603 … … Malawi Mauritius - 2 - 1 - 2 - 5 … … Maurice Rwanda 161 212 200 286 … … Rwanda Seychelles 8 5 52 275 … … Seychelles Sudan … … … … … … Soudan Swaziland - 30 7 0 11 … … Swaziland Uganda 69 47 45 49 … … Ouganda Zambia 223 230 237 150 … … Zambie Zimbabwe … … … … … … Zimbabwe COMESA … … … … … … COMESA

KeyStats 2013 III: COMESA
4 EXTERNAL SECTOR SECTEUR EXTERIEUR 4 4.6 International financial flows
(in millions of US$) Flux financiers internationaux
(en millions de $ EU) 4.6
COUNTRY Official development assistance (net) / Appui public
au développement (net)
Net foreign direct investment /
PAYS Investissement direct étranger net
2009 2010 2011 2009 2010 2011 Burundi 239 238 200 10 1 3 Burundi Comoros 50 67 52 9 4 7 Comores DR Congo 2,357 3,543 5,532 664 2,729 1,596 R. D. Congo Djibouti 167 132 142 100 37 79 Djibouti Egypt 999 592 412 6,712 6,386 -483 Egypte Eritrea 144 161 135 0 56 19 Érythrée Ethiopia 3,819 3,525 3,532 221 288 627 Ethiopie Kenya 1,776 1,629 2,484 141 178 335 Kenya Libya 513 1,419 765 2,674 1,784 200 Libye Madagascar 444 470 441 1,066 860 907 Madagascar Malawi 771 1,023 804 49 97 92 Malawi Mauritius 155 125 183 257 430 273 Maurice Rwanda 934 1,032 1,262 119 42 106 Rwanda Seychelles 23 56 21 275 156 139 Seychelles Sudan 2,351 2,076 1,123 3,034 6,114 3,057 Soudan Swaziland 56 91 125 66 136 95 Swaziland Uganda 1,785 1,723 1,582 816 544 894 Ouganda Zambia 1,267 914 1,046 695 1,729 1,982 Zambie Zimbabwe 736 732 716 105 166 387 Zimbabwe COMESA 18 584 19 550 20 558 17 013 21 736 10 316 COMESA

KeyStats 2013 III: COMESA
4 EXTERNAL SECTOR SECTEUR EXTERIEUR 4 4.7 Total international reserves
(in millions of US$) Réserves internationales totales
(en millions de $ EU) 4.7
COUNTRY 2007 2008 2009 2010 2011 2012 PAYS Burundi 176 266 322 331 294 307 Burundi Comoros 117 112 150 145 155 171 Comores DR Congo 181 78 1 035 1 300 1 268 1 633 R. D. Congo Djibouti 132 175 242 249 244 253 Djibouti Egypt 30 322 32 347 32 386 33 743 15 046 11 785 Egypte Eritrea 34 58 90 114 115 117 Érythrée Ethiopia 1 290 871 1 781 ... ... ... Ethiopie Kenya 3 355 2 879 3 849 4 320 4 264 5 711 Kenya Libya 79 660 92 563 98 979 99 894 104 999 116 783 Libye Madagascar 847 982 1 135 1 172 1 279 1 191 Madagascar Malawi 217 243 150 308 198 143 Malawi Mauritius 1 784 1 746 2 186 2 449 2 589 2 843 Maurice Rwanda 553 596 743 813 1 050 771 Rwanda Seychelles 41 64 191 236 252 268 Seychelles Sudan 1 378 1 399 1 094 1 036 193 ... Soudan Swaziland 774 752 959 756 601 741 Swaziland Uganda 2 560 2 301 2 994 2 706 2 617 3 120 Ouganda Zambia 1 090 1 096 1 892 2 094 2 324 3 042 Zambie Zimbabwe 146 76 822 732 659 574 Zimbabwe COMESA 124 657 138 603 151 001 152 397 138 148 149 455 COMESA

KeyStats 2013 III: COMESA
4 EXTERNAL SECTOR SECTEUR EXTERIEUR 4 4.8 Total international reserves / average monthly imports
(ratio) Réserves internationales totales / Importations moyennes
mensuelles (ratio) 4.8
COUNTRY 2007 2008 2009 2010 2011 2012 PAYS Burundi … … … … 4.49 … Burundi Comoros 10.86 8.57 9.29 7.94 … … Comores DR Congo 0.58 0.20 2.64 … … … R. D. Congo Djibouti 0.68 1.03 1.46 … 4.27 … Djibouti Egypt 13.40 7.33 8.61 … 3.29 … Egypte Eritrea 1.17 2.72 … … … … Érythrée Ethiopia 2.90 1.47 3.04 … … … Ethiopie Kenya 4.48 3.10 4.53 4.33 3.08 … Kenya Libya 120.08 130.31 105.81 … 80.71 … Libye Madagascar 20.96 15.36 21.58 27.79 … … Madagascar Malawi 2.33 1.47 0.99 1.70 0.88 … Malawi Mauritius 5.50 4.49 7.02 6.64 3.86 3.81 Maurice Rwanda 9.77 6.90 8.02 … 5.59 … Rwanda Seychelles 0.57 0.75 2.44 2.36 2.56 … Seychelles Sudan 0.44 0.44 0.36 0.68 0.21 … Soudan Swaziland 6.49 7.02 6.42 4.64 … … Swaziland Uganda … … … … 4.00 4.62 Ouganda Zambia 0.82 0.70 1.04 … 3.02 Zambie Zimbabwe … … … … … … Zimbabwe COMESA 12.6 12.0 12.2 … … … COMESA

KeyStats 2013 III: COMESA
4 EXTERNAL SECTOR SECTEUR EXTERIEUR 4 4.9 Exchange rate
(National currency / US$) Taux de change
(Monnaie nationale / $ EU) 4.9
COUNTRY Average Exchange Rate (Nati. Currency per us$)
Taux de change (moyen) (monnaie nat. par dollars) PAYS
2007 2008 2009 2010 2011 2012 Burundi 100.0 109.6 113.7 113.8 116.6 133.4 Burundi Comoros 359.47 336.28 353.83 371.62 353.90 382.90 Comores DR Congo 463.06 553.94 775.11 897.74 919.49 919.76 R. D. Congo Djibouti 177.72 177.72 177.72 177.72 177.72 177.72 Djibouti Egypt 5.64 5.44 5.55 5.64 5.93 6.06 Egypte Eritrea 15.00 15.00 15.00 15.00 15.38 15.38 Érythrée Ethiopia 9.00 9.63 11.56 14.35 16.90 17.70 Ethiopie Kenya 67.28 69.12 77.24 79.22 88.81 84.53 Kenya Libya 1.26 1.22 1.25 1.27 1.22 1.26 Libye Madagascar 93.6 85.3 97.7 104.3 101.1 109.6 Madagascar Malawi 139.95 140.89 140.92 150.48 156.52 249.11 Malawi Mauritius 31.31 28.45 31.96 30.78 28.71 30.05 Maurice Rwanda 546.14 544.90 566.07 581.91 600.31 614.30 Rwanda Seychelles 6.67 8.94 13.65 12.17 12.38 13.70 Seychelles Sudan … 2.11 2.31 2.31 2.67 3.57 Soudan Swaziland 7.05 8.26 8.42 7.32 7.26 8.21 Swaziland Uganda 96.8 96.6 114.0 122.3 141.7 139.8 Ouganda Zambia 98.7 83.9 113.1 107.5 108.9 115.3 Zambie Zimbabwe 9379.42 59267.34 20576.11 361.89 … … Zimbabwe
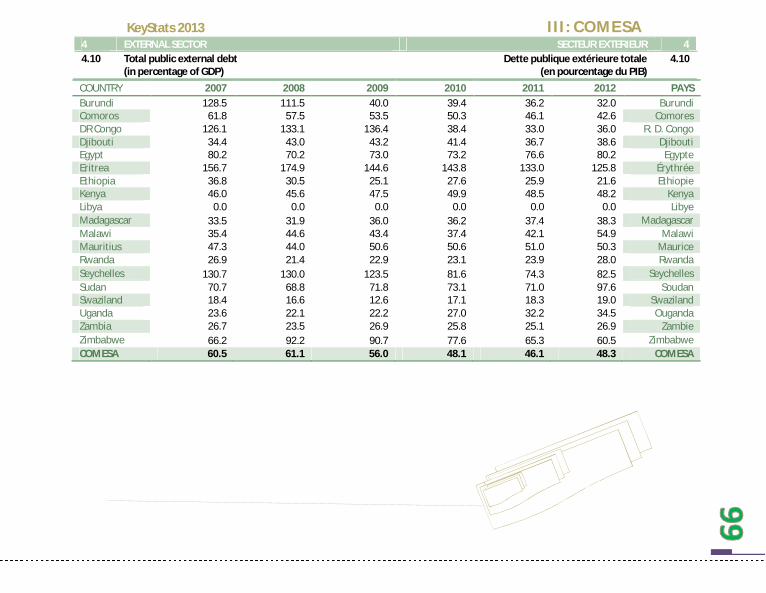
KeyStats 2013 III: COMESA
4 EXTERNAL SECTOR SECTEUR EXTERIEUR 4 4.10 Total public external debt
(in percentage of GDP) Dette publique extérieure totale
(en pourcentage du PIB) 4.10
COUNTRY 2007 2008 2009 2010 2011 2012 PAYS Burundi 128.5 111.5 40.0 39.4 36.2 32.0 Burundi Comoros 61.8 57.5 53.5 50.3 46.1 42.6 Comores DR Congo 126.1 133.1 136.4 38.4 33.0 36.0 R. D. Congo Djibouti 34.4 43.0 43.2 41.4 36.7 38.6 Djibouti Egypt 80.2 70.2 73.0 73.2 76.6 80.2 Egypte Eritrea 156.7 174.9 144.6 143.8 133.0 125.8 Érythrée Ethiopia 36.8 30.5 25.1 27.6 25.9 21.6 Ethiopie Kenya 46.0 45.6 47.5 49.9 48.5 48.2 Kenya Libya 0.0 0.0 0.0 0.0 0.0 0.0 Libye Madagascar 33.5 31.9 36.0 36.2 37.4 38.3 Madagascar Malawi 35.4 44.6 43.4 37.4 42.1 54.9 Malawi Mauritius 47.3 44.0 50.6 50.6 51.0 50.3 Maurice Rwanda 26.9 21.4 22.9 23.1 23.9 28.0 Rwanda Seychelles 130.7 130.0 123.5 81.6 74.3 82.5 Seychelles Sudan 70.7 68.8 71.8 73.1 71.0 97.6 Soudan Swaziland 18.4 16.6 12.6 17.1 18.3 19.0 Swaziland Uganda 23.6 22.1 22.2 27.0 32.2 34.5 Ouganda Zambia 26.7 23.5 26.9 25.8 25.1 26.9 Zambie Zimbabwe 66.2 92.2 90.7 77.6 65.3 60.5 Zimbabwe COMESA 60.5 61.1 56.0 48.1 46.1 48.3 COMESA

KeyStats 2013 III: COMESA
4 EXTERNAL SECTOR SECTEUR EXTERIEUR 4 4.11 Debt service
(in percentage of exports) Service de la dette
(en pourcentage des exportations) 4.11
COUNTRY 2007 2008 2009 2010 2011 2012 PAYS Burundi 6.2 3.2 1.7 1.2 7.1 7.1 Burundi Comoros 12.6 4.5 10.5 11.8 11.0 10.6 Comores DR Congo 9.4 8.9 16.9 10.7 5.9 7.5 R. D. Congo Djibouti 7.6 7.2 7.3 7.9 7.7 9.2 Djibouti Egypt 10.6 8.4 12.0 9.7 12.7 11.4 Egypte Eritrea 34.9 45.0 35.9 33.5 13.0 8.1 Érythrée Ethiopia 3.6 2.9 2.4 3.3 5.5 8.1 Ethiopie Kenya 4.6 4.1 4.6 4.6 3.8 5.5 Kenya Libya 0.0 0.0 0.0 0.0 … 0.0 Libye Madagascar 4.4 5.2 7.0 7.2 7.0 8.9 Madagascar Malawi 45.4 1.2 1.3 1.3 2.4 2.3 Malawi Mauritius 5.4 3.5 3.1 2.6 2.9 4.1 Maurice Rwanda 2.4 1.3 1.7 2.7 5.3 11.7 Rwanda Seychelles 10.7 6.8 13.4 6.6 2.5 2.5 Seychelles Sudan 1.9 2.5 4.8 3.5 4.8 9.5 Soudan Swaziland 1.9 3.7 2.5 1.7 2.4 3.4 Swaziland Uganda 174.7 2.3 2.9 2.7 2.8 8.5 Ouganda Zambia 1.4 5.0 13.8 3.3 2.5 6.2 Zambie Zimbabwe … … … … … 9.2 Zimbabwe COMESA 18.8 6.4 7.9 6.3 5.8 7.0 COMESA

KeyStats 2013 III: COMESA
4 EXTERNAL SECTOR SECTEUR EXTERIEUR 4 4.12 Tariffs and imports by product groups in % (in 2012) Tarifs et importations par group des produits en %
(en 2012) 4.12
COUNTRY Animal products Dairy products Fruit, vegetables, plants
Coffee, tea Cereals & preparations PAYS
Burundi 23.3 43.3 22.1 19.6 22.4 Burundi Comoros 8.0 4.9 7.6 16.3 11.1 Comores DR Congo … … … … … R. D. Congo Djibouti 10.0 12.1 10.2 23.8 8.7 Djibouti Egypt 15.6 6.0 8.9 10.5 15.3 Egypte Eritrea … … … … … Érythrée Ethiopia 23.8 27.3 27.7 28.8 21.0 Ethiopie Kenya 23.3 43.3 22.1 19.6 23.6 Kenya Libya … … … … … Libye Madagascar 18.6 17.7 17.9 17.9 12.2 Madagascar Malawi 16.7 20.5 21.6 23.8 18.4 Malawi Mauritius 0.0 0.0 0.0 2.5 0.3 Maurice Rwanda 23.3 43.3 22.1 19.6 23.6 Rwanda Seychelles 0.5 0.0 7.1 16.7 5.1 Seychelles Sudan 34.9 38.9 36.0 28.8 23.6 Soudan Swaziland 10.7 13.9 9.2 8.2 8.4 Swaziland Uganda 23.3 43.3 22.1 19.6 23.6 Ouganda Zambia 19.2 22.6 22.0 22.9 16.9 Zambie Zimbabwe 31.8 27.8 28.8 32.7 23.2 Zimbabwe COMESA 17.7 22.8 17.8 19.5 16.1 COMESA
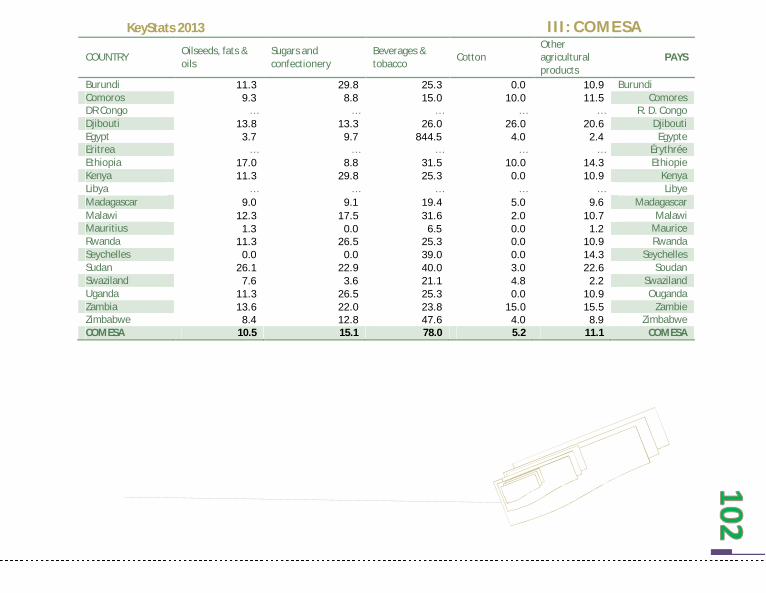
KeyStats 2013 III: COMESA
COUNTRY Oilseeds, fats & oils
Sugars and confectionery
Beverages & tobacco
Cotton Other agricultural products
PAYS
Burundi 11.3 29.8 25.3 0.0 10.9 Burundi Comoros 9.3 8.8 15.0 10.0 11.5 Comores DR Congo … … … … … R. D. Congo Djibouti 13.8 13.3 26.0 26.0 20.6 Djibouti Egypt 3.7 9.7 844.5 4.0 2.4 Egypte Eritrea … … … … … Érythrée Ethiopia 17.0 8.8 31.5 10.0 14.3 Ethiopie Kenya 11.3 29.8 25.3 0.0 10.9 Kenya Libya … … … … … Libye Madagascar 9.0 9.1 19.4 5.0 9.6 Madagascar Malawi 12.3 17.5 31.6 2.0 10.7 Malawi Mauritius 1.3 0.0 6.5 0.0 1.2 Maurice Rwanda 11.3 26.5 25.3 0.0 10.9 Rwanda Seychelles 0.0 0.0 39.0 0.0 14.3 Seychelles Sudan 26.1 22.9 40.0 3.0 22.6 Soudan Swaziland 7.6 3.6 21.1 4.8 2.2 Swaziland Uganda 11.3 26.5 25.3 0.0 10.9 Ouganda Zambia 13.6 22.0 23.8 15.0 15.5 Zambie Zimbabwe 8.4 12.8 47.6 4.0 8.9 Zimbabwe COMESA 10.5 15.1 78.0 5.2 11.1 COMESA

KeyStats 2013 III: COMESA
COUNTRY Fish & fish products Minerals & metals Petroleum Chemicals PAYS
Burundi 24.7 10.6 4.3 4.0 Burundi Comoros 6.2 9.3 5.0 9.8 Comores DR Congo … … … … R. D. Congo Djibouti 13.1 23.8 25.1 25.3 Djibouti Egypt 5.4 7.9 2.8 5.7 Egypte Eritrea … … … … Érythrée Ethiopia 21.0 13.4 7.3 10.9 Ethiopie Kenya 24.7 10.6 4.3 4.0 Kenya Libya … … … … Libye Madagascar 19.7 10.6 5.8 7.3 Madagascar Malawi 16.3 11.9 5.4 3.8 Malawi Mauritius 0.0 0.9 0.0 0.5 Maurice Rwanda 24.7 10.6 4.3 4.0 Rwanda Seychelles 69.8 1.1 21.0 2.8 Seychelles Sudan 39.5 22.2 9.5 8.1 Soudan Swaziland 6.2 3.6 1.0 2.3 Swaziland Uganda 24.7 10.5 4.3 3.9 Ouganda Zambia 24.1 11.0 18.9 6.1 Zambie Zimbabwe 10.9 13.0 22.5 7.3 Zimbabwe
COMESA 20.7 10.7 8.8 6.6 COMESA

KeyStats 2013 III: COMESA
COUNTRY Wood, paper, etc. Textiles Clothing Leather, footwear, etc. PAYS
Burundi 16.0 19.6 25.2 12.7 Burundi Comoros 5.7 10.0 10.0 7.4 Comores DR Congo … … … … R. D. Congo Djibouti 22.5 17.7 12.6 23.6 Djibouti Egypt 11.4 10.9 28.8 12.2 Egypte Eritrea … … … … Érythrée Ethiopia 12.1 27.8 35.0 18.6 Ethiopie Kenya 16.0 19.6 25.2 12.7 Kenya Libya … … … … Libye Madagascar 13.5 14.9 19.9 12.8 Madagascar Malawi 14.9 18.5 25.0 19.0 Malawi Mauritius 3.9 0.9 4.5 0.8 Maurice Rwanda 16.0 19.6 25.2 12.7 Rwanda Seychelles 2.4 3.9 18.5 15.1 Seychelles Sudan 22.5 27.4 40.0 25.9 Soudan Swaziland 6.1 16.9 41.0 13.3 Swaziland Uganda 16.0 19.5 25.2 12.7 Ouganda Zambia 16.7 15.9 25.0 17.7 Zambie Zimbabwe 17.1 20.3 88.2 26.6 Zimbabwe COMESA 13.3 16.5 28.1 15.2 COMESA
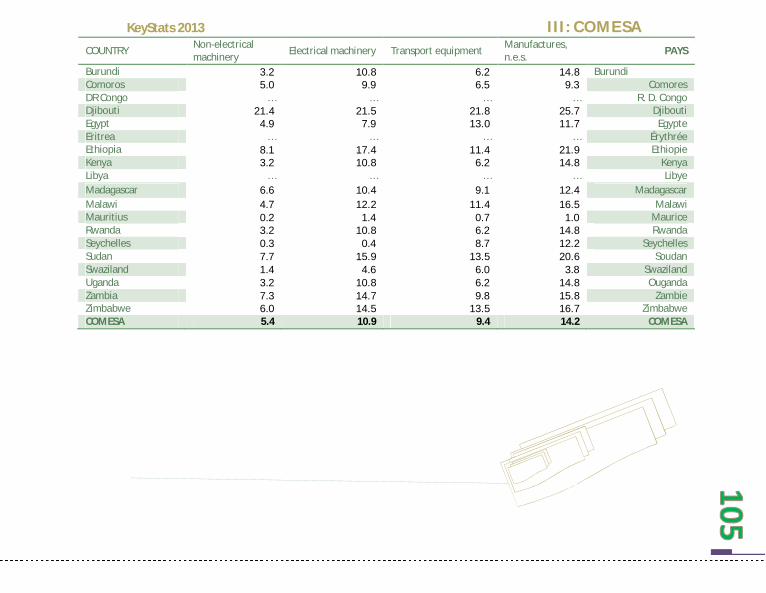
KeyStats 2013 III: COMESA
COUNTRY Non-electrical machinery Electrical machinery Transport equipment Manufactures,
n.e.s. PAYS
Burundi 3.2 10.8 6.2 14.8 Burundi Comoros 5.0 9.9 6.5 9.3 Comores DR Congo … … … … R. D. Congo Djibouti 21.4 21.5 21.8 25.7 Djibouti Egypt 4.9 7.9 13.0 11.7 Egypte Eritrea … … … … Érythrée Ethiopia 8.1 17.4 11.4 21.9 Ethiopie Kenya 3.2 10.8 6.2 14.8 Kenya Libya … … … … Libye Madagascar 6.6 10.4 9.1 12.4 Madagascar Malawi 4.7 12.2 11.4 16.5 Malawi Mauritius 0.2 1.4 0.7 1.0 Maurice Rwanda 3.2 10.8 6.2 14.8 Rwanda Seychelles 0.3 0.4 8.7 12.2 Seychelles Sudan 7.7 15.9 13.5 20.6 Soudan Swaziland 1.4 4.6 6.0 3.8 Swaziland Uganda 3.2 10.8 6.2 14.8 Ouganda Zambia 7.3 14.7 9.8 15.8 Zambie Zimbabwe 6.0 14.5 13.5 16.7 Zimbabwe COMESA 5.4 10.9 9.4 14.2 COMESA

KeyStats 2013 III: COMESA
4 EXTERNAL SECTOR SECTEUR EXTERIEUR 4 4.13 Intra- and inter-regional trade
(in millions of US$) Commerce intra- et inter-régional
(en millions de $E.U.) 4.13
Exports to 2007 2008 2009 2010 2011 2012 Exportations vers Africa 16,695 41,594 103,627 258,176 643,220 1,602,521 Afrique AMU 2,962 7,380 18,387 45,810 114,131 284,345 UMA CEN-SAD 6,819 16,989 42,326 105,451 262,721 654,544 CEN-SAD COMESA 8,817 21,967 54,728 136,350 339,704 846,340 COMESA EAC 4,133 10,298 25,655 63,918 159,245 396,744 CAE ECCAS 1,859 4,630 11,536 28,742 71,608 178,403 CEEAC ECOWAS 409 1,018 2,536 6,319 15,742 39,220 CEDEAO IGAD 4,958 12,352 30,774 76,671 191,018 475,902 IGAD SADC 7,895 19,670 49,007 122,095 304,191 757,871 SADC
Imports from Importations de
Africa 25,748 62,639 152,385 370,715 901,857 2,193,993 Afrique AMU 3,559 8,658 21,064 51,243 124,661 303,270 UMA CEN-SAD 8,651 21,045 51,198 124,552 303,005 737,135 CEN-SAD COMESA 11,918 28,994 70,534 171,592 417,441 1,015,530 COMESA EAC 4,301 10,464 25,455 61,926 150,650 366,495 CAE ECCAS 418 1,018 2,476 6,024 14,656 35,654 CEEAC ECOWAS 324 787 1,915 4,658 11,333 27,570 CEDEAO IGAD 4,566 11,109 27,024 65,744 159,938 389,090 IGAD SADC 16,951 41,239 100,323 244,061 593,744 1,444,443 SADC
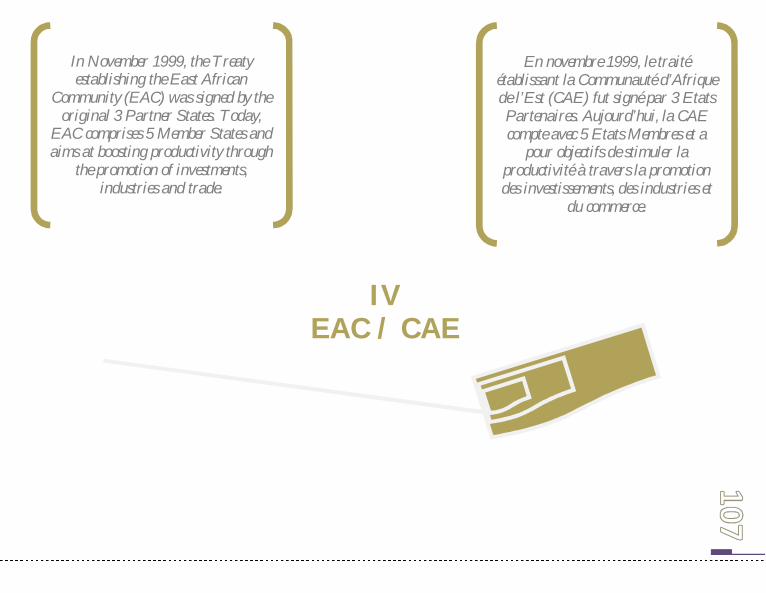
IV EAC / CAE
In November 1999, the Treaty establishing the East African
Community (EAC) was signed by the original 3 Partner States. Today,
EAC comprises 5 Member States and aims at boosting productivity through
the promotion of investments, industries and trade.
En novembre 1999, le traité établissant la Communauté d’Afrique de l’Est (CAE) fut signé par 3 Etats Partenaires. Aujourd’hui, la CAE compte avec 5 Etats Membres et a
pour objectifs de stimuler la productivité à travers la promotion des investissements, des industries et
du commerce.

KeyStats 2013 IV: EAC / CAE
0 POPULATION POPULATION 0 0.1 Total population
(in millions) Population totale
(en millions) 0.1
COUNTRY 2007 2008 2009 2010 2011 2012 PAYS
Burundi 7.7 7.9 8.2 8.4 8.6 8.7 Burundi
Kenya 37.5 38.5 38.6 40.5 41.6 42.7 Kenya
Rwanda 9.7 10.0 10.3 10.6 10.9 11.3 Rwanda
Tanzania 41.0 42.3 43.5 44.8 46.2 47.7 Tanzanie
Uganda 30.3 31.3 32.4 33.4 34.5 35.6 Ouganda
EAC 126.2 130.0 133.0 137.7 141.8 146.0 CAE

KeyStats 2013 IV: EAC / CAE
0 POPULATION POPULATION 0 0.2 Population structure
(in percentage of total population) Structure de la population
(en pourcentage de la population totale) 0.2
COUNTRY Female / Femmes Urban / Urbaine
PAYS 2010 2011 2012 2010 2011 2012
Burundi 50.9 50.9 50.9 11.0 11.3 11 Burundi
Kenya 50.1 50.1 50 22.2 22.5 24 Kenya
Rwanda 50.9 50.9 50.9 18.9 19.2 19 Rwanda
Tanzania 50.1 50.0 50 26.4 26.9 27 Tanzanie
Uganda 50.0 50.0 50 13.3 13.5 16 Ouganda
EAC 50.4 50.4 50.4 18.3 18.7 19.4 CAE

KeyStats 2013 IV: EAC / CAE
0 POPULATION POPULATION 0 0.2 Population structure (cont’d)
(in percentage of total population) Structure de la population (suite)
(en pourcentage de la population totale) 0.2
COUNTRY
Eco. active population / Population éco. Active (Thousands)
Economically active female / male ratio
PAYS Ratio femmes / Hommes économiquement. actifs
2010 2011 2012 2010 2011 2012
Burundi 4 163 4 278 4385 51.8 51.7 51.6 Burundi
Kenya 14 860 15 335 15815 46.3 46.3 46.3 Kenya
Rwanda 5 070 5 208 5358 51.9 51.8 51.8 Rwanda
Tanzania 21 193 21 785 22407 49.8 49.7 49.7 Tanzanie
Uganda 12 866 13 283 13724 49.2 49.2 49.1 Ouganda
EAC 58 152 59 889 61 689 49. 8 49. 74 49. 7 CAE

KeyStats 2013 IV: EAC / CAE
1 REAL SECTOR SECTEUR REEL 1 1.1 GDP at current
(in millions of US$) PIB à prix courant
(en millions de $ EU) 1.1
COUNTRY 2007 2008 2009 2010 2011 2012 PAYS
Burundi 1 361 1 615 1 742 2 028 2 356 2 471 Burundi
Kenya 27 239 30 462 30 649 32 194 34 036 40 707 Kenya
Rwanda 3 462 3 868 5 253 5 619 5 461 6 751 Rwanda
Tanzania 16 880 20 680 21 299 22 396 23 474 29 941 Tanzanie
Uganda 13 545 16 432 16 545 17 705 18 063 23 699 Ouganda
EAC 62 487 73 057 75 488 79 942 83 390 103 569 CAE

KeyStats 2013 IV: EAC / CAE
1 REAL SECTOR SECTEUR REEL 1 1.2 Structure of GDP
(in percentage) Structure du PIB
(en pourcentage) 1.2
COUNTRY Agriculture / Agriculture
Industry / Manufacture / Manufacture
Services etc. / Services etc. PAYS Industrie
2004 2011 2004 2011 2004 2011 2004 2011
Burundi 52.2 41.6 15.5 20.5 10.0 14.6 23.3 37.9 Burundi
Kenya 28.0 27.7 18.2 17.1 11.2 10.7 53.7 55.1 Kenya
Rwanda 41.8 34.8 15.1 17.8 7.5 7.2 43.1 47.4 Rwanda
Tanzania 33.3 27.7 22.3 25.1 8.7 10.2 44.3 47.2 Tanzanie
Uganda 25.0 24.9 24.5 27.3 7.6 9.2 50.4 47.8 Ouganda
EAC 36.1 31.3 19.1 21.6 9.0 10.4 43.0 47.1 CAE

KeyStats 2013 IV: EAC / CAE
1 REAL SECTOR SECTEUR REEL 1 1.3 Real GDP Growth
(in percentage) Croissance réelle du PIB
(en pourcentage) 1.3
COUNTRY 2007 2008 2009 2010 2011 2012 PAYS
Burundi 3.5 4.9 3.8 4.8 4.2 4.7 Burundi
Kenya 7.0 1.5 2.6 5.8 4.4 4.2 Kenya
Rwanda 7.7 11.1 6.2 7.2 8.2 8.0 Rwanda
Tanzania 7.1 7.4 6.0 7.0 6.4 6.9 Tanzanie
Uganda 8.1 10.4 4.2 6.1 5.9 4.4 Ouganda
EAC 6.7 7.1 4.6 6.2 5.8 5.6 CAE

KeyStats 2013 IV: EAC / CAE
1 REAL SECTOR SECTEUR REEL 1 1.4 Per capita GDP and GNI
(in US$) PIB et RNB par habitant
(en $ EU) 1.4
COUNTRY Current prices / Prix courant PPP / PPA GNI / RNB
PAYS 2010 2011 2012 2010 2011 2012 2010 2011 2012
Burundi 242 275 282 582 605 560 200 220 240 Burundi
Kenya 795 818 952 1 681 1 741 1 760 810 820 840 Kenya
Rwanda 529 499 599 1 229 1 334 … 520 570 … Rwanda
Tanzania 499 508 628 1 511 1 610 1 590 530 540 570 Tanzanie
Uganda 530 523 665 1 332 1 385 1 140 460 470 440 Ouganda
EAC 2 595 2 623 3126 6 334 6 674 5 050 2 520 2 620 2 090 CAE

KeyStats 2013 IV: EAC / CAE
1 REAL SECTOR SECTEUR REEL 1 1.5 Inflation
(in percentage) Inflation
(en pourcentage) 1.5
COUNTRY 2007 2008 2009 2010 2011 2012 PAYS
Burundi 8.4 24.5 10.5 6.5 9.6 18.2 Burundi
Kenya 9.8 26.2 19.6 4.1 14.0 9.6 Kenya
Rwanda 9.0 15.4 10.0 1.8 3.1 10.3 Rwanda
Tanzania 7.0 10.3 12.1 6.4 12.6 16.0 Tanzanie
Uganda 6.1 12.1 13.0 4.0 18.7 14.0 Ouganda
EAC … … … … … … CAE
CPI National

KeyStats 2013 IV: EAC / CAE
1 REAL SECTOR SECTEUR REEL 1 1.6 Inflation
(in percentage) Inflation
(en pourcentage) 1.5
COUNTRY 2007 2008 2009 2010 2011 2012 PAYS
Burundi … … … … … … Burundi
Kenya … … … … … … Kenya
Rwanda … … … … … … Rwanda
Tanzania … … … … … … Tanzanie
Uganda … … … … … … Ouganda
EAC … … … … … … CAE
Harmonized CPI

KeyStats 2013 IV: EAC / CAE
2 GOVERNMENT FINANCE FINANCES PUBLIQUES 2 2.1a Total revenue plus grants
(in percentage of GDP) Recettes totales plus dons
(en pourcentage du PIB) 2.1a
COUNTRY 2005 2008 2009 2010 2011 2012 PAYS
Burundi 32.5 30.3 27.4 31.0 36.1 33.0 Burundi
Kenya 21.5 22.9 22.4 25.2 24.0 25.2 Kenya
Rwanda 24.0 27.1 24.3 26.2 24.7 25.5 Rwanda
Tanzania 17.3 21.0 20.2 19.2 21.9 21.8 Tanzanie
Uganda 17.3 16.2 13.5 13.4 17.4 15.6 Ouganda
EAC 22.5 23.5 21.6 23.0 24.8 24.2 CAE

KeyStats 2013 IV: EAC / CAE
2 GOVERNMENT FINANCE FINANCES PUBLIQUES 2 2.1b Total revenue
(in percentage of GDP) Recettes totales
(en pourcentage du PIB) 2.1b
COUNTRY 2005 2008 2009 2010 2011 2012 PAYS
Burundi … … 27.4 25.4 26.2 26.3 Burundi
Kenya 20.2 19.4 22.4 23.1 24.7 25.7 Kenya
Rwanda … … 24.3 25.6 24.5 25.1 Rwanda
Tanzania … … 20.2 20.5 21.2 48.8 Tanzanie
Uganda 11.9 13.3 13.5 15.7 19.6 15.6 Ouganda
EAC 16.1 16.3 21.6 22.1 23.2 28.3 CAE

KeyStats 2013 IV: EAC / CAE
2 GOVERNMENT FINANCE FINANCES PUBLIQUES 2 2.2 Total expenditure
(in percentage of GDP) Dépenses totales
(en pourcentage du PIB) 2.2
COUNTRY 2005 2008 2009 2010 2011 2012 PAYS
Burundi 34.7 33.4 35.8 36.6 20.7 21.5 Burundi
Kenya 21.1 28.5 29.3 29.5 29.2 30.5 Kenya
Rwanda 23.7 26.7 25.2 25.7 26.9 26.9 Rwanda
Tanzania 19.8 21.1 24.1 27.5 27.2 57.8 Tanzanie
Uganda 18.0 18.6 15.5 19.8 23.2 18.6 Ouganda
EAC 23.5 25.6 26.0 27.8 25.4 31.1 CAE

KeyStats 2013 IV: EAC / CAE
2 GOVERNMENT FINANCE FINANCES PUBLIQUES 2 2.3 Fiscal balance
(Surplus+ / Deficit-) (in percentage of GDP)
Solde budgétaire (Excédent+ / Déficit-)
(en pourcentage du PIB)
2.2
COUNTRY 2005 2008 2009 2010 2011 2012 PAYS
Burundi -2.3 -3.1 -8.4 -7.3 -8.4 -8.0 Burundi
Kenya 0.4 -5.6 -6.9 -6.3 -4.5 -4.7 Kenya
Rwanda 0.3 0.5 -0.8 -0.6 -2.4 -1.9 Rwanda
Tanzania -2.5 0.0 -4.0 -6.7 -6.0 -9.1 Tanzanie
Uganda -0.7 -2.3 -2.0 -4.3 -3.6 -3.0 Ouganda
EAC -1.0 -2.1 -4.4 -5.0 -5.0 -5.3 CAE

KeyStats 2013 IV: EAC / CAE
3 MONETARY AND FINANCIAL SECTOR SECTEUR MONETAIRE ET FINANCIER 3 3.1 Money (M1)
(in millions of US$) Monnaie (M1)
(en millions de DEU) 3.1
COUNTRY 2007 2008 2009 2010 2011 2012 PAYS
Burundi 330 079 443 118 53 070 633 490 672 134 795 988 Burundi
Kenya 777 771 901 055 1 045 657 1 271 638 1 516 152 1 817 038 Kenya
Rwanda 375 910 466 390 526 962 615 898 780 742 919 499 Rwanda
Tanzania 6 223 589 7 458 779 8 780 143 11 012 589 13 021 322 14 830 066 Tanzanie
Uganda 4 412 378 5 785 728 6 745 061 9 427 584 10 426 566 11 873 762 Ouganda
EAC 12119 727 15055 070 17150 893 22961 199 26416 916 30236 353 CAE

KeyStats 2013 IV: EAC / CAE
3 MONETARY AND FINANCIAL SECTOR SECTEUR MONETAIRE ET FINANCIER 3 3.2 Money plus quasi-money (M2)
(in % of GDP) Monnaie plus quasi-monnaie (M2)
(en % du PIB) 3.2
COUNTRY 2007 2008 2009 2010 2011 2012 PAYS
Burundi 24.34 24.85 25.92 26.98 23.91 22.95 Burundi
Kenya 42.32 42.54 44.14 50.08 50.98 50.76 Kenya
Rwanda … … … … … … Rwanda
Tanzania 29.71 30.10 31.12 34.10 34.69 32.94 Tanzanie
Uganda 20.88 23.62 22.58 26.89 26.52 24.35 Ouganda
EAC 29.3 30.3 30.9 34.5 34.0 32.8 CAE

KeyStats 2013 IV: EAC / CAE
3 MONETARY AND FINANCIAL SECTOR SECTEUR MONETAIRE ET FINANCIER 3 3.3 Domestic credit
(in percentage of GDP) Crédit intérieur
(en pourcentage du PIB) 3.3
COUNTRY
provided by banking sector / provenant du secteur bancaire
to private sector /
PAYS au secteur privé
2009 2010 2011 2009 2010 2011
Burundi 23.45 26.38 27.9 15.9 18.7 20.8 Burundi
Kenya 43.1 51 52 30.3 33.8 38.1 Kenya
Rwanda … … … … … … Rwanda
Tanzania 18.15 21.05 24.2 15.3 16.2 17.8 Tanzanie
Uganda 11.80 17.10 18.7 13.3 15.7 17.9 Ouganda
EAC 24.12 28.88 30.70 18.69 21.11 23.65 CAE

KeyStats 2013 IV: EAC / CAE
3 MONETARY AND FINANCIAL SECTOR SECTEUR MONETAIRE ET FINANCIER 3 3.4 Interest rates
(in percentage) Taux d’intérêts
(en pourcentage) 3.4
COUNTRY Deposit rate / Taux de dépôts Discount rate / Taux d’escompte
PAYS 2009 2010 2011 2009 2010 2011
Burundi … … … 9.7 9.3 9.1 Burundi
Kenya 6.0 4.6 5.6 8.8 9.8 9.4 Kenya
Rwanda … 7.1 … … 9.6 … Rwanda
Tanzania 8.0 6.6 6.8 7.1 8.0 8.2 Tanzanie
Uganda 9.8 7.7 13.0 11.2 12.5 8.8 Ouganda
EAC 7.9 6.5 8.5 9.2 9.8 8.9 CAE
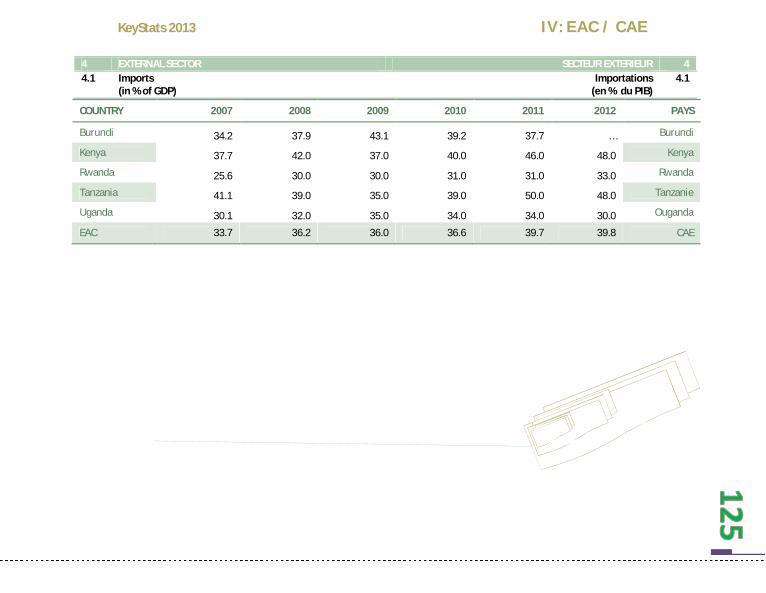
KeyStats 2013 IV: EAC / CAE
4 EXTERNAL SECTOR SECTEUR EXTERIEUR 4 4.1 Imports
(in % of GDP) Importations
(en % du PIB) 4.1
COUNTRY 2007 2008 2009 2010 2011 2012 PAYS
Burundi 34.2 37.9 43.1 39.2 37.7 … Burundi
Kenya 37.7 42.0 37.0 40.0 46.0 48.0 Kenya
Rwanda 25.6 30.0 30.0 31.0 31.0 33.0 Rwanda
Tanzania 41.1 39.0 35.0 39.0 50.0 48.0 Tanzanie
Uganda 30.1 32.0 35.0 34.0 34.0 30.0 Ouganda
EAC 33.7 36.2 36.0 36.6 39.7 39.8 CAE

KeyStats 2013 IV: EAC / CAE
4 EXTERNAL SECTOR SECTEUR EXTERIEUR 4 4.2 Exports
(in % of GDP) Exportations
(en % du PIB) 4.2
COUNTRY 2007 2008 2009 2010 2011 2012 PAYS
Burundi 7.3 9.0 7.0 9.0 9.0 … Burundi
Kenya 26.8 28.0 24.0 28.0 29.0 27.0 Kenya
Rwanda 11.2 14.0 10.0 10.0 13.0 13.0 Rwanda
Tanzania 24.2 25.0 23.0 28.0 31.0 31.0 Tanzanie
Uganda 16.7 24.0 24.0 24.0 24.0 20.0 Ouganda
EAC 17.2 20.0 17.6 19.8 21.2 22.8 CAE

KeyStats 2013 IV: EAC / CAE
4 EXTERNAL SECTOR SECTEUR EXTERIEUR 4 4.3 Trade balance
(in % of GDP) Solde commercial
(en % du PIB) 4.3
COUNTRY 2007 2008 2009 2010 2011 2012 PAYS
Burundi -24.7 -16.50 -15.80 -16.60 -18.20 -18.30 Burundi
Kenya -15.7 -18.50 -18.70 -19.40 -17.6 -19.30 Kenya
Rwanda -11.3 -15.90 -14.50 -14.00 -20.10 -20.30 Rwanda
Tanzania -15.7 -16.40 -13.40 -12.30 -15.20 -13.80 Tanzanie
Uganda -7.3 -11.2 -9.1 -12.5 -13.9 -14.9 Ouganda
EAC -14.9 -15.7 -14.3 -15.0 -17.0 -17.3 CAE

KeyStats 2013 IV: EAC / CAE
4 EXTERNAL SECTOR SECTEUR EXTERIEUR 4 4.4 Current account balance
(in millions of US$) Solde du compte courant
(en millions de $ EU) 4.4
COUNTRY 2007 2008 2009 2010 2011 2012 PAYS
Burundi -124 -308 -198 -370 -358 -535 Burundi
Kenya -69476 -137148 -187738 -185700 -166733 -139931 Kenya
Rwanda -83 -230 -376 -421 -463 … Rwanda
Tanzania -1643 -2595 -1768 -1853 … … Tanzanie
Uganda -633 -1268 -1090 -1699 -1974 -2025 Ouganda
EAC -71 959 -141 549 -191 170 -190 043 -169 528 -142 491 CAE

KeyStats 2013 IV: EAC / CAE
4 EXTERNAL SECTOR SECTEUR EXTERIEUR 4 4.5 Capital and financial account
(in millions of US$) Compte des capitaux et des opérations financières
(en millions de $ EU) 4.5
COUNTRY 2007 2008 2009 2010 2011 2012 PAYS
Burundi 161 246 214 363 351 535 Burundi
Kenya 157 94 261 240 … … Kenya
Rwanda 92 210 200 286 197 … Rwanda
Tanzania 1765 2158 1821 2194 … … Tanzanie
Uganda 1393 1169 1721 1053 1594 2252 Ouganda
EAC 3 568 3 877 4 217 4 136 … … CAE

KeyStats 2013 IV: EAC / CAE
4 EXTERNAL SECTOR SECTEUR EXTERIEUR 4 4.6 International financial flows
(in millions of US$) Flux financiers internationaux
(en millions de $ EU) 4.6
COUNTRY
Official development assistance (net) / Appui public au développement (net)
Net foreign direct investment /
PAYS Investissement direct étranger net
2009 2010 2011 2009 2010 2011
Burundi 561 630 579 0 1 2 Burundi
Kenya 1 776 1 629 2474 116 178 335 Kenya
Rwanda 934 1 032 1278 119 42 106 Rwanda
Tanzania 2 933 2 958 2445 953 1 023 1 095 Tanzanie
Uganda 1 785 1 723 1580 842 548 894 Ouganda
EAC 7 989 7 972 8 356 2 030 1 792 2 432 CAE

KeyStats 2013 IV: EAC / CAE
4 EXTERNAL SECTOR SECTEUR EXTERIEUR 4 4.7 Total international reserves
(in millions of US$) Réserves internationales totales
(en millions de $ EU) 4.7
COUNTRY 2007 2008 2009 2010 2011 2012 PAYS
Burundi 176 266 322 331 294 307 Burundi
Kenya 3 355 2 879 3 849 4 320 4 264 5 711 Kenya
Rwanda 553 596 743 813 1 050 771 Rwanda
Tanzania 2 886 2 863 3 470 3 905 3 726 3 541 Tanzanie
Uganda 2 560 2 301 2 994 2 706 2 617 3 120 Ouganda
EAC 9 530 8 905 11 378 12 075 11 951 13 450 CAE

KeyStats 2013 IV: EAC / CAE
4 EXTERNAL SECTOR SECTEUR EXTERIEUR 4 4.8 Total international reserves / average monthly imports
(ratio) Réserves internationales totales / Importations moyennes
mensuelles (ratio) 4.8
COUNTRY 2007 2008 2009 2010 2011 2012 PAYS
Burundi 4.72 5.25 7.21 6.44 4.49 … Burundi
Kenya 4.48 3.10 4.53 4.33 3.08 … Kenya
Rwanda 9.77 6.90 8.02 … 5.74 5.59 Rwanda
Tanzania 5.85 4.25 6.38 5.85 3.57
Tanzanie
Uganda 7.19 4.85 6.36 5.00 4.00 4.62 Ouganda
EAC 6.40 4.87 6.50 5.41 4.17 5.10 CAE

KeyStats 2013 IV: EAC / CAE
4 EXTERNAL SECTOR SECTEUR EXTERIEUR 4 4.9 Exchange rate
(National currency / US$) Taux de change
(Monnaie nationale / $ EU) 4.9
COUNTRY Average Exchange Rate (Nat. Currency per us$)
Taux de change (moyen) (monnaie nat. par dollars) PAYS
2007 2008 2009 2010 2011 2012
Burundi 100.0 109.6 113.7 113.8 116.6 133.4 Burundi
Kenya 67.28 69.12 77.24 79.22 88.81 84.53 Kenya
Rwanda 546.14 544.90 566.07 581.91 600.31 614.30 Rwanda
Tanzania 110.3 106.0 117.0 124.8 139.3 140.3 Tanzanie
Uganda 96.8 96.6 114.0 122.3 141.7 139.8 Ouganda

KeyStats 2013 IV: EAC / CAE
4 EXTERNAL SECTOR SECTEUR EXTERIEUR 4 4.10 Total public external debt
(in percentage of GDP) Dette publique extérieure totale
(en pourcentage du PIB) 4.10
COUNTRY 2007 2008 2009 2010 2011 2012 PAYS
Burundi 6.1 5.5 4.2 3.3 … … Burundi
Kenya 0.2 0.2 0.3 0.3 … … Kenya
Rwanda 0.2 0.1 0.1 0.2 … … Rwanda
Tanzania 0.4 0.3 0.3 0.3 … … Tanzanie
Uganda 0.1 0.2 0.2 0.2 0.3 0.2 Ouganda
EAC 1.4 1.3 1.0 0.9 … … CAE

KeyStats 2013 IV: EAC / CAE
4 EXTERNAL SECTOR SECTEUR EXTERIEUR 4 4.11 Debt service
(in percentage of exports) Service de la dette
(en pourcentage des exportations) 4.11
COUNTRY 2007 2008 2009 2010 2011 2012 PAYS
Burundi 19.40 11.88 16.58 2.1 3.4 7.10 Burundi
Kenya 6.28 4.85 5.09 4.41 3.80 5.50 Kenya
Rwanda 5.56 2.06 2.06 2.34 3.9 11.70 Rwanda
Tanzania 1.53 1.14 3.11 3.03 2.90 3.30 Tanzanie
Uganda 135.10 8.80 9.10 8.70 8.30 8.50 Ouganda
EAC 9.25 5.75 7.19 4.12 4.46 7.22 CAE

KeyStats 2013 IV: EAC / CAE
4 EXTERNAL SECTOR SECTEUR EXTERIEUR 4 4.12 Tariffs and imports by product groups in % (2012) Tarifs et importations par groupe des produits en % (en
2012) 4.12
COUNTRY Animal products Dairy products Fruit, vegetables, plants
Coffee, tea Cereals & preparations PAYS
Burundi 23.3 43.3 22.1 19.6 22.4 Burundi Kenya 23.3 43.3 22.1 19.6 23.6 Kenya Rwanda 23.3 43.3 22.1 19.6 23.6 Rwanda Tanzania 23.3 43.3 22.1 19.6 24.1 Tanzanie Uganda 23.3 43.3 22.1 19.6 23.6 Ouganda EAC 116.5 216.5 110.5 98.0 117.3 CAE
COUNTRY Oilseeds, fats & oils
Sugars and confectionery
Beverages & tobacco
Cotton Other agricultural products
PAYS
Burundi 11.3 29.8 25.3 0.0 10.9 Burundi Kenya 11.3 29.8 25.3 0.0 10.9 Kenya Rwanda 11.3 26.5 25.3 0.0 10.9 Rwanda Tanzania 11.3 29.8 25.3 0.0 10.9 Tanzanie Uganda 11.3 26.5 25.3 0.0 10.9 Ouganda EAC 11.3 28.5 25.3 0.0 10.9 CAE

KeyStats 2013 IV: EAC / CAE
COUNTRY Fish & fish products Minerals & metals Petroleum Chemicals PAYS
Burundi 24.7 10.6 4.3 4.0 Burundi Kenya 24.7 10.6 4.3 4.0 Kenya Rwanda 24.7 10.6 4.3 4.0 Rwanda Tanzania 24.7 10.6 4.3 4.0 Tanzanie Uganda 24.7 10.5 4.3 3.9 Ouganda EAC 24.7 10.6 4.3 4.0 CAE
COUNTRY Wood, paper, etc. Textiles Clothing Leather, footwear, etc. PAYS
Burundi 16.0 19.6 25.2 12.7 Burundi Kenya 16.0 19.6 25.2 12.7 Kenya Rwanda 16.0 19.6 25.2 12.7 Rwanda Tanzania 16.0 19.6 25.2 12.7 Tanzanie Uganda 16.0 19.5 25.2 12.7 Ouganda EAC 16.0 19.6 25.2 12.7 CAE
COUNTRY Non-electrical machinery Electrical machinery Transport
equipment Manufactures, n.e.s. PAYS
Burundi 3.2 10.8 6.2 14.8 Burundi Kenya 3.2 10.8 6.2 14.8 Kenya Rwanda 3.2 10.8 6.2 14.8 Rwanda Tanzania 3.2 10.8 6.2 14.8 Tanzanie Uganda 3.2 10.8 6.2 14.8 Ouganda EAC 3.2 10.8 6.2 14.8 CAE

KeyStats 2013 IV: EAC / CAE
4 EXTERNAL SECTOR SECTEUR EXTERIEUR 4 4.13 Intra- and inter-regional trade
(in millions of US$) Commerce intra- et inter-régional
(en millions de $E.U.) 4.13
Exports to 2007 2008 2009 2010 2011 2012 Exportations vers Africa 3,322 4,282 3,859 4,617 5,152 5,749 Afrique AMU 7 8 26 9 10 11 UMA CEN-SAD 982 1,540 1,124 1,393 1,565 1,759 CEN-SAD COMESA 2,287 3,063 2,739 3,184 3,555 3,969 COMESA EAC 1,618 2,181 2,048 2,233 2,487 2,769 CAE ECCAS 763 742 836 1,072 1,201 1,345 CEEAC ECOWAS 49 74 48 40 38 35 CEDEAO IGAD 1,415 2,017 1,714 1,882 2,069 2,276 IGAD SADC 1,225 1,430 1,370 1,675 1,859 2,063 SADC
Imports from Importations de Africa 3,853 4,984 4,788 4,823 5,198 5,602 Afrique AMU 3 21 11 41 96 224 UMA CEN-SAD 1,216 1,454 1,229 1,332 1,373 1,415 CEN-SAD COMESA 1,691 1,993 1,723 1,912 1,992 2,075 COMESA EAC 1,322 1,585 1,467 1,492 1,553 1,617 CAE ECCAS 50 52 56 78 91 105 CEEAC ECOWAS 14 57 17 18 19 20 CEDEAO IGAD 1,170 1,398 1,243 1,229 1,249 1,270 IGAD SADC 1,864 2,415 2,383 2,429 2,653 2,898 SADC

V ECCAS / CEEAC
The Economic Community for Central African States (ECCAS)
was created in 1983 by 10 countries. The ultimate goal of ECCAS is to create a Central
African Common Market, and to ensure peace and security in the
area.
La Communauté économique des Etats de l’Afrique Centrale
(CEEAC) fut créée en octobre 1983, par 10 pays. Le but ultime de la CEEAC est de mettre en place un Marché Commun de l’Afrique Centrale, et d’assurer la paix et la
sécurité dans la zone.

KeyStats 2013 V: ECCAS / CEEAC
0 POPULATION POPULATION 0 0.1 Total population
(in millions) Population totale
(en millions) 0.1
COUNTRY 2007 2008 2009 2010 2011 2012 PAYS
Angola 16.5 16.4 16.9 17.4 18.0 20.2 Angola
Burundi 7.7 7.9 8.2 8.4 8.6 8.8 Burundi
Cameroon 18.4 18.8 18.9 19.7 20.1 20.5 Cameroun CAR 4.2 4.2 4.3 4.4 4.5 4.6 RCA Chad 10.4 10.7 10.9 11.2 11.5 11.9 Tchad Congo 3.7* 3.8 3.9 4.0 4.1 4.2 Congo DR Congo 60.8 62.5 64.2 66.0 67.8 69.6 RD Congo
Equatorial Guinea 0.6 0.7 0.7 0.7 0.7 0.8 Guinée équatoriale
Gabon 1.4 1.5 1.5 1.5 1.5 1.6 Gabon São Tomé 0.2 0.2 0.2 0.2 0.2 0.2 São Tomé
ECCAS 123.9 126.6 129.7 133.5 137.0 142.3 CEEAC
**-+

KeyStats 2013 V: ECCAS / CEEAC
0 POPULATION POPULATION 0 0.2 Population structure
(in percentage of total population) Structure de la population
(en pourcentage de la population totale) 0.2
COUNTRY Female / Femmes Urban / Urbaine
2010 2011 2012 2010 2011 2012 PAYS
Angola 50.5 50.5 50.5 58.5 59.4 … Angola Burundi 50.9 50.9 50.9 24.0 11.3 … Burundi Cameroon 50.1 50.1 50.1 11.0 59.1 … Cameroun CAR 50.7 50.7 50.7 38.9 39.2 … RCA Chad 50.3 50.3 50.3 27.6 28.2 … Tchad Congo 49.9 49.9 49.9 62.1 62.5 … Congo DR Congo 50.3 50.3 50.3 35.2 35.9 … RD Congo Equatorial Guinea 48.7 48.8 48.8 39.7 39.9 … Guinée équatoriale Gabon 49.8 49.8 49.8 86.0 86.4 … Gabon São Tomé 50.5 50.5 50.5 62.2 63.0 … São Tomé ECCAS 50.2 50.2 50.2 44.5 48.5 CEEAC
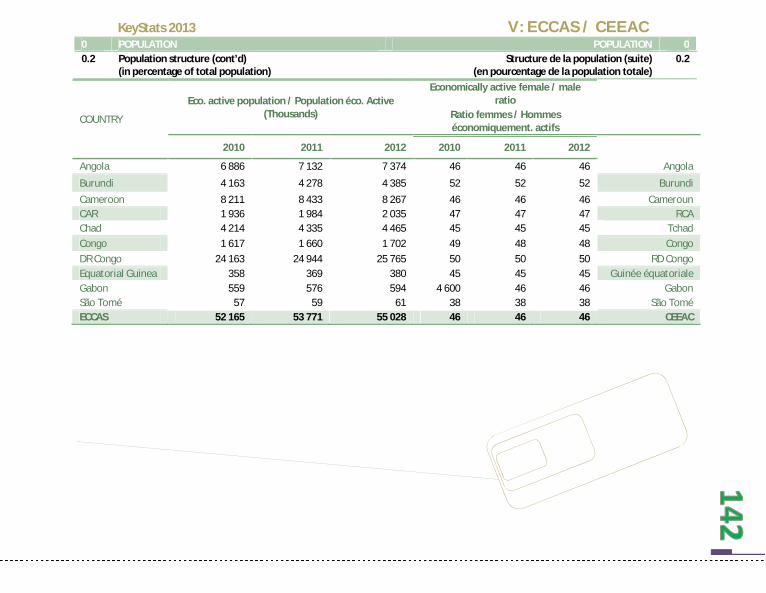
KeyStats 2013 V: ECCAS / CEEAC
0 POPULATION POPULATION 0 0.2 Population structure (cont’d)
(in percentage of total population) Structure de la population (suite)
(en pourcentage de la population totale) 0.2
COUNTRY
Eco. active population / Population éco. Active (Thousands)
Economically active female / male ratio
Ratio femmes / Hommes économiquement. actifs
2010 2011 2012 2010 2011 2012
Angola 6 886 7 132 7 374 46 46 46 Angola
Burundi 4 163 4 278 4 385 52 52 52 Burundi Cameroon 8 211 8 433 8 267 46 46 46 Cameroun CAR 1 936 1 984 2 035 47 47 47 RCA Chad 4 214 4 335 4 465 45 45 45 Tchad Congo 1 617 1 660 1 702 49 48 48 Congo DR Congo 24 163 24 944 25 765 50 50 50 RD Congo Equatorial Guinea 358 369 380 45 45 45 Guinée équatoriale Gabon 559 576 594 4 600 46 46 Gabon São Tomé 57 59 61 38 38 38 São Tomé ECCAS 52 165 53 771 55 028 46 46 46 CEEAC

KeyStats 2013 V: ECCAS / CEEAC
1 REAL SECTOR SECTEUR REEL 1 1.1 GDP at current
(in millions of US$) PIB à prix courant
(en millions de $ EU) 1.1
COUNTRY 2007 2008 2009 2010 2011 2012 PAYS
Angola 60 449 84 216 75 519 82 476 104 288 116 479 Angola Burundi 922 1 078 1 225 1 380 2 356 2 471 Burundi Cameroon 20 432 23 323 23 380 23 621 25 649 26 404 Cameroun CAR 1 698 1 984 1 982 1 987 2 195 2 010 RCA Chad 8 233 9 952 9 030 10 626 9 345 12 730 Tchad Congo 8 344 11 790 9 408 12 407 14 439 14 323 Congo DR Congo 10 029 11 933 11 153 13 191 15 713 18 135 RD Congo Equatorial Guinea 10 841 14 550 10 127 12 386 19 588 24 070 Guinée équatoriale Gabon 11 430 14 413 10 866 13 255 15 970 19 410 Gabon São Tomé 144 182 198 207 248 255 São Tomé ECCAS 132 520 173 419 152 889 171 535 209 791 236 287 CEEAC

KeyStats 2013 V: ECCAS / CEEAC
1 REAL SECTOR SECTEUR REEL 1 1.2 Structure of GDP
(in percentage) Structure du PIB
(en pourcentage) 1.2
COUNTRY Agriculture / Agriculture
Industry / Industrie
Manufacture / Manufacture
Services etc. /
Services etc.
PAYS
2004 2011 2004 2011 2004 2011 2004 2011 Angola 8.6 10.3 67.7 62.0 4.0 6.7 23.7 27.7 Angola Burundi 52.2 41.6 15.5 20.5 10.0 14.6 23.3 37.9 Burundi Cameroon 20.4 23.6 30.6 29.6 19.2 14.5 49.0 46.9 Cameroun CAR 55.7 54.1 14.1 13.8 6.1 6.6 30.2 32.1 RCA Chad 28.9 16.2 31.1 43.4 7.0 5.6 39.9 40.3 Tchad Congo 5.7 3.3 67.7 77.7 5.1 2.8 26.6 19.0 Congo DR Congo 24.9 22.2 33.2 37.4 18.4 23.2 41.9 40.4 RD Congo
Equatorial Guinea 3.0 1.4 93.5 95.5 0.1 0.1 3.5 3.1 Guinée équatoriale Gabon 6.0 4.1 59.3 67.0 5.4 3.9 34.6 28.9 Gabon São Tomé 21.0 22.0 18.0 17.7 7.6 7.1 61.0 60.2 São Tomé ECCAS 22.6 19.9 43.1 46.5 8.3 8.5 33.4 33.7 CEEAC

KeyStats 2013 V: ECCAS / CEEAC
1 REAL SECTOR SECTEUR REEL 1 1.3 Real GDP Growth
(in percentage) Croissance réelle du PIB
(en pourcentage) 1.3
1.3 Real GDP Growth Croissance
réelle du PIB 1.3
(in percentage) (en pourcentage)
COUNTRY 2007 2008 2009 2010 2011 2012 PAYS Angola 23.2 13.8 2.4 3.4 3.9 6.8 Angola Burundi 3.6 4.5 3.5 3.9 4.2 4.7 Burundi Cameroon 3.3 2.9 1.9 3.3 4.2 4.9 Cameroun CAR 3.7 2.0 1.7 3.0 3.3 3.1 RCA Chad 8.4 3.4 4.1 14.6 3.3 5.9 Tchad Congo - 1.6 5.9 7.5 8.7 3.4 6.8 Congo DR Congo 6.3 6.2 2.8 7.1 6.9 7.2 RD Congo Equatorial Guinea 24.0 16.1 4.1 1.3 7.8 5.3 Guinée équatoriale
Gabon 5.6 2.3 - 1.4 6.6 6.6 5.6 Gabon São Tomé 2.4 9.4 4.8 4.5 4.9 4.0 São Tomé ECCAS 7.9 6.7 3.1 5.6 4.9 5.4 CEEAC

KeyStats 2013 V: ECCAS / CEEAC
1 REAL SECTOR SECTEUR REEL 1 1.4 Per capita GDP and GNI
(in US$) PIB et RNB par habitant
(en $ EU) 1.4
COUNTRY Current prices / Prix courant PPP / PPA
GNI / RNB PAYS
2010 2011 2012 2010 2011 2012 2010 2011 2012 Angola 4 732 5 314 5 777 5 749 5 924 5 490 3960 4060 … Angola Burundi 165 275 282 582 605 560 230 250 … Burundi Cameroon 1 200 1 225 1 290 2 176 2 259 2 320 1200 1210 … Cameroun CAR 451 463 439 745 767 860 470 470 … RCA Chad 946 892 1 076 1 841 1 867 1 320 710 690 … Tchad Congo 3 069 3 631 3 384 4 426 4 543 3 510 2240 2270 … Congo DR Congo 200 217 261 329 349 370 180 190 … RD Congo Equatorial Guinea 17 684 14 500 32 506 18 057 19 321 18 880 13720 14540 … Guinée équatoriale Gabon 8 805 10 518 12 411 15 197 16 313 14 290 7680 7980 … Gabon São Tomé 1 254 1 473 1 486 2 141 2 252 1 850 1250 1360 … São Tomé ECCAS 38 505 38 508 58 912 51 243 54 199 49 450 31 640 33 020 … CEEAC

KeyStats 2013 V: ECCAS / CEEAC
1 REAL SECTOR SECTEUR REEL 1 1.5a Inflation
(in percentage) Inflation
(en pourcentage) 1.5a
COUNTRY 2007 2008 2009 2010 2011 2012 PAYS Angola 12.3 12.4 13.7 14.4 13.5 11.1 Angola Burundi 8.4 24.5 10.5 6.5 9.6 11.7 Burundi Cameroon 1.1 5.3 3.0 1.3 2.9 3.0 Cameroun CAR 0.9 9.3 3.5 1.7 1.0 2.2 RCA Chad -8.4 10.3 10.1 -2.3 ... 3.0 Tchad Congo 2.6 5.9 3.8 4.8 5.9 3.0 Congo DR Congo 22.3 44.7 34.8 17.2 18.6 12.7 RD Congo
Equatorial Guinea 2.8 6.0 5.5 4.7 7.3 4.0 Guinée équatoriale Gabon 5.0 5.3 1.9 1.4 1.3 1.1 Gabon São Tomé 27.6 24.8 16.1 12.3 10.6 8.3 São Tomé ECCAS … … … … … … CEEAC

KeyStats 2013 V: ECCAS / CEEAC
1 REAL SECTOR SECTEUR REEL 1 1.5b Inflation
(in percentage) Inflation
(en pourcentage) 1.5b
COUNTRY 2007 2008 2009 2010 2011 2012 PAYS Angola … … … … … … Angola Burundi … … … … … … Burundi Cameroon … … … … … … Cameroun CAR … … … … … … RCA Chad … … … … … … Tchad Congo … … … … … … Congo DR Congo … … … … … … RD Congo Equatorial Guinea … … … … … … Guinée équatoriale Gabon … … … … … … Gabon São Tomé … … … … … … São Tomé ECCAS … … … … … … CEEAC
CPI Harmonized

KeyStats 2013 V: ECCAS / CEEAC
2 GOVERNMENT FINANCE FINANCES PUBLIQUES 2 2.1a Total revenue plus grants
(in percentage of GDP) Recettes totales plus dons
(en pourcentage du PIB) 2.1a
COUNTRY 2005 2008 2009 2010 2011 2012 PAYS
Angola … … … … … … Angola Burundi … … … … … … Burundi Cameroon … … … … … … Cameroun CAR … … … … … … RCA Chad … … … … … … Tchad Congo … … … … … … Congo DR Congo … … … … … … RD Congo Equatorial Guinea … … … … … … Guinée équatoriale
Gabon … … … … … … Gabon São Tomé … … … … … … São Tomé ECCAS … … … … … … CEEAC
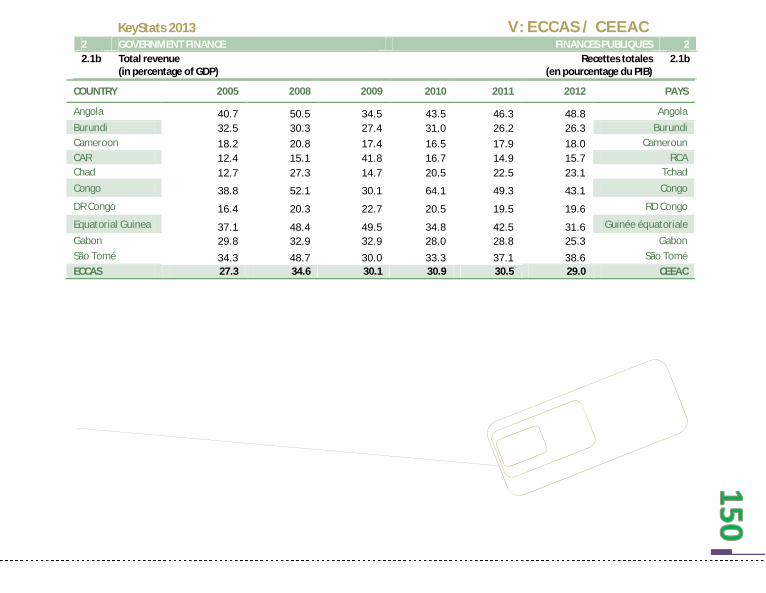
KeyStats 2013 V: ECCAS / CEEAC
2 GOVERNMENT FINANCE FINANCES PUBLIQUES 2 2.1b Total revenue
(in percentage of GDP) Recettes totales
(en pourcentage du PIB) 2.1b
COUNTRY 2005 2008 2009 2010 2011 2012 PAYS
Angola 40.7 50.5 34.5 43.5 46.3 48.8 Angola Burundi 32.5 30.3 27.4 31.0 26.2 26.3 Burundi Cameroon 18.2 20.8 17.4 16.5 17.9 18.0 Cameroun CAR 12.4 15.1 41.8 16.7 14.9 15.7 RCA Chad 12.7 27.3 14.7 20.5 22.5 23.1 Tchad Congo 38.8 52.1 30.1 64.1 49.3 43.1 Congo
DR Congo 16.4 20.3 22.7 20.5 19.5 19.6 RD Congo
Equatorial Guinea 37.1 48.4 49.5 34.8 42.5 31.6 Guinée équatoriale Gabon 29.8 32.9 32.9 28.0 28.8 25.3 Gabon São Tomé 34.3 48.7 30.0 33.3 37.1 38.6 São Tomé ECCAS 27.3 34.6 30.1 30.9 30.5 29.0 CEEAC
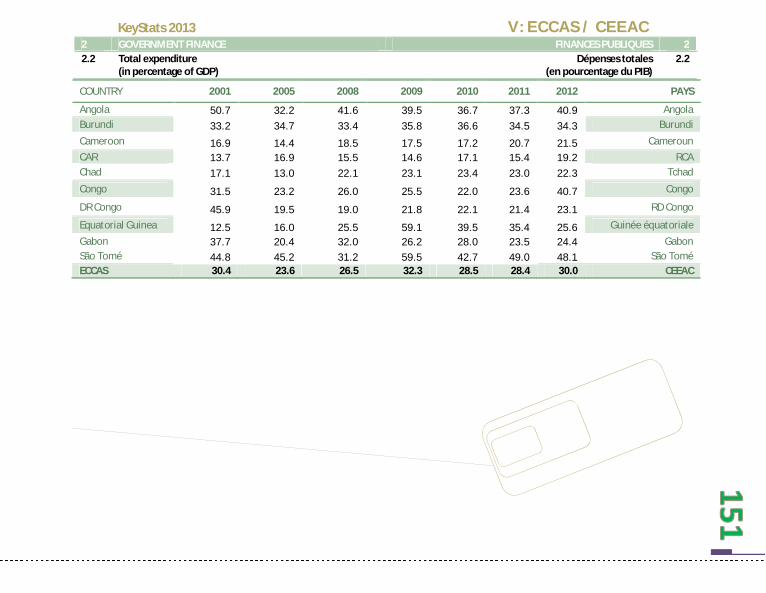
KeyStats 2013 V: ECCAS / CEEAC
2 GOVERNMENT FINANCE FINANCES PUBLIQUES 2 2.2 Total expenditure
(in percentage of GDP) Dépenses totales
(en pourcentage du PIB) 2.2
COUNTRY 2001 2005 2008 2009 2010 2011 2012 PAYS
Angola 50.7 32.2 41.6 39.5 36.7 37.3 40.9 Angola Burundi 33.2 34.7 33.4 35.8 36.6 34.5 34.3 Burundi Cameroon 16.9 14.4 18.5 17.5 17.2 20.7 21.5 Cameroun CAR 13.7 16.9 15.5 14.6 17.1 15.4 19.2 RCA Chad 17.1 13.0 22.1 23.1 23.4 23.0 22.3 Tchad
Congo 31.5 23.2 26.0 25.5 22.0 23.6 40.7 Congo
DR Congo 45.9 19.5 19.0 21.8 22.1 21.4 23.1 RD Congo
Equatorial Guinea 12.5 16.0 25.5 59.1 39.5 35.4 25.6 Guinée équatoriale Gabon 37.7 20.4 32.0 26.2 28.0 23.5 24.4 Gabon São Tomé 44.8 45.2 31.2 59.5 42.7 49.0 48.1 São Tomé ECCAS 30.4 23.6 26.5 32.3 28.5 28.4 30.0 CEEAC

KeyStats 2013 V: ECCAS / CEEAC
2 GOVERNMENT FINANCE FINANCES PUBLIQUES 2 2.3 Fiscal balance
(Surplus+ / Deficit-) (in percentage of GDP)
Solde budgétaire (Excédent+ / Déficit-)
(en pourcentage du PIB)
2.2
COUNTRY 2005 2008 2009 2010 2011 2012 PAYS
Angola 8.5 8.8 -4.9 6.8 8.9 7.8 Angola Burundi -2.3 -3.1 -8.4 -5.7 ... -8.0 Burundi Cameroon 3.8 2.3 0.0 -0.7 ... -3.5 Cameroun CAR -4.5 -0.4 27.2 -0.4 -0.6 -3.5 RCA Chad -0.4 5.2 -8.4 -2.9 -0.5 0.8 Tchad Congo 15.6 26.1 4.7 42.1 25.7 2.4 Congo DR Congo -0.8 -2.4 0.9 -1.6 ... -3.5 RD Congo
Equatorial Guinea 21.1 22.9 -9.6 -4.7 7.1 6.0 Guinée équatoriale
Gabon 9.4 0.9 6.6 0.0 5.4 0.9 Gabon São Tomé -10.9 17.5 -29.5 -9.4 ... -9.4 São Tomé ECCAS 3.9 7.8 -2.1 2.4 7.7 -1.0 CEEAC

KeyStats 2013 V: ECCAS / CEEAC
3 MONETARY AND FINANCIAL SECTOR SECTEUR MONETAIRE ET FINANCIER 3 3.1 Money (M1)
(in millions of US$) Monnaie (M1)
(en millions de DEU) 3.1
COUNTRY 2007 2008 2009 2010 2011 2012 PAYS Angola 311 539 573 926 700 445 783 030 3 656 143 4 193 237 Angola Burundi 3 689 4 335 4 371 4 868 672 134 795 998 Burundi Cameroon 1 128 1 319 1 424 1 592 3 033 3 211 Cameroun CAR 97 294 113 600 131 825 149 098 206 124 234 563 RCA Chad 390 443 444 566 466 767 Tchad Congo 623 647 837 787 878 931 1 235 910 1 901 964 2 794 531 Congo DR Congo 300 273 355 960 432 823 634 990 2 447 664 2 875 550 RD Congo Equatorial Guinea 372 169 531 507 626 789 951 783 1 098 315 1 376 856 Guinée équatoriale Gabon 689 766 756 905 17 757 1 520 Gabon Rwanda 614 035 837 601 867 120 1 085 970 1 781 935 1 527 301 São Tomé ECCAS 2324 854 3257 244 3644 929 4848 712 11785 535 13803 534 CEEAC

KeyStats 2013 V: ECCAS / CEEAC
3 MONETARY AND FINANCIAL SECTOR SECTEUR MONETAIRE ET FINANCIER 3 3.2 Money plus quasi-money (M2)
(in % of GDP) Monnaie plus quasi-monnaie (M2)
(en % du PIB) 3.2
COUNTRY 2007 2008 2009 2010 2011 2012 PAYS Angola 18.39 22.44 38.47 34.42 35.85 35.49 Angola Burundi 24.34 24.85 25.92 26.98 23.91 22.95 Burundi Cameroon 18.14 19.04 20.91 22.38 22.98 21.51 Cameroun CAR 14.01 15.19 16.11 17.81 19.49 18.52 RCA Chad 11.93 13.53 14.44 14.31 13.85 13.94 Tchad Congo 17.97 18.10 22.27 22.38 26.99 31.53 Congo DR Congo 12.28 15.08 16.37 16.36 16.03 16.93 RD Congo Equatorial Guinea 8.87 8.27 15.22 16.36 13.49 18.69 Guinée équatoriale Gabon 18.23 15.90 20.31 19.42 20.04 20.51 Gabon São Tomé 39.18 38.85 35.59 38.11 35.79 36.86 São Tomé ECCAS 18.3 19.1 22.6 22.9 22.8 23.7 CEEAC

KeyStats 2013 V: ECCAS / CEEAC
3 MONETARY AND FINANCIAL SECTOR SECTEUR MONETAIRE ET FINANCIER 3 3.3 Domestic credit
(in percentage of GDP) Crédit intérieur
(en pourcentage du PIB) 3.3
COUNTRY
provided by banking sector /
provenant du secteur bancaire
to private sector /
au secteur privé
PAYS
2009 2010 2011 2012 2009 2010 2011 2012 Angola 29.23 23.55 15.91 17.83 21.2 20.9 18.8 23.0 Angola Burundi 23.45 26.38 26.07 29.15 15.9 18.7 18.6 21.6 Burundi Cameroon 8.27 10.80 9.71 9.33 12.1 13.2 12.5 12.9 Cameroun CAR 20.01 22.67 20.35 23.40 7.2 9.0 9.2 12.2 RCA Chad 9.39 9.54 6.35 6.38 5.1 5.3 6.0 7.3 Tchad Congo -14.36 -14.34 -18.69 -12.81 4.9 6.5 7.1 8.9 Congo DR Congo 7.27 0.98 2.99 1.94 7.2 6.6 5.7 6.8 RD Congo Equatorial Guinea -11.95 1.20 3.09 0.00 7.1 7.5 7.5 7.7 Guinée équatoriale Gabon 8.70 11.40 10.93 9.51 11.1 8.9 8.8 9.9 Gabon São Tomé 25.42 39.41 35.91 36.66 … … 34.7 37.8 São Tomé ECCAS 10.54 13.16 11.26 12.14 10.22 10.74 12.90 14.80 CEEAC
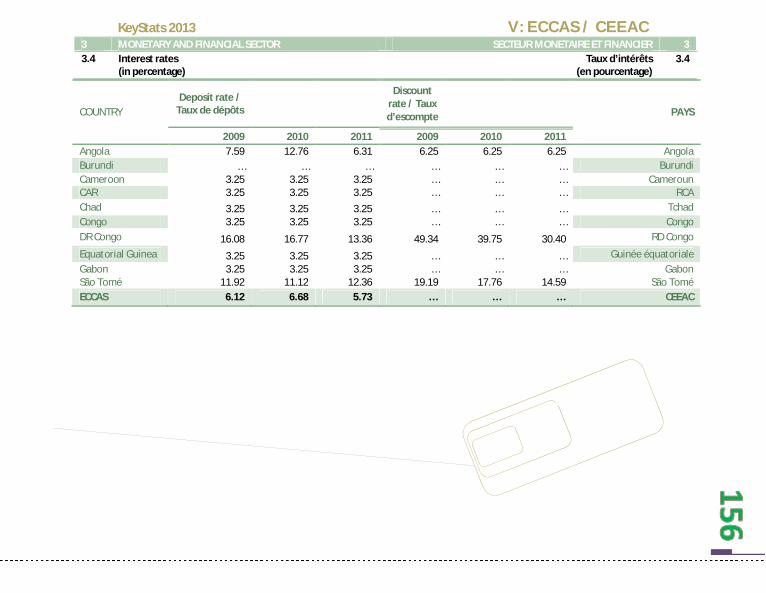
KeyStats 2013 V: ECCAS / CEEAC
3 MONETARY AND FINANCIAL SECTOR SECTEUR MONETAIRE ET FINANCIER 3 3.4 Interest rates
(in percentage) Taux d’intérêts
(en pourcentage) 3.4
COUNTRY Deposit rate /
Taux de dépôts Discount
rate / Taux d’escompte
PAYS
2009 2010 2011 2009 2010 2011 Angola 7.59 12.76 6.31 6.25 6.25 6.25 Angola Burundi … … … … … … Burundi Cameroon 3.25 3.25 3.25 … … … Cameroun CAR 3.25 3.25 3.25 … … … RCA Chad 3.25 3.25 3.25 … … … Tchad Congo 3.25 3.25 3.25 … … … Congo DR Congo 16.08 16.77 13.36 49.34 39.75 30.40 RD Congo
Equatorial Guinea 3.25 3.25 3.25 … … … Guinée équatoriale Gabon 3.25 3.25 3.25 … … … Gabon São Tomé 11.92 11.12 12.36 19.19 17.76 14.59 São Tomé ECCAS 6.12 6.68 5.73 … … … CEEAC

KeyStats 2013 V: ECCAS / CEEAC
4 EXTERNAL SECTOR SECTEUR EXTERIEUR 4 4.1 Imports
(in % of GDP) Importations
(en % du PIB) 4.1
COUNTRY 2007 2008 2009 2010 2011 2012 PAYS
Angola 43.52 51.23 55.40 42.95 43.31 43.34 Angola Burundi 34.22 37.93 43.12 39.18 37.67 … Burundi Cameroon 29.53 33.12 28.31 28.86 34.84 … Cameroun CAR 23.47 23.46 21.55 24.60 23.57 … RCA Chad 52.30 50.20 28.29 27.96 25.47 … Tchad Congo 53.52 47.00 50.21 54.70 34.81 53.64 Congo DR Congo 68.55 76.39 60.91 77.94 78.01 63.79 RD Congo Equatorial Guinea 36.96 44.90 71.63 62.77 55.82 57.89 Guinée équatoriale
Gabon 32.88 … … … … … Gabon São Tomé 63.66 61.91 52.30 64.31 57.36 … São Tomé ECCAS 43. 86 47. 35 45. 75 47. 03 43. 43 54. 67 CEEAC

KeyStats 2013 V: ECCAS / CEEAC
4 EXTERNAL SECTOR SECTEUR EXTERIEUR 4 4.2 Exports
(in % of GDP) Exportations
(en % du PIB) 4.2
Exports to 2007 2008 2009 2010 2011 2012 Exportations
vers
Africa 1,380 3,121 7,060 15,967 36,115 81,684 Afrique
AMU 96 213 481 1,088 2,460 5,535 UMA
CEN-SAD 503 1,138 2,573 5,820 13,164 29,773 CEN-SAD
COMESA 155 351 793 1,793 4,056 9,175 COMESA
EAC 34 77 174 393 890 2,013 CAE
ECCAS 334 755 1,709 3,865 8,741 19,770 CEEAC
ECOWAS 287 649 1,468 3,321 7,511 16,988 CEDEAO
IGAD 15 34 77 174 393 888 IGAD
SADC 702 1,588 3,591 8,123 18,372 41,554 SADC

KeyStats 2013 V: ECCAS / CEEAC
4 EXTERNAL SECTOR SECTEUR EXTERIEUR 4 4.3 Trade balance
(in millions of US$) Solde commercial
(en millions de $ EU) 4.3
Imports from 2007 2008 2009 2010 2011 2012 Importations de
Africa 3683 9,818 26,172 69,766 185,976 495,760 Afrique
AMU 177 472 1,258 3,353 8,938 23,826 UMA
CEN-SAD 1434 3,823 10,190 27,164 72,411 193,028 CEN-SAD
COMESA 830 2,213 5,898 15,722 41,912 111,724 COMESA
EAC 474 1,264 3,368 8,979 23,935 63,804 CAE
ECCAS 369 984 2,622 6,990 18,633 49,670 CEEAC
ECOWAS 912 2,431 6,481 17,276 46,052 122,762 CEDEAO
IGAD 403 1,074 2,864 7,634 20,350 54,247 IGAD
SADC 1821 4854 12940 34495 91953 245,121 SADC

KeyStats 2013 V: ECCAS / CEEAC
4 EXTERNAL SECTOR SECTEUR EXTERIEUR 4 4.4 Current account balance
(in millions of US$) Solde du compte courant
(en millions de $ EU) 4.4
COUNTRY 2007 2008 2009 2010 2011 2012 PAYS Angola 12 056 8 693 -7 497 6 683 13 085 11 346 Angola Burundi - 73 - 16 30 - 248 - 323 - 387 Burundi
Cameroon 282 - 280 - 734 - 677 - 752 -1 099 Cameroun CAR - 106 - 198 - 182 - 202 - 167 - 135 RCA Chad 814 750 - 291 - 431 - 102 - 226 Tchad
Congo - 547 279 - 710 609 103 490 Congo DR Congo - 113 -2 025 -1 166 -1 061 -1 814 -2 192 RD Congo
Equatorial Guinea - 314 - 182 -1 835 -2 918 -1 799 -2 529 Guinée équatoriale
Gabon 1 869 3 664 907 1 290 2 676 2 324 Gabon São Tomé - 43 - 64 - 46 - 45 - 68 - 70 São Tomé ECCAS 13 825 10 621 -11 524 3 000 10 839 7 522 CEEAC
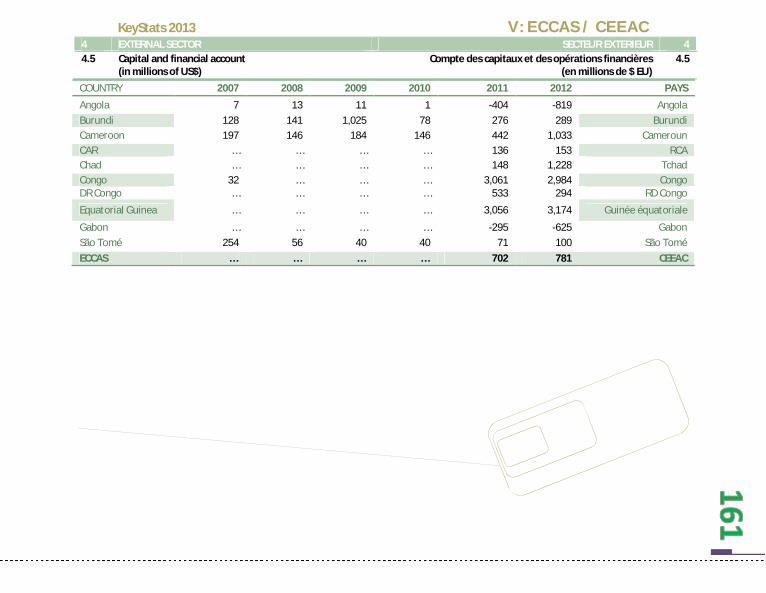
KeyStats 2013 V: ECCAS / CEEAC
4 EXTERNAL SECTOR SECTEUR EXTERIEUR 4 4.5 Capital and financial account
(in millions of US$) Compte des capitaux et des opérations financières
(en millions de $ EU) 4.5
COUNTRY 2007 2008 2009 2010 2011 2012 PAYS
Angola 7 13 11 1 -404 -819 Angola Burundi 128 141 1,025 78 276 289 Burundi Cameroon 197 146 184 146 442 1,033 Cameroun CAR … … … … 136 153 RCA Chad … … … … 148 1,228 Tchad Congo 32 … … … 3,061 2,984 Congo DR Congo … … … … 533 294 RD Congo
Equatorial Guinea … … … … 3,056 3,174 Guinée équatoriale
Gabon … … … … -295 -625 Gabon São Tomé 254 56 40 40 71 100 São Tomé ECCAS … … … … 702 781 CEEAC

KeyStats 2013 V: ECCAS / CEEAC
4 EXTERNAL SECTOR SECTEUR EXTERIEUR 4 4.6 International financial flows
(in millions of US$) Flux financiers internationaux
(en millions de $ EU) 4.6
COUNTRY
Official development
assistance (net) / Appui
public au développeme
nt (net)
Net foreign direct investment /
Investissement direct
étranger net PAYS
2009 2010 2011 2012 2009 2010 2011 2012
Angola 239 … 225 206 13 101 … -3 042 -5 740 Angola Burundi 561 … 644 591 10 … 1 2 Burundi Cameroon 648 … 555 638 337 … 364 369 Cameroun CAR 242 … 266 279 42 … 93 112 RCA Chad 561 … 499 487 462 … 1 992 1 915 Tchad Congo 283 … 1 344 259 2 083 … 2 262 2 997 Congo DR Congo 2 357 … 3 643 5 672 664 … 3 022 1 733 RD Congo Equatorial Guinea 31 … 87 25 1 636 … 1 408 768 Guinée équatoriale Gabon 77 … 106 79 33 … 541 759 Gabon São Tomé 31 … 50 89 14 … 25 21 São Tomé ECCAS 5 030 … 7 420 8 324 18 382 … 6 665 2 935 CEEAC

KeyStats 2013 V: ECCAS / CEEAC
4 EXTERNAL SECTOR SECTEUR EXTERIEUR 4 4.7 Total international reserves
(in millions of US$) Réserves internationales totales
(en millions de $ EU) 4.7
COUNTRY 2007 2008 2009 2010 2011 2012 PAYS Angola 11 197 17 869 13 664 19 749 26 477 33 414 Angola Burundi 110 318 143 243 149 041 331 294 307 Burundi Cameroon 2 907 3 087 3 676 3 643 3 199 3 033 Cameroun CAR 83 122 211 181 155 166 RCA Chad 955 1 345 617 632 951 952 Tchad Congo 2 174 3 872 3 806 4 447 5 641 5 848 Congo DR Congo 181 78 1 035 1 300 1 268 1 633 RD Congo Equatorial Guinea 3 846 4 431 3 252 2 346 3 054 4 287 Guinée équatoriale Gabon 1 227 1 923 1 993 1 736 2 157 2 295 Gabon São Tomé 39 61 67 49 51 52 São Tomé ECCAS 132 927 176 031 177 362 34 415 43 247 51 987 CEEAC

KeyStats 2013 V: ECCAS / CEEAC
4 EXTERNAL SECTOR SECTEUR EXTERIEUR 4 4.8 Total international reserves / average monthly imports
(ratio) Réserves internationales totales / Importations moyennes
mensuelles (ratio) 4.8
COUNTRY 2007 2008 2009 2010 2011 2012 PAYS Angola 12.11 12.64 6.94 13.06 35.93 … Angola Burundi … … … … 4.49 … Burundi Cameroon 10.11 9.09 11.27 9.61 … … Cameroun CAR 4.29 5.60 10.17 7.39 … … RCA Chad … … … … … … Tchad Congo 7.12 15.09 11.17 13.58 … … Congo DR Congo 0.58 0.20 2.64 … … … RD Congo Equatorial Guinea 34.34 30.81 19.66 … … … Guinée équatoriale
Gabon 14.58 20.22 25.42 … … … Gabon São Tomé 0.19 0.24 0.40 5.20 4.14 4.30 São Tomé ECCAS 10.42 11.73 10.96 … … … CEEAC
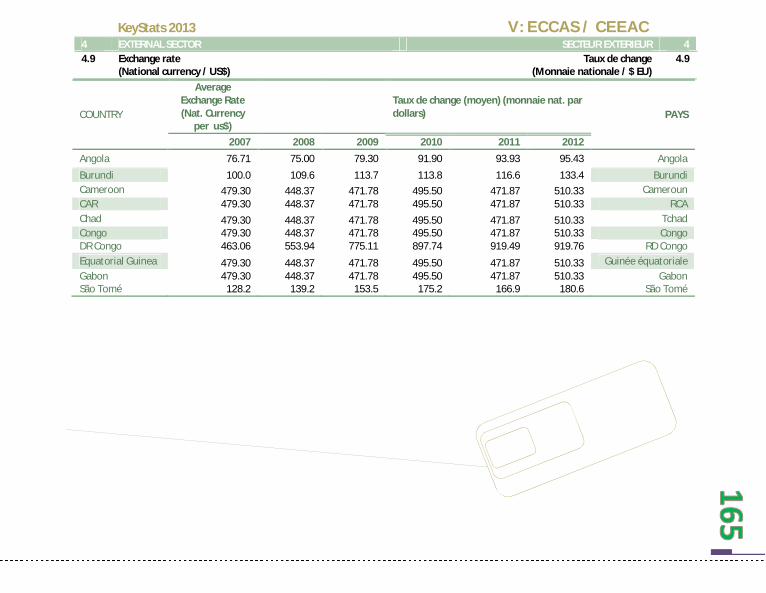
KeyStats 2013 V: ECCAS / CEEAC
4 EXTERNAL SECTOR SECTEUR EXTERIEUR 4 4.9 Exchange rate
(National currency / US$) Taux de change
(Monnaie nationale / $ EU) 4.9
COUNTRY
Average Exchange Rate (Nat. Currency
per us$)
Taux de change (moyen) (monnaie nat. par dollars) PAYS
2007 2008 2009 2010 2011 2012 Angola 76.71 75.00 79.30 91.90 93.93 95.43 Angola Burundi 100.0 109.6 113.7 113.8 116.6 133.4 Burundi Cameroon 479.30 448.37 471.78 495.50 471.87 510.33 Cameroun CAR 479.30 448.37 471.78 495.50 471.87 510.33 RCA Chad 479.30 448.37 471.78 495.50 471.87 510.33 Tchad Congo 479.30 448.37 471.78 495.50 471.87 510.33 Congo DR Congo 463.06 553.94 775.11 897.74 919.49 919.76 RD Congo Equatorial Guinea 479.30 448.37 471.78 495.50 471.87 510.33 Guinée équatoriale Gabon 479.30 448.37 471.78 495.50 471.87 510.33 Gabon São Tomé 128.2 139.2 153.5 175.2 166.9 180.6 São Tomé

KeyStats 2013 V: ECCAS / CEEAC
4 EXTERNAL SECTOR SECTEUR EXTERIEUR 4 4.10 Total public external debt
(in percentage of GDP) Dette publique extérieure totale
(en pourcentage du PIB) 4.10
COUNTRY 2007 2008 2009 2010 2011 2012 PAYS Angola 0.2 0.2 0.2 0.2 20.3 18.8 Angola Burundi 6.1 5.5 4.2 3.3 15.2 16.1 Burundi Cameroon 48.4 40.0 41.9 47.6 7.0 8.1 Cameroun CAR 0.6 0.5 0.2 0.2 14.9 16.5 RCA Chad 214.4 163.5 189.3 200.5 19.5 22.0 Tchad Congo 887.0 555.5 537.2 205.0 18.8 23.1 Congo DR Congo 0.7 0.6 1.2 … 28.8 0.0 RD Congo Equatorial Guinea 0.0 0.0 0.1 0.1 7.4 9.5 Guinée équatoriale
Gabon 353.4 157.3 188.8 164.9 16.1 16.0 Gabon São Tomé 0.9 0.6 0.6 0.7 63.3 0.0 São Tomé ECCAS 151.2 92.4 96.4 69.2 21.1 13.0 CEEAC

KeyStats 2013 V: ECCAS / CEEAC
4 EXTERNAL SECTOR SECTEUR EXTERIEUR 4 4.11 Debt service
(in percentage of exports) Service de la dette
(en pourcentage des exportations) 4.11
COUNTRY 2007 2008 2009 2010 2011 2012 PAYS Angola 9.84 2.54 8.55 4.49 5.60 7.70 Angola Burundi 19.40 11.88 16.58 2.40 7.10 Burundi Cameroon 8.02 6.42 7.11 3.62 2.10 2.70 Cameroun CAR … … … … 4.20 9.70 RCA Chad … … … … 1.90 2.10 Tchad Congo 1.74 … … … 1.10 1.50 Congo
DR Congo 7.56 7.67 12.34 3.76 5.20 7.50 RD Congo Equatorial Guinea … … … … 0.30 1.70 Guinée équatoriale
Gabon … … … … 3.30 5.30 Gabon São Tomé 31.75 11.96 9.74 6.54 10.20 11.10 São Tomé ECCAS 13.05 8.10 10.86 4.60 3.63 5.64 CEEAC

KeyStats 2013 V: ECCAS / CEEAC
4 EXTERNAL SECTOR SECTEUR EXTERIEUR 4 4.12 Tariffs and imports by product groups in % (in 2012) Tarifs et importations par groupe des produits en %
(en 2012) 4.12
COUNTRY Animal products
Dairy products
Fruit, vegetables, plants
Coffee, tea Cereals & preparations PAYS
Angola 11.1 6.0 11.7 16.5 7.8 Angola Burundi 23.3 43.3 22.1 19.6 22.4 Burundi Cameroon 21.6 25.0 26.2 29.9 20.9 Cameroun CAR 20.0 20.0 26.8 29.9 19.6 RCA Chad 20.0 20.0 26.8 29.9 19.6 Tchad Congo 20.0 20.0 26.8 29.9 19.6 Congo DR Congo … … … … … RD Congo Equatorial Guinea 20.0 20.0 26.8 29.9 19.6 Guinée équatoriale Gabon 20.0 20.0 26.8 29.9 19.6 Gabon São Tomé São Tomé ECCAS 19.5 21.8 24.3 26.9 18.6 CEEAC
COUNTRY Oilseeds, fats & oils
Sugars and confectionery
Beverages & tobacco Cotton
Other agricultural products
PAYS
Angola 4.5 4.6 22.4 2.0 6.8 Angola Burundi 11.3 29.8 25.3 0.0 10.9 Burundi Cameroon 19.9 20.0 27.2 10.0 17.1 Cameroun CAR 20.2 20.0 27.2 10.0 15.9 RCA Chad 20.2 20.0 27.2 10.0 15.9 Tchad Congo 20.2 20.0 27.2 10.0 15.9 Congo DR Congo … … … … … RD Congo Equatorial Guinea 20.2 20.0 27.2 10.0 15.9 Guinée équatoriale Gabon 20.2 20.0 27.2 10.0 15.9 Gabon São Tomé … … … … … São Tomé ECCAS 17.1 19.3 26.4 7.8 14.3 CEEAC

KeyStats 2013 V: ECCAS / CEEAC
COUNTRY Fish & fish products Minerals & metals Petroleum Chemicals PAYS
Angola 18.5 7.5 19.4 5.2 Angola Burundi 24.7 10.6 4.3 4.0 Burundi Cameroon 12.0 16.5 10.0 11.8 Cameroun CAR 24.4 17.0 10.0 11.5 RCA Chad 24.4 17.0 10.0 11.5 Tchad Congo 24.4 17.0 10.0 11.5 Congo DR Congo … … … … RD Congo Equatorial Guinea 24.4 17.0 10.0 11.5 Guinée équatoriale Gabon 24.4 17.0 10.0 11.5 Gabon São Tomé … … … … São Tomé ECCAS 22.2 15.0 10.5 9.8 CEEAC
COUNTRY Wood, paper, etc. Textiles Clothing Leather, footwear, etc.
PAYS
Angola 11.5 6.1 15.0 9.6 Angola Burundi 16.0 19.6 25.2 12.7 Burundi Cameroon 20.2 20.4 30.0 21.3 Cameroun CAR 19.4 19.7 30.0 20.5 RCA Chad 19.4 19.7 30.0 20.5 Tchad Congo 19.4 19.7 30.0 20.5 Congo DR Congo … … … … RD Congo Equatorial Guinea 19.4 19.7 30.0 20.5 Guinée équatoriale Gabon 19.4 19.7 30.0 20.5 Gabon São Tomé … … … … São Tomé ECCAS 18.1 18.1 27.5 18.3 CEEAC

KeyStats 2013 V: ECCAS / CEEAC
COUNTRY Non-electrical machinery Electrical machinery Transport
equipment Manufactures, n.e.s. PAYS
Angola 2.5 3.6 3.4 7.1 Angola Burundi 3.2 10.8 6.2 14.8 Burundi Cameroon 12.2 17.0 15.7 22.0 Cameroun CAR 12.3 16.8 15.6 21.9 RCA Chad 12.3 16.8 15.6 21.9 Tchad Congo 12.3 16.8 15.6 21.9 Congo DR Congo … … … … RD Congo Equatorial Guinea 12.3 16.8 15.6 21.9 Guinée équatoriale Gabon 12.3 16.8 15.6 21.9 Gabon São Tomé … … … … São Tomé ECCAS 9.9 14.4 12.9 19.2 CEEAC

KeyStats 2013 V: ECCAS / CEEAC
4 EXTERNAL SECTOR SECTEUR EXTERIEUR 4 4.13 Intra- and inter-regional trade
(in millions of US$) Commerce intra- et inter-régional
(en millions de $E.U.) 4.13
Exports to 2007 2008 2009 2010 2011 2012 Exportations vers Africa 1,380 3,121 7,060 15,967 36,115 81,684 Afrique AMU 96 213 481 1,088 2,460 5,535 UMA CEN-SAD 503 1,138 2,573 5,820 13,164 29,773 CEN-SAD COMESA 155 351 793 1,793 4,056 9,175 COMESA EAC 34 77 174 393 890 2,013 CAE ECCAS 334 755 1,709 3,865 8,741 19,770 CEEAC ECOWAS 287 649 1,468 3,321 7,511 16,988 CEDEAO IGAD 15 34 77 174 393 888 IGAD SADC 702 1,588 3,591 8,123 18,372 41,554 SADC
Imports from 2007 2008 2009 2010 2011 2012 Importations de Africa 3683 9,818 26,172 69,766 185,976 495,760 Afrique AMU 177 472 1,258 3,353 8,938 23,826 UMA CEN-SAD 1434 3,823 10,190 27,164 72,411 193,028 CEN-SAD COMESA 830 2,213 5,898 15,722 41,912 111,724 COMESA EAC 474 1,264 3,368 8,979 23,935 63,804 CAE ECCAS 369 984 2,622 6,990 18,633 49,670 CEEAC ECOWAS 912 2,431 6,481 17,276 46,052 122,762 CEDEAO IGAD 403 1,074 2,864 7,634 20,350 54,247 IGAD SADC 1821 4854 12940 34495 91953 245,121 SADC

VI ECOWAS / CEDEAO
The Economic Community of West African States (ECOWAS) was
created in May 1975, assembling 15 West African countries. With the final
goal of creating an economic union, ECOWAS’s objective is to enhance
economic stability as well as relations among its Member States.
La Communauté économique des Etats de l’Afrique de l’Ouest (CEDEAO)
fut créée en mai 1975, et comprend 15 pays d’Afrique de l’Ouest. Avec le but final de créer une union économique,
l’objectif de la CEDEAO est d’améliorer la stabilité économique
ainsi que les relations entre ses Etats Membres.

KeyStats 2013 VI: ECOWAS / CEDEAO
0 POPULATION POPULATION 0 0.1 Total population
(in millions) Population totale
(en millions) 0.1
COUNTRY 2007 2008 2009 2010 2011 2012 PAYS Benin 8.0 8.2 8.5 8.8 9.1 9.4 Bénin Burkina Faso 14.3 14.7 15.2 15.7 16.2 16.8 Burkina Faso Cape Verde 0.5 0.5 0.5 0.5 0.5 0.5 Cape Vert Côte d’Ivoire 18.6 19.0 19.4 19.7 20.2 23.2 Côte d’Ivoire
Gambia, The 1.6 1.6 1.7 1.7 1.8 1.9 Gambie
Ghana 22.7 23.3 23.8 24.4 25.0 25.0 Ghana
Guinea 9.6 9.9 10.2 10.5 10.9 11.1 Guinée Guinea Bissau 1.4 1.5 1.5 1.5 1.5 1.6 Guinée Bissau Liberia 3.5 3.5 3.6 3.7 3.8 3.8 Libéria Mali 14.0 14.5 14.9 15.4 15.8 16.1 Mali Niger 13.7 14.2 14.7 15.2 15.7 16.3 Niger Nigeria 147.0 150.7 154.5 158.4 162.5 168.8 Nigéria Senegal 11.5 11.8 12.2 12.5 12.9 13.2 Sénégal Sierra Leone 5.5 5.6 5.7 5.9 6.0 6.0 Sierra Leone Togo 5.7 5.8 5.9 6.0 6.2 6.1 Togo ECOWAS 277.5 284.7 292.3 300.0 307.9 319.8 CEDEAO

KeyStats 2013 VI: ECOWAS / CEDEAO
0 POPULATION POPULATION 0 0.2 Population structure
(in percentage of total population) Structure de la population
(en pourcentage de la population totale) 0.2
COUNTRY Female / Femmes Urban / Urbaine
PAYS 2010 2011 2012 2010 2011 2012
Benin 51.0 51.0 50.9 44.1 44.9 54.3 Bénin Burkina Faso 51.8 51.8 51.8 24.0 24.7 74.6 Burkina Faso Cape Verde 50.5 50.4 50.5 61.1 61.8 38.3 Cape Vert Côte d’Ivoire 49.0 49.1 49.0 50.6 51.3 57.5 Côte d’Ivoire Gambia, The 50.6 50.6 50.6 58.1 58.9 26.2 Gambie Ghana 49.1 49.1 50.4 51.5 52.2 46.6 Ghana Guinea 51.0 51.0 51.5 35.4 35.9 59.7 Guinée Guinea Bissau 50.4 50.4 51.5 30.0 30.2 59.7 Guinée Bissau Liberia 49.6 49.6 50.0 47.8 48.2 51.2 Libéria Mali 50.0 50.0 50.4 35.9 36.6 77.5 Mali Niger 50.1 50.1 50.0 20.4 21.0 78.4 Niger Nigeria 49.4 49.4 49.2 49.8 50.5 62.3 Nigéria Senegal 50.5 50.5 50.6 42.2 42.3 52.4 Sénégal Sierra Leone 51.2 51.1 50.9 38.4 38.8 58.8 Sierra Leone Togo 50.5 50.5 50.7 43.4 44.1 54.8 Togo ECOWAS 50.3 50.3 50.5 42.2 42.8 56.8 CEDEAO

KeyStats 2013 VI: ECOWAS / CEDEAO
0 POPULATION POPULATION 0 0.2 Population structure (cont’d)
(in percentage of total population) Structure de la population (suite)
(en pourcentage de la population totale) 0.2
COUNTRY Eco. active population / Population éco. Active
(Thousands)
Economically active female / male ratio
PAYS Ratio femmes / Hommes économiquement. actifs
2010 2011 2012 2010 2011 2012 Benin 3,979 4,179 4,383 51.2 51.1 51.0 Bénin Burkina Faso 7,696 7,953 8,223 54.5 54.5 54.6 Burkina Faso Cape Verde 111 112 112 44.0 44.0 44.0 Cape Vert Côte d’Ivoire 9,672 10,085 10,358 34.9 34.9 34.9 Côte d’Ivoire Gambia, The 626 650 675 48.2 48.7 49.1 Gambie Ghana 10,502 10,738 10,983 49.7 49.7 49.7 Ghana Guinea 606 620 635 58.3 58.3 58.3 Guinée Guinea Bissau 606 620 635 58.3 58.3 58.3 Guinée Bissau Liberia 1 375 1 426 456 33.7 38.5 62.0 Libéria Mali 8,712 10,816 13,427 57.4 60.0 62.4 Mali Niger 5,509 5,727 5,962 32.4 32.4 32.4 Niger Nigeria 86,418 86,430 89,023 50.2 50.2 50.2 Nigéria Senegal 6,881 7,102 7,319 51.5 51.4 51.4 Sénégal Sierra Leone 3,175 3,267 3,362 51.1 51.0 50.8 Sierra Leone Togo 3,996 3,991 4,075 50.5 50.5 51.0 Togo ECOWAS 149,865 153,716 159,626 48.4 48.9 50.7 CEDEAO
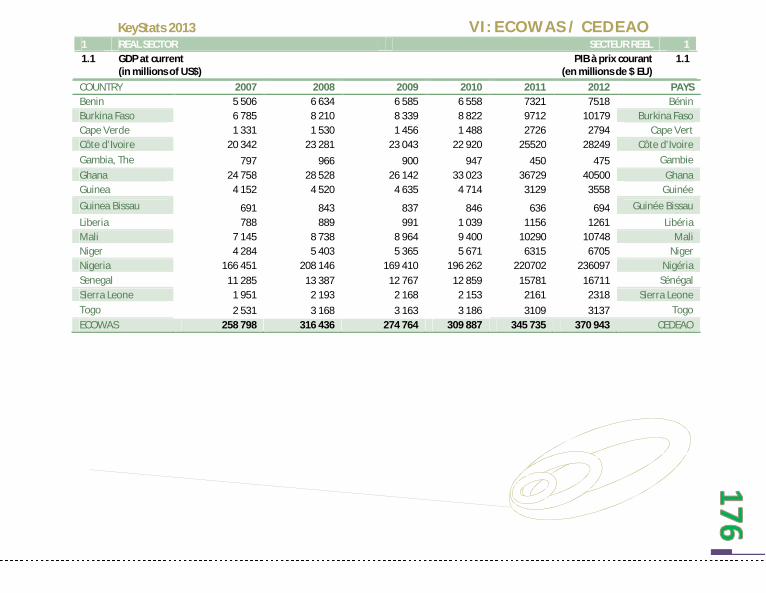
KeyStats 2013 VI: ECOWAS / CEDEAO
1 REAL SECTOR SECTEUR REEL 1 1.1 GDP at current
(in millions of US$) PIB à prix courant
(en millions de $ EU) 1.1
COUNTRY 2007 2008 2009 2010 2011 2012 PAYS Benin 5 506 6 634 6 585 6 558 7321 7518 Bénin Burkina Faso 6 785 8 210 8 339 8 822 9712 10179 Burkina Faso Cape Verde 1 331 1 530 1 456 1 488 2726 2794 Cape Vert Côte d’Ivoire 20 342 23 281 23 043 22 920 25520 28249 Côte d’Ivoire Gambia, The 797 966 900 947 450 475 Gambie Ghana 24 758 28 528 26 142 33 023 36729 40500 Ghana Guinea 4 152 4 520 4 635 4 714 3129 3558 Guinée Guinea Bissau 691 843 837 846 636 694 Guinée Bissau Liberia 788 889 991 1 039 1156 1261 Libéria Mali 7 145 8 738 8 964 9 400 10290 10748 Mali Niger 4 284 5 403 5 365 5 671 6315 6705 Niger Nigeria 166 451 208 146 169 410 196 262 220702 236097 Nigéria Senegal 11 285 13 387 12 767 12 859 15781 16711 Sénégal Sierra Leone 1 951 2 193 2 168 2 153 2161 2318 Sierra Leone Togo 2 531 3 168 3 163 3 186 3109 3137 Togo ECOWAS 258 798 316 436 274 764 309 887 345 735 370 943 CEDEAO

KeyStats 2013 VI: ECOWAS / CEDEAO
1 REAL SECTOR SECTEUR REEL 1 1.2 Structure of GDP
(in percentage) Structure du PIB
(en pourcentage) 1.2
COUNTRY Agriculture / Agriculture
Industry / Manufacture / Manufacture
Services etc. / Services etc. PAYS Industrie
2004 2011 2004 2011 2004 2011 2004 2011 Benin 35.9 36.9 14.8 14.7 8.7 8.5 49.2 48.3 Bénin Burkina Faso 34.5 33.7 21.2 25.4 14.4 4.5 44.3 40.8 Burkina Faso Cape Verde 11.0 9.2 16.7 20.8 4.1 6.2 72.3 70.1 Cape Vert Côte d’Ivoire 25.3 32.1 25.2 25.3 14.6 13.1 49.5 42.6 Côte d’Ivoire Gambia, The 29.6 23.7 15.0 15.5 6.2 6.1 55.4 60.8 Gambie Ghana 41.5 25.6 27.1 25.9 9.6 6.7 31.4 48.5 Ghana Guinea 25.1 20.6 32.8 42.7 6.1 7.4 42.2 36.7 Guinée Guinea Bissau 43.4 47.8 16.1 13.0 13.9 11.3 40.5 39.2 Guinée Bissau Liberia 74.7 73.3 9.3 11.8 5.1 6.0 16.0 14.9 Libéria Mali 38.0 39.2 24.0 22.2 10.4 6.4 38.0 38.6 Mali Niger 43.9 43.1 13.0 16.0 6.7 5.5 43.2 40.9 Niger Nigeria 34.2 31.0 42.1 44.3 3.1 1.9 23.7 24.7 Nigéria Senegal 15.9 14.8 24.9 25.0 16.3 14.8 59.2 60.2 Sénégal Sierra Leone 51.8 57.6 12.6 8.4 2.8 2.4 35.6 33.9 Sierra Leone Togo 39.7 47.0 18.8 18.4 9.0 8.3 41.5 34.6 Togo ECOWAS 36.3 35.7 20.9 22.0 8.7 7.3 42.8 42.3 CEDEAO

KeyStats 2013 VI: ECOWAS / CEDEAO
1 REAL SECTOR SECTEUR REEL 1 1.3 Real GDP Growth
(in percentage) Croissance réelle du PIB
(en pourcentage) 1.3
COUNTRY 2007 2008 2009 2010 2011 2012 PAYS Benin 4.63 5.02 2.67 2.55 5.05 5.42 Bénin Burkina Faso 3.55 5.17 3.20 7.94 6.18 7.60 Burkina Faso Cape Verde 8.65 6.10 4.00 5.60 5.59 6.11 Cape Vert Côte d’Ivoire 1.77 2.30 3.81 2.41 0.12 5.30 Côte d’Ivoire Gambia, The 3.96 6.45 6.68 5.51 6.00 6.90 Gambie Ghana 6.47 8.43 3.99 7.71 13.64 8.31 Ghana Guinea 1.76 4.94 -0.28 1.94 4.60 5.50 Guinée Guinea Bissau 3.20 3.22 3.00 3.50 4.43 6.03 Guinée Bissau Liberia 8.60 8.05 7.76 7.26 7.30 8.90 Libéria Mali 4.30 4.98 4.46 5.81 4.17 4.38 Mali Niger 3.15 9.59 -0.71 8.22 4.32 5.55 Niger Nigeria 6.45 5.98 6.98 7.88 6.90 6.70 Nigéria Senegal 4.95 3.68 2.06 4.13 5.77 5.51 Sénégal Sierra Leone 5.96 4.00 3.16 4.90 7.10 7.00 Sierra Leone Togo 2.08 2.36 3.35 3.70 2.08 2.76 Togo ECOWAS 4.63 5.35 3.61 5.27 5.55 6.13 CEDEAO

KeyStats 2013 VI: ECOWAS / CEDEAO
1 REAL SECTOR SECTEUR REEL 1 1.4 Per capita GDP and GNI
(in US$) PIB et RNB par habitant
(en $ EU) 1.4
COUNTRY Current prices / Prix courant PPP / PPA GNI / RNB
PAYS 2010 2011 2012 2010 2011 2012 2010 2011 2012
Benin 747 815 814 1 576 1 620 1570 780 780 … Bénin Burkina Faso 562 598 607 1 261 1 302 1510 550 570 … Burkina Faso Cape Verde 2 999 5 381 5 354 3 730 3 947 4340 3280 3540 … Cape Vert Côte d’Ivoire 1 161 1 129 1 217 1 683 1 590 1960 1170 1100 … Côte d’Ivoire Gambia, The 548 251 257 1 893 1 943 1860 610 610 … Gambie Ghana 1 354 1 500 1 618 2 733 3 113 1940 1250 1410 … Ghana Guinea 447 290 321 1 049 1 086 980 390 440 … Guinée Guinea Bissau 558 398 425 1 087 1 144 1190 580 600 … Guinée Bissau Liberia 281 310 332 583 627 … 210 240 … Libéria Mali 612 661 667 1 109 1 128 1160 600 610 … Mali
Niger 373 401 412 761 771 650 360 360 … Niger Nigeria 1 239 1 347 1 399 2 420 2 582 2420 1170 1200 … Nigéria Senegal 1 028 1 226 1 263 1 930 1 970 1920 1080 1070 … Sénégal Sierra Leone 367 367 384 1 073 1 132 1360 340 340 … Sierra Leone Togo 529 517 511 1 000 1 048 920 550 560 … Togo ECOWAS 12 804 15 192 15 580 23 888 25 006 23 780 12 920 13 430 … CEDEAO

KeyStats 2013 VI: ECOWAS / CEDEAO
1 REAL SECTOR SECTEUR REEL 1 1.5a Inflation
(in percentage) Inflation
(en pourcentage) 1.5a
COUNTRY 2007 2008 2009 2010 2011 2012 PAYS Benin 1.3 7.9 2.2 1.5 2.8 6.1 Bénin Burkina Faso -0.3 10.7 2.5 -0.8 2.8 3.8 Burkina Faso Cape Verde 4.4 6.8 1.0 2.0 4.5 2.5 Cape Vert Côte d’Ivoire 1.9 6.3 1.0 0.9 4.8 1.4 Côte d’Ivoire Gambia, The 5.4 4.4 4.6 5.1 4.8 9.1 Gambie Ghana 10.7 16.5 19.3 10.8 8.7 9.2 Ghana Guinea 18.7 6.4 3.7 6.8 10.3 15.2 Guinée Guinea Bissau 4.6 10.4 -1.6 -0.2 3.5 … Guinée Bissau Liberia 11.4 17.5 7.4 7.5 8.5 … Libéria Mali 1.4 9.2 2.2 1.2 3.3 5.3 Mali Niger 0.4 11.3 4.3 -0.3 4.9 0.6 Niger Nigeria 6.6 11.6 12.5 13.7 10.8 12.2 Nigéria Senegal 4.9 7.4 -2.3 1.3 3.4 1.4 Sénégal Sierra Leone 11.6 14.8 9.3 17.8 18.5 12.4 Sierra Leone Togo 0.9 8.7 2.9 1.4 3.7 2.6 Togo ECOWAS … … … … … … CEDEAO
CPI national

KeyStats 2013 VI: ECOWAS / CEDEAO
1 REAL SECTOR SECTEUR REEL 1 1.5b Inflation
(in percentage) Inflation
(en pourcentage) 1.5b
COUNTRY 2007 2008 2009 2010 2011 2012 PAYS Benin … … … … … … Bénin Burkina Faso … … … … … … Burkina Faso Cape Verde … … … … … … Cape Vert Côte d’Ivoire … … … … … … Côte d’Ivoire Gambia, The … … … … … … Gambie Ghana … … … … … … Ghana Guinea … … … … … … Guinée
Guinea Bissau … … … … … … Guinée Bissau
Liberia … … … … … … Libéria Mali … … … … … … Mali Niger … … … … … … Niger Nigeria … … … … … … Nigéria Senegal … … … … … … Sénégal Sierra Leone … … … … … … Sierra Leone Togo … … … … … … Togo ECOWAS … … … … … … CEDEAO

KeyStats 2013 VI: ECOWAS / CEDEAO
2 GOVERNMENT FINANCE FINANCES PUBLIQUES 2 2.1 Total revenue plus grants
(in percentage of GDP) Recettes totales plus dons
(en pourcentage du PIB) 2.1
COUNTRY 2005 2008 2009 2010 2011 2012 PAYS Benin … … … … … … Bénin Burkina Faso … … … … … … Burkina Faso Cape Verde … … … … … … Cape Vert Côte d’Ivoire … … … … … … Côte d’Ivoire Gambia, The … … … … … … Gambie Ghana … … … … … … Ghana Guinea … … … … … … Guinée Guinea Bissau … … … … … … Guinée Bissau Liberia … … … … … … Libéria Mali … … … … … … Mali Niger … … … … … … Niger Nigeria … … … … … … Nigéria Senegal … … … … … … Sénégal Sierra Leone … … … … … … Sierra Leone Togo … … … … … … Togo ECOWAS … … … … … … CEDEAO

KeyStats 2013 VI: ECOWAS / CEDEAO
2 GOVERNMENT FINANCE FINANCES PUBLIQUES 2 2.1 Total revenue
(in percentage of GDP) Recettes totales
(en pourcentage du PIB) 2.1
COUNTRY 2005 2008 2009 2010 2011 2012 PAYS Benin 18.9 21.3 21.0 19.2 9.5 10.9 Bénin Burkina Faso 17.3 17.2 19.6 20.1 20.8 11.7 Burkina Faso Cape Verde 30.9 29.9 31.6 31.2 … 1.4 Cape Vert Côte d’Ivoire 18.1 20.3 24.4 32.9 28.8 8.5 Côte d’Ivoire Gambia, The 15.7 22.8 20.6 18.8 … 1.4 Gambie Ghana 29.1 28.4 18.5 19.1 20.8 0.1 Ghana Guinea 15.2 16.2 15.8 15.8 19.1 247.3 Guinée Guinea Bissau 14.2 … 24.7 20.2 … 15.3 Guinée Bissau Liberia 14.8 36.2 23.7 27.7 33.7 0.0 Libéria Mali 19.9 18.9 21.7 20.2 22.6 10.8 Mali Niger 18.2 29.9 18.7 18.4 21.7 13.0 Niger Nigeria 38.1 33.8 19.2 23.5 … 5.4 Nigéria Senegal 20.8 21.8 20.4 21.9 22.8 10.3 Sénégal Sierra Leone 23.1 15.9 17.0 18.1 … 97.3 Sierra Leone Togo 16.9 17.5 21.2 22.8 22.7 13.1 Togo ECOWAS 20.8 23.6 21.2 22.0 22.3 29.8 CEDEAO

KeyStats 2013 VI: ECOWAS / CEDEAO
2 GOVERNMENT FINANCE FINANCES PUBLIQUES 2 2.2 Total expenditure
(in percentage of GDP) Dépenses totales
(en pourcentage du PIB) 2.2
COUNTRY 2005 2008 2009 2010 2011 2012 PAYS Benin 21.3 23.0 25.9 21.6 21.9 21.9 Bénin Burkina Faso 22.3 21.6 24.4 24.6 24.2 23.6 Burkina Faso Cape Verde 35.0 31.1 38.5 43.1 38.6 39.5 Cape Vert Côte d’Ivoire 19.0 19.7 28.6 30.5 35.8 38.6 Côte d’Ivoire Gambia, The 22.1 26.0 23.3 22.8 25.7 25.9 Gambie Ghana 30.7 42.4 22.8 24.9 24.0 30.1 Ghana Guinea 16.0 17.4 23.7 29.8 26.7 28.1 Guinée Guinea Bissau 17.2 … 21.8 20.4 20.2 21.0 Guinée Bissau Liberia 14.1 36.5 25.1 27.2 34.5 32.0 Libéria Mali 24.6 21.5 25.9 22.9 27.6 22.6 Mali Niger 20.2 23.8 24.1 20.8 25.2 24.1 Niger Nigeria 13.0 30.0 22.4 29.3 27.5 25.4 Nigéria Senegal 24.0 26.6 26.7 27.1 29.7 30.1 Sénégal Sierra Leone 23.6 21.0 19.8 24.2 21.7 18.8 Sierra Leone Togo 19.7 17.7 21.8 22.5 25.4 25.3 Togo ECOWAS 21.5 25.6 25.0 26.1 27.2 27.1 CEDEAO

KeyStats 2013 VI: ECOWAS / CEDEAO
2 GOVERNMENT FINANCE FINANCES PUBLIQUES 2 2.3 Fiscal balance
(Surplus+ / Deficit-) (in percentage of GDP)
Solde budgétaire (Excédent+ / Déficit-)
(en pourcentage du PIB)
2.2
COUNTRY 2005 2008 2009 2010 2011 2012 PAYS Benin -2.36 -1.72 -4.89 -2.46 -1.80 -1.50 Bénin Burkina Faso -5.02 -4.40 -4.78 -4.50 -3.44 -0.50 Burkina Faso Cape Verde -4.10 -1.13 -6.88 -11.84 -10.20 -13.80 Cape Vert Côte d’Ivoire -3.07 0.56 -4.20 2.36 -6.98 -6.20 Côte d’Ivoire Gambia, The -6.34 -3.19 -2.69 -4.01 -4.60 -6.00 Gambie Ghana -1.60 -14.01 -4.29 -5.89 -3.22 -5.50 Ghana Guinea -0.87 -1.20 -7.90 -13.99 -7.61 -1.40 Guinée Guinea Bissau -2.92 … 2.83 -0.24 0.70 -2.30 Guinée Bissau Liberia 0.76 -0.36 -1.41 0.57 -0.72 -4.70 Libéria Mali -4.71 -2.60 -4.23 -2.67 -4.98 -6.40 Mali Niger -1.99 6.03 -5.34 -2.43 -3.50 -2.80 Niger Nigeria 25.11 3.79 -3.21 -5.78 -0.10 3.70 Nigéria Senegal -3.15 -4.83 -6.28 -5.22 -6.93 -7.00 Sénégal Sierra Leone -0.52 -5.10 -2.75 -6.11 -4.50 -1.80 Sierra Leone Togo -2.86 -0.23 -0.61 0.30 -2.69 -3.10 Togo ECOWAS -0.91 -2.03 -3.77 -4.13 -4.04 -3.95 CEDEAO
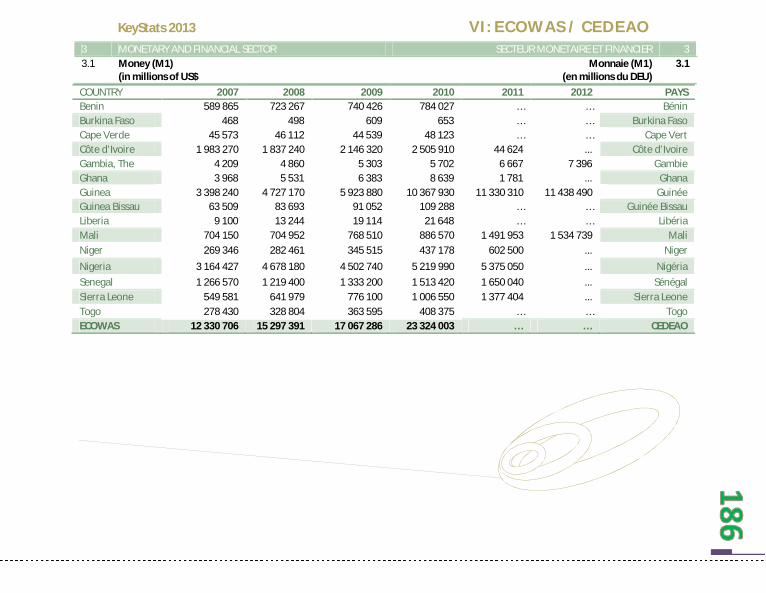
KeyStats 2013 VI: ECOWAS / CEDEAO
3 MONETARY AND FINANCIAL SECTOR SECTEUR MONETAIRE ET FINANCIER 3 3.1 Money (M1)
(in millions of US$ Monnaie (M1)
(en millions du DEU) 3.1
COUNTRY 2007 2008 2009 2010 2011 2012 PAYS Benin 589 865 723 267 740 426 784 027 … … Bénin Burkina Faso 468 498 609 653 … … Burkina Faso Cape Verde 45 573 46 112 44 539 48 123 … … Cape Vert Côte d’Ivoire 1 983 270 1 837 240 2 146 320 2 505 910 44 624 ... Côte d’Ivoire Gambia, The 4 209 4 860 5 303 5 702 6 667 7 396 Gambie Ghana 3 968 5 531 6 383 8 639 1 781 ... Ghana Guinea 3 398 240 4 727 170 5 923 880 10 367 930 11 330 310 11 438 490 Guinée Guinea Bissau 63 509 83 693 91 052 109 288 … … Guinée Bissau Liberia 9 100 13 244 19 114 21 648 … … Libéria Mali 704 150 704 952 768 510 886 570 1 491 953 1 534 739 Mali Niger 269 346 282 461 345 515 437 178 602 500 ... Niger Nigeria 3 164 427 4 678 180 4 502 740 5 219 990 5 375 050 ... Nigéria Senegal 1 266 570 1 219 400 1 333 200 1 513 420 1 650 040 ... Sénégal Sierra Leone 549 581 641 979 776 100 1 006 550 1 377 404 ... Sierra Leone Togo 278 430 328 804 363 595 408 375 … … Togo ECOWAS 12 330 706 15 297 391 17 067 286 23 324 003 … … CEDEAO

KeyStats 2013 VI: ECOWAS / CEDEAO
3 MONETARY AND FINANCIAL SECTOR SECTEUR MONETAIRE ET FINANCIER 3 3.2 Money plus quasi-money (M2)
(in % of GDP) Monnaie plus quasi-monnaie (M2)
(en % du PIB) 3.2
COUNTRY 2007 2008 2009 2010 2011 2012 PAYS Benin 32.94 37.04 38.23 39.19 40.01 37.92 Bénin Burkina Faso 23.58 22.93 26.59 27.42 28.98 31.18 Burkina Faso Cape Verde 88.22 86.58 82.87 80.36 76.98 75.79 Cape Vert Côte d’Ivoire 29.90 28.59 32.28 36.58 40.46 38.97 Côte d’Ivoire Gambia, The 41.16 45.09 46.24 49.05 54.95 53.01 Gambie Ghana 25.72 27.46 28.25 29.50 30.86 … Ghana Guinea 19.65 22.72 25.31 38.26 36.36 … Guinée Guinea Bissau 20.81 23.62 24.24 28.64 40.46 35.52 Guinée Bissau Liberia 26.22 31.87 29.79 34.39 38.21 29.37 Libéria Mali 28.87 25.54 27.05 27.54 29.53 32.55 Mali Niger 17.29 16.56 19.05 21.45 21.45 23.87 Niger Nigeria 28.03 36.35 40.68 32.48 33.58 36.06 Nigéria Senegal 36.31 33.47 37.06 39.90 39.78 40.07 Sénégal Sierra Leone 15.67 17.11 20.68 20.83 21.64 20.46 Sierra Leone Togo 37.17 37.56 41.29 45.63 47.65 46.45 Togo ECOWAS 31.44 32.83 34.64 36.75 38.73 38.56 CEDEAO

KeyStats 2013 VI: ECOWAS / CEDEAO
3 MONETARY AND FINANCIAL SECTOR SECTEUR MONETAIRE ET FINANCIER 3 3.3 Domestic credit
(in percentage of GDP) Crédit intérieur
(en pourcentage du PIB) 3.3
COUNTRY provided by banking sector / provenant du
secteur bancaire to private sector /
PAYS au secteur privé 2009 2010 2011 2009 2010 2011
Benin 19.27 18.28 21.72 22.5 23.3 24.55 Bénin Burkina Faso 14.80 16.43 17.62 17.0 17.6 19.38 Burkina Faso Cape Verde 78.06 76.37 80.58 62.0 62.1 64.49 Cape Vert Côte d’Ivoire 23.04 24.98 25.31 17.3 18.0 18.06 Côte d’Ivoire Gambia, The 28.57 35.32 43.83 13.5 13.9 16.33 Gambie Ghana 28.70 28.37 27.48 15.7 15.3 15.05 Ghana Guinea 21.16 37.30 32.22 3.9 5.7 9.13 Guinée Guinea Bissau 4.93 7.73 13.59 5.6 6.2 11.85 Guinée Bissau Liberia 144.28 37.31 34.63 16.0 19.4 16.44 Libéria Mali 10.70 12.26 16.83 17.5 18.0 20.87 Mali Niger 12.55 13.11 14.74 12.5 13.0 14.18 Niger Nigeria 36.89 35.70 37.46 38.6 29.0 21.09 Nigéria Senegal 26.65 29.01 31.13 24.7 25.9 28.65 Sénégal Sierra Leone 10.89 18.40 16.37 9.5 10.4 7.68 Sierra Leone Togo 27.33 31.63 34.78 19.8 22.8 29.10 Togo ECOWAS 32.52 28.15 29.89 19.74 20.05 21.12 CEDEAO

KeyStats 2013 VI: ECOWAS / CEDEAO
3 MONETARY AND FINANCIAL SECTOR SECTEUR MONETAIRE ET FINANCIER 3 3.4 Interest rates
(in percentage) Taux d’intérêts
(en pourcentage) 3.4
COUNTRY Deposit rate / Taux de dépôts Discount rate / Taux d’escompte
PAYS 2009 2010 2011 2009 2010 2011
Benin 3.50 3.50 3.50 … … … Bénin Burkina Faso 3.50 3.50 3.50 … … … Burkina Faso Cape Verde 2.88 3.11 3.35 8.09 7.93 Cape Vert Côte d’Ivoire 3.50 3.50 3.50 … … … Côte d’Ivoire Gambia, The 15.50 14.63 11.75 11.50 12.38 … Gambie Ghana 17.06 8.91 … … … Ghana Guinea … … … … … … Guinée Guinea Bissau 3.50 3.50 3.50 … … … Guinée Bissau
Liberia 4.11 3.54 3.03 10.08 … … Libéria
Mali 3.50 3.50 3.50 … … … Mali
Niger 3.50 3.50 3.50 … … … Niger
Nigeria 13.30 6.52 5.70 5.06 11.06 … Nigéria
Senegal 3.50 3.50 3.50 … … … Sénégal Sierra Leone 9.08 8.95 10.31 13.08 12.30 … Sierra Leone Togo 3.50 3.50 3.50 … … … Togo ECOWAS 6.42 4.98 5.08 … … … CEDEAO
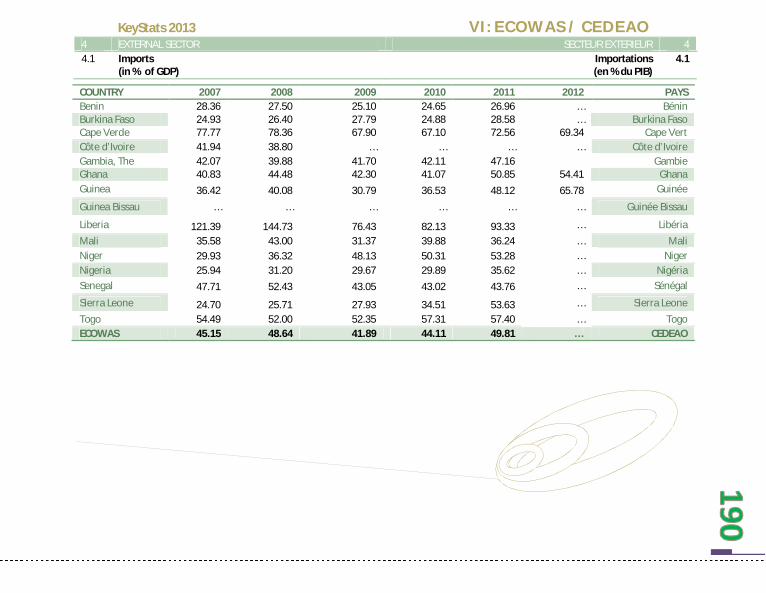
KeyStats 2013 VI: ECOWAS / CEDEAO
4 EXTERNAL SECTOR SECTEUR EXTERIEUR 4 4.1 Imports
(in % of GDP) Importations
(en % du PIB) 4.1
COUNTRY 2007 2008 2009 2010 2011 2012 PAYS Benin 28.36 27.50 25.10 24.65 26.96 … Bénin Burkina Faso 24.93 26.40 27.79 24.88 28.58 … Burkina Faso Cape Verde 77.77 78.36 67.90 67.10 72.56 69.34 Cape Vert Côte d’Ivoire 41.94 38.80 … … … … Côte d’Ivoire Gambia, The 42.07 39.88 41.70 42.11 47.16 Gambie Ghana 40.83 44.48 42.30 41.07 50.85 54.41 Ghana Guinea 36.42 40.08 30.79 36.53 48.12 65.78 Guinée
Guinea Bissau … … … … … … Guinée Bissau
Liberia 121.39 144.73 76.43 82.13 93.33 … Libéria Mali 35.58 43.00 31.37 39.88 36.24 … Mali Niger 29.93 36.32 48.13 50.31 53.28 … Niger Nigeria 25.94 31.20 29.67 29.89 35.62 … Nigéria Senegal 47.71 52.43 43.05 43.02 43.76 … Sénégal
Sierra Leone 24.70 25.71 27.93 34.51 53.63 … Sierra Leone Togo 54.49 52.00 52.35 57.31 57.40 … Togo ECOWAS 45.15 48.64 41.89 44.11 49.81 … CEDEAO
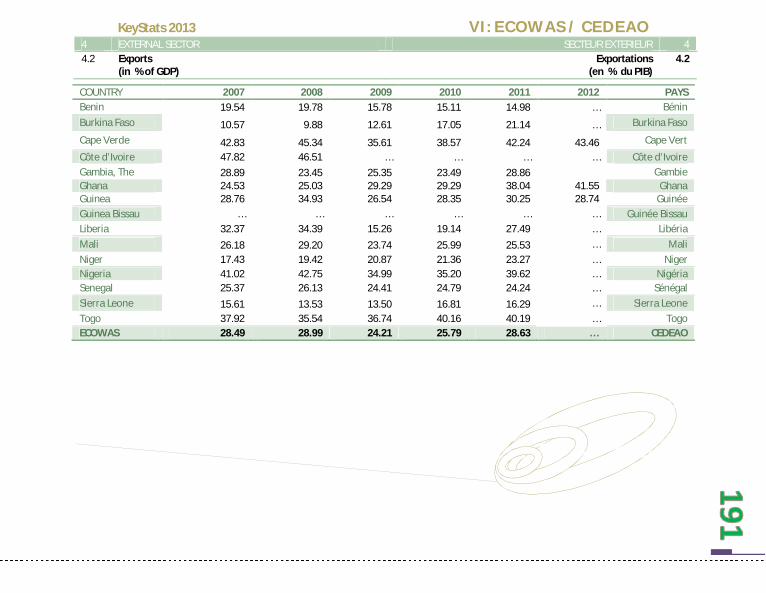
KeyStats 2013 VI: ECOWAS / CEDEAO
4 EXTERNAL SECTOR SECTEUR EXTERIEUR 4 4.2 Exports
(in % of GDP) Exportations
(en % du PIB) 4.2
COUNTRY 2007 2008 2009 2010 2011 2012 PAYS Benin 19.54 19.78 15.78 15.11 14.98 … Bénin Burkina Faso 10.57 9.88 12.61 17.05 21.14 … Burkina Faso
Cape Verde 42.83 45.34 35.61 38.57 42.24 43.46 Cape Vert
Côte d’Ivoire 47.82 46.51 … … … … Côte d’Ivoire Gambia, The 28.89 23.45 25.35 23.49 28.86 Gambie Ghana 24.53 25.03 29.29 29.29 38.04 41.55 Ghana Guinea 28.76 34.93 26.54 28.35 30.25 28.74 Guinée Guinea Bissau … … … … … … Guinée Bissau Liberia 32.37 34.39 15.26 19.14 27.49 … Libéria Mali 26.18 29.20 23.74 25.99 25.53 … Mali Niger 17.43 19.42 20.87 21.36 23.27 … Niger Nigeria 41.02 42.75 34.99 35.20 39.62 … Nigéria Senegal 25.37 26.13 24.41 24.79 24.24 … Sénégal Sierra Leone 15.61 13.53 13.50 16.81 16.29 … Sierra Leone Togo 37.92 35.54 36.74 40.16 40.19 … Togo ECOWAS 28.49 28.99 24.21 25.79 28.63 … CEDEAO

KeyStats 2013 VI: ECOWAS / CEDEAO
4 EXTERNAL SECTOR SECTEUR EXTERIEUR 4 4.3 Trade balance
(in % of GDP) Solde commercial
(en% du PIB) 4.3
COUNTRY 2007 2008 2009 2010 2011 2012 PAYS Benin -14.4 -13.7 -11.2 -12.2 -12.7 -12.1 Bénin Burkina Faso -8.8 -10.9 -5.8 -1.4 -0.6 -0.9 Burkina Faso Cape Verde -49.6 -46.5 -43.5 -47.5 -48.0 -48.5 Cape Vert Côte d’Ivoire 8.9 -1.1 -5.2 -4.4 -6.6 7.0 Côte d’Ivoire Gambia, The -20.8 -21.4 -20.9 -22.0 -21.5 -23.5 Gambie Ghana -15.7 -17.5 -8.5 -11.7 -8.9 -9.7 Ghana Guinea -0.3 -0.6 -0.2 2.5 2.5 -17.1 Guinée Guinea Bissau -41.1 -83.7 -94.9 -84.0 -102.7 -4.2 Guinée Bissau Liberia -39.3 -53.5 -46.6 -50.2 -50.9 -49.5 Libéria Mali -4.1 -7.8 -3.0 -0.9 -2.3 6.4 Mali Niger -5.9 -8.1 -11.8 -15.0 -16.2 -13.7 Niger Nigeria 23.0 22.7 17.5 22.3 26.9 18.0 Nigéria Senegal -22.0 -25.4 -15.9 -20.1 -22.9 -18.1 Sénégal Sierra Leone -5.7 -10.0 -10.0 -9.9 -12.1 -35.5 Sierra Leone Togo -16.2 -14.7 -13.1 -14.6 -15.3 -12.6 Togo ECOWAS -14.13 -19.48 -18.21 -17.95 -19.42 -14.27 CEDEAO

KeyStats 2013 VI: ECOWAS / CEDEAO
4 EXTERNAL SECTOR SECTEUR EXTERIEUR 4 4.4 Current account balance
(in millions of US$) Solde du compte courant
(en millions de $ EU) 4.4
COUNTRY 2007 2008 2009 2010 2011 2012 PAYS Benin - 449 - 455 - 586 -479 -729 -724 Bénin Burkina Faso -561 -964 -395 -209 -115 -494 Burkina Faso Cape Verde - 178 - 208 - 226 -207 -304 -211 Cape Vert Côte d’Ivoire -44 545 1699 567 3117 -448 Côte d’Ivoire Gambia, The -66 -118 -111 -154 -138 -156 Gambie Ghana -2158 -3400 -1397 -2770 -3541 -4921 Ghana Guinea - 199 - 119 - 387 -566 -1049 -1918 Guinée Guinea Bissau -23 -41 -56 -72 -11 -53 Guinée Bissau Liberia -213 -483 -333 -424 -525 -637 Libéria Mali - 527 - 902 - 591 -1190 -645 -353 Mali Niger - 319 - 594 -1 185 -1136 -1566 -1161 Niger Nigeria 25 886 25 181 15 248 13420 8761 17742 Nigéria Senegal -1 190 -1 599 - 771 -568 -1147 -1353 Sénégal Sierra Leone - 194 - 285 - 260 -491 -1531 -787 Sierra Leone Togo - 196 - 188 - 160 -212 -258 -290 Togo ECOWAS 19 570 16 371 10 489 5 509 319 4 236 CEDEAO

KeyStats 2013 VI: ECOWAS / CEDEAO
4 EXTERNAL SECTOR SECTEUR EXTERIEUR 4 4.5 Capital and financial account
(in millions of US$) Compte des capitaux et des opérations financières
(en millions de $ EU) 4.5
COUNTRY 2007 2008 2009 2010 2011 2012 PAYS Benin 176 108 161 153 … … Bénin Burkina Faso 292 190 281 … … … Burkina Faso Cape Verde 27 27 46 40 … … Cape Vert Côte d’Ivoire 95 92 222 … … … Côte d’Ivoire Gambia, The 2 1 … … … … Gambie Ghana 188 463 564 338 … … Ghana Guinea 107 35 40 47 … … Guinée Guinea Bissau 32 37 70 … … … Guinée Bissau Liberia … … … … … … Libéria Mali 323 352 411 251 … … Mali Niger 326 808 255 … … … Niger Nigeria … … … … … … Nigéria Senegal 467 238 303 … … … Sénégal Sierra Leone 634 66 74 62 … … Sierra Leone Togo 73 656 135 … … … Togo ECOWAS 2,742 3,073 2,562 … … … CEDEAO
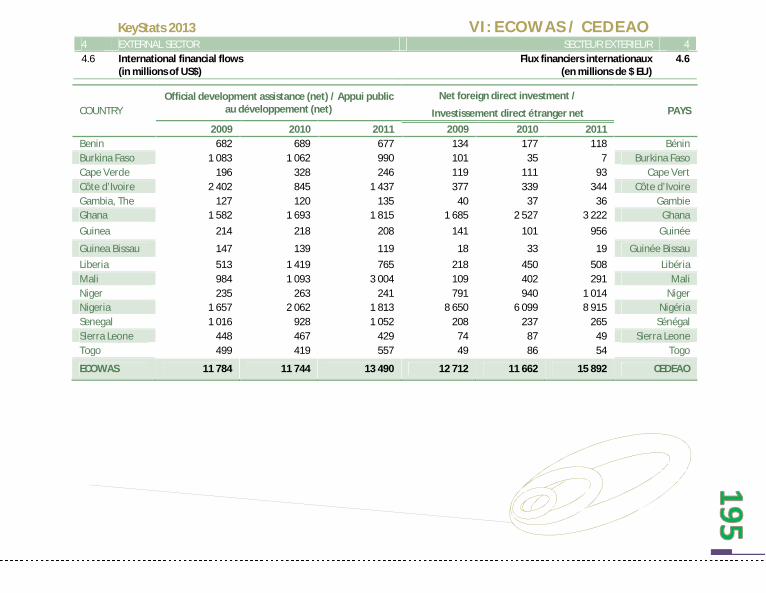
KeyStats 2013 VI: ECOWAS / CEDEAO
4 EXTERNAL SECTOR SECTEUR EXTERIEUR 4 4.6 International financial flows
(in millions of US$) Flux financiers internationaux
(en millions de $ EU) 4.6
COUNTRY Official development assistance (net) / Appui public
au développement (net) Net foreign direct investment /
PAYS Investissement direct étranger net 2009 2010 2011 2009 2010 2011
Benin 682 689 677 134 177 118 Bénin Burkina Faso 1 083 1 062 990 101 35 7 Burkina Faso Cape Verde 196 328 246 119 111 93 Cape Vert Côte d’Ivoire 2 402 845 1 437 377 339 344 Côte d’Ivoire Gambia, The 127 120 135 40 37 36 Gambie Ghana 1 582 1 693 1 815 1 685 2 527 3 222 Ghana Guinea 214 218 208 141 101 956 Guinée
Guinea Bissau 147 139 119 18 33 19 Guinée Bissau Liberia 513 1 419 765 218 450 508 Libéria Mali 984 1 093 3 004 109 402 291 Mali Niger 235 263 241 791 940 1 014 Niger Nigeria 1 657 2 062 1 813 8 650 6 099 8 915 Nigéria Senegal 1 016 928 1 052 208 237 265 Sénégal Sierra Leone 448 467 429 74 87 49 Sierra Leone Togo 499 419 557 49 86 54 Togo
ECOWAS 11 784 11 744 13 490 12 712 11 662 15 892 CEDEAO

KeyStats 2013 VI: ECOWAS / CEDEAO
4 EXTERNAL SECTOR SECTEUR EXTERIEUR 4 4.7 Total international reserves
(in millions of US$) Réserves internationales totales
(en millions de $ EU) 4.7
COUNTRY 2007 2008 2009 2010 2011 2012 PAYS Benin 1 209 1 263 1 230 1 200 887 733 Bénin Burkina Faso 1 029 928 1 296 1 068 957 971 Burkina Faso Cape Verde 364 361 398 382 339 377 Cape Vert Côte d’Ivoire 2 519 2 253 3 267 3 624 4 316 3 742 Côte d’Ivoire Gambia, The 143 117 224 202 223 217 Gambie Ghana 2 117 2 032 3 165 4 778 5 498 5 383 Ghana Guinea 45 87 165 ... 104 105 Guinée Guinea Bissau 113 125 169 156 220 159 Guinée Bissau Liberia 119 161 372 466 513 500 Libéria Mali 1 087 1 072 1 604 1 344 1 379 1 309 Mali Niger 593 705 656 760 673 894 Niger Nigeria 51 334 53 002 44 763 34 956 35 249 46 442 Nigéria Senegal 1 660 1 602 2 123 2 047 1 946 1 775 Sénégal Sierra Leone 217 220 405 409 439 436 Sierra Leone Togo 438 582 703 715 774 448 Togo ECOWAS 62 988 64 510 60 540 52 110 53 517 63 491 CEDEAO

KeyStats 2013 VI: ECOWAS / CEDEAO
4 EXTERNAL SECTOR SECTEUR EXTERIEUR 4 4.8 Total international reserves / average monthly imports
(ratio) Réserves internationales totales / Importations moyennes
mensuelles (ratio) 4.8
COUNTRY 2007 2008 2009 2010 2011 2012 PAYS Benin 9.54 10.16 10.38 10.02 … … Bénin Burkina Faso 8.84 6.56 … … … … Burkina Faso Cape Verde 6.21 5.95 7.26 6.34 … … Cape Vert Côte d’Ivoire 3.71 3.17 4.63 … … … Côte d’Ivoire Gambia, The 4.03 2.66 5.18 4.98 … … Gambie Ghana … 3.18 5.54 5.64 … … Ghana Guinea 0.43 0.70 1.75 … … … Guinée Guinea Bissau 7.10 7.54 10.19 9.65 … … Guinée Bissau Liberia 0.82 0.92 2.74 2.73 … … Libéria Mali 5.75 3.87 7.71 4.72 … … Mali Niger 12.91 11.13 9.64 3.98 … … Niger Nigeria 18.75 22.92 26.32 9.52 … … Nigéria Senegal 4.22 3.03 5.19 5.41 … … Sénégal Sierra Leone 6.48 5.52 9.35 … … … Sierra Leone Togo 4.90 5.35 6.59 6.38 … … Togo ECOWAS 6.69 6.18 8.03 6.31 … … CEDEAO
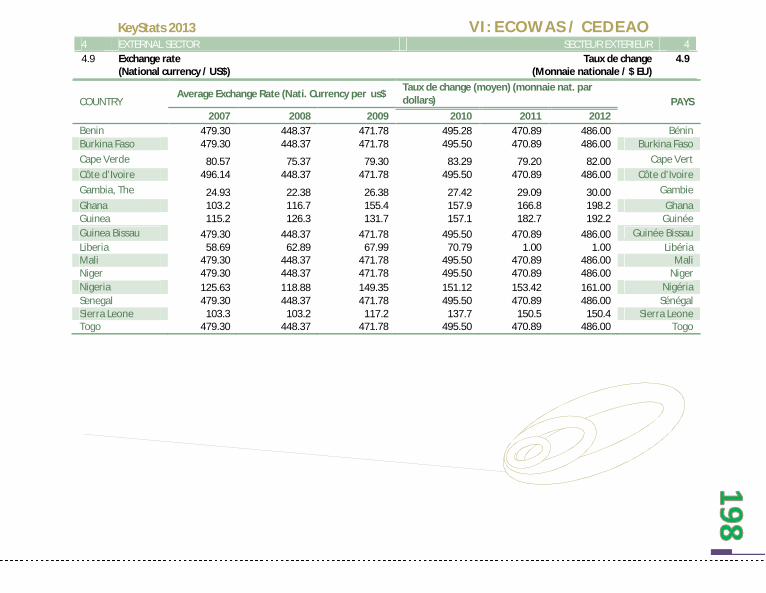
KeyStats 2013 VI: ECOWAS / CEDEAO
4 EXTERNAL SECTOR SECTEUR EXTERIEUR 4 4.9 Exchange rate
(National currency / US$) Taux de change
(Monnaie nationale / $ EU) 4.9
COUNTRY Average Exchange Rate (Nati. Currency per us$
Taux de change (moyen) (monnaie nat. par dollars) PAYS
2007 2008 2009 2010 2011 2012 Benin 479.30 448.37 471.78 495.28 470.89 486.00 Bénin Burkina Faso 479.30 448.37 471.78 495.50 470.89 486.00 Burkina Faso Cape Verde 80.57 75.37 79.30 83.29 79.20 82.00 Cape Vert Côte d’Ivoire 496.14 448.37 471.78 495.50 470.89 486.00 Côte d’Ivoire Gambia, The 24.93 22.38 26.38 27.42 29.09 30.00 Gambie Ghana 103.2 116.7 155.4 157.9 166.8 198.2 Ghana Guinea 115.2 126.3 131.7 157.1 182.7 192.2 Guinée Guinea Bissau 479.30 448.37 471.78 495.50 470.89 486.00 Guinée Bissau Liberia 58.69 62.89 67.99 70.79 1.00 1.00 Libéria Mali 479.30 448.37 471.78 495.50 470.89 486.00 Mali Niger 479.30 448.37 471.78 495.50 470.89 486.00 Niger Nigeria 125.63 118.88 149.35 151.12 153.42 161.00 Nigéria Senegal 479.30 448.37 471.78 495.50 470.89 486.00 Sénégal Sierra Leone 103.3 103.2 117.2 137.7 150.5 150.4 Sierra Leone Togo 479.30 448.37 471.78 495.50 470.89 486.00 Togo
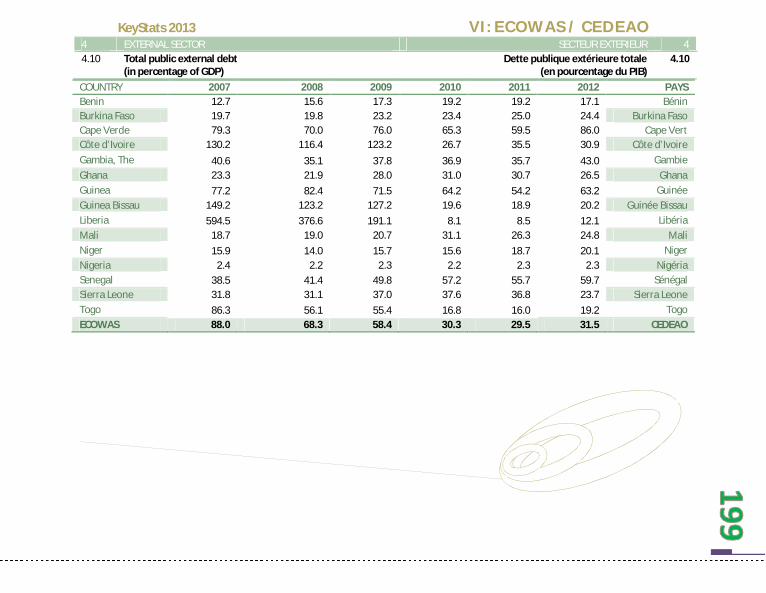
KeyStats 2013 VI: ECOWAS / CEDEAO
4 EXTERNAL SECTOR SECTEUR EXTERIEUR 4 4.10 Total public external debt
(in percentage of GDP) Dette publique extérieure totale
(en pourcentage du PIB) 4.10
COUNTRY 2007 2008 2009 2010 2011 2012 PAYS Benin 12.7 15.6 17.3 19.2 19.2 17.1 Bénin Burkina Faso 19.7 19.8 23.2 23.4 25.0 24.4 Burkina Faso Cape Verde 79.3 70.0 76.0 65.3 59.5 86.0 Cape Vert Côte d’Ivoire 130.2 116.4 123.2 26.7 35.5 30.9 Côte d’Ivoire Gambia, The 40.6 35.1 37.8 36.9 35.7 43.0 Gambie Ghana 23.3 21.9 28.0 31.0 30.7 26.5 Ghana Guinea 77.2 82.4 71.5 64.2 54.2 63.2 Guinée Guinea Bissau 149.2 123.2 127.2 19.6 18.9 20.2 Guinée Bissau Liberia 594.5 376.6 191.1 8.1 8.5 12.1 Libéria Mali 18.7 19.0 20.7 31.1 26.3 24.8 Mali Niger 15.9 14.0 15.7 15.6 18.7 20.1 Niger Nigeria 2.4 2.2 2.3 2.2 2.3 2.3 Nigéria Senegal 38.5 41.4 49.8 57.2 55.7 59.7 Sénégal Sierra Leone 31.8 31.1 37.0 37.6 36.8 23.7 Sierra Leone Togo 86.3 56.1 55.4 16.8 16.0 19.2 Togo ECOWAS 88.0 68.3 58.4 30.3 29.5 31.5 CEDEAO

KeyStats 2013 VI: ECOWAS / CEDEAO
4 EXTERNAL SECTOR SECTEUR EXTERIEUR 4 4.11 Debt service
(in percentage of exports) Service de la dette
(en pourcentage des exportations) 4.11
COUNTRY 2007 2008 2009 2010 2011 2012 PAYS Benin 2.4 1.8 3.0 3.2 4.2 2.2 Bénin Burkina Faso 2.6 5.9 4.6 0.0 3.7 2.7 Burkina Faso Cape Verde 16.7 15.5 19.4 17.9 15.8 13.6 Cape Vert Côte d’Ivoire 2.6 3.6 3.7 2.0 0.8 9.3 Côte d’Ivoire Gambia, The 30.6 30.7 31.3 32.4 32.4 31.3 Gambie Ghana 3.8 5.1 4.6 3.9 2.8 4.8 Ghana
Guinea 11.1 8.9 8.2 4.1 35.5 7.7 Guinée
Guinea Bissau 4.7 3.0 8.7 698.9 0.4 1.1 Guinée Bissau Liberia 26.6 204.4 352.4 168.8 0.8 1.0 Libéria Mali 4.4 3.5 4.7 4.7 4.4 6.0 Mali Niger 3.1 1.8 1.7 1.3 2.9 1.4 Niger Nigeria 1.9 0.7 0.9 0.7 0.5 0.5 Nigéria Senegal 5.7 4.2 5.5 5.7 12.2 7.9 Sénégal Sierra Leone 144.2 3.2 4.7 3.8 4.2 2.2 Sierra Leone Togo 0.5 3.5 4.6 5.1 2.9 3.2 Togo ECOWAS 17.4 19.7 30.5 63.5 8.2 … CEDEAO

KeyStats 2013 VI: ECOWAS / CEDEAO
4 EXTERNAL SECTOR SECTEUR EXTERIEUR 4 4.12 Tariffs and imports by product groups in % (in 2012) Tarifs et importations par groupe des produits en %
(en 2012) 4.12
COUNTRY Animal products Dairy products Fruit, vegetables, plants Coffee, tea
Cereals & preparations PAYS
Benin 19.0 16.3 17.4 15.6 13.2 Bénin Burkina Faso 19.0 16.3 17.4 15.6 13.2 Burkina Faso Cape Verde 17.7 8.0 9.2 25.2 13.6 Cape Vert Côte d’Ivoire 19.0 16.3 17.4 15.6 13.2 Côte d’Ivoire Gambia, The 15.2 12.5 18.8 19.2 18.3 Gambie Ghana … … … … … Ghana Guinea 18.8 12.9 16.9 17.3 13.5 Guinée
Guinea Bissau 19.0 16.3 17.4 15.6 13.2 Guinée Bissau
Liberia 5.3 7.9 10.9 16.2 9.7 Libéria Mali 19.0 16.3 17.4 15.6 13.2 Mali Niger 19.0 16.3 17.4 15.6 13.2 Niger Nigeria 18.8 15.6 17.5 15.8 14.4 Nigéria Senegal 19.0 16.3 17.4 15.6 13.2 Sénégal Sierra Leone 19.0 19.5 17.9 17.0 14.3 Sierra Leone Togo 19.0 16.3 17.4 15.6 13.2 Togo ECOWAS 17.6 14.8 16.5 16.8 13.5 CEDEAO

KeyStats 2013 VI: ECOWAS / CEDEAO
COUNTRY Oilseeds, fats & oils
Sugars and confectionery
Beverages & tobacco
Cotton Other agricultural products
PAYS
Benin 10.7 11.3 18.6 5.0 9.1 Bénin Burkina Faso 10.7 11.3 18.6 5.0 9.1 Burkina Faso Cape Verde 2.2 9.4 30.9 0.0 9.8 Cape Vert Côte d’Ivoire 10.7 11.3 18.6 5.0 9.1 Côte d’Ivoire Gambia, The 15.3 17.7 20.0 18.0 14.2 Gambie Ghana … … … … … Ghana Guinea 10.8 17.5 18.3 5.0 8.7 Guinée Guinea Bissau 10.7 11.3 18.6 5.0 9.1 Guinée Bissau Liberia 8.4 12.9 23.7 5.0 11.7 Libéria Mali 10.7 11.3 18.6 5.0 9.1 Mali Niger 10.7 11.3 18.6 5.0 9.1 Niger Nigeria 17.5 13.8 19.0 5.0 9.1 Nigéria Senegal 10.7 11.3 18.6 5.0 9.1 Sénégal Sierra Leone 11.0 14.9 19.5 5.0 10.5 Sierra Leone Togo 10.7 11.3 18.6 5.0 9.1 Togo ECOWAS 10.8 12.6 20.0 5.6 9.8 CEDEAO

KeyStats 2013 VI: ECOWAS / CEDEAO
COUNTRY Fish & fish products Minerals & metals Petroleum Chemicals PAYS Benin 14.4 11.7 7.2 7.2 Bénin Burkina Faso 14.4 11.7 7.2 7.2 Burkina Faso Cape Verde 22.8 5.5 3.8 3.4 Cape Vert Côte d’Ivoire 14.4 11.7 7.2 7.2 Côte d’Ivoire Gambia, The 19.7 12.9 19.2 10.4 Gambie Ghana … … … … Ghana Guinea 14.3 11.1 14.2 7.4 Guinée Guinea Bissau 14.4 11.7 7.2 7.2 Guinée Bissau Liberia 8.9 7.6 9.2 6.9 Libéria Mali 14.4 11.7 7.2 7.2 Mali Niger 14.4 11.7 7.2 7.2 Niger Nigeria 14.4 12.0 8.6 7.6 Nigéria Senegal 14.4 11.7 7.2 7.2 Sénégal Sierra Leone 16.7 10.3 12.4 7.5 Sierra Leone Togo 14.4 11.7 7.2 7.2 Togo ECOWAS 15.1 10.9 8.9 7.2 CEDEAO
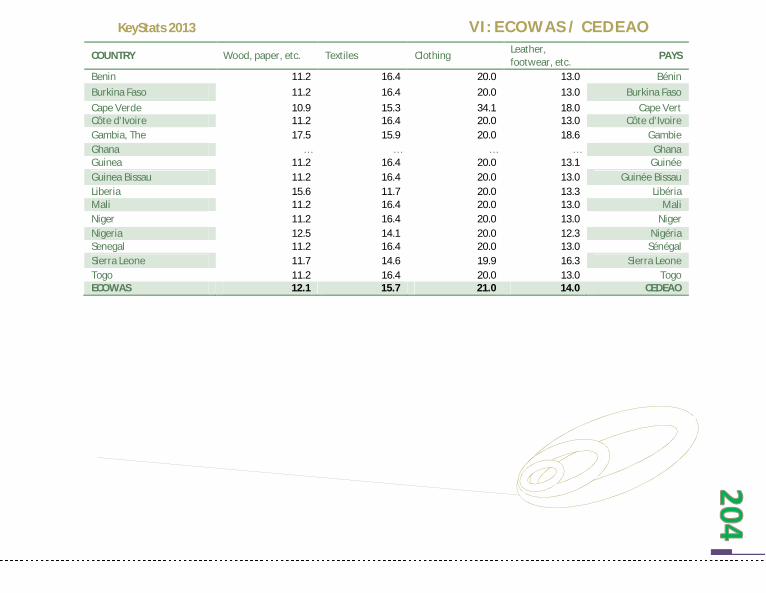
KeyStats 2013 VI: ECOWAS / CEDEAO
COUNTRY Wood, paper, etc. Textiles Clothing Leather, footwear, etc.
PAYS
Benin 11.2 16.4 20.0 13.0 Bénin Burkina Faso 11.2 16.4 20.0 13.0 Burkina Faso Cape Verde 10.9 15.3 34.1 18.0 Cape Vert Côte d’Ivoire 11.2 16.4 20.0 13.0 Côte d’Ivoire Gambia, The 17.5 15.9 20.0 18.6 Gambie Ghana … … … … Ghana Guinea 11.2 16.4 20.0 13.1 Guinée Guinea Bissau 11.2 16.4 20.0 13.0 Guinée Bissau Liberia 15.6 11.7 20.0 13.3 Libéria Mali 11.2 16.4 20.0 13.0 Mali Niger 11.2 16.4 20.0 13.0 Niger Nigeria 12.5 14.1 20.0 12.3 Nigéria Senegal 11.2 16.4 20.0 13.0 Sénégal Sierra Leone 11.7 14.6 19.9 16.3 Sierra Leone Togo 11.2 16.4 20.0 13.0 Togo ECOWAS 12.1 15.7 21.0 14.0 CEDEAO

KeyStats 2013 VI: ECOWAS / CEDEAO
COUNTRY Non-electrical machinery
Electrical machinery
Transport equipment
Manufactures, n.e.s. PAYS
Benin 7.0 11.2 8.7 14.4 Bénin Burkina Faso 7.0 11.2 8.7 14.4 Burkina Faso Cape Verde 2.5 10.0 10.5 13.4 Cape Vert
Côte d’Ivoire 7.0 11.2 8.7 14.4 Côte d’Ivoire Gambia, The 6.3 17.4 13.3 16.6 Gambie Ghana … … … … Ghana Guinea 6.3 11.3 9.6 14.8 Guinée Guinea Bissau 7.0 11.2 8.7 14.4 Guinée Bissau
Liberia 7.4 9.5 8.3 15.7 Libéria
Mali 7.0 11.2 8.7 14.4 Mali
Niger 7.0 11.2 8.7 14.4 Niger
Nigeria 6.2 9.8 8.3 13.5 Nigéria
Senegal 7.0 11.2 8.7 14.4 Sénégal
Sierra Leone 6.6 14.0 7.2 14.4 Sierra Leone Togo 7.0 11.2 8.7 14.4 Togo ECOWAS 6.5 11.5 9.1 14.5 CEDEAO
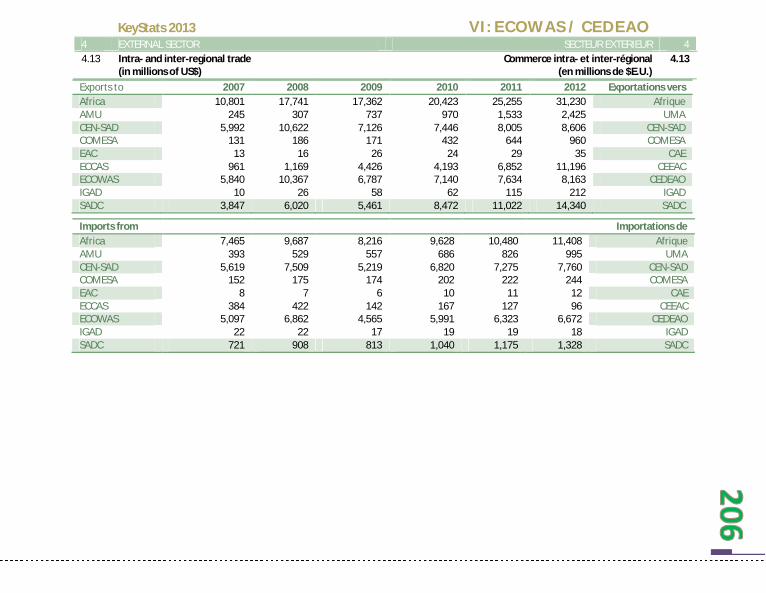
KeyStats 2013 VI: ECOWAS / CEDEAO
4 EXTERNAL SECTOR SECTEUR EXTERIEUR 4 4.13 Intra- and inter-regional trade
(in millions of US$) Commerce intra- et inter-régional
(en millions de $E.U.) 4.13
Exports to 2007 2008 2009 2010 2011 2012 Exportations vers Africa 10,801 17,741 17,362 20,423 25,255 31,230 Afrique AMU 245 307 737 970 1,533 2,425 UMA CEN-SAD 5,992 10,622 7,126 7,446 8,005 8,606 CEN-SAD COMESA 131 186 171 432 644 960 COMESA EAC 13 16 26 24 29 35 CAE ECCAS 961 1,169 4,426 4,193 6,852 11,196 CEEAC ECOWAS 5,840 10,367 6,787 7,140 7,634 8,163 CEDEAO IGAD 10 26 58 62 115 212 IGAD SADC 3,847 6,020 5,461 8,472 11,022 14,340 SADC
Imports from Importations de Africa 7,465 9,687 8,216 9,628 10,480 11,408 Afrique AMU 393 529 557 686 826 995 UMA CEN-SAD 5,619 7,509 5,219 6,820 7,275 7,760 CEN-SAD COMESA 152 175 174 202 222 244 COMESA EAC 8 7 6 10 11 12 CAE ECCAS 384 422 142 167 127 96 CEEAC ECOWAS 5,097 6,862 4,565 5,991 6,323 6,672 CEDEAO IGAD 22 22 17 19 19 18 IGAD SADC 721 908 813 1,040 1,175 1,328 SADC
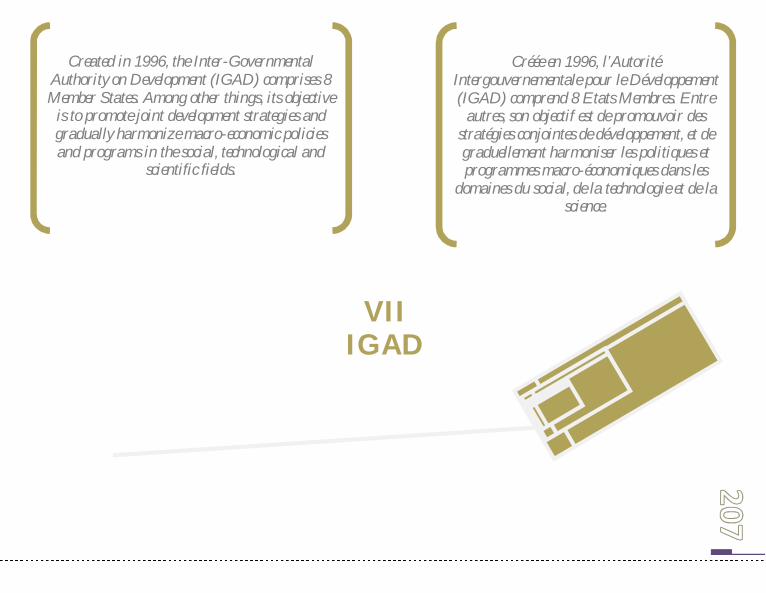
VII IGAD
Created in 1996, the Inter-Governmental Authority on Development (IGAD) comprises 8 Member States. Among other things, its objective
is to promote joint development strategies and gradually harmonize macro-economic policies and programs in the social, technological and
scientific fields.
Créée en 1996, l’Autorité Intergouvernementale pour le Développement (IGAD) comprend 8 Etats Membres. Entre
autres, son objectif est de promouvoir des stratégies conjointes de développement, et de graduellement harmoniser les politiques et programmes macro-économiques dans les
domaines du social, de la technologie et de la science.

KeyStats 2013 VII: IGAD
0 POPULATION POPULATION 0 0.1 Total population
(in millions) Population totale
(en millions) 0.1
COUNTRY 2007 2008 2009 2010 2011 2012 PAYS
Djibouti 0.8 0.9 0.9 0.9 0.9 0.9 Djibouti Eritrea 4.8 4.9 5.1 5.3 5.4 5.6 Erythrée Ethiopia 77.7 79.4 81.2 82.9 84.7 86.5 Ethiopie Kenya 37.5 38.5 38.6 40.5 41.6 42.7 Kenya Somalia 8.7 8.9 9.1 9.3 9.6 9.8 Somalie South Sudan … 8.5 8.9 9.4 9.8 10.4 Sudan du Sud Sudan 37.2 39.2 40.3 41.8 34.0* 35.3 Soudan du Sud Uganda 30.3 31.3 32.4 33.4 34.5 35.6 Ouganda IGAD 197.1 211.7 216.5 223.5 220.5 226.9 IGAD

KeyStats 2013 VII: IGAD
0 POPULATION POPULATION 0 0.2 Population structure
(in percentage of total population) Structure de la population
(en pourcentage de la population totale) 0.2
COUNTRY Female / Femmes Urban / Urbaine
PAYS 2010 2011 2012 2010 2011 2012
Djibouti 50.0 50.0 50.0 76.2 76.3 77.0 Djibouti Eritrea 50.7 50.7 50.7 21.6 22.1 22.0 Erythrée Ethiopia 50.2 50.2 50.0 16.7 16.8 17.0 Ethiopie Kenya 50,1... 50.1 50.0 22.2 22.5 24.0 Kenya Somalia 50.4 50.4 50.4 37.4 37.9 38.0 Somalie South Sudan 48.8 48.8 48.9 … … … Soudan du Sud Sudan 48.8 49.2* 49.6 40.1 33.3* 33.0 Soudan Uganda 50.0 50.0 50.0 13.3 13.5 16.0 Ouganda IGAD 49.9 49.9 50.0 32.5 31.8 32.4 IGAD

KeyStats 2013 VII: IGAD
0 POPULATION POPULATION 0 0.2 Population structure (cont’d)
(in percentage of total population) Structure de la population (suite)
(en pourcentage de la population totale) 0.2
COUNTRY Eco. active population / Population éco. Active
(Thousands)
Economically active female / male ratio
PAYS Ratio femmes / Hommes économiquement. actifs
2010 2011 2012 2010 2011 2012 Djibouti 289 298 307 35 35.2 35.4 Djibouti Eritrea 2 534 2 616 2700 48.6 48.6 48.6 Erythrée Ethiopia 39 262 40 556 41885 47.5 47.6 47.7 Ethiopie Kenya 14 860 15 335 15815 46.3 46.3 46.3 Kenya Somalia 2 867 2 933 3007 33.7 33.8 33.9 Somalie South Sudan … … … … … … Soudan du Sud Sudan 13 399 13 823 14225 29.3 29.4 29.5 Soudan Uganda 12 866 13 283 13724 49.2 49.2 49.1 Ouganda IGAD 86 078 88 844 91 663 41.37 41.44 41.50 IGAD
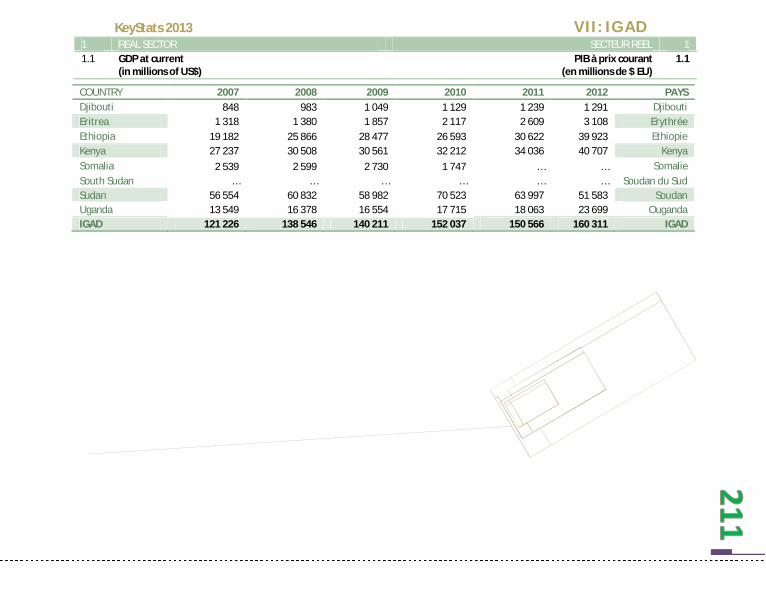
KeyStats 2013 VII: IGAD
1 REAL SECTOR SECTEUR REEL 1 1.1 GDP at current
(in millions of US$) PIB à prix courant
(en millions de $ EU) 1.1
COUNTRY 2007 2008 2009 2010 2011 2012 PAYS Djibouti 848 983 1 049 1 129 1 239 1 291 Djibouti Eritrea 1 318 1 380 1 857 2 117 2 609 3 108 Erythrée Ethiopia 19 182 25 866 28 477 26 593 30 622 39 923 Ethiopie Kenya 27 237 30 508 30 561 32 212 34 036 40 707 Kenya Somalia 2 539 2 599 2 730 1 747 … … Somalie South Sudan … … … … … … Soudan du Sud Sudan 56 554 60 832 58 982 70 523 63 997 51 583 Soudan Uganda 13 549 16 378 16 554 17 715 18 063 23 699 Ouganda IGAD 121 226 138 546 140 211 152 037 150 566 160 311 IGAD
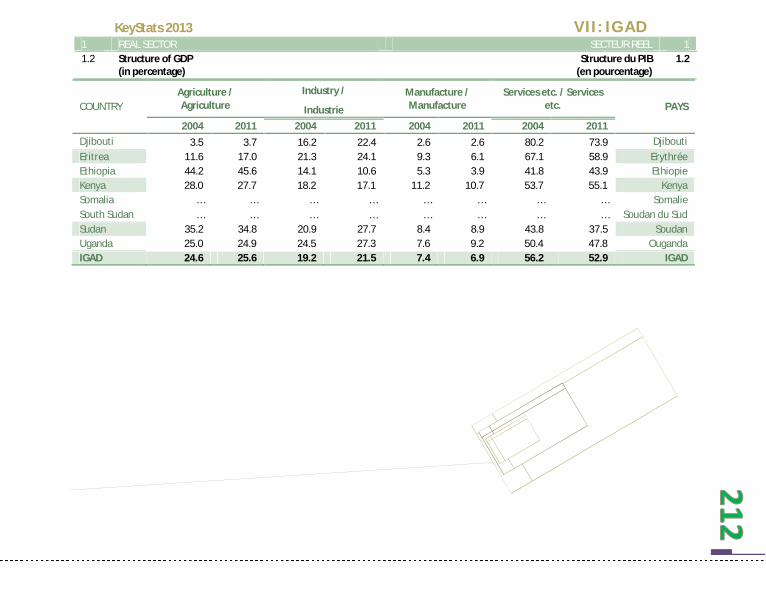
KeyStats 2013 VII: IGAD
1 REAL SECTOR SECTEUR REEL 1 1.2 Structure of GDP
(in percentage) Structure du PIB
(en pourcentage) 1.2
COUNTRY Agriculture / Agriculture
Industry / Manufacture / Manufacture
Services etc. / Services etc. PAYS Industrie
2004 2011 2004 2011 2004 2011 2004 2011 Djibouti 3.5 3.7 16.2 22.4 2.6 2.6 80.2 73.9 Djibouti Eritrea 11.6 17.0 21.3 24.1 9.3 6.1 67.1 58.9 Erythrée Ethiopia 44.2 45.6 14.1 10.6 5.3 3.9 41.8 43.9 Ethiopie Kenya 28.0 27.7 18.2 17.1 11.2 10.7 53.7 55.1 Kenya Somalia … … … … … … … … Somalie South Sudan … … … … … … … … Soudan du Sud Sudan 35.2 34.8 20.9 27.7 8.4 8.9 43.8 37.5 Soudan Uganda 25.0 24.9 24.5 27.3 7.6 9.2 50.4 47.8 Ouganda IGAD 24.6 25.6 19.2 21.5 7.4 6.9 56.2 52.9 IGAD

KeyStats 2013 VII: IGAD
1 REAL SECTOR SECTEUR REEL 1 1.3 Real GDP Growth
(in percentage) Croissance réelle du PIB
(en pourcentage) 1.3
COUNTRY 2007 2008 2009 2010 2011 2012 PAYS Djibouti 5.0 5.0 5.5 4.5 4.5 4.8 Djibouti Eritrea 1.4 -9.8 3.9 2.2 8.7 5.5 Erythrée Ethiopia 11.5 10.8 8.8 12.6 11.2 8.5 Ethiopie Kenya 7.0 1.5 2.6 5.6 4.4 4.2 Kenya Somalia 2.6 2.6 2.6 2.6 2.6 2.6 Somalie South Sudan … … 4.3 4.2 1.9 … Soudan du Sud Sudan 8.1 7.8 6.1 6.4 2.7 -0.6 Soudan Uganda 8.1 10.4 4.2 6.1 5.9 4.4 Ouganda IGAD 6.2 4.1 4.8 5.5 5.2 4.2 IGAD

KeyStats 2013 VII: IGAD
1 REAL SECTOR SECTEUR REEL 1 1.4 Per capita GDP and GNI
(in US$) PIB et RNB par habitant
(en $ EU) 1.4
COUNTRY Current prices / Prix courant PPP / PPA GNI / RNB
PAYS 2010 2011 2012 2010 2011 2012 2010 2011 2012
Djibouti 1 271 1 368 1399 2 537 2 641 … … … … Djibouti Eritrea 403 482 557 683 735 560 310 430 450 Erythrée Ethiopia 319 361 461 1 019 1 092 1 140 370 400 410 Ethiopie Kenya 795 818 952 1 681 1 741 1 760 810 820 840 Kenya Somalia 187 … … … … … … … … Somalie South Sudan … … … … … … … … … Soudan du Sud Sudan 1 489 1 434 1128 2 278 2 730 2 030 1300 1333 1,450 Soudan Uganda 530 523 665 1 332 1 385 1 140 500 510 440 Ouganda IGAD 4 994 4 986 5162 9 529 10 324 6 630 3 290 3 493 3 590 IGAD

KeyStats 2013 VII: IGAD
1 REAL SECTOR SECTEUR REEL 1 1.5a Inflation
(in percentage) Inflation
(en pourcentage) 1.5a
COUNTRY 2007 2008 2009 2010 2011 2012 PAYS Djibouti 5.0 12.0 1.7 4.0 5.1 3.7 Djibouti Eritrea 9.3 19.9 34.7 20.5 13.3 … Erythrée Ethiopia 15.8 37.8 7.6 17.7 32.0 22.7 Ethiopie Kenya 9.8 26.2 19.6 4.1 14.0 9.6 Kenya Somalia ... ... ... ... ... … Somalie South Sudan ... 25.8 8.9 12.8 65.6 25.2 Soudan du Sud Sudan 8.1 14.3 11.2 13.0 18.1 35.6 Soudan Uganda 6.1 12.1 13.0 4.0 18.7 14.0 Ouganda
CPI National

KeyStats 2013 VII: IGAD
1 REAL SECTOR SECTEUR REEL 1 1.5b Inflation
(in percentage) Inflation
(en pourcentage) 1.5b
COUNTRY 2007 2008 2009 2010 2011 2012 PAYS Djibouti … … … … … … Djibouti Eritrea … … … … … … Erythrée Ethiopia … … … … … … Ethiopie Kenya … … … … … … Kenya Somalia … … … … … … Somalie South Sudan … … … … … … Soudan du Sud Sudan … … … … … … Soudan Uganda … … … … … … Ouganda IGAD … … … … … … IGAD
Harmonized CPI

KeyStats 2013 VII: IGAD
2 GOVERNMENT FINANCE FINANCES PUBLIQUES 2 2.1a Total revenue plus grants
(in percentage of GDP) Recettes totales plus dons
(en pourcentage du PIB) 2.1a
COUNTRY 2005 2008 2009 2010 2011 2012 PAYS Djibouti 37.1 41.9 37.0 35.4 34.5 34.5 Djibouti Eritrea 35.3 21.0 15.9 18.6 17.4 17.2 Erythrée Ethiopia 18.9 16.4 16.3 17.3 16.7 15.9 Ethiopie Kenya 21.5 22.9 22.4 25.2 24.0 25.2 Kenya Somalia ... ... … … … … Somalie South Sudan ... ... … … … … Soudan du Sud Sudan 18.3 21.8 14.6 15.7 24.5 14.1 Soudan Uganda 17.3 16.2 13.5 13.4 17.4 15.6 Ouganda IGAD 24.7 23.4 20.0 21.0 22.4 20.4 IGAD

KeyStats 2013 VII: IGAD
2 GOVERNMENT FINANCE FINANCES PUBLIQUES 2 2.1b Total revenue
(in percentage of GDP) Recettes totales
(en pourcentage du PIB) 2.1b
COUNTRY 2005 2008 2009 2010 2011 2012 PAYS Djibouti … … 37.0 35.5 35.5 36.1 Djibouti Eritrea … … … … … … Erythrée Ethiopia 11.0 10.2 16.3 17.3 16.5 15.2 Ethiopie Kenya 20.2 19.4 22.4 23.1 24.7 25.7 Kenya Somalia … … … … … … Somalie South Sudan … … … … … … Soudan du Sud Sudan … … 14.6 19.3 18.9 12 Soudan Uganda 11.9 13.3 13.5 15.7 19.6 15.6 Ouganda IGAD … … … … … … IGAD
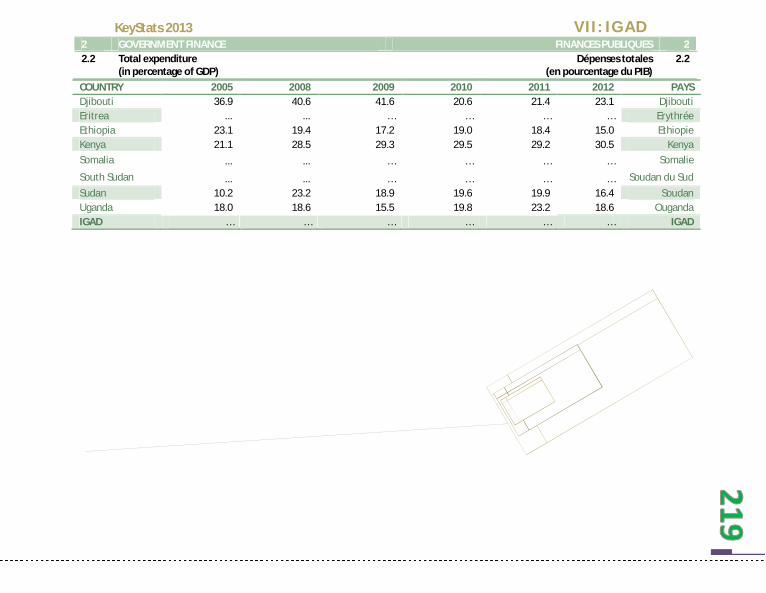
KeyStats 2013 VII: IGAD
2 GOVERNMENT FINANCE FINANCES PUBLIQUES 2 2.2 Total expenditure
(in percentage of GDP) Dépenses totales
(en pourcentage du PIB) 2.2
COUNTRY 2005 2008 2009 2010 2011 2012 PAYS Djibouti 36.9 40.6 41.6 20.6 21.4 23.1 Djibouti Eritrea ... ... … … … … Erythrée Ethiopia 23.1 19.4 17.2 19.0 18.4 15.0 Ethiopie Kenya 21.1 28.5 29.3 29.5 29.2 30.5 Kenya Somalia ... ... … … … … Somalie
South Sudan ... ... … … … … Soudan du Sud Sudan 10.2 23.2 18.9 19.6 19.9 16.4 Soudan Uganda 18.0 18.6 15.5 19.8 23.2 18.6 Ouganda IGAD … … … … … … IGAD

KeyStats 2013 VII: IGAD
2 GOVERNMENT FINANCE FINANCES PUBLIQUES 2 2.3 Fiscal balance
(Surplus+ / Deficit-) (in percentage of GDP)
Solde budgétaire (Excédent+ / Déficit-)
(en pourcentage du PIB)
2.2
COUNTRY 2005 2008 2009 2010 2011 2012 PAYS Djibouti 0.24 1.25 -4.58 -0.80 -0.10 -2.00 Djibouti Eritrea ... ... ... ... ... … Erythrée Ethiopia -4.16 -2.99 -0.94 -1.66 -1.61 0.2 Ethiopie Kenya 0.39 -5.55 -6.90 -6.35 -4.50 -4.70 Kenya Somalia ... ... ... ... ... … Somalie South Sudan ... ... ... ... ... … Soudan du Sud Sudan 8.07 -1.44 -4.32 -0.30 -1.00 -4.40 Soudan Uganda -0.68 -2.33 -1.97 -4.10 -3.60 -3.00 Ouganda IGAD … … … … … … IGAD

KeyStats 2013 VII: IGAD
3 MONETARY AND FINANCIAL SECTOR SECTEUR MONETAIRE ET FINANCIER 3 3.1 Money (M1)
(in millions of US$) Monnaie (M1)
(en millions de DEU) 3.1
COUNTRY 2007 2008 2009 2010 2011 2012 PAYS Djibouti 118 032 142 310 167 191 187 589 179 209 191 803 Djibouti Eritrea 25 870 29 978 34 699 39 755 47 732 56 940 Erythrée Ethiopia 56 842 69 853 83 744 104 117 144 892 193 431 Ethiopie Kenya 777 771 901 055 1 045 657 1 271 638 1 516 152 1 817 038 Kenya Somalia … … … … … … Somalie South Sudan … … … … … … Soudan du Sud Sudan 19 745 22 985 28 519 35 612 41 914 58 016 Soudan Uganda 4 412 378 5 785 728 6 745 061 9 427 584 10 426 566 11 873 762 Ouganda IGAD 5 410 638 6 951 909 8 104 871 11 066 295 12 356 465 14 190 990 IGAD

KeyStats 2013 VII: IGAD
3 MONETARY AND FINANCIAL SECTOR SECTEUR MONETAIRE ET FINANCIER 3 3.2 Money plus quasi-money (M2)
(in % of GDP) Monnaie plus quasi-monnaie (M2)
(en % du PIB) 3.2
COUNTRY 2007 2008 2009 2010 2011 2012 PAYS Djibouti 78.33 81.50 89.67 93.52 81.38 … Djibouti Eritrea 127.66 141.26 121.52 123.19 114.71 … Erythrée Ethiopia 40.05 34.23 … … … … Ethiopie Kenya 42.32 42.54 44.14 50.08 50.98 50.76 Kenya Somalia … … … … … … Somalie South Sudan … … … … … … Soudan du Sud Sudan 21.48 20.40 23.34 23.73 24.48 27.92 Soudan Uganda 20.88 23.62 22.58 26.89 26.52 24.35 Ouganda IGAD 55.12 57.26 60.25 63.48 59.61 34.34 IGAD
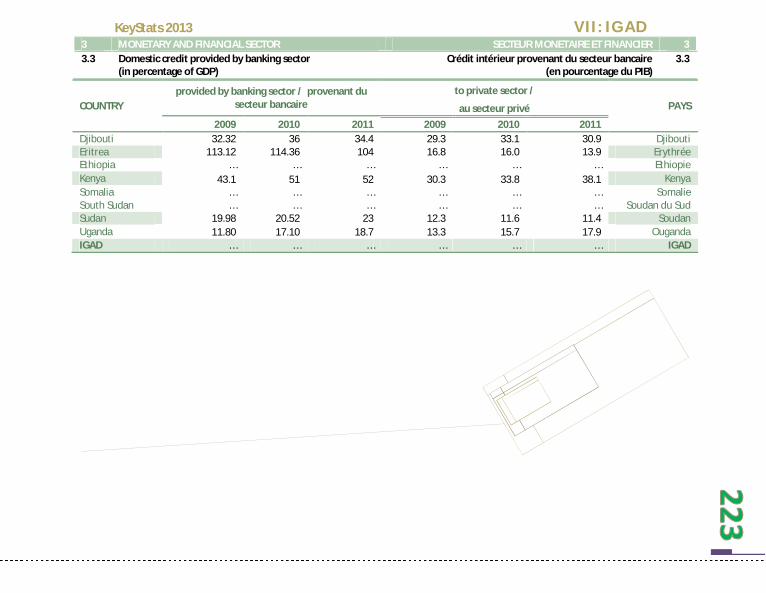
KeyStats 2013 VII: IGAD
3 MONETARY AND FINANCIAL SECTOR SECTEUR MONETAIRE ET FINANCIER 3 3.3 Domestic credit provided by banking sector
(in percentage of GDP) Crédit intérieur provenant du secteur bancaire
(en pourcentage du PIB) 3.3
COUNTRY provided by banking sector / provenant du
secteur bancaire to private sector /
PAYS au secteur privé 2009 2010 2011 2009 2010 2011
Djibouti 32.32 36 34.4 29.3 33.1 30.9 Djibouti Eritrea 113.12 114.36 104 16.8 16.0 13.9 Erythrée Ethiopia … … … … … … Ethiopie Kenya 43.1 51 52 30.3 33.8 38.1 Kenya Somalia … … … … … … Somalie South Sudan … … … … … … Soudan du Sud Sudan 19.98 20.52 23 12.3 11.6 11.4 Soudan Uganda 11.80 17.10 18.7 13.3 15.7 17.9 Ouganda IGAD … … … … … … IGAD

KeyStats 2013 VII: IGAD
3 MONETARY AND FINANCIAL SECTOR SECTEUR MONETAIRE ET FINANCIER 3 3.4 Interest rates
(in percentage) Taux d’intérêts
(en pourcentage) 3.4
COUNTRY Deposit rate / Taux de dépôts Discount rate / Taux d’escompte
PAYS 2009 2010 2011 2009 2010 2011
Djibouti 1.4 1.0 1.5 9.7 9.3 9.1 Djibouti Eritrea … … … … … … Erythrée Ethiopia … …. … … … … Ethiopie Kenya 6.0 4.6 5.6 8.8 9.8 9.4 Kenya Somalia … … … … … … Somalie South Sudan … … … … … … Soudan du Sud Sudan … … … … … … Soudan Uganda 9.8 7.7 13.0 11.2 12.5 8.8 Ouganda IGAD … … … … … … IGAD

KeyStats 2013 VII: IGAD
4 EXTERNAL SECTOR SECTEUR EXTERIEUR 4 4.1 Imports
(in % of GDP) Importations
(en % du PIB) 4.1
COUNTRY 2007 2008 2009 2010 2011 2012 PAYS Djibouti 77.1 … … … … … Djibouti Eritrea 28.8 26.0 23.0 23.0 23.0 23.0 Erythrée Ethiopia 32.0 31.0 29.0 33.0 32.0 … Ethiopie Kenya 37.7 42.0 37.0 40.0 46.0 48.0 Kenya Somalia … … … … … … Somalie South Sudan … … … … … … Soudan du Sud Sudan 22.9 20.0 20.0 17.0 16.0 20.0 Soudan Uganda 30.1 32.0 35.0 34.0 34.0 30.0 Ouganda IGAD 38.1 30.2 28.8 29.4 30.2 30.3 IGAD

KeyStats 2013 VII: IGAD
4 EXTERNAL SECTOR SECTEUR EXTERIEUR 4 4.2 Exports
(in % of GDP) Exportations
(en % du PIB) 4.2
COUNTRY 2007 2008 2009 2010 2011 2012 PAYS Djibouti 57.1 … … … … … Djibouti Eritrea 5.8 4.0 5.0 5.0 14.0 20.0 Erythrée Ethiopia 12.7 11.0 11.0 14.0 17.0 … Ethiopie Kenya 26.8 28.0 24.0 28.0 29.0 27.0 Kenya Somalia … … …. … … … Somalie South Sudan … … …. … … … Soudan du Sud Sudan 22.1 25.0 16.0 20.0 18.0 19.0 Soudan Uganda 16.7 24.0 24.0 24.0 24.0 20.0 Ouganda IGAD 23.5 18.4 16.0 18.2 20.4 21.5 IGAD

KeyStats 2013 VII: IGAD
4 EXTERNAL SECTOR SECTEUR EXTERIEUR 4 4.3 Trade balance
(in % of GDP) Solde commercial
(en % du PIB) 4.3
COUNTRY 2007 2008 2009 2010 2011 2012 PAYS Djibouti 39.68 -51.4 -35.6 -26.1 -33.1 -34.6 Djibouti Eritrea … -22.0 -19.9 -19.6 -10.3 -4.7 Erythrée Ethiopia 15.58 -21.2 -22.4 -23.7 -18.0 -15.8 Ethiopie Kenya 17.00 -18.5 -18.7 -19.4 -17.6 -19.3 Kenya Somalia … … … … … … Somalie South Sudan … … … … … … Soudan du Sud Sudan 6.35 7.8 -1.2 5.7 4.3 -3.0 Soudan Uganda 13.18 -11.2 -9.1 -12.5 -13.9 -14.9 Ouganda IGAD 18.36 -19.42 -17.82 -15.93 -14.77 -15.38 IGAD

KeyStats 2013 VII: IGAD
4 EXTERNAL SECTOR SECTEUR EXTERIEUR 4 4.4 Current account balance
(in millions of US$) Solde du compte courant
(en millions de $ EU) 4.4
COUNTRY 2007 2008 2009 2010 2011 2012 PAYS Djibouti -36 238 -68 423 -12 635 8 973 -30 922 -24 881 Djibouti Eritrea -1 238 -1 160 -2 174 -1 830 220 1 021 Erythrée Ethiopia - 784 -1 502 -1 635 -1 193 - 211 -2 800 Ethiopie Kenya -69 476 -137 148 -187 738 -185 700 -166 733 -139 931 Kenya Somalia … … … … … … Somalie South Sudan … … … … … … Soudan du Sud Sudan -3 269 -1 576 -2 178 - 54 - 835 … Soudan Uganda - 633 -1 268 -1 090 -1 699 -1 974 -2 025 Ouganda IGAD -111 638 -211 077 -207 450 -181 503 -200 455 -168 616 IGAD

KeyStats 2013 VII: IGAD
4 EXTERNAL SECTOR SECTEUR EXTERIEUR 4 4.5 Capital and financial account
(in millions of US$) Compte des capitaux et des opérations financières
(en millions de $ EU) 4.5
COUNTRY 2007 2008 2009 2010 2011 2012 PAYS Djibouti 35 54 55 55 … … Djibouti Eritrea … … … … … … Erythrée Ethiopia 799 1 032 1 648 1 996 2 105 1 889 Ethiopie Kenya 157 94 261 240 … … Kenya Somalia … … … … … … Somalie South Sudan … … … … … … Soudan du Sud Sudan … … … … … … Soudan Uganda 1393 1 169 1 721 1 053 1 594 2 252 Ouganda IGAD … … … … … … IGAD

KeyStats 2013 VII: IGAD
4 EXTERNAL SECTOR SECTEUR EXTERIEUR 4 4.6 International financial flows
(in millions of US$) Flux financiers internationaux
(en millions de $ EU) 4.6
COUNTRY Official development assistance (net) / Appui
public au développement (net) Net foreign direct investment /
PAYS Investissement direct étranger net 2009 2010 2011 2009 2010 2011
Djibouti 167 132 142 100 27 78 Djibouti Eritrea 144 161 163 0 56 19 Erythrée Ethiopia 3 819 3 525 3563 221 288 206 Ethiopie Kenya 1 776 1 629 2474 116 178 335 Kenya Somalia 662 498 1096 108 112 102 Somalie South Sudan … … … … … … Soudan du Sud Sudan 2 289 2 055 1300 3 034 2 064 2 341 Soudan Uganda 1 785 1 723 1580 842 548 894 Ouganda IGAD 10 642 9 723 10318 4 421 3 273 3 975 IGAD

KeyStats 2013 VII: IGAD
4 EXTERNAL SECTOR SECTEUR EXTERIEUR 4 4.7 Total international reserves
(in millions of US$) Réserves internationales totales
(en millions de $ EU) 4.7
COUNTRY 2007 2008 2009 2010 2011 2012 PAYS Djibouti 132 175 242 249 244 253 Djibouti Eritrea 34 58 90 114 115 117 Erythrée Ethiopia 1 290 871 1 781 … … … Ethiopie Kenya 3 355 2 879 3 849 4 320 4 264 5 711 Kenya Somalia 217 211 ... … … … Somalie South Sudan … 2 091 2 310 2305 2830 … Soudan du Sud Sudan 1 378 1 399 1 094 1 036 193 … Soudan Uganda 2 560 2 301 2 994 2 706 2 617 3 120 Ouganda IGAD 8 966 9 984 12 360 10 730 10 263 … IGAD
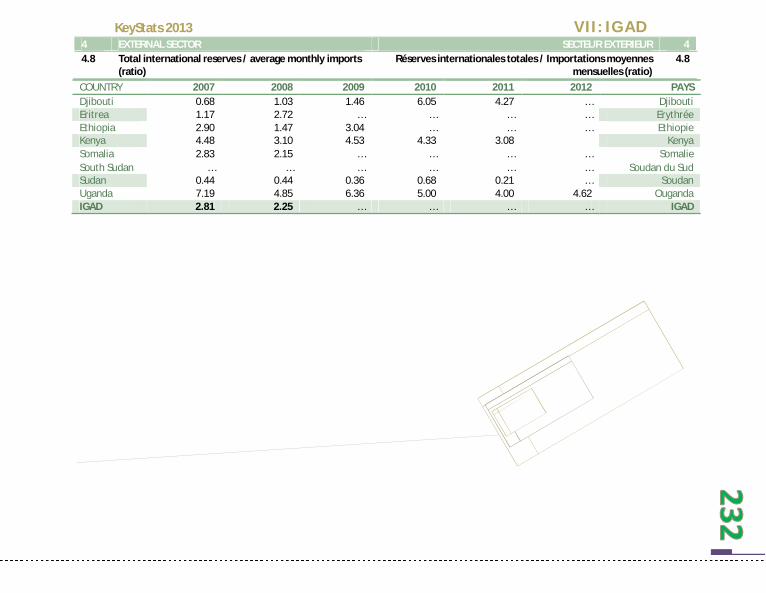
KeyStats 2013 VII: IGAD
4 EXTERNAL SECTOR SECTEUR EXTERIEUR 4 4.8 Total international reserves / average monthly imports
(ratio) Réserves internationales totales / Importations moyennes
mensuelles (ratio) 4.8
COUNTRY 2007 2008 2009 2010 2011 2012 PAYS Djibouti 0.68 1.03 1.46 6.05 4.27 … Djibouti Eritrea 1.17 2.72 … … … … Erythrée Ethiopia 2.90 1.47 3.04 … … … Ethiopie Kenya 4.48 3.10 4.53 4.33 3.08
Kenya
Somalia 2.83 2.15 … … … … Somalie South Sudan … … … … … … Soudan du Sud Sudan 0.44 0.44 0.36 0.68 0.21 … Soudan Uganda 7.19 4.85 6.36 5.00 4.00 4.62 Ouganda IGAD 2.81 2.25 … … … … IGAD

KeyStats 2013 VII: IGAD
4 EXTERNAL SECTOR SECTEUR EXTERIEUR 4 4.9 Exchange rate
(National currency / US$) Taux de change
(Monnaie nationale / $ EU) 4.9
COUNTRY Average Exchange Rate (Nati. Currency per us$
Taux de change (moyen) (monnaie nat. par dollars) PAYS
2007 2008 2009 2010 2011 2012 Djibouti 177.72 177.72 177.72 177.72 177.72 177.72 Djibouti Eritrea 15.00 15.00 15.00 15.00 15.38 15.38 Erythrée Ethiopia 9.00 9.63 11.56 14.35 16.90 17.70 Ethiopie Kenya 67.28 69.12 77.24 79.22 88.81 84.53 Kenya Somalia 14.09 14.41 14.41 19.56 … … Somalie South Sudan … … … … … … Soudan du Sud Sudan 2.02 2.11 2.31 2.31 2.67 3.49 Soudan Uganda 96.8 96.6 114.0 122.3 141.7 139.8 Ouganda
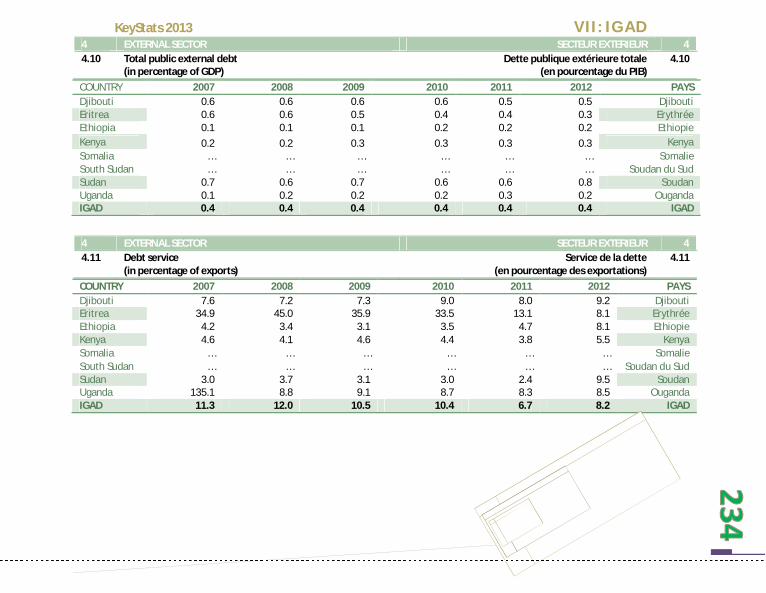
KeyStats 2013 VII: IGAD
4 EXTERNAL SECTOR SECTEUR EXTERIEUR 4 4.10 Total public external debt
(in percentage of GDP) Dette publique extérieure totale
(en pourcentage du PIB) 4.10
COUNTRY 2007 2008 2009 2010 2011 2012 PAYS Djibouti 0.6 0.6 0.6 0.6 0.5 0.5 Djibouti Eritrea 0.6 0.6 0.5 0.4 0.4 0.3 Erythrée Ethiopia 0.1 0.1 0.1 0.2 0.2 0.2 Ethiopie Kenya 0.2 0.2 0.3 0.3 0.3 0.3 Kenya Somalia … … … … … … Somalie South Sudan … … … … … … Soudan du Sud Sudan 0.7 0.6 0.7 0.6 0.6 0.8 Soudan Uganda 0.1 0.2 0.2 0.2 0.3 0.2 Ouganda IGAD 0.4 0.4 0.4 0.4 0.4 0.4 IGAD
4 EXTERNAL SECTOR SECTEUR EXTERIEUR 4 4.11 Debt service
(in percentage of exports) Service de la dette
(en pourcentage des exportations) 4.11
COUNTRY 2007 2008 2009 2010 2011 2012 PAYS Djibouti 7.6 7.2 7.3 9.0 8.0 9.2 Djibouti Eritrea 34.9 45.0 35.9 33.5 13.1 8.1 Erythrée Ethiopia 4.2 3.4 3.1 3.5 4.7 8.1 Ethiopie Kenya 4.6 4.1 4.6 4.4 3.8 5.5 Kenya Somalia … … … … … … Somalie South Sudan … … … … … … Soudan du Sud Sudan 3.0 3.7 3.1 3.0 2.4 9.5 Soudan Uganda 135.1 8.8 9.1 8.7 8.3 8.5 Ouganda IGAD 11.3 12.0 10.5 10.4 6.7 8.2 IGAD

KeyStats 2013 VII: IGAD
4 EXTERNAL SECTOR SECTEUR EXTERIEUR 4 4.12 Tariffs and imports by product groups in % (in 2012) Tarifs et importations par groupe des produits en %
(en 2012) 4.12
COUNTRY Animal products Dairy products Fruit, vegetables, plants
Coffee, tea Cereals & preparations PAYS
Djibouti 10.0 12.1 10.2 23.8 8.7 Djibouti Eritrea … … … … … Erythrée Ethiopia 23.8 27.3 27.7 28.8 21.0 Ethiopie Kenya 23.3 43.3 22.1 19.6 23.6 Kenya Somalia … … … … … Somalie South Sudan … … … … … Soudan du Sud Sudan 34.9 38.9 36.0 28.8 23.6 Soudan Uganda 23.3 43.3 22.1 19.6 23.6 Ouganda IGAD 23.1 33.0 23.6 24.1 20.1 IGAD
COUNTRY Oilseeds, fats & oils
Sugars and confectionery
Beverages & tobacco Cotton
Other agricultural products
PAYS
Djibouti 13.8 13.3 26.0 26.0 20.6 Djibouti Eritrea … … … … … Erythrée Ethiopia 17.0 8.8 31.5 10.0 14.3 Ethiopie Kenya 11.3 29.8 25.3 0.0 10.9 Kenya Somalia … … … … … Somalie South Sudan … … … … … Soudan du Sud Sudan 26.1 22.9 40.0 3.0 22.6 Soudan Uganda 11.3 26.5 25.3 0.0 10.9 Ouganda IGAD 15.9 20.3 29.6 7.8 15.9 IGAD
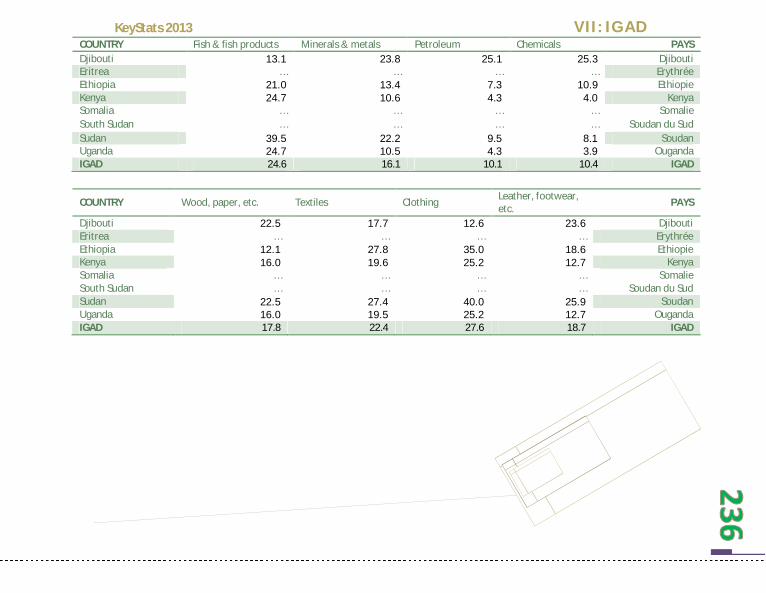
KeyStats 2013 VII: IGAD
COUNTRY Fish & fish products Minerals & metals Petroleum Chemicals PAYS Djibouti 13.1 23.8 25.1 25.3 Djibouti Eritrea … … … … Erythrée Ethiopia 21.0 13.4 7.3 10.9 Ethiopie Kenya 24.7 10.6 4.3 4.0 Kenya Somalia … … … … Somalie South Sudan … … … … Soudan du Sud Sudan 39.5 22.2 9.5 8.1 Soudan Uganda 24.7 10.5 4.3 3.9 Ouganda IGAD 24.6 16.1 10.1 10.4 IGAD
COUNTRY Wood, paper, etc. Textiles Clothing Leather, footwear, etc. PAYS
Djibouti 22.5 17.7 12.6 23.6 Djibouti Eritrea … … … … Erythrée Ethiopia 12.1 27.8 35.0 18.6 Ethiopie Kenya 16.0 19.6 25.2 12.7 Kenya Somalia … … … … Somalie South Sudan … … … … Soudan du Sud Sudan 22.5 27.4 40.0 25.9 Soudan Uganda 16.0 19.5 25.2 12.7 Ouganda IGAD 17.8 22.4 27.6 18.7 IGAD

KeyStats 2013 VII: IGAD
COUNTRY Non-electrical machinery Electrical machinery Transport
equipment Manufactures, n.e.s. PAYS
Djibouti 21.4 21.5 21.8 25.7 Djibouti Eritrea … … … … Erythrée Ethiopia 8.1 17.4 11.4 21.9 Ethiopie Kenya 3.2 10.8 6.2 14.8 Kenya Somalia … … … … Somalie South Sudan … … … … Soudan du Sud Sudan 7.7 15.9 13.5 20.6 Soudan Uganda 3.2 10.8 6.2 14.8 Ouganda IGAD 8.7 15.3 11.8 19.6 IGAD

KeyStats 2013 VII: IGAD
4 EXTERNAL SECTOR SECTEUR EXTERIEUR 4 4.13 Intra- and inter-regional trade
(in millions of US$) Commerce intra- et inter-régional
(en millions de $E.U.) 4.13
Exports to 2007 2008 2009 2010 2011 2012 Exportations vers Africa 4,274 8,152 15,549 29,656 56,563 107,883 Afrique AMU 32 62 118 225 429 818 UMA CEN-SAD 1,558 2,972 5,669 10,812 20,621 39,331 CEN-SAD COMESA 3,343 6,377 12,163 23,198 44,246 84,391 COMESA EAC 2,314 4,413 8,416 16,052 30,616 58,395 CAE ECCAS 706 1,346 2,567 4,896 9,339 17,812 CEEAC ECOWAS 103 196 375 715 1,363 2,600 CEDEAO IGAD 2,533 4,831 9,214 17,574 33,519 63,931 IGAD SADC 1,196 2,281 4,350 8,297 15,824 30,180 SADC
Imports from Importations de Africa 5,955 13,746 31,730 73,240 169,056 390,224 Afrique AMU 125 288 664 1,533 3,538 8,167 UMA CEN-SAD 4,561 10,528 24,302 56,094 129,479 298,869 CEN-SAD COMESA 5,154 11,897 27,462 63,390 146,319 337,740 COMESA EAC 2,306 5,323 12,286 28,359 65,460 151,098 CAE ECCAS 39 91 209 483 1,114 2,571 CEEAC ECOWAS 30 69 160 369 852 1,966 CEDEAO IGAD 3,250 7,502 17,316 39,970 92,260 212,959 IGAD SADC 2,287 5,280 12,188 28,132 64,940 149,908 SADC

VIII SADC
The South African Development Community (SADC) was created in 1992 and currently consists of
15 Member States. Its main objective is to promote sustainable
development through economic, political, cultural and social
integration, and to ensure peace and security within the region.
La Communauté de Développement de l’Afrique Australe (SADC) fut créée en
1992 et compte actuellement avec 15 Etats Membres. Son objectif principal est de
promouvoir le développement durable a travers l’intégration économique, politique, culturelle et sociale, et d’assurer la paix et
la sécurité dans la région.

KeyStats 2013 VIII: SADC
0 POPULATION POPULATION 0 0.1 Total population
(in millions) Population totale
(en millions) 0.1
COUNTRY 2007 2008 2009 2010 2011 2012 PAYS Angola 16.3 16.4 16.9 17.4 18.0 18.6 Angola Botswana 1.9 1.9 2.0 2.0 2.0 2.1 Botswana DR Congo 63.3 65.2 67.2 69.2 71.3 73.4 RD Congo Lesotho 1.9 1.9 1.9 1.9 1.9 1.9 Lesotho Madagascar 18.6 19.1 19.6 20.1 20.7 21.3 Madagascar Malawi 12.9 13.1 13.5 13.9 14.4 14.8 Malawi Mauritius 1.3 1.3 1.3 1.3 1.3 1.3 Maurice Mozambique 20.6 21.2 21.8 22.4 23.0 23.7 Mozambique Namibia 2.0 2.1 2.1 2.1 2.1 2.1 Namibie Seychelles 0.1 0.1 0.1 0.1 0.1 0.1 Seychelles South Africa 47.9 48.7 49.3 50.0 50.6 51.2 Afrique du Sud Swaziland 1.0 1.0 1.0 1.1 1.1 1.1 Swaziland Tanzania 39.4 40.7 41.9 43.2 44.5 44.9 Tanzanie Zambia 12.2 12.5 12.9 13.3 13.7 14.1 Zambie Zimbabwe 12.0 12.1 12.2 12.3 12.8 13.0 Zimbabwe SADC 251.4 257.2 263.7 270.4 277.4 283.7 SADC

KeyStats 2013 VIII: SADC
0 POPULATION POPULATION 0 0.2 Population structure
(in percentage of total population) Structure de la population
(en pourcentage de la population totale) 0.2
COUNTRY Female / Femmes Urban / Urbaine
PAYS 2010 2011 2012 2010 2011 2012
Angola 50.7 50.5 50.5 58.5 59.4 59.4 Angola Botswana 50.0 49.5 49.5 61.1 61.8 61.8 Botswana DR Congo 50.4 50.3 50.3 35.2 35.9 35.9 RD Congo Lesotho 52.7 50.8 50.7 24.8 25.3 27.6 Lesotho Madagascar 50.2 50.1 50.1 30.2 30.6 24.1 Madagascar Malawi 50.3 51.1 49.9 19.8 20.3 20.3 Malawi Mauritius 50.5 50.7 49.7 41.7 41.6 41.5 Maurice Mozambique 51.3 51.8 51.2 30.8 31.0 31.2 Mozambique Namibia 50.7 50.3 50.3 38.0 38.6 42.0 Namibie Seychelles 49.4 48.8 … … … … Seychelles South Africa 50.7 50.5 50.4 61.7 62.2 62.2 Afrique du Sud Swaziland 51.0 52.6 50.7 22.5 22.7 22.8 Swaziland Tanzania 50.1 50.0 50.0 26.3 26.7 26.9 Tanzanie Zambia 50.1 49.9 49.9 39.5 35.9 35.9 Zambie Zimbabwe 51.6 50.7 50.6 38.3 38.8 38.8 Zimbabwe SADC 50.6 50.5 50.3 37.7 37.9 37.9 SADC

KeyStats 2013 VIII: SADC
0 POPULATION POPULATION 0 0.2 Population structure (cont’d)
(in percentage of total population) Structure de la population (suite)
(en pourcentage de la population totale) 0.2
COUNTRY Eco. active population / Population éco. Active
(Thousands)
Economically active female / male ratio
PAYS Ratio femmes / Hommes économiquement. actifs
2010 2011 2012 2010 2011 2012 Angola 6 886 7 132 7374 45.9 45.9 45.8 Angola Botswana 711 1 054 1038 478 46.4 46.4 Botswana DR Congo 41 131 42 365 44 258 49.8 49.7 49.7 RD Congo Lesotho 1 129 1 129 1 129 45.6 45.5 45.3 Lesotho Madagascar 9 739 10 072 10 419 49.1 49.1 49.1 Madagascar Malawi 6 710 6 914 6 682 51.5 51.4 51.2 Malawi Mauritius 581 583 593 37.8 37.9 38.2 Maurice Mozambique 11 555 11 902 12 258 53.4 53.3 53.1 Mozambique Namibia 902 927 868 46.2 46.2 46.2 Namibie Seychelles … … … … … … Seychelles South Africa 18 055 18 337 18 064 42.8 42.8 42.7 Afrique du Sud Swaziland 327 411 422 39.7 39.6 39.5 Swaziland Tanzania 21 193 20 654 21 295 49.8 49.7 49.7 Tanzanie Zambia 5 284 5 416 5 845 45.8 45.7 45.7 Zambie Zimbabwe 6 246 6 420 6634 49.1 49.1 49 Zimbabwe SADC 130 449 133 316 136 879 77.46 46.59 46.54 SADC

KeyStats 2013 VIII: SADC
1 REAL SECTOR SECTEUR REEL 1 1.1 GDP at current
(in millions of US$) PIB à prix courant
(en millions de $ EU) 1.1
COUNTRY 2007 2008 2009 2010 2011 2012 PAYS Angola 61 810 84 068 67 481 81 234 104 259 115 253 Angola Botswana 11 009 11 157 10 044 13 734 15 378 14 447 Botswana DR Congo 10 070 11 872 11 153 13 218 16 038 18 795 RD Congo Lesotho 1 596 1 618 1 726 2 204 2 511 2 450 Lesotho Madagascar 7 342 9 413 8 545 8 739 10 025 9 881 Madagascar Malawi 3 648 5 468 6 145 6 786 7 290 5 653 Malawi Mauritius 7 778 9 672 8 840 9 685 11 225 11 497 Maurice Mozambique 8 124 9 944 9 967 9 580 12 276 15 100 Mozambique Namibia 8 800 8 840 8 897 11 031 12 492 12 823 Namibie Seychelles 1 033 969 849 973 1 060 1 033 Seychelles South Africa 285 805 274 186 285 213 363 192 402 247 384 780 Afrique du Sud Swaziland 3 052 3 006 3 189 3 890 4 090 4 017 Swaziland Tanzania 16 993 20 715 21 368 22 915 23 957 28 101 Tanzanie Zambia 11 541 14 639 12 806 16 191 19 205 21 511 Zambie Zimbabwe 6 249 5 701 6 133 7 433 8 865 9 800 Zimbabwe SADC 444 850 471 269 462 358 570 805 650 917 655 142 SADC
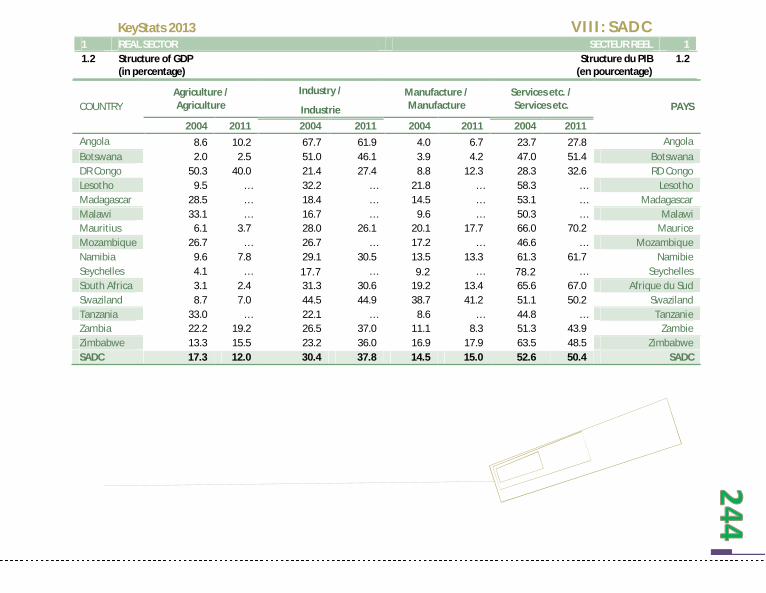
KeyStats 2013 VIII: SADC
1 REAL SECTOR SECTEUR REEL 1 1.2 Structure of GDP
(in percentage) Structure du PIB
(en pourcentage) 1.2
COUNTRY Agriculture / Agriculture
Industry / Manufacture / Manufacture
Services etc. / Services etc. PAYS Industrie
2004 2011 2004 2011 2004 2011 2004 2011 Angola 8.6 10.2 67.7 61.9 4.0 6.7 23.7 27.8 Angola Botswana 2.0 2.5 51.0 46.1 3.9 4.2 47.0 51.4 Botswana DR Congo 50.3 40.0 21.4 27.4 8.8 12.3 28.3 32.6 RD Congo Lesotho 9.5 … 32.2 … 21.8 … 58.3 … Lesotho Madagascar 28.5 … 18.4 … 14.5 … 53.1 … Madagascar Malawi 33.1 … 16.7 … 9.6 … 50.3 … Malawi Mauritius 6.1 3.7 28.0 26.1 20.1 17.7 66.0 70.2 Maurice Mozambique 26.7 … 26.7 … 17.2 … 46.6 … Mozambique Namibia 9.6 7.8 29.1 30.5 13.5 13.3 61.3 61.7 Namibie Seychelles 4.1 … 17.7 … 9.2 … 78.2 … Seychelles South Africa 3.1 2.4 31.3 30.6 19.2 13.4 65.6 67.0 Afrique du Sud Swaziland 8.7 7.0 44.5 44.9 38.7 41.2 51.1 50.2 Swaziland Tanzania 33.0 … 22.1 … 8.6 … 44.8 … Tanzanie Zambia 22.2 19.2 26.5 37.0 11.1 8.3 51.3 43.9 Zambie Zimbabwe 13.3 15.5 23.2 36.0 16.9 17.9 63.5 48.5 Zimbabwe SADC 17.3 12.0 30.4 37.8 14.5 15.0 52.6 50.4 SADC

KeyStats 2013 VIII: SADC
1 REAL SECTOR SECTEUR REEL 1 1.3 Real GDP Growth
(in percentage) Croissance réelle du PIB
(en pourcentage) 1.3
COUNTRY 2007 2008 2009 2010 2011 2012 PAYS Angola 23.2 13.8 2.4 3.5 3.9 8.8 Angola Botswana 8.7 3.9 -7.8 8.6 6.1 3.7 Botswana DR Congo 6.3 6.2 2.8 7.1 6.9 7.2 RD Congo Lesotho 4.7 5.4 2.9 5.6 4.3 4.0 Lesotho Madagascar 6.2 7.1 -4.1 -0.5 0.5 1.9 Madagascar Malawi 9.6 8.3 8.9 6.7 4.3 1.9 Malawi Mauritius 5.9 5.5 3.0 4.1 3.8 3.2 Maurice Mozambique 7.3 6.8 6.3 6.6 7.3 7.4 Mozambique Namibia 5.4 3.4 -1.1 6.0 4.9 5.0 Namibie Seychelles 10.1 -1.9 -0.2 5.6 5.0 2.6 Seychelles South Africa 5.5 3.6 -1.5 3.1 3.5 2.5 Afrique du Sud Swaziland 3.5 2.4 1.2 1.9 1.3 1.3 Swaziland Tanzania 7.1 7.4 6.0 7.0 6.4 6.9 Tanzanie Zambia 6.2 5.7 6.4 7.6 6.8 7.3 Zambie Zimbabwe -3.3 -4.7 12.7 9.6 10.3 4.4 Zimbabwe SADC 7.1 4.9 2.5 5.5 5.0 4.5 SADC

KeyStats 2013 VIII: SADC
1 REAL SECTOR SECTEUR REEL 1 1.4 Per capita GDP and GNI
(in US$) PIB et RNB par habitant
(en $ EU) 1.4
COUNTRY Current prices / Prix courant PPP / PPA GNI / RNB
PAYS 2010 2011 2012 2010 2011 2012 2010 2011 2012
Angola 4661 5795 6204 5 749 5 924 … 3960 4060 … Angola Botswana 6910 7595 7003 15 184 16 105 … … … … Botswana DR Congo 191 225 256 329 349 … 180 190 … RD Congo Lesotho 1165 1324 1287 1 803 1 918 … 1100 1220 … Lesotho Madagascar 434 484 465 932 944 … 430 430 … Madagascar Malawi 487 507 381 821 851 … 330 340 … Malawi
Mauritius 7561 8728 8905 14 152 14 962 … 7780 8240 … Maurice
Mozambique 427 533 637 1 937 2 008 … 440 470 … Mozambique Namibia 5148 5934 6003 7 016 7 451 … 4250 4700 … Namibie Seychelles 10837 12119 11701 23891 25357 … 10460 11130 … Syechelles South Africa 7265 7952 7509 10 541 10 970 … 6090 6960 … Afrique du Sud
Swaziland 3687 3834 3719 5 156 5 301 … 2930 3300 … Swaziland Tanzania 531 539 625 1 511 1 610 … 530 540 … Tanzanie Zambia 1217 1400 1521 1 517 1 611 … 1070 1160 … Zambie Zimbabwe 603 695 755 461 515 … 480 640 … Zimbabwe SADC 51 122 57 662 56 973 90 999 95 875 … 40 030 43 380 … SADC

KeyStats 2013 VIII: SADC
1 REAL SECTOR SECTEUR REEL 1 1.5a Inflation
(in percentage) Inflation
(en pourcentage) 1.5a
COUNTRY 2007 2008 2009 2010 2011 2012 PAYS Angola 12.3 12.4 13.7 14.4 13.5 10.3 Angola Botswana 7.1 12.6 8.1 6.9 8.5 7.5 Botswana DR Congo 16.7 18.0 46.1 23.5 15.6 9.6 RD Congo Lesotho 8.0 10.7 7.2 3.3 5.0 6.1 Lesotho Madagascar 10.4 9.2 9.0 9.2 9.5 6.2 Madagascar Malawi 8.0 8.7 8.4 7.4 7.6 21.3 Malawi Mauritius 8.8 9.7 2.5 2.9 6.5 3.9 Maurice Mozambique 9.2 14.5 3.0 13.0 11.2 2.6 Mozambique Namibia 6.7 10.4 8.8 4.4 5.1 6.5 Namibie Seychelles 5.3 37.0 31.7 -2.4 2.6 7.1 Seychelles South Africa 7.1 11.5 7.1 4.3 5.0 5.6 Afrique du Sud Swaziland 8.1 12.6 7.6 4.5 6.1 8.9 Swaziland Tanzania 7.0 10.3 12.1 5.5 12.6 16.0 Tanzanie Zambia 10.7 12.4 13.4 8.5 6.4 6.6 Zambie Zimbabwe ... ... -7.9 3.1 3.5 2.9 Zimbabwe CPI National
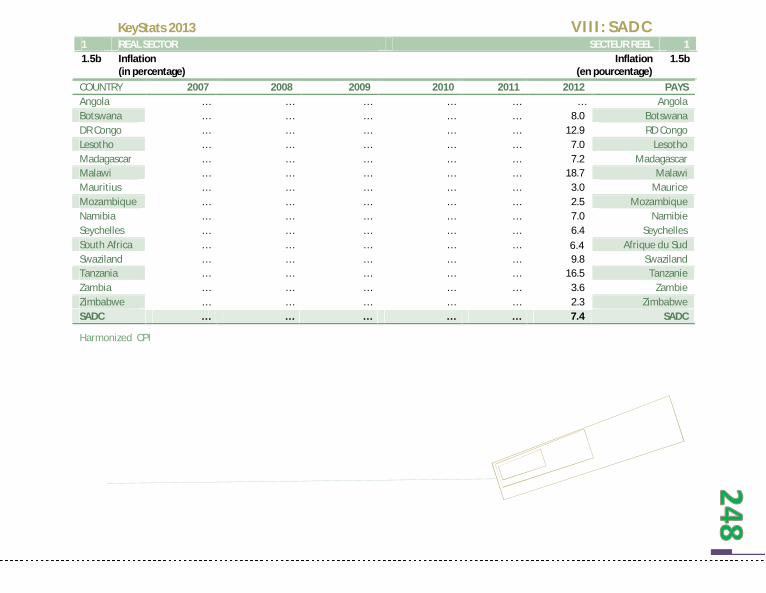
KeyStats 2013 VIII: SADC
1 REAL SECTOR SECTEUR REEL 1 1.5b Inflation
(in percentage) Inflation
(en pourcentage) 1.5b
COUNTRY 2007 2008 2009 2010 2011 2012 PAYS Angola … … … … … … Angola Botswana … … … … … 8.0 Botswana DR Congo … … … … … 12.9 RD Congo Lesotho … … … … … 7.0 Lesotho Madagascar … … … … … 7.2 Madagascar Malawi … … … … … 18.7 Malawi Mauritius … … … … … 3.0 Maurice Mozambique … … … … … 2.5 Mozambique Namibia … … … … … 7.0 Namibie Seychelles … … … … … 6.4 Seychelles South Africa … … … … … 6.4 Afrique du Sud Swaziland … … … … … 9.8 Swaziland Tanzania … … … … … 16.5 Tanzanie Zambia … … … … … 3.6 Zambie Zimbabwe … … … … … 2.3 Zimbabwe SADC … … … … … 7.4 SADC
Harmonized CPI

KeyStats 2013 VIII: SADC
2 GOVERNMENT FINANCE FINANCES PUBLIQUES 2 2.1 Total revenue plus grants
(in percentage of GDP) Recettes totales plus dons
(en pourcentage du PIB) 2.1
COUNTRY 2005 2008 2009 2010 2011 2012 PAYS Angola 44.3 50.9 30.9 43.5 42.2 … Angola Botswana 34.6 31.7 32.9 27.1 25.6 … Botswana DR Congo 33.4 31.5 34.7 25.3 24.3 … RD Congo Lesotho 51.7 60.3 56.5 44.6 52.1 … Lesotho Madagascar 16.7 17.6 12.3 13.3 11.8 … Madagascar Malawi 40.3 39.9 34.8 48.0 … … Malawi Mauritius 21.1 21.4 24.8 23.7 … … Maurice Mozambique 20.0 25.3 27.3 20.6 24.2 … Mozambique Namibia 24.7 28.4 31.2 29.5 24.8 … Namibie Seychelles 42.7 32.0 36.6 35.2 40.6 … Seychelles South Africa 30.3 32.8 34.4 30.7 30.8 … Afrique du Sud Swaziland 33.5 38.5 38.1 24.7 25.1 … Swaziland Tanzania 17.5 21.0 20.0 19.2 19.6 … Tanzanie Zambia 30.7 26.0 21.7 19.8 22.4 … Zambie Zimbabwe … … … … … … Zimbabwe
SADC 31.5 32.7 31.2 28.9 28.6 … SADC

KeyStats 2013 VIII: SADC
2 GOVERNMENT FINANCE FINANCES PUBLIQUES 2 2.1b Total revenue
(in percentage of GDP) Recettes totales
(en pourcentage du PIB) 2.1b
COUNTRY 2005 2008 2009 2010 2011 2012 PAYS Angola 40.7 50.5 34.5 43.5 46.3 48.8 Angola Botswana 34.3 31.4 37.1 29.7 31.8 29.6 Botswana DR Congo 16.4 20.3 22.7 20.5 19.5 19.6 RD Congo Lesotho 52.5 66.2 57.0 59.9 52.5 52.2 Lesotho Madagascar 12.3 16.6 12.3 13.3 13.2 12.2 Madagascar Malawi 26.0 29.9 31.9 33.6 30.9 22.2 Malawi Mauritius 21.2 19.5 22.1 21.9 21.3 21.5 Maurice Mozambique 20.0 25.5 27.1 29.7 30.1 28.0 Mozambique Namibia 24.0 25.1 30.9 29.5 28.1 30.8 Namibie Seychelles 43.0 36.4 37.2 35.4 38.2 41.9 Seychelles South Africa 22.1 24.5 28.5 24.9 25.6 28.1 Afrique du Sud Swaziland 35.4 33.4 35.1 34.2 24.8 38.9 Swaziland Tanzania 17.3 21.0 20.2 19.2 21.2 48.8 Tanzanie Zambia 23.3 22.3 20.3 19.6 21.9 21.6 Zambie Zimbabwe ... … 15.9 17.8 32.9 32.6 Zimbabwe SADC 27.8 30.2 28.9 28.8 29.2 31.8 SADC

KeyStats 2013 VIII: SADC
2 GOVERNMENT FINANCE FINANCES PUBLIQUES 2 2.2 Total expenditure
(in percentage of GDP) Dépenses totales
(en pourcentage du PIB) 2.2
COUNTRY 2005 2008 2009 2010 2011 2012 PAYS Angola 32.2 41.6 39.5 36.7 37.3 40.9 Angola Botswana 33.2 27.2 42.8 39.1 40.2 30.7 Botswana DR Congo 19.5 19.0 21.8 22.1 21.4 23.1 RD Congo Lesotho 44.4 55.7 55.2 62.6 57.5 62.6 Lesotho Madagascar 21.0 18.5 14.8 14.1 14.9 15.3 Madagascar Malawi 29.8 34.0 37.1 34.4 33.6 29.3 Malawi Mauritius 23.6 22.7 28.0 28.3 27.7 24.4 Maurice Mozambique 23.5 28.0 32.6 33.6 34.4 36.2 Mozambique Namibia 26.9 24.3 29.2 30.8 33.8 39.8 Namibie Seychelles 36.0 39.8 32.0 32.8 35.7 39.3 Seychelles South Africa 23.4 23.7 29.4 30.7 29.5 32.8 Afrique du Sud Swaziland 37.5 30.9 37.0 40.3 38.3 35.9 Swaziland Tanzania 19.8 21.1 24.1 25.9 27.2 57.8 Tanzanie Zambia 26.0 24.6 22.4 22.7 25.2 25.8 Zambie Zimbabwe ... … 17.5 23.2 36.4 36.6 Zimbabwe SADC 28.33 29.36 30.89 31.82 32.87 35.37 SADC

KeyStats 2013 VIII: SADC
2 GOVERNMENT FINANCE FINANCES PUBLIQUES 2 2.3 Fiscal balance
(Surplus+ / Deficit-) (in percentage of GDP)
Solde budgétaire (Excédent+ / Déficit-)
(en pourcentage du PIB)
2.2
COUNTRY 2005 2008 2009 2010 2011 2012 PAYS Angola 9.3 8.9 -8.6 6.8 8.9 7.8 Angola Botswana 0.8 1.4 -9.2 -11.1 -6.8 -1.2 Botswana DR Congo -1.3 -0.5 0.5 1.2 3.3 -3.5 RD Congo Lesotho 8.2 10.6 1.8 -2.7 -5.0 -10.4 Lesotho Madagascar -3.7 -2.0 -2.6 -0.9 -1.7 -3.1 Madagascar Malawi 10.0 4.1 1.7 13.2 -2.8 -7.2 Malawi Mauritius -2.0 0.8 0.5 -2.4 0.0 -2.9 Maurice Mozambique -2.1 -1.8 -3.5 -11.4 -4.3 -8.2 Mozambique Namibia -2.2 5.5 3.3 -0.5 -6.4 -9.0 Namibie Seychelles 5.8 2.2 2.6 -0.9 2.5 2.6 Seychelles South Africa -3.0 0.1 -1.3 -5.2 -4.1 -4.7 Afrique du Sud Swaziland -1.8 -0.8 -3.0 -14.0 -11.1 3.0 Swaziland Tanzania -2.8 0.0 -4.5 -6.5 -6.0 -9.1 Tanzanie Zambia 3.1 1.8 0.3 -2.5 -1.5 -4.2 Zambie Zimbabwe ... … -1.6 -5.4 -3.4 -4.0 Zimbabwe SADC 1.30 2.16 -1.56 -2.80 -2.56 -3.61 SADC
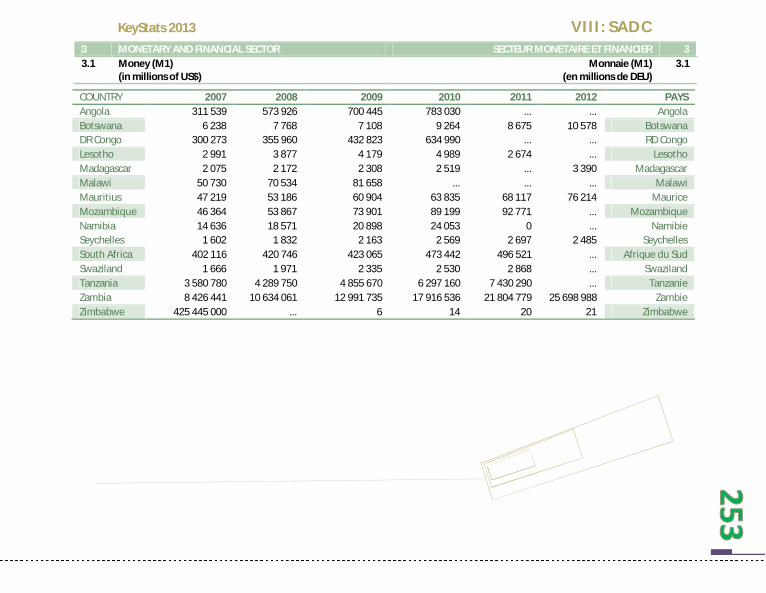
KeyStats 2013 VIII: SADC
3 MONETARY AND FINANCIAL SECTOR SECTEUR MONETAIRE ET FINANCIER 3 3.1 Money (M1)
(in millions of US$) Monnaie (M1)
(en millions de DEU) 3.1
COUNTRY 2007 2008 2009 2010 2011 2012 PAYS Angola 311 539 573 926 700 445 783 030 ... ... Angola Botswana 6 238 7 768 7 108 9 264 8 675 10 578 Botswana DR Congo 300 273 355 960 432 823 634 990 ... ... RD Congo Lesotho 2 991 3 877 4 179 4 989 2 674 ... Lesotho Madagascar 2 075 2 172 2 308 2 519 ... 3 390 Madagascar Malawi 50 730 70 534 81 658 ... ... ... Malawi Mauritius 47 219 53 186 60 904 63 835 68 117 76 214 Maurice Mozambique 46 364 53 867 73 901 89 199 92 771 ... Mozambique Namibia 14 636 18 571 20 898 24 053 0 ... Namibie Seychelles 1 602 1 832 2 163 2 569 2 697 2 485 Seychelles South Africa 402 116 420 746 423 065 473 442 496 521 ... Afrique du Sud Swaziland 1 666 1 971 2 335 2 530 2 868 ... Swaziland Tanzania 3 580 780 4 289 750 4 855 670 6 297 160 7 430 290 ... Tanzanie Zambia 8 426 441 10 634 061 12 991 735 17 916 536 21 804 779 25 698 988 Zambie Zimbabwe 425 445 000 ... 6 14 20 21 Zimbabwe

KeyStats 2013 VIII: SADC
3 MONETARY AND FINANCIAL SECTOR SECTEUR MONETAIRE ET FINANCIER 3 3.2 Money plus quasi-money (M2)
(in % of GDP) Monnaie plus quasi-monnaie (M2)
(en % du PIB) 3.2
COUNTRY 2007 2008 2009 2010 2011 2012 PAYS Angola 18.39 22.44 38.47 34.42 35.85 35.49 Angola Botswana 48.09 51.71 53.48 45.40 40.81 44.45 Botswana DR Congo 12.28 15.08 16.37 16.36 16.03 16.93 RD Congo Lesotho 36.26 36.25 39.50 40.77 36.44 35.58 Lesotho Madagascar 22.58 21.83 23.21 23.18 24.89 24.44 Madagascar Malawi 16.82 23.24 24.51 28.52 35.73 36.38 Malawi Mauritius 98.08 100.00 99.46 100.35 99.02 100.44 Maurice Mozambique 106.92 107.87 107.34 110.30 112.66 113.02 Mozambique Namibia 32.31 33.58 40.22 42.36 39.36 44.94 Namibie Seychelles 66.96 64.90 55.50 61.94 57.90 52.47 Seychelles South Africa 82.75 84.83 80.95 78.33 77.30 75.18 Afrique du Sud Swaziland 24.50 24.38 28.79 30.80 30.46 31.42 Swaziland Tanzania 29.71 30.10 31.12 34.10 34.69 32.94 Tanzanie Zambia 22.51 23.37 21.35 23.07 23.36 24.15 Zambie Zimbabwe … … … … … … Zimbabwe SADC 44.16 45.68 47.16 47.85 47.46 47.70 SADC

KeyStats 2013 VIII: SADC
3 MONETARY AND FINANCIAL SECTOR SECTEUR MONETAIRE ET FINANCIER 3 3.3 Domestic credit provided by banking sector
(in percentage of GDP) Crédit intérieur provenant du secteur bancaire
(en pourcentage du PIB) 3.3
COUNTRY provided by banking sector / provenant du
secteur bancaire to private sector /
PAYS au secteur privé 2009 2010 2011 2009 2010 2011
Angola 28.85 23.17 17.87 21.15 20.87 21.10 Angola Botswana -0.99 9.32 8.01 29.39 25.29 27.52 Botswana DR Congo 7.27 0.98 13.05 8.82 6.14 6.64 RD Congo Lesotho -14.73 -6.27 0.70 12.78 13.60 14.66 Lesotho Madagascar 11.75 10.49 11.80 11.46 11.55 10.99 Madagascar Malawi 32.04 32.03 38.00 13.38 17.83 19.84 Malawi Mauritius 106.78 110.93 105.76 82.74 87.86 91.50 Maurice Mozambique 22.58 25.63 25.35 24.79 26.64 24.33 Mozambique Namibia 45.97 52.94 50.59 48.74 50.10 48.49 Namibie Seychelles 44.32 51.90 45.77 22.66 27.65 25.96 Seychelles South Africa 184.22 182.44 … … … … Afrique du Sud Swaziland 9.09 17.24 … 23.33 23.00 27.18 Swaziland Tanzania 18.15 21.05 26.58 15.33 16.21 17.77 Tanzanie Zambia 18.53 18.91 18.05 13.27 15.65 17.88 Zambie Zimbabwe … … … 11.98 11.51 12.27 Zimbabwe SADC 36.70 39.34 30.13 24.27 25.28 26.15 SADC

KeyStats 2013 VIII: SADC
3 MONETARY AND FINANCIAL SECTOR SECTEUR MONETAIRE ET FINANCIER 3 3.4 Interest rates
(in percentage) Taux d’intérêts
(en pourcentage) 3.4
COUNTRY Deposit rate / Taux de dépôts Discount rate / Taux d’escompte
PAYS 2009 2010 2011 2009 2010 2011
Angola 7.59 12.76 6.31 8.09 9.79 12.45 Angola Botswana 7.47 5.60 5.15 6.29 5.86 5.85 Botswana DR Congo 16.08 16.77 13.36 49.34 39.75 30.40 RD Congo Lesotho 4.85 3.68 2.70 8.15 7.54 7.73 Lesotho Madagascar 11.50 10.50 10.65 33.50 38.50 41.85 Madagascar Malawi 3.50 3.60 4.11 21.75 21.02 19.64 Malawi Mauritius 8.45 8.35 7.11 0.80 0.53 1.81 Maurice Mozambique 9.52 9.68 12.98 6.15 6.58 6.12 Mozambique Namibia 6.24 5.00 4.28 4.88 4.72 4.45 Namibie Seychelles 9.77 2.86 2.08 22.8 27.9 9.11 Seychelles South Africa 8.54 6.47 5.67 3.17 3.37 3.33 Afrique du Sud Swaziland 5.40 3.85 2.85 5.97 5.90 6.15 Swaziland Tanzania 7.97 6.57 6.78 7.06 7.98 8.18 Tanzanie Zambia 7.09 7.40 7.02 14.97 13.52 11.81 Zambie Zimbabwe … … … 13.78 13.78 … Zimbabwe SADC 8.14 7.36 6.50 13.78 13.78 12.06 SADC

KeyStats 2013 VIII: SADC
4 EXTERNAL SECTOR SECTEUR EXTERIEUR 4 4.1 Imports
(in % of GDP) Importations
(en % du PIB) 4.1
COUNTRY 2007 2008 2009 2010 2011 2012 PAYS Angola 43.52 51.23 55.40 42.95 43.31 43.34 Angola Botswana 40.57 46.42 48.77 42.86 47.89 50.33 Botswana DR Congo 68.55 76.39 60.91 77.94 78.01 63.79 RD Congo Lesotho 118.00 120.53 112.37 110.55 105.90 108.02 Lesotho Madagascar 52.07 57.02 52.20 36.99 37.11 … Madagascar Malawi 40.26 48.91 38.96 44.94 39.50 … Malawi Mauritius 67.17 66.10 58.32 63.77 66.42 66.62 Maurice Mozambique 45.15 46.35 43.31 44.68 46.24 45.32 Mozambique Namibia 52.04 54.63 56.10 54.99 52.24 48.67 Namibie Seychelles 82.70 91.88 93.57 101.15 99.09 … Seychelles South Africa 34.21 38.94 28.19 27.56 29.90 31.31 Afrique du Sud Swaziland 76.96 68.68 75.41 71.34 74.69 71.17 Swaziland Tanzania 41.10 38.79 35.15 38.57 50.22 47.90 Tanzanie Zambia 39.19 37.27 32.16 34.89 37.03 38.93 Zambie Zimbabwe 46.39 68.05 59.70 78.48 87.84 74.45 Zimbabwe SADC 56.53 60.75 56.70 58.11 59.69 57.49 SADC

KeyStats 2013 VIII: SADC
4 EXTERNAL SECTOR SECTEUR EXTERIEUR 4 4.2 Exports
(in % of GDP) Exportations
(en % du PIB) 4.2
COUNTRY 2007 2008 2009 2010 2011 2012 PAYS Angola 76.40 78.10 55.06 62.41 64.98 62.61 Angola Botswana 54.52 50.95 37.02 35.38 42.28 44.78 Botswana DR Congo 65.16 61.30 45.21 68.34 68.28 57.18 RD Congo Lesotho 52.10 56.02 45.59 44.04 46.78 46.52 Lesotho Madagascar 30.32 26.59 28.48 23.76 26.06 … Madagascar Malawi 28.33 28.19 24.65 29.38 29.59 … Malawi Mauritius 57.86 52.93 48.96 52.49 53.47 54.75 Maurice Mozambique 35.35 32.27 24.79 26.10 29.43 28.52 Mozambique Namibia 50.73 53.16 47.30 47.63 45.17 42.57 Namibie Seychelles 35.19 44.49 46.30 40.46 45.61 Seychelles South Africa 31.48 35.88 27.31 27.36 29.28 28.26 Afrique du Sud Swaziland 75.67 59.36 58.84 55.89 66.57 59.30 Swaziland Tanzania 24.24 25.14 23.23 27.83 31.06 30.50 Tanzanie Zambia 40.91 35.37 35.01 46.78 46.04 47.50 Zambie Zimbabwe 37.79 41.47 29.28 47.64 49.41 50.72 Zimbabwe SADC 46.40 45.42 38.47 42.37 44.93 46.10 SADC

KeyStats 2013 VIII: SADC
4 EXTERNAL SECTOR SECTEUR EXTERIEUR 4 4.3 Trade balance
(in % of GDP) Solde commercial
(en % du PIB) 4.3
COUNTRY 2007 2008 2009 2010 2011 2012 PAYS Angola 50.8 51.0 24.1 33.4 37.0 40.3 Angola Botswana 13.9 3.2 -5.9 -2.0 -1.7 3.0 Botswana DR Congo 39.7 49.7 36.5 42.3 42.5 41.1 RD Congo Lesotho -50.6 -40.3 -48.6 -42.2 -39.7 -39.4 Lesotho Madagascar -13.6 -20.2 -19.3 -17.4 -17.0 -11.4 Madagascar Malawi -24.7 -18.6 -17.1 -16.5 -17.3 -7.7 Malawi Mauritius -18.0 -20.6 -17.4 -17.6 -18.1 -23.9 Maurice Mozambique -8.4 -11.6 -13.0 -10.6 -9.8 -13.2 Mozambique Namibia -2.3 0.3 -8.4 -8.5 -9.2 -9.4 Namibie Seychelles -41.0 -52.7 -38.2 -23.5 -26.4 -44.1 Seychelles South Africa -2.0 -1.6 0.1 0.8 0.3 0.3 Afrique du Sud Swaziland -3.3 -0.3 -4.1 -8.1 -6.1 -6.9 Swaziland Tanzania -15.7 -16.6 -11.9 -10.7 -9.8 -13.6 Tanzanie Zambia 7.8 2.8 7.1 13.7 16.6 6.5 Zambie Zimbabwe -5.2 -18.6 -28.8 -26.0 -27.2 -33.6 Zimbabwe SADC -4.84 -6.28 -9.66 -6.20 -5.73 -7.47 SADC

KeyStats 2013 VIII: SADC
4 EXTERNAL SECTOR SECTEUR EXTERIEUR 4 4.4 Current account balance
(in millions of US$) Solde du compte courant
(en millions de $ EU) 4.4
COUNTRY 2007 2008 2009 2010 2011 2012 PAYS Angola 10581 7194 -7572 7421 13085 11346 Angola Botswana 1918 1138 -301 147 391 866 Botswana DR Congo -388 -1049 -1123 -2042 -1814 -2192 RD Congo Lesotho -77 29 -39 -452 -555 -345 Lesotho Madagascar -1069 -2197 -1809 -84.6 -680 -782 Madagascar Malawi -412 -663 -549 -829 -330 -155 Malawi Mauritius -423 -971 -652 -1006 -1422 -1149 Maurice Mozambique -785 -1179 -1220 -1107 -3241 -3813 Mozambique Namibia 896 381 86 506 -218 -196 Namibie Seychelles -310 -332 -229 -337 -239 -226 Seychelles South Africa -19924 -19617 -11504 -10237 -13620 -24068 Afrique du Sud Swaziland -140 -231 -378 -391 -341 11 Swaziland Tanzania -1578 -2456 -1657 -1875 -3238 -4462 Tanzanie Zambia -816 -1120 463 992 288 -711 Zambie Zimbabwe -242 -780 -928 -2339 -3249 -2366 Zimbabwe SADC -12 769 -21 853 -27 412 -11 633 -15 183 -28 242 SADC
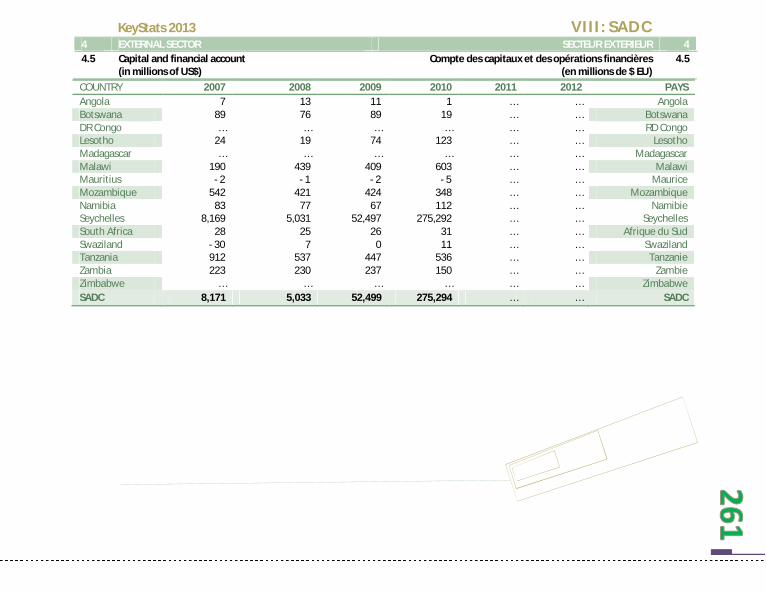
KeyStats 2013 VIII: SADC
4 EXTERNAL SECTOR SECTEUR EXTERIEUR 4 4.5 Capital and financial account
(in millions of US$) Compte des capitaux et des opérations financières
(en millions de $ EU) 4.5
COUNTRY 2007 2008 2009 2010 2011 2012 PAYS Angola 7 13 11 1 … … Angola Botswana 89 76 89 19 … … Botswana DR Congo … … … … … … RD Congo Lesotho 24 19 74 123 … … Lesotho Madagascar … … … … … … Madagascar Malawi 190 439 409 603 … … Malawi Mauritius - 2 - 1 - 2 - 5 … … Maurice Mozambique 542 421 424 348 … … Mozambique Namibia 83 77 67 112 … … Namibie Seychelles 8,169 5,031 52,497 275,292 … … Seychelles South Africa 28 25 26 31 … … Afrique du Sud Swaziland - 30 7 0 11 … … Swaziland Tanzania 912 537 447 536 … … Tanzanie Zambia 223 230 237 150 … … Zambie Zimbabwe … … … … … … Zimbabwe SADC 8,171 5,033 52,499 275,294 … … SADC

KeyStats 2013 VIII: SADC
4 EXTERNAL SECTOR SECTEUR EXTERIEUR 4 4.6 International financial flows
(in millions of US$) Flux financiers internationaux
(en millions de $ EU) 4.6
COUNTRY Official development assistance (net) / Appui
public au développement (net) Net foreign direct investment /
PAYS Investissement direct étranger net 2009 2010 2011 2009 2010 2011
Angola 239 238 200 2198 -4567 n.a Angola Botswana 279 156 121 925 556 585 Botswana DR Congo 2357 n.a n.a 629 2932 1674 RD Congo Lesotho 122 256 259 101 116 135 Lesotho Madagascar 444 470 441 1066 860 n.a Madagascar Malawi 771 1023 804 134 132 200 Malawi Mauritius 155 125 183 211 12404 13405 Maurice Mozambique 2012 1952 2071 890 790 2091 Mozambique Namibia 326 256 274 557 713 904 Namibie Seychelles 23 56 21 113 159 128 Seychelles South Africa 1075 1031 1398 4130 1304 6450 Afrique du Sud Swaziland 56 91 125 59 132 n.a Swaziland Tanzania 2933 2958 2436 645 433 n.a Tanzanie Zambia 1267 914 1046 425 634 832 Zambie Zimbabwe 736 732 716 125 181 125 Zimbabwe SADC 12 795 10 260 10 094 12208 16780 26528 SADC

KeyStats 2013 VIII: SADC
4 EXTERNAL SECTOR SECTEUR EXTERIEUR 4 4.7 Total international reserves
(in millions of US$) Réserves internationales totales
(en millions de $ EU) 4.7
COUNTRY 2007 2008 2009 2010 2011 2012 PAYS Angola 11191 17499 12621 17327 27684 33414 Angola Botswana 6195 5920 5817 8126 8824 7944 Botswana DR Congo 114 50 129 1300 1273 1690 RD Congo Lesotho 1178 1358 1264 1362 1344 1350 Lesotho Madagascar 847 982 1135 1172 1279 1191 Madagascar Malawi 138 158 102 279 190 219 Malawi Mauritius 1821 1786 2303 2602 2778 3046 Maurice Mozambique 1445 1578 1929 2002 2304 2605 Mozambique Namibia 952 1278 1846 1495 1762 1705 Namibie Seychelles 26 73 195 255 279 307 Seychelles South Africa 32979 34099 39706 43834 48860 50735 Afrique du Sud Swaziland 774 752 959 756 601 741 Swaziland Tanzania 2724 2873 3553 3948 3745 4069 Tanzanie Zambia 690 1085 1924 2119 2347 3069 Zambie Zimbabwe 146 76 822 732 659 574 Zimbabwe SADC 61074 69491 73484 86576 103269 112086 SADC

KeyStats 2013 VIII: SADC
4 EXTERNAL SECTOR SECTEUR EXTERIEUR 4 4.8 Total international reserves / average monthly imports
(ratio) Réserves internationales totales / Importations moyennes
mensuelles (ratio) 4.8
COUNTRY 2007 2008 2009 2010 2011 2012 PAYS Angola 12.11 12.64 6.94 13.06 … … Angola Botswana 28.95 21.02 22.27 17.23 … … Botswana DR Congo 0.58 0.20 2.64 … … … RD Congo Lesotho … … … … … … Lesotho Madagascar 20.96 15.36 21.58 27.79 … … Madagascar Malawi 2.33 1.47 0.99 1.70 … … Malawi Mauritius 5.50 4.49 7.02 6.64 … … Maurice Mozambique 5.69 4.72 6.69 7.27 … … Mozambique Namibia 2.67 0.33 … … … … Namibie Seychelles … … … … … … Seychelles South Africa 3.84 4.19 6.63 5.72 … … Afrique du Sud Swaziland 6.49 7.02 6.42 4.64 … … Swaziland Tanzania 5.85 4.25 6.38 5.85 … … Tanzanie Zambia 0.82 0.70 1.04 … … … Zambie Zimbabwe … … … … … … Zimbabwe SADC 7.98 6.37 8.05 9.99 … … SADC

KeyStats 2013 VIII: SADC
4 EXTERNAL SECTOR SECTEUR EXTERIEUR 4 4.9 Exchange rate
(National currency / US$) Taux de change
(Monnaie nationale / $ EU) 4.9
COUNTRY Average Exchange Rate (Nati. Currency per us$
Taux de change (moyen) (monnaie nat. par dollars) PAYS
2007 2008 2009 2010 2011 2012 Angola 75.0 75.1 88.7 93.4 93.8 95.4 Angola Botswana 6.1 6.8 7.2 6.8 6.8 7.6 Botswana DR Congo 516.7 561.1 806.5 905.9 919.4 919.7 RD Congo Lesotho 7.1 8.3 8.4 7.3 7.3 8.2 Lesotho Madagascar 93.6 85.3 97.7 104.3 101.1 109.6 Madagascar Malawi 140.0 140.5 141.3 150.5 156.5 249.1 Malawi Mauritius 31.4 28.4 31.9 30.9 28.8 29.9 Maurice Mozambique 25.6 24.2 26.7 33.0 29.1 28.2 Mozambique Namibia 7.2 8.4 8.4 7.6 7.2 8.2 Namibie Seychelles 6.7 9.4 13.6 12.1 12.4 13.7 Seychelles South Africa 7.1 8.3 8.4 7.3 7.3 8.2 Afrique du Sud Swaziland 7.1 8.3 8.4 7.3 7.3 8.2 Swaziland Tanzania 110.8 129.9 133.2 115.1 114.2 129.1 Tanzanie Zambia 89.7 83.9 113.1 107.5 108.9 115.3 Zambie Zimbabwe 43266 … … 1.0 1.0 1.0 Zimbabwe

KeyStats 2013 VIII: SADC
4 EXTERNAL SECTOR SECTEUR EXTERIEUR 4 4.10 Total public external debt
(in percentage of GDP) Dette publique extérieure totale
(en pourcentage du PIB) 4.10
COUNTRY 2007 2008 2009 2010 2011 2012 PAYS Angola 15.8 16.5 20.0 18.2 14.4 18.8 Angola Botswana 10.2 8.5 23.4 23.3 22.7 21.1 Botswana DR Congo 96.7 79.9 75.4 73.1 74.0 53.2 RD Congo Lesotho 42.6 42.2 42.7 38.4 36.2 33.1 Lesotho Madagascar 25.9 24.2 27.0 29.2 26.3 49.4 Madagascar Malawi 16.7 17.5 17.0 16.4 16.0 20.8 Malawi Mauritius 10.3 8.8 10.6 11.9 12.8 15.2 Maurice Mozambique 81.0 65.3 64.4 56.7 49.4 51.2 Mozambique Namibia 25.7 22.3 23.9 18.3 16.3 37.4 Namibie Seychelles 68.4 78.9 87.0 45.1 45.2 58.1 Seychelles South Africa 26.3 26.5 27.8 27.1 27.0 34.4 Afrique du Sud Swaziland 17.4 17.0 13.5 11.3 15.1 11.2 Swaziland Tanzania 27.7 28.2 32.8 35.7 38.3 33.3 Tanzanie Zambia 10.3 38.5 50.0 36.3 34.3 29.9 Zambie Zimbabwe 92.9 121.8 135.0 141.8 142.2 146.2 Zimbabwe SADC 37.9 39.7 43.4 38.8 38.0 40.9 SADC

KeyStats 2013 VIII: SADC
4 EXTERNAL SECTOR SECTEUR EXTERIEUR 4 4.11 Debt service
(in percentage of exports) Service de la dette
(en pourcentage des exportations) 4.11
COUNTRY 2007 2008 2009 2010 2011 2012 PAYS Angola 9.9 4.3 12.4 7.5 6.2 7.7 Angola Botswana 16.7 4.2 6.4 4.0 6.3 5.3 Botswana DR Congo 9.4 8.9 16.9 10.7 5.9 7.5 RD Congo Lesotho 2.7 3.8 5.3 3.8 4.2 3.8 Lesotho Madagascar 4.4 5.2 7.0 7.2 7.0 8.9 Madagascar Malawi 45.4 1.2 1.3 1.3 2.4 2.3 Malawi Mauritius 5.4 3.5 3.1 2.6 2.9 4.1 Maurice Mozambique 8.5 19.2 17.8 15.1 10.6 15.8 Mozambique Namibia 30.9 24.7 15.3 7.6 7.4 11.0 Namibie Seychelles 10.7 6.8 13.4 6.6 2.5 2.5 Seychelles South Africa 34.3 46.6 50.9 45.3 32.5 32.2 Afrique du Sud Swaziland 1.9 3.7 2.5 1.7 2.4 3.4 Swaziland Tanzania 125.4 4.0 4.6 3.1 2.8 3.3 Tanzanie Zambia 174.7 2.3 2.9 2.7 2.8 8.5 Zambie Zimbabwe 1.4 5.0 13.8 3.3 2.5 6.2 Zimbabwe SADC 32.1 9.6 11.6 8.2 6.6 8.2 SADC

KeyStats 2013 VIII: SADC
4 EXTERNAL SECTOR SECTEUR EXTERIEUR 4 4.12 Tariffs and imports by product groups in % (in 2012) Tarifs et importations par groupe des produits en %
(en 2012) 4.12
COUNTRY Animal products Dairy products Fruit, vegetables, plants
Coffee, tea Cereals & preparations PAYS
Angola 11.1 6.0 11.7 16.5 7.8 Angola Botswana 10.7 13.0 9.2 8.2 8.4 Botswana DR Congo … … … … … RD Congo Lesotho 10.7 13.9 9.2 8.2 8.4 Lesotho Madagascar 18.6 17.7 17.9 17.9 12.2 Madagascar Malawi 16.7 20.5 21.6 23.8 18.4 Malawi Mauritius 0.0 0.0 0.0 2.5 0.3 Maurice Mozambique 18.1 16.3 17.0 17.2 12.9 Mozambique Namibia 10.7 13.9 9.2 8.2 8.4 Namibie Seychelles 0.5 0.0 7.1 16.7 5.1 Seychelles South Africa 10.6 9.7 9.1 7.7 8.4 Afrique du Sud Swaziland 10.7 13.9 9.2 8.2 8.4 Swaziland Tanzania 23.3 43.3 22.1 19.6 24.1 Tanzanie Zambia 19.2 22.6 22.0 22.9 16.9 Zambie Zimbabwe 31.8 27.8 28.8 32.7 23.2 Zimbabwe SADC 13.8 15.6 13.9 15.0 11.6 SADC

KeyStats 2013 VIII: SADC
COUNTRY Oilseeds, fats & oils Sugars and confectionery
Beverages & tobacco
Cotton Other agricultural products
PAYS
Angola 4.5 4.6 22.4 2.0 6.8 Angola Botswana 7.6 3.6 20.9 4.8 2.2 Botswana DR Congo … … … … … RD Congo Lesotho 7.6 3.6 21.1 4.8 2.2 Lesotho Madagascar 9.0 9.1 19.4 5.0 9.6 Madagascar Malawi 12.3 17.5 31.6 2.0 10.7 Malawi Mauritius 1.3 0.0 6.5 0.0 1.2 Maurice Mozambique 9.5 9.1 17.9 2.5 7.6 Mozambique Namibia 7.6 3.6 21.1 4.8 2.2 Namibie Seychelles 0.0 0.0 39.0 0.0 14.3 Seychelles South Africa 7.6 3.6 20.9 4.6 2.2 Afrique du Sud Swaziland 7.6 3.6 21.1 4.8 2.2 Swaziland Tanzania 11.3 29.8 25.3 0.0 10.9 Tanzanie Zambia 13.6 22.0 23.8 15.0 15.5 Zambie Zimbabwe 8.4 12.8 47.6 4.0 8.9 Zimbabwe SADC 7.7 8.8 24.2 3.9 6.9 SADC

KeyStats 2013 VIII: SADC
COUNTRY Fish & fish products Minerals & metals Petroleum Chemicals PAYS Angola 18.5 7.5 19.4 5.2 Angola Botswana 6.2 3.6 1.0 2.3 Botswana DR Congo … … … … RD Congo Lesotho 6.2 3.6 1.0 2.3 Lesotho Madagascar 19.7 10.6 5.8 7.3 Madagascar Malawi 16.3 11.9 5.4 3.8 Malawi Mauritius 0.0 0.9 0.0 0.5 Maurice Mozambique 19.6 7.2 5.9 5.0 Mozambique Namibia 6.2 3.6 1.0 2.3 Namibie Seychelles 69.8 1.1 21.0 2.8 Seychelles South Africa 6.2 3.6 0.8 2.3 Afrique du Sud Swaziland 6.2 3.6 1.0 2.3 Swaziland Tanzania 24.7 10.6 4.3 4.0 Tanzanie Zambia 24.1 11.0 18.9 6.1 Zambie Zimbabwe 10.9 13.0 22.5 7.3 Zimbabwe SADC 16.8 6.6 7.7 3.8 SADC

KeyStats 2013 VIII: SADC
COUNTRY Wood, paper, etc. Textiles Clothing Leather, footwear, etc. PAYS
Angola 11.5 6.1 15.0 9.6 Angola Botswana 6.1 16.7 41.0 13.3 Botswana DR Congo … … … … RD Congo Lesotho 6.1 16.7 41.0 13.3 Lesotho Madagascar 13.5 14.9 19.9 12.8 Madagascar Malawi 14.9 18.5 25.0 19.0 Malawi Mauritius 3.9 0.9 4.5 0.8 Maurice Mozambique 9.8 14.6 20.0 11.3 Mozambique Namibia 6.1 16.9 41.0 13.3 Namibie Seychelles 2.4 3.9 18.5 15.1 Seychelles South Africa 6.1 17.1 41.0 13.3 Afrique du Sud Swaziland 6.1 16.9 41.0 13.3 Swaziland Tanzania 16.0 19.6 25.2 12.7 Tanzanie Zambia 16.7 15.9 25.0 17.7 Zambie
Zimbabwe 17.1 20.3 88.2 26.6 Zimbabwe SADC 9.7 14.2 31.9 13.7 SADC

KeyStats 2013 VIII: SADC
COUNTRY Non-electrical machinery
Electrical machinery
Transport equipment
Manufactures, n.e.s. PAYS
Angola 2.5 3.6 3.4 7.1 Angola Botswana 1.4 4.6 6.0 3.8 Botswana DR Congo … … … … RD Congo Lesotho 1.4 4.6 6.0 3.8 Lesotho Madagascar 6.6 10.4 9.1 12.4 Madagascar Malawi 4.7 12.2 11.4 16.5 Malawi Mauritius 0.2 1.4 0.7 1.0 Maurice Mozambique 6.0 9.0 7.4 12.8 Mozambique Namibia 1.4 4.6 6.0 3.8 Namibie Seychelles 0.3 0.4 8.7 12.2 Seychelles South Africa 1.4 4.6 6.0 3.8 Afrique du Sud Swaziland 1.4 4.6 6.0 3.8 Swaziland Tanzania 3.2 10.8 6.2 14.8 Tanzanie Zambia 7.3 14.7 9.8 15.8 Zambie Zimbabwe 6.0 14.5 13.5 16.7 Zimbabwe SADC 3.1 7.1 7.2 9.2 SADC
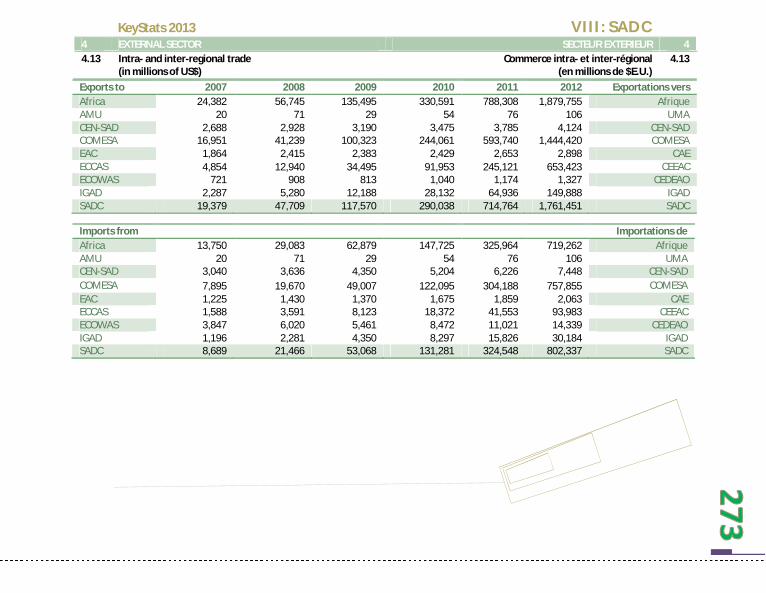
KeyStats 2013 VIII: SADC
4 EXTERNAL SECTOR SECTEUR EXTERIEUR 4 4.13 Intra- and inter-regional trade
(in millions of US$) Commerce intra- et inter-régional
(en millions de $E.U.) 4.13
Exports to 2007 2008 2009 2010 2011 2012 Exportations vers Africa 24,382 56,745 135,495 330,591 788,308 1,879,755 Afrique AMU 20 71 29 54 76 106 UMA CEN-SAD 2,688 2,928 3,190 3,475 3,785 4,124 CEN-SAD COMESA 16,951 41,239 100,323 244,061 593,740 1,444,420 COMESA EAC 1,864 2,415 2,383 2,429 2,653 2,898 CAE ECCAS 4,854 12,940 34,495 91,953 245,121 653,423 CEEAC ECOWAS 721 908 813 1,040 1,174 1,327 CEDEAO IGAD 2,287 5,280 12,188 28,132 64,936 149,888 IGAD SADC 19,379 47,709 117,570 290,038 714,764 1,761,451 SADC
Imports from Importations de Africa 13,750 29,083 62,879 147,725 325,964 719,262 Afrique AMU 20 71 29 54 76 106 UMA CEN-SAD 3,040 3,636 4,350 5,204 6,226 7,448 CEN-SAD COMESA 7,895 19,670 49,007 122,095 304,188 757,855 COMESA EAC 1,225 1,430 1,370 1,675 1,859 2,063 CAE ECCAS 1,588 3,591 8,123 18,372 41,553 93,983 CEEAC ECOWAS 3,847 6,020 5,461 8,472 11,021 14,339 CEDEAO IGAD 1,196 2,281 4,350 8,297 15,826 30,184 IGAD SADC 8,689 21,466 53,068 131,281 324,548 802,337 SADC