
Y;netTitle è¡ ã ¢ã ã ã ã ©ã ·PDFã ã ã ³ã ã ¼ã ç ¨.pdf Author PC12 Created Date 4/10/2018 4:47:11 PM

FY2020 Annual Operating & Capital Budget
The Unified Government of Athens – Clarke County
July 1, 2019 – June 30, 2020

ATHENS-CLARKE COUNTY MISSION STATEMENT
Athens-Clarke County, an open and responsive government,
facilitating a positive environment for individuals to obtain a high quality of life and
local organizations to achieve success
by providing innovative, high quality services and responsible stewardship of the community’s
resources, to benefit current and future generations.
Adopted by the Mayor and Commission November 4, 1997

SECTION A ‐ INTRODUCTION Mayor’s Transmittal Letter ............................................................................................. A‐1
Mayor & Commission ...................................................................................................... A‐4
List of Principal Officials .................................................................................................. A‐5
ACCGOV Organizational Charts ....................................................................................... A‐6 SECTION B ‐ BUDGET SUMMARY
Executive Summary ......................................................................................................... B‐1
Mayor & Commission Strategic Commitments ............................................................... B‐2
General Fund Summary .................................................................................................. B‐4
All Funds Summary .......................................................................................................... B‐5
FY20 Revenues ................................................................................................................ B‐6
General Fund Revenues .............................................................................................. B‐6
Other Revenue Changes ........................................................................................... B‐11
FY20 Expenses ............................................................................................................... B‐13
Current Services ........................................................................................................ B‐13
New Initiatives .......................................................................................................... B‐13
SPLOST Impacts ........................................................................................................ B‐14
Additional Positions and Other Personnel Changes ................................................. B‐15
Changes to Compensation and Benefits................................................................... B‐18
Summary of the Recommended Capital Budget & CIP ................................................. B‐19
FY20 Budget Ordinance ................................................................................................. B‐20
Development of FY20 Operating Budget ...................................................................... B‐24
Legal and Charter Requirements .............................................................................. B‐24
Budget Development Process .................................................................................. B‐24 SECTION C ‐ DEPARTMENT OPERATING BUDGETS
Airport .............................................................................................................................. C‐1
Attorney ........................................................................................................................... C‐4
Board of Elections ............................................................................................................ C‐6
Building Inspection ........................................................................................................... C‐9
Central Services ..............................................................................................................C‐12
Clerk of Courts ................................................................................................................C‐18
Cooperative Extension Service .......................................................................................C‐20
Coroner ..........................................................................................................................C‐22
Corrections .....................................................................................................................C‐23
Debt Service ...................................................................................................................C‐28
District Attorney .............................................................................................................C‐29
Economic Development .................................................................................................C‐32
Finance ...........................................................................................................................C‐36
Fire & Emergency Services .............................................................................................C‐39
Housing & Community Development ............................................................................C‐42
Human Resources ..........................................................................................................C‐46
Independent Agencies ...................................................................................................C‐49
Table of Contents
FY20 Budget TOC-1

Information Technology .................................................................................................C‐50
Juvenile Court .................................................................................................................C‐52
Leisure Services ..............................................................................................................C‐55
Magistrate Court ............................................................................................................C‐59
Manager .........................................................................................................................C‐63
Mayor & Commission ....................................................................................................C‐69
Municipal Court ..............................................................................................................C‐71
Operational Analysis ......................................................................................................C‐73
Other Financing Uses .....................................................................................................C‐75
Other General Administration .......................................................................................C‐76
Planning & Zoning ..........................................................................................................C‐79
Police Services ................................................................................................................C‐82
Probate Court .................................................................................................................C‐88
Public Utilities.................................................................................................................C‐90
Sheriff .............................................................................................................................C‐95
Solicitor General .......................................................................................................... C‐100
Solid Waste.................................................................................................................. C‐104
State Court .................................................................................................................. C‐108
Superior Courts ........................................................................................................... C‐110
Tax Assessors ............................................................................................................... C‐115
Tax Commissioner ....................................................................................................... C‐118
Transit ......................................................................................................................... C‐120
Transportation & Public Works ................................................................................... C‐124 SECTION D ‐ CAPITAL BUDGET & CAPITAL IMPROVEMENT PLAN
Capital Improvement Plan & FY20 Capital Budget Narrative ......................................... D‐1
Summary of Major Projects ............................................................................................ D‐2
General Capital Projects Fund ......................................................................................... D‐3
Building Inspection Fund ................................................................................................. D‐9
Economic Development Fund ....................................................................................... D‐10
Fleet Management Fund ............................................................................................... D‐11
Fleet Replacement Fund ............................................................................................... D‐12
Hotel/Motel Tax Fund ................................................................................................... D‐13
Internal Support Fund ................................................................................................... D‐14
Landfill Enterprise Fund ................................................................................................ D‐15
Solid Waste Enterprise Fund ......................................................................................... D‐16
Stormwater Management Enterprise Fund .................................................................. D‐17
Water & Sewer Enterprise Fund ................................................................................... D‐18
Project Data Sheets by Department ..................................................... D‐19 through D‐140 SECTION E ‐ BUDGETS BY FUND
Budgets by Fund Introduction .......................................................................................... E‐1
All Funds Summary by Fund Type .................................................................................... E‐2
All Funds Expenditures Summary by Fund ....................................................................... E‐4
Table of Contents
FY20 Budget TOC-2

General Fund .................................................................................................................... E‐5
Hotel/Motel Fund ............................................................................................................ E‐8
Community Development Block Grant Fund ................................................................... E‐9
Revolving Loan Fund ...................................................................................................... E‐10
Emergency Telephone System Fund .............................................................................. E‐11
HUD HOME Grant Fund .................................................................................................. E‐12
Grants Fund .................................................................................................................... E‐13
Alternative Dispute Resolution Fund ............................................................................. E‐14
Affordable Housing Fund ............................................................................................... E‐15
Supportive Housing Fund ............................................................................................... E‐16
Special Programs Fund ................................................................................................... E‐17
Building Inspection Fund ................................................................................................ E‐18
Sheriff Inmate Fund ........................................................................................................ E‐19
Corrections Inmate Fund ............................................................................................... E‐20
Public Facilities Authority Capital Fund .......................................................................... E‐21
Economic Development Capital Projects Fund .............................................................. E‐22
General Capital Projects Fund ........................................................................................ E‐23
Airport Fund ................................................................................................................... E‐24
Landfill Fund ................................................................................................................... E‐25
Public Transit Fund ......................................................................................................... E‐26
Water & Sewer Fund ..................................................................................................... E‐27
Solid Waste Collection Fund .......................................................................................... E‐29
Stormwater Utility Fund ................................................................................................. E‐30
Internal Support Fund .................................................................................................... E‐31
Fleet Management Fund ................................................................................................ E‐32
Fleet Replacement Fund ................................................................................................ E‐33
Insurance & Claims Fund ................................................................................................ E‐34
Health Insurance Fund ................................................................................................... E‐35
Interfund Transfers & Charges ....................................................................................... E‐36 SECTION F ‐ INDEPENDENT AGENCIES
Appropriation Summary of Independent Agency Budgets .............................................. F‐1
Independent Agencies Budget Overview ......................................................................... F‐2 SECTION G ‐ OTHER INFORMATION
Athens‐Clarke County Demographic Information ........................................................... G‐1
CDBG and Home Grants .................................................................................................. G‐3
Debt Service Requirements ............................................................................................. G‐6
Athens‐Clarke County Fiscal Policies ............................................................................... G‐9 SECTION H – GLOSSARY
Glossary of Terms ............................................................................................................ H‐1
Acronyms ........................................................................................................................ H‐6
Table of Contents
FY20 Budget TOC-3

MAYOR KELLY GIRTZ
THE UNIFIED GOVERNMENT OF ATHENS-CLARKE COUNTY, GEORGIA 301 College Avenue, Suite 300 Athens, Georgia 30601 (706) 613-3010
www.accgov.com
July 1, 2019 Dear Citizens and Commissioners of Athens-Clarke County: As Mayor of the Unified Government of Athens-Clarke County, I am pleased to present to you the 2020 Fiscal Year Annual Operating and Capital Budget. In accordance with Georgia Law and the Charter of the Unified Government, the Mayor and Commission on June 4, 2019 adopted this budget. This budget is balanced without reductions to current services and includes funding to support voter approved SPLOST facilities while maintaining the current millage rate of 13.95 for the seventh consecutive year.
Key Points in the FY 2020 Budget
This Budget includes a total of ten new fulltime positions and eight fulltime positions converted from twelve part-time positions, bringing the authorized level of fulltime positions to 1,691. The authorized level of fulltime positions will remain below 14 per thousand of Athens-Clarke County population, as it has since 1991. These additional positions include:
In the General Fund - a fulltime position for the new Inclusion Office in the Manager’s Office - conversion of two part-time positions to a fulltime Elections Coordinator position for Board of
Elections - conversion of a part-time position to a fulltime Medical Lab Assistant in Superior Court –
Probation (Drug Testing Lab) - two additional Corrections Officers for Corrections - a fulltime Housing Coordinator position in Housing & Community Development for the final
three months of FY20
Outside the General Fund - four fulltime Transit Vehicle Operators (converted from seven part-time positions) - two Transit Facility Maintenance positions (converted from two part-time positions) - an Accounting Analyst for Public Utilities – Water Business Office - three fulltime positions in Public Utilities for the Phosphorus Discharge Project - a Public Works Inspector in Transportation & Public Works (funded from TSPLOST)
The FY20 Budget includes several initiatives aimed at reducing poverty and increasing prosperity for citizens of Athens-Clarke County. The major initiatives are listed below.
- $4,000,000 for a “Prosperity Package” to be invested in programs and partnerships with other agencies to reduce the poverty rate in Athens-Clarke County.
- $150,000 to create a Workforce Investment Program in Economic Development that will partner with other agencies to create a training curriculum for targeted individuals that will help them gain employment.
- $100,000 has been included for the third year of the Youth Build pilot program.

- $94,000 in General Fund support for the Transit fund to provide fare free service to senior and disable citizens and to offer fare free service to employees of ACCGOV.
- $30,000 has been budgeted to partner with local agencies to increase outreach efforts to our homeless population.
- addition of a Housing Coordinator position to support increased creation of affordable housing throughout Athens.
Another area of focus for the FY20 Budget was improvements to the local criminal justice systems. The budget includes funding for the following initiatives:
- $150,000 to begin an offender incentive program to begin to support state inmates as they perform labor on behalf of ACCGOV.
- $100,100 in the Police Department to continue the Mental Health Co-Responder unit that had been grant funded and to add an additional team.
- support for Criminal Justice System enhancements, including for creation of a system-wide Data Dashboard and a Municipal Court notification system.
- two additional Corrections Officer positions to increase supervision and safety support needed due to the increased number of housed offenders at the Diversion Center.
The FY20 Budget includes funding in support of the Mayor and Commission goal to attract, retain, and reward talented employees. Across all funds, the Budget includes approximately $1.8 million ($1.3 million in the General Fund) for the resumption of the Performance Management Program (PMP) to encourage retention and reward active employees who meet the highest levels of performance. The $1.8 million total is equivalent to 2% of pay and related benefits and will be added to departmental budgets based on their proportional share of total salaries. Individual pay increases for employees will depend on performance.
The Budget includes an increase in employee contributions to the Employee Health Insurance program beginning in January 2020. These increases are needed to keep pace with the cost of health insurance programs.
In order to maintain current benefits, funding for Retiree Health Insurance and life insurance (Other Post-Employment Benefits – OPEB), will increase to almost $6.0 million per year, a $1.3 million increase ($1.0 from the General Fund) over the FY19 Budget. This increase is based on a growing number of retirees compared to this time last year, current trends in claims expenses and an increase in the monthly HRA contribution for some retirees 65 and older.
Strategic Commitments and Goals agreed to by the Mayor and Commission at their most recent annual retreat helped to guide the development of the FY20 Budget. Resources have been set aside for some objectives and others are already operational or will be achieved with resources established in this budget. Additional information on key points of the budget is included in the Budget Summary prepared by the staff of the Finance Department. My work as Mayor affords me the unique opportunity to work with and meet people throughout the community, region, and state, where I routinely receive compliments for our community and our staff. This positive perception is something for which we can be proud, and is directly attributed to the commitment regularly exhibited by both citizens and staff as we work together for the Athena ideal: to leave our community better than we found it.
FY20 Budget A-2

FY20 Budget A-3

Kelly Girtz Mayor
Patrick Davenport District 1 Commissioner
Mariah Parker District 2 Commissioner
Melissa Link District 3 Commissioner
Allison Wright District 4 Commissioner
Tim Denson District 5 Commissioner
Jerry NeSmith District 6 Commissioner
Russell Edwards District 7 Commissioner
Andy Herod District 8 Commissioner
Ovita Thornton District 9 Commissioner
Mike Hamby District 10 Commissioner
Mayor and Commission
FY20 Budget A-4

Elected Officials Clerk of Courts Beverly Logan State Court Chief Judge Ethelyn Simpson
Coroner Sonny Wilson State Court Judge Charles Auslander
District Attorney Ken Mauldin Superior Court Chief Judge H. Patrick Haggard
Magistrate Court Chief Judge
Patricia Barron Superior Court Judge Lawton Stephens
Probate Court Judge Susan Tate Superior Court Judge Eric Norris
Sheriff Ira Edwards Superior Court Judge Lisa Lott
Solicitor General C.R. Chisholm Tax Commissioner Toni Meadow
Appointed Officials Manager Blaine H. Williams Finance Director David Boyd
Assistant Manager Jestin Johnson Housing & Community Development Director
Hayley Banerjee (Interim)
Assistant Manager Deborah Lonon Human Resources Director Jeff Hale
Attorney Bill Berryman Information Technology Director Steve Davis
Internal Auditor Stephanie Maddox Juvenile Court Judge Robin Shearer
Airport Director Mike Mathews Leisure Services Director Kent Kilpatrick
Building Inspection Director
Doug Hansford Municipal Court Judge Ryan Hope
Central Services Director David Fluck Planning & Zoning Director Brad Griffen
Chief of Fire & Emergency Services
Jeff Scarbrough Public Information Officer Jeff Montgomery
Chief of Police Cleveland Spruill Public Transit Director Butch McDuffie
Chief Tax Appraiser Kirk Dunagan Public Utilities Director Frank Stephens
Clerk of Commission Jean Spratlin Solid Waste Director Suki Janssen
Corrections Warden Ray Covington Supervisor of Elections & Voter Registration
Charlotte Sosebee
County Extension Coordinator
Amanda Tedrow Transportation & Public Works Director
Drew Raessler
Economic Development Director
Michelle Nguyen
Principal Officials
FY20 Budget A-5

G -
FY20 Budget A-6

Man
ager
's O
ffic
e
Ass
ista
nt
Man
ager
Co
nstit
utio
nal
Offi
cers
Bui
ldin
g In
spec
tion
Dire
ctor
Pub
lic U
tiliti
esD
irect
or
Tra
nspo
rtat
ion
&P
ubl
ic W
orks
Dire
ctor
Tra
nsit
Dire
ctor
Man
ager
Ass
ista
ntM
anag
er
Ce
ntra
l Ser
vice
sD
irect
or
Pu
blic
Info
rmat
ion
O
ffice
r***
Hu
ma
n R
esou
rce
s
Co
rre
ctio
nsD
irect
or
Leis
ure
Se
rvic
es
Dire
ctor
Judi
cial
Offi
cers
Airp
ort
Dire
ctor
Pol
ice
Ch
ief
SP
LOS
TP
rog
ram
Ad
min
istr
ator
***
Exe
cutiv
eA
ssis
tant
Cyn
thia
Lam
brig
ht
Info
rmat
ion
Te
chno
log
yD
irect
or
***
Sec
tions
of M
anag
ers
Offi
ce--
----
----
- A
ppoi
nted
by
othe
rs
Adm
inis
trat
ive
Sec
reta
ryS
upe
rvis
or o
fE
lect
ion
s
Ho
usin
g &
C
om
mun
ity
De
velo
pmen
t D
irect
or
Pla
nni
ng
Dir
ecto
r
So
lid W
ast
e
Dire
ctor
Fir
e &
Em
erge
ncy
Se
rvic
esD
irect
or
Eco
nom
icD
eve
lopm
ent
Dire
ctor
Geo
spa
tial
Info
rmat
ion
O
ffice
r***
Ash
ley
Bar
nett
May
or
&
Co
mm
issi
on
Jest
in J
ohns
on
Deb
ora
hLo
non
Bla
ine
Will
iam
s
Su
sta
ina
bilit
y O
ffice
r***
Co
oper
ativ
eE
xten
sio
n C
oor
d/A
gen
t
Org
ani
zatio
nal
De
velo
pmen
tA
dm
inis
trat
or**
*
Fin
ance
Dire
ctor
Offi
ce o
f In
clus
ion
an
d D
ive
rsity
***
Ch
ief
Ta
xA
ppr
aise
r
FY20 Budget A-7

Co
mm
issi
on
ers
May
or a
ndC
om
mis
sion
May
or's
Exe
cutiv
e A
ssis
tant
Cle
rk o
f C
omm
issi
onJe
anS
prat
lin
Dep
uty
Cle
rk o
f C
omm
issi
on
Bill
B
erry
man
Kel
ly G
irtz,
May
or
Ste
phan
ieM
addo
x
Att
orne
y A
ttor
ney
Ope
ratin
g S
ervi
ces
and
Dep
artm
ents
(See
Org
aniz
atio
nal C
har
ts)
Bla
ine
Will
iam
s
Rya
nH
ope
Lega
lA
ssis
tant
Pat
rick
Dav
enpo
rt (
Dis
tric
t 1)
Mar
iah
Par
ker
(Dis
tric
t 2)
Mel
issa
Lin
k (D
istr
ict 3
)A
lliso
n W
right
(D
istr
ict 4
)T
im D
enso
n (D
istr
ict 5
)Je
rry
NeS
mith
(D
istr
ict 6
)R
usse
ll E
dwar
ds
(Dis
tric
t 7)
And
y H
erod
(D
istr
ict 8
)O
vita
Tho
rnto
n (D
istr
ict 9
)M
ike
Ham
by (
Dis
tric
t 10)
Atto
rney
*M
ana
ger*
Mun
icip
al C
ourt
Judg
e
See
O
rgan
izat
iona
l C
hart
Inte
rnal
Aud
itor*
Man
age
men
t A
na
lyst
Adm
inis
trat
ive
Ass
ista
nt
May
or
and
Co
mm
issi
on
Att
orne
y
Inve
stig
ator
Deb
orah
Arn
old
*Cha
rter
Offi
cers
FY20 Budget A-8
Overall Budget
This Budget includes a General Fund Operating Budget of $140.2 million for FY20, $5.9 million or 4.4% above the FY19 Budget. The Operating Budget for All Funds totals $213.8 million. The Capital Budget for all funds is $35.2 million. In total, the Operating and Capital Budget for FY20, $249.0 million, is $6.4 million more than the FY19 Original Budget.
Millage Rate The millage rate for FY20 (property tax year 2019) is 13.95 mills, the same level as FY19. Property Tax information for FY20 is included on page B‐6 of this section.
Use of Fund Balance The FY20 budget for the General Fund includes $4,000,000 for a “Prosperity Package” to be invested in programs and partnerships with other agencies to reduce the poverty rate in Athens‐Clarke County. Funding for this initiative is budgeted to come from fund balance.
Department Requests
ACCGOV Departments requested $3.1 million in FY20 (2.4 million in the General Fund) for operating expenditures for new initiatives, new programming, additional positions and SPLOST/TSPLOST operating budget impacts. This budget includes roughly $1.7 million for these additional expenses ($1.2 in the General Fund). See pages B‐13 to 16 for information on these increases to departmental budgets.
Additional Positions
The FY20 Budget includes ten new fulltime authorized positions across all funds and eight fulltime positions converted from twelve part‐time positions, bringing the authorized level of positions to 1,691. See page B‐15 in this section for a list of additional positions.
Pay Adjustment
This Budget includes $1.8 million across all funds ($1.3 million of in General Fund) for employee pay adjustments. The funding represents the resumption of the Performance Management Program (PMP) to encourage retention and reward active employees who meet the highest levels of performance. The $1.8 million total is equivalent to 2% of pay and related benefits and will be added to departmental budgets based on their proportional share of total salaries.
Water & Sewer Rates
FY20 revenues for the Public Utilities Department reflect the planned rate increases included in the 2015 Public Utilities Service Delivery Plan approved by the Mayor and Commission on May 2, 2016. The FY20 budgeted revenues will continue to fund operations, fully fund all annual debt service expenses and meets all bond debt service coverage ratio requirements. A typical customer receiving both water and sewer service will experience a 3.8% increase in their bill for the same usage as FY19. At 3,000 gallons of consumption per month, the rate increase equals a water and sewer bill increase of $2.01 per month.
Executive Summary
FY20 Budget Summary
FY20 Budget B-1

Listed below are the Mayor and Commission’s six Strategic Commitments and Goals as approved on April 2, 2019. These Strategic Commitments and Goals have been used to guide the development of budget initiatives. Healthy, Livable, Sustainable Athens‐Clarke County 1. Invest in human infrastructure by collaborating with stakeholders in education, health and economic
development to increase upward economic mobility for all. 2. Create Mixed Income, Mixed Use neighborhoods, while transforming the most challenged neighborhoods. 3. ACCGOV to aim for 100% clean and renewable energy by 2035 and develop and implement equitable
strategies to do so by April 2020. 4. Manage environmentally damaging septic tanks and attention to targeting areas of need. 5. Create a welcoming, inclusive, and prosperous downtown. Transportation Mobility and Connectivity 1. Air Service Incentive Plan ‐ Encourage new nonstop air service and competition by providing temporary
assistance to an airline beginning new nonstop service to an approved destination. 2. Fare Free Transit ‐ Moving in a tiered fashion towards Fare‐Free Transit System as we approach the end of
life cycle for our fare box system. 3. Enhanced Mobility Corridor Aesthetics ‐ Easy connections between residential and commercial, county‐
wide. Start this theme in redevelopment areas and then expand outward. Shared Prosperity 1. Corridor Redevelopment 2. Develop Economic Development Strategy & Framework ‐ Assess economic conditions, consider trends and
research, evaluate SWOTs, address weakness and opportunities, determine focus. Filter this all through lens of equity and diversity.
3. Municipal Mobile Network ‐ Ensure wireless high speed broadband access for all parts of the county, stimulate economic development, enhance educational experience, improve services provided by ACCGOV through higher bandwidths.
Safe and Prepared Community 1. Criminal Justice initiatives:
a) Explore avenues to decriminalize marijuana. b) Foster a criminal justice system focused on rehabilitation and prevention, both in collaboration with
community partners, rather than incarceration. This could involve changing policy around arrests for low‐level crime, eliminating cash bail, phasing out inmate labor‐for‐free program, expanding accountability courts, and matching funding (from grants) to programs serving youth and people with behavior disorders.
c) Criminal Justice Outcomes Enhancement: reduction of recidivism, enhanced public safety, reduce jail‐nights and greater support for paths away from criminality.
2. Justice and Mental Health Collaborative Grant ‐ Identify programs to improve outcomes and coordinate service delivery amongst community partners involved with mental health and substance abuse
3. Rehabilitation of Offenders ‐ Promote education, work skills, improved social and life skills under strict supervision to promote a positive transition for offenders back into the community.
4. Transparency Initiative ‐ Develop and enhance the Transparency in Policing link on the ACCPD website which includes information on Departmental demographics, complaints, use of force, discipline, etc.
5. Improving water supply resiliency and reliability
FY20 Mayor and Commission Strategic Commitments and Goals
FY20 Budget Summary
FY20 Budget B-2
Informed and Engaged Citizens 1. Directly engaging citizens on the front end of ACCGOV processes. Developing ownership in "their" County
Government, through new and varied forms of public input (written input on agendas, regular town halls) 2. Law Enforcement Advisory Panel ‐ to advise the Chief of Police in matters of community issues, review
potential policies and procedures, and provide guidance to the chief on service and police related issues. Accountable and Responsive Government 1. Re‐examine Athens Clarke County pay plan 2. Film Guide & Updated Film Procedures ‐ Develop a guide to filming in Athens‐Clarke County and update
related filming procedures
FY20 Budget Summary
FY20 Budget B-3

FY19 FY20
Approved Approved
Budget Budget $▲ %▲Revenues:
Property Taxes 59,926,533 65,206,378 5,279,845 8.8%
Sales Tax 23,700,000 24,233,425 533,425 2.3%
Other Taxes 22,328,889 22,779,134 450,245 2.0%
Licenses & Permits 1,759,454 1,590,300 (169,154) ‐9.6%
Intergovernmental Revenues 1,189,663 1,183,303 (6,360) ‐0.5%
Charges for Services 13,071,260 12,954,290 (116,970) ‐0.9%
Fines & Forfeitures 3,389,770 3,246,382 (143,388) ‐4.2%
Other Revenues 1,086,123 1,118,206 32,083 3.0%
Other Financing Sources 3,520,086 3,881,612 361,526 10.3%
Total Revenues $129,971,778 $136,193,030 $6,221,252 4.8%
Prior Year Fund Balance ‐ Oper 871,444 4,000,000 3,128,556 359.0%
Prior Year Fund Balance ‐ Capital 3,451,600 0 (3,451,600) ‐100.0%
Total Revenues & Other Sources $134,294,822 $140,193,030 $5,898,208 4.4%
Expenditures:
General Government 25,269,414 31,188,100 5,918,686 23.4%
Judicial 28,230,295 28,750,525 520,230 1.8%
Public Safety 40,665,626 40,124,700 (540,926) ‐1.3%
Public Works 15,592,744 16,043,757 451,013 2.9%
Cultural & Recreation 7,902,488 8,060,667 158,179 2.0%
Housing & Development 3,175,557 3,299,505 123,948 3.9%
Independent Agencies 5,497,269 5,574,443 77,174 1.4%
Debt Service 1,052,561 1,057,855 5,294 0.5%
Total Operating Expenditures $127,385,954 $134,099,552 $6,713,598 5.3%
Other Financing Uses ‐ Oper. 3,457,268 3,848,478 391,210 11.3%
Total Operating Expenditures $130,843,222 $137,948,030 $7,104,808 5.4%
& Other Financing Uses
Other Financing Uses ‐ Capital 3,451,600 2,245,000 (1,206,600) ‐35.0%
Total Operating & Capital $134,294,822 $140,193,030 $5,898,208 4.4%
Expenditures
Summary FY20 Annual Operating and Capital Budget
Commission Approved
General Fund Summary
FY20 Budget B-4

FY20 FY20 FY20
Operating Capital Total
Budget Budget Budget
Revenues:
Property Taxes 62,961,378 2,245,000 65,206,378
Sales Tax 24,233,425 24,233,425
Other Taxes 26,529,134 26,529,134
Licenses & Permits 2,690,300 0 2,690,300
Intergovernmental Revenues 7,210,231 7,210,231
Charges for Services 99,715,462 12,325,943 112,041,405
Fines & Forfeitures 4,109,982 4,109,982
Other Revenues 1,642,732 1,642,732
Other Financing Sources 7,865,090 2,245,000 10,110,090
Total Revenues $236,957,734 $16,815,943 $253,773,677
Prior Year Fund Balance 4,390,582 209,500 4,600,082
Use of Unrestricted Net Position 2,207,184 20,427,857 22,635,041
Total Revenues & Other Sources $243,555,500 $37,453,300 $281,008,800
Less Interfund Transfers & Charges (29,760,982) (2,245,000) (32,005,982)
Total Revenues $213,794,518 $35,208,300 $249,002,818
Expenditures:
General Government 67,834,227 852,500 68,686,727
Judicial 30,235,974 68,000 30,303,974
Public Safety 43,615,759 518,000 44,133,759
Public Works 58,017,447 33,604,800 91,622,247
Cultural & Recreation 8,095,667 160,000 8,255,667
Housing & Development 7,152,170 45,000 7,197,170
Independent Agencies 8,814,568 8,814,568
Debt Service 11,530,492 11,530,492
Total Operating Expenditures $235,296,304 $35,248,300 $270,544,604
Other Financing Uses 7,731,832 2,245,000 9,976,832
Total Expenditures & Other Financing Uses $243,028,136 $37,493,300 $280,521,436
Less Interfund Transfers & Charges (29,760,982) (2,245,000) (32,005,982)
Total Expenditures $213,267,154 $35,248,300 $248,515,454
Designated for Future Capital Improvements 527,364 (40,000) 487,364
& Debt Service Requirements
Total Expenditures & Designations $213,794,518 $35,208,300 $249,002,818
Summary FY20 Annual Operating and Capital Budget
Commission Approved
All Funds Summary
FY20 Budget B-5

Total General Fund Operating Revenue is projected to be $136.1 million in FY20, approximately $6.2 million or 4.8% more than the FY19 Budget.
$0.0
$10.0
$20.0
$30.0
$40.0
$50.0
$60.0
$70.0
Property Taxes Sales Tax Other Taxes All Others
General Fund Major Revenueswith 5 Year Average Annual Change
FY16 FY17 FY18 FY19 FY20
Millions
7.3%
2.1% 2.4% 3.5%
Property Taxes Total General Fund Property Taxes are projected to be $65.2 million, approximately $5.3 million more than originally estimated for FY19. The budget estimate for property taxes is based on the current millage rate of 13.95 mills. Based on current estimates from the Board of Tax Assessors and the Tax Commissioner, the 2019 net Tax Digest is $4.3 billion, a net increase approximately 8.6% over the 2018 Tax Digest. Property tax revenues include real property, motor vehicle (prior to March 2013), TAVT (motor vehicle after March 2013), real estate transfer and intangible recording taxes.
The property tax revenue estimates included in this Budget are based on a collection rate of 99%, similar to collection rates in previous years.
Based on current local share percentages, ACCGOV’s Title Ad Valorem Tax (TAVT) and Motor Vehicle Taxes are estimated to be $5.0 million in FY20, an increase of $1.1 million over FY19 Budget. The TAVT estimate for FY20 is based on the current 7% tax rate and allocation percentages approved in 2018 by the State Legislature (HB329) which reduced the State’s share of this tax and increased the local share.
Real estate Transfer and Intangible Recording Taxes are estimated to generate $1.3 million, a $54,000 increase over FY19.
In FY20, Property Tax Revenue is projected to be 48% of the General Fund Operating Budget. The following graph shows that property taxes as a percentage of General Fund Revenues have ranged from 44% to 48% since FY11. The FY20 Budget continues the careful balance of General Fund Revenues from Property Taxes (48%), Sales Taxes (18%), and other General Fund sources (34%).
General Fund Revenues
FY20 Revenues
FY20 Budget B-6

47% 46% 45% 46% 45% 45% 45% 46% 46% 48%
0%
10%
20%
30%
40%
50%
PROPERTY TAXES AS % OF THE GENERAL FUND (FY11‐FY20)
Athens‐Clarke County, Georgia
Property Tax Rates (Per $1,000 of Assessed Value) Last Ten Years (2010‐2019)
Note: In 1978 the City and County implemented a rollback of property taxes based on the receipt of local option sales tax revenues as required by Georgia Law.
State General Sales Tax General Total
Calendar of Debt Gross Reduction Net Debt Tax
Year Georgia General Service Total Rate (1) Rate Service Total Rates
2010 0.25 20.00 ‐‐‐ 20.00 18.90 ‐5.20 13.70 ‐‐‐ 13.70 33.95
2011 0.25 20.00 ‐‐‐ 20.00 19.51 ‐5.81 13.70 ‐‐‐ 13.70 33.95
2012 0.20 20.00 ‐‐‐ 20.00 19.56 ‐5.86 13.70 ‐‐‐ 13.70 33.90
2013 0.15 20.00 ‐‐‐ 20.00 20.08 ‐6.13 13.95 ‐‐‐ 13.95 34.10
2014 0.10 20.00 ‐‐‐ 20.00 19.94 ‐5.99 13.95 ‐‐‐ 13.95 34.05
2015 0.05 20.00 ‐‐‐ 20.00 20.13 ‐6.18 13.95 ‐‐‐ 13.95 34.00
2016 0.00 20.00 ‐‐‐ 20.00 20.07 ‐6.12 13.95 ‐‐‐ 13.95 33.95
2017 0.00 20.00 ‐‐‐ 20.00 19.70 ‐5.75 13.95 ‐‐‐ 13.95 33.95
2018 0.00 20.00 ‐‐‐ 20.00 19.70 ‐5.75 13.95 ‐‐‐ 13.95 33.95
2019 0.00 20.00 ‐‐‐ 20.00 19.37 ‐5.42 13.95 ‐‐‐ 13.95 33.95
Athens‐Clarke County
County School District
FY20 Revenues
FY20 Budget B-7
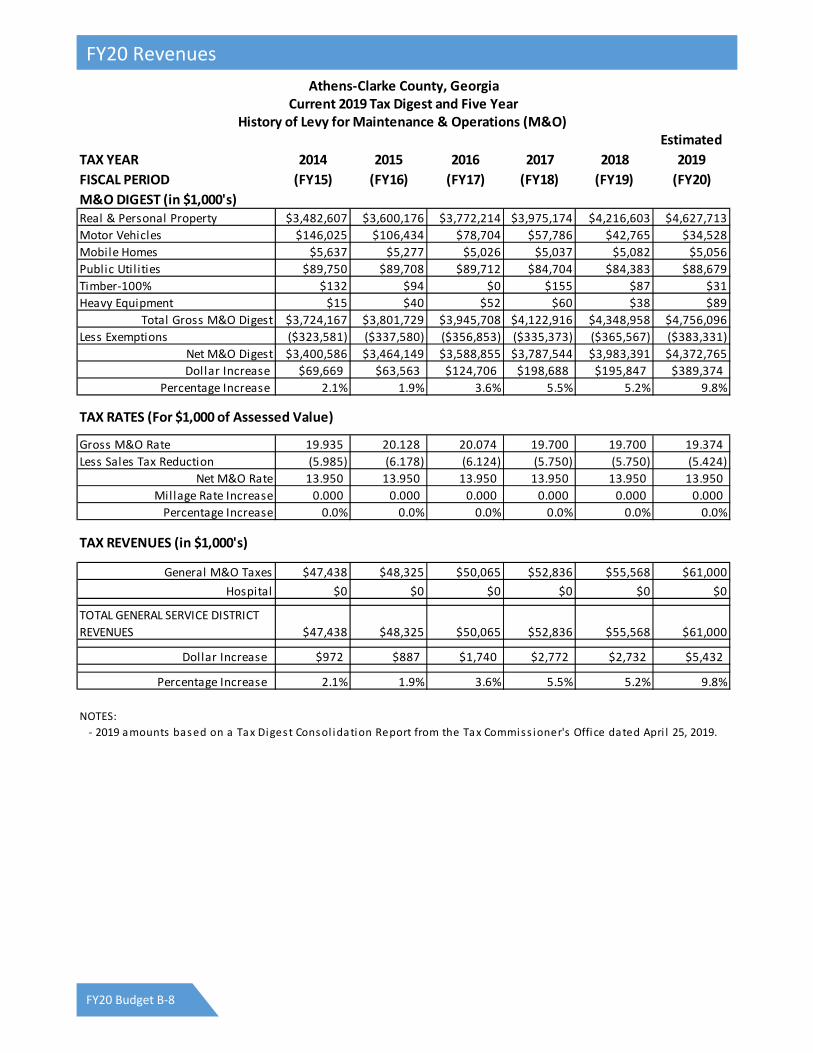
Athens‐Clarke County, GeorgiaCurrent 2019 Tax Digest and Five Year
History of Levy for Maintenance & Operations (M&O) Estimated
TAX YEAR 2014 2015 2016 2017 2018 2019
FISCAL PERIOD (FY15) (FY16) (FY17) (FY18) (FY19) (FY20)
M&O DIGEST (in $1,000's)Real & Personal Property $3,482,607 $3,600,176 $3,772,214 $3,975,174 $4,216,603 $4,627,713
Motor Vehicles $146,025 $106,434 $78,704 $57,786 $42,765 $34,528
Mobile Homes $5,637 $5,277 $5,026 $5,037 $5,082 $5,056
Public Util ities $89,750 $89,708 $89,712 $84,704 $84,383 $88,679
Timber‐100% $132 $94 $0 $155 $87 $31
Heavy Equipment $15 $40 $52 $60 $38 $89
Total Gross M&O Digest $3,724,167 $3,801,729 $3,945,708 $4,122,916 $4,348,958 $4,756,096
Less Exemptions ($323,581) ($337,580) ($356,853) ($335,373) ($365,567) ($383,331)
Net M&O Digest $3,400,586 $3,464,149 $3,588,855 $3,787,544 $3,983,391 $4,372,765
Dollar Increase $69,669 $63,563 $124,706 $198,688 $195,847 $389,374
Percentage Increase 2.1% 1.9% 3.6% 5.5% 5.2% 9.8%
TAX RATES (For $1,000 of Assessed Value)
Gross M&O Rate 19.935 20.128 20.074 19.700 19.700 19.374
Less Sales Tax Reduction (5.985) (6.178) (6.124) (5.750) (5.750) (5.424)
Net M&O Rate 13.950 13.950 13.950 13.950 13.950 13.950
Millage Rate Increase 0.000 0.000 0.000 0.000 0.000 0.000
Percentage Increase 0.0% 0.0% 0.0% 0.0% 0.0% 0.0%
TAX REVENUES (in $1,000's)
General M&O Taxes $47,438 $48,325 $50,065 $52,836 $55,568 $61,000
Hospital $0 $0 $0 $0 $0 $0
TOTAL GENERAL SERVICE DISTRICT
REVENUES $47,438 $48,325 $50,065 $52,836 $55,568 $61,000
Dollar Increase $972 $887 $1,740 $2,772 $2,732 $5,432
Percentage Increase 2.1% 1.9% 3.6% 5.5% 5.2% 9.8%
NOTES:
‐ 2019 amounts based on a Tax Digest Consol idation Report from the Tax Commiss ioner's Office dated Apri l 25, 2019.
FY20 Revenues
FY20 Budget B-8

Local Option Sales Taxes (LOST) An estimate of $24.2 million is included for FY20, a $533,000 (2%) increase over the FY19 Original Budget. LOST revenues for FY19 (through February) are up 1.7 % and sales taxes have averaged a 2.6% annual increase over the five fiscal years ending June 30, 2018.
$0
$5
$10
$15
$20
$25
$30
Millions
Local Option Sales Tax (LOST) Collection History
Other Taxes Other Taxes are projected to be $22.8 million in FY20, approximately $450,000 higher compared to the FY19 Budget. This estimate reflects current trends in revenues for franchise fees, business taxes, and alcohol and rental car excise taxes.
Franchise Fees on electricity, gas, telephone and cable services are estimated to be $8.2 million in FY20 based on current trends and rates, an increase of roughly $400,000 over the current budget.
The Insurance Premium Tax is the largest Other Tax and is estimated to generate $8.6 million based on current trends, a $400,000 increase over FY19. This tax is based on the value of insurance sold in the county, and is collected by the state and remitted annually to ACCGOV each October.
Excise tax revenues are estimated at $3.3 million in FY20, similar to last year. Excise taxes on beer, wine, and liquor are estimated to generate $2.4 million, about $40,000 less than FY19. The excise tax on mixed drinks and rental motor vehicles are anticipated to generate $675,000 and $200,000 respectively in FY20.
Based on current trends, revenues from annual Occupation Tax Certificates or Business Licenses are estimated to be $1.8 million in FY20, about $100,000 less than was budgeted for in FY19.
Delinquent Tax Collections are estimated to be $400,000, similar to FY19.
Charges for Services This budget includes an estimate of $13.0 million in FY20 for Charges for Services, slightly less than FY19.
Downtown parking fee revenues, as managed by the Athens Downtown Development Authority (ADDA), are anticipated to generate $3.1 million in FY20, the same as estimated in FY19 (this amount does not include an estimated $950,000 from parking fine revenue in the downtown area). The ADDA managed parking program includes the revenue from the operations of the Washington Street Building, the College
FY20 Revenues
FY20 Budget B-9

Avenue Parking Deck, on‐street metered parking spaces, and parking lots (note: 20% of the net revenue goes back to ADDA per contract).
Based on the current cost allocation plan, total overhead charges for services provided by the General Fund to other funds will be $2.6 million, similar to last year. A cost allocation study was completed in FY19 that resulted in updated overhead amounts for the enterprise funds and a new overhead charge for the Building Inspection Fund ($155,500).
Revenue from collection of taxes on behalf of other governmental entities by the Tax Commissioner’s Office is estimated to be $2.0 million in FY20.
Leisure Services is estimated to generate $1.2 million in FY20 and includes an increase to rental fees ($26,100) in accordance with the Pricing Police approved by the Mayor and Commission in December 2018.
The FY20 Budget for Probation fees is $315,000, $15,000 greater than the FY19 Budget. In addition, the Budget includes $237,500 in revenue from the in‐house drug‐testing program and $160,000 in supervision fees for the pre‐trial programs in State and Municipal Courts, $30,000 less than FY19.
Fees and recording costs in FY20 for Superior Court ($515,000) and Magistrate Court ($310,000) are $100,000 ($30,000 and $70,000 respectively) lower than FY19 based on current revenue trends. Probate Court fees are budgeted at $153,000 for FY20, the same as last year.
Resident fees from the Diversion Center are anticipated to generate $228,000 in FY20 based on an increase in State inmates participating in the Transitional Center and adjusted rates that are expected to result in an additional $3,000.
Sheriff’s Fees in FY20 are estimated to be similar to previous years at $235,000 and reflect the revenue collected under Georgia law and added revenue collected for housing inmates that have not been transferred to the State Correctional System.
The FY20 Budget includes six months of “host fee” revenue estimated at $107,500 from the Landfill Fund to compensate ACCGOV for the impact of serving as the location of the landfill site. Oglethorpe County will receive this fee when landfill waste disposal is located in their jurisdiction.
Planning and Zoning Permit fees are budgeted at $38,800 and include fee adjustments that are anticipated to generate an additional $17,600.
Fines & Forfeitures Total revenues from fines are estimated to be $3.2 million in FY20, a decrease of $143,000 from the FY19 Budget.
Revenue from the Municipal Court is projected to generate roughly $1.9 million in FY20, down $100,000 compared to the FY19 Budget. Fine revenues from the Superior, State, Magistrate, and Juvenile Courts are anticipated to generate $377,000 in total, down slightly from the FY19 Budget.
FY20 Revenues
FY20 Budget B-10

Other Financing Sources The budget includes $31,000 collected by the Sheriff’s Department for reporting information to the Social Security Administration during the year. The FY20 Budget includes an operating transfer of $190,000 from the hotel/motel tax fund, the same as FY19.
Also, the FY20 Budget reflects transfers of $3.6 million (a $316,000 increase) from Enterprise and Internal Service Funds to fund the annual cost for pension and other post‐retirement benefits (OPEB) expenses of those funds. This transfer in does not increase the net cost or benefit to the General Fund, it only shifts where these expense and liabilities are recorded. Use of Fund Balance for Operations For FY20, there is no budgeted use of fund balance for current operating or capital programs. General Fund does include $4,000,000 for a “Prosperity Package” to be invested in programs and partnerships with other agencies to reduce the poverty rate in Athens‐Clarke County. Funding for this initiative is budgeted to come from fund balance. The use of “one time” funding to support the budget is not consistent with the Fiscal Policies and is not sustainable for the long term. For FY19, the budget included the use of $871,400 for operations and $3.5 million for capital.
Airport Fund Total revenue estimated by the Department for FY20 is $3.1 million. In FY19, Runway 9/27 was temporarily closed for two months due to scheduled renovations. FY20 reflects the runway being open for the full year, resulting in an increase in fuel sales. Gross sales from fuel will generate revenues of $2.4 million, up $581,600 compared to FY19. For FY20, the General Fund will provide a subsidy of $105,800, the same as FY19. There are no other significant changes for FY20.
Transit Fund Total revenue of $5.7 million is projected for FY20, an increase of $169,000 from FY19 Budget. Federal funding is estimated to be $2.6 million in FY20, based on the current grant contract, a $70,000 increase above FY19 funding. Fare box revenue ($531,000) and the contribution from UGA ($647,000) will provide $1.2 million. Fare box revenue is projected to decline by $94,000 in FY20 due to a proposal to provide fare free transit services to senior citizens, disabled passengers & ACCGOV employees. UGA fare box revenue will increase in FY20 by $119,000, based on the current contract for ridership and grant revenue sharing. The General Fund contribution is $1.8 million, an increase of $103,500 above FY19 Budget, primarily due to support for a fare box revenue reduction and bus stop improvements. The FY20 Budget plans the use of $1.5 million of Available Unrestricted Net Position in the Transit Fund. Water and Sewer Fund
Based on estimates from the department, Water and Sewer operating revenues for FY20 will total $56.2 million, roughly 4% more than the FY19 Budget. These revenue estimates reflect six‐year planned rate increases (through FY22) accepted by the Mayor and Commission in May 2016 and outlined in the Financial Element of the Public Utilities Department Service Delivery Plan. The budgeted revenues will continue to fund operations, annual debt service expenses, partially fund capital and meets all bond debt service coverage ratio requirements.
Enterprise Funds Major Revenue Changes
FY20 Revenues
FY20 Budget B-11

A typical customer receiving both water and sewer service will experience a 3.8% increase in their bill for the same usage as FY19. At 3,000 gallons of consumption per month, the rate increase equals a water and sewer bill increase of $2.01 per month.
The adjusted fees for water and sewer services will become effective on July 1, 2019. Storm Water Utility Fund For FY20 total revenue for this utility will be approximately $4.2 million. This revenue estimate includes user fee changes ranging from a $5 increase per permit to a $30 increase a construction plan review. These rate changes for the land development permit fee are projected to generate an additional $7,500 of revenue. Proceeds from Stormwater revenue will fund operating expenses of $4.2 million along with capital improvements to the storm water system.
Hotel‐Motel Special Revenue Fund Receipts from this $0.07 tax are estimated to be $3.750 million in FY20, a $350,000 increase over the FY19 Budget.
Building Inspection Special Revenue Fund The FY20 Budget estimates $1.1 million of revenue, a $100,000 (10%) increase over FY19. The FY20 Budget anticipates no General Fund support. FY20 anticipates the use of $264,100 of fund balance, which will leave the fund with a sufficient level of operating reserve.
Emergency Telephone System (E911) Special Revenue Fund FY20 revenues from charges for services is projected to increase by $217,000 (12%) over FY19. This is due to the State increasing the prepaid wireless fee from $0.75 to $1.50, doubling the revenue for this item. The General Fund will transfer $82,100 more for FY20 (from $675,900 to $758,000) to fund an additional communications officer position and increases in benefit costs. The difference between the revenues and transfer from the General Fund and the projected expenditures, $147,000, will be funded with the balance in the E911 fund available from prior years’ operations. Affordable Housing Special Revenue Fund The FY20 Budget includes the second year of the Affordable Housing Special Revenue Fund. FY19 shifted the annual Payment in Lieu of Taxes (PILOT) received from the Athens Housing Authority (AHA) from the General Fund to this new fund for dedicated programs related to affordable housing. This annual revenue, estimated at $135,000 in FY20, will fund a full‐time Records Technician position and $100,000 payment to AHA for the first of a seven year commitment to improved affordable housing in Athens‐Clarke County. The fund will also use $24,400 of fund balance that is available from extra revenues received during FY19 operations.
Internal Service Funds support operating departments. These services are copier, postage, printing, fleet maintenance, fleet replacement, and self‐funded insurance programs. Revenues for Internal Service Funds are generated by allocating costs to operating departments for such services. The funding for these allocated costs is included in the departments’ operating budget as indirect expenses. Revenues generated for each Internal Service Fund are designed to offset annual operating expenses rather than to accrue income.
Special Revenue Funds Major Revenue Changes
Internal Service Funds Major Revenue Changes
FY20 Revenues
FY20 Budget B-12

Each year, Departments and Offices are asked to develop budgets to deliver current services within a budget limit. For FY20, they were limited to a budget equal to the FY19 Budget (not including salary and benefits). Sixteen departments submitted budget requests over their limits totaling roughly $1.3 million with the remaining departments submitting requests at or below the limit. This Budget includes the following increases in the General Fund totaling $439,000:
Central Services ($161,700) – to fund building maintenance contract increases and fleet cost increases
Manager’s Office‐GIO ($50,000 net increase) – to fund government‐wide license agreement for the GIS ESRI software
Manager’s Office‐Sustainability ‐ $40,000 for a clean energy plan
Board of Elections ($40,000) – for additional polling locations and early voting days
Fire ($30,500) – funding for training software, EMS certifications, and vehicle maintenance costs
Leisure Services ($30,000) – for full‐year cost of Grand Slam program
Other Department and Offices ($86,800) Fleet Replacement Also, Fleet Replacement contributions for non‐Public Safety vehicles have been increased by $165,200 for all funds, $60,800 for General Fund. FY20 is the third of a five year plan to increase annual funding to the Fleet Replacement Fund to gradually bring the annual amount to full funding. In FY05 and again in FY11, approved budgets included reductions or discounts in contributions to the Fleet Replacement Program totaling 35%. These past discounted contributions resulted in a shortfall in funding and a backlog of replacements. Beginning in FY18, approved budgets have included a phased increase in funding to gradually bring the fleet replacement contributions back to full funding.
For FY20, Public Safety vehicle replacement is proposed to be funded from the next SPLOST program. Therefore, $1,157,000 of funding for vehicle replacement contributions from Sheriff, Police, Fire and Corrections has been eliminated.
Other Expenses General Fund Contingency has increased from $800,000 in FY19 to $1,313,500 in FY20, a $513,500 increase. The Contingency remains less than 1% of the total General Fund operating budget. Also, $200,000 has been budgeted in General Fund Other General Administration for Mayor and Commission adjustments as needed.
Increases for New Initiatives and Additional Positions ACCGOV departments requested a total of $2.8 million in FY20 for new initiatives and additional positions ($2.1 million in the General Fund). The FY20 Budget includes $5.5 million in the General Fund and nearly $2.0 million across all funds (listed below by associated Mayor & Commission Strategic Commitment). This includes $4 million for a Commission proposed “Prosperity Package.” For more information on individual new initiatives, see the appropriate department page in Section C.
Maintaining Current Services
New Initiatives, Additional Positions, and SPLOST Impacts
FY20 Expenses
FY20 Budget B-13

Fund Department New Initiative/Additional Position Amount
Transportation and Mobility
General Fund Transit/Transfers Out Fare Free Transit for Sr. Citizens 85,000
Transit/Transfers Out Fare Free Transit for ACCGOV Employees 9,000
Transit/Transfers Out Bus Stop Improvement/Maintenance 9,500
Transit Fund Transit Convert 7 PT Vehicle Operators to 4 FT 51,000
Shared Prosperity
General Fund Other General Admin. Prosperity Package 4,000,000
Econ. Development Workforce Investment Program 150,000
Human Resources Expand Great Promise Internships 13,400
Safe and Prepared Community
General Fund Corrections Corrections Officer I (2 FT positions) 123,300
Offender Incentives 150,000
Fire Medical Emergency Reporting Software 12,000
Municipal Court Municipal Court Notification System 15,000
Police Mental Health Co‐Response Team 100,100
Police Take Home Vehicle Program 70,000
Additional Communications Officer 54,000
Superior Court Probation Lab Assistant (Net Cost) 11,300
Landfill Fund Solid Waste Hazardous Waste Tech ‐ CHARM 16,300
Water & Sewer Fund Public Utilities Phosphorus Project‐ 3 FT positions 161,300
Informed and Engaged Citizens
General Fund HCD Homeless Street Outreach 30,000
Manager’s Office Establish an Office of Inclusion 170,000
Accountable and Responsive Government
General Fund Board of Elections Poll Worker/Coordinator Pay Increase 91,100
Elections Coordinator (2PT to 1FT) 14,600
Fire Payroll System 15,700
HCD Housing Coordinator Position (3 months) 18,000
Human Resources Employee Relations Investigator 22,600
Leisure Services CityWorks Related Expenses 25,800
Manager’s Office Performance Management Dashboard 40,000
Operational Analysis Additional Office Storage System 14,200
Superior Court Felony Drug Ct to Gen Fund 149,800
Courts Assessment (one‐time) 40,000
Tax Assessors Mobile Assessor Appraisal System 27,200
Building Inspection Fund
Building Inspection Reduce Funding for Current Position (62,900)
Planning Renew funding for Bldg Insp Funded Position
84,500
Solid Waste Fund Solid Waste Part‐time Janitorial Position (Net Cost) 0
Water & Sewer Fund Public Utilities Accounting Analyst Position 61,600
SPLOST Impacts The FY20 Budget includes funding of $97,300 (of a requested $300,000) in additional operating support for SPLOST projects. This includes $46,700 in Central Services for additional maintenance support for the new Cooperative Extension and Fire State #2 buildings and $50,600 in Cooperative Extension for increased operating costs for the new larger building (janitorial, utilities, etc.).
FY20 Expenses
FY20 Budget B-14

Additional Positions and Other Personnel Changes The FY20 Budget includes a total of ten new fulltime positions and eight fulltime positions converted from twelve part‐time positions, bringing the authorized level of positions to 1,691. In the General Fund these include six positions:
a fulltime position for the new Office of Inclusion in the Manager’s Office
conversion of two part‐time positions to a fulltime Elections Coordinator position for Board of Elections
conversion of a part‐time position to a fulltime Medical Lab Assistant in Superior Court – Probation (Drug Testing Lab)
two additional Corrections Officers for Corrections
one fulltime Housing Coordinator in HCD (3 months) Outside the General Fund these include:
one additional Communications Officer in the Police Department (in the Emergency Telephone Fund but funded from General Fund support)
four fulltime Transit Vehicle Operators (conversion of seven part‐time positions to four fulltime)
two additional Transit Facility Service Workers (conversion of two part‐time positions to fulltime)
a Public Works Inspector for Pavement Management in Transportation & Public Works (funded from TSPLOST)
an Accounting Analyst for Public Utilities – Water Business Office
three fulltime positions in Public Utilities for the Phosphorus Discharge Project
FY20 Expenses
FY20 Budget B-15

Summary of FY20 Fulltime Authorized Position Changes Commission Approved
GENERAL FUND
Number Fulltime Position Type
Board of Elections 1 Elections Coordinator New Initiative
Corrections ‐ Diversion Center 2 Correctional Officer I New Initiative
Housing & Community Development 1 Housing Coordinator (3 months) New Initiative
Manager ‐ Office of Inclusion 1 Inclusion Office Personnel New Initiative
Superior Court ‐ Probation Services 1 Medical Lab Assistant New Initiative
Total General Fund 6
OTHER FUNDS
Number Fulltime Position Type
Emergency Telephone Fund
Police ‐ Central Communications 1 Communications Officer New Initiative
Water & Sewer Fund
Public Utilities ‐ Plant Maintenance 1 Electrician I New Initiative
Public Utilities ‐ Plant Maintenance 1 Plant Maintenance Mechanic New Initiative
Public Utilities ‐ Water Business Office 1 Accounting Analyst New Initiative
Public Utilities ‐ WRF I 1 Water Reclamation Operator I New Initiative
Subtotal Public Utilities 4
Transit Fund
Transit ‐ Operations 2 Facility Service Worker New Initiative
Transit ‐ Operations 4 Transit Vehicle Operator New Initiative
Subtotal Transit 6
TSPLOST Fund
Transportation & Public Works ‐ Engineering 1 Public Works Inspector New Initiative
Total Other Funds 12
Total Additional Fulltime Positions All Funds 18
Department
Department
FY20 Expenses
FY20 Budget B-16

Authorized Positions FY15 to FY20 FY 2015 FY 2016 FY 2017 FY 2018 FY 2019 FY 2020 Change
Department Authorizations Authorizations Authorizations Authorizations Authorizations Approved FY19 to FY20
Legislative Group
Attorney 6 6 6 6 6 6 0
Mayor and Commission 1 1 1 1 1 1 0
Clerk of Commission 2 2 2 2 2 2 0
Office of Operational Analysis 3 3 3 3 3 3 0
Total Legislative Group 12 12 12 12 12 12 0
Elected & Constitutional Group
Courts
Superior Court 30 32 33 34 34 35 1
State Court 8 7 7 7 7 7 0
Magistrate Court 11 11 11 11 11 11 0
Municipal Court 10 10 10 10 10 10 0
Probate Court 6 6 6 6 6 6 0
Juvenile Court 4 4 4 5 5 5 0
Courts Subtotal 69 70 71 73 73 74 1
Elected Officials
District Attorney 20 21 26 28 28 28 0
Solicitor General 16 17 17 18 18 18 0
Clerk of Superior Court 19 19 19 21 21 21 0
Tax Commissioner 19 19 19 19 19 19 0
Sheriff 191 194 194 194 194 194 0
Elected Officials Subtotal 265 270 275 280 280 280 0
Total Elected & Constitutional Group 334 340 346 353 353 354 1
Manager Group
Airport 7 7 7 7 7 7 0
Building Inspections & Permits 23 23 23 23 24 24 0
Central Services 88 91 102 102 103 103 0
Corrections 43 43 43 43 43 45 2
Economic Development 4 4 4 4 4 4 0
Finance 27 27 28 28 28 28 0
Fire & Emergency Services 186 186 186 187 187 187 0
Housing & Community Developmen 8 8 8 8 8 9 1
Human Resources 21 21 21 21 21 21 0
Information Technology 19 19 19 23 23 23 0
Leisure Services 73 73 73 73 73 73 0
Manager 5 5 5 5 5 5 0
Emergency Management 1 1 1 0 0 0 0
Office of Inclusion 0 0 0 0 0 1 1
Organizational Development 3 3 3 3 3 3 0
Public Information 2 2 3 3 3 3 0
Office of Sustainabil ity 0 0 0 2 2 2 0
Geospatial Information Office 0 0 0 2 2 2 0
SPLOST 3 3 3 3 3 3 0
Planning 20 21 21 19 18 18 0
Police 309 309 309 318 319 320 1
Public Util ities 195 195 195 194 194 198 4
Solid Waste 68 60 61 61 62 62 0
Transit 60 61 66 68 71 77 6
Transportation & Public Works 92 92 81 87 88 89 1
Subtotal 1,257 1,254 1,262 1,284 1,291 1,307 16
Board of Elections 3 3 3 3 3 4 1
Cooperative Extension 1 1 1 1 1 1 0
Tax Assessor 13 13 13 13 13 13 0
Subtotal 17 17 17 17 17 18 1
Total Manager Group 1,274 1,271 1,279 1,301 1,308 1,325 17
Grand Total 1,620 1,623 1,637 1,666 1,673 1,691 18
FY20 Expenses
FY20 Budget B-17

For FY20, the number of full‐time employees compared to the Athens‐Clarke County population (per thousand) will remain below 14 as shown in the graph below. This Budget is based on 1,691 full‐time authorized positions, an increase of seightteen positions compared to the current level.
13.5 13.3 13.1 13.1 13.4 13.1 13.0 13.2 13.2 13.3
0
2
4
6
8
10
12
14
16
FY11 FY12 FY13 FY14 FY15 FY16 FY17 FY18 FY19 FY20
ACC FULL‐TIME EMPLOYEES PER 1,000 RESIDENTS(FY11‐FY20)
Changes to Employee Compensation The FY20 budget includes $1.3 million in the General Fund ($1.8 million across all funds) for salary adjustments. The funding represents the resumption of the Performance Management Program (PMP) to encourage retention and reward active employees who meet the highest levels of performance. The $1.8 million total is equivalent to 2% of pay and related benefits and will be added to departmental budgets based on their proportional share of total salaries. Individual pay increases for employees will depend on performance. The budget also includes the full year funding of the pay plan which was implemented in January, 2019. Beginning in FY20, budgets for full‐time positions in the General Fund will factor in estimated vacancy savings, reducing the General Fund compensation budget $1.5 million. Employee Health In FY20, funding to the Employee Health Insurance Fund for active employees allows continuation of the three existing health plans (Conventional POS, Consumer Healthy Solutions (CHS) Select with HSA and CHS Value with HSA). The FY20 Budget for the Employee Health Insurance Fund is estimated to be $15.3 million, down from the FY19 Budget of $16.1 million, based on current trends for claims expenses. Across all funds, the Employer contribution is estimated at $10.4 million ($7.5 million in the General Fund) and the Employee contribution estimated is at $5.0 million.
Retiree Health In order to maintain current benefits, funding for Retiree Health Insurance and life insurance (Other Post‐Employment Benefits – OPEB), will increase to almost $6.0 million per year, a $1.3 million increase over the FY19 Budget ($1.0 in the General Fund). This increase is based on a growing number of retirees compared to this time last year, current trends in claims expenses, and an increase in the monthly HRA contribution for some retirees 65 and older. All the funding for the estimated $6.0 million in expenses in FY20 will come from a current year revenues. This funding level will pay for Pre‐65 retiree health claims and administration
Compensation and Benefits for FY20
FY20 Expenses
FY20 Budget B-18

expenses; provide for an increase in the monthly contribution to the Health Reimbursement Arrangement (HRA) accounts up to $228/month for retirees 65 and older hired prior to 7/1/2002 and maintains the current $195/month for those hired after that date; and fund the “doughnut hole” coverage for Post‐65 retirees. Currently, 257 retirees are Pre‐65 and 470 are Post‐65.
Pension Program The FY20 Budget plans a contribution of $10.4 million ($7.8 million from the General Fund) to the Pension Trust Fund, the same budgeted contribution as FY19. The Pension Board recently reviewed and approved updates to pension plan assumptions recommended by the plan actuaries. In addition, the Board approved a change to the assumed long term rate of return on pension assets from 8% to 7.75%. Even with a lower assumed rate of return and updated plan assumptions, the current level of funding is sufficient to meet the estimated actuarial determined contribution for FY20.
In the General Capital Projects Fund, a total of $2.2 million is included for capital projects in FY20. Current Services (CS) projects for FY20 total $1.7 million. FY20 Additions & Improvement (A&I) projects total $487,500. Over the 5 year CIP period, a total of $15.5 million has been included in the General Capital Projects Fund. Government‐wide, a total of $35.2 million has been included for capital projects in FY20. More detailed information on the Capital Budget and CIP can be found in Section D of this document. Major FY20 Capital Projects:
General Fund Projects:
Information Technology – $400,000 to replace equipment and software throughout the government based on the Strategic Automation Plan. See project on D‐47 for more information.
Police Department – $250,000 is included to fund additional on‐officer body cameras and requisite storage. See project on D‐74 for more information.
Manager’s Office – $165,000 is included to fund a talent management software suite (D‐61).
Transportation & Public Works – $150,000 is appropriated to continue to upgrade overhead street name signs (D‐128).
Projects in Other Funds:
Public Utilities – The Water and Sewer Fund Capital Budget for FY20 includes $9,951,800 to rehabilitate and replace sewer lines (D‐91), $5,300,000 for ongoing equipment and facilities replacement program (D‐93), $3,500,000 to improve water supply reliability (D‐97), $2,750,000 to rehabilitate and replace water lines (D‐94), water transmission grid improvements for $2,000,000 (D‐101), and $1,500,000 to manage and reuse residual solids (D‐96).
Solid Waste – The Landfill Enterprise Fund Budget includes $300,000 to replace a bulldozer (D‐108) and the Solid Waste Enterprise Fund Budget includes $200,000 for Automated Refuse/Recycling trucks (D‐121).
Fleet Replacement – $3,102,000 is included in the FY20 Capital Budget to work towards fully funding the replacement costs of vehicles. See D‐40 for more information.
Summary of FY20 Capital Budget and CIP
FY20 Expenses
FY20 Budget B-19

AN ORDINANCE TO PROVIDE FOR THE RAISING OF REVENUES AND THE APPROPRIATION OF FUNDS FOR ATHENS‐CLARKE COUNTY, GEORGIA, FOR THE FISCAL YEAR 2020 BEGINNING JULY 1, 2019 AND ENDING JUNE 30, 2020 TO PROVIDE FOR THE OPERATIONS OF GOVERNMENT DEPARTMENTS, BOARDS, AGENCIES, ELECTED OFFICES, AND OTHER GOVERNMENTAL ACTIVITIES; TO PROVIDE FOR THE LEVEL OF PERSONNEL AUTHORIZED FOR THE VARIOUS DEPARTMENTS AND AGENCIES; TO PROVIDE FOR A CAPITAL BUDGET; TO ESTABLISH 2019 PROPERTY TAX RATES; TO ESTABLISH COMPENSATION FOR THE CHARTER OFFICERS; TO ESTABLISH RATES AND STRUCTURE OF FISCAL YEAR 2020 HEALTH INSURANCE PROGRAMS; TO REPEAL CONFLICTING ORDINANCES; TO PROVIDE EFFECTIVE DATES; AND FOR OTHER PURPOSES. THE COMMISSION OF ATHENS‐CLARKE COUNTY, GEORGIA, HEREBY ORDAINS AS FOLLOWS:
SECTION 1. Pursuant to Section 7‐405 of the Charter, the sums of money as summarized in Exhibit A attached hereto and made a part of this Ordinance, shall be and are hereby adopted as the Operating Budget and the Capital Budget for Athens‐Clarke County for Fiscal Year 2020 (FY20), beginning July 1, 2019 and ending June 30, 2020.
SECTION 2. The appropriation of funds for all departments and agencies shall be as provided for in Exhibit A and supporting schedules.
SECTION 3. Each of the Enterprise and Internal Service Funds shall be operated in accordance with Proprietary Fund accounting standards and procedures and shall not be governed by the Governmental Fund budgetary accounting principles; however, the budgetary estimates upon which such budgets are adopted shall be retained in memorandum form for budget control purposes and utilized in the preparation of comparative operating statements.
SECTION 4. The personnel levels provided for in the Personnel Authorization Schedule for all departments and agencies, as provided in the budget document entitled "FY2020 Annual Operating and Capital Budget: The Unified Government of Athens‐Clarke County July 1, 2019–June 30, 2020" are hereby adopted as the maximum employment levels for such departments and agencies and shall not be increased without the approval of the Mayor and Commission.
SECTION 5. All financial operations shall be accounted for in accordance with Generally Accepted Accounting Principles and Standards.
SECTION 6. In accordance with the Official Code of Georgia Annotated Sections 33‐8‐8.1 and 33‐8‐8.2, the proceeds from the tax on insurance premiums, estimated to be $8,609,000 for FY20, shall be used for the provision of services to all residents of Athens‐Clarke County.
SECTION 7. In accordance with the Official Code of Georgia Annotated Section 46‐5‐133, 46‐5‐134,
and 46‐5‐134.2; the monthly "9‐1‐1 charge" of $1.50 per exchange access facility, the $1.50 per month “wireless enhanced 9‐1‐1 charge”, and the $1.50 per retail transaction for the “pre‐paid wireless charge” are reaffirmed for the period July 1, 2019 – June 30, 2020.
SECTION 8. The Manager is further authorized to transfer sums up to $15,000 from the General Fund Contingency to meet unbudgeted obligations of the Government. The Manager is required to notify the Mayor and Commission of each of these transfers from Contingency at the next scheduled regular meeting under the provisions of Section 7‐408 of the Charter of the Unified Government of Athens‐Clarke County, Georgia.
FY20 Budget Ordinance
FY20 Budget B-20

SECTION 9. The Manager is further authorized to transfer sums within each fund’s capital budget among projects and accounts up to $100,000 to meet project obligations of the government. The Manager is required to notify the Mayor and Commission of each of these transfers at the next scheduled regular meeting under the provisions of Section 7‐408 of the Charter of the Unified Government of Athens‐Clarke County, Georgia.
SECTION 10. The Manager is further authorized to approve the application for grants and accept
grants on behalf of the government up to $50,000 and to amend the Operating or Capital Budget for the grants as needed. This authority is permitted if the grant meets all of the following conditions: (1) matching funds are appropriated or the grant does not require matching funds; (2) the government will not be required to otherwise commit resources or maintain any services after the end of the grant period; (3) no positions will be added with the grant; and (4) no vehicles will be added to the government’s Fleet Replacement Program as a result of acceptance of the grant.
The Manager is required to notify the Mayor and Commission of approval or acceptance of each grant at the next scheduled regular meeting under the provisions of Section 7‐400 of the Charter of the Unified Government of Athens‐Clarke County, Georgia. The Manager and appropriate staff are authorized to execute all required documents associated with grants accepted under this provision.
SECTION 11. The budget document, entitled "FY2020 Annual Operating and Capital Budget: The Unified Government of Athens‐Clarke County July 1, 2019–June 30, 2020" shall be maintained on file in the Office of the Clerk of Commission.
SECTION 12. The ad valorem tax rate for Athens‐Clarke County is hereby levied for the year 2019 upon all real and personal property within the government not exempt from taxation under law as follows:
Maintenance and Operations (General Fund) 13.95 mills SECTION 13. Under authority of the Act creating the Downtown Athens Development Authority, 1977
Ga. Laws 3533‐3538, there is hereby levied and assessed for the year 2019 on the real property in the downtown Athens area (said downtown area most recently defined in House Bill No. 590, 2017 Ga. Laws 3900‐3903), a tax of one (1) mill upon the value of said real estate as fixed by the Tax Digest of Athens‐Clarke County.
SECTION 14. Pursuant to Sections 4‐101, 4‐103, and 4‐104 of the Charter of the Unified Government
of Athens‐Clarke County, the annual compensation of the charter officers, as provided for by ordinance and contract for FY20, shall be $179,711 plus a $6,000 car allowance for the Manager, shall be up to $173,870 plus up to $4,800 car allowance for the Attorney and $85,420 plus a $4,200 car allowance for the Internal Auditor.
SECTION 15. Pursuant to Official Code of Georgia Annotated Section 48‐13‐93(a)‐(2), the proceeds of the excise tax on the rental charge for motor vehicles, projected to be $200,000 during FY20, shall be used for promoting industry, trade, commerce, and tourism. The proceeds from this tax in FY20 shall be used to support the Athens‐Clarke County Economic Development Department, with an estimated budget of $700,000.
SECTION 16. Pursuant to Section 1‐9‐19 of the Code of Ordinances of the Unified Government of
Athens‐Clarke County, the Benefits Summary of the Health Insurance and Health Benefits Program and the premiums or contributions for employees and retirees, as applicable, shall be as follows:
FY20 Budget Ordinance
FY20 Budget B-21

(a) Pursuant to Athens‐Clarke County Code Section 1‐9‐19(a), the government shall provide as an option to employees the plans of health insurance coverage as described in the Summary Plan Document entitled “Consumer Healthy Solutions (CHS) Plan with a Health Savings Account (HSA) Medical Benefit Booklet for the Unified Government of Athens‐Clarke County,” effective July 1, 2018, and prepared by Anthem for the Unified Government of Athens‐Clarke County. This booklet is on file and available for public inspection in the office of the Clerk of Commission, Room 204, City Hall, 301 College Avenue, Athens, Georgia and on file and available for public inspection in the office of the Human Resources Department, 375 Satula Ave., Athens, Georgia. Any plan changes effective January 1, 2020 may result in new summary plan documents, which will be available for public inspection in the office of the Clerk of Commission in or around October, 2019. This Section 16 shall be subject to amendment by the Commission to incorporate any such plan changes prior to the effective date of such changes.
(b) During the first open enrollment period, employees have the option to select from among the following health insurance coverage: the option described in the preceding paragraph or the plans of health insurance coverage as described in the Summary Plan Document entitled “BlueChoice Option Point of Service Open Access dated July 1, 2018 –Conventional Plan Benefit Booklet for the Unified Government of Athens‐Clarke County,” Administered by BlueCross BlueShield Healthcare Plan of Georgia, incorporated herein by reference. This booklet is on file and available for public inspection in the office of the Clerk of Commission, Room 204, City Hall, 301 College Avenue, Athens, Georgia and on file and available for public inspection in the office of the Human Resources Department, 375 Satula Ave., Athens, Georgia. Any plan changes effective January 1, 2020 may result in new summary plan documents, which will be available for public inspection in the office of the Clerk of Commission in or around October, 2019. This Section 16 shall be subject to amendment by the Commission to incorporate any such plan changes prior to the effective date of such changes.
(c) Pursuant to Athens‐Clarke County Code Section 1‐9‐19(b), the Designated Plan for retirees not yet 65 years of age and the Designated Dependent Plan for spouses of retirees not yet 65 years of age, and eligible dependent children, shall be that plan described as the BlueChoice Point of Service (POS) Open Access Plan of health insurance coverage as further described in the Summary Plan Document entitled “BlueChoice Option Point of Service Open Access dated July 1, 2018 – Traditional Plan Benefit Booklet for the Unified Government of Athens‐Clarke County,” Administered by BlueCross BlueShield Healthcare Plan of Georgia, incorporated herein by reference. This booklet is on file and available for public inspection in the office of the Clerk of Commission, Room 204, City Hall, 301 College Avenue, Athens, Georgia and on file and available for public inspection in the office of the Human Resources Department, 375 Satula Ave., Athens, Georgia. The plan options for retirees and for retiree dependent coverage shall be any other health insurance coverage plans offered to employees in (a) and (b) above. Any plan changes effective January 1, 2020 may result in new summary plan documents, which will be available for public inspection in the office of the Clerk of Commission in or around October, 2019. This Section 16 shall be subject to amendment by the Commission to incorporate any such plan changes prior to the effective date of such changes.
(d) Those retirees not yet 65 years of age who are eligible for PPO shall be provided the plan of
health insurance coverage as described in the Summary Plan Document entitled “Blue Choice PPO Benefit Booklet for the Unified Government of Athens‐Clarke County,” Administered by BlueCross Blue Shield of Georgia, dated July 1, 2018, incorporated herein by reference. This booklet is on file and available for public inspection in the office of the Clerk of Commission, Room 204, City Hall, 301 College Avenue, Athens, Georgia and on file and available for public inspection in the office of the Human Resources Department, 375 Satula Ave., Athens, Georgia. Any plan changes effective January 1, 2020 may result in new summary plan documents, which will be available for public inspection in the office of the Clerk of Commission in or around October, 2019. This Section 16 shall be subject to amendment by the Commission to incorporate any such
FY20 Budget Ordinance
FY20 Budget B-22

plan changes prior to the effective date of such changes. (e) The premiums to be paid for the programs of health insurance for employees are set forth in
the document entitled "The Unified Government of Athens‐Clarke County Rate Sheet – July 1, 2019,” incorporated herein by reference and on file and available for public inspection in the office of the Clerk of Commission, Room 204, City Hall, 301 College Avenue, Athens, Georgia and on file and available for public inspection in the office of the Human Resources Department, 375 Satula Ave., Athens, Georgia. The premiums to be paid for plans effective January 1, 2020 will be set forth in the document entitled “The Unified Government of Athens‐Clarke County 2020 Benefits Enrollment Guide,” which will be made available for public inspection in the office of the Clerk of Commission in or around October, 2019. This Section 16 shall be subject to amendment by the Commission to incorporate any such changes in premiums.
(f) The premiums to be paid for the programs of health insurance for those retirees, under age
65, subject to such insurance as described in paragraphs (c) and (d) hereof are set forth in the document entitled "The Unified Government of Athens‐Clarke County Retiree Rate Sheet – July 1, 2019,” incorporated herein by reference and on file and available for public inspection in the office of the Clerk of Commission, Room 204, City Hall, 301 College Avenue, Athens, Georgia and on file and available for public inspection in the office of the Human Resources Department, 375 Satula Ave., Athens, Georgia. The premiums to be paid for plans effective January 1, 2020 will be set forth in the document entitled “The Unified Government of Athens‐Clarke County 2020 Retiree Benefits Enrollment Guide,” which will be made available for public inspection in the office of the Clerk of Commission in or around October, 2019. This Section 16 shall be subject to amendment by the Commission to incorporate any such changes in premiums.
(g) Pursuant to Athens‐Clarke County Code Section 1‐9‐19(c) the government shall provide to
retirees who are age 65 or older those health benefits as described in the “2019 Enroll in Additional Medicare Coverage for 2019” and “Funding Guide to Reimbursement,” and incorporated herein by reference. Such documents are on file and available for public inspection in the office of the Clerk of Commission, Room 204, City Hall, 301 College Avenue, Athens, Georgia and on file and available for public inspection in the office of the Human Resources Department, 375 Satula Ave., Athens, Georgia. SECTION 17. The effective date of this ordinance shall be July 1, 2019.
SECTION 18. All Ordinances or parts of ordinances in conflict with this Ordinance are hereby repealed.
Adopted June 4, 2019 by Commission
Approved June 7, 2019 by Mayor
FY20 Budget Ordinance
FY20 Budget B-23
There are a number of requirements under Georgia Law and the Unified Government’s Charter that must be met as a part of preparing and adopting the Annual Budget. These requirements include:
Budgets must be balanced so that projected expenditures do not exceed projected revenues and available fund balances.
Budgets must be provided at least at the department level and be separated by fund.
A separate Operating and Capital Budget must be submitted and adopted.
The Mayor’s Recommended Budget must be submitted to the Commission at least 60 days prior to beginning of the fiscal year.
At the time the Recommended Budget is provided to the Commission, it shall be made available for public review.
Public Hearings must be held to receive public input on the proposed budget at least one week prior to the budget being adopted.
Public Hearings must be held to receive public input if the proposed budget includes an increase in the property tax as defined by the Taxpayer Bill of Rights (O.C.G.A. 48‐5‐32.1).
During the fiscal year, the Mayor and Commission may change the Budget as needed through the adoption of a budget ordinance identifying the change. Also, departments can transfer budget funds between line items within their department’s budget to cover unanticipated expenses with approval of the Finance Director. However, the department’s total budget or number of full‐time authorized positions cannot increase without Mayor and Commission approval.
The Annual Operating and Capital Budget is the financial plan for raising revenues and expending funds for all Athens‐Clarke County departments, offices and constitutional officials.
The process to develop the Annual Operating and Capital Budget begins about nine months prior to the beginning of the fiscal year. Departments and Constitutional Officials submit Operating and Capital Budget requests for review by the Manager and the Mayor. Prior to May 1 each year, the Mayor must submit a Recommended Budget to the Commission for review. The Commission will review the Mayor’s Recommended Budget and make any adjustments they feel are necessary and adopt the budget in June. Major steps in the Annual Budget development process include:
October – Mayor & Commission provide Budget goals and directions and November Operating Budget directions sent to Departments & Offices November Departments Submit Capital Project requests and
updates to the 5 year Capital Improvement Plan (CIP).
Legal and Charter Requirements for the Annual Budget
Annual Budget Development Process
FY20 Budget Development
FY20 Budget B-24

January Departments Submit Operating Budget Requests.
February Mayor and Commission review Independent Agencies Budget Requests.
February ‐ Manager and Mayor meet with Department and March Constitutional Officials to review Budget requests. April Mayor sends a Recommended Budget to Commission. May Commission reviews Mayor Recommended Budget. June Commission adopts budget for next fiscal year
and establishes the property tax millage rate. July Budget for next fiscal year begins on July 1.
FY20 Budget Development
FY20 Budget B-25

To promote a safe, consistent, and efficient aviation environment; provide quality aviation products and
services; and serve as a catalyst in the creation and development of aviation related industry in Athens – Clarke
County. The airport will strive for self‐sufficiency through the development and implementation of competitive
rates and fees.
Build on and maintain modern and technologically up‐to‐date airport facilities and infrastructure.
Achieve and maintain financial self‐sufficiency.
Foster a work environment that leads to high employee morale.
Establish scheduled and increase non‐scheduled passenger service.
Expand the general aviation experience.
Inform and connect community, businesses, and customers.
Meet with the Airport Authority monthly to coordinate airport operations.
Work with the Airport Authority, consultants, and ACC to secure a new airline.
Meet with airport engineers monthly to manage airport projects.
Coordinate airport projects with the GDOT and FAA on a monthly basis.
Meet monthly with the Operations Supervisor and Business Coordinator to review the airport financial and
operational status.
Meet monthly with the operations staff to review airport issues.
Work to involve employees in airport projects and operations.
Mission
Goals
Objectives
Airport
FY20 Budget C-1

Outcomes and Performance Measures
Current Goal FY14 FY15 FY16 FY17 FY18
Comments or Analysis
Number of Aircraft Operations Data only 42,850 29,939 34,868 35,769 37,506 Control Tower count
Number of NTSB reported incidents
0 0 0 0 0 0Incident of sufficient concern to generate NTSB report
Aircraft based on field Stable 76 88 90 93 95Includes single engine, twin engine, turbine and helicopter
Runway & taxiway area-weighted pavement condition indication (PCI) score
>70 60 60 60 60 60Rwy 9/27 will be upgraded with FY19 improvements. All other pavement will remain the same
FAA Part 139 Safety & Cert. Inspection
Pass Pass Pass Pass Pass PassAirport passed inspection with only minor corrections needed.
Aviation Gas Sold (in gallons) Increase 107,651 115,000 102,454 115,783 115,822FY19 revenues down due to 9/27 rehab project. Project completion will return revenues to normal.
Jet A Fuel Sold (in gallons) Increase 313,236 307,000 323,290 337,157 406,096FY19 revenues down due to 9/27 rehab project. Project completion will return revenues to normal.
Margin on Fuel Sales Increase $512,186 $576,481 $697,347 $668,020 $753,378FY19 revenues down due to 9/27 rehab project. Project completion will return revenues to normal.
% of t-hangars leased 100% 89% 90% 95% 90% 95% Remains steady.
% of FBO hangars leased 100% 100% 100% 100% 100% 100%
Airport Enterprise Fund Operating Income/(Loss)
>0 ($299,413) ($256,565) ($79,708) ($75,647) ($12,390)Need positive operating income to cover non-operating expenses (capital, loan payments, etc.)
General Fund Supplement Reduce $190,577 $190,577 $194,389 $196,333 $105,826General Fund cash support to Enterprise Fund. FY18 budget = $105,826
Days Cash on Hand at End of Year
>90 28 51 104 132 106
Non-Scheduled Large Charter Enplanements
Data only 1,155 2,264 3,012 2,832 3,013
Tenant evaluation of the facility (5 pt scale - 5 is highest)
>3External evaluation began 10/1/19. Not enough data obtained yet to submit.
Customer rating of staff support (5 pt scale - 5 is highest)
>4External evaluation began 10/1/19. Not enough data obtained yet to submit.
Began 10/1/2019
Began 10/1/2019
Athens-Ben Epps Airport
Provide a safe and efficient airport for commercial and general aviation users
Strive for financial self-sufficiency for the Airport Enterprise Fund by increasing revenues
Operate within the approved Enterprise Fund budget while reducing dependency on the General Fund
Increase annual commercial passengers
We strive to satisfy our customers
Performance Measures
Airport
FY20 Budget C-2
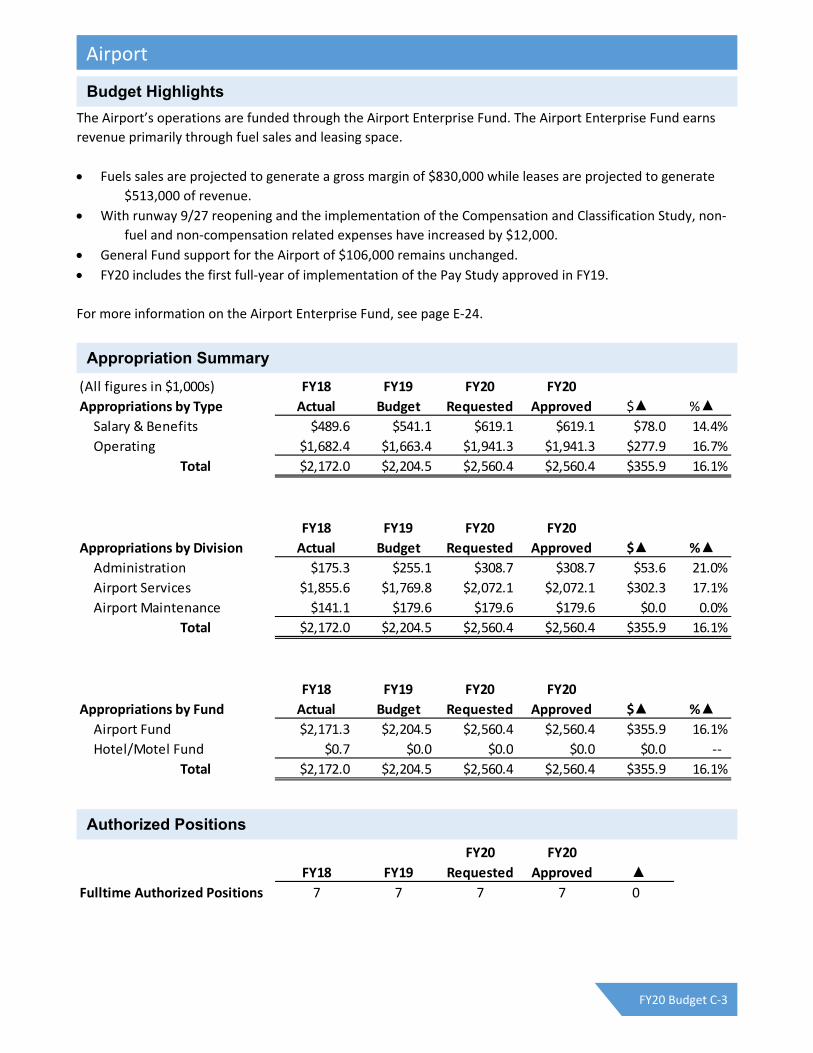
The Airport’s operations are funded through the Airport Enterprise Fund. The Airport Enterprise Fund earns
revenue primarily through fuel sales and leasing space.
Fuels sales are projected to generate a gross margin of $830,000 while leases are projected to generate
$513,000 of revenue.
With runway 9/27 reopening and the implementation of the Compensation and Classification Study, non‐
fuel and non‐compensation related expenses have increased by $12,000.
General Fund support for the Airport of $106,000 remains unchanged.
FY20 includes the first full‐year of implementation of the Pay Study approved in FY19.
For more information on the Airport Enterprise Fund, see page E‐24.
(All figures in $1,000s) FY18 FY19 FY20 FY20
Appropriations by Type Actual Budget Requested Approved $▲ %▲Salary & Benefits $489.6 $541.1 $619.1 $619.1 $78.0 14.4%
Operating $1,682.4 $1,663.4 $1,941.3 $1,941.3 $277.9 16.7%
Total $2,172.0 $2,204.5 $2,560.4 $2,560.4 $355.9 16.1%
FY18 FY19 FY20 FY20
Appropriations by Division Actual Budget Requested Approved $▲ %▲Administration $175.3 $255.1 $308.7 $308.7 $53.6 21.0%
Airport Services $1,855.6 $1,769.8 $2,072.1 $2,072.1 $302.3 17.1%
Airport Maintenance $141.1 $179.6 $179.6 $179.6 $0.0 0.0%
Total $2,172.0 $2,204.5 $2,560.4 $2,560.4 $355.9 16.1%
FY18 FY19 FY20 FY20
Appropriations by Fund Actual Budget Requested Approved $▲ %▲Airport Fund $2,171.3 $2,204.5 $2,560.4 $2,560.4 $355.9 16.1%
Hotel/Motel Fund $0.7 $0.0 $0.0 $0.0 $0.0 ‐‐
Total $2,172.0 $2,204.5 $2,560.4 $2,560.4 $355.9 16.1%
FY20 FY20
FY18 FY19 Requested Approved ▲Fulltime Authorized Positions 7 7 7 7 0
Budget Highlights
Appropriation Summary
Authorized Positions
Airport
FY20 Budget C-3

The Athens‐Clarke County Attorney’s Office provides legal services to Unified Government of Athens‐Clarke
County through its representation, including the Mayor and Commission, the Manager, Constitutional Officers,
and all other Departments and Divisions of the Athens‐Clarke County Government. The Attorney’s Office handles
legal matters, including instituting and defending lawsuits except for lawsuits covered by liability insurance. The
Office communicates with the Justice Department and other Federal and State agencies to keep the Athens‐
Clarke County government in compliance with Federal and State laws and regulations. The Attorney’s Office
researches and drafts proposed local legislation concerning Athens‐Clarke County. In addition, the Office
researches and drafts ordinances and resolutions to be considered for adoption by the Mayor and Commission.
The office drafts or reviews all contracts and deeds to be executed or accepted by the government. A
representative of the Attorney's Office attends all meetings of the Mayor and Commission, Planning
Commission, Historic Preservation Commission, Hearings Board, and Board of Tax Assessors, as well as
Commission work sessions and committee meetings.
Our primary goal is to continue to provide the legal services needed to serve the Unified Government. We will
also expand the services we provide to ensure that acts of the Government are reviewed and are modified, if
necessary, to accord with applicable law.
Work with the Mayor and Commission as they identify new priority projects that require assistance from the
Attorney’s Office.
Continue to proceed as necessary against properties that have been identified for demolition as a result of changes to the Unified Government's secured structure ordinance.
Continue to work with the Legislative Review Committee and the Government Operations Committee to provide legal assistance as needed.
Continue to assist departments and offices in responding to an increasing number of public records requests, under the Open Records Act.
Continue to work with the Economic Development Department regarding specific economic development projects.
Continue “quality of life” ordinance enforcement and regulatory and administrative support for alcoholic beverages, taxicabs and red light camera and school bus stop arm camera programs.
Continue to supply support for enterprise fund activities, such as Public Utilities, Airport, Transit and Stormwater Utility.
Assist the Human Resources Department with ongoing personnel issues, policy development and claims management.
Provide litigation support for claims counsel on pending claims cases.
Assist the Department of Transportation and Public Works with compliance with state and federal environmental laws and regulations.
Work with the Police, Fire, and Solid Waste Departments to protect public health safety regarding activities in the Downtown District, particularly enforcement of fire safety, alcoholic beverages and solid waste ordinances.
Review and advise departments throughout the government regarding contracts.
Mission and Goals
Objectives
Attorney
FY20 Budget C-4

(1)The installation of a new Red Light Camera on U.S. Highway 29 and Georgia Highway 72 will increase the
number of citations.
There are no significant budget changes for FY20.
(All figures in $1,000s) FY18 FY19 FY20 FY20
Appropriations by Type Actual Budget Requested Approved $▲ %▲Salary & Benefits $566.2 $604.6 $622.0 $607.3 $2.7 0.4%
Operating $75.4 $84.5 $84.7 $84.7 $0.2 0.2%
Total $641.6 $689.1 $706.7 $692.0 $2.9 0.4%
FY20 FY20
FY18 FY19 Requested Approved ▲Fulltime Authorized Positions 6 6 6 6 0
Actual Forecast
FY16 FY17 FY18 FY19 FY20
Ordinances / Resolutions / Policies/ Legislation Drawn 50 59 67 52 65
Municipal Court Cases 306 334 337 385 425
Red Light Camera/School Bus Arm Cases 4,400 7,319 9,021 7,662 9,500(1)
Cases in Superior/State/Federal/Appellate Courts 18 6 4 4 6
Information / Litigation Files Opened / Legal Opinions 28 27 18 32 28
Contracts / Deeds / Drawn / Approved as to Form 252 223 231 259 270
Nuisance Abatement Cases 13 10 12 8 12
Performance Measures
Budget Highlights
Appropriation Summary
Authorized Positions
Attorney
FY20 Budget C-5
The mission of the Athens‐Clarke County Board of Elections is to provide excellent election services, ensuring
accessibility, protecting the integrity of votes, and maintaining a transparent, accurate and fair process. Our
vision is to provide the best possible election services for the voters and candidates of Athens‐Clarke County.
Enhance voter registration, voting opportunities and voter education for the citizens of ACC.
Provide quality information and excellent customer service to candidates, public officers, poll workers and elected officials.
Maintain knowledge of federal and state election laws.
Provide a team of well‐prepared and responsive poll workers for all elections held in FY20.
Properly maintain all voting equipment and prepare for implementation of new equipment, a very plausible result of the 2019 General Assembly.
Host surrounding counties with equipment training by providing our training room as a central location.
Properly assign voters to political districts in Athens‐Clarke County with minimal errors.
Consider the current polling locations for necessary separating of those that are currently merged/consolidated.
Survey the county for potential Advance Voting satellite sites and possible Election Day polling locations
Successfully maintain and update statewide voter registration system daily.
Properly maintain Easy File and timely receive campaign filings of all Elected Officials.
Conduct one countywide Special Election (SPLOST) in November 2019 and two major scheduled elections
(Presidential Preference Primary and the General Primary) during FY20 with no legal challenges.
Demonstrate new voting equipment and distribute printed election material to the citizens of Athens‐Clarke County at public meetings and gatherings throughout the year.
Attend training sessions regarding new equipment immediately after implementation and mandated for use statewide.
Properly train over 200 poll workers, elected officials and other staff on proper handling, assembling, troubleshooting and testing of new voting equipment upon implementing, purchasing and receiving as inventory.
Properly organize and store all voting equipment and inventory at the facility on Lexington Road.
Provide assistance and input on committees for state election organizations and the Secretary of State Elections Division.
Evaluate and implement improvements to existing 20 polling sites for our 24 voting precincts.
Hire and train poll workers for elections conducted in FY20.
Maintain training and education required of Superintendents of Elections.
Conduct Advance Voting, adding multiple sites throughout the county, with possibly providing other options for our voters by providing extended hours and additional days such as an additional Saturday voting and/or Sunday voting.
Mission
Goals
Objectives
Board of Elections
FY20 Budget C-6

Outcomes and Performance Measures
Current Goal
FY14 FY15 FY16 FY17 FY18 Comments or Analysis
We provide election and voter registration services for the citizens of Athens-Clarke County
Registered Active Voters 65,000 54,683 55,502 51,199 60,411 68,586This # has varied from fiscal to fiscal. Will impact
voter turnout percentages.
Average Total Active Voters per Polling Location
3,000 2,278 2,313 2,438 2,877 3,429This # has increased as total active voters has
increased.
Election Day Voters (EDV) 36%5,478
(10.01%)10,792
(19.44%)6,455
(12.61%)19,431
(32.16%)12,380
(18.62%)
This # has increased dramatically. However, AIP
and ABM numbers remains equally favorable
options for voting.
Advance Voters (AIP) 45%2,026
(3.70%)4,522
(8.14%)1,375
(2.69%)23,423
(38.77%)5,935
(8.92%)
This has increased dramatically. Will impact # of
voting locations and precincts in the future.
Absentee Voters (ABM) 6%210
(.38%)764
(1.38%)197
(.38%)2,718
(4.50%)511
(.77%)
This has increased dramatically. Will impact # of
voting locations and precincts in the future.
# Voting Precincts 24 24 24 24 24 24This remains steady and may impact precinct
consolidating in the future.
# Voting Locations 15 24 24 21 21 20
This # has decreased. Voters taking advantage
of early processes of voting may impact # of less
locations in the future.
# Early Voting Locations 3 1 1 1 4 3This # has increased as the favor of
Early/Advance Voting.
# Poll Officers 175 165 175 165 224 175
This # has varied from fiscal to fiscal.
Consideration of decreasing # polling places will
also decrease # of poll workers.
# Laborers* 200 175 185 178 250 185Laborers include the total # poll workers and part-
time seasonal office staff.
Voting Equipment Inventory (DRE Touch Screens)
245 259 245 245 245 245
This number is maintained. Future Bill(s) from
General Assembly may impact the need of
replacing current system.
Total # Machines actually used 200 147 102 125 205 181This # varies based on ballot content and # active
voters per polling location.
Ballot Printing Cost $12,000 $4,496 $17,389 $43,066 $7,458 $4,533
Varies from FY to FY. Decrease is a result of
purchase of Balotar System (ballot printing on
demand)
# Training hours (average of 3hrs/worker)
600 495 525 495 672 525O.C.G.A. § 21-2-99 requires adequate training of
poll workers prior to each election cycle.
# Voter IDs Created Data Only N/A 238 526 711 723
SEB Rule 183-1-20 requires issuance of Voter ID
Cards to any voter who does not possess any of
the 6 acceptable forms of ID required for voting.
and protect the integrity of the vote.
% Voter Turnout 76% 14.15% 46.05% 27.43% 75.59% 28.34%This # varies. An FY that includes a General
Election normally results in a higher voter turnout.
% of polling places handicap accessible
100% 100% 100% 100% 100% 100%
Federal Law § 508 requires ADA compliance of
all polling locations. An annual survey is
completed to ensure 100% compliant.
% of polling places in compliance (equipment)
100% 100% 100% 100% 100% 100%
SEB Rule 183-1-12-.02 requires VWD devices for
all polling locations. Locations are equipped to
take care of the needs of all voters.
% of polling places in compliance (size)
100% 100% 100% 100% 100% 100%
Federal Law § 508 requires ADA compliance of
all polling locations. An annual survey is
completed to ensure 100% space compliance.
Registration Data Error Rate 100% 0% 0% 0% 0% 0%Office staff conducts a daily audit process to
ensure 100% error in data entry.
Athens-Clarke County Board of Elections
Performance Measures
Board of Elections
FY20 Budget C-7

The FY20 Budget for Board of Elections is $748,600, an increase of $154,500 above FY19.
Three elections are scheduled in FY20: SPLOST ‐ November 2019, Presidential Preference Primary ‐ March
2020, and General Primary ‐ May 2020.
$39,600 is included to unmerge some polling precincts by adding polling locations and advance voting
days.
$91,100 is included to increase pay rate range of poll workers from $8 ‐ $10/hour to $10 ‐ $12/hour.
$14,600 is included for conversion of two part‐time Clerk positions to one full‐time Elections Coordinator.
An applied position vacancy estimate has reduced personal service expense by $5,300.
(All figures in $1,000s) FY18 FY19 FY20 FY20
Appropriations by Type Actual Budget Requested Approved $▲ %▲Salary & Benefits $414.9 $465.5 $636.5 $620.0 $154.5 33.2%
Operating $73.2 $128.6 $138.6 $128.6 $0.0 0.0%
Total $488.1 $594.1 $775.1 $748.6 $154.5 26.0%
FY20 FY20
FY18 FY19 Requested Approved ▲Fulltime Authorized Positions 3 3 5 4 1
Budget Highlights
Appropriation Summary
Authorized Positions
Board of Elections
FY20 Budget C-8

The Athens‐Clarke County Building Permits and Inspection Department exists for the purpose of protecting the
public's health, safety, and general welfare. We accomplish this by ensuring compliance with adopted codes
that regulate structural strength, stability, sanitation, lighting, ventilation, fire safety, and other hazards
associated with construction, alteration, removal, demolition, use, or occupancy of buildings, structures, or
property.
Maximize the number of properties and structures that comply with adopted standards.
Provide quality inspections, customer service, and development services that are efficient, cost effective,
accurate, and responsive to the citizens of Athens‐Clarke County.
Improve the safety and appearance of properties and buildings within Athens‐Clarke County by enforcing
local ordinances, property maintenance codes, and construction codes.
To perform 98% of all inspections of footing, slabs, excavations, electrical service changes and emergency
repairs within four business hours of the time the work is ready for inspection.
To perform at least 95% of all requested rough‐in and final inspections within two workdays.
To respond to at least 95% of all single‐family soil erosion complaints and to initiate compliance and/or
enforcement processes within eight business hours.
To process 95% of all single‐family and secondary permit applications within one workday.
To investigate 99% of all complaints received by our office within three business days.
To investigate 100% of the housing and nuisance complaints received and initiate compliance and/or
enforcement action.
To respond to 100% of ordinance violation complaints and initiate compliance and/or enforcement action.
To provide proactive enforcement of illegal signs erected without permits or in the public right‐of‐way.
To provide proactive code compliance and enforcement services that educates and provides an
understanding of the compliance process to citizens.
To recover through permit fees 100% of the operating expenses for the Construction Division.
Performance Measure Goal FY16 FY17 FY18 Reference
Building Permits Issued 900 915 852 1,050
Electrical Permits Issued 800 890 970 957
HVAC/Gas Permits Issued 600 862 948 1,057
Plumbing Permits Issued 600 572 658 683
Total Construction Inspections 9000 9352 9916 11,282
Building Inspection Department staff are committed to protecting the public's safety by ensuring compliance with adopted building codes…
Mission
Goals
Objectives
Performance Measures
Building Permits & Inspection
FY20 Budget C-9

The Building Inspection Department primarily operates within two separate funds. The Code Enforcement
Division is fully funded by the General Fund, while the Construction Inspection and Administration divisions are
funded through the Building Inspection Special Revenue Fund.
Projected revenues for the Building Inspection Fund have increased $100,000 over last year to $1,100,000.
With the use of fund balance, Special Revenue Fund revenues are sufficient to cover expenses.
Funding for two pieces of software, Blue Beam and EnerGov, are approved to be moved to the Building
Inspection Special Revenue Fund, reducing General Fund expenses and increasing Building Inspection
Fund expenses by $17,600.
Funding for one Inspector position is being eliminated, leaving the position authorized but unfunded and
lowering Building Inspection Fund expenses by $62,900.
For more information on the Building Inspection Fund (which also includes some expenses for Planning and
Zoning), see page E‐18.
Performance Measure Goal FY16 FY17 FY18 Reference
Front Yard Parking 400 410 425 293
Roll Cart Violations 500 538 589 434
Sign Ordinance Violations 3000 3,332 3238 4,359
Litter/Accumulation of Refuse 700 724 812 881
Junked Vehicles 300 337 536 576
Customer service satisfaction survey 80% N/A N/A N/AInspections conducted within 2 business days of requested time 95% N/A N/A N/A
...and by ensuring compliance with ordinances that enhance quality of life for Athens-Clarke County citizens.
We strive to provide these services to the citizens of Athens-Clarke County in a customer friendly and accountable way.
Budget Highlights
Building Permits & Inspection
FY20 Budget C-10

(All figures in $1,000s) FY18 FY19 FY20 FY20
Appropriations by Type Actual Budget Requested Approved $▲ %▲Salary & Benefits $1,439.2 $1,534.5 $1,607.0 $1,607.0 $72.5 4.7%
Operating $150.6 $169.1 $229.5 $247.1 $78.0 46.1%
Total $1,589.8 $1,703.6 $1,836.5 $1,854.1 $150.5 8.8%
FY18 FY19 FY20 FY20
Appropriations by Division Actual Budget Requested Approved $▲ %▲Administration $247.5 $242.8 $326.6 $344.2 $101.4 41.8%
Construction Inspection $552.2 $597.3 $582.5 $582.5 ($14.8) ‐2.5%
Code Enforcement $790.1 $863.5 $927.4 $927.4 $63.9 7.4%
Total $1,589.8 $1,703.6 $1,836.5 $1,854.1 $150.5 8.8%
FY18 FY19 FY20 FY20
Appropriations by Fund Actual Budget Requested Approved $▲ %▲Building Inspection Fund $772.6 $812.5 $881.8 $899.4 $86.9 10.7%
General Fund $790.1 $824.5 $873.1 $873.1 $48.6 5.9%
Water & Sewer Fund $27.1 $27.6 $27.4 $27.4 ($0.2) ‐0.7%
Affordable Housing Fund $0.0 $39.0 $54.2 $54.2 $15.2 39.0%
Total $1,589.8 $1,703.6 $1,836.5 $1,854.1 $150.5 8.8%
5‐Year CIP
Capital Appropriations
FY18 Year
End Balance
FY19
Budget
FY20
Approved
FY21‐24
Proposed
FY25‐29
Proposed
Build Insp: Spec Rev Fund
D‐22 Digital Plan Review Software (New) ‐ ‐ 45.0 ‐ ‐
Build Insp: Spec Rev Fund Total ‐ ‐ 45.0 ‐ ‐
FY20 FY20
FY18 FY19 Requested Approved ▲Fulltime Authorized Positions 23 24 24 24 0
Appropriation Summary
Capital Budgets, 5-Year CIP and Project Forecast
Authorized Positions
Building Permits & Inspection
FY20 Budget C-11

To provide our customers, both public and internal, with efficient and cost effective high quality services which meet or exceed their expectations and which promote the image of the Unified Government and the Athens‐Clarke County community. General Fund
Provide a high level of customer service that exceeds our customers’ expectations.
Provide superior quality of life services that enhance the Athens‐Clarke County community.
Protect the health and safety of the public and internal customers.
Provide a quality work environment for ACC employees.
Encourage, promote and support staff performance and development.
Provide professional stewardship to protect, enhance, and maximize the life of government facilities.
Provide high quality support services at the lowest possible cost.
Use environmentally friendly processes and materials in all services and activities. Internal Services Fund
To be responsive to customer needs.
To provide timely and accurate financial reports.
To maintain records in accordance with approved policy and procedures.
Minimize service disruptions to our customers. Fleet Management Fund Provide a safe and effective fleet for Athens‐Clarke County departments
Respond to all service calls (Animal Control, Facilities, and Landscape) in a timely manner, giving proper
consideration to the critical nature of the service provided.
Complete at least 90% of the Facilities Management work orders within 30 days.
Adhere to Landscape Management maintenance schedules at least 90% of the time.
Ensure that 95% of adopted animals are sterilized within the time prescribed by law.
Promote adoptions to achieve a euthanasia rate of adoptable animals less than 10%.
Ensure that 90% of all copier/telephone repair requests are completed within 24 hours.
Submit indirect billing, finance reports within 30 days of the receipt of charges from vendors.
Assure FCC compliance of the 800 MHz system 100% of the time.
Ensure that 90% of the fleet receives preventive maintenance prior to reaching the scheduled maintenance mileage.
Mission & Goals
Objectives
Central Services
FY20 Budget C-12

Outcomes and Performance Measures Current Goal FY13 FY14 FY15 FY16 FY17 FY18 Trend Comments or Analysis
Number of Structures Maintained Data only 118 206 206 206 221 224 FY18: Added 3 Airport buildings to maintenance program
Number of Work Orders Data only 5,670 6,538 7,525 9,162 9,345 9,383 Square Footage Maintained for all maintenance and repairs
Data only 1,660,811 1,853,713 1,865,963 1,981,173 2,006,907 2,035,833
Avg. Number of Work Orders per Maintenance Employee
425 515 409 470 436 445 447 Measures workload by average volume of work performed per maintenance employee
Avg. Square Footage Maintained per Maintenance Employee
90,000 150,982 115,857 116,623 94,342 95,567 96,945 Measures average amount of responsibility per maintenance employee
Cost per Square Foot for Maintenance <$1.75 1.23$ $1.59 $1.27 $1.60 $1.30 $1.90 Cost per Square Foot for Custodial Services
<$2.11 2.00$ $1.65 $1.62 $1.94 $1.52 $1.58 Preventive Maintenance vs. Corrective Maintenance
75%Preventive Maint. as percent of Total Maint. cost shows preventive program effectiveness (ref: IFMA)
Central Services / Facilities Management
Ensure a safe, productive, and positive image of Athens-Clarke County Facilities
by providing a high quality physical environment through dependable customer service
and sound fiscal practices.
New for FY19
Outcomes and Performance Measures Current Goal FY13 FY14 FY15 FY16 FY17 FY18 Trend Comments or Analysis
Acres of Park and Open Space Maintained per Employee (total 415 acres)
33 40 43 Greenway and Rails-to-Trail expansions increasing acres maintained
Miles of Rights-of-Way Maintained per Employee (total 1,200 lane miles)
75 96 96 Goal would provide one additional mowing cycle per growing season
Acres of Facilities Grounds Maintained per Employee (total 100 acres)
30 31 31
Percent of Routes Completed on Schedule 85% Weather is primary factor affecting schedule
Number of Landscape Installations and Renovations
Data only 15
Number of Athletic Field Repairs and Renovations
Data only 2
Number of Private Property Tree Assessments
Data only 430 377 Total Tree Canopy Cover for Athens-Clarke County (measured every 5 years)
45% -- -- 63% -- -- --Goal is defined in the ACC Tree Management Ordinance
Total Customer Calls for Services Data only
Percent of Service Calls Responded To Within 1 Workday
85%
Percent of Service Calls Completed Within 5 Workdays
95%
New for FY18
New for FY18
New for FY17
New for FY17
New for FY17
New for FY17
New for FY19
Provide safe, functional, and aesthetically pleasing open space management at ACC parks, facilities, and rights-of-way.
Central Services / Landscape Management
Provide public tree assessment and management as well as community outreach.
Strive to satisfy our customers.
New for FY19
New for FY19
New for FY19
Performance Measures
Central Services
FY20 Budget C-13

Outcomes and Performance Measures Current Goal FY13 FY14 FY15 FY16 FY17 FY18 Trend Comments or Analysis
Number of Preventive Maintenance Inspections Completed
>1600 1,938 1,654 1,621 1,570 1,372 1,453 Number of Corrective Maintenance Service Calls
<75 187 202 327 314 250 152
Percentage of Vehicles/Equip Exceeding Replacement Criteria Not Replaced
10% 23% 18% Replacement criteria revised in FY18. Funding constraints limits no. of replacements each year.
Number of Catastrophic Failures <5 11 6 4 11 3 8
Compliance with Georgia Environmental Protection Division Regulations
100% 100% 100% 100% 100% 100% 100% Regulatory requirement
Number of Inspections of Fueling Equipment and Storage Tanks
45 40 40 40 45 35 40 Needed to maintain regulatory compliance
New for FY17
Ensure reliable fuel availability for ACCUG vehicles and equipment.
Central Services / Fleet Management
Ensure safe, reliable, and safe vehicles and equipment are available to enable all ACCUG departments to complete their service delivery.
Provide a modern fleet of vehicles and equipment that are reliable and efficient.
Outcomes and Performance Measures Current Goal FY13 FY14 FY15 FY16 FY17 FY18 Trend Comments or Analysis
Number of Sick Animal Calls Data only 107 111 61 115 67 120
Number of Animal Bite Calls Data only 206 148 151 155 125 148 Number of Rabies Vouchers Purchased When Reclaiming an Impounded Animal
Data only 197 147 133 143 157 140
Number of Dog Running-at-large Calls Data only 1,462 1,351 1,394 1,449 1,192 1,221
Number of Vicious Animal Calls Data only 113 34 44 32 21 94
Number of Barking Dog Complaints Data only 105 138 177 90 93 72 Number of Trapped Cat Transport Requests
Data only 71 83 107 125 43 40
Number of Animal Neglect Calls Data only 400 413 377 270 266 409 Public education programs and better coordination with courts may impact recurring issues.
Number of Injured Animal Calls Data only 206 207 168 192 120 187
Number of Warnings Issued Data only 1,087 1,049 1,077 911 829 1,022
Number of Citations Issued Data only 152 52 37 71 75 154
Ratio of Warnings to Citations >20 7 20 29 13 11 7 Achieving compliance through education over punishment
Number of Animals Impounded Data only 2,425 2,315 2,070 1,969 1,690 2,363
Number of Animals Adopted Data only 698 573 568 550 444 571
Number of Owner Reclaimed Animals Data only 385 274 254 287 340 330 Number of Animals Transferred to Rescue Groups
Data only 636 762 681 733 614 1,004
Number of Visitors and Volunteers Data only 12,277 10,526 11,018 11,292 9,580 11,250 New Volunteer Facilitator position in FY18 should help with volunteer recruitment and retention.
Euthansia Rate (Adoptable Animals Euthanized / Total Animal Dispositions)
<2.0% 7.8% 6.1% 2.7% 0.7% 1.8% 0.4% Continued cooperation with licensed rescue groups to place unclaimed and unadopted animals.
Central Services / Animal Control
Protect and promote the public health,
safety,
Manage a shelter for impounded animals.
and protect animals from inhumane treatment.
quality of life,
Encourage compliance with animal control ordinances.
Central Services
FY20 Budget C-14

Central Services Department is supported by the General Fund, Internal Support Fund & Fleet Management
Fund.
General Fund
The FY20 Budget is $10.6 million (not including debt service of $539,000) for the cost of: Administration,
Animal Control, Landscape Management, & Facilities Management.
The budget includes full funding for a full‐time Groundskeeper position, which was added for the last 6
months of FY19.
An increase of $17,100 is included for 800 MHz radio & vehicle corrective/preventative maintenance cost
increases.
The Facilities Management Division includes $144,600 for maintenance contract cost increases.
Funding for building and equipment maintenance cost associated with new Fire Station #2 of $25,500, and
the new Cooperative Extension facility of $21,200, is included.
An applied position vacancy estimate has reduced personal service expense by $191,100.
The annual contract for downtown parking services with Athens Downtown Development Authority
(ADDA) projected to generate $4 million in fees and fines, the same level as FY19 Budget.
ADDA’s FY20 parking expenditures are estimated at $2.0 million, the same level as the FY19 Budget.
The Parking Management Services Fee to ADDA is projected to be $368,270, similar to FY19.
ACCGOV’s portion of net parking revenues is estimated to be $1,473,082, the same as the FY19 Budget.
Internal Support Fund
Internal Support Fund provides services to other government departments for: copier, phone, postage,
paper, printing, and 800 MHz radio.
Internal Support Fund/Internal Service Division budget is decreasing by $269,400 due to the Voice over IP
phone system (VOIP) capital lease (year 2 of 5) being moved from Central Services to Debt Service &
Other General Administration.
The FY20 Budget for the Internal Support Fund is $1.9 million, similar to the FY19 level.
Outcomes and Performance Measures Current Goal FY13 FY14 FY15 FY16 FY17 FY18 Trend Comments or Analysis
FCC Compliance 100% 100% 100% 100% 98% 98% 100% Regulatory
System Availability 100% 100% 100% 100% 100% 100% 100% Up-time minus system busy time
Number of ACCUG subscriber radio units Data only 1,051 1,031 1,032 1,052 1,060 1,080
Number of UGA subscriber radio units Data only 0 0 462 459 461 461
Number of Special Event Permits Issued Data only 59 66 52 62 51 53
Central Services / Administration
Ensure continuous operation of the 800 MHz radio system providing critical public safety and general government communications
Review, coordinate with other departments, and issue Special Event permits for community enhancing events
Budget Highlights
Central Services
FY20 Budget C-15

Fleet Management Fund
The FY20 Budget is $2.5 million, similar to FY19, to allocate ACCGOV vehicle costs for repair, maintenance
and bulk fuel.
Fuel costs are based on a purchase price of $2.00/gallon for gasoline & $2.14/gallon for diesel (same prices
used for FY19 budgeting).
For more information on the Internal Support Fund and the Fleet Management Fund, see pages E‐31 and 32.
(All figures in $1,000s) FY18 FY19 FY20 FY20
Appropriations by Type Actual Budget Requested Approved $▲ %▲Salary & Benefits $5,608.8 $6,108.5 $6,863.0 $6,212.8 $104.3 1.7%
Operating $7,774.9 $8,319.2 $8,450.7 $8,276.3 ($42.9) ‐0.5%
Total $13,383.7 $14,427.7 $15,313.7 $14,489.1 $61.4 0.4%
FY18 FY19 FY20 FY20
Appropriations by Division Actual Budget Requested Approved $▲ %▲Administration $297.5 $294.2 $375.9 $362.0 $67.8 23.0%
Animal Control $651.6 $704.4 $973.1 $798.7 $94.3 13.4%
Internal Support $3,057.5 $3,459.2 $3,285.7 $3,185.9 ($273.3) ‐7.9%
Landscape Management $2,560.4 $2,907.4 $3,353.1 $2,886.2 ($21.2) ‐0.7%
Facilities Management $3,927.7 $4,107.8 $4,362.7 $4,293.0 $185.2 4.5%
800 MHz Radio System $485.5 $546.9 $576.3 $576.3 $29.4 5.4%
Fleet Management $2,403.6 $2,407.8 $2,387.0 $2,387.0 ($20.8) ‐0.9%
Total $13,383.8 $14,427.7 $15,313.8 $14,489.1 $61.4 0.4%
FY18 FY19 FY20 FY20
Appropriations by Fund Actual Budget Requested Approved $▲ %▲General Fund $9,370.4 $10,239.6 $11,393.6 $10,569.0 $329.4 3.2%
Internal Support Fund $1,594.4 $1,780.3 $1,533.1 $1,533.1 ($247.2) ‐13.9%
Fleet Management Fund $2,403.6 $2,407.8 $2,387.0 $2,387.0 ($20.8) ‐0.9%
Other Funds $15.3 $0.0 $0.1 $0.1 $0.1 ‐‐
Total $13,383.7 $14,427.7 $15,313.8 $14,489.2 $61.5 0.4%
Appropriation Summary
Central Services
FY20 Budget C-16

5‐Year CIP
Capital Appropriations
FY18 Year
End Balance
FY19
Budget
FY20
Approved
FY21‐24
Proposed
FY25‐29
Proposed
General Capital Fund
D‐24 Deep Tine Aerator Purchase (New) ‐ ‐ 30.0 ‐ ‐
D‐25 Landscaping Equipment Life Cycle Replacement 49.4 25.0 50.0 200.0 500.0
D‐29 800 MHz Subscriber Radio Life Cycle 200.0 25.0 26.0 100.0 250.0
D‐30 Landscape & Community Tree Program 40.7 20.0 20.0 ‐ 200.0
D‐31 Parking Lot Life Cycle Maintenance & Repair ‐ 20.0 20.0 80.0 200.0
D‐33 800 MHz Radio Infrastructure Replacement 75.0 25.0 25.0 ‐ 5,500.0
D‐34 Parking Facil ities 10.8 20.0 20.0 ‐ 100.0
D‐37 Downtown Enhancement Project ‐ 60.0 60.0 240.0 300.0
General Capital Fund Total 375.9 195.0 251.0 620.0 7,050.0
Fleet Management Fund
D‐27 Fleet Management Shop Equipment Life Cycle
Replacement
‐ ‐ 10.0 40.0 50.0
Fleet Management Fund Total ‐ ‐ 10.0 40.0 50.0
Fleet Replacement Fund
D‐40 Fleet Replacement Program ‐ 2,790.8 3,102.0 10,784.5 13,933.0
Fleet Replacement Fund Total ‐ 2,790.8 3,102.0 10,784.5 13,933.0
Internal Support Fund
D‐32 Replace Internal Support Equipment 123.4 15.0 15.0 60.0 75.0
D‐38 Telephone System Life Cycle Replacement 231.0 25.0 25.0 100.0 125.0
Internal Support Fund Total 354.4 40.0 40.0 160.0 200.0
Hotel/Motel Spec Rev Fund
D‐36 Community Events Program 4.1 30.0 40.0 160.0 200.0
Hotel/Motel Spec Rev Fund Total 4.1 30.0 40.0 160.0 200.0
FY20 FY20
FY18 FY19 Requested Approved ▲Fulltime Authorized Positions 102 103 112 103 0
Capital Budgets, 5-Year CIP and Project Forecast
Authorized Positions
Central Services
FY20 Budget C-17

To effectively and efficiently file and record all proceedings, actions, orders and minutes and to perform all
duties and functions mandated by law, of the Superior and State Courts of Athens‐Clarke County and to
protect and secure all records entrusted therein.
To provide electronic index and images for deeds 1985‐1988, in house and on GSCCCA, ongoing.
Completed 1989‐1991.
To procure a digital reverse image for Deed Books 180‐368, on going
To image all cases for the years 1993‐2002, on going
To link civil and criminal digitized images from the FY17 and FY18 capital project within our case
management system for availability on the public internet docket
To digitize bound newspaper books from 1800’s to 1900’s, on going
Actual Forecast
CY16 CY17 CY18 CY19 CY20
Civil Filed Superior and State 2,681 2,673 2,904
Not Available
Civil Disposed Superior and State 2,712 2,961 3,003
Criminal Filed Superior and State 6,665 6,067 6,875
Criminal Disposed Superior and State 6,962 6,503 6,729
Land Record Instruments processed 22,754 24,221 24,865
General Minutes processed 2,959 2,973 5,672
Appeals filed/processed to Board of Equal 184 87 115
Board of Equalization Hearings Conducted 26 49 49
The budget includes the first full‐year implementation of the Pay Study approved in FY19.
A position vacancy estimate is approved, reducing General Fund Personal Services expenses by $35,900.
The Approved Budget includes no other significant changes.
Mission & Goals
Objectives
Performance Measures
Budget Highlights
Clerk of Courts
FY20 Budget C-18

(All figures in $1,000s) FY18 FY19 FY20 FY20
Appropriations by Type Actual Budget Requested Approved $▲ %▲Salary & Benefits $1,065.6 $1,155.6 $1,183.7 $1,147.6 ($8.0) ‐0.7%
Operating $106.4 $324.0 $324.0 $324.0 $0.0 0.0%
Total $1,172.0 $1,479.6 $1,507.7 $1,471.6 ($8.0) ‐0.5%
FY20 FY20
FY18 FY19 Requested Approved ▲Fulltime Authorized Positions 21 21 21 21 0
Appropriation Summary
Authorized Positions
Clerk of Courts
FY20 Budget C-19
The mission of UGA Cooperative Extension is to extend lifelong learning to the people of Georgia through unbiased, research‐based education in agriculture, the environment, communities, youth and families. Cooperative Extension provides education and information for all citizens of Athens‐Clarke County in the areas of Families, Food & Nutrition, Agriculture, Horticulture, & the Environment, and Youth Development.
Family and Consumer Sciences & Supplemental Nutrition Assistance Program Education To respond to clientele calls regarding food safety, home food preservation, healthy lifestyles, weight
management, chronic disease prevention and management. To provide consumer information regarding financial management and budgeting. To provide nutrition and food management training to low‐income families, empowering them to get the
best nutrition within a limited budget. To help professional food handlers and consumers learn safe food handling practices to prevent food
borne illness. To help train pre‐school providers to safely care for and nurture area children. To provide consumer information to create greater radon awareness and promote testing. Agriculture & Natural Resources To respond to clientele calls regarding soil samples, water samples, insect, disease and plant identification,
tree care and other issues. To provide a series of comprehensive training courses through the Master Gardener, Master Composter
and Master Naturalist Programs which train volunteers in subject specific areas who can then extend this knowledge throughout the community.
To provide educational opportunities through informational and activity booths staffed by Master Gardener and Master Composter volunteers at events throughout the region as well as weekly booths at two area Farmers Markets during the market season.
To provide information and offer programs that will encourage environmental stewardship and promote water quality through the Master Naturalist program.
4‐H and Youth Development To provide a variety of leadership opportunities for elementary, middle and high school students. To provide community involvement and service activities for young people to develop citizenship skills in
their community. To provide monthly educational programs in all elementary schools and middle schools in Athens‐Clarke
County. Educational programs are also offered to home school students, as well as evening programs for high school students.
To offer a series of judging event activities in order to help young people develop decision‐making skills. To assist with coordinating Youth Leadership Athens for high school juniors.
Mission & Goals
Objectives
Cooperative Extension
FY20 Budget C-20

Actual Forecast
FY16 FY17 FY18 FY19 FY20
Educational Classes Provided 898 706 746 800 700
Total Teaching Contacts 13,200 10,526 10,326 11,000 9,000
Soil Analysis Diagnostics 876 775 709 900 900
Water and Microbiology Diagnostics 122 151 184 150 150
Pathology, Plant & Insect ID 405 350 378 250 250
Radon Kits Distributed 41 24 28 30 30
Educational Newsletters Distributed 18,100 26,952 25,000 25,000 20,000
Phone, Office & Email Consultations 10,261 8,660 8,546 9,500 9,000
Home Visit Consultations 35 20 26 25 25
Educational Exhibit Contacts 9,848 8,120 8,500 9,000 8,000
Cooperative Extension is scheduled to move into a new facility (funded by SPLOST 2011) in August 2019.
$50,600 of additional funding is included for increased utility and operating costs in the department’s new
facility.
An applied position vacancy estimate has reduced personal service expense by $2,300.
The FY20 Budget of $255,000 reflects no other significant changes to services or programs.
(All figures in $1,000s) FY18 FY19 FY20 FY20
Appropriations by Type Actual Budget Requested Approved $▲ %▲
Salary & Benefits $144.3 $169.8 $170.8 $168.5 ($1.3) ‐0.8%
Operating $34.6 $35.6 $86.5 $86.5 $50.9 143.0%
Total $178.9 $205.4 $257.3 $255.0 $49.6 24.1%
FY20 FY20
FY18 FY19 Requested Approved ▲Fulltime Authorized Positions 1 1 1 1 0
Performance Measures
Budget Highlights
Appropriation Summary
Authorized Positions
Cooperative Extension
FY20 Budget C-21

Our mission is to fulfill the statutory requirements of the Coroner’s Office of Athens‐Clarke County in a manner
that is professional, efficient and compassionate to the citizens of Athens‐Clarke County.
Our goal is to manage the resources allocated to this office in a responsible manner that enables the Coroner’s
Office to provide caring and compassionate services in a time of crisis for the citizens of Athens‐Clarke County.
The Approved Budget for the Coroner includes $9,700 for increased expenses associated with opening the
new morgue. There are no other significant changes.
(All figures in $1,000s) FY18 FY19 FY20 FY20
Appropriations by Type Actual Budget Requested Approved $▲ %▲Salary & Benefits $18.4 $19.0 $18.6 $18.6 ($0.4) ‐2.1%
Operating $29.2 $30.0 $40.1 $40.1 $10.1 33.7%
Total $47.6 $49.0 $58.7 $58.7 $9.7 19.8%
FY20 FY20
FY18 FY19 Requested Approved ▲Fulltime Authorized Positions 0 0 0 0 0
Mission
Goals
Budget Highlights
Appropriation Summary
Authorized Positions
Coroner
FY20 Budget C-22

The mission of the Athens‐Clarke County Department of Corrections is to provide a humane and safe environment for staff, inmates, and the community at large through the use of modern correctional management techniques and supervision.
Comply fully with all Georgia Department of Corrections audit standards.
To clearly define (classification process) how inmate labor is to be used and supervised.
To provide ongoing mandated training for all Corrections’ staff and Athens‐Clarke County personnel that are supervising inmates.
To comply with all Athens‐Clarke County policies and procedures.
To maintain order and control of the inmates in our custody
To reduce inmate drug usage through random drug testing.
To maintain sanitation standards and proper safety practices.
To provide security and safety inspections of all inmate work sites.
To provide meals at a reasonable cost to the Athens‐Clarke County Jail, County Correctional Institution and Diversion Center/Work Release Center.
To prevent inmate escapes and injuries to staff or inmates.
To fully meet health and sanitation standards for Food Service. Diversion Center: The mission of the Athens‐Clarke County Diversion/Work Release Center is to provide quality cost‐effective management of non‐violent Athens‐Clarke county offenders, whose confinement in traditional incarceration would limit them from more quickly integrating into society, while at the same time building their skill sets that will encourage successfully re‐entering back into our community.
Create a secured, drug and alcohol free residential environment for offenders who would otherwise be incarcerated or subject to incarceration.
Encourage and assist offenders in developing strong work habits.
Provide offenders access to treatment, counseling, educational opportunities and related services.
Ensure offenders are held accountable for their crimes by requiring them to pay court ordered fines, fees and restitution.
Provide vocational and life skills training.
Ensure that parents failing to pay child support are able and obligated to work while providing them opportunities reconnect with their children.
Ensure offenders have a job within 30 days of entry into the program and maintain consistent employment during their sentence.
Provide opportunities for community service, in addition to the required employment, as ordered by the court and as an alternative to some fines.
Reduce participating offender recidivism.
Mission & Goals
Corrections
FY20 Budget C-23

Score 100% on all Georgia Department of Corrections audits.
Score 100% on all health inspections.
Receive and classify inmates from the State of Georgia and the ACC Jail for work details.
Reduce incidences of inmate work detail injuries to zero.
Maintain incidences of assaults with weapons at zero.
Maintain inmate escapes at zero.
Reduce the number of positive drug screen results from inmates to zero.
Provide mandated training for Corrections’ personnel and all Athens‐Clarke County personnel in other departments who supervise inmate work crews.
Conduct daily safety and security inspections of inmate work sites.
Diversion Center:
Achieve 90% resident occupancy rate.
80% of residents will successfully complete available programs or skill development.
80% of residents entering the Diversion/Work Release Center will find jobs or be placed in a job relevant to their skil1s.
100% of employed residents will make payment of fines, fees and per diem costs.
100% of residents owing child support payments will maintain those payments.
100% of residents will receive a monthly drug/alcohol screen. Additional screening will be made according to the resident’s record and/or personal behavior.
Case workers and staff will visit resident job sites and resident employers weekly or as necessary.
100% or residents in need of education or skills development (GED, certification, technical certification, etc.) will be placed in an available program(s).
Zero walk‐aways from the Diversion/Work Release Center.
Provide 40 hours of program relevant training to all staff.
Case workers to meet with residents on their caseload a minimum of once a week.
Case workers to complete resident assessment the same day of resident arrival.
Objectives
Corrections
FY20 Budget C-24

Outcomes and Performance Measures
Current Goal 2014 2015 2016 2017 2018
Comments or Analysis
WE PROTECT THE PUBLIC
Average Daily CountData only
103 106 106 109 116
Number of Escapes 0 1 0 1 0 0
Number of Training HoursData only
1,128 2,537 3,581 3,324 3,482
Number of inmate on inmate assaults
<5 0 1 8 3 6 Goal: less than 5
Number of inmate on staff assaults
<1 0 0 1 0 1 Goal: less than 1
Total number of detailsData only
19 19 24 24 48
Inmate details were previously counted per department. They are now counted per inmate supervisor regardless of department assignment. An inmate detail consists of a supervisor and inmate workers numbering from 1 to 8. Currently we have 110-115 working and 5-10 new arrivals.
Percentage of inmates working details
stable 70.0% 72.0% 91.0% 90.0% 95.0% Above 90%
Total expenses ($)Data only
3,214,069$ 3,317,829$ 3,406,175$ 3,341,814$ 3,387,076$ Actual Expenses for the year
Cost Recovery: Total Reimbursements
Data only
751,900$ 773,800$ 773,800$ 795,700$ 846,800$ $20 X 365 days X Avg. Inmate Pop
Athens-Clarke County Total Daily Cost Per Inmate
Data only
$59 $61 $62 $61 $62Took total budget divided by 365 divided by Ave Daily Count
Athens-Clarke County Funds: Daily Cost per inmate
Data only
$39.33 $40.60 $41.68 $40.90 $41.45 Total daily cost per inmate * 67%
Athens-Clarke County: Daily Labor Value Per Inmate
Increase FPY
$67.69 $68.97 $89.44 $95.90 $101.23 Increase steadily
ROI: total hours worked by inmates in County
Stable 149,968 158,746 200,637 204,048 229,216Based on Ave Daily Count X percentage of inmates working detail X full time rate of 2080 hours
ROI: value to Athens-Clarke County of hours worked by inmates
Data only
2,544,957$ 2,668,514$ 3,460,584$ 3,815,494$ 4,286,110$ Grade 7 employee + benefits (salary/2080) It was reevaluated to include the benefits plus salary for Grade 7 employee.
Number of GEDS awardedData only
no data 0 2 6 5 > 5% eligible inmates gain GED
Number of inmates completing Re-entry Program
>50 no data 42 140 95 68 Goal to increase to >75
Number of inmates completing Motivation for Change
>50 no data 24 51 73 73Goal: more than 4 year running avg Goal to increase to >75
Total EmployeesData only
43 43 43 43 43
Overtime as % of personnel expenditure.
< 1.5% 1.40% 1.30% 1.40% 2.00% 2.35% keep under 1.5%
Expenditures: Actual versus budget
< 100% 97.0% 92.6% 92.9% 95.6% 90.6%Our goal is to distribute and expend the budget as efficiently and effectively as possible.
Total Intakes (calendar year)Data only
123 142 179 163 123
Average Daily Count >60 46 44 47 40 43Our goal is to achieve and maintain a 75% rate of capacity.
Total Successful ReleasesData Only
110 115 135 104 73Our goal is to achieve and maintain 80% total intakes resulting in successful releases.
Successful Release Percentage>75% of intakes
89.43% 80.99% 75.42% 63.80% 62.39%
Average % Residents Employed Ave
>85% 4% 8% 85.00% 87.00% 95.00%Our goal is to maintain a consistent 90% employment rate for our residents.
Available Program Hours Per Week
Data only
80 96 12 28 25
Pathways to Success, Men in Action, Alcoholics Anonymous, Department of Labor, GED, Project 13:3, UGA Food Talk, Piedmont-Athens Regional, North GA Mobile Lab
Total Program Hours Attended Per Week
Data only
80 0.80 15 300 200 Total hours utilized by all residents
WE PROVIDE A COST-EFFICIENT WORKFORCE
WE PROVIDE OPPORTUNITIES FOR REHABILITATION
WE USE RESOURCES RESPONSIBLY
WE OFFER RE-ENTRY SERVICES WITH THE DIVERSION CENTER
Performance Measures
Corrections
FY20 Budget C-25

The Correctional Institution houses convicted State inmates.
Current contract includes a house maximum of 160 convicted State inmates: (120 at the Correctional
Institution and 40 at the Transition/Diversion Center).
$1.1 million in revenue is projected from the State to ACCGOV in FY20 ($20/day per housed inmate).
Revenue from Diversion Center residents is projected to be $228,000 ($67,000, 23% less than FY19) and
includes proposed Diversion Center fee increase estimated to collect an additional $3,000.
Funding of $123,300 is included to add two full‐time Corrections Officer 1 positions to increase supervision
and safety support needed, due to the increased number of housed offenders at the Diversion Center.
$150,000 is included to implement an offender incentive program to begin to support state inmates as
they perform labor on behalf of ACCGOV.
For FY20, Public Safety vehicle replacement is approved to be funded from the next SPLOST program,
resulting in a reduction of $13,300 for Corrections.
An applied position vacancy estimate has reduced the personal service budget by $74,500.
The FY20 Budget of $3.9 million reflects no other significant changes to services or programs.
(All figures in $1,000s) FY18 FY19 FY20 FY20
Appropriations by Type Actual Budget Requested Approved $▲ %▲Salary & Benefits $2,679.1 $2,953.4 $3,192.1 $3,006.0 $52.6 1.8%
Operating $658.3 $842.5 $868.1 $993.1 $150.6 17.9%
Total $3,337.4 $3,795.9 $4,060.2 $3,999.1 $203.2 5.4%
FY18 FY19 FY20 FY20
Appropriations by Division Actual Budget Requested Approved $▲ %▲
Administration $344.2 $372.2 $380.6 $529.3 $157.1 42.2%
Food Services $468.1 $634.8 $632.7 $632.7 ($2.1) ‐0.3%
Security Operations $1,597.4 $1,758.9 $1,751.7 $1,705.2 ($53.7) ‐3.1%
Diversion Center $927.7 $1,030.0 $1,295.2 $1,131.9 $101.9 9.9%
Total $3,337.4 $3,795.9 $4,060.2 $3,999.1 $203.2 5.4%
FY18 FY19 FY20 FY20
Appropriations by Fund Actual Budget Requested Approved $▲ %▲General Fund $3,312.5 $3,745.9 $4,010.2 $3,949.1 $203.2 5.4%
Corrections Inmate Fund $14.8 $50.0 $50.0 $50.0 $0.0 0.0%
Grants Fund $10.1 $0.0 $0.0 $0.0 $0.0 ‐‐
Total $3,337.4 $3,795.9 $4,060.2 $3,999.1 $203.2 5.4%
Budget Highlights
Appropriation Summary
Corrections
FY20 Budget C-26

5‐Year CIP
Capital Appropriations
FY18 Year
End Balance
FY19
Budget
FY20
Approved
FY21‐24
Proposed
FY25‐29
Proposed
General Capital Fund
D‐41 Food Service Equipment Life Cycle Replacement 0.8 20.0 20.0 60.0 30.0
General Capital Fund Total 0.8 20.0 20.0 60.0 30.0
FY20 FY20
FY18 FY19 Requested Approved ▲Fulltime Authorized Positions 43 43 47 45 2
Capital Budgets, 5-Year CIP and Project Forecast
Authorized Positions
Corrections
FY20 Budget C-27

Debt Service includes the Government’s payments for Guaranteed Revenue Debt, Revenue Bonds, and other
long‐term liabilities.
General Fund – This budget includes $539,455 of funding for annual debt service for the bonds issued in
2011 to finance a portion of the Washington Street Building and $518,400 for principal, interest and
bond fees on the debt service for the bonds issued in 2012 for the site improvements for the
Caterpillar Project.
Public Facilities Authority Fund – This budget includes $529,200 for the annual debt service for the note
issued in 2010 for the Jail Advance Housing Facility. This debt was issued through the Public Facilities
Authority with annual debt service funded by the General Fund.
Airport Fund – This Budget includes $19,400 for the interest payments for the notes issued to finance two
projects at the Airport. The first project financed the construction of T‐Hangars in 2003; the second
project financed Executive Hangars in 2009. The Airport Enterprise Fund is responsible for the
repayment of these notes. Including principal and interest, the total debt payments for FY20 will be
$110,700.
Landfill Fund – $204,100 is included in the budget for the Landfill Fund for debt related to the construction
of Phase V Cell 1A‐1B. Total FY20 debt payments for principal and interest are estimated to total
$669,400.
Water & Sewer Fund – The budget for the Water and Sewer Enterprise Fund includes $9,450,400 for the
interest component of debt service to repay the bonds refunded in 2015 to upgrade and expand the
three water reclamation facilities and two notes issued through the State of Georgia Environmental
Finance Authority (GEFA) in 2007 and 2009. There was a decrease in the Budget for FY17 as the result
of the refinancing of the 2008 bonds in May, 2015. Total FY20 debt service (principal and interest) for
the Water and Sewer Enterprise Fund will be $16.0 million.
Internal Support Fund – The $269,400 budget represents the second year of a five year capital lease for
the new voice over IP (VOIP) phone system that was installed in FY19.
Additional information regarding Debt Service can be found in Section G ‐ Other Information.
(All figures in $1,000s) FY18 FY19 FY20 FY20
Appropriations by Fund Actual Budget Requested Approved $▲ %▲General Fund $1,045.1 $1,052.6 $1,057.9 $1,057.9 $5.3 0.5%
Public Facility Auth. Fund $536.3 $533.0 $529.2 $529.2 ($3.8) ‐0.7%
Airport Fund $23.8 $22.3 $19.4 $19.4 ($2.9) ‐13.0%
Landfill Fund $0.0 $0.0 $204.1 $204.1 $204.1 ‐‐
Water & Sewer Fund $10,143.2 $9,807.7 $9,450.4 $9,450.4 ($357.3) ‐3.6%
Internal Support Fund $0.0 $0.0 $269.4 $269.4 $269.4 ‐‐
Fleet Replacement Fund $26.1 $0.0 $0.0 $0.0 $0.0 ‐‐
Total $11,774.5 $11,415.6 $11,530.4 $11,530.4 $114.8 1.0%
Mission
Budget Highlights
Appropriation Summary
Debt Service
FY20 Budget C-28

The Office of the District Attorney serves primarily as the prosecuting attorney in the Superior Court of Athens‐
Clarke and Oconee Counties. In Athens‐Clarke County, the District Attorney is responsible for the prosecution
of all criminal cases involving at least one felony charge. Additionally, there is a responsibility to pursue, when
appropriate, certain civil actions such as RICO, drug, gambling, and bond forfeitures. A corollary to the actual
prosecution of cases in our Superior Courts is the practical responsibility of the office to organize, manage, and
present the criminal cases before the four Superior Court Judges. Further, the District Attorney serves as the
prosecuting attorney in the Juvenile Court in those instances when a child (less than 17 years of age) is accused
of a delinquent and/or unruly act. Moreover, the District Attorney represents the State of Georgia in the
Georgia Supreme Court and Georgia Court of Appeals in those cases arising out of this jurisdiction, which
includes researching and drafting briefs and presenting oral arguments; serves as the official legal adviser to
the Grand Jury; and provides legal advice on an informal basis to local law enforcement agencies. Lastly, the
District Attorney’s Office handles preliminary hearings and special bond hearings in Magistrate Court, operates
a Pretrial Diversion Program, and staffs three alternative courts – a Drug Court Program, Treatment and
Accountability Court, and a Veteran’s Court.
As used above, the term “prosecute” involves, first and foremost, that exercise of discretion in determining
whether to prosecute at all and, if so, whom and how to prosecute. The overriding goal of this office is to
ensure that those persons who are not responsible are not held responsible and that those persons who are
responsible are held responsible and held responsible in an appropriate way. To this end, our attendant goal is
to give individual attention to each case in spite of the vast number of cases received for prosecution, and the
expected demands and urgencies of the caseload. At the forefront of every case is to identify those which
involve victims and to provide assistance as needed; which assistance may include notification of prosecutorial
and court action, counseling, referral to social service agencies, court accompaniment and the otherwise. This
service to victims is done not only because it is required by the Crime Victims’ Bill of Rights, but also because it
is the “right” thing to do.
Continue to prioritize the prosecution of Serious Violent Felonies and those involving Special Victims
(Sexual Assault, Child Abuse/Molestation, Domestic Violence and Elder Abuse)
Refine our newly unveiled paperless file system (“CASE”) to reduce costs and improve efficiency including
e‐discovery via the web for defense attorneys.
Establish and maintain a digital information platform to provide transparency to the community via a
website.
Provide in‐house training to enhance State provided training for prosecutors, investigators and victim
advocates.
Continue with efforts to reduce the time between arrest and the prosecutorial charging decision, thereby
reducing the time between arrest and disposition.
Continue to examine cold cases for possible prosecution.
Reduce the amount of old documents and records maintained in offsite storage that are no longer of
evidentiary value and that can be purged according to law.
Mission & Goals
Objectives
District Attorney
FY20 Budget C-29

Actual Forecast
CY16 CY17 CY18 CY19 CY20
New Felony Cases Received 1,774 1,766 1601 1,650 1,700
Dismissals (incl. PTP Dismissals) 48 105 143 145 150
Transfers to Solicitor‐General 60 54 54 65 70
Superior Court
Bond Hearings 927 864 981 990 995
Arraignments 1,622 1,739 1865 1,870 1,875
Motion Hearings 372 345 299 325 350
Status Conferences 1,785 1,535 TBD 1,585 1,600
Jury Trials
Cases Scheduled for Trial 988 1,099 1238 1,250 1,250
Number of Jury Trials 25 33 31 35 35
Number of Days in Trial 81 95 116 120 140
Average Days / Trial 3.24 2.87 3.74 5 5
Number of ADA Days in Trial 138 153 236 240 240
Probation Cases Filed 1,392 894 1052 1,075 1,075
Probation Status Conferences 696 694 TBD 750 800
Juvenile Court
Delinquent Cases Filed 1,001 1,384 TBD 1,400 1,450
Traffic 234 438 TBD 470 490
Subpoenas Issued and Served (by DA Investigators) 11,479 6,731 16,109 16,200 16,250
Victim Assistance
Total Active Victims Served 2,347 2,961 3,086 3,100 3,500
Total Victim Services Provided 46,656 40,539 40,837 42,000 45,000
Civil Forfeiture Actions
Opened 55 48 34 40 45
Closed 63 36 32 35 40
The FY20 Budget for the District Attorney’s Office includes $4,000 to maintain law licenses and POST
certifications.
The District Attorney also requested $28,300 to restore reductions that were taken by the Mayor and
Commission in FY10 and FY12. This request was not recommended nor approved.
The District Attorney’s Office includes 11 fulltime positions in the Special Programs Fund that are paid for
by reimbursements from Oconee County.
There are also two fulltime victim assistance positions in the Special Programs Fund that are funded from
5% fine add‐on revenues.
Performance Measures
Budget Highlights
District Attorney
FY20 Budget C-30

(All figures in $1,000s) FY18 FY19 FY20 FY20
Appropriations by Type Actual Budget Requested Approved $▲ %▲
Salary & Benefits $1,784.4 $1,934.2 $2,065.8 $2,055.6 $121.4 6.3%
Operating $140.4 $104.6 $137.8 $109.5 $4.9 4.7%
Total $1,924.8 $2,038.8 $2,203.6 $2,165.1 $126.3 6.2%
FY18 FY19 FY20 FY20
Appropriations by Division Actual Budget Requested Approved $▲ %▲District Attorney $1,767.3 $1,870.2 $2,030.6 $1,992.1 $121.9 6.5%
Victim Assistance $157.5 $168.6 $173.0 $173.0 $4.4 2.6%
Total $1,924.8 $2,038.8 $2,203.6 $2,165.1 $126.3 6.2%
FY18 FY19 FY20 FY20
Appropriations by Fund Actual Budget Requested Approved $▲ %▲General Fund $1,249.0 $1,315.1 $1,420.6 $1,382.1 $67.0 5.1%
Special Programs Fund $675.8 $723.7 $783.0 $783.0 $59.3 8.2%
Total $1,924.8 $2,038.8 $2,203.6 $2,165.1 $126.3 6.2%
5‐Year CIP
Capital Appropriations
FY18 Year
End Balance
FY19
Budget
FY20
Approved
FY21‐24
Proposed
FY25‐29
Proposed
General Capital Fund
D‐43 Purchase a Special Service Vehicle 2019 Ford
Explorer (New)
‐ ‐ 26.0 ‐ ‐
General Capital Fund Total ‐ ‐ 26.0 ‐ ‐
FY20 FY20
FY18 FY19 Requested Approved ▲Fulltime Authorized Positions 28 29 29 29 0
Appropriation Summary
Capital Budgets, 5-Year CIP and Project Forecast
Authorized Positions
District Attorney
FY20 Budget C-31

Athens‐Clarke County, an open and responsive government, will facilitate a positive environment for
individuals to obtain a high quality of life and local organizations to achieve success by providing innovative,
high‐quality services and responsible stewardship of the community’s resources, to benefit current and future
generations.
Fundamental to Athens‐Clarke County’s high quality of life for individuals and success of local organizations is
an environment conducive to economic prosperity and opportunity.
Therefore, the mission of the Economic Development Department is to facilitate economic growth through
support, outreach, and partnerships. We respect Athens’ unique character and endeavor to build a stronger
community than that which was entrusted to us.
Identify and recruit economic development opportunities that support and enhance Athens‐Clarke County’s
quality of life, increase the tax base, and provide opportunities for sustained, livable wages for workers;
Provide site location assistance to domestic and international companies planning new or expanded facilities;
assistance shall include but not limited to identifying financial and human resources available to support such
developments;
Utilize marketing media and outreach efforts to promote the competitive advantages to businesses and
industries of choosing to locate in Athens‐Clarke County;
Support businesses and industries currently operating within Athens‐Clarke County by strengthening
relationships and encouraging re‐investment and job creation utilizing various economic development tools
and resources;
Coordinate where appropriate with local entities with an economic development interest that may include the
Athens Area Chamber of Commerce, Athensmade, the Classic Center, the Convention and Visitors Bureau,
Four Athens, the SBDC, and others to promote entrepreneurship, tourism, and community development; also
for the purpose of receiving assistance with economic development recruitment efforts managed by the
Department;
Maintain a current inventory of facilities and properties available for industrial/business development; develop
recommendations for strategies to meet emerging infrastructure and natural resource needs to support future
industrial and business development;
Support development through the coordination of various departments and by offering innovative results
oriented solutions to the development process in Athens‐Clarke County;
Utilize all available economic development tools to put Athens‐Clarke County in a position to be developed
responsibly and to the highest and best use.
Mission
Goals
Economic Development
FY20 Budget C-32

Support
Attend all meetings of the Atlanta Highway and Lexington Corridor Committees and provide information
regarding any available economic development tools and feedback/suggestions for redevelopment.
Make contact with 100% of visioning meetings and garner feedback about their experience with process.
Host signature existing industry dinner and awards event celebrate the manufacturing sector in Athens.
Host an innovation events to bring emerging technology industries to Athens and networking
opportunities to Athens based entrepreneurs.
Partner with the private sector to deliver an inclusive and accessible space for the entrepreneurial
community to utilize for innovation and growth.
Outreach
Target 30 new projects in FY19 by maintaining contact with appropriate stakeholders and seeking out any
potential for the area.
Maintain an active social media and marketing presence that distribute resources relevant to followers
and:
o increases brand awareness by 20%, and
o increases community engagement by 10%.
Host two project manager events.
Participate in 10 speaking engagements to various civic, social, neighborhood, social, and business groups
in FY19 to update the community on various economic development initiatives and news.
Engage in 18 outreach visits to real estate developers, site selection consultants, and project managers.
Engage in 12 client meetings in Athens for key brokers, site selection consultants, and project managers.
Attend four trade shows to seek out development opportunities and source leads.
Attend eight conferences to seek out opportunity and to remain knowledgeable of any new or changing
economic development programs or tools.
Make 24 existing industry visits to industries in Athens‐Clarke County.
Participate in one International Outreach Mission to broadcast the viability of doing business in Athens‐
Clarke County outside of the U.S.
Partnerships
Continue to support Athensmade where appropriate to bolster the maker/entrepreneurship community in
Athens.
Coordinate and execute four events in partnership with groups in the entrepreneurial community.
Objectives
Economic Development
FY20 Budget C-33

Economic Development operates with funding from the General Fund and the Hotel/Motel Fund.
Establish a Workforce Development Program in the Special Revenue Fund for $150,000 with funding from
the General Fund. This program will partner with other agencies to create a training curriculum for
targeted individuals that will help them gain employment.
A position vacancy estimate is approved, reducing General Fund Personal Services expenses by $11,500.
Performance Measure Goal FY13 FY14 FY15 FY16 FY17 FY18 (Pace) FY19 Goal Comments Reference
# of jobs createdIncrease
YOY417 642 2,033 2,031 3,240 1,989 Increase YOY
Source: Bureau of Labor Statistics, Quarterly survey of wages
BLS; quarterly census, Clarke, all employees; Pace is mopst current to date, YOY
Avg weekly wage Increase
YOY738 758 803 803 819(P) Increase YOY
Source: Bureau of Labor Statistics, Quarterly survey of wages
BLS; quarterly census, Clarke, all employees Qtr 2; Pace is most current to date, YOY
Commercial Digest growth
Increase YOY
1.74% 4.03% 2.68% 5.82% 7.14% N/A Increase YOYCalendar year percentage change in digest value.
Industrial Digest GrowthIncrease
YOY9.7% 12.5% 4.8% 4.6% -1.4% N/A Increase YOY
Caterpillar/Ethicon effect - initial investment begins depreciating
Calendar year percentage change in digest value.
New projects 20 N/A 20 20 21 18 20 20
# of expansions/announcements
0 N/A 1 2 2 3 2 2Calendar year totals
# commercial building permits
Increase YOY
29 53 54 40 45 Increase YOYCalendar year totals
total commercial permit value (1,000's)
Increase YOY
$79,035 $42,624 $42,316 $49,153 $41,514 Increase YOYCalendar year totals
Social media following20% YOY
increaseN/A N/A N/A N/A 874* 2042
20% YOY increase
Total followers of Twitter, Facebook, and Instagram. *no Instagram acount in FY17. Pace is total as of May 2018.
Business and Retention Visits
25 Annual Visits
N/A 16 16 15 18 25 25 Internal accounting
Client visits15
Annual Visits
N/A 12 13 14 6 15 15 Internal accounting
Public Private Partnerships Created
1N/A
0 0 0 1 2 1 Internal accounting
Projects with capital investment 1 N/A 0 0 0 1 1 1
Internal accounting
Attract, create, expand, and retain businesses through support,
outreach,
and partnerships.
Performance Measures
Budget Highlights
Economic Development
FY20 Budget C-34
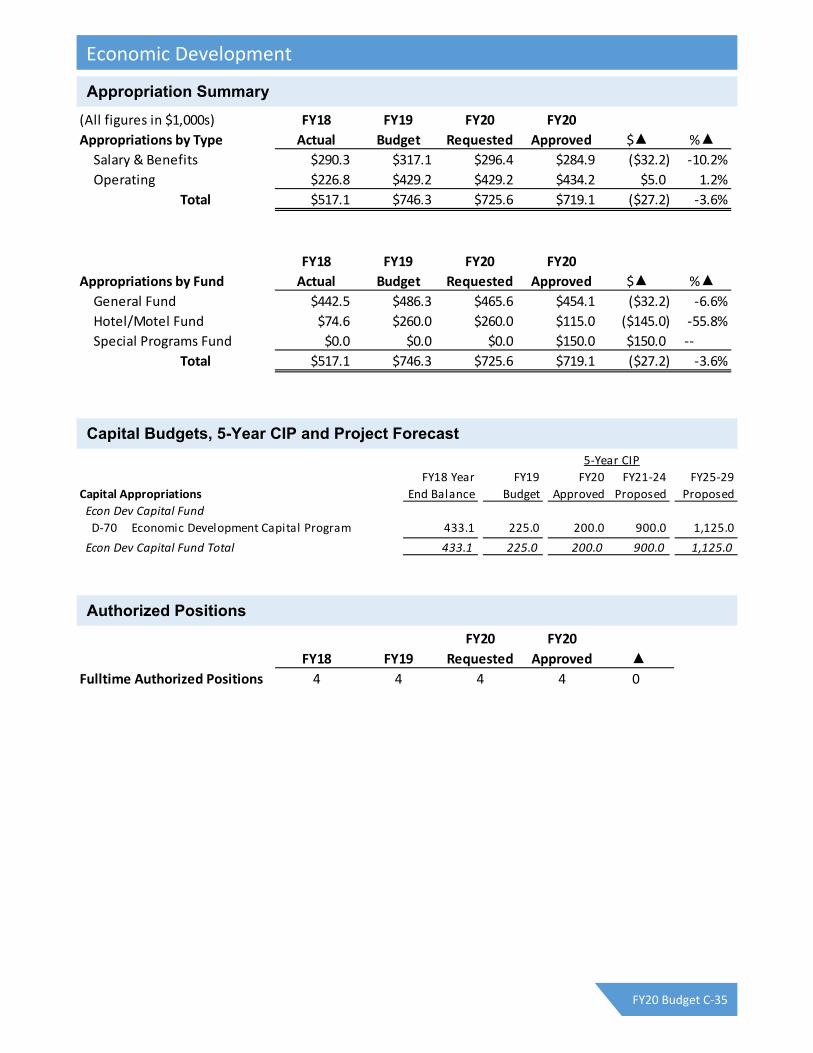
(All figures in $1,000s) FY18 FY19 FY20 FY20
Appropriations by Type Actual Budget Requested Approved $▲ %▲Salary & Benefits $290.3 $317.1 $296.4 $284.9 ($32.2) ‐10.2%
Operating $226.8 $429.2 $429.2 $434.2 $5.0 1.2%
Total $517.1 $746.3 $725.6 $719.1 ($27.2) ‐3.6%
FY18 FY19 FY20 FY20
Appropriations by Fund Actual Budget Requested Approved $▲ %▲General Fund $442.5 $486.3 $465.6 $454.1 ($32.2) ‐6.6%
Hotel/Motel Fund $74.6 $260.0 $260.0 $115.0 ($145.0) ‐55.8%
Special Programs Fund $0.0 $0.0 $0.0 $150.0 $150.0 ‐‐
Total $517.1 $746.3 $725.6 $719.1 ($27.2) ‐3.6%
5‐Year CIP
Capital Appropriations
FY18 Year
End Balance
FY19
Budget
FY20
Approved
FY21‐24
Proposed
FY25‐29
Proposed
Econ Dev Capital Fund
D‐70 Economic Development Capital Program 433.1 225.0 200.0 900.0 1,125.0
Econ Dev Capital Fund Total 433.1 225.0 200.0 900.0 1,125.0
FY20 FY20
FY18 FY19 Requested Approved ▲Fulltime Authorized Positions 4 4 4 4 0
Appropriation Summary
Capital Budgets, 5-Year CIP and Project Forecast
Authorized Positions
Economic Development
FY20 Budget C-35

The Finance Department supports the Manager’s Office by guiding the government’s financial operations. It employs conservative fiscal policies emphasizing financial stability and resilience. The department collects and processes data, advises management in financial matters, provides information to various stakeholders, monitors budgetary trends, and provides various financial reports. Focus areas include:
Commitment to Transparency and Reliable Financial Reports
Monitoring Budgetary and Financial Trends
Proactive Management
Revenue Diversity
Balanced Budget
Prepare Comprehensive Annual Financial Reports (CAFR) and Annual Budget Documents that serve as
policy documents, financial plans and communication tools.
Ongoing budget review process in order to realign budget appropriations with unexpected trends.
Utilize multi‐year financial forecasting, including operating trends, the future operational impact of proposed capital projects and the five‐year capital improvement program to identify future challenges and opportunities.
Provide management information regarding revenue diversity.
Assist the Manager’s Office with providing a balanced budget document to the Mayor and Commission.
File CAFR and Annual Budget Documents with required recipients within the timeframe required by state law and receive formal, external recognition for financial reporting excellence (from the Government Finance Officers Association for the CAFR).Receive “Unmodified” (clean) independent audit opinion letters (CAFR).
Provide management with information necessary to maintain stable General Obligation and Public Utility bond ratings.
Provide financial reports (monthly, quarterly and as needed) to management. Assist management with budgetary decisions through accurate General Fund revenue estimates and five‐year forecasting of fund balance under various scenarios.
Mission
Goals
Objectives
Finance
FY20 Budget C-36

Performance Measures
Finance
FY20 Budget C-37

The FY20 Budget, $2.3 million, reflects no significant changes to services or programs.
An applied position vacancy estimate has reduced personal service expense by $47,400.
(All figures in $1,000s) FY18 FY19 FY20 FY20
Appropriations by Type Actual Budget Requested Approved $▲ %▲Salary & Benefits $1,857.5 $2,031.6 $2,134.5 $2,087.1 $55.5 2.7%
Operating $216.4 $198.9 $199.9 $199.9 $1.0 0.5%
Total $2,073.9 $2,230.5 $2,334.4 $2,287.0 $56.5 2.5%
FY18 FY19 FY20 FY20
Appropriations by Division Actual Budget Requested Approved $▲ %▲Administration $421.5 $436.2 $447.1 $431.3 ($4.9) ‐1.1%
Financial Services $526.1 $564.5 $596.7 $580.9 $16.4 2.9%
Accounting $422.2 $478.2 $494.3 $494.3 $16.1 3.4%
Budget Management $312.0 $325.8 $332.4 $332.4 $6.6 2.0%
Purchasing $392.1 $425.8 $463.9 $448.1 $22.3 5.2%
Total $2,073.9 $2,230.5 $2,334.4 $2,287.0 $56.5 2.5%
FY20 FY20
FY18 FY19 Requested Approved ▲Fulltime Authorized Positions 28 28 28 28 0
Budget Highlights
Appropriation Summary
Authorized Positions
Finance
FY20 Budget C-38

Help our community become safer and more resilient by providing professional services and protection with integrity.
• Achieve an average turnout time of 80 seconds for fire and special operations emergency responses. • Achieve an average turnout time of 60 seconds for medical emergency responses. • Assemble a minimum of 15 personnel on the scene of structure fires within 8 minutes of dispatch, 90% of
the time. • Meet the department’s FY20 property inspection schedule for all properties on file as of July 1, 2019. • Provide fire safety information to 75% of all kindergarten through grade 5 students, public and private.
(6,028 of 8,038 students) • Achieve 85% compliance for fire code violations within thirty (30) days of issuance of a Notice of Violation. • Review 100% of all non‐one/two family construction plans for code compliance prior to issuance of a
Certificate of Occupancy. • Perform all fire & life safety inspections on new construction projects within five (5) business days of
notification by the Building Inspection Department. • Conduct cause and origin examinations on all suspicious structure fires and all fires with civilian injuries or
fatalities; identifying fire cause factors and responsible agents of fire events. • Conduct pre‐planning and building familiarization inspections at least once every year for all non‐one/two
family dwelling buildings within our jurisdiction. • Conduct annual training required by ISO to maintain our fire protection class to include: 8 half day drills, 4
half day multi‐company drills, 2 night drills, 20 hours per member of company training, 12 hours per member of officer training, 4 half day trainings on driver and operator training, 40 hours of new driver training, 1 half day training on radioactivity or hazardous materials, and a minimum of 240 hours of new recruit training for new firefighters.
• Annually provide at least the minimum training hours as required by the Georgia Firefighter Standards and Training Council, American Heart Association, and the Georgia Department of Public Health to recertify our personnel for the following certifications based on personnel assignments; Firefighter (24 hours), Hazmat (24 hours), Technical Rescue: Search & rescue/ Water rescue/ Rope rescue/Structural Collapse search and rescue/Confined space search and rescue/Wilderness search and rescue/(24 hours), Fire Inspector (24 hours), Fire Investigator (24 hours), CPR (4 hours), EMT (20 hours).
• Conduct at least three (3) hours a quarter of Auto/Mutual Aid training with affected ACCFES companies in compliance with agreements and ISO requirements.
• Increase community awareness of ACCFES services through social media efforts to increase our followers/likes by 5% in FY20.
• Increase the number of certified EMTs by 15 each fiscal year within the Department to improve the level of care/service for emergencies.
• Strengthen the existing false alarm ordinance to be reasonable and enforceable to reduce the number of false alarms by 10% in FY20.
Mission
Goals
Fire & Emergency Services
FY20 Budget C-39

Performance Measures
Fire & Emergency Services
FY20 Budget C-40

FY20 Budget includes a $58,150 increase for:
o EMS Certification (initial & renewal fees) $5,000
o Vehicle Preventative Maintenance $7,000
o Medical Emergency Reporting Software $12,000
o Payroll System $15,650
o Fire & Emergency Training Software $18,500
For FY20, Public Safety vehicle replacement is approved to be funded from the next SPLOST program,
resulting in a reduction of $445,600 for the Fire Department.
The applied position vacancy estimate has reduced the personal service budget by $140,600.
FY20 Budget of $14.2 million reflects no other significant changes to the department.
(All figures in $1,000s) FY18 FY19 FY20 FY20
Appropriations by Type Actual Budget Requested Approved $▲ %▲Salary & Benefits $12,347.4 $12,947.7 $13,540.4 $13,260.7 $313.0 2.4%
Operating $1,244.4 $1,283.1 $1,454.3 $985.6 ($297.5) ‐23.2%
Total $13,591.8 $14,230.8 $14,994.7 $14,246.3 $15.5 0.1%
FY18 FY19 FY20 FY20
Appropriations by Division Actual Budget Requested Approved $▲ %▲Administration $225.0 $241.6 $232.5 $231.2 ($10.4) ‐4.3%
Fire Prevention $643.9 $754.1 $772.8 $762.8 $8.7 1.2%
Fire Suppression $12,722.9 $13,235.1 $13,989.4 $13,252.3 $17.2 0.1%
Total $13,591.8 $14,230.8 $14,994.7 $14,246.3 $15.5 0.1%
5‐Year CIP
Capital Appropriations
FY18 Year
End Balance
FY19
Budget
FY20
Approved
FY21‐24
Proposed
FY25‐29
Proposed
General Capital Fund
D‐44 Smoke Containment System Repair 3.6 65.0 32.0 ‐ ‐
General Capital Fund Total 3.6 65.0 32.0 ‐ ‐
FY20 FY20
FY18 FY19 Requested Approved ▲Fulltime Authorized Positions 187 187 189 187 0
Budget Highlights
Appropriation Summary
Capital Budgets, 5-Year CIP and Project Forecast
Authorized Positions
Fire & Emergency Services
FY20 Budget C-41

The Department of Housing and Community Development (HCD) strives to improve and develop viable neighborhoods by providing decent housing, a suitable living environment and expanding economic opportunity for low to moderate income individuals.
Provide accurate information, comprehensive research and timely advice to the public, management and
staff in support of housing, economic development and community development designed to foster positive community outcomes.
Increase affordable housing activity and production in Athens‐Clarke County through an ongoing and continuously updated strategic planning process that will result in greater funding opportunities, better community awareness of all housing programs and available services as well as stronger public and private sector partnerships.
Partner with ACC departments and housing program providers to reduce slum and blight in neighborhoods through the demolition of dilapidated structures.
Help low‐ to moderate income residents and the chronically unemployed overcome barriers to full‐time regular employment.
Encourage the growth and establishment of the local small‐ to medium sized businesses in order to encourage job creation.
Improve the public health and welfare of Athens‐Clarke County residents.
Partner with social service and shelter providers to reduce homelessness in Athens‐Clarke County.
Encourage citizen participation in decision‐making processes with particular emphasis on participation by persons of low and moderate incomes.
Secure CDBG, HOME, Supportive Housing Services, Supportive Housing, and Shelter + Care Grant funds to
assist community partners in the provision of housing, shelter and community development projects and programs.
Allocate entitlement and competitive grant funds to community partners through Mayor and Commission approval processes in a timely manner.
Partner with community organizations to develop accurate scopes of services and contracts for all grant‐funds in a timely manner.
Provide technical assistance, guidance and monitor all contracted agency expenditures and performance monthly.
Process reimbursements to sub‐recipient agencies in a timely manner.
Reimburse ACC expenditures for sub‐recipient activities from grant sources efficiently.
Administer all grant programs efficiently and accurately and document regulatory compliance to minimize financial risk to ACC.
Ensure all expenditures for program administration are at or below statutory caps. Submit accurate reports to HUD and other primary funding agencies on time.
Mission
Goals
Objectives
Housing & Community Development
FY20 Budget C-42

Outcomes and Performance Measures Goal FY14 FY15 FY16 FY17 FY18
Comments or Analysis
Creates and rehabilitates affordable housing,
# Affordable housing units
supported with CDBG/HOMESteady Increase 21 40 41 57 80
Total # affordable housing units
supported with CDBG/HOME
# Affordable rental housing
units createdData Only 5 16 0 0 12
# Affordable rental housing units
created through HOME, CDBG funding
# Affordable housing units
acquiredData Only 11 3 5 8 0
# Affordable rental housing units
acquired through HOME, CDBG funding
# Affordable homes newly
constructedData Only 3 3 1 2 3
# Affordable homes newly constructed
through HOME, CDBG funding
# Demolitions of dilapidated
homesData Only 5 7 6 4 4
# Demolitions of dilapidated LMI homes
(funded through general fund and
CDBG)
# Rehabilitations of LMI homes Data Only 46 48 54 47 47# LMI homes rehabilitated through
CDBG/HOME
% Housing cost‐burdened
homeownersData Only 24.20% 27.50% N/A N/A N/A
% Homeowners paying more than 30%
of income on housing (American
Community Survey estimate)
% Housing cost‐burdened
rentersData Only 60.70% 63.00% N/A N/A N/A
% Renters paying more than 30% of
income on housing (American
Community Survey estimate)
fosters and coordinates services for disadvantaged populations, and
% LMI persons served in all
CDBG projects
At least 70%
(HUD
regulation)
99% 98% 95% 95% >70%% LMI persons served in all CDBG
projects
% LMI persons served in public
facilities projects
At least 51%
(HUD
Regulation)84% 68% 68% 86% TBD
% LMI persons served in CDBG public
facilities projects
% Change in homelessness
2015‐2016
Percentage
Change ‐3%
16% ‐8.50% ‐0.88% 6.70% ‐11.30%% Change in annual Point in Time count
of homeless persons in ACC
# Homeless persons in ACC Data Only 247 226 224 239 212# Homeless persons in annual Point in
Time (PIT) count
% Homeless persons
unsheltered
32% National
Average (2016
AHAR)
35.20% 40.30% 33.90% 38.90% 21.70%% Homeless persons counted in PIT who
were unsheltered
% Homeless persons sheltered
68% National
Average (2016
AHAR)
64.80% 59.70% 66.10% 61.10% 78.30%% Homeless persons counted in PIT who
were sheltered
% Chronically homeless
population
14% National
Average (2016
AHAR)
17.00% 14.20% 21.90% 22.20% 27%% Persons counted in PIT who were
chronically homeless
% Homeless veterans
7.2% National
Average (2016
AHAR)6.07% 8.85% 6.25% 3.77% 6.60%
% Persons counted in PIT who were
veterans
% Homeless persons in
families
35% National
Average (2016
AHAR)
19.00% 16.80% 30.40% 23.80% 39.60%% Persons counted in PIT who were
homeless family members
# Homeless persons served
annuallyData Only N/A 626 595 528 337
# Homeless persons served through
emergency shelter or transitional
housing
# Permanent supportive
housing bedsData Only 134 154 191 238 266
Total # permanent supportive housing
beds in ACC
# Homeless persons receiving
rapid rehousing (RRH)
assistance
Data Only 107 69 89 76 59
# Homeless persons receiving short‐ to
medium‐term rental assistance in
annual PIT
promotes economic mobility among residents of Athens‐Clarke County.
% Disbursement of revolving
loan fund
70% (HUD
Regulation)N/A N/A N/A 0% 43%
% total assets loaned to businesses,
program revitalized in FY18, 33% loaned
in FY18
% Loans repaid timely 100% N/A N/A N/A N/A 100%% of loans in default status, loans will be
repaid started in FY18
% LMI persons served51% (HUD
Regulation)N/A N/A N/A N/A 95%
% of people served through CDBG:
Economic Development‐funded
programs who are LMI
# of small business
workshops/sessionsData Only N/A N/A N/A N/A 55
# of facilitated sessions to grow &
strengthen small businesses, 2 held YTD
in FY18
Housing and Community Development
Performance Measures
Housing & Community Development
FY20 Budget C-43
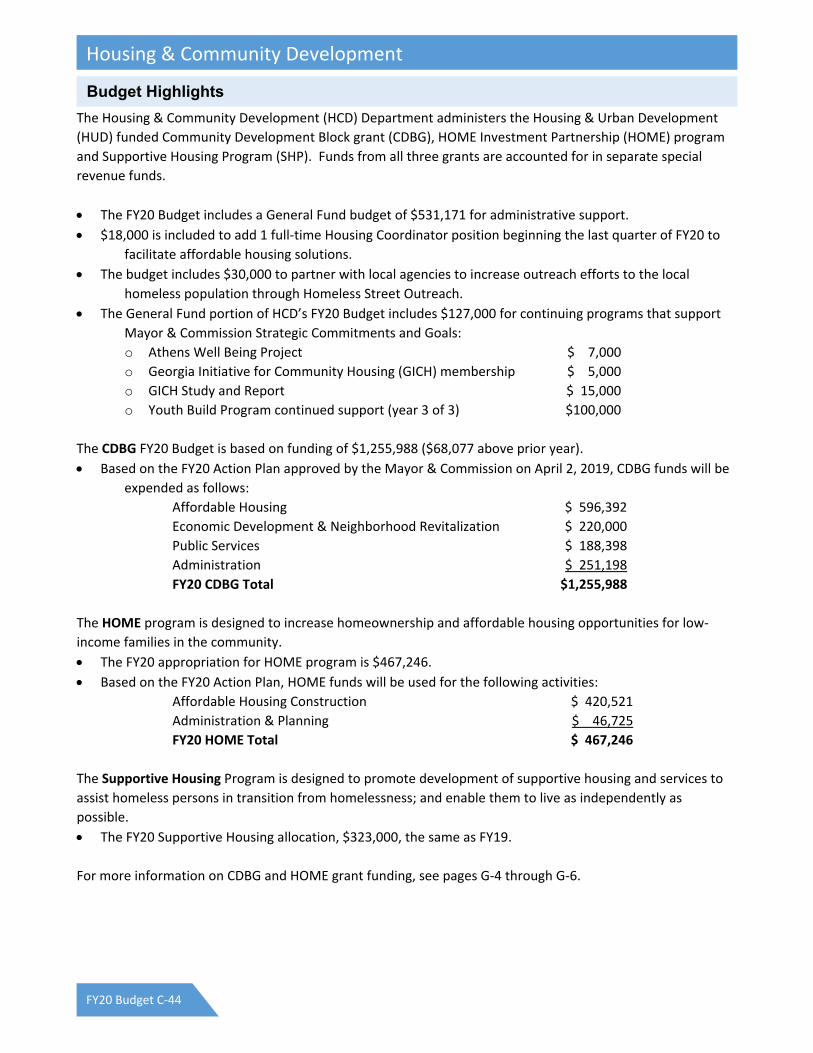
The Housing & Community Development (HCD) Department administers the Housing & Urban Development
(HUD) funded Community Development Block grant (CDBG), HOME Investment Partnership (HOME) program
and Supportive Housing Program (SHP). Funds from all three grants are accounted for in separate special
revenue funds.
The FY20 Budget includes a General Fund budget of $531,171 for administrative support.
$18,000 is included to add 1 full‐time Housing Coordinator position beginning the last quarter of FY20 to
facilitate affordable housing solutions.
The budget includes $30,000 to partner with local agencies to increase outreach efforts to the local
homeless population through Homeless Street Outreach.
The General Fund portion of HCD’s FY20 Budget includes $127,000 for continuing programs that support
Mayor & Commission Strategic Commitments and Goals:
o Athens Well Being Project $ 7,000
o Georgia Initiative for Community Housing (GICH) membership $ 5,000
o GICH Study and Report $ 15,000
o Youth Build Program continued support (year 3 of 3) $100,000
The CDBG FY20 Budget is based on funding of $1,255,988 ($68,077 above prior year).
Based on the FY20 Action Plan approved by the Mayor & Commission on April 2, 2019, CDBG funds will be
expended as follows:
Affordable Housing $ 596,392
Economic Development & Neighborhood Revitalization $ 220,000
Public Services $ 188,398
Administration $ 251,198
FY20 CDBG Total $1,255,988
The HOME program is designed to increase homeownership and affordable housing opportunities for low‐
income families in the community.
The FY20 appropriation for HOME program is $467,246.
Based on the FY20 Action Plan, HOME funds will be used for the following activities:
Affordable Housing Construction $ 420,521
Administration & Planning $ 46,725
FY20 HOME Total $ 467,246
The Supportive Housing Program is designed to promote development of supportive housing and services to
assist homeless persons in transition from homelessness; and enable them to live as independently as
possible.
The FY20 Supportive Housing allocation, $323,000, the same as FY19.
For more information on CDBG and HOME grant funding, see pages G‐4 through G‐6.
Budget Highlights
Housing & Community Development
FY20 Budget C-44

(All figures in $1,000s) FY18 FY19 FY20 FY20
Appropriations by Type Actual Budget Requested Approved $▲ %▲Salary & Benefits $553.7 $579.3 $673.0 $619.8 $40.5 7.0%
Operating $1,750.3 $1,808.1 $1,942.1 $1,952.1 $144.0 8.0%
Total $2,304.0 $2,387.4 $2,615.1 $2,571.9 $184.5 7.7%
FY18 FY19 FY20 FY20
Appropriations by Division Actual Budget Requested Approved $▲ %▲HCD $602.1 $653.1 $766.8 $723.6 $70.5 10.8%
Grants & Programs $1,701.9 $1,734.3 $1,848.3 $1,848.3 $114.0 6.6%
Total $2,304.0 $2,387.4 $2,615.1 $2,571.9 $184.5 7.7%
FY18 FY19 FY20 FY20
Appropriations by Fund Actual Budget Requested Approved $▲ %▲General Fund $340.8 $482.6 $574.5 $531.3 $48.7 10.1%
CDBG Fund $1,202.0 $1,182.1 $1,250.5 $1,250.5 $68.4 5.8%
HOME Fund $526.3 $399.8 $467.2 $467.2 $67.4 16.9%
Supportive Housing Fund $234.9 $322.9 $322.9 $322.9 $0.0 0.0%
Total $2,304.0 $2,387.4 $2,615.1 $2,571.9 $184.5 7.7%
FY20 FY20
FY18 FY19 Requested Approved ▲Fulltime Authorized Positions 8 8 9 9 1
Appropriation Summary
Authorized Positions
Housing & Community Development
FY20 Budget C-45

The Human Resources Department works in partnership with the Unified Government to recruit, retain, and
reward an engaged, prepared, and committed workforce to serve the citizens of Athens‐Clarke County in an
environment of diversity, excellence, responsiveness, transparency, and fairness.
Attract, retain and reward talented and empowered employees.
Promote transparency through improved access to information
Improve internal efficiency and effectiveness.
Document and share our actions to cultivate a culture of innovation by piloting new ideas and adopting
those with demonstrated benefits.
Protect lives, property, and the environment by forming partnerships and implementing programs for a
safer, more resilient Athens‐Clarke County.
The Human Resources Department seeks to enhance the quality of work experience for all Athens‐Clarke
County employees and retirees and the quality of life for all Athens‐Clarke County citizens through effective,
respectful, and compassionate human resource practices.
Professionalism, Safety, Respect, Timeliness, Excellence, Collaboration, Diversity and Wellness
Strategy #1: Attract, retain and reward talented employees
Proposed action:
Annually monitor and adjust compensation and benefits to remain a competitive employer.
Effectively administer the Pension Plan to retain long‐term employees.
Fully implement the results of the Classification and Compensation Study.
Pay a living wage to all full‐time, part‐time and seasonal employees.
Modify and enhance the current Performance Management Program.
Implement new career ladder systems in accordance with results of the Classification and Compensation
Study.
Expand the Great Promise Program and other internship programs. Fully fund public safety promotional
process and conduct assessment centers as necessary.
Effectively resolve employee relations matters as necessary.
Submit “Great Place to Work” application for designation/certification in FY20.
Mission
Goals
Vision
Values
Objectives
Human Resources
FY20 Budget C-46

Strategy #2: Improve internal efficiency and effectiveness
Proposed action:
Enhance and maintain existing Human Resources software systems; prepare for implementation of new
Enterprise Resource Planning System.
Review, inventory, and update human resource written policies within and across departments.
Update Human Resources website and intranet site.
Strategy #3: Create empowered and engaged employees
Proposed action:
Continue recruiting diversity initiative with the Great Promise Partnership.
Continue to brand ACCGOV as an employer of choice that will help to recruit and retain employees.
Continue to fund the ACCGOV employee recognition program.
Contain health care costs through review, analysis and management of claims and promotion of the
Wellness Program to employees and retirees through increased participation in wellness screenings,
fitness programs, healthy hours, and nutrition and wellness classes.
Continue to develop succession planning program for retention of top talent and to put the organization in
the position as retirements continue to impact departments.
Human Resources operations are primarily funded from the General fund.
The budget includes a part‐time Employee Relations Investigator ($22,600) to help investigate
employee/employment grievances and issues.
The Approved Budget continues support for the Great Promise Partnership Internship program and
includes $13,400 to increase participation by two positions.
PERFORMANCE MEASURE GOAL FY13 FY14 FY15 FY16 FY17 FY18Comments or Analysis
Turnover Rate <10% 9.5% 10.9% 10.1% 11.8% 11.8% 12.9%
Reclassification <5 - 7 12 16 15 -
Employment Application/Criminal History >10,000 5,439 5,979 6,377 11,068 11,500 8,680
Payroll - # of Maintenance Entries <9,000 9,349 9,594 10,300 9,616 10,840 10,500
Health Risk Assessment/Wellness >650 650 729 751 749 1,084 1,203
Disciplinary Actions & Dismissals <60 133 151 106 51 88 99
Harassment/Discrimination Issues 0 11 4 3 1 4 3
Worker's Comp Claims Filed <100 165 132 114 124 42 113
Lawsuits 0 12 7 12 10 15 15
Liability Claims/Transactions <200 1,047 445 418 413 181 374
Random Drug Testing (Budget) 622 587 587 793 348 351
Attract, retain and reward talented and empowered employees.
Protect lives, property, and the environment by forming partnerships and implementing programs for a safer, more resilient Athens-Clarke County.
Performance Measures
Budget Highlights
Human Resources
FY20 Budget C-47

The FY20 budget includes a vacancy estimate reducing General Fund Personal Services expenses by
$42,600.
Human Resources also manages three self‐funded insurance programs: the Insurance and Claims Fund which
administers liability and worker compensation, the employee Health Insurance Fund and the retiree health
insurance fund. Each fund has been balanced to move towards maintaining a steady reserve.
For information on the Insurance & Claims Fund and the Health Insurance Fund, see pages E‐34 and 35.
(All figures in $1,000s) FY18 FY19 FY20 FY20
Appropriations by Type Actual Budget Requested Approved $▲ %▲Salary & Benefits $1,484.5 $1,699.1 $1,817.9 $1,760.3 $61.2 3.6%
Operating $731.4 $925.0 $944.9 $925.5 $0.5 0.1%
Total $2,215.9 $2,624.1 $2,762.8 $2,685.8 $61.7 2.4%
FY18 FY19 FY20 FY20
Appropriations by Division Actual Budget Requested Approved $▲ %▲Administration $419.7 $409.8 $528.3 $499.0 $89.2 21.8%
Employment $520.5 $607.0 $623.8 $593.2 ($13.8) ‐2.3%
Benefits & Wellness $995.1 $1,311.0 $1,304.2 $1,298.4 ($12.6) ‐1.0%
Compensation & Payroll $280.6 $296.3 $306.5 $295.2 ($1.1) ‐0.4%
Total $2,215.9 $2,624.1 $2,762.8 $2,685.8 $61.7 2.4%
FY18 FY19 FY20 FY20
Appropriations by Fund Actual Budget Requested Approved $▲ %▲General Fund $1,255.9 $1,444.1 $1,572.5 $1,510.5 $66.4 4.6%
Special Programs Fund $110.7 $25.0 $40.0 $25.0 $0.0 0.0%
Insurance & Claims Fund $301.7 $465.1 $469.0 $469.0 $3.9 0.8%
Health Insurance Fund $547.6 $689.9 $681.3 $681.3 ($8.6) ‐1.2%
Total $2,215.9 $2,624.1 $2,762.8 $2,685.8 $61.7 2.4%
FY20 FY20
FY18 FY19 Requested Approved ▲Fulltime Authorized Positions 21 21 21 21 0
Appropriation Summary
Authorized Positions
Human Resources
FY20 Budget C-48

Independent Agencies are legal, separate entities from ACCGOV.
FY20 Budget allocates $7.1 million for Independent Agencies in the following funds:
o General Fund $3,816,059
o Hotel/Motel Tax Special Revenue Fund $3,214,125
o Special Programs Special Revenue Fund (Project Safe) $ 26,000
(Fine revenues designated for victim assistance programs per State Law)
In addition, $1,758,384 is included for indigent defense (GA Public Defender Standards Council contract).
Additional information provided in Section “F” of this document.
FY20
Approved General Fund Advantage Behavioral Health Systems 180,206 Athens‐Clarke County Libraries 2,028,197 Athens Community Council on Aging, Inc. (Operating & Capital) 287,300 Athens Cultural Affairs Commission 21,000 Athens Neighborhood Health Center 100,000 Athens Tutorial Program 3,500 Clarke County Public Health Department 946,354 Department of Family & Children Services 208,600 Oconee Rivers Greenway Commission 16,500 United Way of Northeast Georgia 2‐1‐1/Community Connection 24,402
Subtotal $3,816,059 Hotel/Motel Tax Special Revenue Fund Athens Convention & Visitors Bureau 1,178,250 Classic Center Authority 2,035,875
Subtotal $3,214,125 Special Programs and Initiatives Fund Project Safe 26,000 Total All Funds $7,056,184
Budget Highlights
Appropriation Summary
Independent Agencies
FY20 Budget C-49
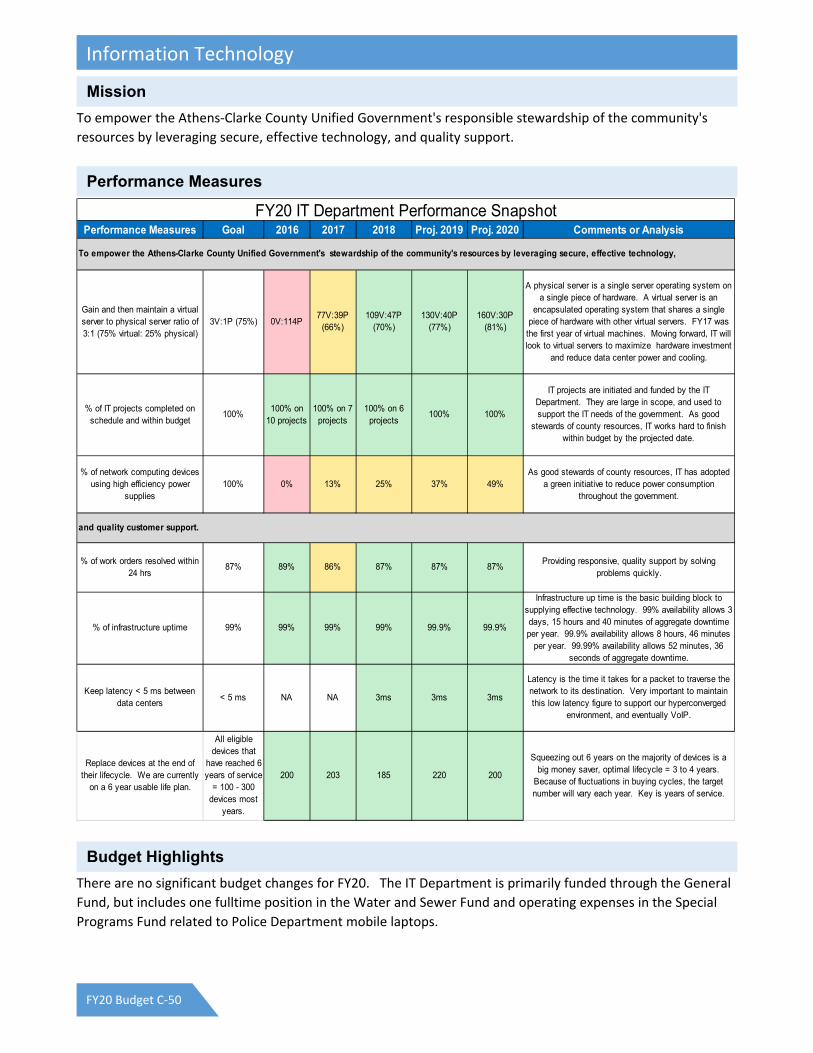
To empower the Athens‐Clarke County Unified Government's responsible stewardship of the community's
resources by leveraging secure, effective technology, and quality support.
There are no significant budget changes for FY20. The IT Department is primarily funded through the General
Fund, but includes one fulltime position in the Water and Sewer Fund and operating expenses in the Special
Programs Fund related to Police Department mobile laptops.
Performance Measures Goal 2016 2017 2018 Proj. 2019 Proj. 2020 Comments or Analysis
Gain and then maintain a virtual server to physical server ratio of 3:1 (75% virtual: 25% physical)
3V:1P (75%) 0V:114P77V:39P
(66%)109V:47P
(70%)130V:40P
(77%)160V:30P
(81%)
A physical server is a single server operating system on a single piece of hardware. A virtual server is an
encapsulated operating system that shares a single piece of hardware with other virtual servers. FY17 was
the first year of virtual machines. Moving forward, IT will look to virtual servers to maximize hardware investment
and reduce data center power and cooling.
% of IT projects completed on schedule and within budget
100%100% on
10 projects100% on 7
projects100% on 6
projects100% 100%
IT projects are initiated and funded by the IT Department. They are large in scope, and used to support the IT needs of the government. As good
stewards of county resources, IT works hard to finish within budget by the projected date.
% of network computing devices using high efficiency power
supplies100% 0% 13% 25% 37% 49%
As good stewards of county resources, IT has adopted a green initiative to reduce power consumption
throughout the government.
% of work orders resolved within 24 hrs
87% 89% 86% 87% 87% 87%Providing responsive, quality support by solving
problems quickly.
% of infrastructure uptime 99% 99% 99% 99% 99.9% 99.9%
Infrastructure up time is the basic building block to supplying effective technology. 99% availability allows 3 days, 15 hours and 40 minutes of aggregate downtime per year. 99.9% availability allows 8 hours, 46 minutes
per year. 99.99% availability allows 52 minutes, 36 seconds of aggregate downtime.
Keep latency < 5 ms between data centers
< 5 ms NA NA 3ms 3ms 3ms
Latency is the time it takes for a packet to traverse the network to its destination. Very important to maintain this low latency figure to support our hyperconverged
environment, and eventually VoIP.
Replace devices at the end of their lifecycle. We are currently
on a 6 year usable life plan.
All eligible devices that
have reached 6 years of service
= 100 - 300 devices most
years.
200 203 185 220 200
Squeezing out 6 years on the majority of devices is a big money saver, optimal lifecycle = 3 to 4 years.
Because of fluctuations in buying cycles, the target number will vary each year. Key is years of service.
FY20 IT Department Performance Snapshot
To empower the Athens-Clarke County Unified Government's stewardship of the community's resources by leveraging secure, effective technology,
and quality customer support.
Mission
Performance Measures
Budget Highlights
Information Technology
FY20 Budget C-50

(All figures in $1,000s) FY18 FY19 FY20 FY20
Appropriations by Type Actual Budget Requested Approved $▲ %▲Salary & Benefits $1,436.9 $1,764.6 $1,821.2 $1,808.0 $43.4 2.5%
Operating $1,371.5 $1,798.3 $1,798.6 $1,798.6 $0.3 0.0%
Total $2,808.4 $3,562.9 $3,619.8 $3,606.6 $43.7 1.2%
FY18 FY19 FY20 FY20
Appropriations by Fund Actual Budget Requested Approved $▲ %▲General Fund $2,696.3 $3,401.1 $3,454.5 $3,441.3 $40.2 1.2%
Special Programs Fund $104.7 $104.7 $104.7 $104.7 $0.0 0.0%
Water & Sewer Fund $7.4 $57.1 $60.6 $60.6 $3.5 6.1%
Total $2,808.4 $3,562.9 $3,619.8 $3,606.6 $43.7 1.2%
5‐Year CIP
Capital Appropriations
FY18 Year
End Balance
FY19
Budget
FY20
Approved
FY21‐24
Proposed
FY25‐29
Proposed
General Capital Fund
D‐47 Information Technology Equipment Replacement
Program
643.8 290.0 400.0 1,680.0 890.0
General Capital Fund Total 643.8 290.0 400.0 1,680.0 890.0
FY20 FY20
FY18 FY19 Requested Approved ▲Fulltime Authorized Positions 23 23 23 23 0
Appropriation Summary
Capital Budgets, 5-Year CIP and Project Forecast
Authorized Positions
Information Technology
FY20 Budget C-51

The purpose of Georgia’s Juvenile Courts is to secure for each child who comes within the jurisdiction of the
court such care and guidance, preferably in his own home, as will secure his or her moral, emotional, mental,
and physical welfare as well the safety of both the child and the community. The intention of the General
Assembly of Georgia in creating the juvenile code is to strengthen and preserve family relationships,
countenancing the removal of a child from his or her home only when state intervention is essential to protect
such child and enable him or her to live in security and stability. (O.C.G.A. 15‐11‐1, Effective January 1, 2014.)
The mission of the Athens‐Clarke County Juvenile Court is to protect the well‐being of the child under the Court’s
jurisdiction, providing guidance and control as necessary, while balancing the needs and best interest of the
community, while fulfilling the intent of the newly rewritten Juvenile Code.
The goal of the Athens‐Clarke County Juvenile Court is to serve the community and the children whose cases
are before the court by balancing the requirements of law, the best interest of the child and the community,
and to fulfill the mandated requirements of the newly rewritten juvenile code within the bounds of the
resources provided by the Athens‐Clarke County Government.
Protect the community
Promote accountability for violations of law
Provide treatment and rehabilitation and equip juvenile offenders with the ability to live responsibly and productively
In every proceeding to guarantee due process of law, as required by the Constitutions of the United States and the State of Georgia, through which every child and his or her parent and all other interested parties are assured fair hearings at which legal rights are recognized and enforced.
Mission
Goals
Objectives
Juvenile Court
FY20 Budget C-52

Actual Forecast
CY15 CY16 CY17 CY18 CY19
All Case Types Disposed 1,753 2,051 2,123 2,082 2,200
Delinquent cases filed 856 1,001 1,104 847 1,000
Delinquent cases disposed 1,019 1,100 964 1,247 1,150
All Case Types Filed 1,827 2,064 2,253 1,327 1,500
Unruly Cases Disposed 27 62 78 120 94
Traffic Cases Filed 194 234 122 87 124
Traffic Cases Disposed 202 201 79 436 201
Deprivation/Dependency Cases Filed 719 898 934 338 642
Deprivation/Dependency Cases Disposed 473 545 592 348 652
Termination of Parental Rights Filed 35 37 21 31 28
Termination of Parental Rights Disposed 19 21 22 54 22
Special Proceedings filed 23 19 72 24 48
Special Proceedings Disposed 13 9 42 121 35
The FY20 Approved Budget includes $925 for additional training.
The court also requested the following items which were not recommended nor approved:
- $82,546 for Indigent Defense and Court Appointed Fees
- A Program Coordinator for Family Dependency Court ($66,000)
- A Senior Case Management Specialist for the Treatment and Accountability Court ($48,000).
(All figures in $1,000s) FY18 FY19 FY20 FY20
Appropriations by Type Actual Budget Requested Approved $▲ %▲Salary & Benefits $338.8 $389.3 $468.9 $354.8 ($34.5) ‐8.9%
Operating $496.5 $263.1 $346.5 $264.0 $0.9 0.3%
Total $835.3 $652.4 $815.4 $618.8 ($33.6) ‐5.2%
FY18 FY19 FY20 FY20
Appropriations by Fund Actual Budget Requested Approved $▲ %▲General Fund $630.0 $652.4 $815.4 $618.8 ($33.6) ‐5.2%
Grants Fund $187.8 $0.0 $0.0 $0.0 $0.0 ‐‐
Special Programs Fund $17.5 $0.0 $0.0 $0.0 $0.0 ‐‐
Total $835.3 $652.4 $815.4 $618.8 ($33.6) ‐5.2%
Performance Measures
Budget Highlights
Appropriation Summary
Juvenile Court
FY20 Budget C-53

FY20 FY20
FY18 FY19 Requested Approved ▲Fulltime Authorized Positions 5 5 7 5 0
Authorized Positions
Juvenile Court
FY20 Budget C-54

The mission of the Athens‐Clarke County Leisure Services Department is to build a healthier and more livable
community by creating opportunities to learn, to create and to play in quality parks, programs and facilities
that are valued by our citizens.
Complete the new Leisure Services Master Plan and present document to Mayor and Commission.
Grow partnerships within the community that support the Department mission by providing opportunities
for program and service growth.
Enhance the department’s sense of value and position in the community by improving operational
outcomes in the areas of marketing, branding, and public information.
Cultivate and implement methods to improve the department’s culture and staff morale/retention.
Implement remaining SPLOST 2011 projects involving Greenway and Firefly Trails. Work to support and
promote the SPLOST 2020 referendum.
Grow new program opportunities for under‐served populations.
Augment General Fund support by increasing reliance on grants, sponsors and partners to grow programs
and services; implement pricing policy change to provide opportunity for new revenue streams.
Implement the new Computerized Maintenance Management System and evaluate efficiencies and
effectiveness.
Work with Carl Vinson Institute and Department staff to secure quality citizen input regarding leisure
opportunities within the community; draft and present final Master plan document by June 2020.
Develop joint programs and services with Athens Community Council on Aging and the Clarke County
School District that augment Leisure Service opportunities. Work with both East and West Athens
Business Associations to provide community special events. Seek new additional partnerships that
align with the Department mission.
Complete and implement the first phase of a marketing plan that expands the use of social media to
enhance outreach to a younger, presently underserved clientele; pursue and cultivate avenues to
strengthen departmental branding and to share positive experiences, opportunities, and stories about
the department.
Implement and evaluate new programs that focus on employee growth to include succession planning and
recognition/reward opportunities; conduct staff surveys to evaluate each program. Seek avenues for
more employee feedback, input and interaction.
Evaluate impact of additional SPLOST funded trails and bridges along the Greenway and Firefly Trail
systems. Implement partial year funding and present plans for twelve month operations for FY21
budget.
Continue development of new Grand Slam program, Mayor’s Youth Council, summer teen camps, senior
wellness programs, and therapeutic recreation opportunities all in an effort to address under‐served
populations within Athens‐Clarke County.
Research and submit applications for a minimum of six new grants to support department programs
and/or facility enhancements. Evaluate all programs in accordance with adopted pricing policy and
submit incremental fee changes as deemed appropriate.
Mission
Goals
Objectives
Leisure Services
FY20 Budget C-55

Implement City Works software by securing needed hardware and working with consultants to transition
appropriate data. Continue to monitor efficiencies and make required adjustments as needed.
Performance Measure FY14 FY15 FY18 FY19 Q1-2WE BUILD A HEALTHIER AND MORE LIVABLE COMMUNITY
Acres of park land per 1,000 citizens 21.36 21.36 21.69 21.69
Acres of developed land for recreation 1973 1973 1,980 1,980
Acres of undeveloped land for conservation
520 520 552 552
# of developed parks per residents1 for every
5,836 residents
1 for every 5,836
residents
1 for every 5,558
residents
1 for every 5,558
residents
Miles of bike and walking trails 35 40 45 45
WE CREATE OPPORTUNITIES TO LEARN, CREATE, AND PLAY
# of programs offered NA NA 1,030 541 # of program participants NA NA 15,539 7,943 # of aquatic visitors 39,796 38,670 44,682 17,976
# of scholarship participants NA NA 966 446
Scholarship discount % of total program revenue
NA NA 23% 7%
# of after school participants NA NA 81 57Number of grants awarded 2 3 4 1 Cash value of grants awarded $35,000.00 $80,050.00 $61,793.00 $10,000.00Value of donations & sponsors $35,876.15 $21,671.16 $22,258.53 $18,027.00
# of volunteers & volunteer hours1,701
20,040 hrs1,652
24,091 hrs1,114
23,183 hrs785
8,883 hrs
Monetary value for volunteers $445,890.00 $555,779.37 $572,388.27 $219,321.27WE PROVIDE QUALITY PARKS, PROGRAMS, AND FACILITIES THAT ARE VALUED BY OUR CITIZENS
Annual operating budget per capita 61.60 61.69 $66.78 $67.71 Revenue vs Expenditures 15% 15% 15% 14%
# of FT staff per 10,000 residents 7.3 Staff members
86% 86% 86% 86%
Recreation user satisfaction NA NA 90% 86%
# of facility rentals (includes special events)
NA NA 1,887 986
% of repeat program participants NA NA 81% 69%
$46,227.76
FY18 includes the addition phase 1 of Rails to Trails; FY19 includes next phase of Rails to Trails and Greenway
15,923
4 $13,673.00
971
32,630 38,934
520
1,973
7
≥ 2,000≥ 40,000 hrs
1,50722,417 hrs
$100,000
LE
ISU
RE
SE
RV
ICE
S
1,43230,213 hrs
Data Only
≥12
978
FY16 and FY17 will be for summer camps only; FY18 includes all programs and camps
Hourly value of $24.69 is from
Number of participants is anticipated to decrease based on policy changes in FY18
Roster Report
NRPA Benchmark
NRPA BenchmarkFY18 budget reallocates one position to the Sustainability Office and adds another through SPLOST
Percentage of discounts is anticipated to decrease based on policy changes in FY18
FY18 will add 4 miles of Greenway and 1 mile of Rails to Trails; FY19 will add 11 miles of Rails to Trails and Greenway combined
Data Only
Data Only
FY17
21.42
1 for every 5,836
residents
GOAL
FY18 will add 25 acres for Matthew Motors property
527
1,973
$62.67
86%
15%
97%
Data Only
92
Data Only 1,328
107
Data Only 38% 56%
$150,000
$528,144.52
$78,205.00$31,099.94
69% 85%≥ 90% This number may reduce due to cap limits in the new scholarship program
$736,849.00
90%
1,869 Data Only
$65.01 ≥ 20%
7.3 = 100% 86%
$77.32 of annual 16%
97%
1,755
FY19 Notes
NRPA BenchmarkLatest census totals 116,714 residents; includes developed and undeveloped land (2,500 acres currently); FY19 is ~2,600 acres due to Rails to Trails/Greenway expansions
Data Only
Data Only 16,104
21.36
1 for every 5,836
residents
40
1 for every 2,266 residents
Data Only 40
FY16
Data Only
9.6 acres per 1,000 residents
967
NRPA BenchmarkAny site with added recreation amenities; 21 developed sites for public access
Performance Measures
Leisure Services
FY20 Budget C-56

The Approved FY20 Budget includes fee increases which will generate an additional $26,000 of revenue for
the General Fund. These fee changes are consistent with the pricing policy approved by the Mayor
and Commission in December 2018.
The budget includes $30,000 for a full year of funding for the Grand Slam Program.
An increase of $25,800 is budgeted for the purchase of support hardware for CityWorks implementation
and ongoing software costs.
A vacancy estimate is approved, reducing General Fund Personal Services expenses by $140,900.
(All figures in $1,000s) FY18 FY19 FY20 FY20
Appropriations by Type Actual Budget Requested Approved $▲ %▲Salary & Benefits $5,206.3 $5,787.1 $6,115.3 $5,902.2 $115.1 2.0%
Operating $2,099.4 $2,115.4 $2,210.7 $2,193.4 $78.0 3.7%
Total $7,305.7 $7,902.5 $8,326.0 $8,095.6 $193.1 2.4%
FY18 FY19 FY20 FY20
Appropriations by Division Actual Budget Requested Approved $▲ %▲Administration $941.8 $2,166.3 $2,211.8 $2,167.1 $0.8 0.0%
Arts Division $1,783.2 $1,314.6 $1,360.0 $1,333.0 $18.4 1.4%
Park Services $1,834.5 $0.0 $0.0 $0.0 $0.0 ‐‐
Recreation Division $2,745.9 $2,645.7 $2,784.5 $2,713.7 $68.0 2.6%
Nature Division $0.3 $1,775.9 $1,969.7 $1,881.8 $105.9 6.0%
Total $7,305.7 $7,902.5 $8,326.0 $8,095.6 $193.1 2.4%
FY18 FY19 FY20 FY20
Appropriations by Fund Actual Budget Requested Approved $▲ %▲General Fund $7,290.9 $7,902.5 $8,291.0 $8,060.6 $158.1 2.0%
Special Programs Fund $0.0 $0.0 $35.0 $35.0 $35.0 ‐‐
Water & Sewer Fund $14.8 $0.0 $0.0 $0.0 $0.0 ‐‐
Total $7,305.7 $7,902.5 $8,326.0 $8,095.6 $193.1 2.4%
Budget Highlights
Appropriation Summary
Leisure Services
FY20 Budget C-57

5‐Year CIP
Capital Appropriations
FY18 Year
End Balance
FY19
Budget
FY20
Approved
FY21‐24
Proposed
FY25‐29
Proposed
General Capital Fund
D‐49 Pool Repairs and Renovations 17.9 ‐ 90.0 ‐ 790.2
D‐52 Park Equipment ‐ Replacement / Life Cycle 2.5 ‐ 50.0 ‐ 471.0
General Capital Fund Total 20.4 ‐ 140.0 ‐ 1,261.2
FY20 FY20
FY18 FY19 Requested Approved ▲Fulltime Authorized Positions 73 73 75 73 0
Capital Budgets, 5-Year CIP and Project Forecast
Authorized Positions
Leisure Services
FY20 Budget C-58

The Mission of the Magistrate Court is to deliver justice to the citizens of Athens‐Clarke County by:
(1) Ruling on disputed civil claims or approving mutual settlements in civil cases involving:
(a) Claims up to $15,000;
(b) Dispossessory proceedings between landlords and tenants; (c) Abandoned motor vehicle foreclosures;
(d) Personal property foreclosures; and (e) Garnishments.
(2) Managing preliminary matters in criminal cases by:
(a) Having a judge available 24 hours a day, seven days a week (including holidays) to consider requests for the issuance of arrest warrants and search warrants in misdemeanor and felony cases;
(b) Conducting hearings seven days a week (including holidays) to set bail for persons arrested, including the imposition of special conditions of pre‐trial release;
(c) Communicating with victims of domestic violence and victims of other violent or sex crimes to determine safety issues prior to consideration of bail;
(d) Presiding over felony preliminary hearings; (e) Presiding over warrant application hearings brought by both private citizens and law enforcement
officials; (f) Assigning a Superior Court Judge to each criminal case where bond has been set by a Magistrate
Court Judge (by Special Order of the Superior Court Judges, entered January 10, 2005). (g) Assigning a State Court Judge to each criminal case where bond has been set by a Magistrate Court
Judge (by Special Order of the State Court Judges, entered December 20, 2016). (h) Conducting hearings to set bail for persons arrested after indictment (true bill) by the grand jury
on cases where the Magistrate Judge would otherwise have the authority to set bail (by Special Order of the Superior Court Judges, entered January 11, 2006).
(3) Appointing defense counsel and presiding over the trial, sentencing, and probation revocation hearings in
cases involving misdemeanor deposit account fraud (“bad checks”) up to $1,500.
Goal #1
Continue to provide the highest level of services to the public by maximizing office efficiency and accuracy.
Objective #1
(a) Employ clerk staff sufficient to meet the operational needs of the Court. (b) Train new employees. (c) Continue to meet all statutory mandates for the scheduling and resolution of cases. (d) Maintain a current calendar with no backlog of pending cases. (e) Continue to maintain clerical errors and omissions below 5%. Continue to maintain errors on
Statement of Claims, Dispossessory Warrants and Warrant Applications below 6%.
Goal #2
Continue to seek input both internally from department staff and externally from the judicial and legal
community, the business community, and other interested parties on ways to improve the operation of the
court, and make ongoing revisions to court procedures and court policies to implement the suggestions
Mission
Goals and Objectives
Magistrate Court
FY20 Budget C-59

Objective #2
(a) Continue to hold quarterly staff meetings and receive input from the judges and court staff on department policies and procedures.
(b) Schedule periodic forums with members of the legal community, business community, and other interested parties to solicit input on ways to improve court operations.
(c) Continue to participate in the monthly Legal Pop‐up Clinics and provide information to the public on the resources available in Magistrate Court and provide copies of Magistrate Court forms.
(d) Continue to participate in the training of new police officers and sheriff’s deputies on court procedures.
(e) Maintain open communication and coordination with all law enforcement.
Goal #3
Maximize the use of computer technology and the Internet to enhance and streamline court functions.
Objective #3
(a) Maintain and update the court’s webpage to ensure public access to information about the Magistrate Court, including links to frequently requested forms.
(b) Continue using the Electronic Warrant Interchange (EWI) program for efficient issuance of warrants.
(c) Continue using specialized software for access to police reports, which reduces paperwork, reduces the workload of police and court staff, and protects unauthorized release of information.
(d) Work with the County Law Library staff and its Legal Clinic volunteers to provide information about Magistrate Court.
Goal #4
Develop and implement new data management system with SPLOST funds.
Objective #4
(a) In coordination with court, jail and law enforcement staff, develop data exchange system for sharing criminal records information.
(b) Work with Court Administrator to develop and implement a new case management system to manage civil cases, garnishments, and to promote other automated processing.
(c) Implement imaging project for all case files stored off‐site.
Magistrate Court
FY20 Budget C-60

Actual
CY 18 Performance
Measures
CY16 CY17 CY18 Goal Actual
Goal #1
Warrant Application Filings 265 214 198
Criminal Arrest Warrants 6,734 7,184 6,310
Search Warrants 382 364 241 80% Returned 90%
Criminal Hearings 3,246 3,313 2,916 5% Error Rate 5.3%
Civil Filings 6,231 5,649 4707 5% Error Rate
Civil Hearings 2,309 2,302 1853 5% Error Rate 4.7%
Garnishment Answers 1,807 2,200 1,453 5% Error Rate 1%
Goal #2 100% 100% 100% 100% Met
Quarterly Staff Meetings (4 sessions) 100% 100% 100% 100% Met
Annual Community Meeting (1 session) 100% 9 sessions 100% 900%
Goal #3 – Technology
Magistrate Court Web Page Views 12,925 9,616 9,309 10% Increase Not Met
Arrest Warrants by EWI 5,205 5,486 5,118 80% Electronic 95%
Blood Search Warrants by EWI 30 10 4 100% Returned Met
Dispossessory E‐Filing 176 279 255 10% Increase Not Met
Public use of County Law Library (New)
Goal #4
Data Exchange 90% 90% 90% Met
New case management system 80% 80% 80% Met
Imaging & Scanning (Off‐site Files) 20% 20% 20% Met
Financials (transactions in dollars) $922,462 $993,315 $807,894 5% Increase Not Met
The FY20 Approved Budget for Magistrate Court includes an additional $11,462 for operating expenses. There
are no other significant changes to the FY20 Approved Budget for Magistrate Court.
Performance Measures
Budget Highlights
Magistrate Court
FY20 Budget C-61

(All figures in $1,000s) FY18 FY19 FY20 FY20
Appropriations by Type Actual Budget Requested Approved $▲ %▲Salary & Benefits $726.0 $803.2 $807.5 $802.7 ($0.5) ‐0.1%
Operating $58.4 $60.7 $72.2 $72.2 $11.5 18.9%
Total $784.4 $863.9 $879.7 $874.9 $11.0 1.3%
FY18 FY19 FY20 FY20
Appropriations by Division Actual Budget Requested Approved $▲ %▲Court Operations $463.2 $519.3 $541.2 $536.4 $17.1 3.3%
Court Judge's Office $321.2 $344.6 $338.5 $338.5 ($6.1) ‐1.8%
Total $784.4 $863.9 $879.7 $874.9 $11.0 1.3%
FY20 FY20
FY18 FY19 Requested Approved ▲Fulltime Authorized Positions 11 11 11 11 0
Appropriation Summary
Authorized Positions
Magistrate Court
FY20 Budget C-62

The Office of the Manager is responsible for the implementation of all policies, programs, contracts, ordinances, and resolutions as approved and directed by the Mayor and Commission. This office performs the administrative functions of the government which support the activities of the Mayor and Commission. The ACCGOV Charter dictates the authority and the responsibility of the Manager.
During FY20, the Manager’s Office will focus on the following goals and objectives: • Guide the organization to produce a positive year-end fund balance while minimizing operational and
service delivery interruptions. • Continue to monitor and evaluate both short-term and long-term financial projections and develop
recommendations to meet future operational challenges and/or opportunities. • Assist in finalizing the SPLOST 2020 referendum and if approved, establishing the implementation plan. • Assist the Mayor and Commission in their efforts and intent to reform the criminal justice system. • Work with the Transit Department to implement a tiered approach to Fare Free Transit as directed by the
Mayor and Commission. • Continue the management of the SPLOST 2011 Program and pursue the closeout phase of the 2005
Program. • Assist the Mayor and Commission in their efforts and intent to create more affordable housing and mixed
income neighborhoods within Athens-Clarke County. • Support the Public Utilities Department in, evaluating potential future water source alternatives, and
implementing the service delivery plan. • Continue to support the Solid Waste Department’s efforts to refine and enhance solid waste reduction
efforts in an effort to meet defined Mayor and Commission goals. Adjust rates to fully realize revenue recovery in each cost center.
• Assist the Mayor and Commission in the efforts and intent to invest in human infrastructure. • Work with relevant departments to begin conversion to a fully digital plans review process. • Work with Corrections on programs to create opportunities for rehabilitated offenders. • Work with the Mayor’s Commission on Youth to identify opportunities for at-risk youth. • Monitor ACCGOV’s ability to maintain competitive market wage adjustments and benefits to retain
employees and participate in the comprehensive wage and salary study. • Facilitate the completion of the Sustainability Plan. Further, to develop a strategy for ACCGOV to become
100% clean and renewable energy by 2035. • Coordinate the transition to a more centralized model of GIS governance. • Implement a performance metrics initiative tied to the M&C Strategic Commitments. • Coordinate and cooperate with Office of Operational Analysis studies in order to seek improvements to
government functions and efficiencies. • Identify funding and partnership opportunities to implement various Corridor study recommendations
(Atlanta Hwy, Lexington Rd, Prince Ave). • Monitor and report on progress of the FY19 M&C Goals and Strategies, establish a link with ongoing
agenda items, and implementing FY20 budget goals. • Continue to work with economic development staff to capture new prospects and encourage growth of
existing business and industry, as well as to establish a program to assist with the development of entrepreneurialism, particularly with respect to minority business development.
Mission & Goals
Goals/Objectives
Manager's Office
FY20 Budget C-63

• Encourage the Police Department to continually strengthen its culture of community oriented policing and to conduct its operations in an open and transparent manner.
• Support the implementation strategies for Envision Athens and the Comprehensive Plan. • Foster leadership development and new initiatives within the Unified Government through the Innovation
Ambassador program and participating in the Alliance for Innovation, Peake Academy and other efforts. • Continue to explore options to engage, educate, and inform citizens of Athens-Clarke County regarding the
functions, policies, and programs of the Unified Government (i.e. Citizens Academy). • Continue to staff and advise the Government Operations Committee and Legislative Review Committee. • Work towards the development of the Athens-Clarke County Emergency Management Plan 5-year update. • Work towards implementation of the City Works platform for PUD, Leisure Services, Central Services, and
T&PW. • Support the efforts of Organizational Development to implement a meaningful Executive Coaching
Program and organizational succession plan. • If approved by the voters, assist in the coordination and implementation of the TSPLOST program. • Work with the Economic Development Department and the Attorney’s Office to create the first tax
allocation district in Athens-Clarke County.
Performance Measure Goal FY17 FY18 (Q1) Methodology Reference
% of participants that purport they developed new skills or competencies after attending an OD program
80% New measure for FY18
97.3%
% of participants that rated facilitator as effective 80% New measure for FY18
99.4%
% of participants that purported OD program was key to their success
80% New measure for FY18
98.0%
% of participants that said they would recommend the OD program to others 80%
New measure for FY18 98.2% indicates customer satisfaction
% of participants that "agree" they gained self-awareness following completion of OD program 80%
New measure for FY18 100%
Total hours of training program instruction in fiscal year 200 hours New measure for FY18
227
% of participants that reported receiving a promotion within 1 year from completing OD training program 30%
New measure for FY19
% of ACC employees that completed training during fiscal year 14%
New measure for FY18 12%
based on total ACC full-time employees; relates to outreach
Total hours of staff development to design/update OD training programs 300 hours
New measure for FY19
Average training cost per trainee- $ investment in training Data only New measure for FY18
$ 112.15
supplies+refreshments+(trainer salaries per hour*hours of training)/# of people trained
# of participants that completed training during fiscal year 250New measure
for FY18 205 contextual measure
Organizational Development
At the heart of Organizational Development, we create meaningful programs
Performance Measures
Manager's Office
FY20 Budget C-64

Performance Measure Goal FY17 FY18 (Q1) Methodology Referenceand learning experiences that support strategic relationships.% of participants that made new contacts to expand their network
80% New measure for FY19
% of participants that "agree" they gained self-awareness following completion of OD coaching experience
80% New measure for FY19
% of participants that purported OD learning experience was important to their success 80%
New measure for FY19
includes coaching, Innovation Ambassadors, Executive onboarding
% of participants that rated coach/facilitator as effective 80%New measure
for FY19
Total hours of learning experience engagement 100 New measure for FY18
80
# of participants that a learning experience during fiscal year 100 New measure for FY18
54 contextual measure
% of ACC employees that completed learning experience during fiscal year
5% New measure for FY18
3% based on total ACC full-time employees; relates to outreach
Performance Measure Goal FY14 FY15 FY16 FY17 FY18 FY19 (Q2) FY18 (Pace) FY19 (Q2) Notes
Website visitors Data Only
1.49 million 1.60 million 1.80 million 1.89 million 2 million 452,852 1.02 million
Website pageviews Data Only
4.46 million 4.12 million 4.54 million 4.23 million 4.3 million 886,918 2.07 million
Website notification subscriptions (all notifications)
Data Only
24,466(1/1/14)
27,145 (1/1/15) N/A
33,878 (6/14/17) 37,818 N/A 43,124
Number of downloads from website
Data Only
558,721 1.1 million 685,795 732,801 1.1 million 244,485 518,735
NewsFlashes distributed 52 56 59 61 52 103 18 34NewsFlash items posted on accgov.com homepage
75 N/A N/A N/A 50 (11/16 - 6/17) 206 52 98
Number of social media accounts managed (@accgov)
Data Only N/A N/A N/A 8 8 7 7
Twitter, Instagram, Facebook, LinkedIn, YouTube, Vimeo, Nextdoor (Google+ is being removed)
Social media following/subscribers for main ACC accounts
TBD N/A N/A N/A N/A 12,190 13,066 13,066Twitter, Instagram, Facebook, LinkedIn, YouTube, Vimeo (not counting Nextdoor)
Minutes of video watched on social media
Data Only
N/A N/A N/A N/A 166,804 48,801 87,580
Hours of Mayor & Commission meetings broadcast / streamed
Data Only 28:24 28:57 43:54 48:17 53:31 16:35 32:17
Minutes of non-meeting video produced
360 N/A N/A N/A 236 (11/16 - 6/17) 276 74 107
Number of offices featured in videos | newsflashes | homepage
TBD N/A N/A N/A 7 | 20 | 19 28 | 21 | 25 N/A 19 | 22 | 24 Offices include departments and divisions
Number of film project inquiries assisted
Data Only
N/A 7 11 23 25 9 17
Number served in outside group presentations, panels & tours
Data Only N/A N/A N/A N/A 185 16 63
Public digital displays managed
Data Only 9 9 9 9 7 7 7
GDOL & DFCS do not currently display ACTV
Number of department website liaisons trained
Data Only
N/A 56 15 13 32 9 12
Number of department social media liaisons trained (SM@RT Team)
Data Only N/A N/A 16 22 10 6 10
Number of social media accounts monitored
Data Only
N/A N/A N/A 70 73 96 96
Number of locations claimed and monitored in Google Business
Data Only N/A N/A N/A N/A 93 96 96
Social Media Resource & Training (SM@RT) Team Best Practice & Training Session Hours
8 N/A N/A N/A 6 7.5 3.5 5.25
Public Information Office
The Public Information Office provides clear and open communications through a variety of outlets about the government's goals, activities, and services
and coordinates and collaborates with other departments’ communications staff.
Manager's Office
FY20 Budget C-65
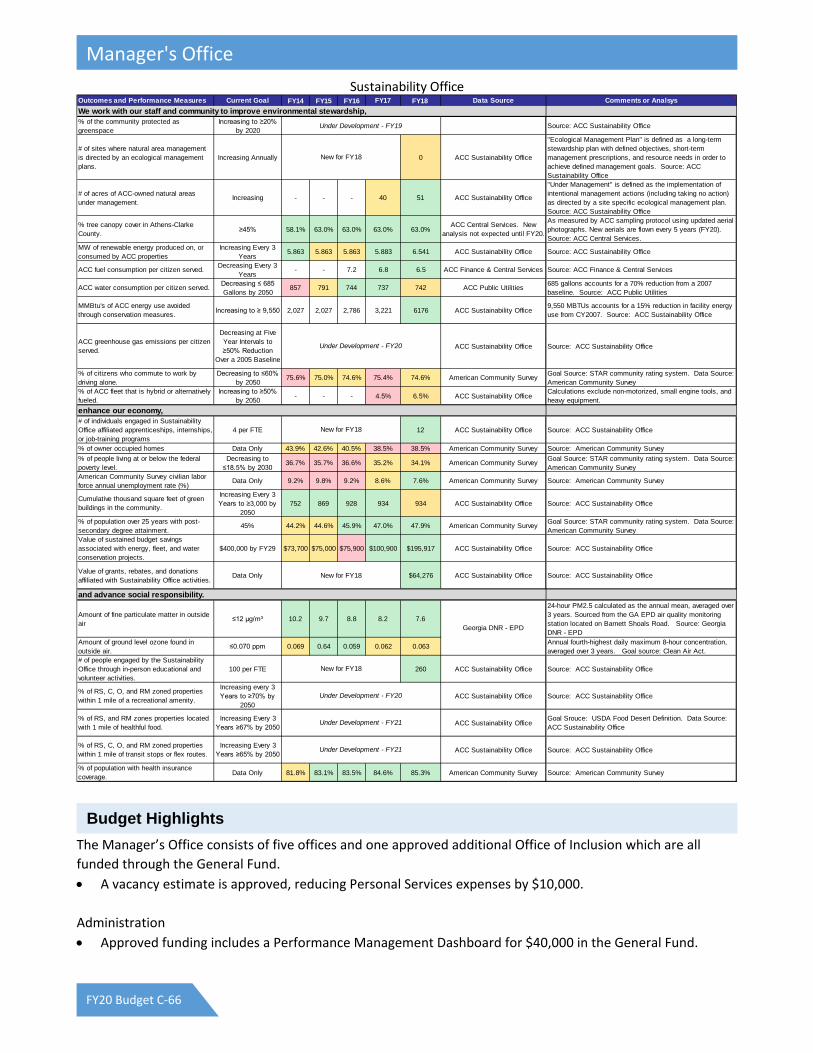
The Manager’s Office consists of five offices and one approved additional Office of Inclusion which are all funded through the General Fund. • A vacancy estimate is approved, reducing Personal Services expenses by $10,000. Administration • Approved funding includes a Performance Management Dashboard for $40,000 in the General Fund.
Outcomes and Performance Measures Current Goal FY14 FY15 FY16 FY17 FY18 Data Source Comments or Analsys
% of the community protected as greenspace
Increasing to ≥20% by 2020
Source: ACC Sustainability Office
# of sites where natural area management is directed by an ecological management plans.
Increasing Annually 0 ACC Sustainability Office
"Ecological Management Plan" is defined as a long-term stewardship plan with defined objectives, short-term management prescriptions, and resource needs in order to achieve defined management goals. Source: ACC Sustainability Office
# of acres of ACC-owned natural areas under management.
Increasing - - - 40 51 ACC Sustainability Office
"Under Management" is defined as the implementation of intentional management actions (including taking no action) as directed by a site specific ecological management plan. Source: ACC Sustainability Office
% tree canopy cover in Athens-Clarke County. ≥45% 58.1% 63.0% 63.0% 63.0% 63.0%
ACC Central Services. New analysis not expected until FY20.
As measured by ACC sampling protocol using updated aerial photographs. New aerials are flown every 5 years (FY20). Source: ACC Central Services.
MW of renewable energy produced on, or consumed by ACC properties
Increasing Every 3 Years
5.863 5.863 5.863 5.883 6.541 ACC Sustainability Office Source: ACC Sustainability Office
ACC fuel consumption per citizen served. Decreasing Every 3 Years
- - 7.2 6.8 6.5 ACC Finance & Central Services Source: ACC Finance & Central Services
ACC water consumption per citizen served. Decreasing ≤ 685 Gallons by 2050
857 791 744 737 742 ACC Public Utilities 685 gallons accounts for a 70% reduction from a 2007 baseline. Source: ACC Public Utilities
MMBtu's of ACC energy use avoided through conservation measures. Increasing to ≥ 9,550 2,027 2,027 2,786 3,221 6176 ACC Sustainability Office
9,550 MBTUs accounts for a 15% reduction in facility energy use from CY2007. Source: ACC Sustainability Office
ACC greenhouse gas emissions per citizen served.
Decreasing at Five Year Intervals to ≥50% Reduction
Over a 2005 Baseline
ACC Sustainability Office Source: ACC Sustainability Office
% of citizens who commute to work by driving alone.
Decreasing to ≤60% by 2050
75.6% 75.0% 74.6% 75.4% 74.6% American Community Survey Goal Source: STAR community rating system. Data Source: American Community Survey
% of ACC fleet that is hybrid or alternatively fueled.
Increasing to ≥50% by 2050 - - - 4.5% 6.5% ACC Sustainability Office
Calculations exclude non-motorized, small engine tools, and heavy equipment.
# of individuals engaged in Sustainability Office affiliated apprenticeships, internships, or job-training programs
4 per FTE 12 ACC Sustainability Office Source: ACC Sustainability Office
% of owner occupied homes Data Only 43.9% 42.6% 40.5% 38.5% 38.5% American Community Survey Source: American Community Survey% of people living at or below the federal poverty level.
Decreasing to ≤18.5% by 2030
36.7% 35.7% 36.6% 35.2% 34.1% American Community Survey Goal Source: STAR community rating system. Data Source: American Community Survey
American Community Survey civilian labor force annual unemployment rate (%)
Data Only 9.2% 9.8% 9.2% 8.6% 7.6% American Community Survey Source: American Community Survey
Cumulative thousand square feet of green buildings in the community.
Increasing Every 3 Years to ≥3,000 by
2050752 869 928 934 934 ACC Sustainability Office Source: ACC Sustainability Office
% of population over 25 years with post-secondary degree attainment.
45% 44.2% 44.6% 45.9% 47.0% 47.9% American Community Survey Goal Source: STAR community rating system. Data Source: American Community Survey
Value of sustained budget savings associated with energy, fleet, and water conservation projects.
$400,000 by FY29 $73,700 $75,000 $75,900 $100,900 $195,917 ACC Sustainability Office Source: ACC Sustainability Office
Value of grants, rebates, and donations affiliated with Sustainability Office activities.
Data Only $64,276 ACC Sustainability Office Source: ACC Sustainability Office
Amount of fine particulate matter in outside air
≤12 μg/m³ 10.2 9.7 8.8 8.2 7.6
24-hour PM2.5 calculated as the annual mean, averaged over 3 years. Sourced from the GA EPD air quality monitoring station located on Barnett Shoals Road. Source: Georgia DNR - EPD
Amount of ground level ozone found in outside air.
≤0.070 ppm 0.069 0.64 0.059 0.062 0.063 Annual fourth-highest daily maximum 8-hour concentration, averaged over 3 years. Goal source: Clean Air Act.
# of people engaged by the Sustainability Office through in-person educational and volunteer activities.
100 per FTE 260 ACC Sustainability Office Source: ACC Sustainability Office
% of RS, C, O, and RM zoned properties within 1 mile of a recreational amenity.
Increasing every 3 Years to ≥70% by
2050ACC Sustainability Office Source: ACC Sustainability Office
% of RS, and RM zones properties located with 1 mile of healthful food.
Increasing Every 3 Years ≥67% by 2050
ACC Sustainability OfficeGoal Srouce: USDA Food Desert Definition. Data Source: ACC Sustainability Office
% of RS, C, O, and RM zoned properties within 1 mile of transit stops or flex routes.
Increasing Every 3 Years ≥65% by 2050
ACC Sustainability Office Source: ACC Sustainability Office
% of population with health insurance coverage. Data Only 81.8% 83.1% 83.5% 84.6% 85.3% American Community Survey Source: American Community Survey
Under Development - FY20
Sustainability Office
We work with our staff and community to improve environmental stewardship,
Under Development - FY19
Under Development - FY20
enhance our economy,
and advance social responsibility.
Georgia DNR - EPD
New for FY18
New for FY18
New for FY18
New for FY18
Under Development - FY21
Under Development - FY21
Budget Highlights
Manager's Office
FY20 Budget C-66

Public Information Office • An additional $3,500 is budgeted to allow for a fourth insert for the Quarterly Newsletter.
Organizational Development • There are no significant changes for this division for FY20.
Geospatial Information Office • The budget includes increased funding for the ESRI Enterprise License Agreement to continue to maintain
this software for a net increase of $50,000 in the General Fund.
Sustainability Office • Funding for a Clean Energy Plan ($40,000) is included.
Office of Inclusion • The Approved Budget includes $170,000 to establish an Office of Inclusion.
(All figures in $1,000s) FY18 FY19 FY20 FY20Appropriations by Type Actual Budget Requested Approved $▲ %▲
Salary & Benefits $1,432.5 $1,501.9 $1,713.5 $1,647.6 $145.7 9.7%Operating $321.1 $384.9 $545.0 $625.9 $241.0 62.6%
Total $1,753.6 $1,886.8 $2,258.5 $2,273.5 $386.7 20.5%
FY18 FY19 FY20 FY20Appropriations by Division Actual Budget Requested Approved $▲ %▲
$667.1 $713.8 $718.8 $754.6 $40.8 5.7%$304.4 $313.6 $413.7 $335.3 $21.7 6.9%$276.7 $290.2 $301.7 $301.7 $11.5 4.0%$222.4 $241.3 $326.5 $326.5 $85.2 35.3%$283.1 $327.9 $377.8 $385.4 $57.5 17.5%
Manager's Administration
Public Information Office
Organizational Development Geospatial Info. Office
Sustainability Office
Office of Inclusion $0.0 $0.0 $120.0 $170.0 $170.0 -- Total $1,753.7 $1,886.8 $2,258.5 $2,273.5 $386.7 20.5%
FY18 FY19 FY20 FY20Appropriations by Fund Actual Budget Requested Approved $▲ %▲
General Fund $1,747.8 $1,878.8 $2,258.5 $2,273.5 $394.7 21.0%Special Programs Fund $4.0 $8.0 $0.0 $0.0 ($8.0) -100.0%Grants Fund $1.8 $0.0 $0.0 $0.0 $0.0 --
Total $1,753.6 $1,886.8 $2,258.5 $2,273.5 $386.7 20.5%
Appropriation Summary
Manager's Office
FY20 Budget C-67

Organizational Development 5-Year CIP
Capital AppropriationsFY18 Year
End BalanceFY19
BudgetFY20
ApprovedFY21-24
ProposedFY25-29
ProposedGeneral Capital Fund
D-61 ACCGOV Talent Management Software Suite - - 165.0 340.0 -General Capital Fund Total - - 165.0 340.0 -
Public Information Office 5-Year CIP
Capital AppropriationsFY18 Year
End BalanceFY19
BudgetFY20
ApprovedFY21-24
ProposedFY25-29
ProposedGeneral Capital Fund
D-62 Website & eGovernment Enhancements 67.8 10.0 15.0 - 255.0D-63 ACTV & Multimedia Production Equipment 77.3 20.0 15.0 - 180.0D-65 Pop-up Van - - 27.5 - -
General Capital Fund Total 145.1 30.0 57.5 - 610.0
Sustainability Office 5-Year CIP
Capital AppropriationsFY18 Year
End BalanceFY19
BudgetFY20
ApprovedFY21-24
ProposedFY25-29
ProposedGeneral Capital Fund
D-68 Energy Action Plan (New) - - 30.0 - 75.0General Capital Fund Total - - 30.0 180.0 645.0
FY20 FY20Fulltime Authorized Positions FY18 FY19 Requested Approved ▲
5 5 5 5 03 3 4 3 03 3 3 3 02 2 2 2 02 2 2 2 0
Manager's Administration
Public Information Office
Organizational Development Geospatial Info. Office
Sustainability OfficeOffice of Inclusion 0 0 0 1 1
Capital Budgets, 5-Year CIP and Project Forecast
Authorized Positions
Manager's Office
FY20 Budget C-68

The Mayor and Commission serve as the governing authority of the Unified Government of Athens‐Clarke
County with powers and jurisdiction throughout the territorial limits of Athens‐Clarke County. The Mayor and
Commission are elected to establish policy through the adoption of Ordinances and Resolutions, and are
responsible for placing in effect the powers conferred by the Charter, which created the Unified Government
of Athens‐Clarke County; and for the promotion and protection of the safety, health, peace, security, and
general welfare through ordinances, resolutions, rules, and regulations. The Mayor and Commission have the
power to set tax rates and adopt a budget. It is the responsibility of the Mayor and Commission to assure the
cost efficient and effective delivery of quality services to every citizen and entity in a fair and equitable
manner, and to act as liaison and advocate for citizens experiencing problems with, or needing information
from government services.
Clerk of Commission
The Clerk of the Commission directs the activities necessary to prepare for Commission meetings and
dispenses information regarding the decisions and actions of the Commission.
Actual Forecast
FY14 FY15 FY16 FY18 FY19 FY20
Provide support for Mayor and Commission Meetings
Regular 12 12 12 12 12 12
Agenda 12 12 12 12 12 12
Special 8 8 13 20 17 20
Agenda items processed for Mayor and Commission
staff and posting to website for public 200 200 185 200 245 225
Open records requests processed 171 210 250 250
Contracts processed for the Mayor's signature 250 250 244 250 290 250
Work requests processed 205 300 313 400
Boards, authorities and commissions applications 102 150 120 150
Mission
Performance Measures
Mayor & Commission
FY20 Budget C-69

There are no significant changes in the FY20 budget.
(All figures in $1,000s) FY18 FY19 FY20 FY20
Appropriations by Type Actual Budget Requested Approved $▲ %▲Salary & Benefits $551.6 $590.0 $580.4 $580.4 ($9.6) ‐1.6%
Operating $23.8 $41.0 $45.1 $45.1 $4.1 10.0%
Total $575.4 $631.0 $625.5 $625.5 ($5.5) ‐0.9%
FY18 FY19 FY20 FY20
Appropriations by Division Actual Budget Requested Approved $▲ %▲Mayor's Office $136.9 $148.4 $154.6 $154.6 $6.2 4.2%
Commission's Office $263.6 $300.3 $289.2 $289.2 ($11.1) ‐3.7%
Clerk of Commission $174.9 $182.3 $181.7 $181.7 ($0.6) ‐0.3%
Total $575.4 $631.0 $625.5 $625.5 ($5.5) ‐0.9%
FY20 FY20
FY18 FY19 Requested Approved ▲Fulltime Authorized Positions
Mayor's Office 1 1 1 1 0
Clerk of Commission 2 2 2 2 0
Budget Highlights
Appropriation Summary
Authorized Positions
Mayor & Commission
FY20 Budget C-70

The mission of the Municipal Court is to fairly, efficiently and accurately adjudicate state misdemeanor and
traffic cases; county ordinance cases; and county administrative cases in accordance with the laws of the
United States; the State of Georgia; and the Charter and Municipal Code of the Unified Government of Athens‐
Clarke County.
The Municipal Court’s goals are to:
Treat all who have business before the Court with courtesy and respect.
Apply the law fairly, impartially, and efficiently.
Deter criminal behavior and reduce recidivism through the imposition of prompt and appropriate sentences and sanctions, designed to address the individual circumstances of each case.
Manage dockets, calendars, and processes to guarantee the timely and accurate disposition of court cases.
Protect the integrity of the Court’s proceedings and processes.
Collect and manage public funds accurately and securely.
Through all of these goals, to engender public confidence in the Municipal Court; for the Unified Government of Athens‐Clarke County; and for the judicial system as a whole.
To implement a court notification system that will remind individuals of court dates, and other important
deadlines, in order to dispose of cases more efficiently and increase customer satisfaction with the court
To continue scanning old paper files into the new case management system with the goal of reducing or eliminating off‐site storage costs
To partner with other departments (Athens‐Clarke County Police Department, Athens‐Clarke County Probation, Athens Clarke County Clerk of Court for State and Superior Court) in linking our computer databases to allow for the free flow of information thereby increasing the accuracy of information across all departments.
Actual Forecast
FY16 FY17 FY18 FY19 FY20
Criminal/Traffic 19,080 16,001 16,463 17,164 18,198
Ordinance 250 245 348 350 350
Red Light Camera 6,782 7,149 9303 9,890 9,900
School Bus Camera 580 537 586 580 600
Administrative Hearings 53 12 15 25 30
Parking 3.241 3,268 3,022 3275 3,300
Total Cases 29,986 27,212 29,737 30,474 32,378
Mission
Goals
Objectives
Performance Measures
Municipal Court
FY20 Budget C-71

The FY20 Approved Budget includes an increase of $16,000 to the salary of the Municipal Court Judge
(from $82,000 to $98,000).
The FY20 Approved Budget for the Municipal Court also includes $15,000 for Court Notification Software.
There are no other significant changes for the FY20 Approved Budget.
(All figures in $1,000s) FY18 FY19 FY20 FY20
Appropriations by Type Actual Budget Requested Approved $▲ %▲Salary & Benefits $525.9 $582.4 $602.6 $617.1 $34.7 6.0%
Operating $59.1 $70.8 $83.3 $83.3 $12.5 17.7%
Total $585.0 $653.2 $685.9 $700.4 $47.2 7.2%
FY18 FY19 FY20 FY20
Appropriations by Division Actual Budget Requested Approved $▲ %▲Court Operations $415.0 $479.6 $511.7 $507.3 $27.7 5.8%
Judge's Office $170.0 $173.6 $174.2 $193.1 $19.5 11.2%
Total $585.0 $653.2 $685.9 $700.4 $47.2 7.2%
FY18 FY19 FY20 FY20
Appropriations by Fund Actual Budget Requested Approved $▲ %▲General Fund $580.0 $653.2 $685.9 $700.4 $47.2 7.2%
Grants Fund $5.0 $0.0 $0.0 $0.0 $0.0 ‐‐
Total $585.0 $653.2 $685.9 $700.4 $47.2 7.2%
FY20 FY20
FY18 FY19 Requested Approved ▲Fulltime Authorized Positions 10 10 10 10 0
Budget Highlights
Appropriation Summary
Authorized Positions
Municipal Court
FY20 Budget C-72

The Office of Operational Analysis (formerly the Auditor’s Office) was created by the Charter of the Unified
Government of Athens‐Clarke County to “conduct a continuing internal audit of the fiscal affairs and
operations of every department, office, and agency of the Unified Government.” The mission of the Office of
Operational Analysis is to provide quality internal audit services through independent and objective reviews
and assessments of the activities, operations, financial systems, and internal accounting controls that supports
the Mayor and Commission’s adopted goals and strategies; to make recommendations that will improve
governance, risk management, control processes, and value for money, all with the intent of enhancing the
efficiency and effectiveness of government operations for the benefit of Athens‐Clarke County.
Deliver value and impact through:
1. Continuing to work with the Audit Committee 2. Development of a work plan composed of relevant, important issues 3. Development and application of objective reviews and operational assessments 4. Actively using technology to maximize impact 5. Working collaboratively with Athens‐Clarke County departments and agencies 6. Providing valuable recommendations for the services and programs offered 7. Completing audits in a timely manner 8. Striving to continuously improve performance by using modern technology
Actual Forecast
FY16 FY17 FY18 FY19 FY20
Number of Audit Assignments/year. 3 3 3 3 2
Percent of audits plan/completed. 50% 100% 0% 100% 100%
Achieve Professional Certification (CIA). ‐ ‐ ‐ 1 2
Percentage of recommendations approved per audit by the
Audit Committee. ‐ ‐ ‐ 80% 80%
Number of recommendations past due. ‐ ‐ ‐
Percentage of Surveys responses sent/received. ‐ ‐ 33% 80% 80%
Attend two professional conferences/meet annual CPE
requirement. 0% 100% 100% 100% 100%
The FY20 Approved Budget for Operational Analysis includes an increase of $14,211 for a new storage
system.
Operational Analysis also requested the following items which were not recommended nor approved: - $21,370 for a part‐time position. - $6,455 for additional operating costs.
Mission
Objectives
Performance Measures
Budget Highlights
Operational Analysis
FY20 Budget C-73
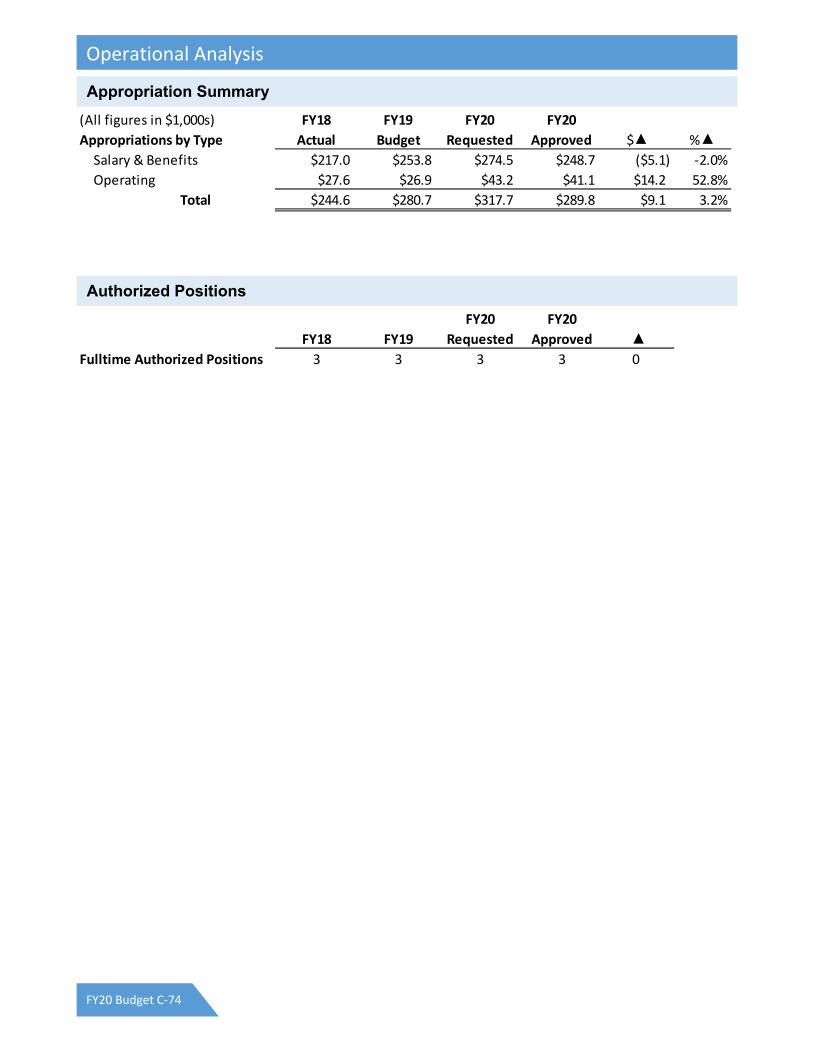
(All figures in $1,000s) FY18 FY19 FY20 FY20
Appropriations by Type Actual Budget Requested Approved $▲ %▲Salary & Benefits $217.0 $253.8 $274.5 $248.7 ($5.1) ‐2.0%
Operating $27.6 $26.9 $43.2 $41.1 $14.2 52.8%
Total $244.6 $280.7 $317.7 $289.8 $9.1 3.2%
FY20 FY20
FY18 FY19 Requested Approved ▲Fulltime Authorized Positions 3 3 3 3 0
Appropriation Summary
Authorized Positions
Operational Analysis
FY20 Budget C-74

Other Financing Uses Budget includes transfers from one fund to another. Transfers from the General Fund to
other funds are principally to provide additional financial support for the operations and programs within
those funds or to meet legal requirements. Transfers between other funds are typically the reimbursement of
the cost for support provided by another fund or to meet legal requirements.
Transfers from the General Fund to the General Capital Projects Fund decrease from $3.2 million in FY19 to
$2.0 million in FY20, a decrease of $1.2 million or 38%.
Transfer from the General Fund to the Economic Development Capital Fund decrease $25,000 (11%), from
$225,000 in FY19 to $200,000 in FY20.
Transfers from enterprise and internal service funds increase $316,100 (10%) due to an increase in costs
for Other Post‐Employment Benefits (OPEB).
For more information on interfund transfers see page E‐36.
(All figures in $1,000s) FY18 FY19 FY20 FY20
Appropriations by Fund Actual Budget Requested Approved $▲ %▲General Fund $9,343.0 $6,908.9 $13,759.6 $6,093.5 ($815.4) ‐11.8%
Hotel/Motel Fund $190.0 $190.0 $190.0 $190.0 $0.0 0.0%
Special Programs Fund $9.9 $0.0 $0.0 $0.0 $0.0 ‐‐
Sheriff Inmate Fund $19.6 $35.0 $35.0 $35.0 $0.0 0.0%
General Capital Project Fd $84.0 $0.0 $0.0 $0.0 $0.0 ‐‐
Airport Fund $61.8 $68.5 $74.6 $74.6 $6.1 8.9%
Landfill Fund $290.1 $307.8 $331.3 $331.3 $23.5 7.6%
Transit System Fund $567.3 $569.6 $627.1 $652.1 $82.5 14.5%
Water & Sewer Fund $1,331.9 $1,555.2 $1,733.6 $1,733.6 $178.4 11.5%
Solid Waste Fund $210.6 $243.1 $268.5 $268.5 $25.4 10.4%
Storm Water Utility Fund $294.4 $350.0 $379.6 $379.6 $29.6 8.5%
Water/Sewer Construc. Fd $103.0 $107.4 $0.0 $107.4 $0.0 0.0%
Internal Support Fund $33.7 $38.5 $41.5 $41.5 $3.0 7.8%
Fleet Management Fund $82.9 $96.0 $104.0 $104.0 $8.0 8.3%
Insurance & Claims Fund $47.9 $40.0 $43.0 $43.0 $3.0 7.5%
Health Insurance Fund $25.3 $28.4 $30.4 $30.4 $2.0 7.0%
Total $12,695.4 $10,538.4 $17,618.2 $10,084.5 ($453.9) ‐4.3%
Mission
Budget Highlights
Appropriation Summary
Other Financing Uses
FY20 Budget C-75

Other General Administration includes responsibilities and expenses not related to any one department,
general governmental costs, expenditures budgeted for but not yet allocated to a specific department or
project, and the government's operating contingency. The Finance Director develops the Budget for Other
General Administration.
The FY20 Budget for Other General Administration across all funds includes the following items as well as other
costs:
Funding for health insurance for retirees (or Other Post‐Employment Benefits – OPEB) is $5.7 million. $5.4
million of this amount is budgeted in the General Fund and covers OPEB costs for the General Fund,
enterprise funds, and internal service funds. The budget for OPEB in other funds totals $316,000.
$1.9 million ($1.3 in the General Fund) is budgeted for the Self‐ Funded General Liability program
This budget includes $1.8 million ($1.3 million in the General Fund) to fund the government's Employee
Performance Management Program. The Performance Management Program is designed to reward and
retain current employees who meet the highest levels of performance. The Mayor and Commission have
authorized the Manager to transfer these funds to department budgets for implementation.
The General Fund Other General Administration includes the following:
$4,000,000 for a “Prosperity Package” to be invested in programs and partnerships with other agencies to
reduce the poverty rate in Athens‐Clarke County
Pension funding for enterprise funds and internal service funds ($2.2 million)
$200,000 to be used for Mayor and Commission directed initiatives
$128,000 for the Government’s participation in the Northeast Georgia Regional Commission
$110,000 for auditing and accounting fees
$100,000 to provide support for emergency medical services through a contract with Athens Regional
Medical Center
An Operating Contingency of $1,313,500, which is $513,500 more than FY19 and is less than 1% of the
total General Fund operating budget
Seed funding for initiatives that emerge from the Envision Athens Program ($75,000)
$24,000 for the employee/retiree Holiday Luncheon and $17,000 for an employee Spring event.
The FY20 budget for Other General Administration also includes the Government’s dues and memberships
to the organizations listed below.
Georgia Municipal Association 23,800 Association of County Commissioners of Georgia 13,100 Athens Area Chamber of Commerce 3,700 Georgia Forestry Commission 3,600 National Association of Counties 2,400 Other 3,400
Total $50,000
Mission
Budget Highlights
Other General Administration
FY20 Budget C-76

Other General Administration in the Hotel/Motel Tax Fund includes the following programs:
Community Events Programs (in partnership with ADDA) 90,000 Mayor’s Community Improvement Program 20,000 Annual Fireworks Show 25,000 Community Events/Festivals 40,000 Athens Heritage Foundation – Insurance for Lyndon House Exhibits 1,200
Total $176,200
Included within the Other General Administration section of the Enterprise Funds (Airport, Landfill, Transit,
Water and Sewer, Solid Waste, and Storm Water) and the Building Inspection Special Revenue Fund are
payments to the General Fund for administrative overhead expenses. This amount in FY20 is $2,625,200,
$104,500 or 4.1% more than FY19. The overhead allocation helps recover the actual costs included in the
General Fund needed to administratively support the Enterprise Fund Operations.
Also included in the Other General Administration section of the enterprise and internal service fund budgets
is the depreciation expense for capital assets owned by each enterprise or internal service fund. To comply
with Generally Accepted Accounting Principles, the depreciation of capital assets in Enterprise Funds must be
recorded. Depreciation expenses are “non‐cash” expenses which help build working capital funds for future
capital and equipment replacement. Total depreciation in FY20 is $15.8 million, similar to FY19.
Almost all expenses (except for administrative costs) for the Self‐Funded Insurance and Claims Fund and the
Health Benefit Insurance Internal Service Fund are included in the Other General Administration Budget. The
Self‐Funded Insurance and Claims expense budget for Other General Administration in FY20 is estimated to be
$2.9 million to fund current claims for workers’ compensation, general liability and the current cost of
insurance. This represents an increase of $150,000 over FY19 (5.5%). The budgeted expenses for the Self‐
Funded Health Insurance Program for employees are estimated to be $14.7 million in FY20, a decrease of
$757,000 from the FY20 Budget. For more information on these funds in total, see pages E34 and 35.
5‐Year CIP
Capital Appropriations
FY18 Year
End Balance
FY19
Budget
FY20
Approved
FY21‐24
Proposed
FY25‐29
Proposed
General Capital Fund
D‐69 Public Art Program 89.7 15.0 20.0 ‐ 100.0
General Capital Fund Total 604.1 15.0 20.0 ‐ 600.0
Capital Budgets, 5-Year CIP and Project Forecast
Other General Administration
FY20 Budget C-77

(All figures in $1,000s) FY18 FY19 FY20 FY20
Appropriations by Fund Actual Budget Requested Approved $▲ %▲General Fund $7,761.7 $11,467.8 $12,387.0 $16,650.5 $5,182.7 45.2%
Hotel/Motel Fund $77.7 $140.7 $141.2 $176.2 $35.5 25.2%
CDBG Fund $7.6 $5.8 $5.5 $5.5 ($0.3) ‐5.2%
Emergency Telephone Fund $121.7 $185.3 $194.5 $194.5 $9.2 5.0%
HOME Fund $1.3 $1.3 $0.0 $0.0 ($1.3) ‐100.0%
Grants Fund $23.9 $35.6 $97.9 $97.9 $62.3 175.0%
Alt. Dispute Resolution Fund $10.2 $16.1 $17.1 $17.1 $1.0 6.2%
Affordable Housing Fund $0.0 $96.0 $105.2 $105.2 $9.2 9.6%
Special Programs Fund $135.6 $86.0 $94.2 $94.2 $8.2 9.5%
Building Inspection Fund $51.2 $80.8 $239.4 $239.4 $158.6 196.3%
Airport Fund $493.8 $507.7 $482.1 $482.1 ($25.6) ‐5.0%
Landfill Fund $1,004.2 $1,043.5 $970.1 $970.1 ($73.4) ‐7.0%
Transit System Fund $2,370.2 $3,502.9 $3,376.2 $3,376.2 ($126.7) ‐3.6%
Water & Sewer Fund $13,215.7 $13,498.8 $13,245.8 $13,245.8 ($253.0) ‐1.9%
Solid Waste Fund $673.3 $710.0 $704.5 $704.5 ($5.5) ‐0.8%
Stormwater Fund $590.1 $595.0 $816.4 $816.4 $221.4 37.2%
Internal Support Fund $57.4 $56.0 $54.0 $54.0 ($2.0) ‐3.6%
Fleet Management Fund $27.3 $45.2 $39.6 $39.6 ($5.6) ‐12.4%
Fleet Replacement Fund $90.0 $90.0 $90.0 $90.0 $0.0 0.0%
Insurance & Claims Fund $2,330.4 $2,701.8 $2,851.3 $2,851.3 $149.5 5.5%
Health Insurance Fund $14,282.3 $15,423.3 $14,666.3 $14,666.3 ($757.0) ‐4.9%
Total $43,325.6 $50,289.6 $50,578.3 $54,876.8 $4,587.2 9.1%
Appropriation Summary
Other General Administration
FY20 Budget C-78

To effectively manage community change in both the short and long term with regard to land use,
transportation, historic preservation, urban design and overall community development in order to ensure
that the natural and built environment of Athens‐Clarke County are of the highest quality.
Maintain a high level of accuracy and efficiency in the administration of the Plans Review Process, as well
as in the processing of zoning decisions and appeals, and Historic Preservation related issues.
Promote a long‐range view of community planning, and assist the Mayor and Commission and the Planning Commission in focusing on more than zoning decisions.
Improve coordination with other Athens‐Clarke County departments and governmental agencies in identifying and looking at the long‐term infrastructure impacts associated with new development and development‐related policies.
Expand and routinely maintain the associated departmental GIS system, and promote the integration of GIS technology into appropriate governmental functions.
Continue to identify, recommend, and support potential solutions and alternatives to regional planning issues.
Continue to enhance the community planning and development service capabilities of the Unified Government by providing additional equipment and training to Planning Department staff as well as the members of the appointed boards staffed by the Planning Department.
Afford all customers prompt, courteous, and impartial service.
Provide the general public with reasonable access to all public information managed and retained by the Planning Department.
Review all staff‐administered (over the counter) applications within 48 hours of a complete submittal.
Strive for all staff reports to be entirely accurate, concise, and error‐free.
Hold quarterly long‐range planning sessions with the Planning Commission.
Offer Planning staff and newly appointed board members at least one (1) significant training opportunity annually. This is subject to the availability of financial resources.
Mission
Goals
Objectives
Planning & Zoning
FY20 Budget C-79

In addition to funding from the General Fund, the Planning Department uses funding for two Senior
Planner positions and 25% of an additional Planner position from the Building Inspection Special Revenue
Fund totaling $180,400. This includes an additional $84,500 for a position that had previously been
authorized but unfunded.
The Planning Department also receives one grant: the PL112 Transportation Planning for a total of
$385,600. This grant is 80% federally funded.
The budget includes changes to the fee schedule which is anticipated to generate an additional $17,620 in
Revenue.
Performance Measure Goal FY15 FY16 FY17 FY18 FY19 FY20
Zoning Actions and Special Use permits Data Only 16 30 21 38 31 36
Variance requests Data Only 13 23 21 16 15 16
% of Board and Commission applications processed and recommendations forwarded on time
95% 100% 100% 100% 100% 100% 100%
Site and/or building plans submitted through Plans Review Data Only 232 223 254 254 192 241
Plan Reviews processed within designated time 90% 90% 90% 90% 90% 90% 90%
Zoning permits issued Data Only 661 735 921 936 958 977
Preliminary subdivision plats Data Only 4 1 4 4 3 4
Final subdivision plats Data Only 54 66 78 69 91 88
Sign permits issued Data Only 179 179 182 175 118 158
Home Occupation permits issued Data Only 206 219 200 202 158 187
Demolition reviews Data Only 61 87 129 111 98 101
Environmental Areas permits Data Only 86 101 105 101 130 109
Customer service hours (phone / walk-ins) Data Only 3500 3650 3700 3900 3925 3965
Zoning verifications Data Only 389 371 387 393 370 352
Historic Preservation requests - staff & HPC review Data Only 101 128 134 136 120 135
% of COAs processed at staff level as a % of total 50% 50% 50% 50% 50% 50% 60%
Number of Open Records Requests responded to with 3 business days 90% 90% 90% 90% 90% 100% 100%
PLANNING DEPARTMENT PERFORMANCE MEASURES
To effectively manage community change in both the short and long term with regard to land use, transportation, historic preservation, urban design and overall community development in order to ensure that the natural and built environment of Athens-Clarke County are of the highest quality.
Performance Measures
Budget Highlights
Planning & Zoning
FY20 Budget C-80

(All figures in $1,000s) FY18 FY19 FY20 FY20
Appropriations by Type Actual Budget Requested Approved $▲ %▲Salary & Benefits $1,332.0 $1,332.1 $1,466.0 $1,441.4 $109.3 8.2%
Operating $275.3 $463.8 $328.3 $310.7 ($153.1) ‐33.0%
Total $1,607.3 $1,795.9 $1,794.3 $1,752.1 ($43.8) ‐2.4%
FY18 FY19 FY20 FY20
Appropriations by Fund Actual Budget Requested Approved $▲ %▲General Fund $1,146.7 $1,176.8 $1,228.3 $1,186.1 $9.3 0.8%
Building Inspection Fund $87.2 $88.6 $180.4 $180.4 $91.8 103.6%
Grants Fund $373.4 $530.5 $385.6 $385.6 ($144.9) ‐27.3%
Total $1,607.3 $1,795.9 $1,794.3 $1,752.1 ($43.8) ‐2.4%
FY20 FY20
FY18 FY19 Requested Approved ▲Fulltime Authorized Positions 19 18 18 18 0
Appropriation Summary
Authorized Positions
Planning & Zoning
FY20 Budget C-81

To Protect and To Serve as Guardians of Athens‐Clarke County.
To build the highest levels of trust and confidence within the community through fair and impartial
policing.
To support and defend the U.S. Constitution, protect and safeguard all life, and ensure the equal
protection of rights for all as we work to reduce both crime and the fear of crime.
To embrace and practice community‐oriented, problem‐oriented, and constitutional policing philosophies.
Educating the public, mentoring the youth, and involving community stakeholders are the foundations
of our service delivery and crime prevention strategies. By acting with integrity and transparency, we
are committed to enhancing community partnerships and building trust and confidence in all that we
do.
Goal: Transform the ACCPD into the premier law enforcement agency.
o Implement 100% of the funded portions of the ACCPD Strategic Vision Plan.
o Implement relevant recommendations from the President’s Task Force on 21st Century Policing, as
funded by the FY20 budget.
o Develop and implement all new departmental policies and procedures grounded in community‐
oriented, problem‐oriented, and constitutional policing philosophies.
o Provide the best response and safety equipment to ensure employees have the equipment necessary
to do their jobs and ensure their safety.
Goal: Create an agency that exhibits optimal organizational health.
o Identify the appropriate, targeted leadership training based on the results of 2017’s Organizational
Leadership Assessment.
o Develop and implement retention practices that focus on retention of existing personnel.
Goal: Create a safer Athens‐Clarke County.
o Maintain and/or reduce Part I Violent Crime in calendar year 2019 to levels at the mean for crimes
over the last five (5) years, while accounting for changes in the law.
o Identify the top crime areas within Athens‐Clarke County and develop appropriate strategies to reduce
crime in each identified area.
o Develop a system to identify Part I prolific offenders in order to work with the District Attorney’s Office
to keep the identified violent prolific offenders in custody.
o Maintain and/or reduce levels of serious injury by vehicle and fatality crashes in calendar year 2019 to
levels at or below the mean for serious injury vehicle and fatality crashes over the last five (5)
years.
o Reduce the threat to public safety presented by gang‐related criminal activities by prioritizing
community outreach efforts, prevention, participation in the Youth Development Task Force, and
through zero‐tolerance enforcement for all gang related crimes.
o Achieve compliance with the Association of Public Safety Communications standard for answering 90
% of all 911 calls within 10 seconds.
Goal: Enhance trust and legitimacy between the police department and community.
o Sustain the Community Oriented Policing Performance System (COPPS) to focus departmental efforts
on community‐oriented and problem‐oriented policing philosophies.
o Increase transparency with the community through increased use of social media posts, inclusive of at
least four (4) Public Service Announcements.
Motto, Vision, Mission, and Our Commitment
Goals & Objectives
Police Services
FY20 Budget C-82

o Expand the types of information and documentation available through the Transparency in Policing
link on the ACCPD Website to include all current Departmental policies and procedures.
o Host a minimum of two (2) Town Hall meetings at various locations within the county.
o Administer one (1) community‐wide survey to gauge overall satisfaction with police services.
Goal: Stabilize and sustain current service delivery strategy through appropriate allocation of personnel.
o Review and strengthen the assigned zone officer program.
o Develop and implement a departmental performance measures system that allows the ACCPD to
demonstrate the totality of its work and allow for the reporting of traditional measures (e.g.,
incident reports, citations, arrests) while also focusing on non‐traditional performance measures
of building trust and confidence within the community (e.g., community policing hours, problem
oriented policing projects, community outreach meetings, etc.).
Goal: Develop the Assigned Vehicle Program to meet modern public safety demands.
o Replace 100% of all police vehicles that are eligible for replacement under the ACCUG vehicle
replacement program.
o Complete the Assigned Vehicle Program to allow for one police officer to be assigned to one police
patrol unit, thereby eliminating “pool” vehicles.
Goal: Enhance the department’s response to mental health crisis incidents.
o Provide the Crisis Intervention Unit the necessary resources to meet increasing demands for service in
response to mental health consumers.
o Meet or exceed the necessary grant requirements to demonstrate full support in the efforts of the
Mental Health Collaborative Grant Initiative.
o Identify the appropriate final recommendations from the Mental Health Collaborative Grant Initiative
for inclusion into departmental policies, procedures, and operations.
Goal: Maintain Accreditation and Certification.
o Maintain accreditation through The Commission on Accreditation for Law Enforcement Agencies
(CALEA).
o Maintain certification through the Georgia Association of Chiefs of Police (GACP) Law Enforcement
Certification Program
Honor is the bedrock of our character. Honor empowers the men and women of ACCPD to exemplify the
highest level of Integrity; to abide by an uncompromising Code of Ethics; to Respect human rights and the
dignity of every person; and to have Respect and concern for all. Honor represents the maturity, dedication,
trust and dependability that drives the men and women of ACCPD to act responsibly, fulfill their obligations
and hold both themselves and others accountable for their actions.
Courage is the mental, moral, and physical strength possessed by the men and women of ACCPD. Courage
sees them through the challenges of adversity and the mastery of fear; it drives them to do what is right, to
adhere to a higher standard of personal conduct, to lead by example, and to make difficult decisions under
stress. The inner strength of Courage enables the men and women of ACCPD to take that extra step to protect
and to serve.
Core Values
Police Services
FY20 Budget C-83

Commitment is the spirit of determination and dedication within all members of the ACCPD that leads to the
highest level of professionalism, Integrity, transparency, and our demonstration of our passion to protect and
to serve. It promotes the highest order of discipline and restraint for department and self, and is the ingredient
that instills dedication to Service, community, pride, concern for others, transparency, and an unrelenting
determination to achieve the highest standard of excellence in every endeavor.
Performance Measure Goal CY13 CY14 CY15 CY16 CY17 CY18 CY18 Notes
Incident Reports Data Only 20,698 19,772 20,919 19,600 18,046 15,777Partial reduction attributed to reduced "Information Only" reports
UCR Part I Violent Crimes <453 404 372 504 532 520 511In 2018, NIBRS crime reporting succeeded UCR
UCR Part I Property Crimes < 4,169 4,072 3,792 4,282 4,099 3,934 4,474In 2018, NIBRS crime reporting succeeded UCR
Group A Offenses Data Only 10,606 10,038 11,104 10,701 10,160 9,235In 2018, NIBRS crime reporting succeeded UCR
Group B Offenses Data Only 5,374 5,172 4,862 4,562 4,322 3,846In 2018, NIBRS crime reporting succeeded UCR
Nonreportable Offenses Data Only 12,337 11,257 11,301 10,375 9,966 3,974In 2018, NIBRS crime reporting succeeded UCR
Population Data Only 121,265 120,938 123,912 124,707 124,707 127,064 U.S. Census Bureau Estimate
Total number of 911 calls Data Only 131,610 135,473 128,565 117,409 109,340 107,235
Percentage of 911 calls answered in 10 seconds
≥ 90% 90% 88% 87% 86% 85% 87% APCO National Standard is 90%.
Total number of non-emergency calls
Data Only N/A N/A 55,889 47,289 55,134 50,465 No ability to report data prior to 2015.
Total number of dispatched calls for ACCPD Services
Data Only 150,950 131,099 126,854 116,856 112,304 95,927
Total number of dispatched calls for ACC Fire Dept. Services
Data Only 3,987 4,355 5,335 5,983 6,832 5,953
Total traffic crashes Data Only 6,481 6,823 8,089 8,430 8,137 7,384ACCPD, UGA, Winterville crash data. GSP not included in CY18.
Total Traffic Stops Data Only 28,662 23,615 16,959 14,718 16,795 18,492 ACCPD Only
DUI arrests Data Only 735 598 507 402 392 321ACCPD Only. Reduction attributed to increased DT living and Uber
Total training hours provided Data Only 26,784 27,357 28,725 32,723 38,597 36,793
Total sworn police officers 240 240 240 240 242 254COPS Grant Officers included in CY18 total
Authorized Sworn Police Officers (FTEs per 1,000 citizens)
>2.1 1.97 1.98 1.93 1.92 1.94 2.00
Actual Sworn Police Officers (FTEs per 1,000 citizens)
>2.1 N/A N/A 1.87 1.82 1.54 1.72Adjusted for vacancy rate, FMLA, training, Temporary Assignment, etc.
% police officers with body cameras
100% 0% 8% 58% 75% 75% 100.0% Full Deployment
Police Officer Attrition Rate <10% 6.28% 11.30% 9.96% 10.42% 11.16% 19.69%
Communication Officer Attrition Rate
<10% 9.09% 6.06% 6.45% 6.25% 6.25% 6.06%
Total number of complaints against Police Department
Data Only 3 2 20 44 55 55In 2015, ACCPD policy changed to count all complaints.
% Complaints determined valid Data Only 33.0% 50.0% 0.0% 6.8% 7.3% 16.3%
Total police vehicle pursuits Data Only 20 32 34 25 40 10Pursuit Policy recently made more stringent.
Total use of force incidents Data Only 212 270 265 226 264 288
Operating Budget Data Only $19,076,696 $19,241,253 $20,210,323 $20,545,484 $21,387,771 $21,767,727
% operating expenses (Actual vs. budget)
Data Only 99.3% 98.4% 95.1% 97.5% 96.3% 99.4%
Overtime as % of base personnel cost
Data Only 4.1% 3.8% 4.2% 4.0% 3.3% 3.7%
We use resources responsibly.
We work to reduce crime and the fear of crime.
To protect and safeguard life
While we build trust and confidence in the community.
Performance Measures
Police Services
FY20 Budget C-84

The General Fund represents the largest portion of the Police Department’s budget and supports most of the
operations for the Department.
For FY20, Public Safety vehicle replacement is approved to be funded from the next SPLOST program
resulting in a reduction of $609,000 for the Police Department.
An additional communications officer is funded in Central Communications in the E‐911 Fund ($54,011)
through a transfer from the General Fund.
A vacancy estimate is approved, reducing General Fund Personal Services expenses by $416,700.
The budget maintains current funding for a previously grant funded Mental Health Co‐Response team and
provides additional contract support for a new team in the General Fund for a total of $100,100.
Continued matching funds for the COPS hiring grant of $84,000 provided by the General Fund is included.
The Approved Budget includes expansion of the Police Take Home Vehicle Program to allow taking vehicles
out of Athens‐Clarke County ($70,000).
The Police Department also has operations in the Special Programs Fund, supported by program revenues.
An additional $20,000 is included for extra duty compensation for UGA Football Game Day support that
are to be reimbursed to the agreed upon level by UGA.
Additional support funding of $15,700 for the School Bus Stop Arm & Red Light Camera programs is
included.
The Central Communications Division operates within the Emergency Telephone System Special Revenue Fund,
E‐911, primarily funded through 911 fees and General Fund support.
With the doubling of prepaid wireless phone fees by the State (from $0.75 to $1.50), revenue is projected
to increase to $1,991,000, $217,000 over last year.
General Fund support increases $82,100 for increases in OPEB and Life costs and the addition of a
Communications Officer.
For more information on the Emergency Telephone Fund, see page E‐11.
Budget Highlights
Police Services
FY20 Budget C-85

(All figures in $1,000s) FY18 FY19 FY20 FY20
Appropriations by Type Actual Budget Requested Approved $▲ %▲Salary & Benefits $20,979.8 $22,335.6 $22,530.0 $22,147.4 ($188.2) ‐0.8%
Operating $4,010.3 $3,772.1 $4,209.1 $3,223.0 ($549.1) ‐14.6%
Total $24,990.1 $26,107.7 $26,739.1 $25,370.4 ($737.3) ‐2.8%
FY18 FY19 FY20 FY20
Appropriations by Division Actual Budget Requested Approved $▲ %▲Command $1,597.9 $1,521.1 $1,544.3 $1,426.6 ($94.5) ‐6.2%
Field Operations $10,695.1 $11,597.9 $13,177.8 $12,315.7 $717.8 6.2%
Crime Investigation $3,208.9 $3,381.6 $3,910.8 $3,662.7 $281.1 8.3%
Strategic & Professional Dev. $60.1 $170.7 $65.3 $65.3 ($105.4) ‐61.7%
Support Services $2,644.6 $2,484.0 $2,231.6 $2,087.1 ($396.9) ‐16.0%
Community Outreach $1,183.7 $1,310.4 $1,218.3 $1,197.6 ($112.8) ‐8.6%
Special Operations $3,196.7 $3,086.0 $1,968.4 $1,938.8 ($1,147.2) ‐37.2%
Central Communications $2,403.1 $2,556.0 $2,622.6 $2,676.6 $120.6 4.7%
Total $24,990.1 $26,107.7 $26,739.1 $25,370.4 ($737.3) ‐2.8%
FY18 FY19 FY20 FY20
Appropriations by Fund Actual Budget Requested Approved $▲ %▲General Fund $21,623.3 $22,689.0 $23,352.0 $21,929.3 ($759.7) ‐3.3%
Emergency Telephone Fund $2,422.2 $2,686.0 $2,647.6 $2,701.6 $15.6 0.6%
Special Programs Fund $621.4 $478.1 $515.4 $515.4 $37.3 7.8%
Grants Fund $323.2 $254.6 $224.1 $224.1 ($30.5) ‐12.0%
Total $24,990.1 $26,107.7 $26,739.1 $25,370.4 ($737.3) ‐2.8%
5‐Year CIP
Capital Appropriations
FY18 Year
End Balance
FY19
Budget
FY20
Approved
FY21‐24
Proposed
FY25‐29
Proposed
General Capital Fund
D‐74 On‐Officer Cameras and Data Storage 125.0 ‐ 250.0 204.9 1,315.0
D‐75 Mobile Computing Replacement Program ‐ 170.0 125.0 ‐ 975.0
D‐77 Traffic Motorcycle Replacement 18.4 ‐ 56.0 ‐ ‐
D‐83 Maintenance of Downtown Safety Camera System ‐ 59.0 35.0 ‐ 300.0
General Capital Fund Total 143.4 229.0 466.0 204.9 2,590.0
Appropriation Summary
Capital Budgets, 5-Year CIP and Project Forecast
Police Services
FY20 Budget C-86

FY20 FY20
FY18 FY19 Requested Approved ▲Fulltime Authorized Positions 318 319 319 320 1
Authorized Positions
Police Services
FY20 Budget C-87

The mission of the Probate Court is to serve the public, protect the incapacitated, and assist persons living with mental illness, dementia or other cognitive impairments, safeguarding the due process rights of all with efficiency and grace.
To implement a new case management software that will replace the current case management software
allowing for more efficient and streamlined case processing and information retrieval
To better monitor and audit annual return and inventory filings by conservators, administrators and executors promptly, to recover all funds misappropriated by fiduciaries under the court’s jurisdiction, and to remove malfeasors from office.
To protect incapacitated persons vulnerable to exploitation, neglect or abuse from harm, as well as safeguarding public safety by being attentive to signs of possible harm and/or abuse.
To work closely with Pioneer, our newly contracted case management system provider, to streamline
court procedures by adapting the software to our court’s needs and by fully utilizing the features available to reduce case processing time by 20%.
To ensure that reporting and accounting requirements are met by all guardians, conservators and personal representatives of estates by using our new time‐driven capability to trigger reminder letters, notices to appear and other applicable monitoring and enforcement mechanisms in 100% of new cases and in 50% of old ones in each of the next two years.
To continue partnership with the Treatment and Accountability Court, Advantage Behavioral Health Systems, the Department of Behavioral Health and Developmental Disabilities and other mental health stakeholders to improve access to treatment and supportive services for those with mental illness and/or addictive disease by providing judicial support, training and expertise as requested.
Actual Forecast FY16 FY17 FY18 FY19 FY20
Marriage License Applications 1,099 1,097 1,008 940 1,020
Firearms License Applications 1,225 1,254 1,207 1,292 1,355
Mental Health Applications 27 33 23 40 45
Inventory/Returns Filings 151 156 145 150 175
Estate/Docket Filings 543 520 539 550 575
TOTALS 3,013 3,035 2,877 2,930 3,115
Mission
Goals
Objectives
Performance Measures
Probate Court
FY20 Budget C-88

There are no significant budget changes for FY20.
(All figures in $1,000s) FY18 FY19 FY20 FY20
Appropriations by Type Actual Budget Requested Approved $▲ %▲Salary & Benefits $445.9 $484.6 $483.0 $478.2 ($6.4) ‐1.3%
Operating $34.3 $30.0 $30.0 $30.0 $0.0 0.0%
Total $480.2 $514.6 $513.0 $508.2 ($6.4) ‐1.2%
FY20 FY20
FY18 FY19 Requested Approved ▲Fulltime Authorized Positions 6 6 6 6 0
Budget Highlights
Appropriation Summary
Authorized Positions
Probate Court
FY20 Budget C-89

Our staff is committed to provide an uninterrupted supply of safe drinking water for public health, fire
protection and economic productivity, and to safely convey and reclaim wastewater in an environmentally
responsive way. We operate and manage an effective and reliable enterprise, and responsibly reinvest in
public health and environmental protection infrastructure at value to our ratepayers.
Provide suitable technology to educate Athens‐Clarke County citizens on environmental issues and to
improve customer services.
Provide quality drinking water to protect and enhance the well‐being of the citizens of Athens‐Clarke County.
Maintain and improve the public water distribution and wastewater collection systems to meet the current and future needs of Athens‐Clarke County.
Adopt and /or expand new technology to provide efficient and improved operations, performance data and customer service.
Continue improvements to the Athens‐Clarke County Water Conservation and Drought Management Plans.
Diversify water supply portfolio to improve the resilience and reliability of water supplies
Develop a business plan to provide check and balances and process descriptions into the day to day operations and efficiencies of the Water Business Office.
Continue to safely reclaim clean water from wastewater system.
Continue evaluation and rehabilitation the public water transmission and distribution lines in a priority
order.
Continue evaluation and rehabilitation the public wastewater trunk and interceptor lines, in a priority order.
Utilize the Advanced Metering Infrastructure (AMI) data to enhance customer service, and analyze consumption and billing data.
Evaluate and modify as necessary the Water Conservation Program ensuring that environmental, economic and public outreach goals and regulations are achieved.
Continue utilization of the Wastewater Flow Monitoring Program.
Implement a non‐potable reuse system to improve water supply resilience and reliability
Implement water transmission lines grid improvements to reduce impact of potential water service interruptions.
Implement the Water Business Plan into the daily operations of the Water Business Office.
Mission
Goals
Objectives
Public Utilities
FY20 Budget C-90

Performance Measure FY13 FY14 FY15 FY16 FY17 FY18 FY19 Q1 FY20 Goal Metric Definition/ Reference
Drinking water produced (mgd) 11.74 11.52 12.04 12.26 12.46 12.23 12.36 NA12-month rolling average drinking water pumped into the distribution system
% SDWA compliance rate 100% 100% 100% 100% 100% 100% 100% 100%% of previous 365 days in continuous compliance with Safe Drinking Water Act
Water main breaks / 100 miles new 5.9 4.5 3.2 3.9 2.5 2.1 < 7.0# of water main breaks (excl leaks) prior 12 months per 100 miles of distribution system
ISO fire rating new 2/2X 2/2X 2/2X 2/2X 2/2X 2/2X 2/2X ISO Public Protection Classification
Reclaimed wastewater (mgd) 10.11 11.62 11.40 12.45 11.14 11.80 12.10 NA12-month rolling average effluent from all three Water Reclamation Facilities
NOWRF peaking factor (annual) 1.16 1.14 1.20 1.15 1.24 1.10 NA < 1.25average of max month mgd divided by annual average mgd
MOWRF peaking factor (annual) 1.20 1.31 1.30 1.43 1.30 1.24 NA < 1.25average of max month mgd divided by annual average mgd
CCWRF peaking factor (annual) 2.03 2.00 1.85 1.90 1.48 1.17 NA < 1.25average of max month mgd divided by annual average mgd
% Sewer inspection 9.4% 9.0% 8.1% 8.6% 10.6% 18.8% 16.6% > 9%% of miles of sanitary sewers camera inspected prior 12 months by PUD
SSOs / 100 miles of public sewer / year 2.5 2.7 1.5 6.2 3.9 2.5 2.1 < 2.0# of sanitary sewer overflows into State waters per 100 miles of collection system prior 12
SSO volume as % of total flow new new new new 0.00087% 0.00208% 0.00196% < 0.005%cumulative 12-month SSO volume divided by cumulative 12-month effluent flow
Net kWh / million gallons JGB WTP new 2,405 2,299 2,240 2,199 2,237 2,252 1,993net kWh used divided by total finished water prior 12 months
Net kWh / million gallons NOWRF new 4,912 5,199 4,300 4,519 4,237 4,068 2,172net kWh used divided by total effluent flow prior 12 months
Net kWh / million gallons MOWRF new 3,966 4,105 3,342 4,171 3,659 3,633 2,172net kWh used divided by total effluent flow prior 12 months
Net kWh / million gallons CCWRF new 7,985 5,907 4,800 3,997 3,759 3,605 2,172net kWh used divided by total effluent flow prior 12 months
% CWA compliance rate 99% 100% 100% 100% 100% 100% 100% 99%% of previous 365 days in continuous compliance with Clean Water Act at all 3 WRFs
Our staff is committed to provide safe drinking water for public health, fire protection and economic productivity,
and safely convey and reclaim wastewater
in an environmentally responsive way.
Performance Measures
Public Utilities
FY20 Budget C-91

% Apparent water loss (annual CY) 2.14 1.79 1.36 1.37 1.38 1.38 NA < 1.69% apparent losses divided by total water supplied per year
% Real water loss (annual CY) 10.52 9.51 10.23 8.02 7.94 7.94 NA <13.78% real losses divided by total water supplied per year
JGB WTP peaking factor (annual) 1.31 1.41 1.26 1.32 1.21 1.22 NA < 1.6peak day divided by annual average finished water production
Debt coverage ratio (annual CAFR) 1.55 1.68 1.94 3.76 2.46 2.54 NA > 1.55 net operating funds divided by debt obligations
Return on assets (annual CAFR) 2.69% 2.85% 3.70% 4.03% 4.55% 4.47% NA > 2.50% net income divided by total assets
Operating ratio (annual CAFR) 97.0% 94.8% 87.9% 78.7% 74.6% 73.1% NA > 54%
Debt ratio (annual CAFR) 45.3% 44.3% 48.7% 47.5% 45.5% 42.5% NA < 36% total liabilities divided by total assets
Debt per capita (annual CAFR) 1,852$ 1,788$ 1,990$ 1,909$ 1,821$ 1,735$ NA < $1,700end-of-year outstanding notes and bonds divided by population estimate
Water and sewer bond rating (periodic) AA AA AA+ AA+ AA+ AA+ AA+ AA rating by Fitch's Rating Agency
% CIP R&R sanitary sewers (annual) new 0.24% 0.53% 0.73% 1.37% 2.19% NA > 1.6%% actual 12-month R&R capex divided by 50-year sewer R&R needs
% CIP R&R water lines (annual) new 1.21% 2.40% 1.72% 3.61% 4.26% NA > 1.6%% actual 12-month R&R capex divided by 50-year water distribution system R&R needs
% CIP R&R treatment plants (annual) new 0.67% 0.68% 1.18% 2.94% 1.40% NA > 1.8%% actual 12-month R&R capex divided by 50-year facility R&R needs
Water affordability index 0.88% 0.92% 0.95% 0.98% 1.00% 1.02% 1.05% < 0.68%average annual water bill / median household income
Wastewater affordability index 0.84% 0.91% 0.97% 1.03% 1.07% 1.11% 1.16% < 0.79%annual average wastewater bill / median household income
% Electronic and credit card payments new new new new newACH plus EFT plus credit card payments divided by total payments
Distribution O&M $ / 100 miles water $180,026 $179,897 $174,423 $184,802 $197,676 $189,310 $179,840 < $568,344
Collection O&M $ / 100 miles sewer $439,744 $454,350 $457,659 $447,870 $438,445 $486,357 $472,809 < $603,372
NOWRF O&M $ / mgal effluent $1,630 $1,178 $1,245 $1,220 $1,175 $1,320 $1,210 $1,37825th percentile $1,378 representing tertiary treatment and scale of plant
MOWRF O&M $ / mgal effluent $1,614 $1,316 $1,439 $1,227 $1,417 $1,396 $1,317 $1,37825th percentile $1,378 representing tertiary treatment and scale of plant
CCWRF O&M $ / mgal effluent $4,339 $2,943 $2,175 $1,886 $1,448 $1,817 $1,648 $1,37825th percentile $1,378 representing tertiary treatment and scale of plant
JGBWTP O&M $ / mgal production $673 $717 $643 $630 $686 $966 $701 $747
GlossaryAWWA means American Water Works AssociationCapex means historical capital expenditure CWA means federal Clean Water ActISO means Insurance Service OfficeJGBWTP means the J.G. Beacham Water Treatment PlantkWh means kilowat hoursmgal means million gallonsmgd means million gallons per dayMHI means median household incomeMedian means 50th percentile of performance by other utilitiesR&R means capital rehabilitation and replacementSDWA means federal Safe Drinking Water ActSSO means sanitary sewer overflows that reach waters of the StateWEF means Water Environment FederationWRF means water reclamation facility
We run an effective and reliable enterprise
responsibly reinvesting in public health and environmental protection infrastructure
at value to our ratepayers.
Public Utilities
FY20 Budget C-92

Water and Sewer Fund revenues for FY20 are projected to be $56.3 million, an increase of $2.1 million
over the FY19 Budget. This revenue is based on changes to water and sewer rates planned for adoption during the budget process of FY17 that took effect on July 1, 2017.
For FY20, the projected revenue is sufficient to fund projected operating expenses (including all debt payments) in the Water & Sewer Fund (not including depreciation).
The FY20 Approved Budget includes three new positions for the Phosphorus Discharge Project ($116,993). This project addresses necessary regulatory upgrades at all three Water Reclamation Facilities.
The FY20 Approved Budget includes one new position for an Accounting Analyst in the Water Business Office ($45,680). This position will manage the complexities of new financial products and services (bank drafts, online payments, etc.).
For more information on the Water & Sewer Fund, see page E‐27.
(All figures in $1,000s) FY18 FY19 FY20 FY20
Appropriations by Type Actual Budget Requested Approved $▲ %▲Salary & Benefits $8,895.7 $9,581.4 $10,130.3 $10,130.3 $548.9 5.7%
Operating $8,549.2 $10,172.8 $10,234.3 $10,234.3 $61.5 0.6%
Total $17,444.9 $19,754.2 $20,364.6 $20,364.6 $610.4 3.1%
FY18 FY19 FY20 FY20
Appropriations by Division Actual Budget Requested Approved $▲ %▲Administration $888.4 $1,154.1 $1,256.1 $1,200.5 $46.4 4.0%
Constr & Proj Managemnt $5,805.3 $6,363.1 $6,619.7 $6,675.4 $312.3 4.9%
Plant Operations $10,265.8 $11,695.2 $11,911.3 $11,911.3 $216.1 1.8%
Engineering Management $485.4 $541.8 $577.5 $577.5 $35.7 6.6%
Total $17,444.9 $19,754.2 $20,364.6 $20,364.7 $610.5 3.1%
Budget Highlights
Appropriation Summary
Public Utilities
FY20 Budget C-93

5‐Year CIP
Capital Appropriations
FY18 Year
End Balance
FY19
Budget
FY20
Approved
FY21‐24
Proposed
FY25‐29
Proposed
Water & Sewer Const. Fund
D‐86 W&S Lines ‐ Additions and Improvements ‐ 918.2 936.0 3,934.5 5,260.0
D‐87 Meter and Water/Sewer Stub Additions ‐ 482.2 491.0 2,061.6 2,758.0
D‐88 Donated W&S Additions Management ‐ 218.0 224.0 930.4 1,246.0
D‐89 Watershed Protection Long‐Term Monitoring 46.5 100.0 100.0 400.0 500.0
D‐90 Replace Water Meters 5,250.9 365.0 365.0 1,460.0 1,825.0
D‐91 Rehabilitate and Replace Sewers 24,861.9 14,000.0 9,951.8 20,000.0 30,000.0
D‐92 Extend Wastewater Collection System 4,906.8 100.0 100.0 400.0 5,000.0
D‐93 Replace and Upgrade Facil ities and Equipment 7,181.7 5,400.0 5,300.0 13,450.0 17,250.0
D‐94 Rehabilitate and Replace Water Lines 1,219.9 2,500.0 2,750.0 13,000.0 20,000.0
D‐95 Relocate Water & Sewer Lines for DOT Projects 405.1 100.0 100.0 400.0 500.0
D‐96 Manage and Reuse Residual Solids 496.1 1,350.0 1,500.0 9,260.0 1,500.0
D‐97 Improve Water Supply Reliabil ity 3,327.7 3,000.0 3,500.0 22,500.0 10,500.0
D‐98 W&S Contribution to Economic Development 571.0 100.0 100.0 400.0 500.0
D‐99 Investigate and Install Alternative Energy 993.2 50.0 50.0 200.0 500.0
D‐101 Water Transmission Grid Improvements ‐ 1,200.0 2,000.0 ‐ ‐
Water & Sewer Const. Fund Total 49,260.8 29,883.4 27,467.8 88,396.5 97,339.0
FY20 FY20
FY18 FY19 Requested Approved ▲Fulltime Authorized Positions 194 194 198 198 4
Capital Budgets, 5-Year CIP and Project Forecast
Authorized Positions
Public Utilities
FY20 Budget C-94

Our mission is to work in partnership with our diverse communities to promote and enhance the safety and the quality of life in Athens‐Clarke County.
We respect all members of the community and we value community relations.
We respect all members of the organization.
We value initiative.
We value service orientation.
We value work ethic.
We value professional public image.
We value professional skill.
We value efficient use of resources.
We value internal relations. The Clarke County Sheriff’s Office exists to provide services for the protection of life and property and the preservation of the public peace in Athens‐Clarke County. The Sheriff is responsible for the physical health and welfare of all inmates in the jail, and the management of their property and money. The Sheriff’s Office serves criminal warrants, civil papers, and subpoenas, executes evictions, transports prisoners to court, extradites prisoners from other states to court, provides security for State, Superior, Municipal, Magistrate and Juvenile Courts, Jurors, Clarke County Courthouse, and the Courthouse Parking Deck. The Sheriff’s Office also serves as a source of information, providing lectures and programs to community groups, civic associations and schoolchildren through the D.A.R.E. Program.
To provide a community free of crime, fear, disorder, and innovative correctional practices that hold offenders accountable to become productive members of our society.
Our goal is to provide an atmosphere of safety and security in an effective and efficient manner to the citizens of Athens‐Clarke County, protect life and property, preserve the public peace, operate all of the Sheriff’s Office efficiently and to enhance our awareness and educational programs for the public and for inmates and to provide for the safe and efficient transportation of prisoners throughout various locations in the state.
Reduce the number of warrants on file through innovative special operations and administrative warrant
reduction efforts in cooperation with the courts and prosecutors. o Review the current warrants for validity and work with the Judiciary, District Attorney, and Solicitor
General to review old warrants determined to be un‐servable and create a review system to dismiss these warrants.
Provide prompt service of Temporary Protective Orders and Involuntary Committal Orders, provide timely service of civil and landlord and tenant processes, and provide timely presentation of prisoners before the courts.
Prevent or quickly resolve any incident or breach of security in courtrooms, the courthouse, or the surrounding grounds.
Mission
Vision
Goal
Objectives
Sheriff
FY20 Budget C-95
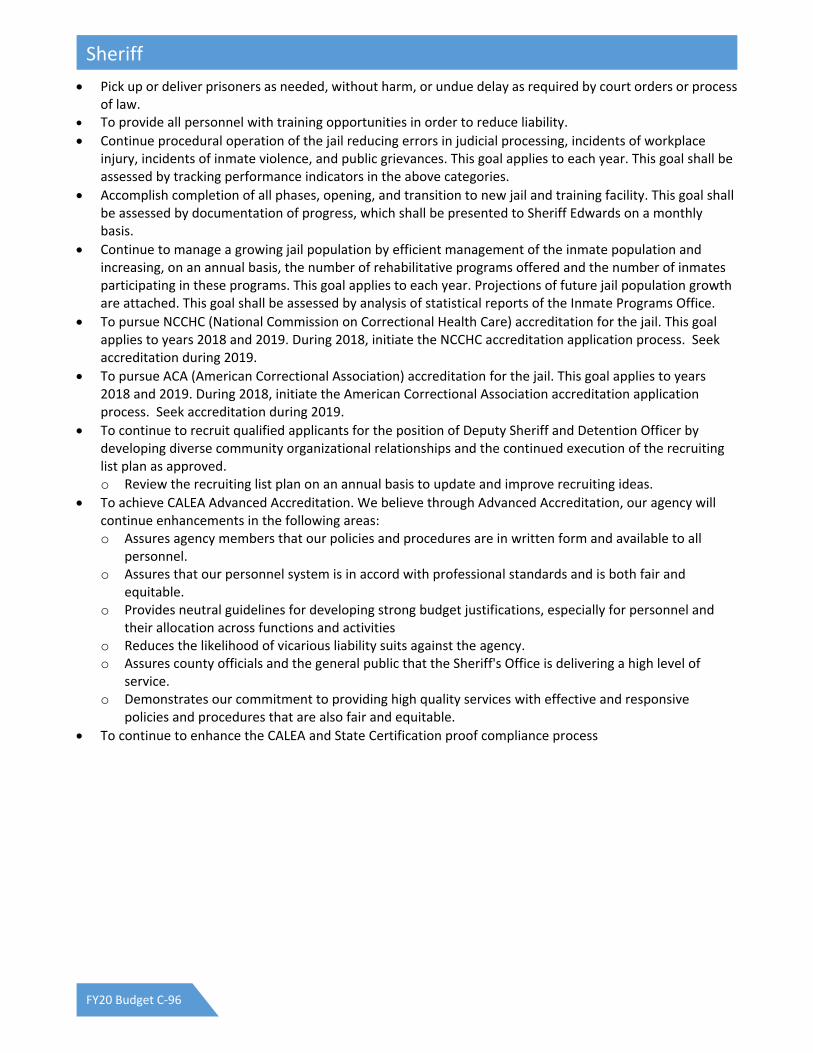
Pick up or deliver prisoners as needed, without harm, or undue delay as required by court orders or process of law.
To provide all personnel with training opportunities in order to reduce liability.
Continue procedural operation of the jail reducing errors in judicial processing, incidents of workplace injury, incidents of inmate violence, and public grievances. This goal applies to each year. This goal shall be assessed by tracking performance indicators in the above categories.
Accomplish completion of all phases, opening, and transition to new jail and training facility. This goal shall be assessed by documentation of progress, which shall be presented to Sheriff Edwards on a monthly basis.
Continue to manage a growing jail population by efficient management of the inmate population and increasing, on an annual basis, the number of rehabilitative programs offered and the number of inmates participating in these programs. This goal applies to each year. Projections of future jail population growth are attached. This goal shall be assessed by analysis of statistical reports of the Inmate Programs Office.
To pursue NCCHC (National Commission on Correctional Health Care) accreditation for the jail. This goal applies to years 2018 and 2019. During 2018, initiate the NCCHC accreditation application process. Seek accreditation during 2019.
To pursue ACA (American Correctional Association) accreditation for the jail. This goal applies to years 2018 and 2019. During 2018, initiate the American Correctional Association accreditation application process. Seek accreditation during 2019.
To continue to recruit qualified applicants for the position of Deputy Sheriff and Detention Officer by developing diverse community organizational relationships and the continued execution of the recruiting list plan as approved. o Review the recruiting list plan on an annual basis to update and improve recruiting ideas.
To achieve CALEA Advanced Accreditation. We believe through Advanced Accreditation, our agency will continue enhancements in the following areas: o Assures agency members that our policies and procedures are in written form and available to all
personnel. o Assures that our personnel system is in accord with professional standards and is both fair and
equitable. o Provides neutral guidelines for developing strong budget justifications, especially for personnel and
their allocation across functions and activities o Reduces the likelihood of vicarious liability suits against the agency. o Assures county officials and the general public that the Sheriff's Office is delivering a high level of
service. o Demonstrates our commitment to providing high quality services with effective and responsive
policies and procedures that are also fair and equitable.
To continue to enhance the CALEA and State Certification proof compliance process
Sheriff
FY20 Budget C-96

Actual Forecast
FY16 FY17 FY18 FY19 FY20
Sheriff / Administration Section
# Training Hours reported to Training Unit 10,680 12,650 12,135 12,135 12,620
Background Checks through GCIC 2,114 2,028 1,980 1,992 2,000
Fingerprints‐firearms lic., bondsmen, adoption, USDA, Bar Admission, RESA, other 1,195 1,498 1,439 1,200 1,200
# Complaints 25 29 111 100 100
Public Complaints / Grievances (founded) 10 12 15 15 12
New Deputy & Detention Hires 12 28 18 15 15
Deputy & Detention Separations 21 12 20 5 10
Total Sworn Staff 138 153 158 130 130
Total Staff 166 163 173 161 161
Use of Force Incidents 97 93 106 80 80
Sheriff / Field Section
New Warrants 10,040 11,153 X* 12,000 12,000
Warrants Served/Processed 8,500 5,834 X* 6,500 6,500
Total Arrest 4,500 4,202 X* 4,281 4,281
Civil Papers Received 9,900 10,835 9,863 10,900 10,900
Civil Papers Served / Processed 8,864 8,900 7,209 8,900 8,900
Evictions Received 950 710 713 756 756
Evictions Served / Processed 875 630 558 756 756
Sheriff/Jail
Average Daily Inmate Population 398 434 425 425 435
Average Number of Inmates Housed Daily in Other Facilities at a cost to ACC 3 1 1 0 0
Number of Inmates Processed 8,463 8,547 8,000 8,500 8,500
Number of Inmates Released 8,397 8,464 7,700 8,500 8,500
Number of Inmates Released to State System 271 256 375 400 400
Number of Inmates Classified 5,344 5,711 5,200 5,400 5,400
Number of Inmate Medical Transports 234 204 276 300 300
Inmate Participation in Rehabilitation /Education 3,417 3,961 3,850 4,000 4,000
Inmate on Deputy/Staff Violence 21 26 21 20 20
Inmate on Inmate Violence 191 135 87 80 80
*Due to a transition in our record management system, previous data has not been fully merged into the new system. Therefore, FY18 totals cannot be determined at this time. We are hopeful that this data will be available soon.
Performance Measures
Sheriff
FY20 Budget C-97

The FY20 Budget includes $90,000 of the $97,874 requested increase for inmate medical expenses.
The Budget also includes an additional $12,572 for Indirect Expenses.
The Sheriff’s Office requested the following increases which were not recommended nor approved:
o Jail Internet Service Expansion $ 1,800
o New Initiative: Jail Accreditation for ACA & NCCHC $25,980
For FY20, Public Safety vehicle replacement is approved to be funded from the next SPLOST program
resulting in a reduction of $89,000 for the Sheriff’s Office.
An applied position vacancy estimate has reduced personal service expense by $92,900.
FY20 Budget of $17.9 million reflects no other significant changes to services or programs.
(All figures in $1,000s) FY18 FY19 FY20 FY20
Appropriations by Type Actual Budget Requested Approved $▲ %▲Salary & Benefits $12,687.5 $13,019.1 $13,284.5 $13,191.6 $172.5 1.3%
Operating $4,296.5 $4,634.6 $4,787.4 $4,662.7 $28.1 0.6%
Total $16,984.0 $17,653.7 $18,071.9 $17,854.3 $200.6 1.1%
FY18 FY19 FY20 FY20
Appropriations by Division Actual Budget Requested Approved $▲ %▲Administration $1,141.2 $1,274.6 $1,408.0 $1,356.9 $82.3 6.5%
Jail $11,955.1 $12,202.8 $12,332.3 $12,251.4 $48.6 0.4%
Field $3,887.7 $4,176.3 $4,331.6 $4,246.0 $69.7 1.7%
Total $16,984.0 $17,653.7 $18,071.9 $17,854.3 $200.6 1.1%
FY18 FY19 FY20 FY20
Appropriations by Fund Actual Budget Requested Approved $▲ %▲General Fund $16,938.4 $17,618.7 $18,036.8 $17,819.3 $200.6 1.1%
Sheriff Inmate Fund $28.3 $35.0 $35.0 $35.0 $0.0 0.0%
Other Funds $17.3 $0.0 $0.1 $0.0 $0.0 ‐‐
Total $16,984.0 $17,653.7 $18,071.9 $17,854.3 $200.6 1.1%
Budget Highlights
Appropriation Summary
Sheriff
FY20 Budget C-98

5‐Year CIP
Capital Appropriations
FY18 Year
End Balance
FY19
Budget
FY20
Approved
FY21‐24
Proposed
FY25‐29
Proposed
General Capital Fund
D‐103 Body Worn Cameras (New) ‐ ‐ 42.0 ‐ 212.0
General Capital Fund Total ‐ ‐ 42.0 ‐ 212.0
FY20 FY20
FY18 FY19 Requested Approved ▲Fulltime Authorized Positions 194 194 194 194 0
Capital Budgets, 5-Year CIP and Project Forecast
Authorized Positions
Sheriff
FY20 Budget C-99

The mission of the Office of the Solicitor‐General is to seek justice through the appropriate prosecution of
misdemeanor criminal offenses under Georgia state law and criminal violations of local ordinances in the State
Court of Clarke County, the Municipal Court of Athens‐Clarke County, the Municipal Court of the City of
Winterville, and the Magistrate Court of Clarke County. Seeking justice requires us to investigate cases in
order to gather the necessary information upon which to base prosecutorial decisions. Through the exercise of
prosecutorial discretion, we seek to allocate the resources of the office in the most efficient manner in order
to secure justice by maximizing the rate of successful resolution of cases, through trial, plea, or dismissal
(when appropriate), while minimizing the length of time required for final disposition.
An important part of seeking justice for society is seeking justice for the individual victims of crimes.
Accordingly, it is also the mission of the Office of the Solicitor‐General to ensure that victims are given a voice
in criminal proceedings by giving them a meaningful opportunity to express themselves through the judicial
process. In order to achieve this mission, victims are provided with information about court dates and case
status, education about victim compensation and restitution, and referrals to appropriate social service
agencies. Additionally, we provide support for victims who face the emotionally difficult task of appearing and
testifying in court.
While seeking justice is a key mission, the Office of the Solicitor‐General also recognizes the need to educate
the public as a way to reduce criminal behavior and increase the safety of our citizens. As a result, the Office
of the Solicitor‐General also sees as our mission informing the public about issues of domestic violence and
alcohol related offenses, including DUI and Underage Possession of Alcohol, through various programs in an
effort to prevent criminal cases before the need to prosecute arises.
Manage the growing office caseload in an efficient and just manner.
Reduce time between receipt of case and arraignments by continuing to Fast Track high risk multi‐offender
DUI and domestic violence cases.
Reduce time between arraignment and final disposition.
Continue providing services and support to the victims of crimes.
Continue to devote two prosecutors through a government funded grant to handle family violence cases
and two county funded prosecutors to handle DUI cases so that these often complex cases will be
prosecuted efficiently and effectively.
Reduce recidivism among DUI and substance abuse offenders through rehabilitation by strict supervision
and mandatory treatment in the DUI/Drug Court Program.
Continue providing effective domestic violence intervention and DUI enforcement training to new police
recruits through the New Officer Basic Course and to experienced police officers through in‐service
training.
Review all outstanding bench warrant cases in order to determine whether prosecution of the cases is
consistent with the interest of justice.
Continue providing educational programs designed to reduce criminal behavior and improve citizen safety
at no cost to taxpayers.
Continue to participate as team members of the DUI/Drug Court, Treatment and Accountability Court, and
Veterans’ Court in an effort to seek alternative sanctions that reduce recidivism and the jail
population.
Mission & Goals
Objectives
Solicitor General
FY20 Budget C-100

Goal 1: Fair, Impartial, and Expeditious Pursuit of Justice
Objective Performance Measure 2018
Offender
Accountability
Percentage of convictions 59% guilty pleas or convictions
Percentage of dismissals 22% dismissals
Treatment Courts and creative
treatment centered sentencing options
23 new CAP participants, 17
continuing – staffing 40 cases over
the year
Fair and consistent
case disposition
Pleas to Original Charge
Pre‐Trial Diversion 120 in State Court
Timely and efficient
administration of
justice
Time to disposition *Calculations in progress for DV
cases at present – hope to gather
more data on other caseloads
Opportunities to adjudicate Average of 20 court dates per
month, excluding special
scheduled pleas
Maintaining low backlog Opened 2514 misdemeanor cases
and closed 2571 misdemeanor
cases in State Court
Victim Services
Delivery*
Performing statutory and constitutional
notification of rights, court dates, and
criminal justice system explanation
14,554 services performed by
Victim Witness Program; 2,599
individual notes added; 3807
services performed by interns
supervised by staff
Early notification efforts
Face to face meetings with prosecutors
and/or victim advocates
Referrals to social services
Special Bond Hearing appearances
Victim knowledge and satisfaction See summary and graphics.
Goal 2: Safer Community
Objective Performance Measure 2018
Prevention Accountability Court participation Actively participate in 3
Accountability Courts
Community Accountability Protocol
(CAP) – DV Offender treatment staffing
SGO attendance at CAP monthly
staffing
Education Hands Are Not for Hitting – Bullying
program in CCSD
1746 children in Pre‐K,
Kindergarten, and 1st grades at 10
CCSD schools
Victim Impact Panel Approximately 245 attendees to
monthly Panel hosted by SGO
Victim Services Presentations
Performance Measures
Solicitor General
FY20 Budget C-101

Objective Performance Measure 2018
Restriction Event 65 applications, 30 people
attended event
New Officers Basic Course (NOBC) with
ACCPD – Misdemeanor best practices
education and mock scene and
testimony experience
42 New officers trained –
33 ACCPD, 9 UGAPD
Community
Coordination
Coordinate with community partners Domestic Violence MOU signed in
2018, see attached
Community task forces Quarterly Domestic Violence Task
Force and Executive Committee
Meetings
Accountability Court Staffing DUI Drug Court Staffing every
other week; Treatment and
Accountability Court Staffing
weekly; Veteran’s Court staffing
twice per month – 102 meetings
per year, 167 hours in staffing only
Accelerated Court for
high risk offenders
Domestic Violence Fast Track 327 high risk cases fast tracked –
repeat DV, Stalking, Violation of
Court Order
Driving Under the Influence Fast Track 270 high risk cases fast tracked –
repeat DUI offenders, or those
with high BAC as determined by
Magistrate
Victim Services Referrals to social service agencies
Temporary Protective Order Assistance
Goal 3: Competent and Responsible Pursuit of Justice
OBJECTIVE PERFORMANCE MEASURE 2018
Efficient office services Budget consistency
Staff training and cross training Prosecutors receive – hours
Continuing Legal Education per
year; Victim Advocates must
receive 8 hours of training per
year; VAWA & VOCA employees
must
Staff Education
Focused prosecution 2 prosecutors assigned to
Domestic Violence and other
Violent offenses; 2 prosecutors
assigned to DUI and traffic
offenses
Solicitor General
FY20 Budget C-102

OBJECTIVE PERFORMANCE MEASURE 2018
Grants and funding
opportunities
Victims of Crime Act Funds VOCA funds awarded for FFY19 ‐
$51,706; awaiting response on
additional training funds
Violence Against Women Act Funds VAWA funds for 2018
$70,000
The Solicitor General’s Office is funded from the General Fund as well as 5% fine add‐on revenue in the Special
Programs Fund which supports one fulltime victim assistance position.
The budget includes increased funding for software licensing and support of $6,400.
The Approved Budget includes no other significant changes.
(All figures in $1,000s) FY18 FY19 FY20 FY20
Appropriations by Type Actual Budget Requested Approved $▲ %▲Salary & Benefits $1,276.6 $1,253.4 $1,278.4 $1,278.4 $25.0 2.0%
Operating $60.2 $66.4 $73.5 $73.5 $7.1 10.7%
Total $1,336.8 $1,319.8 $1,351.9 $1,351.9 $32.1 2.4%
FY18 FY19 FY20 FY20
Appropriations by Fund Actual Budget Requested Approved $▲ %▲General Fund $1,160.6 $1,251.9 $1,272.1 $1,272.1 $20.2 1.6%
Special Programs Fund $59.9 $67.9 $79.8 $79.8 $11.9 17.5%
Grants Fund $116.3 $0.0 $0.0 $0.0 $0.0 ‐‐
Total $1,336.8 $1,319.8 $1,351.9 $1,351.9 $32.1 2.4%
FY20 FY20
FY18 FY19 Requested Approved ▲Fulltime Authorized Positions 18 18 18 18 0
Budget Highlights
Appropriation Summary
Authorized Positions
Solicitor General
FY20 Budget C-103
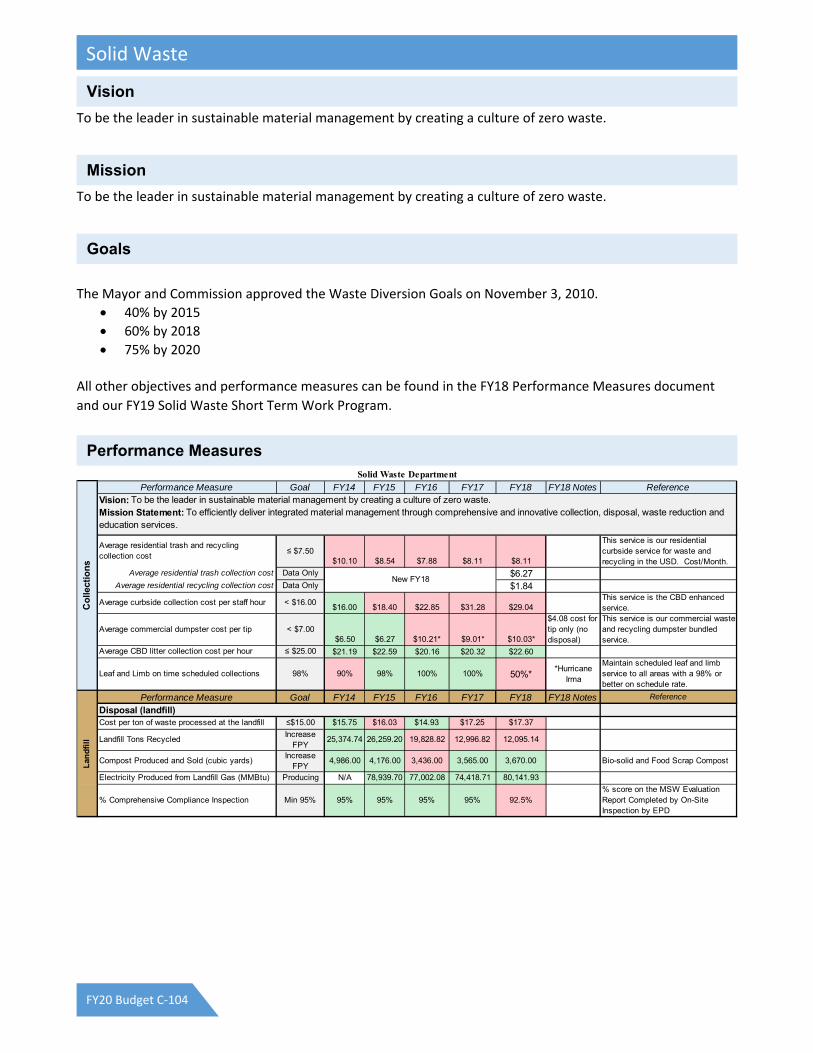
To be the leader in sustainable material management by creating a culture of zero waste.
To be the leader in sustainable material management by creating a culture of zero waste.
The Mayor and Commission approved the Waste Diversion Goals on November 3, 2010.
40% by 2015
60% by 2018
75% by 2020
All other objectives and performance measures can be found in the FY18 Performance Measures document
and our FY19 Solid Waste Short Term Work Program.
Performance Measure Goal FY14 FY15 FY16 FY17 FY18 FY18 Notes Reference
Average residential trash and recycling collection cost
≤ $7.50$10.10 $8.54 $7.88 $8.11 $8.11
This service is our residential curbside service for waste and recycling in the USD. Cost/Month.
Average residential trash collection cost Data Only $6.27Average residential recycling collection cost Data Only $1.84
Average curbside collection cost per staff hour < $16.00$16.00 $18.40 $22.85 $31.28 $29.04
This service is the CBD enhanced service.
Average commercial dumpster cost per tip < $7.00$6.50 $6.27 $10.21* $9.01* $10.03*
$4.08 cost for tip only (no disposal)
This service is our commercial waste and recycling dumpster bundled service.
Average CBD litter collection cost per hour ≤ $25.00 $21.19 $22.59 $20.16 $20.32 $22.60
Leaf and Limb on time scheduled collections 98% 90% 98% 100% 100% 50%* *Hurricane
Irma
Maintain scheduled leaf and limb service to all areas with a 98% or better on schedule rate.
Performance Measure Goal FY14 FY15 FY16 FY17 FY18 FY18 Notes Reference
Disposal (landfill)Cost per ton of waste processed at the landfill ≤$15.00 $15.75 $16.03 $14.93 $17.25 $17.37
Landfill Tons RecycledIncrease
FPY25,374.74 26,259.20 19,828.82 12,996.82 12,095.14
Compost Produced and Sold (cubic yards)Increase
FPY4,986.00 4,176.00 3,436.00 3,565.00 3,670.00 Bio-solid and Food Scrap Compost
Electricity Produced from Landfill Gas (MMBtu) Producing N/A 78,939.70 77,002.08 74,418.71 80,141.93
% Comprehensive Compliance Inspection Min 95% 95% 95% 95% 95% 92.5%% score on the MSW Evaluation Report Completed by On-Site Inspection by EPD
Solid Waste Department
Co
llect
ion
s
Vision: To be the leader in sustainable material management by creating a culture of zero waste. Mission Statement: To efficiently deliver integrated material management through comprehensive and innovative collection, disposal, waste reduction and education services.
Lan
dfi
ll
New FY18
Vision
Mission
Goals
Performance Measures
Solid Waste
FY20 Budget C-104

The Solid Waste Department’s budget is supported by three funds: the General Fund, Landfill Fund and the
Solid Waste Fund.
General Fund
The FY20 General Fund Budget for litter collection in the Commercial Business District is $222,429. The Budget for Leaf & Limb services is $721,942. There are no significant changes for these services.
Performance Measure Goal FY14 FY15 FY16 FY17 FY18 FY18 Notes Reference
Waste Reduction
Average monthly recycling tonnage 2,500 1,709 1,833 1,548 1,627 1,643Incoming tonnage received at the RMPF.
% Contamination Rate < 10% 10% 15% 12% 10% 25%Contamination is material sent to the landfill but delivered to the RMPF.
% Waste Diversion RateIncrease
Rate44.0% 43.0% 38.0% 27.0% 27.0%
M&C Waste Diversion Goal set in 2010; 40% by 2015; 60% by 2018; 75% by 2020
Number of CHaRM CustomersIncrease
FPY2,371 4,415 4,810
CHaRM Customer RevenueIncrease
FPY$10,720 $13,107 $16,001
Fees charged to CHaRM customers -material specific.
Material Revenue from CHaRM itemsIncrease
FPY$5,459 $20,158 $17,862
Revenue made from sale of CHaRM recyclables.
Tonnage Processed at the CHaRMIncrease
FPY108.20 148 254
Compliance with Commercial Recycling Ordinance
Increase FPY
N/A 330 806 896 1007Total number/percentage of businesses compliant with Commercial Recycling Ordinance
Performance Measure Goal FY14 FY15 FY16 FY17 FY18 FY18 Notes Reference
and Education Services (Recycling Division & KACCB)
Total Number of Community Interactions 1,640 1,258 1,620 2,062 6,998
Tours of the RMPF, Landfill and Compost Facility performed by the Recycling Division and all outreach too.
Total Number of Tour Participants 2,159
Total Number of Outreach Participants 4,839Classroom visits, School assemblies, and Tabling events
RMPF Tours Data Only 63 54 50 71 80
CHaRM Tours Data Only 7
Landfill Tours Data Only 11 17 15 23 29
Compost Facility Tours Data Only 9 19 15 23 29
Number of Annual Community Events(projects supported)
Increase FPY
61 67 82 103 401*
Number of Volunteers at Community EventsIncrease
FPY 7,286 10,582 7,485 8,494 8,223
Total Number of Volunteer HoursIncrease
FPY 29,967 35,498 18,361 23,458 19,115
Number of Litter Clean-UpsIncrease
FPY171 191 266 310 264
Return on InvestmentIncrease
FPY$194.00 $108.00 $19.38 $18.93 $35.30
For every $1 invested in KACCB, FY amount on left is returned in community benefit.
GlossaryCBD - Central Business District KAB - Keep America BeautifulCHaRM - Center for Hard to Recycle Materials KACCB - Keep Athens-Clarke County Beautiful EPD - Environmental Protection Division MSW - Municipal Solid WasteFPY - From Previous Year NYA - Not Yet Available
RMPF - Recovered Material Processing Facility
Ed
uca
tio
n S
ervi
ces
Keep Athens-Clarke County Beautiful Mission Statement: to educate and empower citizens and businesses with the resources to take action as environmental stewards of litter prevention, waste reduction, and beautification.
These numbers are prepared as required for the KAB annual report.
Was
te R
edu
ctio
n
New for FY16
New for FY18
Increase FPY
New for FY18
Budget Highlights
Solid Waste
FY20 Budget C-105

Landfill Enterprise Fund
Revenue for the Landfill Enterprise Fund is projected to be $4.1 million, which is $263,000 above the FY19 Budget and based on the current $42/ton fee adopted in FY09. Based on current waste flow, the FY20 estimate is 65,000 tons, which is similar to the FY19 estimate.
Operating expenses (less depreciation) for the Landfill Fund in FY20 are projected to be $4.2 million, approximately $900,000 more than FY19.
The FY20 Approved Budget for the Landfill Fund includes a part‐time Hazardous Waste Tech at the CHaRM ($16,300) to cover additional workload.
Solid Waste Fund
Revenues for FY20 are projected at $3.5 million, similar to FY19. No rate changes are included for FY20.
Operating expenses (less depreciation) for the Solid Waste Fund in FY20 are budgeted at $3.5 million, similar to the FY19 Budget.
The FY20 Approved Budget includes for the Solid Waste Fund a new part‐time janitorial position ($13,200).
For more information on the Landfill Fund and the Solid Waste Fund, see pages E‐25 and 29.
(All figures in $1,000s) FY18 FY19 FY20 FY20
Appropriations by Type Actual Budget Requested Approved $▲ %▲Salary & Benefits $3,248.5 $3,528.9 $3,824.5 $3,721.5 $192.6 5.5%
Operating $3,027.1 $2,742.2 $2,783.8 $2,779.3 $37.1 1.4%
Total $6,275.6 $6,271.1 $6,608.3 $6,500.8 $229.7 3.7%
FY18 FY19 FY20 FY20
Appropriations by Division Actual Budget Requested Approved $▲ %▲Administration $1,389.6 $1,474.1 $1,580.1 $1,580.1 $106.0 7.2%
Landfill $1,692.5 $1,478.1 $1,510.6 $1,510.6 $32.5 2.2%
Collections $3,193.5 $3,318.9 $3,517.6 $3,410.1 $91.2 2.7%
Total $6,275.6 $6,271.1 $6,608.3 $6,500.8 $229.7 3.7%
FY18 FY19 FY20 FY20
Appropriations by Fund Actual Budget Requested Approved $▲ %▲General Fund $927.8 $944.4 $1,076.6 $969.1 $24.7 2.6%
Landfill Fund $2,722.5 $2,578.6 $2,712.7 $2,712.7 $134.1 5.2%
Solid Waste Collection Fund $2,625.3 $2,748.1 $2,819.0 $2,819.0 $70.9 2.6%
Total $6,275.6 $6,271.1 $6,608.3 $6,500.8 $229.7 3.7%
Appropriation Summary
Solid Waste
FY20 Budget C-106

5‐Year CIP
Capital Appropriations
FY18 Year
End Balance
FY19
Budget
FY20
Approved
FY21‐24
Proposed
FY25‐29
Proposed
Landfill Fund
D‐108 Replace Bulldozer 12.5 100.0 300.0 480.0 240.0
D‐109 Replace Dump Truck (25 yard articulating) 210.0 134.0 134.0 134.0 400.0
D‐117 Belt Replacements for RMPF (New) ‐ ‐ 67.0 134.0 ‐
D‐118 Control Panel/Cabinets Replacement for RMPF ‐ ‐ 65.0 ‐ ‐
D‐119 Replacement Roll‐Off Container Truck ‐ 114.0 59.0 201.0 200.0
D‐120 Replace Pavement at Solid Waste Facil ities (New) ‐ ‐ 60.0 ‐ ‐
Landfill Fund Total 222.5 348.0 685.0 949.0 840.0
Solid Waste Fund
D‐121 Replace Automated Refuse/Recycling Truck 540.0 540.0 200.0 620.0 ‐
D‐122 Replace Commercial Dumpster Collection Front‐
end Loader
(79.6) 165.0 180.0 360.0 90.0
D‐123 Replace Mini‐Packer Trucks (New) ‐ ‐ 135.0 270.0 ‐
D‐124 Mini‐Packer Truck (293.4) 34.0 34.0 34.0 68.0
Solid Waste Fund Total 166.9 739.0 549.0 1,284.0 158.0
FY20 FY20
FY18 FY19 Requested Approved ▲Fulltime Authorized Positions 61 62 64 62 0
Capital Budgets, 5-Year CIP and Project Forecast
Authorized Positions
Solid Waste
FY20 Budget C-107

The Mission of the State Court is to preside over civil and criminal cases in a manner consistent with the law and interests of justice. The Court seeks to handle all cases in a timely, efficient, and cost‐effective manner and to treat all persons who appear in Court with dignity, courtesy, and respect. A significant part of the operation of the Court is the DUI/Drug Court program, the goal of which is to provide the opportunity for repeat DUI and substance‐abuse offenders to achieve sobriety and become productive members of our community through a unique program of intensive supervision, treatment and accountability.
The State Court seeks to provide diligent, effective, efficient and fair administration of justice in all civil and criminal cases. The DUI/Drug Court seeks to reduce recidivism rates for high‐risk offenders by holding offenders accountable and therefore increasing public safety.
Actual Forecast
FY15 FY16 FY17 FY18 FY19 FY20
Criminal Cases Filed* 4,537 3,964 3,562 3,804
Not Available
Criminal Cases Disposed* 4,487 4,341 3,733 3,834
Civil Cases Filed 487 450 509 676
Civil Cases Disposed 426 449 452 582
Jury trials conducted 52 38 29 27
*Includes probation cases
There are no significant changes to the FY20 Approved Budget for the General Fund.
The FY20 Approved Budget for the DUI‐Drug Court includes participant revenues of $120,000, anticipated
grant funding of $74,000, use of fund balance of $5,000 and anticipated use of DATE Funds of $64,000
for a total of $263,000.
Mission and Goals
Objectives
Performance Measures
Budget Highlights
State Court
FY20 Budget C-108

(All figures in $1,000s) FY18 FY19 FY20 FY20
Appropriations by Type Actual Budget Requested Approved $▲ %▲Salary & Benefits $642.9 $662.4 $673.7 $673.7 $11.3 1.7%
Operating $450.4 $395.2 $395.4 $395.4 $0.2 0.1%
Total $1,093.3 $1,057.6 $1,069.1 $1,069.1 $11.5 1.1%
FY18 FY19 FY20 FY20
Appropriations by Division Actual Budget Requested Approved $▲ %▲State Court $675.0 $680.6 $675.6 $675.6 ($5.0) ‐0.7%
DUI/Drug Court $418.3 $377.0 $393.5 $393.5 $16.5 4.4%
Total $1,093.3 $1,057.6 $1,069.1 $1,069.1 $11.5 1.1%
FY18 FY19 FY20 FY20
Appropriations by Fund Actual Budget Requested Approved $▲ %▲General Fund $787.9 $794.5 $805.8 $805.8 $11.3 1.4%
Special Programs Fund $189.2 $263.1 $263.3 $263.3 $0.2 0.1%
Grants Fund $116.2 $0.0 $0.0 $0.0 $0.0 ‐‐
Total $1,093.3 $1,057.6 $1,069.1 $1,069.1 $11.5 1.1%
FY20 FY20
FY18 FY19 Requested Approved ▲Fulltime Authorized Positions 7 7 7 7 0
Appropriation Summary
Authorized Positions
State Court
FY20 Budget C-109

Superior Courts
The mission of the Superior Courts is to provide for the timely, effective and legally correct resolution of civil
disputes, criminal prosecutions, appellate and equity matters in the furtherance of justice and in compliance
with the Constitution and the laws of the State of Georgia. The Superior Courts also supports and oversees the
operation of programs and functions within the Superior Courts’ authority.
Probation Services
The mission of Probation Services is to be a leader in community corrections, working with the judiciary and
the community to create a safer society. Probation Services is committed to providing the courts with quality
information while offering viable, cost‐effective sentencing and pretrial options. Through a balance of
compliance enforcement and treatment strategies, offenders are held accountable and afforded opportunities
to become productive, law‐abiding citizens. Probation Services provides offender management for Felony
Drug Court, Treatment and Accountability Court, Veterans Court, DUI/Drug Court, and the Solicitor’s Pretrial
Intervention Program. Probation Services also provides enhanced supervision of Domestic Violence cases
under a Violence Against Women (VAWA) grant and operates the full‐service Athens Drug Lab.
Felony Drug Court
The mission of the Western Judicial Circuit Felony Drug Court is to provide an alternative means for addressing
substance abuse offenses through a judicially supervised regimen of treatment for chemically dependent
offenders with the goal of yielding sober, law‐abiding citizenry, thereby reducing the cost and negative effect
on the community while resolving public safety issues.
Mental Health Treatment and Accountability Court
The mission of the Treatment and Accountability Court is to increase public safety and make more effective
use of resources, in cooperation with local mental health providers, by providing judicial supervision to
offenders with mental illness, thereby reducing criminal behavior, reducing arrests and jail time; effectively
treating and monitoring individuals with mental illness and improving the quality of life for individuals and
their families.
Veterans Treatment Court
The mission of the Western Judicial Circuit Veterans Treatment Court is to provide support and accountability
that empowers Veterans to regain and maintain productive, responsible lives.
Alternative Dispute Resolution
The mission of the Alternative Dispute Resolution Program for the Tenth Judicial District is to provide an
alternative method of resolving disputes in cases filed in Superior, State, Magistrate and Probate Courts of
Athens‐Clarke, Oconee, Madison, Hart, Elbert, Franklin, Walton, Newton, and Oglethorpe counties. Judges in
these counties assign appropriate cases for mediation in conformity with state law and local rules established
by the Board of Directors for the ADR program. The ADR Program staff also coordinates the Divorcing Parents
Programs in Athens‐Clarke and Oconee counties for spouses filing for divorce who have children under 18
years of age.
Law Library
The mission of the Athens‐Clarke County Law Library is to provide free use of legal research materials including
statutes, digests and case law in an effort to promote equal access to court services. The Law Library’s primary
Mission
Superior Court
FY20 Budget C-110

purpose is for legal research, but it also has facilities for meetings and serves as the center for self‐represented
litigants.
To maintain or increase current disposition rates for Superior Court civil and criminal cases.
To increase response times, participation, rehabilitative services and compliance through alternative programs such as Alternative Dispute Resolution, Felony Drug Court, Mental Health Treatment and Accountability Court, Veterans Court and Probation Services.
Increase positive community relations and the professional knowledge of court staff and participants while ensuring equal access to court services.
Increase program participation for qualified participants in the Felony Drug Court, Mental Health Treatment and Veterans Court and increase the direct contact and supervision provided to participants of these programs and Probation Services to ensure program conformity and fidelity.
To establish a Steering Committee to build community support and awareness to all of the Accountability Courts.
Formation of a Judicial Council to hold regular meetings to address Criminal Justice Reform.
Actual Forecast
CY16 CY16 CY17 CY18 CY19
Criminal Cases Filed 2,527 2,500 2,504 2,675 2,675
Civil Cases Filed 2,289 2,400 2,165 2,650 2,650
Actual Forecast
FY15 FY16 CY17 CY18 CY19
Number of New Accountability Court Participants 44 44 121 113 117
Number of Accountability Court Graduates 17 19 69 64 67
Average Number of Misdemeanor Probation Cases and Active Warrants
2,900 2,500 4,000 4,000 4,000
Average Number of Pre‐trial Probation Cases 350 350 600 600 600
Objectives
Performance Measures
Superior Court
FY20 Budget C-111

Outcomes and Performance Measures
Current Goal 2017 2018 Proj. 2019 Trend
Comments or Analysis
Court Case Data
Superior Court Cases Fiscal Year
Data only
335 382 328Down
Finacial Assessments ordered in dollars
Data only
$120,444 $66,482 80,068Up
Percentage of assessments collected by probation
65% 67% 80% 76%Down
Community Service Hours Completed
Data only
6,430 5,700 5,717Up
State Court Cases Fiscal YearData only
1,366 1,337 1,340Up
Finacial Assessments ordered in dollars
Data only
$661,444 $431,263 $461,876Up
Percentage of assessments collected by probation
65% 65% 78% 92%Up
Community Service Hours Completed
Data only
55,513 60,128 40615Down
Municipal Court Cases Fiscal Year
Data only
610 711 694Down
Finacial Assessments ordered in dollars
Data only
$379,718 $399,303 $320,364Down
Percentage of assessments collected by probation
65% 71% 69% 71%Up
Community Service Hours Completed
Data only
22,033 12,015 20,200Up
Total number of staff-FTData only
21 21 21
Total number of staff-PT/NBData only
2 3 3
Total expenses ($)Data only
1,678,132$ 1,601,968$ 1,700,209$ Up
Pay Adjustment
Revenue ReceiptsData only
997,250$ 924,982$ 865,364$ Down
Supervision Fees, Program Fees, Electronic Monitoring Fees, Drug Test Fees
Percentage of revenue offset relative to expenses
Data only
59% 58% 61%Down
Goal: Increase by 5% or more
Number of cases closed successfully
Data only
1,570 1,509 PendingProbationer completed conditions or case was modified.
Number of cases closed unsuccessfully
Data only
679 490 PendingProbationer did not complete conditions or were in warrant status/revoked.
Percentage of successful casesData only
51% 68% Pending Goal: Increase by 5% or more
Samples tested by Fiscal YearData only
17,512 19,817 20,482Up
Individual urine samples tested. Goal: Increase by 5% or more.
Assays performedData only
117,469 148,893 149,600Up
Specific tests for drugs within the samples. Goal: Increase by 5% or more.
Probation Services
WE PROVIDE A COST-EFFICIENT WORKFORCE
CASE MANAGEMENT
Drug Testing
Superior Court
FY20 Budget C-112

The FY20 Approved Budget for Superior Court includes operations in the General Fund, the Alternative Dispute
Resolution (ADR) Fund, and the Special Programs Fund (Law Library).
General Fund
The Superior Court budget includes the conversion of a part‐time Lab Assistant position to fulltime ($23,761). The position is anticipated to generate an additional $12,500 of revenue.
The General Fund budget also reflects funding of $150,000 to move the Felony Drug Court from the Special Programs Fund to the General Fund. The Felony Drug Court had been supported by Drug Abuse Treatment and Education (DATE) funds. However, these funds are no longer sufficient to cover the program.
The Approved Budget includes funding of $40,000 for Court Assessments.
The Superior Court requested $67,500 for Veteran’s Court Program Coordinator be budgeted to move to the General Fund. This request was not recommended nor approved.
ADR Fund
This program operates in a separate fund and all costs are recovered by revenues from fees charged to participating judicial circuits, which currently include the Alcovy, Northern and Western judicial circuits.
The FY20 Budget for the ADR Program reflects no significant changes.
Special Programs Fund
In previous years, the Superior Court budget in the Special Programs Fund included both the Law Library and the Felony Drug Court. However, funding for the Felony Drug Court was approved to move to the General Fund.
There are no significant changes for the Law Library.
Budget Highlights
Superior Court
FY20 Budget C-113

(All figures in $1,000s) FY18 FY19 FY20 FY20
Appropriations by Type Actual Budget Requested Approved $▲ %▲Salary & Benefits $2,364.9 $2,431.5 $2,497.2 $2,457.6 $26.1 1.1%
Operating $1,354.2 $1,109.1 $1,065.1 $1,105.1 ($4.0) ‐0.4%
Total $3,719.1 $3,540.6 $3,562.3 $3,562.7 $22.1 0.6%
FY18 FY19 FY20 FY20
Appropriations by Division Actual Budget Requested Approved $▲ %▲Administration $3,139.7 $3,000.6 $3,030.9 $3,031.3 $30.7 1.0%
Superior Court One $107.4 $127.9 $127.9 $127.9 $0.0 0.0%
Superior Court Two $249.6 $139.6 $139.6 $139.6 $0.0 0.0%
Superior Court Three $122.5 $166.5 $166.5 $166.5 $0.0 0.0%
Superior Court Four $99.9 $106.0 $97.4 $97.4 ($8.6) ‐8.1%
Total $3,719.1 $3,540.6 $3,562.3 $3,562.7 $22.1 0.6%
FY18 FY19 FY20 FY20
Appropriations by Fund Actual Budget Requested Approved $▲ %▲General Fund $2,918.3 $3,037.6 $3,238.0 $3,238.4 $200.8 6.6%
Alternative Dispute Res. Fd. $163.2 $192.6 $202.4 $202.4 $9.8 5.1%
Special Programs Fund $242.2 $310.4 $121.9 $121.9 ($188.5) ‐60.7%
Grants Fund $395.4 $0.0 $0.0 $0.0 $0.0 ‐‐
Total $3,719.1 $3,540.6 $3,562.3 $3,562.7 $22.1 0.6%
FY20 FY20
FY18 FY19 Requested Approved ▲Fulltime Authorized Positions 34 34 36 35 1
Appropriation Summary
Authorized Positions
Superior Court
FY20 Budget C-114

Appraise all property located in Athens‐Clarke County at its fair market value to ensure that taxpayers pay
no more than their fair share of property taxes.
Achieve fair and equitable valuations of all properties within state mandated specifications.
Produce a statutorily acceptable digest by August 1 of each year.
Maintain a level of assessment (assessed value/sales ratio) between 38% and 42%. (State requirement
range is 36% ‐ 44%)
Maintain a uniformity of assessment (coefficient of dispersion) not to exceed a range of 10% above or below the median ratio (state requirement is less than 15%)
Maintain an assessment bias relationship (price related differential) close to 1.00. (State requirement range is 0.95 – 1.10)
Prepare and send change of assessment notices by first week of May each digest year.
Mission & Goals
Objectives
Tax Assessor
FY20 Budget C-115

The FY20 Budget for the Tax Assessor’s office is $1.1 million.
$27,165 is included for purchase of Mobile Assessor, computer‐assisted mass appraisal system.
An applied position vacancy estimate has reduced personal service expense by $16,000.
Outcomes and Performance Measures Goal FY13 FY14 FY15 FY16 FY17 FY18
Comments or Analysis
Number of Real Parcels Data Only 41,802 41,871 41,861 41,805 41,828 41,775 Annual digest countNumber of Personal Property Accounts Data Only 5,169 5,209 5,216 5,277 5,415 5,451 Annual digest countNumber of Mobile Homes Data Only 2,517 2,516 2,514 2,496 2,497 2,498 Annual digest count
Maintain Level of Assessment (FMV) 38%-42% 39.53 39.96 40.58 39.39 39.29 *Unknown Mandated by State of GeorgiaMaintain Level of Uniformity < 15% 10.21 3.20 8.81 8.90 8.54 *Unknown Mandated by State of GeorgiaMaintain Level of Assessment Bias .95 - 1.10 102.26 100.61 101.24 101.58 100.66 *Unknown Mandated by State of GeorgiaGeorgia Department of Audit Ratio Study
Pass, no findings
Pass, no findings
Pass, no findings
Pass, no findings
Pass, no findings
Pass, no findings *Unknown Mandated by State of Georgia
Complete fieldwork reviews by February 1 each year > 95% 97% 97% 97% 98% 98% 98%
Necessary deadline in producing of tax digest each year
Complete deed transactions reviews by Feb 1 each year > 95% 95% 95% 96% 97% 98% 99%
Necessary deadline in producing of tax digest each year
Complete mapping updates by Feb 1 each year > 95% 97% 97% 96% 97% 98% 98%
Necessary deadline in producing of tax digest each year
Complete Personal Property accounts to send notices by first week of May each year > 95% 100% 99% 99% 99% 96% 99%
Necessary deadline in producing of tax digest each year
Complete ratio analysis to send notices by first week of May each year > 98% 100% 100% 100% 100% 100% 100%
Necessary deadline in producing of tax digest each year
Process appeals within 180 days of receipt < 180 100% 100% 100% 100% 100% 100%
State requirement for processing appeals in timely manner
Produce timely and acceptable tax digest
August 1 each year Met Met Met Met Met Met
State requirement for tax digest submission is September 1 each year
Tax Assessor
Appraise all property located in Athens-Clarke County
Achieve fair and equitable valuations of all properties according to state mandated specifications
Produce a statutorily acceptable digest each year so tax bills can be mailed in a timely manner
* 2018 Statistics not available from state until May 2019.
Performance Measures
Budget Highlights
Tax Assessor
FY20 Budget C-116

(All figures in $1,000s) FY18 FY19 FY20 FY20
Appropriations by Type Actual Budget Requested Approved $▲ %▲Salary & Benefits $975.4 $997.3 $997.2 $981.2 ($16.1) ‐1.6%
Operating $100.0 $120.2 $148.1 $148.1 $27.9 23.2%
Total $1,075.4 $1,117.5 $1,145.3 $1,129.3 $11.8 1.1%
FY20 FY20
FY18 FY19 Requested Approved ▲Fulltime Authorized Positions 13 13 13 13 0
Appropriation Summary
Authorized Positions
Tax Assessor
FY20 Budget C-117

The overall goal of the Office of the Tax Commissioner is to provide effective and accountable tax administration to the citizens of Athens‐Clarke County in a fair and courteous manner. The Property Tax Division is involved in the preparation of the digest, collection of ad valorem tax on real and personal property, disbursements of these collections to the levying authorities, and final audit of these transactions. The Delinquent Tax Division’s mission is to maximize collection of ad valorem tax by working with taxpayers in financial difficulty and maintaining an ongoing levy program. We use all legal measures to collect delinquent tax from those who willfully refuse to pay. The Motor Vehicle Division ‐‐ Services provided by this division are: (1) registration and titling of vehicles, collection, and disbursements of related taxes and fees; (2) advise taxpayers of legal means of transferring vehicle ownership and proper registration and titling procedures; and (3) assist law enforcement in identifying vehicle ownership.
Process property tax payments within 24 hours of receipt
Disburse payments received within one week in off peak season and within two weeks in the peak season as required by O.C.G.A.
Collect, process and disburse 91% of property taxes billed within 30 days of due date
Collect, process and disburse 98.5% of property taxes billed by the end of the fiscal year
Process and (re)bill errors, releases and Not on Digest (NOD’s) within seven working days
Process motor vehicle dealer mail within 24‐48 hours of receipt
Turn around individual taxpayer mail within 48 hours
Process walk‐in business in 15 minutes or less for DMV and five minutes or less for property tax
Answer phones by third ring
Actual Forecast
FY16 FY17 FY18 FY19 FY20
Property Tax Bills ‐ Real/Personal 45,866 46,003 46,023 46,000 46,000
Delinquent Tax Billing 8,011 12,166 4,018 9,000 9,000
Homestead Applications Maintained 15,834 15,717 15,739 16,000 16,200
Tax Returns Received/Processed 1,586 1,526 1,503 1,600 1,600
Tax Sale Operations/ Fi‐Fa. Issued 926 1,858 848 1,900 1,900
Vehicle Registration Services 90,962 106,904 108,342 107,000 107,000
Vehicle Miscellaneous Services 12,364 5,757 5,828 8,000 8,000
Mobile Homes Billed 1,824 1,801 1,814 1,825 1,825
Vehicle Title Services 19,921 22,080 20,046 21,000 21,000
Mission
Objectives
Performance Measures
Tax Commissioner
FY20 Budget C-118

The FY20 Budget for the Tax Commissioner’s office, $1.5 million, reflects no significant changes to services
or programs.
An applied position vacancy estimate reduced personal service expense by $17,200.
(All figures in $1,000s) FY18 FY19 FY20 FY20
Appropriations by Type Actual Budget Requested Approved $▲ %▲Salary & Benefits $1,267.9 $1,324.0 $1,346.6 $1,329.4 $5.4 0.4%
Operating $167.8 $210.7 $210.7 $210.7 $0.0 0.0%
Total $1,435.7 $1,534.7 $1,557.3 $1,540.1 $5.4 0.4%
FY18 FY19 FY20 FY20
Appropriations by Division Actual Budget Requested Approved $▲ %▲Administration $189.7 $203.3 $201.0 $200.0 ($3.3) ‐1.6%
Property Tax $401.9 $445.9 $451.7 $446.0 $0.1 0.0%
Motor Vehicle $684.7 $706.2 $722.8 $714.5 $8.3 1.2%
Delinquent Tax $159.4 $179.3 $181.8 $179.6 $0.3 0.2%
Total $1,435.7 $1,534.7 $1,557.3 $1,540.1 $5.4 0.4%
FY20 FY20
FY18 FY19 Requested Approved ▲Fulltime Authorized Positions 19 19 19 19 0
Budget Highlights
Appropriation Summary
Authorized Positions
Tax Commissioner
FY20 Budget C-119

The mission of the Transit Department is to provide safe, courteous, cost effective efficient public transportation services to the citizens of Athens‐Clarke County.
Transit is to provide transportation to employment, educational, medical, shopping, cultural, and other
resource centers for community members, with special attention to those who do not have access to other modes of transportation. a) To identify areas with transit dependent block groups that have an above average propensity to use
transit by assessing census data. b) Recommend change on a system wide basis to better address the needs of citizens. c) Emphasize regional connections for all ground transportation. d) Position Athens Transit as a strong alternative to automobiles by providing more frequency of service,
longer hours of service, multiple transfer options, and more direct routes with shorter travel times.
Transit provides solutions to help improve citizen mobility within Athens‐Clarke County. a) Identify neighborhoods that are underserved and develop service plans. b) Attempt to improve air quality by reducing traffic congestion along specific corridors.
ATS operates in such a manner that is cost effective.
a) Continue to pursue dedicated funding sources for transit services. (Examples; local option sales tax, gasoline tax, etc.)
b) Develop alternative revenue sources that have the least impact on local community tax payers. c) Create a fare structure that is economically feasible for people with low incomes. d) Utilize SPLOST and TSPLOST funding to supplement capital expenses. e) Thoroughly investigate, acquire and implement new technology to achieve operating cost savings.
Continue to foster the ATS and UGA transit services interface in order to achieve community goals. a) Continue to coordinate with Campus Transit to avoid duplication of transit services. b) Develop specific services in conjunction with Campus Transit, tailored to meet the needs of UGA
affiliated passengers. Reduce the need for parking facilities within the CBD and UGA campus therefore allowing maximum
utilization of land for more productive purposes. a) Educate employers, the business community and citizens about the economic benefits of Athens
Transit. b) Encourage more partnerships with employers and business communities. c) Develop park‐n‐ride sites with direct service to the CBD and UGA campus.
SERVICE GOALS
Fixed Route Service – “The Bus” Provide safe, timely transit services to our community and a safe service environment for customers and
employees. Ensure that safe, clean, well‐maintained vehicles are available to operate all trips as scheduled. Achieve a high level of rider satisfaction and an on‐time performance rate that exceeds 95%. Maximize fare revenue, while providing economical services. Limit the cost of providing service by generating more revenue. Increase community awareness and encourage use of available transit service.
Mission
Goals & Objectives
Transit
FY20 Budget C-120

Implement innovative route and scheduling methods to reduce cost and promote increased ridership. Paratransit Demand Response – “The Lift” Limit the increasing cost of providing service by ensuring only qualified individuals are permitted to use the
service. Achieve a high level of rider satisfaction and an on‐time performance rate that exceeds 95%. Optimize scheduling to effectively utilize resources. Implement innovative route and scheduling methods to reduce cost and promote increased ridership.
Transit Performance Measure Goal FY15 FY16 FY17 FY18 FY19 (Proj.) FY20 (Proj.)
Total Passengers Fixed‐Route
increase
by 3%1,555,318 1,508,601 1,603,837 1,651,952 1,701,511 1752556
Passenger Revenue*
increase
by 3% $ 1,951,602 $ 1,850,187 $ 1,858,368 $ 1,914,119 $ 1,971,543 $ 2,030,689
Revenue Miles
increase
by 3%761,055 818,720 868,972 895,041 921,892 949549
Revenue Hours
increase
by 3%65,983 71,285 75,038 77,289 79,608 81996
Passengers/Mile
increase
by 3%2.04 1.84 1.85 1.91 1.96 2
Passengers/Hour
increase
by 3%23.57 21.16 21.37 22.01 22.67 23
Revenue/Mile
increase
by 3% $ 2.56 $ 2.26 $ 2.14 $ 2.20 $ 2.27 $ 2.34
Revenue/Hour
increase
by 3% $ 29.58 $ 25.95 $ 24.77 $ 25.51 $ 26.28 $ 27.07
Total Passengers Demand
Responseincrease
by 3%6,793 6,822 6814 $7,018 $7,229 7446
Passenger Revenue*increase
by 3% $ 23,595 $ 23,705 $ 22,837 $ 23,522 $ 24,228 $ 24,955
Revenue Milesincrease
by 3%55,541 59,843 56875 58581 60339 62149
Revenue Hoursincrease
by 3%5,138 5,354 5,509 5674 5844 6020
Passengers/Mileincrease
by 3%0.12 0.11 0.12 0.12 0.13 0
Passengers/Hourincrease
by 3%1.32 1.27 1.27 1.31 1.35 1
Revenue/Mileincrease
by 3%$0.42 $0.40 0 0.41 0.42 $ 0.44
Revenue/Hourincrease
by 3% $ 4.59 $ 4.43 $ 4.15 $ 4.27 $ 4.40 $ 4.53
Miles/Tripincrease
by 3% $ 8.18 $ 8.77 $ 8.35 $8.60 $8.86 $ 9.12
Overall Ridership 1555318 1508601 1603837 1651952 1668472 1718526
Performance Measures
Transit
FY20 Budget C-121

Projected FY20 Revenue is $5.7 million, an increase of $169,000 from FY19 Budget.
Federal funding is estimated to be $2.6 million in FY20, $70,000 above FY19 Budget.
Fare box revenue, $531,000, & contributions from UGA, $647,000, are projected to be $1.2 million, similar
to FY19.
Fare free transit service for senior citizens and disabled passengers, $85,000, and for ACCGOV employees,
$9,000, has been included, reducing requested fare box revenue by $94,000.
The General Fund contribution to Transit Enterprise Fund is $1.8 million, increasing by $103,500 over FY19,
to support the fare box revenue reduction of $94,000 & bus stop improvements of $9,500.
Use of $1.5 million of Available Unrestricted Net Position is planned for FY20.
Expenses (less depreciation of $2.9 million) are projected at $7.2 million, an increase of $583,709.
$50,992 is included to convert seven part‐time Transit Vehicle Operator positions to four full‐time
positions to help stabilize staffing.
$9,500 is included for bus stop improvement (funded by SPLOST 2005 & 2011) support by converting two
part‐time Transit Facility Service Worker positions to two full‐time positions & reducing solid waste
collection expenses by $60,000.
A full year of funding of 2 full‐time positions is included for:
- 1 Transit Education/Outreach/Marketing Coordinator (authorized for 9 months in FY19)
- 1 Transit Safety & Training Coordinator (authorized for 6 months in FY19)
The FY20 Budget includes the Transit Planning Grant of $92,800, similar to FY19, which funds a Planner II
position.
For more information on the Transit Fund, see page E‐26.
Budget Highlights
Transit
FY20 Budget C-122

(All figures in $1,000s) FY18 FY19 FY20 FY20
Appropriations by Type Actual Budget Requested Approved $▲ %▲Salary & Benefits $3,882.5 $4,146.9 $4,965.5 $4,782.8 $635.9 15.3%
Operating $1,192.1 $1,448.0 $1,564.4 $1,442.4 ($5.6) ‐0.4%
Total $5,074.6 $5,594.9 $6,529.9 $6,225.2 $630.3 11.3%
FY18 FY19 FY20 FY20
Appropriations by Division Actual Budget Requested Approved $▲ %▲Administration $386.3 $672.30 $636.30 $631.40 ($40.9) ‐6.1%
Operations $3,465.2 $3,592.9 $4,455.1 $4,185.3 $592.4 16.5%
Demand Response $304.6 $320.5 $380.1 $360.1 $39.6 12.4%
Maintenance $918.5 $1,009.2 $1,058.4 $1,048.4 $39.2 3.9%
Total $5,074.6 $5,594.9 $6,529.9 $6,225.2 $630.3 11.3%
FY18 FY19 FY20 FY20
Appropriations by Fund Actual Budget Requested Approved $▲ %▲Transit Fund $5,074.6 $5,504.5 $6,437.2 $6,132.4 $627.9 11.4%
Grants Fund $0.0 $90.4 $92.7 $92.8 $2.4 2.7%
Total $5,074.6 $5,594.9 $6,529.9 $6,225.2 $630.3 11.3%
FY20 FY20
FY18 FY19 Requested Approved ▲Fulltime Authorized Positions 68 71 80 77 6
Appropriation Summary
Authorized Positions
Transit
FY20 Budget C-123

Transportation & Public Works is committed to the responsible planning, construction, maintenance, and
operation of a transportation network that is effective and safe for people using all modes of transportation.
Further, Transportation & Public Works is dedicated to a stormwater management program that improves
both the conveyance of stormwater and the quality of our streams and rivers while running an effective and
responsive utility.
The Department strives to provide an effective and safe transportation network for people using all modes
through the following:
Provide a proactive asset management program to key transportation infrastructure including pavement,
bridges, traffic signals, pavement markings, and signs
Provide safe and efficient roadways
Provide effective and connected bicycle and pedestrian networks that are comfortable and safe for all
users
Provide safe, clear, efficient, and effective traffic control and guidance systems
Provide proactive and responsive maintenance to transportation systems
Promote high quality, safe, effective and environmentally sensitive development in the community
Oversee the effective and cost efficient construction of transportation improvements
Provide prompt emergency response that serves the needs of Athens‐Clarke County
The Department strives to provide an effective stormwater program through the following:
Provide a proactive asset management program to key stormwater infrastructure including dams,
detention facilities, culverts, and stormwater collection systems
Provide safe and efficient public storm water collection and conveyance systems
Operate a utility that is cost efficient, effective, and responsive
Identify safety and operational deficiencies in drainage systems and deliver corrective solutions in a timely
manner
Transportation:
Provide major roadway maintenance (resurfacing) to at least 5.8% (70 lane‐miles) of ACC lane miles to
provide a sustainable life cycle program (10 years for arterials, 15 years for collectors, and 20 years for
local roadways)
Replace approximately one bridge every 1.5 years to provide sufficient structures
Rebuild approximately 8% (7) traffic signals annually to provide a reliable and effective signal system
Upgrade 8%, approximately 2,750, of all road signs on an annual basis to ensure proper reflectivity
standards of all signs
Complete plans review for new development within fourteen (14) days of submittal
Complete 95% of street work requests within three (3) days of receiving the request
Mission
Goals
Objectives
Transportation & Public Works
FY20 Budget C-124

Stormwater:
Develop and implement an asset management program for piped stormwater systems
Continue implementation of Stormwater Master Plan
Maintain stormwater utility bill collection to average at least 92% yearly
Provide a cost effective stormwater utility that maximizes public investment
Performance Measure Goal FY15 FY16 FY17 FY18 FY19* Comments
Lane-miles inspected for pavement condition as % of all lane-miles
> 67% 67% 67% 67% 0% 100%Plan to automate inspections by end of FY19.
Lane-miles receiving major roadway maintenance as % of all lane-miles (resurfacing, full-depth reconstruction, etc.)
> 5.8% 1.6% 1.8% 1.7% 2.0% 8.7%Increase based on TSPLOST funding anticipated to continue
Lane-miles receiving minor roadway maintenance as % of all lane-miles (crack seal, chip seal, patching, etc.)
>11.7% 7.5% 10.0% 11.1% 5.8% 2.0%Lower numbers to prioritize major resurfacing projects
Lane-miles in good or excellent condition as % of all lane-miles
> 70% 47% 47% 44% 44% 46%FY18 number assumed. To be updated by end of FY19
Average bridge sufficiency rating > 80 77.9 77.9 78.2 78.2 78.2Current score from 2017 GDOT report. To be updated in 2019 report.
Number of traffic signal rebuilds as % of all ACC traffic signals
> 8% 1.8% 1.2% 1.2% 3.3% 4.4%3 traffic signals rebuilt in FY18
Average traffic signal age Data Only 23 23 23 24 24One third of ACC signals exceed age of 39-years
Cabinet equipment preventative maintenance inspections % of all signals
100%New
FY16100% 100% 90% 56%
Preventative maintenance inspections of field equipment as % of all traffic signals
> 50%New
FY1640% 30% 85% 30%
Traffic Signal Maintenance Devices Per Technician
≤ 40 52 55 61 62 53Lower number from Fiber Technician approved in FY19 budget for Q4
Number of traffic signal work orders Data Only 1094 1228 1045 1198 116438% increase since FY14 likely due to aging infrastructure
Centerline miles of roadway striping installed as % of centerline miles
> 12% 5.0% 2.0% 4.3% 6.0% 6.5%FY20 projections will be higher as Pavement Program increases volume
Number of signs replaced as percentage of all signs
> 8% 5.5% 3.0% 5.0% 5.0% 6.4%Many signs are older and noncompliant with MUTCD rero-reflectivity standards.
Average response time (days) for immediate roadway work requests
< 3 days 1.4 0.6 1.0 1.1 1.2189 immediate roadway work requests resolved in FY18
TRANSPORTATIO
N
Our staff is committed to the responsible planning, construction, and maintenance of a transportation network
FY19 projected decrease due to 2 signal tech vacancies which caused Traffic to prioritize work order response over PM inspections
Performance Measures
Transportation & Public Works
FY20 Budget C-125

Performance Measure Goal FY15 FY16 FY17 FY18 FY19* Comments
% dead animals removed within 24-hours of notice
100% 100% 100% 100% 100% 100%All 484 dead animals removed in FY18 within 24-hour notice
Number of immediate roadway work requests completed in 3 days as % of all requests
> 90% 90.2% 96.3% 91.1% 93.2% 90.0%Slight decreased due to volume of capital projects
Overall arterial level of service (LOS) C Developing work flow
Million vehicle miles traveled Data Only 1070 1120 1105 1149 1195FY18 represents a 15% increase from FY14
Total pedestrian network mileage as percent of overall roadway network
Data Only 31.9% 32.0% 32.3% 32.4% 32.4%720-feet of sidewalk anticipated in FY19
Total bicycle network mileage as percent of overall roadway network
> 51% 12.5% 12.6% 12.8% 12.8% 12.8%Additional facilities were on hold pending completion of Athens in Motion Plan.
Crashes / 100 million vehicle miles traveled
Decrease FPY
688 527 494 603 545
Fatalities (sum of reported vehicular, bicycle, and pedestrian)
Decrease FPY
9 16 11 8 7
Serious Injuries (sum of reported vehicular, bicycle, and pedestrian)
Decrease FPY
1178 1347 1298 1127 1059
Number of pedestrian-related crashesDecrease
FPY49 66 57 75 70
Number of bicycle-related crashesDecrease
FPY35 16 26 33 31
TRANSPORTATIO
N
that is effective
and safe for all modes of transportation.
New in FY20
Q1 and Q2 crash numbers appear lower than previous years by about 6%. Possibly due to combination of distracted driving law and regression to the mean. Final numbers pending verification of crash reports and data compilation.
Performance Measure Goal FY15 FY16 FY17 FY18 FY19* Comments
Stormwater Pipe in Good or Excellent Condition as % of pipe
Developing work flow
Number of linear feet of stormwater pipe rehabilitated/replaced
Data Only 462 1028Clayton Street and failing pipe replacements increased feet of pipes replaced
Number of miles of shoulder and ditch maintenance completed as % of total miles
> 20% 11.1% 10.6% 5.1% 7.7% 10%Moderate FY18 increase projected to continue into FY19
% inspection of stormwater drains in public right of way
100% 100% 100% 100% 86% 90%Lower numbers as staff was out on FMLA and inclement weather impaired inspections
Number of flooding-related work requests
Data Only Developing work flow
Average response time (days) for immediate stormwater work requests
< 3 days 1.8 0.6 0.6 0.8 0.8
Number of immediate stormwater work requests completed in 3 days as % of all requests
> 90% 86% 98% 97% 94% 95.7%
Further, we are dedicated to a stormwater management program that improves both the conveyance of stormwater
New in FY20
New in FY18
New in FY20
828 immediate stormwater work requests resolved in FY18
ST
OR
MW
AT
ER
Transportation & Public Works
FY20 Budget C-126

Transportation and Public Works is funded through two funds, the General Fund and the Stormwater Fund.
The General Fund supports Administration, Traffic & Operations, Engineering, and Streets & Drainage. The
Stormwater Fund supports Engineering, Streets & Drainage, and Stormwater Management for stormwater
projects.
An additional fulltime Pavement Management Program Inspector is approved for FY20 and is to be funded
through the TSPLOST program.
General Fund
A vacancy estimate is approved, reducing General Fund Personal Services expenses by $90,300.
The budget includes $6,000 for operating needs for the Intelligent Transportation Systems Technician
position.
Stormwater Fund
Increased User Fees in the Stormwater Fund will generate approximately $7,500 in additional revenue.
For more information on the Stormwater Fund, see page E‐30.
Performance Measure Goal FY15 FY16 FY17 FY18 FY19* Comments
Number of sampling locations within Georgia EPD thresholds as % of all sampling locations
Developing work flow
Number of Illicit Discharge Complaints Data Only 99 72 43 66 44
% of Illicit Discharge Complaints responded to in 48 hours
100% 100% 100% 100% 100% 100%
Cubic yards of waste removed from stormwater system
Data Only 595.5 600As required by NPDES Phase II Permit
Utility bill collection rate > 95% 98% 96% 91% 93% 92%Projection pending final collections
% credit card payments > 4.6% 2.8% 6.4% 3.8%ClickToGov projected to increase
Monthly stormwater rate per 1,000 square feet
< $1.91 $1.34 $1.34 $1.34 $1.34 $1.34 Utility Fee Review ongoing
Number of impervious surface appeals reviewed
Data Only 103 243 286 51 36Peak reviews from impervious surface audit
Number of new credit applications approved
Data Only 2 1 1 1 0Utility Fee Review looking for ways to increase
ST
OR
MW
AT
ER
*FY19 numbers projected based on data collected from Q1 and Q2
New in FY18
New in FY17
while running an effective and responsive utility.
New in FY20
and the quality of our streams and rivers.
As required by NPDES Phase II Permit
Budget Highlights
Transportation & Public Works
FY20 Budget C-127
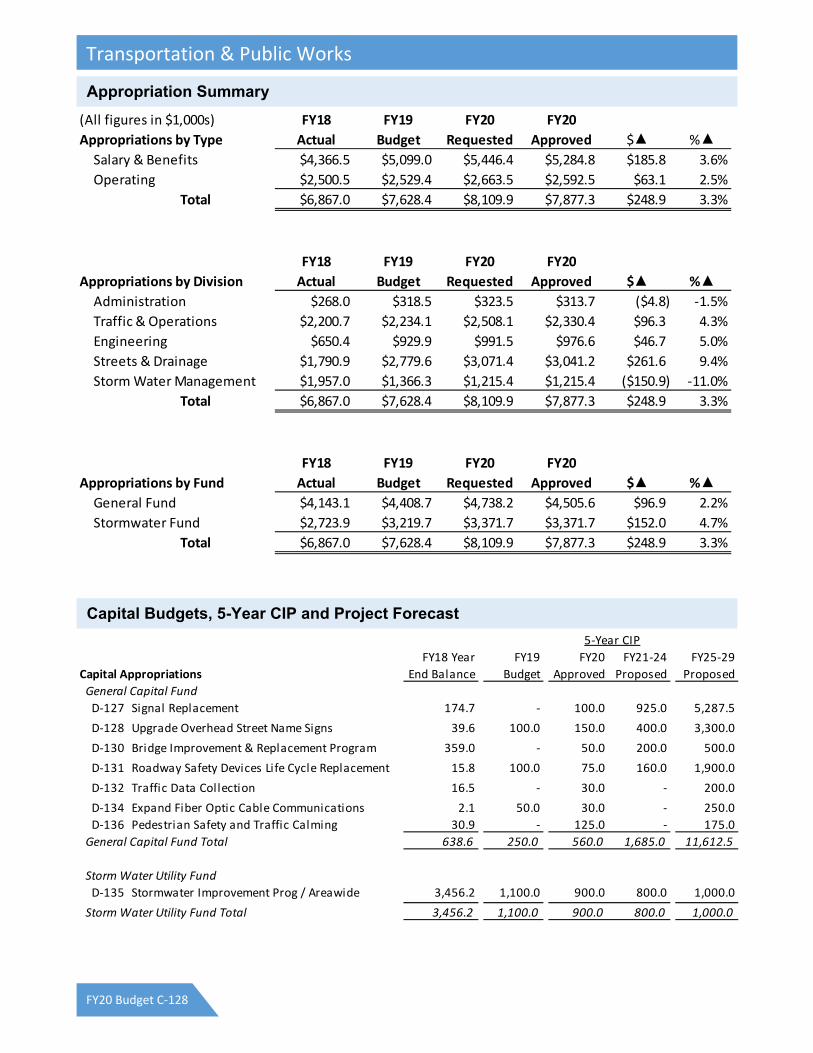
(All figures in $1,000s) FY18 FY19 FY20 FY20
Appropriations by Type Actual Budget Requested Approved $▲ %▲Salary & Benefits $4,366.5 $5,099.0 $5,446.4 $5,284.8 $185.8 3.6%
Operating $2,500.5 $2,529.4 $2,663.5 $2,592.5 $63.1 2.5%
Total $6,867.0 $7,628.4 $8,109.9 $7,877.3 $248.9 3.3%
FY18 FY19 FY20 FY20
Appropriations by Division Actual Budget Requested Approved $▲ %▲Administration $268.0 $318.5 $323.5 $313.7 ($4.8) ‐1.5%
Traffic & Operations $2,200.7 $2,234.1 $2,508.1 $2,330.4 $96.3 4.3%
Engineering $650.4 $929.9 $991.5 $976.6 $46.7 5.0%
Streets & Drainage $1,790.9 $2,779.6 $3,071.4 $3,041.2 $261.6 9.4%
Storm Water Management $1,957.0 $1,366.3 $1,215.4 $1,215.4 ($150.9) ‐11.0%
Total $6,867.0 $7,628.4 $8,109.9 $7,877.3 $248.9 3.3%
FY18 FY19 FY20 FY20
Appropriations by Fund Actual Budget Requested Approved $▲ %▲General Fund $4,143.1 $4,408.7 $4,738.2 $4,505.6 $96.9 2.2%
Stormwater Fund $2,723.9 $3,219.7 $3,371.7 $3,371.7 $152.0 4.7%
Total $6,867.0 $7,628.4 $8,109.9 $7,877.3 $248.9 3.3%
5‐Year CIP
Capital Appropriations
FY18 Year
End Balance
FY19
Budget
FY20
Approved
FY21‐24
Proposed
FY25‐29
Proposed
General Capital Fund
D‐127 Signal Replacement 174.7 ‐ 100.0 925.0 5,287.5
D‐128 Upgrade Overhead Street Name Signs 39.6 100.0 150.0 400.0 3,300.0
D‐130 Bridge Improvement & Replacement Program 359.0 ‐ 50.0 200.0 500.0
D‐131 Roadway Safety Devices Life Cycle Replacement 15.8 100.0 75.0 160.0 1,900.0
D‐132 Traffic Data Collection 16.5 ‐ 30.0 ‐ 200.0
D‐134 Expand Fiber Optic Cable Communications 2.1 50.0 30.0 ‐ 250.0
D‐136 Pedestrian Safety and Traffic Calming 30.9 ‐ 125.0 ‐ 175.0
General Capital Fund Total 638.6 250.0 560.0 1,685.0 11,612.5
Storm Water Utility Fund
D‐135 Stormwater Improvement Prog / Areawide 3,456.2 1,100.0 900.0 800.0 1,000.0
Storm Water Utility Fund Total 3,456.2 1,100.0 900.0 800.0 1,000.0
Appropriation Summary
Capital Budgets, 5-Year CIP and Project Forecast
Transportation & Public Works
FY20 Budget C-128

FY20 FY20
FY18 FY19 Requested Approved ▲Fulltime Authorized Positions 87 88 89 89 1
Authorized Positions
Transportation & Public Works
FY20 Budget C-129

The Capital Improvement Plan (CIP) is a multi-year planning instrument used by Athens-Clarke County to identify capital projects and to coordinate the financing of these projects. Capital projects are undertaken to:
a) Maintain infrastructure and public facilities, b) Promote economic development and enhance the quality of life, c) Enhance the delivery of services, d) Preserve community and historical assets and e) Improve economically depressed areas and / or those areas with low and moderate income households.
For budgeting and accounting, a capital project is defined as an individual asset or project expenditure of at least $30,000 which has an expected useful life of three years or longer. It includes any vehicle requests that may increase the size of the fleet beyond its current authorized level. The Mayor and Commission must approve all capital projects and additions to the fleet.
The first year of the Capital Improvement Plan is the Capital Budget. When adopted by the Mayor and Commission, the Capital Budget formally authorizes the expenditure of funds for FY20 capital projects. Projects outlined in the remaining four years (FY21 – FY24) are for planning purposes only and are not authorized until included in an adopted Capital Budget. Furthermore, projects identified in years FY25–FY29 are listed to show a budget estimate for the next five years of future capital planning.
In accordance with the Government’s fiscal policies, once approved, the appropriation balance carries forward until the project is completed or funds have been expended.
Capital requests are classified in either of two project categories:
a) Capital for Current Services (CS) and b) Capital for Additional or Improved Services (A&I).
CS projects are designed to maintain the current capital base or the existing service level. A&I projects are intended to improve service levels or add to the capital base. Expenditures (uses) proposed for the FY20 Capital Budget total $35.2 million (page D-2). General Capital Fund projects (page D-3) total $2.2 million. The remaining capital projects in the Enterprise, Internal Service and Special Revenue Funds total $33.0 million. The FY20 Capital Budget and the Five-Year Capital Improvement Plan are summarized on pages D-3 to D-18. Detailed data sheets for individual projects begin on page D-19.
FY20 Capital Budget and Capital Improvement Plan
FY20 Budget D-1

Capital Projects for Current Services Landfill Enterprise Fund
General Fund SW Replace Bulldozer 300,000$
IT Information Technology Equipment Replacement Program 400,000$ Other Landfill Ent Fund 385,000$
PD On‐Officer Cameras and Data Storage 250,000$ Subtotal 685,000$
TPW Upgrade Overhead Street Name Signs 150,000$
Other General Fund 922,000$ All Other CS Projects 135,000$
Subtotal 1,722,000$
Current Services ‐ All Funds 32,360,800$
Fleet Replacement Fund
CS Fleet Replacement Program 3,102,000$ Capital Projects for Additions & Improvements
General Fund
Storm Water Management Enterprise Fund MGR Talent Management Software Suite (New) 165,000$
CS Stormwater Improvement Prog / Areawide 900,000$ Other General Fund 322,500$
Subtotal 487,500$
Water & Sewer Enterprise Fund
PU Rehabilitate and Replace Sewers 9,951,800$ Economic Development Capital Project Fund
PU Replace and Upgrade Facilities and Equipment 5,300,000$ OGA Economic Development Capital Program 200,000$
PU Improve Water Supply Reliability 3,500,000$
PU Rehabilitate and Replace Water Lines 2,750,000$ Water & Sewer Enterprise Fund
PU Manage and Reuse Residual Solids 1,500,000$ PU Water Transmission Grid Improvements 2,000,000$
PU W&S Lines ‐ Additions and Improvements 936,000$ Other Water & Sewer Ent Fund 200,000$
PU Meter and Water/Sewer Stub Additions 491,000$ Subtotal 2,200,000$
PU Replace Water Meters 365,000$
PU Donated W&S Additions Management 224,000$ Additions & Improvements ‐ All Funds 2,887,500$
Other Water & Sewer Ent Fund 250,000$
Subtotal 25,267,800$
Solid Waste Enterprise Fund
SW Replace Automated Refuse/Recycling Truck 200,000$
Other Solid Waste Enterprise Fund 349,000$
Subtotal 549,000$ Total FY20 Capital Budget 35,248,300$
Major Projects Capital Summary FY20 Budget D-2

Capital Improvement Plan Forecast
General Capital Projects Fund
FY18
Year End
Balance
FY19
Budget
FY20
Request
FY20
Approved
FY21
Proposed
FY22
Proposed
FY23
Proposed
FY24
Proposed
FY25‐29
Proposed
Sources:Transfers from General Fund 9,162.9 2,045.0 3,232.6 3,210.0 3,050.0 3,815.9 108,240.0Use of Fund Balance ‐ 164.5 ‐ ‐ ‐ ‐ ‐Total Sources 9,162.9 2,209.5 3,232.6 3,210.0 3,050.0 3,815.9 108,240.0
Uses:Current Services Projects Listed Below 8,403.8 1,722.0 2,962.6 2,940.0 2,940.0 3,705.9 60,605.6Additions & Improvements Projects Listed Below 759.1 487.5 270.0 270.0 110.0 110.0 47,634.4Total Uses 9,162.9 2,209.5 3,232.6 3,210.0 3,050.0 3,815.9 108,240.0
Change in Fund Balance ‐ (164.5) ‐ ‐ ‐ ‐ ‐
Current ServicesAirportD‐19 Matching Funds for Airport Capital Improvement Grants 244.1 ‐ 339.0 ‐ ‐ ‐ ‐ ‐ 1,825.0D‐20 Maintain Airport Facilities and Equipment 53.3 30.0 50.0 ‐ 25.0 25.0 25.0 25.0 315.0Airport Total 297.5 30.0 389.0 ‐ 25.0 25.0 25.0 25.0 2,140.0
Board of ElectionsD‐21 Replacing Electronic Voting Equipment ‐ ‐ 60.0 ‐ ‐ ‐ ‐ ‐ 70.0Board of Elections Total ‐ ‐ 60.0 ‐ ‐ ‐ ‐ ‐ 70.0
Central ServicesD‐23 Facilities Life Cycle Maintenance Program 308.6 1,700.0 2,349.3 ‐ 1,000.0 1,000.0 1,000.0 1,000.0 7,328.6D‐24 Deep Tine Aerator Purchase (New) ‐ ‐ 30.0 30.0 ‐ ‐ ‐ ‐ ‐D‐25 Landscaping Equipment Life Cycle Replacement 49.4 25.0 75.0 50.0 50.0 50.0 50.0 50.0 500.0D‐29 800 MHz Subscriber Radio Life Cycle 200.0 25.0 26.0 26.0 25.0 25.0 25.0 25.0 250.0D‐30 Landscape & Community Tree Program 40.7 20.0 30.0 20.0 ‐ ‐ ‐ ‐ 200.0D‐31 Parking Lot Life Cycle Maintenance & Repair ‐ 20.0 25.0 20.0 20.0 20.0 20.0 20.0 200.0D‐32 Replace Internal Support Equipment 109.1 10.0 10.0 ‐ 10.0 10.0 10.0 10.0 50.0D‐33 800 MHz Radio Infrastructure Replacement 75.0 25.0 25.0 25.0 ‐ ‐ ‐ ‐ 5,500.0D‐34 Parking Facilities 10.8 20.0 30.0 20.0 ‐ ‐ ‐ ‐ 100.0
Capital Summary by Fund
FY20 Budget D-3

Capital Improvement Plan Forecast
General Capital Projects Fund
FY18
Year End
Balance
FY19
Budget
FY20
Request
FY20
Approved
FY21
Proposed
FY22
Proposed
FY23
Proposed
FY24
Proposed
FY25‐29
Proposed
D‐35 Parking Decks Life Cycle Replacement 285.5 ‐ 90.0 ‐ ‐ ‐ ‐ ‐ 350.0D‐38 Telephone System Life Cycle Replacement 543.8 ‐ ‐ ‐ ‐ ‐ ‐ ‐ ‐D‐39 Energy Management Improvements 65.9 ‐ 20.0 ‐ ‐ ‐ ‐ ‐ 150.0Central Services Total 1,688.8 1,845.0 2,710.3 191.0 1,105.0 1,105.0 1,105.0 1,105.0 14,628.6
CorrectionsD‐41 Food Service Equipment Life Cycle Replacement 0.8 20.0 20.0 20.0 20.0 20.0 20.0 ‐ 30.0Corrections Total 0.8 20.0 20.0 20.0 20.0 20.0 20.0 ‐ 30.0
District Attorney's Office D‐43 Purchase a Special Service Vehicle 2019 Ford Explorer (New) ‐ ‐ 26.0 26.0 ‐ ‐ ‐ ‐ ‐District Attorney's Office Total ‐ ‐ 26.0 26.0 ‐ ‐ ‐ ‐ ‐
Fire ServicesD‐44 Smoke Containment System Repair 3.6 65.0 32.0 32.0 ‐ ‐ ‐ ‐ ‐D‐45 Replace Mobile Data Terminals 107.7 50.0 50.0 ‐ 50.0 50.0 50.0 50.0 250.0D‐46 Purchase Personal Protective Equipment (New) ‐ ‐ 191.9 ‐ 55.6 57.3 59.0 60.8 62.6Fire Services Total 111.3 115.0 273.9 32.0 105.6 107.3 109.0 110.8 312.6
Information TechnologyD‐47 Information Technology Equipment Replacement Program 643.8 290.0 450.0 400.0 350.0 415.0 500.0 415.0 890.0Information Technology Total 643.8 290.0 450.0 400.0 350.0 415.0 500.0 415.0 890.0
Leisure ServicesD‐48 Parks ‐ R&M Existing Facilities 42.3 ‐ 381.2 ‐ 200.0 200.0 200.0 200.0 3,646.8D‐49 Pool Repairs and Renovations 17.9 ‐ 92.6 90.0 ‐ ‐ ‐ ‐ 790.2D‐50 Bridge and Boardwalk Inspection and Replacement 32.4 ‐ 691.8 ‐ ‐ ‐ ‐ ‐ 1,156.1D‐51 Pavement Repair and Maintenance 34.5 30.0 299.2 ‐ ‐ ‐ ‐ ‐ 1,232.9D‐52 Park Equipment ‐ Replacement / Life Cycle 2.5 ‐ 99.2 50.0 ‐ ‐ ‐ ‐ 471.0D‐53 Create a Property Boundary Program 31.3 ‐ ‐ ‐ ‐ ‐ ‐ ‐ 100.0D‐58 Morton Theatre Fork Lift Replacement (New) ‐ ‐ ‐ ‐ ‐ ‐ ‐ ‐ 35.0Leisure Services Total 160.9 30.0 1,564.0 140.0 200.0 200.0 200.0 200.0 7,432.0
Capital Summary by Fund FY20 Budget D-4

Capital Improvement Plan Forecast
General Capital Projects Fund
FY18
Year End
Balance
FY19
Budget
FY20
Request
FY20
Approved
FY21
Proposed
FY22
Proposed
FY23
Proposed
FY24
Proposed
FY25‐29
Proposed
Manager's OfficeD‐62 Website & eGovernment Enhancements 67.8 10.0 55.0 15.0 ‐ ‐ ‐ ‐ 255.0D‐63 ACTV & Multimedia Production Equipment 77.3 20.0 50.0 15.0 ‐ ‐ ‐ ‐ 180.0Manager's Office Total 145.1 30.0 105.0 30.0 ‐ ‐ ‐ ‐ 435.0
Other General AdministrationD‐71 Capital Budget Contingency 514.4 ‐ ‐ ‐ ‐ ‐ ‐ ‐ 500.0Other General Administration Total 514.4 ‐ ‐ ‐ ‐ ‐ ‐ ‐ 500.0
Planning & ZoningD‐73 Update Aerial Photos ‐ ‐ ‐ ‐ ‐ ‐ ‐ ‐ 150.0Planning & Zoning Total ‐ ‐ ‐ ‐ ‐ ‐ ‐ ‐ 150.0
PoliceD‐74 On‐Officer Cameras and Data Storage 125.0 ‐ 263.0 250.0 117.0 27.7 16.0 44.2 1,315.0D‐75 Mobile Computing Replacement Program ‐ 170.0 195.0 125.0 ‐ ‐ ‐ ‐ 975.0D‐76 Replace Investigative Operations Vehicles ‐ ‐ ‐ ‐ ‐ ‐ ‐ ‐ ‐D‐77 Traffic Motorcycle Replacement 18.4 ‐ 56.0 56.0 ‐ ‐ ‐ ‐ ‐D‐78 Replace Drug Task Force Vehicles ‐ ‐ ‐ ‐ ‐ ‐ ‐ ‐ ‐D‐81 Wireless Communications (New) ‐ ‐ ‐ ‐ ‐ ‐ ‐ ‐ ‐D‐82 Replacement of TASER Conducted Energy Device (CED) Units ‐ ‐ ‐ ‐ ‐ ‐ ‐ ‐ 264.9D‐83 Maintenance of Downtown Safety Camera System ‐ 59.0 60.0 35.0 ‐ ‐ ‐ ‐ 300.0D‐85 E911 Telephone System Replacement Plan ‐ ‐ ‐ ‐ ‐ ‐ ‐ 765.9 ‐Police Total 143.4 229.0 574.0 466.0 117.0 27.7 16.0 810.1 2,854.9
SheriffD‐103 Body Worn Cameras (New) ‐ ‐ 42.0 42.0 ‐ ‐ ‐ ‐ 212.0D‐104 Replace Mobile Data Computers ‐ ‐ ‐ ‐ ‐ ‐ ‐ ‐ 76.0D‐105 Tasers and Related Equipment (New) ‐ ‐ ‐ ‐ ‐ ‐ ‐ ‐ 88.0D‐106 Replace Courthouse Security Equipment ‐ ‐ ‐ ‐ ‐ ‐ ‐ ‐ 75.0D‐107 Replace Prisoner Transport Bus ‐ ‐ ‐ ‐ ‐ ‐ ‐ ‐ 250.0Sheriff Total ‐ ‐ 42.0 42.0 ‐ ‐ ‐ ‐ 701.0
Capital Summary by Fund
FY20 Budget D-5

Capital Improvement Plan Forecast
General Capital Projects Fund
FY18
Year End
Balance
FY19
Budget
FY20
Request
FY20
Approved
FY21
Proposed
FY22
Proposed
FY23
Proposed
FY24
Proposed
FY25‐29
Proposed
TransitD‐125 Matching Funds for Transit Capital Improvement Grants 128.3 ‐ ‐ ‐ ‐ ‐ ‐ ‐ 400.0Transit Total 128.3 ‐ ‐ ‐ ‐ ‐ ‐ ‐ 400.0
Transportation & Public WorksD‐127 Signal Replacement 174.7 ‐ 619.6 100.0 250.0 250.0 175.0 250.0 5,287.5D‐128 Upgrade Overhead Street Name Signs 39.6 100.0 218.0 150.0 100.0 100.0 100.0 100.0 3,300.0D‐129 Pavement Maintenance Program 711.8 ‐ 1,099.0 ‐ 600.0 600.0 600.0 600.0 18,924.0D‐130 Bridge Improvement & Replacement Program 359.0 ‐ 50.0 50.0 50.0 50.0 50.0 50.0 500.0D‐131 Roadway Safety Devices Life Cycle Replacement 15.8 100.0 173.0 75.0 40.0 40.0 40.0 40.0 1,900.0D‐137 School Area Infrastructure 66.2 ‐ 30.0 ‐ ‐ ‐ ‐ ‐ 150.0Transportation & Public Works Total 1,367.2 200.0 2,189.6 375.0 1,040.0 1,040.0 965.0 1,040.0 30,061.5
Current Services Total 5,201.3 2,789.0 8,403.8 1,722.0 2,962.6 2,940.0 2,940.0 3,705.9 60,605.6
Capital Summary by Fund FY20 Budget D-6

Capital Improvement Plan Forecast
General Capital Projects Fund
FY18
Year End
Balance
FY19
Budget
FY20
Request
FY20
Approved
FY21
Proposed
FY22
Proposed
FY23
Proposed
FY24
Proposed
FY25‐29
Proposed
Additions and ImprovementsCentral ServicesD‐28 Renovations/Space Allocation Plan 468.8 ‐ 25.0 ‐ ‐ ‐ ‐ ‐ 750.0D‐37 Downtown Enhancement Project ‐ 60.0 60.0 60.0 60.0 60.0 60.0 60.0 300.0Central Services Total 468.8 60.0 85.0 60.0 60.0 60.0 60.0 60.0 1,050.0
CorrectionsD‐42 JMS Inmate Accountability Software Purchase (New) ‐ ‐ 59.6 ‐ ‐ ‐ ‐ ‐ 39.9Corrections Total ‐ ‐ 59.6 ‐ ‐ ‐ ‐ ‐ 39.9
Leisure ServicesD‐54 Bishop Park Renovations ‐ ‐ ‐ ‐ ‐ ‐ ‐ ‐ 25,500.0D‐55 Memorial Park Renovations ‐ ‐ ‐ ‐ ‐ ‐ ‐ ‐ 10,850.0D‐56 Improve Bear Hollow Zoo Exhibits & Visitor Amenities ‐ ‐ ‐ ‐ ‐ ‐ ‐ ‐ 2,750.0D‐57 Dudley Park Improvements ‐ ‐ ‐ ‐ ‐ ‐ ‐ ‐ 850.0D‐59 Trails & Open Spaces Compact Track Loader Equipment (New) ‐ ‐ ‐ ‐ ‐ ‐ ‐ ‐ 35.0D‐60 Portable Soccer Pitch System (New) ‐ ‐ ‐ ‐ ‐ ‐ ‐ ‐ 35.0Leisure Services Total ‐ ‐ ‐ ‐ ‐ ‐ ‐ ‐ 40,020.0
Manager's OfficeD‐61 ACCGOV Talent Management Software Suite (New) ‐ ‐ 165.0 165.0 170.0 170.0 ‐ ‐ ‐D‐64 Digital Signage Displays in Transit System Buses ‐ ‐ 75.0 ‐ ‐ ‐ ‐ ‐ 175.0D‐65 Pop‐up Van ‐ ‐ 27.5 27.5 ‐ ‐ ‐ ‐ ‐D‐66 Natural Area Rehabilitation Program (New) ‐ ‐ ‐ ‐ ‐ ‐ ‐ ‐ 250.0D‐67 Solar Energy Program ‐ ‐ ‐ ‐ 40.0 40.0 50.0 50.0 320.0D‐68 Energy Action Plan (New) ‐ ‐ 30.0 30.0 ‐ ‐ ‐ ‐ 75.0Manager's Office Total ‐ ‐ 297.5 222.5 210.0 210.0 50.0 50.0 820.0
Other General AdministrationD‐69 Public Art Program 89.7 15.0 20.0 20.0 ‐ ‐ ‐ ‐ 100.0Other General Administration Total 89.7 15.0 20.0 20.0 ‐ ‐ ‐ ‐ 100.0
Planning & ZoningD‐72 Develop Comprehensive Plan Ten Year Update 20.0 ‐ ‐ ‐ ‐ ‐ ‐ ‐ 200.0Planning & Zoning Total 20.0 ‐ ‐ ‐ ‐ ‐ ‐ ‐ 200.0
Capital Summary by Fund
FY20 Budget D-7

Capital Improvement Plan Forecast
General Capital Projects Fund
FY18
Year End
Balance
FY19
Budget
FY20
Request
FY20
Approved
FY21
Proposed
FY22
Proposed
FY23
Proposed
FY24
Proposed
FY25‐29
Proposed
PoliceD‐79 Additional Crisis Intervention Unit Vehicle (Title Change) ‐ 40.0 45.0 ‐ ‐ ‐ ‐ ‐ 45.0D‐80 Downtown District Electric Utility Vehicle (New) ‐ ‐ 12.0 ‐ ‐ ‐ ‐ ‐ 12.0D‐84 Additional Police Vehicles (New) ‐ ‐ ‐ ‐ ‐ ‐ ‐ ‐ 1,897.5Police Total ‐ 40.0 57.0 ‐ ‐ ‐ ‐ ‐ 1,954.5
SheriffD‐102 Public Safety Initiative ‐Equip Tech 72.4 ‐ 30.0 ‐ ‐ ‐ ‐ ‐ 150.0Sheriff Total 72.4 ‐ 30.0 ‐ ‐ ‐ ‐ ‐ 150.0
TransitD‐126 Update Transit Plans and Transit Studies ‐ ‐ ‐ ‐ ‐ ‐ ‐ ‐ 150.0Transit Total ‐ ‐ ‐ ‐ ‐ ‐ ‐ ‐ 150.0
Transportation & Public WorksD‐132 Traffic Data Collection 16.5 ‐ 30.0 30.0 ‐ ‐ ‐ ‐ 200.0D‐133 Local Road Improvement Projects 405.1 ‐ 75.0 ‐ ‐ ‐ ‐ ‐ 625.0D‐134 Expand Fiber Optic Cable Communications System 2.1 50.0 30.0 30.0 ‐ ‐ ‐ ‐ 250.0D‐136 Pedestrian Safety and Traffic Calming Improvements 30.9 ‐ 25.0 125.0 ‐ ‐ ‐ ‐ 175.0D‐138 Sidewalk and Other Improvements 48.7 ‐ ‐ ‐ ‐ ‐ ‐ ‐ 750.0D‐139 Bicycle Transportation Improvements ‐ ‐ 25.0 ‐ ‐ ‐ ‐ ‐ 1,000.0D‐140 Corridor Management Program 464.0 ‐ 25.0 ‐ ‐ ‐ ‐ ‐ 150.0Transportation & Public Works Total 967.3 50.0 210.0 185.0 ‐ ‐ ‐ ‐ 3,150.0
Additions and Improvements Total 1,618.3 165.0 759.1 487.5 270.0 270.0 110.0 110.0 47,634.4
General Capital Projects Fund Total 6,819.6 2,954.0 9,162.9 2,209.5 3,232.6 3,210.0 3,050.0 3,815.9 108,240.0
Capital Summary by Fund FY20 Budget D-8
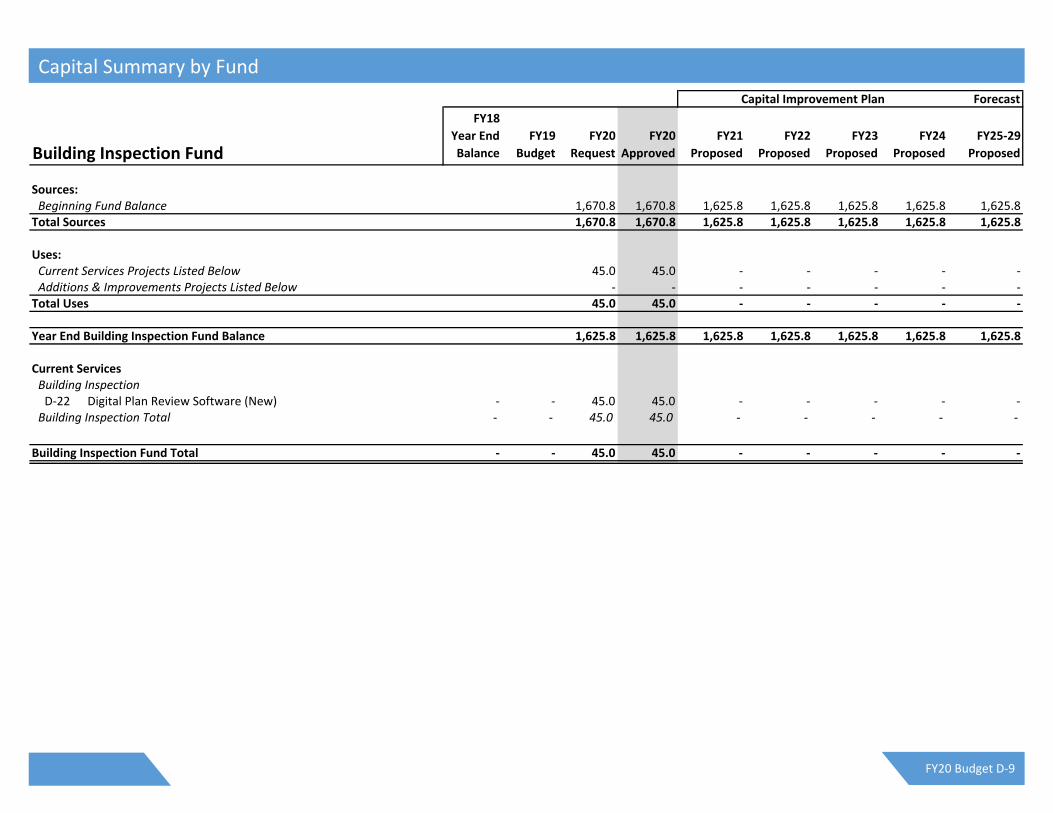
Capital Improvement Plan Forecast
Building Inspection Fund
FY18
Year End
Balance
FY19
Budget
FY20
Request
FY20
Approved
FY21
Proposed
FY22
Proposed
FY23
Proposed
FY24
Proposed
FY25‐29
Proposed
Sources:Beginning Fund Balance 1,670.8 1,670.8 1,625.8 1,625.8 1,625.8 1,625.8 1,625.8Total Sources 1,670.8 1,670.8 1,625.8 1,625.8 1,625.8 1,625.8 1,625.8
Uses:Current Services Projects Listed Below 45.0 45.0 ‐ ‐ ‐ ‐ ‐Additions & Improvements Projects Listed Below ‐ ‐ ‐ ‐ ‐ ‐ ‐Total Uses 45.0 45.0 ‐ ‐ ‐ ‐ ‐
Year End Building Inspection Fund Balance 1,625.8 1,625.8 1,625.8 1,625.8 1,625.8 1,625.8 1,625.8
Current ServicesBuilding InspectionD‐22 Digital Plan Review Software (New) ‐ ‐ 45.0 45.0 ‐ ‐ ‐ ‐ ‐Building Inspection Total ‐ ‐ 45.0 45.0 ‐ ‐ ‐ ‐ ‐
Building Inspection Fund Total ‐ ‐ 45.0 45.0 ‐ ‐ ‐ ‐ ‐
Capital Summary by Fund
FY20 Budget D-9

Capital Improvement Plan Forecast
Economic Development Fund
FY18
Year End
Balance
FY19
Budget
FY20
Request
FY20
Approved
FY21
Proposed
FY22
Proposed
FY23
Proposed
FY24
Proposed
FY25‐29
Proposed
Sources:Beginning Fund Balance 37.9 37.9 37.9 37.9 37.9 37.9 37.9Transfers from General Fund 225.0 200.0 225.0 225.0 225.0 225.0 225.0Total Sources 262.9 237.9 262.9 262.9 262.9 262.9 262.9
Uses:Current Services Projects Listed Below ‐ ‐ ‐ ‐ ‐ ‐ ‐Additions & Improvements Projects Listed Below 225.0 200.0 225.0 225.0 225.0 225.0 1,125.0Total Uses 225.0 200.0 225.0 225.0 225.0 225.0 1,125.0
Year End Economic Development Fund Reserve 37.9 37.9 37.9 37.9 37.9 37.9 (862.1)
Additions & ImprovementsOther General AdministrationD‐70 Economic Development Capital Program 433.1 225.0 225.0 200.0 225.0 225.0 225.0 225.0 1,125.0Other General Administration Total 433.1 225.0 225.0 200.0 225.0 225.0 225.0 225.0 1,125.0
Economic Development Fund Total 433.1 225.0 225.0 200.0 225.0 225.0 225.0 225.0 1,125.0
Capital Summary by Fund FY20 Budget D-10

Capital Improvement Plan Forecast
Fleet Management Fund
FY18
Year End
Balance
FY19
Budget
FY20
Request
FY20
Approved
FY21
Proposed
FY22
Proposed
FY23
Proposed
FY24
Proposed
FY25‐29
Proposed
Sources:Beginning Unrestricted Net Position (Estimate) 108.7 108.7 113.7 88.7 73.7 58.7 43.7Current Year Operating Revenues 15.0 15.0 15.0 15.0 15.0 15.0 75.0Total Sources 123.7 123.7 128.7 103.7 88.7 73.7 118.7
Uses:Current Services Projects Listed Below 10.0 10.0 40.0 30.0 30.0 30.0 150.0Additions & Improvements Projects Listed Below ‐ ‐ ‐ ‐ ‐ ‐ ‐Total Uses 10.0 10.0 40.0 30.0 30.0 30.0 150.0
Year End Fleet Management Fund Unrestricted Net Position 113.7 113.7 88.7 73.7 58.7 43.7 (31.3)
Current ServicesCentral ServicesD‐26 Upgrade Fuel Sites 39.6 30.0 ‐ ‐ 30.0 20.0 20.0 20.0 100.0D‐27 Fleet Management Shop Equipment Life Cycle Replacement ‐ ‐ 10.0 10.0 10.0 10.0 10.0 10.0 50.0Central Services Total 39.6 30.0 10.0 10.0 40.0 30.0 30.0 30.0 150.0
Fleet Management Fund Total 39.6 30.0 10.0 10.0 40.0 30.0 30.0 30.0 150.0
Capital Summary by Fund
FY20 Budget D-11

Capital Improvement Plan Forecast
Fleet Replacement Fund
FY18
Year End
Balance
FY19
Budget
FY20
Request
FY20
Approved
FY21
Proposed
FY22
Proposed
FY23
Proposed
FY24
Proposed
FY25‐29
Proposed
Sources:Beginning Unrestricted Net Position (Estimate) 7,864.3 7,864.3 6,864.4 6,864.4 6,864.4 6,864.4 6,864.4Current Year Operating Revenues 2,102.1 1,010.5 2,413.4 2,724.6 2,746.5 2,900.0 13,933.0Total Sources 9,966.4 8,874.8 9,277.8 9,589.0 9,610.9 9,764.4 20,797.4
Uses:Current Services Projects Listed Below 3,102.0 3,102.0 2,413.4 2,724.6 2,746.5 2,900.0 13,933.0Additions & Improvements Projects Listed Below ‐ ‐ ‐ ‐ ‐ ‐ ‐Total Uses 3,102.0 3,102.0 2,413.4 2,724.6 2,746.5 2,900.0 13,933.0
Year End Fleet Replacement Fund Unrestricted Net Position 6,864.4 5,772.8 6,864.4 6,864.4 6,864.4 6,864.4 6,864.4
Current ServicesCentral ServicesD‐40 Fleet Replacement Program ‐ 2,790.8 3,102.0 3,102.0 2,413.4 2,724.6 2,746.5 2,900.0 13,933.0Central Services Total ‐ 2,790.8 3,102.0 3,102.0 2,413.4 2,724.6 2,746.5 2,900.0 13,933.0
Fleet Replacement Fund Total ‐ 2,790.8 3,102.0 3,102.0 2,413.4 2,724.6 2,746.5 2,900.0 13,933.0
Capital Summary by Fund FY20 Budget D-12

Capital Improvement Plan Forecast
Hotel/Motel Fund
FY18
Year End
Balance
FY19
Budget
FY20
Request
FY20
Approved
FY21
Proposed
FY22
Proposed
FY23
Proposed
FY24
Proposed
FY25‐29
Proposed
Sources:Beginning Fund Balance 265.5 265.5 265.5 265.5 265.5 265.5 265.5Current Year Operating Revenue 40.0 40.0 40.0 40.0 40.0 40.0 200.0Total Sources 305.5 305.5 305.5 305.5 305.5 305.5 465.5
Uses:Current Services Projects Listed Below 40.0 40.0 40.0 40.0 40.0 40.0 200.0Additions & Improvements Projects Listed Below ‐ ‐ ‐ ‐ ‐ ‐ ‐Total Uses 40.0 40.0 40.0 40.0 40.0 40.0 200.0
Year End Hotel/Motel Fund Ending Balance 265.5 265.5 265.5 265.5 265.5 265.5 265.5
Current ServicesCentral ServicesD‐35 Parking Decks Life Cycle Replacement 53.4 ‐ ‐ ‐ ‐ ‐ ‐ ‐ ‐D‐36 Community Events Program 4.1 30.0 40.0 40.0 40.0 40.0 40.0 40.0 200.0Central Services Total 57.5 30.0 40.0 40.0 40.0 40.0 40.0 40.0 200.0
Hotel/Motel Fund Total 57.5 30.0 40.0 40.0 40.0 40.0 40.0 40.0 200.0
Capital Summary by Fund
FY20 Budget D-13

Capital Improvement Plan Forecast
Internal Support Fund
FY18
Year End
Balance
FY19
Budget
FY20
Request
FY20
Approved
FY21
Proposed
FY22
Proposed
FY23
Proposed
FY24
Proposed
FY25‐29
Proposed
Sources:Beginning Unrestricted Net Position (Estimate) 199.7 199.7 199.7 199.7 199.7 209.7 219.7Current Year Operating Revenues 40.0 40.0 40.0 40.0 50.0 50.0 250.0Total Sources 239.7 239.7 239.7 239.7 249.7 259.7 469.7
Uses:Current Services Projects Listed Below 40.0 40.0 40.0 40.0 40.0 40.0 200.0Additions & Improvements Projects Listed Below ‐ ‐ ‐ ‐ ‐ ‐ ‐Total Uses 40.0 40.0 40.0 40.0 40.0 40.0 200.0
Year End Internal Support Fund Unrestricted Net Position 199.7 199.7 199.7 199.7 209.7 219.7 269.7
Current ServicesCentral ServicesD‐32 Replace Internal Support Equipment 123.4 15.0 15.0 15.0 15.0 15.0 15.0 15.0 75.0D‐38 Telephone System Life Cycle Replacement 231.0 25.0 25.0 25.0 25.0 25.0 25.0 25.0 125.0Central Services Total 354.4 40.0 40.0 40.0 40.0 40.0 40.0 40.0 200.0
Internal Support Fund Total 354.4 40.0 40.0 40.0 40.0 40.0 40.0 40.0 200.0
Capital Summary by Fund FY20 Budget D-14

Capital Improvement Plan Forecast
Landfill Fund
FY18
Year End
Balance
FY19
Budget
FY20
Request
FY20
Approved
FY21
Proposed
FY22
Proposed
FY23
Proposed
FY24
Proposed
FY25‐29
Proposed
Sources:Beginning Unrestricted Net Position (Estimate) 1,703.9 1,703.9 1,418.9 623.9 112.9 (631.1) (751.1)Current Year Operating Revenues 400.0 400.0 450.0 450.0 450.0 450.0 2,250.0Landfill Closure Revenue ‐ ‐ ‐ ‐ ‐ ‐ 2,500.0Total Sources 2,103.9 2,103.9 1,868.9 1,073.9 562.9 (181.1) 3,998.9
Uses:Current Services Projects Listed Below 685.0 685.0 1,245.0 961.0 1,194.0 570.0 4,240.0Additions & Improvements Projects Listed Below ‐ ‐ ‐ ‐ ‐ ‐ ‐Total Uses 685.0 685.0 1,245.0 961.0 1,194.0 570.0 4,240.0
Year End Landfill Fund Unrestricted Net Position 1,418.9 1,418.9 623.9 112.9 (631.1) (751.1) (241.1)
Current ServicesSolid WasteD‐108 Replace Bulldozer 12.5 100.0 300.0 300.0 120.0 120.0 120.0 120.0 240.0D‐109 Replace Dump Truck (25 yard articulating) 210.0 134.0 134.0 134.0 134.0 ‐ ‐ ‐ 400.0D‐110 Replace Trash Compactor ‐ ‐ ‐ ‐ 450.0 450.0 450.0 450.0 900.0D‐111 Replace Track Excavator ‐ ‐ ‐ ‐ 90.0 90.0 90.0 ‐ ‐D‐112 Replace Track Loader ‐ ‐ ‐ ‐ 167.0 167.0 167.0 ‐ ‐D‐113 Replace Walking Floor Trailer (1986) ‐ ‐ ‐ ‐ ‐ ‐ 100.0 ‐ ‐D‐114 Replace Trommel Screen in Compost Operations ‐ ‐ ‐ ‐ ‐ ‐ 200.0 ‐ ‐D‐115 Replace Windrow Turner in Compost Operations ‐ ‐ ‐ ‐ 150.0 ‐ ‐ ‐ ‐D‐116 Closure of Landfill‐ Phase 1 & 2 Areas ‐ ‐ ‐ ‐ ‐ ‐ ‐ ‐ 2,500.0D‐117 Belt Replacements for RMPF (New) ‐ ‐ 67.0 67.0 67.0 67.0 ‐ ‐ ‐D‐118 Control Panel/Cabinets Replacement for RMPF (New) ‐ ‐ 65.0 65.0 ‐ ‐ ‐ ‐ ‐D‐119 Replacement Roll‐Off Container Truck ‐ 114.0 59.0 59.0 67.0 67.0 67.0 ‐ 200.0D‐120 Replace Pavement at Solid Waste Facilities (New) ‐ ‐ 60.0 60.0 ‐ ‐ ‐ ‐ ‐Solid Waste Total 222.5 348.0 553.0 553.0 1,178.0 894.0 1,194.0 570.0 4,240.0
Landfill Fund Total 222.5 348.0 685.0 685.0 1,245.0 961.0 1,194.0 570.0 4,240.0
Capital Summary by Fund
FY20 Budget D-15

Capital Improvement Plan Forecast
Solid Waste Fund
FY18
Year End
Balance
FY19
Budget
FY20
Request
FY20
Approved
FY21
Proposed
FY22
Proposed
FY23
Proposed
FY24
Proposed
FY25‐29
Proposed
Sources:Beginning Unrestricted Net Position (Estimate) 631.5 631.5 482.5 347.5 262.5 622.5 948.5Current Year Operating Revenues 400.0 400.0 400.0 450.0 450.0 450.0 2,250.0Total Sources 1,031.5 1,031.5 882.5 797.5 712.5 1,072.5 3,198.5
Uses:Current Services Projects Listed Below 549.0 549.0 535.0 535.0 90.0 124.0 158.0Additions & Improvements Projects Listed Below ‐ ‐ ‐ ‐ ‐ ‐ ‐Total Uses 549.0 549.0 535.0 535.0 90.0 124.0 158.0
Year End Solid Waste Fund Unrestricted Net Position 482.5 482.5 347.5 262.5 622.5 948.5 3,040.5
Current ServicesSolid WasteD‐121 Replace Automated Refuse/Recycling Truck 540.0 540.0 200.0 200.0 310.0 310.0 ‐ ‐ ‐D‐122 Replace Commercial Dumpster Collection Front‐end Loader (79.6) 165.0 180.0 180.0 90.0 90.0 90.0 90.0 90.0D‐123 Replace Mini‐Packer Trucks (New) ‐ ‐ 135.0 135.0 135.0 135.0 ‐ ‐ ‐D‐124 Mini‐Packer Truck (293.4) 34.0 34.0 34.0 ‐ ‐ ‐ 34.0 68.0Solid Waste Total 166.9 739.0 549.0 549.0 535.0 535.0 90.0 124.0 158.0
Solid Waste Fund Total 166.9 739.0 549.0 549.0 535.0 535.0 90.0 124.0 158.0
Capital Summary by Fund FY20 Budget D-16
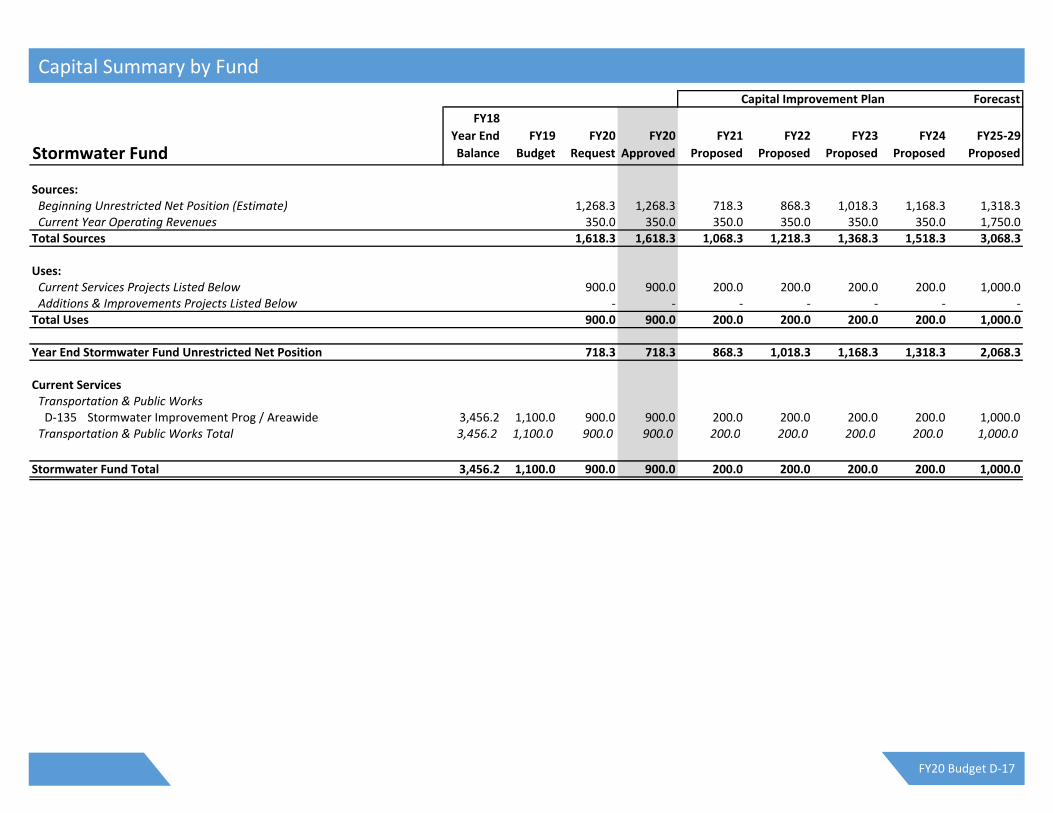
Capital Improvement Plan Forecast
Stormwater Fund
FY18
Year End
Balance
FY19
Budget
FY20
Request
FY20
Approved
FY21
Proposed
FY22
Proposed
FY23
Proposed
FY24
Proposed
FY25‐29
Proposed
Sources:Beginning Unrestricted Net Position (Estimate) 1,268.3 1,268.3 718.3 868.3 1,018.3 1,168.3 1,318.3Current Year Operating Revenues 350.0 350.0 350.0 350.0 350.0 350.0 1,750.0Total Sources 1,618.3 1,618.3 1,068.3 1,218.3 1,368.3 1,518.3 3,068.3
Uses:Current Services Projects Listed Below 900.0 900.0 200.0 200.0 200.0 200.0 1,000.0Additions & Improvements Projects Listed Below ‐ ‐ ‐ ‐ ‐ ‐ ‐Total Uses 900.0 900.0 200.0 200.0 200.0 200.0 1,000.0
Year End Stormwater Fund Unrestricted Net Position 718.3 718.3 868.3 1,018.3 1,168.3 1,318.3 2,068.3
Current ServicesTransportation & Public WorksD‐135 Stormwater Improvement Prog / Areawide 3,456.2 1,100.0 900.0 900.0 200.0 200.0 200.0 200.0 1,000.0Transportation & Public Works Total 3,456.2 1,100.0 900.0 900.0 200.0 200.0 200.0 200.0 1,000.0
Stormwater Fund Total 3,456.2 1,100.0 900.0 900.0 200.0 200.0 200.0 200.0 1,000.0
Capital Summary by Fund
FY20 Budget D-17

Capital Improvement Plan Forecast
Water & Sewer Fund
FY18
Year End
Balance
FY19
Budget
FY20
Request
FY20
Approved
FY21
Proposed
FY22
Proposed
FY23
Proposed
FY24
Proposed
FY25‐29
Proposed
Sources:Beginning Unrestricted Net Position (Estimate) 43,002.9 43,002.9 30,535.1 16,606.7 7,146.7 1,832.6 638.6Current Year Operating Revenues 15,000.0 15,000.0 16,000.0 17,000.0 18,000.0 19,000.0 110,000.0Total Sources 58,002.9 58,002.9 46,535.1 33,606.7 25,146.7 20,832.6 110,638.6
Uses:Current Services Projects Listed Below 25,267.8 25,267.8 22,728.4 21,760.0 23,114.1 19,994.0 91,839.0Additions & Improvements Projects Listed Below 2,200.0 2,200.0 7,200.0 4,700.0 200.0 200.0 5,500.0Total Uses 27,467.8 27,467.8 29,928.4 26,460.0 23,314.1 20,194.0 97,339.0
Year End Water & Sewer Fund Unrestricted Net Position 30,535.1 30,535.1 16,606.7 7,146.7 1,832.6 638.6 13,299.6
Public UtilitiesCurrent ServicesD‐86 W&S Lines ‐ Additions and Improvements ‐ 918.2 936.0 936.0 955.0 975.0 994.5 1,010.0 5,260.0D‐87 Meter and Water/Sewer Stub Additions ‐ 482.2 491.0 491.0 501.6 510.0 520.0 530.0 2,758.0D‐88 Donated W&S Additions Management ‐ 218.0 224.0 224.0 226.8 230.0 234.6 239.0 1,246.0D‐89 Watershed Protection Long‐Term Monitoring 46.5 100.0 100.0 100.0 100.0 100.0 100.0 100.0 500.0D‐90 Replace Water Meters 5,250.9 365.0 365.0 365.0 365.0 365.0 365.0 365.0 1,825.0D‐91 Rehabilitate and Replace Sewers 24,861.9 14,000.0 9,951.8 9,951.8 5,000.0 5,000.0 4,000.0 6,000.0 30,000.0D‐93 Replace and Upgrade Facilities and Equipment 7,181.7 5,400.0 5,300.0 5,300.0 3,300.0 3,400.0 3,450.0 3,300.0 17,250.0D‐94 Rehabilitate and Replace Water Lines 1,219.9 2,500.0 2,750.0 2,750.0 3,000.0 3,000.0 3,000.0 4,000.0 20,000.0D‐95 Relocate Water & Sewer Lines for DOT Projects 405.1 100.0 100.0 100.0 100.0 100.0 100.0 100.0 500.0D‐96 Manage and Reuse Residual Solids 496.1 1,350.0 1,500.0 1,500.0 5,130.0 3,530.0 300.0 300.0 1,500.0D‐97 Improve Water Supply Reliability 3,327.7 3,000.0 3,500.0 3,500.0 4,000.0 4,500.0 10,000.0 4,000.0 10,500.0D‐99 Investigate and Install Alternative Energy Generation 993.2 50.0 50.0 50.0 50.0 50.0 50.0 50.0 500.0
Current Services Total 43,783.0 28,483.4 25,267.8 25,267.8 22,728.4 21,760.0 23,114.1 19,994.0 91,839.0
Additions & ImprovementsD‐92 Extend Wastewater Collection System 4,906.8 100.0 100.0 100.0 100.0 100.0 100.0 100.0 5,000.0D‐98 W&S Contribution to Economic Development 571.0 100.0 100.0 100.0 100.0 100.0 100.0 100.0 500.0D‐100 WRF Phosphorous Improvements ‐ ‐ ‐ ‐ 7,000.0 4,500.0 ‐ ‐ ‐D‐101 Water Transmission Grid Improvements ‐ 1,200.0 2,000.0 2,000.0 ‐ ‐ ‐ ‐ ‐
Additions & Improvements Total 5,477.8 1,400.0 2,200.0 2,200.0 7,200.0 4,700.0 200.0 200.0 5,500.0
Water & Sewer Fund Total 49,260.8 29,883.4 27,467.8 27,467.8 29,928.4 26,460.0 23,314.1 20,194.0 97,339.0
Capital Summary by Fund FY20 Budget D-18

Airport Department Priority
Matching Funds for Airport Capital Improvement Grants 1 of 2CS, Transportation Project Timeline: Ongoing
Project Description
Project Justification
Impact on Annual Operating Expenses
Financial Plan Project ID: c0334
FY18 FY19 FY20 FY21 FY22 FY23 FY24 FY25‐29 Total
End Bal. Budget Approved Proposed Proposed Proposed Proposed Proposed Proposed
SOURCES
General Capital Fund 244,123 ‐ ‐ ‐ ‐ ‐ ‐ 1,825,000 1,825,000
TOTAL SOURCES 244,123 ‐ ‐ ‐ ‐ ‐ ‐ 1,825,000 1,825,000
USES
Capital ‐ Const. 244,123 ‐ ‐ ‐ ‐ ‐ ‐ 1,825,000 1,825,000
TOTAL USES 244,123 ‐ ‐ ‐ ‐ ‐ ‐ 1,825,000 1,825,000
This project provides matching funds for approved Airport Improvement Projects (AIP) and other grants funded by the Federal Aviation Administration (FAA) and/or
the Georgia Department of Transportation (GDOT).
This project is in keeping with the airport's FAA capital improvement program and Airport Master Plan. Funding for Airport projects is contingent upon the FAA and
GDOT approving discretionary funding. Federally funded projects are awarded at a percentage of 90% Federal, 5% State and 5% Local matches. State funded
projects are awarded at a percentage of 75% State and 25% Local match.
No Impact
Capital Detail by Department
FY20 Budget D-19

Airport Department Priority
Maintain Airport Facilities and Equipment 2 of 2CS, Facilities Project Timeline: Ongoing
Project Description
Project Justification
Impact on Annual Operating Expenses
Financial Plan Project ID: c0570
FY18 FY19 FY20 FY21 FY22 FY23 FY24 FY25‐29 Total
End Bal. Budget Approved Proposed Proposed Proposed Proposed Proposed Proposed
SOURCES
General Capital Fund 53,341 30,000 ‐ 25,000 25,000 25,000 25,000 315,000 415,000
TOTAL SOURCES 53,341 30,000 ‐ 25,000 25,000 25,000 25,000 315,000 415,000
USES
Capital ‐ Const. 53,341 30,000 ‐ 25,000 25,000 25,000 25,000 315,000 415,000
Capital ‐ Machinery & Equip ‐ ‐ ‐ ‐ ‐ ‐ ‐ ‐
TOTAL USES 53,341 30,000 ‐ 25,000 25,000 25,000 25,000 315,000 415,000
Maintain airport facilities and repair and/or replace equipment.
Provide funding to maintain airport facilities such as painting hangars, replacement of furniture, replacement of roofs, replacement of flooring, and HVAC systems.
Replacement and repair of flightline equipment. This does not include any funding for buildings that may be maintained by the Facilities Management Division of the
Central Services Department.
No Impact
Capital Detail by Department FY20 Budget D-20

Board of Elections Department Priority
Replacing Electronic Voting Equipment 1 of 1CS, Equipment Project Timeline: FY05 ‐ Ongoing
Project Description
Project Justification
Impact on Annual Operating Expenses
Financial Plan Project ID: co413
FY18 FY19 FY20 FY21 FY22 FY23 FY24 FY25‐29 Total
End. Bal. Budget Approved Proposed Proposed Proposed Proposed Proposed Proposed
SOURCES
General Capital Fund ‐ ‐ ‐ ‐ ‐ ‐ ‐ 70,000 70,000
TOTAL SOURCES ‐ ‐ ‐ ‐ ‐ ‐ ‐ 70,000 70,000
USES
Capital ‐ Machinery & Equip ‐ ‐ ‐ ‐ ‐ ‐ ‐ 70,000 70,000
TOTAL USES ‐ ‐ ‐ ‐ ‐ ‐ ‐ 70,000 70,000
Purchase and/or replacing voting equipment. Currently in use are touchscreen units, memory cards, Optical Scan Units, Express Polls and scanners. This project
provides funding to replace the current system or systems (initially purchased by the State of Georgia; added equipment and maintenance later purchased by ACC in
2002) with equipment currently under consideration by the S.A.F.E. Commission and the 2018‐19 General Assembly.
In FY03 the Georgia Secretary of State provided 208 AccuVote touchscreen voting machines to ACCUG . In FY05, anticipating "Advance Voting" work load increases,
six additional touchscreen units were provided by the state and ACCUG purchased ten units. Currently, the board maintains 248 touchscreens, 10 Optical Scan units,
89 ExpressPoll units (48 issued from the state and 41 purchased), and 73 Barcode scanners (48 issued from the state in 2010, 25 purchased). All machines are out of
warranty and ACCUG is responsible for repairs and/or replacements. The original TS units (208) are no longer in production. In January 2019, with expectations of a
newly elected Secretary of State, it is a very considerable possibility that the state‐wide uniform vote system will be addressed. Without knowledge of possible
federal or state funding, it is requested to have the remaining $164,469 carryforward in the event of the possibility; funds expended by August 2019 (FY20) with
implementation by 2020 Presidential Year. It is also very likely that a new vote system will be added as early as the 2020 PPP Election. Without knowledge of how
much funding we will receive from the mandate, it is necessary to have funding available for the need to purchase more equipment in addition to what the state or
federal provides to our county.
Minimal impact on annual costs. Of course as equipment is added to the Board of Elections inventory, maintenance, programming and storage is required.
Capital Detail by Department
FY20 Budget D-21

Building Inspection Department Priority
Digital Plan Review Software (New) 1 of 1CS, Software Project Timeline: FY20 ‐ FY20
Project Description
Project Justification
Impact on Annual Operating Expenses
Financial Plan Project ID: New
FY18 FY19 FY20 FY21 FY22 FY23 FY24 FY25‐29 Total
End. Bal. Budget Approved Proposed Proposed Proposed Proposed Proposed Proposed
SOURCES
Build Insp: Spec Rev Fund ‐ ‐ 45,000 ‐ ‐ ‐ ‐ ‐ 45,000
TOTAL SOURCES ‐ ‐ 45,000 ‐ ‐ ‐ ‐ ‐ 45,000
USES
Other ‐ ‐ 45,000 ‐ ‐ ‐ ‐ ‐ 45,000
TOTAL USES ‐ ‐ 45,000 ‐ ‐ ‐ ‐ ‐ 45,000
We will purchase software in order to implement digital/electronic plans review. The software includes an additional Energov module, Blue Beam software to
interface with Energov, training, and additional hardware as needed. A previous capital project for this same implementation was not funded adequately due to
unforeseen software upgrades and acquisitions.
This project satisfies M&C goals of reducing the use of paper and providing a service more efficiently. The development community has indicated support for
electronic plan submittals and reviews as it will reduce the cost of printing and transporting construction plans.
The ongoing software licensing fees will be approximately $40,000 annually and will be recovered by additional fees. The General Fund impact is anticipated to be
minimal or zero depending on fee increase approval through the FY20 budget process.
Capital Detail by Department FY20 Budget D-22

Central Services Department Priority
Facilities Life Cycle Maintenance Program 1 of 18CS, Facilities Project Timeline: Ongoing
Project Description
Project Justification
Impact on Annual Operating Expenses
Financial Plan Project ID: c0188
FY18 FY19 FY20 FY21 FY22 FY23 FY24 FY25‐29 Total
End Bal. Budget Approved Proposed Proposed Proposed Proposed Proposed Proposed
SOURCES
General Capital Fund 308,608 1,700,000 ‐ 1,000,000 1,000,000 1,000,000 1,000,000 7,328,561 11,328,561
TOTAL SOURCES 308,608 1,700,000 ‐ 1,000,000 1,000,000 1,000,000 1,000,000 7,328,561 11,328,561
USES
Capital ‐ Const. 308,608 1,700,000 ‐ 1,000,000 1,000,000 1,000,000 1,000,000 7,328,561 11,328,561
TOTAL USES 308,608 1,700,000 ‐ 1,000,000 1,000,000 1,000,000 1,000,000 7,328,561 11,328,561
The Facility Component Life Cycle Maintenance program is an annual plan to replace key facility components on buildings maintained by the Central Services
Department. The goal is to replace the items at or near the end of their normal life expectancy to minimize operating budget impacts caused by unexpected failures
of older equipment. The major components included in this program are roofs, HVAC equipment, exterior and interior painting, carpets and emergency generators.
A 3% inflation factor has been applied to out‐years.
This program is required to ensure that adequate funds are available, on a recurring basis, to maintain facilities owned by ACCUG. Replacements covered under this
program are necessary to protect the financial investment that ACCUG has in their public facilities. Timely replacement of aging components extends the life
expectancy of facilities and creates safer and more productive work environments. Cost estimates were obtained from the Facilities Management staff and through
professional services. NOTE: Funding requested in each year is based on projected needs of the life cycle program. Inadequate funding may result in emergency
funding requests for equipment that fails due to over‐extended lifetimes.
If this program is not adequately funded, needed life cycle replacements will be deferred resulting in deteriorated facilities, higher equipment failures, adverse
impacts on building occupants, higher maintenance and repair expenses in the operating budget, and higher future capital replacement needs.
Capital Detail by Department
FY20 Budget D-23

Central Services Department Priority
Deep Tine Aerator Purchase (New) 2 of 18CS, Equipment Project Timeline: FY20 ‐ FY20
Project Description
Project Justification
Impact on Annual Operating Expenses
Financial Plan Project ID: New
FY18 FY19 FY20 FY21 FY22 FY23 FY24 FY25‐29 Total
End. Bal. Budget Approved Proposed Proposed Proposed Proposed Proposed Proposed
SOURCES
General Capital Fund ‐ ‐ 30,000 ‐ ‐ ‐ ‐ ‐ 30,000
TOTAL SOURCES ‐ ‐ 30,000 ‐ ‐ ‐ ‐ ‐ 30,000
USES
Capital ‐ Machinery & Equip ‐ ‐ 30,000 ‐ ‐ ‐ ‐ ‐ 30,000
TOTAL USES ‐ ‐ 30,000 ‐ ‐ ‐ ‐ ‐ 30,000
This project is the purchase of a Deep Tine Aerator for use on athletic fields and other large turf areas. A deep tine aerator is a large tractor implement that is used
to aerate turf areas to maintain the growth and health of heavily used turf areas, including all athletic fields in Leisure Services parks. Without periodic aeration,
athletic field conditions will decline affecting usability and ultimately leading to the need for a complete turf replacement.
Currently, this aeration of athletic fields is contracted at a cost of $3,000 per acre. The 4 fields at Bishop Park alone will cost $27,000 to aerate in FY20 if this aerator
is not purchased. These costs would otherwise come from another capital project that also funds the Tree Management Program which would severely limit tree
plantings and landscape repairs in FY20. The purchase of the aerator will result in a 1 year pay back in contract savings, thereby eliminating the contract costs in
future years.
Negligible. Life cycle costs will be covered by the existing Landscape Equipment Life Cycle Replacement capital project.
Capital Detail by Department FY20 Budget D-24

Central Services Department Priority
Landscaping Equipment Life Cycle Replacement 3 of 18CS, Equipment Project Timeline: Ongoing
Project Description
Project Justification
Impact on Annual Operating Expenses
Financial Plan Project ID: c0090
FY18 FY19 FY20 FY21 FY22 FY23 FY24 FY25‐29 Total
End Bal. Budget Approved Proposed Proposed Proposed Proposed Proposed Proposed
SOURCES
General Capital Fund 49,421 25,000 50,000 50,000 50,000 50,000 50,000 500,000 750,000
TOTAL SOURCES 49,421 25,000 50,000 50,000 50,000 50,000 50,000 500,000 750,000
USES
Capital ‐ Machinery & Equip 49,421 25,000 50,000 50,000 50,000 50,000 50,000 500,000 750,000
TOTAL USES 49,421 25,000 50,000 50,000 50,000 50,000 50,000 500,000 750,000
Purchase replacement landscape maintenance equipment (mowers, chainsaws, ball field implements, etc.) used by the Landscape Management Division (LMD). This
capital project uses equipment useful life cycles as a basis for projecting annual replacement costs. Equipment is used for landscape services to Athens‐Clarke
County parks, public buildings, and rights‐of‐way. Cost estimates are from LMD staff.
Efficiency of landscape services is dependent upon functioning, reliable equipment. Since the program funding began in FY96, service has become reliable and stable
as equipment is replaced on schedule (with exception of recession budget years FY09‐FY14). All who travel public roadways (700 miles of streets and roads), use
public parks (450 acres and 24 ball fields), or conduct business with departments (45 acres, 29 sites) are affected by Landscape Division Services. Inadequately
managed growth of vegetation affects community appearance and public safety. Serviceable equipment is essential to Landscape Division's primary objective to
provide a stable level of service under a range of environmental variables.
No Impact
Capital Detail by Department
FY20 Budget D-25

Central Services Department Priority
Upgrade Fuel Sites 4 of 18CS, Facilities Project Timeline: Ongoing
Project Description
Project Justification
Impact on Annual Operating Expenses
Financial Plan Project ID: c0419
FY18 FY19 FY20 FY21 FY22 FY23 FY24 FY25‐29 Total
End Bal. Budget Approved Proposed Proposed Proposed Proposed Proposed Proposed
SOURCES
Fleet Management Fund 39,564 30,000 ‐ 30,000 20,000 20,000 20,000 100,000 190,000
TOTAL SOURCES 39,564 30,000 ‐ 30,000 20,000 20,000 20,000 100,000 190,000
USES
Capital ‐ Machinery & Equip 39,564 30,000 ‐ 30,000 20,000 20,000 20,000 100,000 190,000
TOTAL USES 39,564 30,000 ‐ 30,000 20,000 20,000 20,000 100,000 190,000
The following five (5) fuel sites are managed by the Fleet Management Division: (1) Public Safety Campus (Jail) (2) Fleet Management ‐ Newton Bridge Road, (3) Fire
Station #1, (4) Fire Station #2, and (5) East Side Fuel Center ‐ Spring Valley Road. This project provides routine upgrades to fuel sites, responds to EPD requirements
for fuel facilities, and updates to the computer operated fuel dispensing system. Additional focus on underground storage tank repair and maintenance is expected
to be addressed in future budget years.
For over twenty years, regular bi‐annual upgrades to Athens‐Clarke County’s fueling sites have ensured safe, compliant, efficient fueling operations that have served
customers year round. While this funding has allowed Fleet Management to enhance automated tank monitoring and site maintenance, fuel management software
and some hardware is outdated and has reached its limited storage capacity. This year’s funding request, coupled with previous year’s carry‐forward amount, will be
focused on a fuel management system upgrade.
No Impact
Capital Detail by Department FY20 Budget D-26

Central Services Department Priority
Fleet Management Shop Equipment Life Cycle Replacement 5 of 18CS, Equipment Project Timeline: Ongoing
Project Description
Project Justification
Impact on Annual Operating Expenses
Financial Plan Project ID: New
FY18 FY19 FY20 FY21 FY22 FY23 FY24 FY25‐29 Total
End Bal. Budget Approved Proposed Proposed Proposed Proposed Proposed Proposed
SOURCES
Fleet Management Fund ‐ ‐ 10,000 10,000 10,000 10,000 10,000 50,000 100,000
TOTAL SOURCES ‐ ‐ 10,000 10,000 10,000 10,000 10,000 50,000 100,000
USES
Capital ‐ Machinery & Equip ‐ ‐ 10,000 10,000 10,000 10,000 10,000 50,000 100,000
TOTAL USES ‐ ‐ 10,000 10,000 10,000 10,000 10,000 50,000 100,000
This project will provide life cycle replacement funds for worn or obsolete equipment used in the two shop areas at Fleet Management's maintenance facility
(Vehicle Servicing & Repair, and Vehicle Replacement). This equipment is used for the outfitting, maintenance, and repair of all vehicles and equipment in the ACCUG
fleet that serves all ACCUG departments.
This project is needed to ensure that the equipment used by Fleet Management in support of the ACCUG fleet is functional and up‐to‐date. Otherwise, worn and
obsolete shop equipment will impact Fleet Managements service delivery requiring some vehicle and equipment repairs to be outsourced at a higher cost to the user
department.
No impact.
Capital Detail by Department
FY20 Budget D-27

Central Services Department Priority
Renovations/Space Allocation Plan 6 of 18AI, Facilities Project Timeline: Ongoing
Project Description
Project Justification
Impact on Annual Operating Expenses
Financial Plan Project ID: c0074
FY18 FY19 FY20 FY21 FY22 FY23 FY24 FY25‐29 Total
End Bal. Budget Approved Proposed Proposed Proposed Proposed Proposed Proposed
SOURCES
General Capital Fund 468,827 ‐ ‐ ‐ ‐ ‐ ‐ 750,000 750,000
TOTAL SOURCES 468,827 ‐ ‐ ‐ ‐ ‐ ‐ 750,000 750,000
USES
Capital ‐ Const. 468,827 ‐ ‐ ‐ ‐ ‐ ‐ 750,000 750,000
TOTAL USES 468,827 ‐ ‐ ‐ ‐ ‐ ‐ 750,000 750,000
The Space Allocation Program sets aside funds to be used for the renovation, acquisition, or construction of facilities in response to ACCUG departments' space
needs. The FY20 request is to fund a small portion of recommendations coming from the 2010 and 2018 Space Allocation studies and other space
reconfiguration/renovation needs of ACCUG departments and possible relocation of ACCUG offices currently in leased office space.
Projects are determined based on the needs of other ACCUG departments as their service delivery needs evolve over time requiring renovation or reconfiguration of
office and other operational facility spaces. In FY20‐FY23, additional needs are anticipated as existing departments (not yet identified) are moved into the Costa
Building, which is being renovated as a SPLOST 2011 project, or some other location or new building. Spaces vacated by those departments moving will need
renovations to accommodate new functions.
No Impact
Capital Detail by Department FY20 Budget D-28

Central Services Department Priority
800 MHz Subscriber Radio Life Cycle 7 of 18CS, Equipment Project Timeline: Ongoing
Project Description
Project Justification
Impact on Annual Operating Expenses
Financial Plan Project ID: c0384
FY18 FY19 FY20 FY21 FY22 FY23 FY24 FY25‐29 Total
End Bal. Budget Approved Proposed Proposed Proposed Proposed Proposed Proposed
SOURCES
General Capital Fund 200,000 25,000 26,000 25,000 25,000 25,000 25,000 250,000 376,000
TOTAL SOURCES 200,000 25,000 26,000 25,000 25,000 25,000 25,000 250,000 376,000
USES
Capital ‐ Machinery & Equip 200,000 25,000 26,000 25,000 25,000 25,000 25,000 250,000 376,000
TOTAL USES 200,000 25,000 26,000 25,000 25,000 25,000 25,000 250,000 376,000
This project accumulates funds for a life cycle replacement program for the 800 MHz subscriber (portable and mobile) radios purchased with SPLOST 2011 funds.
Over 1000 radios were purchased through the SPLOST. The manufacturer indicates that these radios have a life expectancy of 5‐10 years. This proposal sets aside
funds for the subscriber radios and continues the life cycle process begun with the older radios. The average current replacement cost is approximately $4,000 per
radio. These funds may also be used to replace radios that are damaged or lost during use and the radios that are used to activate the tornado sirens, Greenway Call
Boxes, Fire Station Alerting, and other critical items.
As these subscriber radios age, they become both unreliable and expensive to repair. Staff believes that with good maintenance, a 12‐year life expectancy is
feasible. No inflation figures are applied in the belief that improved technology and competition will offset any inflationary increase. Funding will provide for the
replacement of the radios that fail due to age, cost of repairs, or other reasons.
No Impact
Capital Detail by Department
FY20 Budget D-29

Central Services Department Priority
Landscape & Community Tree Program 8 of 18CS, Facilities Project Timeline: Ongoing
Project Description
Project Justification
Impact on Annual Operating Expenses
Financial Plan Project ID: c0182
FY18 FY19 FY20 FY21 FY22 FY23 FY24 FY25‐29 Total
End Bal. Budget Approved Proposed Proposed Proposed Proposed Proposed Proposed
SOURCES
General Capital Fund 40,744 20,000 20,000 ‐ ‐ ‐ ‐ 200,000 220,000
TOTAL SOURCES 40,744 20,000 20,000 ‐ ‐ ‐ ‐ 200,000 220,000
USES
Capital ‐ Const. 40,744 20,000 20,000 ‐ ‐ ‐ ‐ 200,000 220,000
TOTAL USES 40,744 20,000 20,000 ‐ ‐ ‐ ‐ 200,000 220,000
The purpose of this project is to provide or restore Athens‐Clarke County (ACC) landscape features that: (1) become unserviceable due to natural life‐span, (2) are
destroyed due to construction activities, (3) serve as enhancements to existing conditions, (4) provide a standard level of landscape quality to under‐funded facility
projects, or (5) serve as natural vegetative cover for undeveloped or passive public lands. Projects are located at ACC parks, rights‐of‐way, buildings/facilities, and
right‐of‐way stormwater bio‐retention facilities.
The Landscape Management Division annually responds to events requiring landscape plantings and support systems for ACC properties. The consequence of not
responding is deteriorated conditions, a negative public image and limits to programmed activities. This capital life cycle program stabilizes annual expenditures,
preserves infrastructure assets, benefits citizens and staff and improves asset life expectancy. A combination of chemical, mechanical and other methods will be
used, with an emphasis on environmentally compatible methods where possible.
No Impact
Capital Detail by Department FY20 Budget D-30

Central Services Department Priority
Parking Lot Life Cycle Maintenance & Repair 9 of 18CS, Facilities Project Timeline: Ongoing
Project Description
Project Justification
Impact on Annual Operating Expenses
Financial Plan Project ID: c0724
FY18 FY19 FY20 FY21 FY22 FY23 FY24 FY25‐29 Total
End Bal. Budget Approved Proposed Proposed Proposed Proposed Proposed Proposed
SOURCES
General Capital Fund ‐ 20,000 20,000 20,000 20,000 20,000 20,000 200,000 300,000
TOTAL SOURCES ‐ 20,000 20,000 20,000 20,000 20,000 20,000 200,000 300,000
USES
Capital ‐ Const. ‐ 20,000 20,000 20,000 20,000 20,000 20,000 200,000 300,000
TOTAL USES ‐ 20,000 20,000 20,000 20,000 20,000 20,000 200,000 300,000
The Parking Lot Life Cycle M&R Project will include maintenance and repairs to existing parking lots for ACCUG buildings. This may include installing new concrete,
asphalt, or seal coating. It will also include restriping parking lots as needed.
Work will need to be done in the near future at several parking lots due to the age of the material and the use of the parking lot. All ACCUG facilities should properly
represent the image of the Unified Government, especially the facilities that directly serve the public. A properly executed life cycle program will extend the life of
the existing parking lots, thereby minimizing future repair costs.
This project will reduce the dependence on operating budgets to perform repairs due to the lack of maintenance.
Capital Detail by Department
FY20 Budget D-31

Central Services Department Priority
Replace Internal Support Equipment 10 of 18CS, Equipment Project Timeline: Ongoing
Project Description
Project Justification
Impact on Annual Operating Expenses
Financial Plan Project ID: c0347
FY18 FY19 FY20 FY21 FY22 FY23 FY24 FY25‐29 Total
End Bal. Budget Approved Proposed Proposed Proposed Proposed Proposed Proposed
SOURCES
General Capital Fund 109,110 10,000 ‐ 10,000 10,000 10,000 10,000 50,000 90,000
Internal Support Fund 123,420 15,000 15,000 15,000 15,000 15,000 15,000 75,000 150,000
TOTAL SOURCES 232,530 25,000 15,000 25,000 25,000 25,000 25,000 125,000 240,000
USES
Capital ‐ Machinery & Equip 232,530 25,000 15,000 25,000 25,000 25,000 25,000 125,000 240,000
TOTAL USES 232,530 25,000 15,000 25,000 25,000 25,000 25,000 125,000 240,000
Purchase and replace outdated equipment in the Records Center and Print Shop in order to provide better service. This program provides for the programmed
replacement of record keeping and printing equipment as it approaches the end of its useful life.
Approximately 30% of all equipment covered by this replacement program is 12 to 17 years old. As equipment ages, it requires more frequent service calls and
replacement parts become more expensive. Equipment downtime creates the need for more expensive outsourcing. This scheduled replacement program will
reduce operating costs for maintenance and outsourcing. Funding will be split between the General Capital Projects Fund (310) and the Internal Support Fund (601).
No Impact
Capital Detail by Department FY20 Budget D-32

Central Services Department Priority
800 MHz Radio Infrastructure Replacement 11 of 18CS, Equipment Project Timeline: Ongoing
Project Description
Project Justification
Impact on Annual Operating Expenses
Financial Plan Project ID: c0726
FY18 FY19 FY20 FY21 FY22 FY23 FY24 FY25‐29 Total
End Bal. Budget Approved Proposed Proposed Proposed Proposed Proposed Proposed
SOURCES
General Capital Fund 75,000 25,000 25,000 ‐ ‐ ‐ ‐ 5,500,000 5,525,000
TOTAL SOURCES 75,000 25,000 25,000 ‐ ‐ ‐ ‐ 5,500,000 5,525,000
USES
Capital ‐ Machinery & Equip 75,000 25,000 25,000 ‐ ‐ ‐ ‐ 5,500,000 5,525,000
TOTAL USES 75,000 25,000 25,000 ‐ ‐ ‐ ‐ 5,500,000 5,525,000
This project will establish a life cycle replacement program for the 800 MHz radio infrastructure and towers. According to radio vendors, the infrastructure of a radio
system has a life expectancy of 10‐20 years; this project assumes a 20‐year life span. This project sets aside money for the three towers and supporting equipment
to be replaced.
Radio vendors estimate their systems have a life expectancy of 20 years. This project creates an accumulating fund, beginning in FY17, to replace the towers and
future infrastructure on a 20‐year cycle. Based on the previous radio system, staff feels 20 years is the correct estimate through diligent maintenance, if parts remain
available. Estimated replacement costs total $6.2 million (Whitehall $3M; Vaughn Road $2M; Police $1M; American Tower $100k; UGA Tower $100k).
No Impact
Capital Detail by Department
FY20 Budget D-33

Central Services Department Priority
Parking Facilities 12 of 18CS, Facilities Project Timeline: Ongoing
Project Description
Project Justification
Impact on Annual Operating Expenses
Financial Plan Project ID: c0230
FY18 FY19 FY20 FY21 FY22 FY23 FY24 FY25‐29 Total
End Bal. Budget Approved Proposed Proposed Proposed Proposed Proposed Proposed
SOURCES
General Capital Fund 10,777 20,000 20,000 ‐ ‐ ‐ ‐ 100,000 120,000
TOTAL SOURCES 10,777 20,000 20,000 ‐ ‐ ‐ ‐ 100,000 120,000
USES
Capital ‐ Const. 10,777 20,000 20,000 ‐ ‐ ‐ ‐ 100,000 120,000
TOTAL USES 10,777 20,000 20,000 ‐ ‐ ‐ ‐ 100,000 120,000
Maintain downtown public parking facilities (excluding parking deck facilities life cycle) and repair and/or replace parking meters outside of downtown, as well as
maintain equipment and software for the ticket system.
Provide funding to maintain downtown and other on‐street public parking facilities and spaces such as, painting of the parking stripes, replacing damaged parking
meters, and repairing of surface parking facilities and equipment.
No Impact
Capital Detail by Department FY20 Budget D-34

Central Services Department Priority
Parking Decks Life Cycle Replacement 13 of 18CS, Facilities Project Timeline: Ongoing
Project Description
Project Justification
Impact on Annual Operating Expenses
Financial Plan Project ID: c0255
FY18 FY19 FY20 FY21 FY22 FY23 FY24 FY25‐29 Total
End Bal. Budget Approved Proposed Proposed Proposed Proposed Proposed Proposed
SOURCES
General Capital Fund 285,537 ‐ ‐ ‐ ‐ ‐ ‐ 350,000 350,000
Hotel/Motel Spec Rev Fund 53,381 ‐ ‐ ‐ ‐ ‐ ‐ ‐ ‐
TOTAL SOURCES 338,918 ‐ ‐ ‐ ‐ ‐ ‐ 350,000 350,000
USES
Capital ‐ Const. 338,918 ‐ ‐ ‐ ‐ ‐ ‐ 350,000 350,000
TOTAL USES 338,918 ‐ ‐ ‐ ‐ ‐ ‐ 350,000 350,000
This Life Cycle Program for the College Avenue Deck and the West Washington Building parking deck is an annual plan to replace key building equipment and
components at or near the end of their normal life expectancy.
This program is needed to ensure that adequate funds are available, on an annual basis, to maintain the College Avenue Parking Deck and the West Washington
Building parking deck. The protection gained comes in the form of extended life expectancy and safer and more productive work environments.
No Impact
Capital Detail by Department
FY20 Budget D-35

Central Services Department Priority
Community Events Program 14 of 18CS, General Project Timeline: Ongoing
Project Description
Project Justification
Impact on Annual Operating Expenses
Financial Plan Project ID: c0135
FY18 FY19 FY20 FY21 FY22 FY23 FY24 FY25‐29 Total
End Bal. Budget Approved Proposed Proposed Proposed Proposed Proposed Proposed
SOURCES
Hotel/Motel Spec Rev Fund 4,124 30,000 40,000 40,000 40,000 40,000 40,000 200,000 400,000
TOTAL SOURCES 4,124 30,000 40,000 40,000 40,000 40,000 40,000 200,000 400,000
USES
Capital ‐ Machinery & Equip 4,124 30,000 40,000 40,000 40,000 40,000 40,000 200,000 400,000
TOTAL USES 4,124 30,000 40,000 40,000 40,000 40,000 40,000 200,000 400,000
This program provides materials and services in support of the Athens Downtown Development Authority (ADDA) "Community Events Program" (CEP). This funding
allows Central Services to partner with Athens Downtown Development Authority (ADDA) to host a seasonal array of community events and utilize the Central
Business District as a "stage." Examples of materials requiring capital funding include seasonal lighting, garlands, electrical circuits, banner brackets, and protective
fencing and barricades. Cost estimates are from Central Services Department staff. NOTE: This project is not the CEP budget that is allocated to ADDA annually to
support downtown special events.
The Christmas Season and Athfest are examples of events that characterize Athens‐Clarke County (ACC) as a community interested in providing quality outdoor
entertainment and enhancements to citizens and visitors while additionally benefiting merchants within the Central Business District. This base level of support to
the streetscape infrastructure (the stage) by ACC will encourage seasonal events marketed by ADDA. Overall, funding for this project will promote economic
development and enhance the quality of life for merchants, community citizens, and community visitors.
No Impact
Capital Detail by Department FY20 Budget D-36

Central Services Department Priority
Downtown Enhancement Project 15 of 18AI, General Project Timeline: Ongoing
Project Description
Project Justification
Impact on Annual Operating Expenses
Financial Plan Project ID: c0367
FY18 FY19 FY20 FY21 FY22 FY23 FY24 FY25‐29 Total
End Bal. Budget Approved Proposed Proposed Proposed Proposed Proposed Proposed
SOURCES
General Capital Fund ‐ 60,000 60,000 60,000 60,000 60,000 60,000 300,000 600,000
TOTAL SOURCES ‐ 60,000 60,000 60,000 60,000 60,000 60,000 300,000 600,000
USES
Capital ‐ Const. ‐ 60,000 60,000 60,000 60,000 60,000 60,000 300,000 600,000
TOTAL USES ‐ 60,000 60,000 60,000 60,000 60,000 60,000 300,000 600,000
The Downtown Enhancement Program (DEP) has been established to provide funding to the Athens Downtown Development Authority (ADDA) for capital and
operating expenses in support of downtown improvement activities. Funding for the DEP comes from downtown parking revenues. The ADDA will submit a plan for
approval by the Mayor and Commission prior to expending any funds from the DEP program.
The Downtown Enhancement Program was established in September 2002 as a part of the parking services contract between Athens‐Clarke County and the ADDA.
No Impact
Capital Detail by Department
FY20 Budget D-37

Central Services Department Priority
Telephone System Life Cycle Replacement 16 of 18CS, Equipment Project Timeline: Ongoing
Project Description
Project Justification
Impact on Annual Operating Expenses
Financial Plan Project ID: c0238
FY18 FY19 FY20 FY21 FY22 FY23 FY24 FY25‐29 Total
End Bal. Budget Approved Proposed Proposed Proposed Proposed Proposed Proposed
SOURCES
General Capital Fund 543,757 ‐ ‐ ‐ ‐ ‐ ‐ ‐ ‐
Internal Support Fund 231,015 25,000 25,000 25,000 25,000 25,000 25,000 125,000 250,000
TOTAL SOURCES 774,773 25,000 25,000 25,000 25,000 25,000 25,000 125,000 250,000
USES
Capital ‐ Machinery & Equip 774,773 25,000 25,000 25,000 25,000 25,000 25,000 125,000 250,000
TOTAL USES 774,773 25,000 25,000 25,000 25,000 25,000 25,000 125,000 250,000
Purchase and replace outdated telephone systems and equipment as existing hardware reaches the end of its useful life. This project will also transition the multiple
ACCUG phone systems to a new Voice‐over‐IP (VoIP) solution that will reduce future operating expenses.
Telephonic communications is critical to the functioning and service delivery of all departments of the Unified Government of Athens‐Clarke County. Equipment is
aging and mostly of analog technology. A transition to VoIP requires a significant capital investment.
VoIP should provide significant operating expense savings throughout ACCUG departments by eliminating the dependence on conventional phone systems.
Capital Detail by Department FY20 Budget D-38

Central Services Department Priority
Energy Management Improvements 17 of 18CS, General Project Timeline: Ongoing
Project Description
Project Justification
Impact on Annual Operating Expenses
Financial Plan Project ID: c0487
FY18 FY19 FY20 FY21 FY22 FY23 FY24 FY25‐29 Total
End Bal. Budget Approved Proposed Proposed Proposed Proposed Proposed Proposed
SOURCES
General Capital Fund 65,884 ‐ ‐ ‐ ‐ ‐ ‐ 150,000 150,000
TOTAL SOURCES 65,884 ‐ ‐ ‐ ‐ ‐ ‐ 150,000 150,000
USES
Capital ‐ Const. 65,884 ‐ ‐ ‐ ‐ ‐ ‐ 150,000 150,000
TOTAL USES 65,884 ‐ ‐ ‐ ‐ ‐ ‐ 150,000 150,000
The purpose of the Energy Management Program is to reduce energy consumption & costs at ACC facilities. This project provides funding for the implementation of
proven energy savings measures & audits to identify those measures. Funds may be used as a one time life cycle augmentation where it can be demonstrated that
the early replacement or upgrading of equipment will result in energy savings.
The justification for this project is reduction in energy consumption and proven energy cost savings. Projects will increase savings to Athens‐Clarke County and
reduce our carbon footprint. Further savings could be realized through a broader program application and additional annual funding.
Possible reduction in energy consumption costs.
Capital Detail by Department
FY20 Budget D-39

Central Services Department Priority
Fleet Replacement Program 18 of 18CS, Equipment Project Timeline: Ongoing
Project Description
Project Justification
Impact on Annual Operating Expenses
Financial Plan Project ID: N/A
FY18 FY19 FY20 FY21 FY22 FY23 FY24 FY25‐29 Total
End Bal. Budget Approved Proposed Proposed Proposed Proposed Proposed Proposed
SOURCES
Fleet Replacement Fund ‐ 2,790,800 3,102,000 2,413,400 2,724,600 2,746,500 2,900,000 13,933,000 27,819,500
TOTAL SOURCES ‐ 2,790,800 3,102,000 2,413,400 2,724,600 2,746,500 2,900,000 13,933,000 27,819,500
USES
Capital ‐ Vehicles ‐ 2,790,800 3,102,000 2,413,400 2,724,600 2,746,500 2,900,000 13,933,000 27,819,500
TOTAL USES ‐ 2,790,800 3,102,000 2,413,400 2,724,600 2,746,500 2,900,000 13,933,000 27,819,500
The Internal Service Fund Fleet Management is funded from the user departmental contributions. These expenditures are for the authorized replacement of vehicles
and equipment that have reached the end of their useful life. There are 720 vehicles and pieces of equipment in the Fleet Replacement Program. Specific vehicle
replacements are approved each year by the Manager.
Replacement of vehicles and equipment on a planned schedule reduces repair costs, downtime and provides for a constant funding strategy to meet the vehicle
needs of the user departments.
Without the Fleet Enterprise fund, the replacement of these vehicles would need to be programmed by each individual department using existing funding sources.
Capital Detail by Department FY20 Budget D-40

Corrections Department Priority
Food Service Equipment Life Cycle Replacement 1 of 2CS, Equipment Project Timeline: Ongoing
Project Description
Project Justification
Impact on Annual Operating Expenses
Financial Plan Project ID: c0180
FY18 FY19 FY20 FY21 FY22 FY23 FY24 FY25‐29 Total
End Bal. Budget Approved Proposed Proposed Proposed Proposed Proposed Proposed
SOURCES
General Capital Fund 777 20,000 20,000 20,000 20,000 20,000 ‐ 30,000 110,000
TOTAL SOURCES 777 20,000 20,000 20,000 20,000 20,000 ‐ 30,000 110,000
USES
Capital ‐ Machinery & Equip 777 20,000 20,000 20,000 20,000 20,000 ‐ 30,000 110,000
TOTAL USES 777 20,000 20,000 20,000 20,000 20,000 ‐ 30,000 110,000
The Correctional Facility's food service kitchen supplies meals to the Prison (Correctional Institute), Diversion Center and the Jail. This request is to ensure that
kitchen equipment is safe, reliable and adequate for the volume of meals that need to be prepared.
Meals provided by the Corrections Food Service Facility are a necessary component of the Jail, Correctional Institution and Diversion Center. Failure to provide meals
in a timely manner can result in inmate unrest and lawsuits. The existing kitchen, installed in 1987, was designed for serving meals only at the prison. Today,
Corrections prepares an average of 1,800 meals a day for the prison, diversion center and the jail. In FY05, because of the increase in the jail population, a new
SPLOST funded food service facility was opened. However, the existing kitchen is still used as a servicing center; and the existing dishwasher, warming oven, steam
table and other serving equipment must be maintained. Also, the prison kitchen is used as a backup kitchen and will be utilized during an upcoming renovation
project.
No Impact
Capital Detail by Department
FY20 Budget D-41

Corrections Department Priority
JMS Inmate Accountability Software Purchase (New) 2 of 2AI, Software Project Timeline: FY20 ‐ ongoing
Project Description
Project Justification
Impact on Annual Operating Expenses
Financial Plan Project ID: New
FY18 FY19 FY20 FY21 FY22 FY23 FY24 FY25‐29 Total
End. Bal. Budget Approved Proposed Proposed Proposed Proposed Proposed Proposed
SOURCES
General Capital Fund ‐ ‐ ‐ ‐ ‐ ‐ ‐ 39,900 39,900
TOTAL SOURCES ‐ ‐ ‐ ‐ ‐ ‐ ‐ 39,900 39,900
USES
Other ‐ ‐ ‐ ‐ ‐ ‐ ‐ 39,900 39,900
TOTAL USES ‐ ‐ ‐ ‐ ‐ ‐ ‐ 39,900 39,900
Purchase and support for Corrections Inmate Accountability Software
This software is necessary for fast and accurate inmate accountability in daily operations of the CI. The interface ability of the software with SCRIBE, Telephone and
Commissary systems would decrease response time in case of an emergency as well as decrease the number of data entry errors.
Annual operating expenses will only be impacted by the support fee of $7980.
Capital Detail by Department FY20 Budget D-42

District Attorney's Office Department Priority
Purchase a Special Service Vehicle 2019 Ford Explorer (New) 1 of 1CS, Equipment Project Timeline: FY20 ‐ FY20
Project Description
Project Justification
Impact on Annual Operating Expenses
Financial Plan Project ID: New
FY18 FY19 FY20 FY21 FY22 FY23 FY24 FY25‐29 Total
End. Bal. Budget Approved Proposed Proposed Proposed Proposed Proposed Proposed
SOURCES
General Capital Fund ‐ ‐ 26,000 ‐ ‐ ‐ 26,000
TOTAL SOURCES ‐ ‐ 26,000 ‐ ‐ ‐ ‐ ‐ 26,000
USES
Capital ‐ Vehicles ‐ ‐ 26,000 ‐ ‐ ‐ 26,000
TOTAL USES ‐ ‐ 26,000 ‐ ‐ ‐ ‐ ‐ 26,000
This request is for the purchase of a four‐door Pursuit Utility Vehicle (Explorer) for use by an Investigator of the District Attorney's Office for work related travel and
work related duties. The total cost of the vehicle is approximately $26,000.00. The expected useful life of the car would be 10‐12 years.
This vehicle will be used almost exclusively by an investigator with the District Attorneys Office for job related travel and job related duties. The Investigator is
currently using a pool car that is mechanically unsound and is well beyond its useful life. The duties of the Investigator is to handle job related duties such as serving
subpoenas, locating witnesses, securing evidence, traveling to and from training and any other job related duties of the District Attorney's Office.
Fuel: $1,200
Replacement: $2,600
Maintenance/Repairs: $1,500
Capital Detail by Department
FY20 Budget D-43
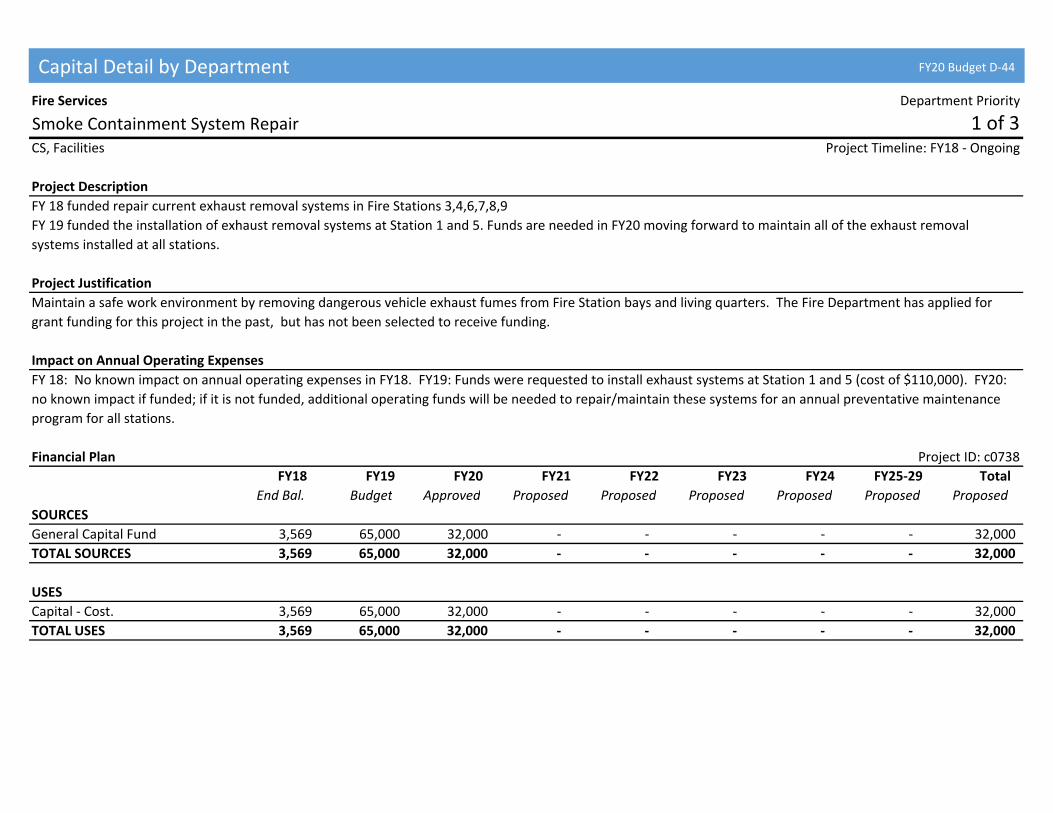
Fire Services Department Priority
Smoke Containment System Repair 1 of 3CS, Facilities Project Timeline: FY18 ‐ Ongoing
Project Description
Project Justification
Impact on Annual Operating Expenses
Financial Plan Project ID: c0738
FY18 FY19 FY20 FY21 FY22 FY23 FY24 FY25‐29 Total
End Bal. Budget Approved Proposed Proposed Proposed Proposed Proposed Proposed
SOURCES
General Capital Fund 3,569 65,000 32,000 ‐ ‐ ‐ ‐ ‐ 32,000
TOTAL SOURCES 3,569 65,000 32,000 ‐ ‐ ‐ ‐ ‐ 32,000
USES
Capital ‐ Cost. 3,569 65,000 32,000 ‐ ‐ ‐ ‐ ‐ 32,000
TOTAL USES 3,569 65,000 32,000 ‐ ‐ ‐ ‐ ‐ 32,000
FY 18 funded repair current exhaust removal systems in Fire Stations 3,4,6,7,8,9
FY 19 funded the installation of exhaust removal systems at Station 1 and 5. Funds are needed in FY20 moving forward to maintain all of the exhaust removal
systems installed at all stations.
Maintain a safe work environment by removing dangerous vehicle exhaust fumes from Fire Station bays and living quarters. The Fire Department has applied for
grant funding for this project in the past, but has not been selected to receive funding.
FY 18: No known impact on annual operating expenses in FY18. FY19: Funds were requested to install exhaust systems at Station 1 and 5 (cost of $110,000). FY20:
no known impact if funded; if it is not funded, additional operating funds will be needed to repair/maintain these systems for an annual preventative maintenance
program for all stations.
Capital Detail by Department FY20 Budget D-44

Fire Services Department Priority
Replace Mobile Data Terminals 2 of 3CS, Equipment Project Timeline: FY13 ‐ Ongoing
Project Description
Project Justification
Impact on Annual Operating Expenses
Financial Plan Project ID: c0659
FY18 FY19 FY20 FY21 FY22 FY23 FY24 FY25‐29 Total
End Bal. Budget Approved Proposed Proposed Proposed Proposed Proposed Proposed
SOURCES
General Capital Fund 107,701 50,000 ‐ 50,000 50,000 50,000 50,000 250,000 450,000
TOTAL SOURCES 107,701 50,000 ‐ 50,000 50,000 50,000 50,000 250,000 450,000
USES
Capital ‐ Machinery & Equip 107,701 50,000 ‐ 50,000 50,000 50,000 50,000 250,000 450,000
TOTAL USES 107,701 50,000 ‐ 50,000 50,000 50,000 50,000 250,000 450,000
Timely replacement of 28 MDT's currently installed in Fire Department vehicles and apparatus.
Information Technology Services recommended a 5 year replacement program for these devices, at which time the useful life expectancy will be reached.
Technology changes and maintenance costs will make replacement a more fiscally responsible alternative. New projected cost of replacement in FY23 is $250,000.
The request is $50,000 per year contribution continuing through FY23.
No Impact
Capital Detail by Department
FY20 Budget D-45

Fire Services Department Priority
Purchase Personal Protective Equipment (New) 3 of 3CS, Equipment Project Timeline: Ongoing
Project Description
Project Justification
Impact on Annual Operating Expenses
Financial Plan Project ID: New
FY18 FY19 FY20 FY21 FY22 FY23 FY24 FY25‐29 Total
End. Bal. Budget Approved Proposed Proposed Proposed Proposed Proposed Proposed
SOURCES
General Capital Fund ‐ ‐ ‐ 55,620 57,288 59,006 60,776 62,600 295,290
TOTAL SOURCES ‐ ‐ ‐ 55,620 57,288 59,006 60,776 62,600 295,290
USES
Capital ‐ Machinery & Equip ‐ ‐ ‐ 55,620 57,288 59,006 60,776 62,600 295,290
TOTAL USES ‐ ‐ ‐ 55,620 57,288 59,006 60,776 62,600 295,290
Replace personal protective gear for firefighting to follow NFPA guidelines ( PPE to be replaced every ten years). Currently there are 70 sets of turnout gear either
expired or going to expire this year being used. In addition, there are 50 helmets and 67 pairs of boots that have reached ten years of service. This program will
allow 18 sets of full turnout gear to be purchased per year and begin a sustainable replacement program.
Ensure firefighting personnel have the safest gear possible as they enter IDLH ( Immediate danger to life or health) areas and follow national consensus standards (
NFPA). NFPA 1851 requires that firefighters' personal protective equipment be replaced ten years after the manufacture date. The fire department currently has a
formal inspection, maintenance and repair program in compliance with NFPA 1851.
The protective gear and equipment line item in the operating budget would remain the same. This line item is used for turnout gear repair, other protective clothing
and to purchase gear when new employees are hired.
Capital Detail by Department FY20 Budget D-46

Information Technology Department Priority
Information Technology Equipment Replacement Program 1 of 1CS, Equipment Project Timeline: Ongoing
Project Description
Project Justification
Impact on Annual Operating Expenses
Financial Plan Project ID: c0095
FY18 FY19 FY20 FY21 FY22 FY23 FY24 FY25‐29 Total
End Bal. Budget Approved Proposed Proposed Proposed Proposed Proposed Proposed
SOURCES
General Capital Fund 643,754 290,000 400,000 350,000 415,000 500,000 415,000 890,000 2,995,000
TOTAL SOURCES 643,754 290,000 400,000 350,000 415,000 600,000 415,000 890,000 2,995,000
USES
Capital ‐ Machinery & Equip 643,754 290,000 450,000 350,000 415,000 500,000 415,000 890,000 2,995,000
TOTAL USES 643,754 290,000 450,000 350,000 415,000 600,000 415,000 890,000 2,995,000
This project will replace PCs and Printers in all departments that are six years old or older and are of such a configuration that they are no longer suitable for client
server applications. Locations are in all the departments and work units in Athens‐Clarke County. In addition, this project will replace, upgrade, and expand network
equipment and software required to support IT operations within the government.
This project is made up of various components that are required to maintain and keep ACC's IT infrastructure operational. Components include networking
equipment, software upgrades, main system replacement(s), wiring improvements, and various other necessary components.
Replacing some infrastructure gear will result in increased maintenance agreements and new purchases to expand some services will also bring about new
maintenance contracts.
Capital Detail by Department
FY20 Budget D-47
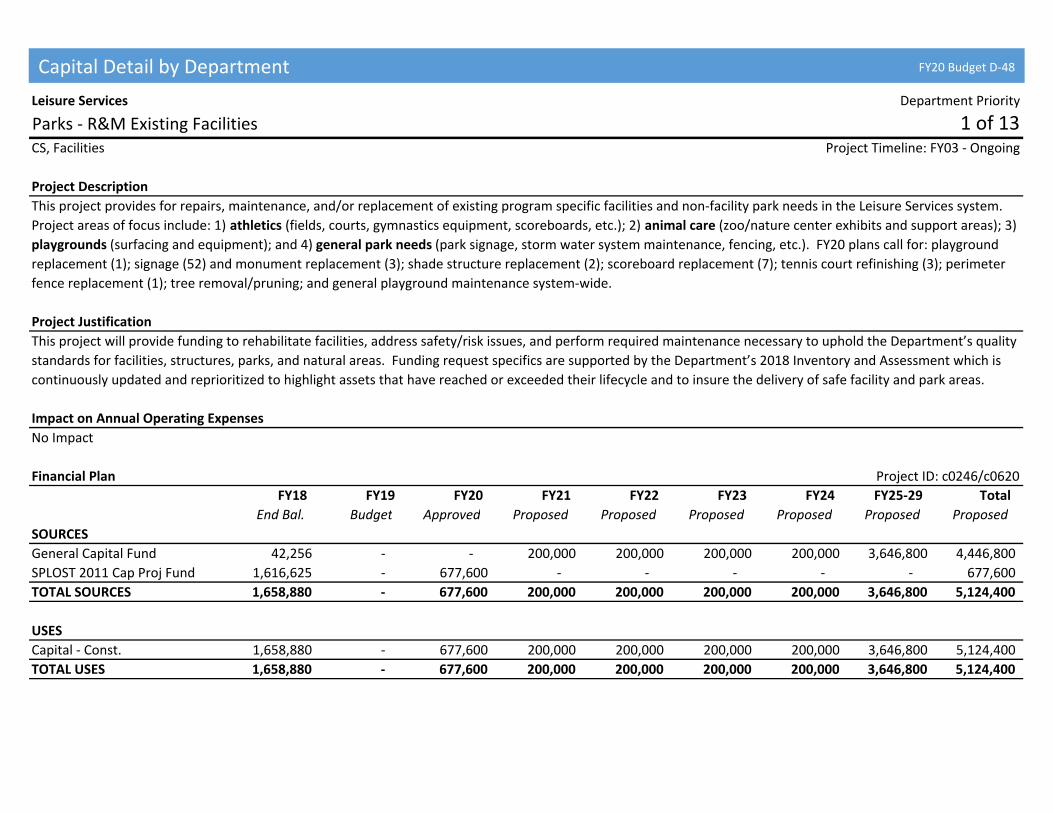
Leisure Services Department Priority
Parks ‐ R&M Existing Facilities 1 of 13CS, Facilities Project Timeline: FY03 ‐ Ongoing
Project Description
Project Justification
Impact on Annual Operating Expenses
Financial Plan Project ID: c0246/c0620
FY18 FY19 FY20 FY21 FY22 FY23 FY24 FY25‐29 Total
End Bal. Budget Approved Proposed Proposed Proposed Proposed Proposed Proposed
SOURCES
General Capital Fund 42,256 ‐ ‐ 200,000 200,000 200,000 200,000 3,646,800 4,446,800
SPLOST 2011 Cap Proj Fund 1,616,625 ‐ 677,600 ‐ ‐ ‐ ‐ ‐ 677,600
TOTAL SOURCES 1,658,880 ‐ 677,600 200,000 200,000 200,000 200,000 3,646,800 5,124,400
USES
Capital ‐ Const. 1,658,880 ‐ 677,600 200,000 200,000 200,000 200,000 3,646,800 5,124,400
TOTAL USES 1,658,880 ‐ 677,600 200,000 200,000 200,000 200,000 3,646,800 5,124,400
This project provides for repairs, maintenance, and/or replacement of existing program specific facilities and non‐facility park needs in the Leisure Services system.
Project areas of focus include: 1) athletics (fields, courts, gymnastics equipment, scoreboards, etc.); 2) animal care (zoo/nature center exhibits and support areas); 3)
playgrounds (surfacing and equipment); and 4) general park needs (park signage, storm water system maintenance, fencing, etc.). FY20 plans call for: playground
replacement (1); signage (52) and monument replacement (3); shade structure replacement (2); scoreboard replacement (7); tennis court refinishing (3); perimeter
fence replacement (1); tree removal/pruning; and general playground maintenance system‐wide.
This project will provide funding to rehabilitate facilities, address safety/risk issues, and perform required maintenance necessary to uphold the Department’s quality
standards for facilities, structures, parks, and natural areas. Funding request specifics are supported by the Department’s 2018 Inventory and Assessment which is
continuously updated and reprioritized to highlight assets that have reached or exceeded their lifecycle and to insure the delivery of safe facility and park areas.
No Impact
Capital Detail by Department FY20 Budget D-48

Leisure Services Department Priority
Pool Repairs and Renovations 2 of 13CS, Facilities Project Timeline: FY11 ‐ Ongoing
Project Description
Project Justification
Impact on Annual Operating Expenses
Financial Plan Project ID: c0642
FY18 FY19 FY20 FY21 FY22 FY23 FY24 FY25‐29 Total
End Bal. Budget Approved Proposed Proposed Proposed Proposed Proposed Proposed
SOURCES
General Capital Fund 17,875 ‐ 90,000 ‐ ‐ ‐ ‐ 790,200 880,200
TOTAL SOURCES 17,875 ‐ 90,000 ‐ ‐ ‐ ‐ 790,200 880,200
USES
Capital ‐ Const. 17,875 ‐ 90,000 ‐ ‐ ‐ ‐ 790,200 880,200
TOTAL USES 17,875 ‐ 90,000 ‐ ‐ ‐ ‐ 790,200 880,200
This project provides for repairs, maintenance and code upgrades for the one wading pool, five swimming pools, and two splash pads operated in the Leisure
Services system. Projects supported by this program include maintenance and replacement of filtration equipment, chemical controllers, splash pad features, and
aquatics elements such as diving boards, pool decks, and liners. FY20 plans call for the replacement of: filtration pumps (3); ADA lifts (6); lifeguard stands (17); and
pool covers (2). The large increase in FY23 represents the end‐of‐life replacement for equipment at Rocksprings, Bishop, and Trail Creek (all of which came online
with new equipment in 2013).
This project will provide funding to rehabilitate and renovate facilities, address safety and risk issues, and perform required maintenance necessary to uphold the
Department’s quality standards for aquatic facilities and water features. Funding request specifics are supported by the Department’s 2018 Inventory and
Assessment which is continuously updated and reprioritized to highlight assets that have reached or exceeded their lifecycle and to insure the delivery of safe aquatic
facility and water feature areas.
No Impact
Capital Detail by Department
FY20 Budget D-49

Leisure Services Department Priority
Bridge and Boardwalk Inspection and Replacement 3 of 13CS, Facilities Project Timeline: FY17 ‐ Ongoing
Project Description
Project Justification
Impact on Annual Operating Expenses
Financial Plan Project ID: c0727
FY18 FY19 FY20 FY21 FY22 FY23 FY24 FY25‐29 Total
End Bal. Budget Approved Proposed Proposed Proposed Proposed Proposed Proposed
SOURCES
General Capital Fund 32,443 ‐ ‐ ‐ ‐ ‐ ‐ 1,156,100 1,156,100
TOTAL SOURCES 32,443 ‐ ‐ ‐ ‐ ‐ ‐ 1,156,100 1,156,100
USES
Capital ‐ Infrastructure 32,443 ‐ ‐ ‐ ‐ ‐ ‐ 1,081,100 1,081,100
Capital ‐ Other ‐ ‐ ‐ ‐ ‐ ‐ ‐ 75,000 75,000
TOTAL USES 32,443 ‐ ‐ ‐ ‐ ‐ ‐ 1,156,100 1,156,100
This project provides for professional engineering inspections, major maintenance, and lifecycle replacement for all 86 bridges, boardwalks, and observation decks in
the Leisure Services system. FY20 plans call for replacing wooden bridges at Sandy Creek Nature Center, Memorial Park, and around Lakeside Trail at Sandy Creek
Park which rated poorly in our bridge and boardwalk inspections. FY20 plans also address improvements to emergency access bridges on remote trails at Sandy
Creek Park, Sandy Creek Nature Center, and the Cook's Trail.
Totaling more than 1.9 miles, approximately half of the bridges, boardwalks and decks covered by this project are all‐wood structures estimated to be 25 or more
years old, and do not meet modern building code or safety requirements. Funding request specifics are supported by the Department’s annual Inventory and
Assessment conducted annually since 2015. Cost estimates include escalations as required for what are primarily limited access and environmentally sensitive
wetland construction sites. Project funding is necessary to ensure public safety and to keep the trails that these structures support fully operational.
No Impact
Capital Detail by Department FY20 Budget D-50

Leisure Services Department Priority
Pavement Repair and Maintenance 4 of 13CS, Facilities Project Timeline: FY18 ‐ Ongoing
Project Description
Project Justification
Impact on Annual Operating Expenses
Financial Plan Project ID: c0740
FY18 FY19 FY20 FY21 FY22 FY23 FY24 FY25‐29 Total
End Bal. Budget Approved Proposed Proposed Proposed Proposed Proposed Proposed
SOURCES
General Capital Fund 34,461 30,000 ‐ ‐ ‐ ‐ ‐ 1,232,900 1,232,900
TOTAL SOURCES 34,461 30,000 ‐ ‐ ‐ ‐ ‐ 1,232,900 1,232,900
USES
Capital ‐ Infrastructure 34,461 30,000 ‐ ‐ ‐ ‐ ‐ 1,232,900 1,232,900
TOTAL USES 34,461 30,000 ‐ ‐ ‐ ‐ ‐ 1,232,900 1,232,900
This project provides for repairs, maintenance, and/or replacement of existing paved surfaces in the Leisure Services system. Projects supported by this program
include asphalt maintenance, paving, parking lot striping, sidewalk grinding, and replacement of guardrails and regulatory and wayfinding signage. FY20 plans call for
milling and repaving ~0.55 miles of two‐lane roadway and parking between Sandy Creek and the Nature Center which also acts as part of the greenway. FY20
remaining funds will support completion of Phase 1 work to repair, repave, and stripe a section of the existing paved roads and parking lot at the Holland Youth
Sports Complex.
The park and facility system comprises over nine miles of paved trail, four miles of roadways, and more than 1.4 million square feet of parking areas and sidewalks.
Funding request specifics are supported by the Department’s 2018 Inventory and Assessment which inspects paved surface conditions relative to striping, cracking,
alligatoring, heaving and potholes, and also evaluates the visibility/condition of signage. Project funding is necessary to ensure public accessibility and safety and to
maintain a positive curb appeal for park patrons.
No Impact
Capital Detail by Department
FY20 Budget D-51

Leisure Services Department Priority
Park Equipment ‐ Replacement / Life Cycle 5 of 13CS, Equipment Project Timeline: FY03 ‐ Ongoing
Project Description
Project Justification
Impact on Annual Operating Expenses
Financial Plan Project ID: c0177
FY18 FY19 FY20 FY21 FY22 FY23 FY24 FY25‐29 Total
End Bal. Budget Approved Proposed Proposed Proposed Proposed Proposed Proposed
SOURCES
General Capital Fund 2,503 ‐ 50,000 ‐ ‐ ‐ ‐ 471,000 521,000
TOTAL SOURCES 2,503 ‐ 50,000 ‐ ‐ ‐ ‐ 471,000 521,000
USES
Capital ‐ Machinery & Equip 2,503 ‐ 50,000 ‐ ‐ ‐ ‐ 471,000 521,000
TOTAL USES 2,503 ‐ 50,000 ‐ ‐ ‐ ‐ 471,000 521,000
This project provides for replacement of park amenities and service equipment covering all 28 sites and 2,500 acres supported in the Leisure Services system. Park
amenities include items such as trash cans, picnic tables, benches, and barbeque grills while service equipment includes items such as fitness/computer lab
equipment, ice machines, catering kitchen appliances, and ATV's. Outdoor equipment is selected with a minimum 30 year service life. FY20 plans call for the
replacement of: trash cans (35); benches (27); computer lab pc's (13); heavy duty pressure washer (1); picnic tables (10); gym equipment (1); and ice machines (1).
This project will provide funding to replace amenities and equipment supporting service delivery which have reached the end of their serviceable life. Funding
request specifics are supported by the Department’s 2018 Inventory and Assessment which is continuously updated and reprioritized to highlight replacement needs
based on equipment age, condition, and use. Support of this program allows Leisure Services staff to replace deteriorated and broken amenities and service
equipment without impact to the public.
No Impact
Capital Detail by Department FY20 Budget D-52

Leisure Services Department Priority
Create a Property Boundary Program 6 of 13CS, General Project Timeline: FY18 ‐ FY26
Project Description
Project Justification
Impact on Annual Operating Expenses
Financial Plan Project ID: c0741
FY18 FY19 FY20 FY21 FY22 FY23 FY24 FY25‐29 Total
End Bal. Budget Approved Proposed Proposed Proposed Proposed Proposed Proposed
SOURCES
General Capital Fund 31,319 ‐ ‐ ‐ ‐ ‐ ‐ 100,000 100,000
TOTAL SOURCES 31,319 ‐ ‐ ‐ ‐ ‐ ‐ 100,000 100,000
USES
Capital ‐ Other 31,319 ‐ ‐ ‐ ‐ ‐ ‐ 100,000 100,000
TOTAL USES 31,319 ‐ ‐ ‐ ‐ ‐ ‐ 100,000 100,000
This project provides for surveying/permanently marking all property and updating/consolidating deeds for all 2,500+ acres owned by ACCUG and managed by the
Leisure Services Department. Project completion will establish boundary lines for the integration of property restrictions into the GIS planning database and will
provide critical data for park planning and development. This project will be phased over multiple years by systematically addressing the property boundaries.
Properties comprising the Leisure Services system encompass more than 50 miles of boundaries. Development along park boundaries has created issues ranging
from direct property encroachment to the creation of unofficial or illegal access points. Unmarked property boundaries hamper assessment and response to
boundary related issues. Further complicating matters, ongoing incremental property acquisition as part of park and greenway expansion has led to some sites being
comprised of upwards of 20 parcels which need to be combined. This program will allow for better land management and provide accurate base data for park
planning and development.
No Impact
Capital Detail by Department
FY20 Budget D-53

Leisure Services Department Priority
Bishop Park Renovations 7 of 13AI, Facilities Project Timeline: FY24 ‐ FY26
Project Description
Project Justification
Impact on Annual Operating Expenses
Financial Plan Project ID: N/A
FY18 FY19 FY20 FY21 FY22 FY23 FY24 FY25‐29 Total
End Bal. Budget Approved Proposed Proposed Proposed Proposed Proposed Proposed
SOURCES
General Capital Fund ‐ ‐ ‐ ‐ ‐ ‐ ‐ 25,500,000 25,500,000
TOTAL SOURCES ‐ ‐ ‐ ‐ ‐ ‐ ‐ 25,500,000 25,500,000
USES
Capital ‐ Const. ‐ ‐ ‐ ‐ ‐ ‐ ‐ 14,500,000 14,500,000
Capital ‐ Infrastructure ‐ ‐ ‐ ‐ ‐ ‐ ‐ 1,500,000 1,500,000
Capital ‐ Other ‐ ‐ ‐ ‐ ‐ ‐ ‐ 1,500,000 1,500,000
Capital ‐ Site Improvements ‐ ‐ ‐ ‐ ‐ ‐ ‐ 8,000,000 8,000,000
TOTAL USES ‐ ‐ ‐ ‐ ‐ ‐ ‐ 25,500,000 25,500,000
This project provides for implementation of the Bishop Park master plan. The project will involve: renovation of the existing facility; replacement of the non‐code
compliant restroom building and picnic shelter; redesign of the parking lot areas, the Hawthorne Ave Corridor, and the swimming pool; an addition of a splash pad;
and improvements to aged water, sewer, and storm water infrastructure. The renovated facility will provide increased space for: gymnastics programming; rentable
multi‐purpose programming; administrative offices; and the provision of large scale events such as the Athens Farmer’s Market through conversion of the covered
tennis courts to a pavilion.
The majority of the buildings at Bishop Park date from the 1970’s and do not meet modern code requirements, programmatic use/space demands or ADA
compliance. This project will provide funding to: address code, ADA, and safety compliance issues; provide public restroom access; increase program, event, and
park capacity; modernize water/sewer infrastructure; and replace and expand multiple 40+ year old structures. This park experiences the highest degree of patron
utilization within the Leisure Services system and is highly regarded and strongly enjoyed by the general public.
Operating: $100.0K per year
Capital Detail by Department FY20 Budget D-54

Leisure Services Department Priority
Memorial Park Renovations 8 of 13AI, Facilities Project Timeline: FY24 ‐ FY26
Project Description
Project Justification
Impact on Annual Operating Expenses
Financial Plan Project ID: N/A
FY18 FY19 FY20 FY21 FY22 FY23 FY24 FY25‐29 Total
End Bal. Budget Approved Proposed Proposed Proposed Proposed Proposed Proposed
SOURCES
General Capital Fund ‐ ‐ ‐ ‐ ‐ ‐ ‐ 10,850,000 10,850,000
TOTAL SOURCES ‐ ‐ ‐ ‐ ‐ ‐ ‐ 10,850,000 10,850,000
USES
Capital ‐ Infrastructure ‐ ‐ ‐ ‐ ‐ ‐ ‐ 500,000 500,000
Capital ‐ Other ‐ ‐ ‐ ‐ ‐ ‐ ‐ 350,000 350,000
Capital ‐ Site Improvements ‐ ‐ ‐ ‐ ‐ ‐ ‐ 10,000,000 10,000,000
TOTAL USES ‐ ‐ ‐ ‐ ‐ ‐ ‐ 10,850,000 10,850,000
This project provides for replacement of failing, overburdened, and in some areas, non‐existent water and sewer infrastructure throughout Memorial Park, thereby
reducing service requirements and increasing facility availability for patrons. This project will execute the redesign and reconstruction of several key park features to
include circulation drives, parking areas, the dog park, and walking paths to address significant erosion and storm water control issues.
Water line breaks, electrical failures, and clogged sewer lines have consistently had negative impacts on patron services such as restroom availability. The installation
of new sewer lines in the Zoo will correct disposal practices that are not environmentally friendly. Inadequate storm water controls create major erosion issues
which have recently led to facility closures and significant damage to playground and picnic shelter amenities. This project will provide funding to improve patron
accessibility, park sustainability, and maintenance efficiency by reducing current reactive emergency maintenance requirements.
Operating: $10.0K per year
Capital Detail by Department
FY20 Budget D-55

Leisure Services Department Priority
Improve Bear Hollow Zoo Exhibits & Visitor Amenities 9 of 13AI, Facilities Project Timeline: FY24 ‐ FY26
Project Description
Project Justification
Impact on Annual Operating Expenses
Financial Plan Project ID: N/A
FY18 FY19 FY20 FY21 FY22 FY23 FY24 FY25‐29 Total
End Bal. Budget Approved Proposed Proposed Proposed Proposed Proposed Proposed
SOURCES
General Capital Fund ‐ ‐ ‐ ‐ ‐ ‐ ‐ 2,750,000 2,750,000
TOTAL SOURCES ‐ ‐ ‐ ‐ ‐ ‐ ‐ 2,750,000 2,750,000
USES
Capital ‐ Infrastructure ‐ ‐ ‐ ‐ ‐ ‐ ‐ 500,000 500,000
Capital ‐ Other ‐ ‐ ‐ ‐ ‐ ‐ ‐ 250,000 250,000
Capital ‐ Site Improvements ‐ ‐ ‐ ‐ ‐ ‐ ‐ 2,000,000 2,000,000
TOTAL USES ‐ ‐ ‐ ‐ ‐ ‐ ‐ 2,750,000 2,750,000
This project provides for addressing failing infrastructure and safety issues within the Zoo, as well as non‐compliance with standards of the United States Department
of Agriculture (USDA), American Zoo Association (AZA) and Americans with Disabilities Act (ADA). The project includes: the creation of a Zoo site master plan;
construction of a visitor entry and restroom facility; creation of a gray‐water system; reconstruction of pedestrian walking paths; upgrades to animal exhibits; and
fence replacements for the entire park perimeter, animal enclosures, and the reptile house.
The existing Zoo fails to meet national standards for safety and access including USDA standards for animal safety and care, AZA standards for perimeter fence
security, and ADA standards for access. Continued non‐compliance with USDA and AZA standards will reduce access to regulated animals. A master plan will provide
for the long‐term viability of the site while improvements are needed to enhance the safety and care of the animals, to reduce the risk of animal escape, and to
provide universal public access to this unique facility.
Operating: $10.0K per year
Capital Detail by Department FY20 Budget D-56

Leisure Services Department Priority
Dudley Park Improvements 10 of 13AI, Facilities Project Timeline: FY18 ‐ FY26
Project Description
Project Justification
Impact on Annual Operating Expenses
Financial Plan Project ID: c0621
FY18 FY19 FY20 FY21 FY22 FY23 FY24 FY25‐29 Total
End Bal. Budget Approved Proposed Proposed Proposed Proposed Proposed Proposed
SOURCES
General Capital Fund ‐ ‐ ‐ ‐ ‐ ‐ ‐ 850,000 850,000
SPLOST 2011 Cap Proj Fund 970,000 ‐ ‐ ‐ ‐ ‐ ‐ ‐ ‐
TOTAL SOURCES 970,000 ‐ ‐ ‐ ‐ ‐ 850,000 850,000
USES
Capital ‐ Other ‐ ‐ ‐ ‐ ‐ ‐ ‐ ‐ ‐
Capital ‐ Site Improvements 970,000 ‐ ‐ ‐ ‐ ‐ ‐ 850,000 850,000
TOTAL USES 970,000 ‐ ‐ ‐ ‐ ‐ ‐ 850,000 850,000
This project provides for the development of Dudley Park, a 28‐acre park located adjacent to downtown. SPLOST 2011 Project #17 provides initial funding for this
work beginning in Tier 7 (FY18). The SPLOST project will begin with a master plan review and development of a priority list for development of this park.
Development may include: picnic shelter(s); river overlooks; restrooms; an amphitheater; a playground; and additional parking. The CIP funding requested here will
augment the limited SPLOST funds to allow for more complete development of this centrally located riverside park.
Dudley Park’s proximity to downtown coupled with the beautiful, general park setting makes it a special draw to the many people who visit this part of the county.
While Dudley Park has served as a passive park with limited utilization for many years, implementation of the park improvement plan will maximize the significant
untapped potential and utilization of this park environment. These infrastructure improvements will also create the potential for revenue generation through rental,
festival, and special event activities.
Operating: $56.0K per year NOTE: Estimated revenue of approximately $20.0K per year
Capital Detail by Department
FY20 Budget D-57
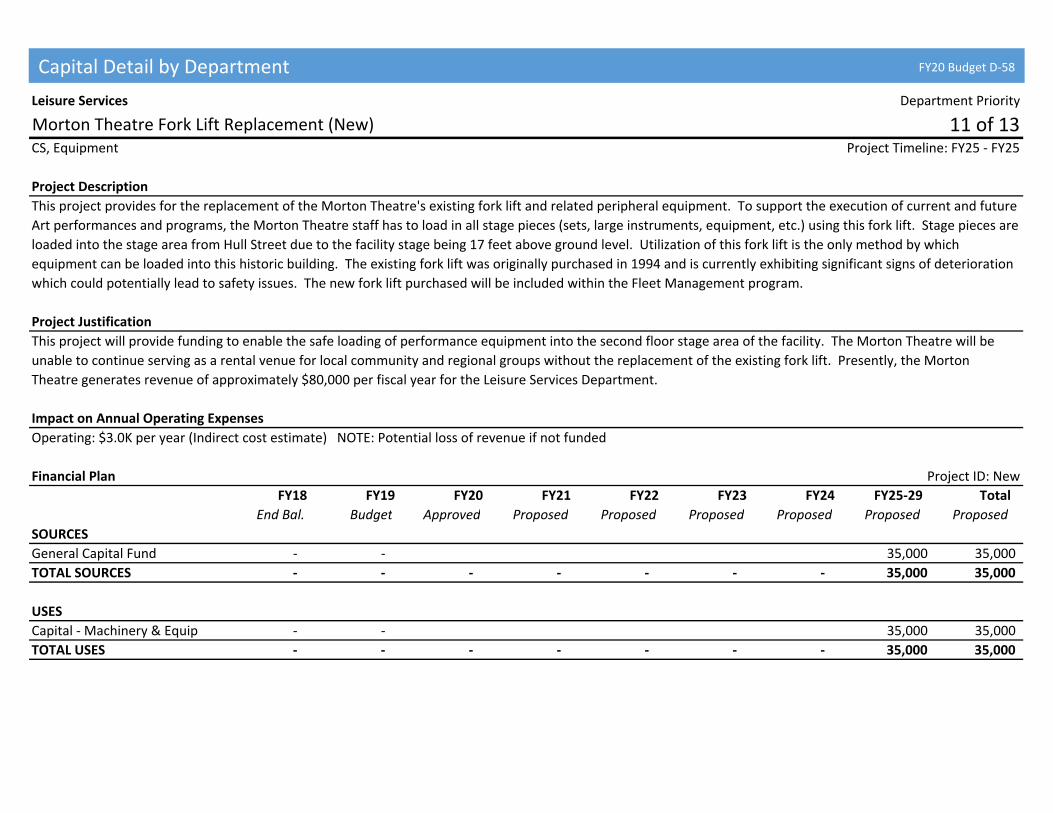
Leisure Services Department Priority
Morton Theatre Fork Lift Replacement (New) 11 of 13CS, Equipment Project Timeline: FY25 ‐ FY25
Project Description
Project Justification
Impact on Annual Operating Expenses
Financial Plan Project ID: New
FY18 FY19 FY20 FY21 FY22 FY23 FY24 FY25‐29 Total
End Bal. Budget Approved Proposed Proposed Proposed Proposed Proposed Proposed
SOURCES
General Capital Fund ‐ ‐ 35,000 35,000
TOTAL SOURCES ‐ ‐ ‐ ‐ ‐ ‐ ‐ 35,000 35,000
USES
Capital ‐ Machinery & Equip ‐ ‐ 35,000 35,000
TOTAL USES ‐ ‐ ‐ ‐ ‐ ‐ ‐ 35,000 35,000
This project provides for the replacement of the Morton Theatre's existing fork lift and related peripheral equipment. To support the execution of current and future
Art performances and programs, the Morton Theatre staff has to load in all stage pieces (sets, large instruments, equipment, etc.) using this fork lift. Stage pieces are
loaded into the stage area from Hull Street due to the facility stage being 17 feet above ground level. Utilization of this fork lift is the only method by which
equipment can be loaded into this historic building. The existing fork lift was originally purchased in 1994 and is currently exhibiting significant signs of deterioration
which could potentially lead to safety issues. The new fork lift purchased will be included within the Fleet Management program.
This project will provide funding to enable the safe loading of performance equipment into the second floor stage area of the facility. The Morton Theatre will be
unable to continue serving as a rental venue for local community and regional groups without the replacement of the existing fork lift. Presently, the Morton
Theatre generates revenue of approximately $80,000 per fiscal year for the Leisure Services Department.
Operating: $3.0K per year (Indirect cost estimate) NOTE: Potential loss of revenue if not funded
Capital Detail by Department FY20 Budget D-58

Leisure Services Department Priority
Trails & Open Spaces Compact Track Loader Equipment (New) 12 of 13AI, Equipment Project Timeline: FY25 ‐ FY25
Project Description
Project Justification
Impact on Annual Operating Expenses
Financial Plan Project ID: New
FY18 FY19 FY20 FY21 FY22 FY23 FY24 FY25‐29 Total
End Bal. Budget Approved Proposed Proposed Proposed Proposed Proposed Proposed
SOURCES
General Capital Fund ‐ ‐ 35,000 35,000
TOTAL SOURCES ‐ ‐ ‐ ‐ ‐ ‐ ‐ 35,000 35,000
USES
Capital ‐ Machinery & Equip ‐ ‐ 35,000 35,000
TOTAL USES ‐ ‐ ‐ ‐ ‐ ‐ ‐ 35,000 35,000
This project provides for the purchase of a mini‐tracked excavator (similar to a Toro Dingo) to be utilized by the Trails & Open Spaces staff. This much needed
equipment will allow for significantly improved management and safety of existing and proposed greenways, trails, and open space areas throughout the community.
This piece of landscape management equipment is able to regrade trails washed out due to storms, remove fallen trees, and deliver soil stabilization material such as
riprap and gravel. The project also provides for the purchase of several attachments to include a bucket, a grabbing bucket, and an auger bit for the installation of
fence posts and sign posts.
This project will provide funding to: improve land management resources; enhance public safety within the trail system; increase staff efficiencies by reducing
maintenance activity time; and reduce the usage of subcontractors for maintenance work. The Trails & Open Spaces staff services the many miles of trails at all parks
and facilities throughout the Leisure Services Department. Staff performs regular maintenance on all greenway and Firefly trail segments, Dudley Park, Ben Burton
Park, Oconee Riverside Parks, Cook's Trail, Lakeside Trail, Trail Creek Trails, Sandy Creek Nature Center Trails, and the Birchmore Trail.
Operating: $4.0K per year (Indirect cost estimate)
Capital Detail by Department
FY20 Budget D-59

Leisure Services Department Priority
Portable Soccer Pitch System (New) 13 of 13AI, Equipment Project Timeline: FY26 ‐ FY26
Project Description
Project Justification
Impact on Annual Operating Expenses
Financial Plan Project ID: New
FY18 FY19 FY20 FY21 FY22 FY23 FY24 FY25‐29 Total
End Bal. Budget Approved Proposed Proposed Proposed Proposed Proposed Proposed
SOURCES
General Capital Fund ‐ ‐ 35,000 35,000
TOTAL SOURCES ‐ ‐ ‐ ‐ ‐ ‐ ‐ 35,000 35,000
USES
Capital ‐ Machinery & Equip ‐ ‐ 35,000 35,000
TOTAL USES ‐ ‐ ‐ ‐ ‐ ‐ ‐ 35,000 35,000
This project provides for the purchase of a modular Soccer Field "Pitch" system (SFP) which can be assembled at any Leisure Service facility or remote location to
create an enclosed soccer field with 4 foot high walls. The walls allow the SFP to be assembled in a variety of locations such as parking lots or at the edges of
unusable spaces due to grading variances. This project is inspired by the documented success of similar SFP systems utilized within Atlanta, GA. which have engaged
the community and increased the levels of outdoor play. The project also provides for the purchase of a trailer for staff to store and transport the SFP system.
Modular SFP systems are becoming popular in urban areas where field space areas at park locations are limited. Atlanta United has been utilizing similar SFP systems
at bus stations and parking lots to realize increased levels of recreational activity accessibility and citizen outdoor play. The portable SFP system will enable the
Leisure Services Department to move the system around Athens to increase programming possibilities and to encourage play. The system could also provide
opportunities for rental activities similar to the Showmobile stage should a tournament or group have an interest in using the equipment.
Operating: $4.0K per year (Indirect cost estimate)
Capital Detail by Department FY20 Budget D-60

Manager's Office ‐ OD Department Priority
ACCGOV Talent Management Software Suite (New) 1 of 1AI, Software Project Timeline: Ongoing
Project Description
Project Justification
Impact on Annual Operating Expenses
Financial Plan Project ID: New
FY18 FY19 FY20 FY21 FY22 FY23 FY24 FY25‐29 Total
End. Bal. Budget Approved Proposed Proposed Proposed Proposed Proposed Proposed
SOURCES
General Capital Fund ‐ ‐ 165,000 170,000 170,000 ‐ ‐ ‐ 505,000
TOTAL SOURCES ‐ ‐ 165,000 170,000 170,000 ‐ ‐ ‐ 505,000
USES
Capital ‐ Other ‐ ‐ 165,000 170,000 170,000 ‐ ‐ ‐ 505,000
TOTAL USES ‐ ‐ 165,000 170,000 170,000 ‐ ‐ ‐ 505,000
The Talent Development Software (TDS) suite contains a cloud‐based learning management system for training, to be used by all ACCGOV departments who design
and implement training (GIS, Police, Fire, HR, OD, etc.). The second aspect of the TDS is that it contains a Performance Management module that will sufficiently
replace our current PMP, with better optics and augmented reporting.
Approximately 1/3 of employees do not have ACCGOV email; TDS would connect all employees. Organization‐wide compliance training is not possible with the
current staff, training room and training room limitations. Public safety employees who work night shifts can't attend training. This software would put all of OD's,
HR's, Fire's, Police's, GIS' training content online, with rapid deployment of vast amounts of information and 24/7 mobile‐friendly access. This project is aligned with
the Mayor and Commission strategic commitment of an Accountable and Responsive Government.
The system is scalable, able to add additional modules that work with the talent management suite, with specific functions, including: recruiting, onboarding,
succession planning, compensation planning, HR strategic planning. The impact on annual operating expenses depends on the decisions that may be made to scale
up to greater efficiencies in any of the aforementioned functionality listed in the justification section.
Capital Detail by Department
FY20 Budget D-61

Manager's Office ‐ PIO Department Priority
Website & eGovernment Enhancements 1 of 4CS, Equipment Project Timeline: FY17 ‐ Ongoing
Project Description
Project Justification
Impact on Annual Operating Expenses
Financial Plan Project ID: c0707
FY18 FY19 FY20 FY21 FY22 FY23 FY24 FY25‐29 Total
End Bal. Budget Approved Proposed Proposed Proposed Proposed Proposed Proposed
SOURCES
General Capital Fund 67,803 10,000 15,000 ‐ ‐ ‐ ‐ 255,000 270,000
TOTAL SOURCES 67,803 10,000 15,000 ‐ ‐ ‐ ‐ 255,000 270,000
USES
Capital ‐ Machinery & Equip 67,803 10,000 15,000 ‐ ‐ ‐ ‐ 255,000 270,000
TOTAL USES 67,803 10,000 15,000 ‐ ‐ ‐ ‐ 255,000 270,000
This project maintains services and equipment and provide new services and equipment related to the Athens‐Clarke County website (accgov.com) and associated
eGovernment initiatives.
The Public Information Office (PIO) manages the website and trains departmental staff on use of the site. Project funds support system upgrades, support, and
improvements, social media archiving, as well as eventual redesign costs tentatively scheduled for FY21. This project is designed to provide funding for eGovernment
enhancements to the website and other identified online initiatives, including a resident problem‐reporting tool. In 2018, the website address and email addresses
were changed to accgov.com. The website is a key outlet for primary source information about the Unified Government. Residents have identified the website in the
National Citizen Survey as a primary source of information. In FY18, accgov.com had 2 million visitors, 4.3 million page views, and 1.1 million downloads.
None. However, the hiring of a new Media Analyst (TV/Video) in FY17 allows the Media Analyst (Web/Graphics) to focus more fully on website and eGovernment
initiatives currently and potentially funded by this project.
Capital Detail by Department FY20 Budget D-62

Manager's Office ‐ PIO Department Priority
ACTV & Multimedia Production Equipment 2 of 4CS, Equipment Project Timeline: FY19 ‐ Ongoing
Project Description
Project Justification
Impact on Annual Operating Expenses
Financial Plan Project ID: c0084
FY18 FY19 FY20 FY21 FY22 FY23 FY24 FY25‐29 Total
End Bal. Budget Approved Proposed Proposed Proposed Proposed Proposed Proposed
SOURCES
General Capital Fund 77,342 20,000 15,000 ‐ ‐ ‐ ‐ 180,000 195,000
TOTAL SOURCES 77,342 20,000 15,000 ‐ ‐ ‐ ‐ 180,000 195,000
USES
Capital ‐ Machinery & Equip 77,342 20,000 15,000 ‐ ‐ ‐ ‐ 180,000 195,000
TOTAL USES 77,342 20,000 15,000 ‐ ‐ ‐ ‐ 180,000 195,000
This project provides funding for lifecycle replacements, new equipment, and upgrades to equipment related to the operation of the ACTV government access
channel, live meeting coverage, and multimedia production for ACTV and other outlets.
In 1995, the cable local franchise agreement with the Unified Government provided initial funding for equipment related to a government access channel that
launched in 2000. Charter Communications continued this funding through a variety of sources until obtaining a statewide franchise. Soon after, their financial
contribution for ACTV channel operation ceased. The available funds were substantially decreased after FY17 upgrades to the ACTV bulletin board, ACTV production
studio, ACTV production equipment, and Commission Chamber audio. This project is designed to provide continued lifecycle maintenance and equipment updates for
video production and distribution.
None. However, the new Media Analyst (TV/Video) position approved in FY17 allows us to more fully utilize and expand the equipment's use and decrease
expenditures by other departments for video and multimedia projects.
Capital Detail by Department
FY20 Budget D-63

Manager's Office ‐ PIO Department Priority
Digital Signage Displays in Transit System Buses 3 of 4AI, Equipment Project Timeline: FY18 ‐ Ongoing
Project Description
Project Justification
Impact on Annual Operating Expenses
Financial Plan Project ID: New
FY18 FY19 FY20 FY21 FY22 FY23 FY24 FY25‐29 Total
End Bal. Budget Approved Proposed Proposed Proposed Proposed Proposed Proposed
SOURCES
General Capital Fund ‐ ‐ ‐ ‐ ‐ ‐ ‐ 175,000 175,000
TOTAL SOURCES ‐ ‐ ‐ ‐ ‐ ‐ ‐ 175,000 175,000
USES
Capital ‐ Machinery & Equip ‐ ‐ ‐ ‐ ‐ ‐ ‐ 175,000 175,000
TOTAL USES ‐ ‐ ‐ ‐ ‐ ‐ ‐ 175,000 175,000
This initiative is designed to incorporate digital display monitors in Athens‐Clarke County Transit Buses to display bulletin board information and video content
produced by the PIO and other sources specifically formatted for The Bus’ system. The Bus provides over 1.7 million rides to passengers across the geographic and
demographic spectrum, a valuable opportunity for reaching a wide range of citizens with information about the Unified Government. Working closely with Transit,
the PIO may be able to have some or all ongoing costs offset with revenues from electronic in‐bus advertising if policies are amended.
The PIO is continually looking to expand its reach to all segments of the community in efficient and effective ways. One of these ways includes expanding video and
bulletin board information opportunities through places where people gather such as customer service lines or waiting areas in Unified Government facilities. The
Bus transports 1.7 million riders annually from all segments of the community. Digital display monitors on the buses would provide an efficient way to convey
information to many people who may otherwise not learn about some of the Unified Government's programs, events, and services.
This project is not anticipated to have any significant impact on annual operating expenses. Some revenue may be possible if The Bus' advertising policy is changed to
allow digital advertising that could be inserted among other programming. However, the CIP request does not include adjustments for this possibility at this time.
Capital Detail by Department FY20 Budget D-64

Manager's Office ‐ PIO Department Priority
Pop‐up Van 4 of 4AI, Vehicle Project Timeline: FY20 ‐ FY20
Project Description
Project Justification
Impact on Annual Operating Expenses
Financial Plan Project ID: New
FY18 FY19 FY20 FY21 FY22 FY23 FY24 FY25‐29 Total
End. Bal. Budget Approved Proposed Proposed Proposed Proposed Proposed Proposed
SOURCES
General Capital Fund ‐ ‐ 27,500 ‐ ‐ ‐ ‐ ‐ 27,500
TOTAL SOURCES ‐ ‐ 27,500 ‐ ‐ ‐ ‐ ‐ 27,500
USES
Capital ‐ Vehicles ‐ ‐ 27,500 ‐ ‐ ‐ ‐ ‐ 27,500
TOTAL USES ‐ ‐ 27,500 ‐ ‐ ‐ ‐ ‐ 27,500
This project involves the purchase of a van for use by departments to check out for use as a pop‐up meeting or at outside events. The van would be wrapped and
equipped with some multimedia components, storage, and other materials for use either as a meeting site itself or as a transport vehicle and indicator that an
ACCGOV department has a presence at an event.
This project allows for any department, even those without vehicles of their own, with opportunities to engage with residents at events outside of ACCGOV offices.
Preventative Maintenance: $250 + Tires/Tubes: $400
Corrective Maintenance: $800
Fuel: $1,200
Insurance: $625
Replacement: $4,500 (beginning in FY21)
Capital Detail by Department
FY20 Budget D-65

Manager's Office ‐ SO Department Priority
Natural Area Rehabilitation Program (New) 1 of 3AI, Facilities Project Timeline: FY21 ‐ Ongoing
Project Description
Project Justification
Impact on Annual Operating Expenses
Financial Plan Project ID: New
FY18 FY19 FY20 FY21 FY22 FY23 FY24 FY25‐29 Total
End. Bal. Budget Approved Proposed Proposed Proposed Proposed Proposed Proposed
SOURCES
General Capital Fund ‐ ‐ ‐ ‐ ‐ ‐ ‐ 250,000 250,000
TOTAL SOURCES ‐ ‐ ‐ ‐ ‐ ‐ ‐ 250,000 250,000
USES
Capital ‐ Const. ‐ ‐ ‐ ‐ ‐ ‐ ‐ 250,000 250,000
TOTAL USES ‐ ‐ ‐ ‐ ‐ ‐ ‐ 250,000 250,000
This project will implement natural area management activities identified as identified in management plans. Currently, management plans are in development for
Dudley Park, Rock & Shoals, and Sandy Creek Nature Center. By funding this through the capital program, we decrease the need for additional staffing while also
minimizing year to year fluctuations in the general operating budget.
ACC is the second largest landowner in the county and has undertaken the adoption and implementation of land stewardship practices and policies that conserve
ecosystem services, enhance community esthetics, promote biodiversity, and encourage public‐private sustainability initiatives. This capital program will focus on
reducing the need for additional staffing by using contract services to address issues in natural areas that are otherwise underserviced with current budget
allocations.
Positive. By funding this as a capital project, ACC staff can contract for services, which reduces the need for additional staffing and operating expenses.
Capital Detail by Department FY20 Budget D-66

Manager's Office ‐ SO Department Priority
Solar Energy Program 2 of 3AI, Facilities Project Timeline: FY21 ‐ Ongoing
Project Description
Project Justification
Impact on Annual Operating Expenses
Financial Plan Project ID: N/A
FY18 FY19 FY20 FY21 FY22 FY23 FY24 FY25‐29 Total
End Bal. Budget Approved Proposed Proposed Proposed Proposed Proposed Proposed
SOURCES
General Capital Fund ‐ ‐ ‐ 40,000 40,000 50,000 50,000 320,000 500,000
TOTAL SOURCES ‐ ‐ ‐ 40,000 40,000 50,000 50,000 320,000 500,000
USES
Capital ‐ Const. ‐ ‐ ‐ 40,000 40,000 50,000 50,000 320,000 500,000
TOTAL USES ‐ ‐ ‐ 40,000 40,000 50,000 50,000 320,000 500,000
This project will install solar energy systems at Athens‐Clarke County (ACC) facilities in order to: (1) decrease the environmental impacts of the energy we use, (2)
decrease the ongoing costs associated with facility energy bills, and (3) provide opportunities for local jobs by supporting domestic energy production instead of
using out‐of‐state fuel sources.
Over the last decade, ACC facility energy use has increase by more than $1.2 million/year while annually adding an additional 32,500 tons of CO2 to the atmosphere.
During this time, facility energy price inflation has outpaced Athens‐Clarke County budget growth, and as a result, fewer dollars are available for public safety,
infrastructure, and economic development as we commit more funding to pay our utility bills. This capital project will systematically deploy solar energy systems at
ACC facilities starting with those that offer the highest financial returns first. The Sustainability Office will work to use these funds as grant matching money in order
to leverage our investment and returns. This project supports a 2016 Mayor and Commission resolution to increase the amount of renewable energy used at ACC
facilities.
At today's rates, each dollar spent on solar energy results in a decrease of 5% annual savings on utility bills. This return continues to improve as utility rates increase
and solar energy system prices decrease.
Capital Detail by Department
FY20 Budget D-67

Manager's Office ‐ SO Department Priority
Energy Action Plan (New) 3 of 3AI, Planning Priority
Project Description
Project Justification
Impact on Annual Operating Expenses
Financial Plan Project ID: New
FY18 FY19 FY20 FY21 FY22 FY23 FY24 FY25‐29 Total
End Bal. Budget Approved Proposed Proposed Proposed Proposed Proposed Proposed
SOURCES
General Capital Fund ‐ ‐ 30,000 ‐ ‐ ‐ ‐ 75,000 105,000
TOTAL SOURCES ‐ ‐ 30,000 ‐ ‐ ‐ ‐ 75,000 105,000
USES
Capital ‐ Const. ‐ ‐ 30,000 ‐ ‐ ‐ ‐ 75,000 105,000
TOTAL USES ‐ ‐ 30,000 ‐ ‐ ‐ ‐ 75,000 105,000
This project will support energy action planning efforts needed to meet the Mayor and Commission commitment to reach 100% renewable energy by 2035. For FY20,
a mix of capital and general operating budget funds will be used to complete the plan.
Athens‐Clarke County currently spends more $7,350,000/year on 287 billion BTUs of energy to support government operations. Preliminary analysis indicates the
community may spend as much as $350 million/year on its energy use. Many policies, programs, and capital equipment modifications will be needed to transition
this energy use to renewable sources. An energy action plan will identify what changes need to be made to support the renewable energy revolution. In addition to
in‐depth analysis on ACCGOV, the plan will include specific recommendations on how ACCGOV can support the business community and economically‐disadvantaged
individuals in the pursuit of 100% renewable energy.
Positive. By funding this as a capital project ACCGOV staff can efficiently use the Capital Budget and SPLOST funding allocated to energy projects. The implementation
of this plan will decrease future operating budgets for ACCGOV.
Capital Detail by Department FY20 Budget D-68

Other General Administration Department Priority
Public Art Program 1 of 3AI, Facilities Project Timeline: FY12 ‐ Ongoing
Project Description
Project Justification
Impact on Annual Operating Expenses
Financial Plan Project ID: c0625
FY18 FY19 FY20 FY21 FY22 FY23 FY24 FY25‐29 Total
End Bal. Budget Approved Proposed Proposed Proposed Proposed Proposed Proposed
SOURCES
General Capital Fund 89,680 15,000 20,000 ‐ ‐ ‐ ‐ 100,000 120,000
SPLOST 2011 Cap Proj Fund 329,634 ‐ 66,600 ‐ ‐ ‐ ‐ ‐ 66,600
TOTAL SOURCES 419,314 15,000 86,600 ‐ ‐ ‐ ‐ 100,000 186,600
USES
Capital ‐ Machinery & Equip 419,314 15,000 86,600 ‐ ‐ ‐ ‐ 100,000 186,600
TOTAL USES 419,314 15,000 86,600 ‐ ‐ ‐ ‐ 100,000 186,600
Funds for this project will be used for the design, fabrication, installation, maintenance and implementation of community public art projects recommended by the
Athens Cultural Affairs Commission and Proposed by the Mayor and Commission purchase for placement in various locations around Athens‐Clarke County. The
project is funded through the allocation of the equivalent of one percent of General Fund funding for Proposed capital projects, excluding land and equipment
purchases.
This project is carried out in accordance with Chapter 1‐25, "Athens Cultural Affairs Commission", of the Athens‐Clarke County Code of Ordinances. Specific art
projects are chosen in conjunction with the Athens Cultural Affairs Commission.
No Impact
Capital Detail by Department
FY20 Budget D-69

Other General Administration Department Priority
Economic Development Capital Program 2 of 3AI, General Project Timeline: Ongoing
Project Description
Project Justification
Impact on Annual Operating Expenses
Financial Plan Project ID: c0078
FY18 FY19 FY20 FY21 FY22 FY23 FY24 FY25‐29 Total
End Bal. Budget Approved Proposed Proposed Proposed Proposed Proposed Proposed
SOURCES
Econ Dev Capital Fund 433,100 225,000 200,000 225,000 225,000 225,000 225,000 1,125,000 2,225,000
TOTAL SOURCES 433,100 225,000 200,000 225,000 225,000 225,000 225,000 1,125,000 2,225,000
USES
Capital ‐ Other 433,100 225,000 200,000 225,000 225,000 225,000 225,000 1,125,000 2,225,000
TOTAL USES 433,100 225,000 200,000 225,000 225,000 225,000 225,000 1,125,000 2,225,000
The purpose of this project is to provide a readily available funded program to pay for the site improvements and related expenditures for new industry location and
existing industry expansion in Athens‐Clarke County. Location is to be determined based upon industrial development opportunities.
This project will fund and assist with the implementation of an element of the government's economic development policy, as directed by the Mayor and
Commission.
No Impact
Capital Detail by Department FY20 Budget D-70

Other General Administration Department Priority
Capital Budget Contingency 3 of 3CS, General Project Timeline: Ongoing
Project Description
Project Justification
Impact on Annual Operating Expenses
Financial Plan Project ID: c0124
FY18 FY19 FY20 FY21 FY22 FY23 FY24 FY25‐29 Total
End Bal. Budget Approved Proposed Proposed Proposed Proposed Proposed Proposed
SOURCES
General Capital Fund 514,380 ‐ ‐ ‐ ‐ ‐ ‐ 500,000 500,000
TOTAL SOURCES 514,380 ‐ ‐ ‐ ‐ ‐ ‐ 500,000 500,000
USES
Capital ‐ Other 514,380 ‐ ‐ ‐ ‐ ‐ ‐ 500,000 500,000
TOTAL USES 514,380 ‐ ‐ ‐ ‐ ‐ ‐ 500,000 500,000
Capital Contingency is used to fund unanticipated capital expenses. Funds are transferred to other projects with the Manager and/or Mayor and Commission
approval. No expenses are charged directly to this project.
All requests are reviewed by the Manager and based on funding parameters are then forwarded to the Mayor and Commission for either their information or
approval.
No Impact
Capital Detail by Department
FY20 Budget D-71

Planning & Zoning Department Priority
Develop Comprehensive Plan Ten Year Update 1 of 2AI, General Project Timeline: Ongoing
Project Description
Project Justification
Impact on Annual Operating Expenses
Financial Plan Project ID: c0529
FY18 FY19 FY20 FY21 FY22 FY23 FY24 FY25‐29 Total
End Bal. Budget Approved Proposed Proposed Proposed Proposed Proposed Proposed
SOURCES
General Capital Fund 20,000 ‐ ‐ ‐ ‐ ‐ ‐ 200,000 200,000
TOTAL SOURCES 20,000 ‐ ‐ ‐ ‐ ‐ ‐ 200,000 200,000
USES
Capital ‐ Other 20,000 ‐ ‐ ‐ ‐ ‐ ‐ 200,000 200,000
TOTAL USES 20,000 ‐ ‐ ‐ ‐ ‐ ‐ 200,000 200,000
This project will update the Comprehensive Plan for Athens‐Clarke County. The current Comprehensive Plan update was Proposed in June 2008. Monies associated
with this project will fund work by staff to complete the required 10‐year major update due in 2018.
Georgia State Law requires that Comprehensive Plans be updated every five years. The Planning Department completed a major update in June 2008. The FY18
request covers the cost of providing the required major update due June 2018. A state‐mandated 5‐year minor update will need additional funding in FY23.
Anticipating the future 10‐year major update, staff has indicated the possibility of a consultant‐lead effort, which is noted in FY28.
No Impact
Capital Detail by Department FY20 Budget D-72

Planning & Zoning Department Priority
Update Aerial Photos 2 of 2CS, General Project Timeline: Ongoing
Project Description
Project Justification
Impact on Annual Operating Expenses
Financial Plan Project ID: c0350
FY18 FY19 FY20 FY21 FY22 FY23 FY24 FY25‐29 Total
End Bal. Budget Approved Proposed Proposed Proposed Proposed Proposed Proposed
SOURCES
General Capital Fund ‐ ‐ ‐ ‐ ‐ ‐ ‐ 150,000 150,000
TOTAL SOURCES ‐ ‐ ‐ ‐ ‐ ‐ ‐ 150,000 150,000
USES
Capital ‐ Other ‐ ‐ ‐ ‐ ‐ ‐ ‐ 150,000 150,000
TOTAL USES ‐ ‐ ‐ ‐ ‐ ‐ ‐ 150,000 150,000
Acquisition of new aerial photography and planimetric data for Athens‐Clarke County's Geographical Information System (GIS) Base Map.
Past policy has been to have new aerial photography produced every five years with new planimetric data (roads, building footprints, utilities, etc.) and topographic
data (two foot contours) created every ten years. Maintenance of this data provides the County’s GIS with the most current and accurate information available.
New aerial photography was flown in January, 2013. The next scheduled update of photographic, planimetric, and topographic data will be in FY18
(January/February 2018 Anticipated Flight). In keeping with past policy (every 5‐years), staff has also requested FY23 funding, as well as FY28 funding for the same
anticipated amounts.
No Impact
Capital Detail by Department
FY20 Budget D-73

Police Department Priority
On‐Officer Cameras and Data Storage 1 of 12CS, Equipment Project Timeline: Ongoing
Project Description
Project Justification
Impact on Annual Operating Expenses
Financial Plan Project ID: c0699
FY18 FY19 FY20 FY21 FY22 FY23 FY24 FY25‐29 Total
End Bal. Budget Approved Proposed Proposed Proposed Proposed Proposed Proposed
SOURCES
General Capital Fund 124,968 ‐ 250,000 117,000 27,700 16,000 44,200 1,315,000 1,769,900
TOTAL SOURCES 124,968 ‐ 250,000 117,000 27,700 16,000 44,200 1,315,000 1,769,900
USES
Capital ‐ Machinery & Equip 124,968 ‐ 82,000 ‐ ‐ ‐ ‐ 410,000 492,000
Capital ‐ Other ‐ ‐ 168,000 117,000 27,700 16,000 44,200 840,000 1,212,900
TOTAL USES 124,968 ‐ 250,000 117,000 27,700 16,000 44,200 1,250,000 1,704,900
Full deployment and maintenance of on‐officer camera systems to record interactions between officers and the public. This system automatically and seamlessly
downloads and stores digital video for use in court and supervisory reviews as mandated by national accreditation (CALEA) standards. Request is inclusive of
equipment purchases, maintenance, and data storage costs.
The Athens‐Clarke County Police Department has utilized video recordings for a number of years, to include in‐car video recordings and on‐officer camera systems. In
2014, a limited number of on‐officer cameras were issued to patrol operations, with expansion to all patrol officers over the following year. Video shall continue to
be transferred to a centralized database for use by criminal justice stakeholders. As the mandated retention cycle for such videos is now a minimum of 2.5 years,
data storage needs have stabilized. Costs represented within the model below account for a continuance of existing cloud storage practices and the supported
deployment of TASER Axon Camera Systems by all 254 authorized sworn officers.
The system may require periodic software upgrades which may influence operational/replacement costs. A minimal number of units may also need to be replaced as
a result of the challenging environment in which such systems operate. System requirements may dictate service agreements and/or additional purchases to meet
developing operational needs.
Capital Detail by Department FY20 Budget D-74
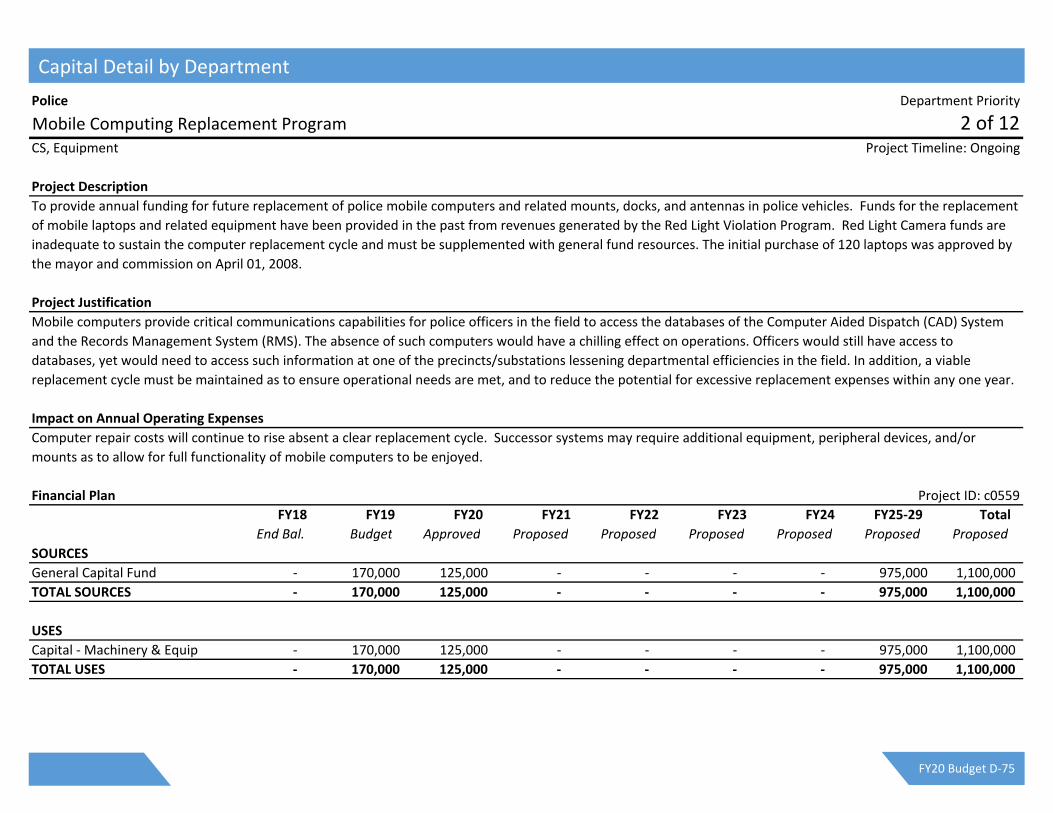
Police Department Priority
Mobile Computing Replacement Program 2 of 12CS, Equipment Project Timeline: Ongoing
Project Description
Project Justification
Impact on Annual Operating Expenses
Financial Plan Project ID: c0559
FY18 FY19 FY20 FY21 FY22 FY23 FY24 FY25‐29 Total
End Bal. Budget Approved Proposed Proposed Proposed Proposed Proposed Proposed
SOURCES
General Capital Fund ‐ 170,000 125,000 ‐ ‐ ‐ ‐ 975,000 1,100,000
TOTAL SOURCES ‐ 170,000 125,000 ‐ ‐ ‐ ‐ 975,000 1,100,000
USES
Capital ‐ Machinery & Equip ‐ 170,000 125,000 ‐ ‐ ‐ ‐ 975,000 1,100,000
TOTAL USES ‐ 170,000 125,000 ‐ ‐ ‐ ‐ 975,000 1,100,000
To provide annual funding for future replacement of police mobile computers and related mounts, docks, and antennas in police vehicles. Funds for the replacement
of mobile laptops and related equipment have been provided in the past from revenues generated by the Red Light Violation Program. Red Light Camera funds are
inadequate to sustain the computer replacement cycle and must be supplemented with general fund resources. The initial purchase of 120 laptops was approved by
the mayor and commission on April 01, 2008.
Mobile computers provide critical communications capabilities for police officers in the field to access the databases of the Computer Aided Dispatch (CAD) System
and the Records Management System (RMS). The absence of such computers would have a chilling effect on operations. Officers would still have access to
databases, yet would need to access such information at one of the precincts/substations lessening departmental efficiencies in the field. In addition, a viable
replacement cycle must be maintained as to ensure operational needs are met, and to reduce the potential for excessive replacement expenses within any one year.
Computer repair costs will continue to rise absent a clear replacement cycle. Successor systems may require additional equipment, peripheral devices, and/or
mounts as to allow for full functionality of mobile computers to be enjoyed.
Capital Detail by Department
FY20 Budget D-75

Police Department Priority
Replace Investigative Operations Vehicles 3 of 12CS, Equipment Project Timeline: Ongoing
Project Description
Project Justification
Impact on Annual Operating Expenses
Financial Plan Project ID: c0085
FY18 FY19 FY20 FY21 FY22 FY23 FY24 FY25‐29 Total
End Bal. Budget Approved Proposed Proposed Proposed Proposed Proposed Proposed
SOURCES
Forfeited Funds 965 25,000 35,000 35,000 35,000 35,000 35,000 175,000 350,000
TOTAL SOURCES 965 25,000 35,000 35,000 35,000 35,000 35,000 175,000 350,000
USES
Capital ‐ Vehicles 965 25,000 35,000 35,000 35,000 35,000 35,000 175,000 350,000
TOTAL USES 965 25,000 35,000 35,000 35,000 35,000 35,000 175,000 350,000
Replacement funds for up to four (4) undercover vehicles for use by Criminal Investigations.
Familiarity with undercover vehicles can influence operational effectiveness and potentially endanger ACCPD personnel. Once identified, it is unlikely that suspects
will engage in activity with the vehicles and may become hostile towards such vehicles and occupants. Investigative vehicles are traded‐in each year so that they will
be under warranty. This practice also limits potential vehicle repair costs.
No Impact
Capital Detail by Department FY20 Budget D-76

Police Department Priority
Traffic Motorcycle Replacement 4 of 12CS, Equipment Project Timeline: Ongoing
Project Description
Project Justification
Impact on Annual Operating Expenses
Financial Plan Project ID: c0600
FY18 FY19 FY20 FY21 FY22 FY23 FY24 FY25‐29 Total
End Bal. Budget Approved Proposed Proposed Proposed Proposed Proposed Proposed
SOURCES
General Capital Fund 18,395 ‐ 56,000 ‐ ‐ ‐ ‐ ‐ 56,000
TOTAL SOURCES 18,395 ‐ 56,000 ‐ ‐ ‐ ‐ ‐ 56,000
USES
Capital ‐ Vehicles 18,395 ‐ 56,000 ‐ ‐ ‐ ‐ ‐ 56,000
TOTAL USES 18,395 ‐ 56,000 ‐ ‐ ‐ ‐ ‐ 56,000
Replacement of Traffic Section motorcycles that are used for traffic safety programs, enforcement of traffic statutes, and accident investigations. The traffic section
has ten (10) motorcycles of various model years. This project seeks to provide funds for the maintenance of such motorcycle assets with the provision of necessary
funds for the replacement of two (2) new police motorcycles per year, allowing for a five (5) year rotation of the motorcycle fleet.
These motorcycles are used daily (weather permitting). The officers routinely use radar, monitor red‐lights, perform speed zone enforcement in school zones, and
other duties associated with traffic enforcement. The current base MSRP for a new BMW R 1200 GS motorcycle (well equipped) is approximately $23,245.
Additionally, it is estimated that it will take approximately $4,500 to fully equip each new police motorcycle in FY20.
No Impact
Capital Detail by Department
FY20 Budget D-77

Police Department Priority
Replace Drug Task Force Vehicles 5 of 12CS, Equipment Project Timeline: Ongoing
Project Description
Project Justification
Impact on Annual Operating Expenses
Financial Plan Project ID: c0008
FY18 FY19 FY20 FY21 FY22 FY23 FY24 FY25‐29 Total
End Bal. Budget Approved Proposed Proposed Proposed Proposed Proposed Proposed
SOURCES
Forfeited Funds 317 35,000 35,000 35,000 35,000 35,000 35,000 175,000 350,000
TOTAL SOURCES 317 35,000 35,000 35,000 35,000 35,000 35,000 175,000 350,000
USES
Capital ‐ Vehicles 317 35,000 35,000 35,000 35,000 35,000 35,000 175,000 350,000
TOTAL USES 317 35,000 35,000 35,000 35,000 35,000 35,000 175,000 350,000
Replacement funds for up to four (4) undercover vehicles for the Drug Task Force (DTF) and Investigative Operations.
Familiarity with undercover vehicles can influence operational effectiveness and potentially endanger ACCPD personnel once identified. It is unlikely that suspects
will engage in activity with the vehicles and may become hostile towards such vehicles and occupants. DTF vehicles are traded‐in each year so that they will be under
warranty. This practice also limits potential vehicle repair costs.
No Impact
Capital Detail by Department FY20 Budget D-78

Police Department Priority
Additional Crisis Intervention Unit Vehicle (Title Change) 6 of 12AI, Vehicles Project Timeline: FY20 ‐ Ongoing
Project Description
Project Justification
Impact on Annual Operating Expenses
Financial Plan Project ID: c0778
FY18 FY19 FY20 FY21 FY22 FY23 FY24 FY25‐29 Total
End Bal. Budget Approved Proposed Proposed Proposed Proposed Proposed Proposed
SOURCES
General Capital Fund ‐ 40,000 ‐ ‐ ‐ ‐ ‐ 45,000 45,000
TOTAL SOURCES ‐ 40,000 ‐ ‐ ‐ ‐ ‐ 45,000 45,000
USES
Capital ‐ Vehicles ‐ 40,000 ‐ ‐ ‐ ‐ ‐ 45,000 45,000
TOTAL USES ‐ 40,000 ‐ ‐ ‐ ‐ ‐ 45,000 45,000
With the implementation of the ACCPD Crisis Intervention Unit, at least one more specialized vehicle is required to meet operational needs.
The Crisis Intervention Unit requires at least one more specialized vehicle for employee transit to/from client meetings, and to help facilitate the movement of clients
to respective service providers. The officers' work with mental health clients necessitates the use of non‐patrol type vehicles to mitigate client anxiety.
An additional vehicle would necessitate the payment of additional insurance, corrective & preventative maintenance expenses, and fuel. The proposed vehicle would
also be subject to a replacement cycle, proposed to be no more than five years.
Capital Detail by Department
FY20 Budget D-79

Police Department Priority
Downtown District Electric Utility Vehicle (New) 7 of 12AI, Vehicle Project Timeline: FY20 ‐ TBD
Project Description
Project Justification
Impact on Annual Operating Expenses
Financial Plan Project ID: New
FY18 FY19 FY20 FY21 FY22 FY23 FY24 FY25‐29 Total
End Bal. Budget Approved Proposed Proposed Proposed Proposed Proposed Proposed
SOURCES
General Capital Fund ‐ ‐ ‐ ‐ ‐ ‐ ‐ 12,000 12,000
TOTAL SOURCES ‐ ‐ ‐ ‐ ‐ ‐ ‐ 12,000 12,000
USES
Capital ‐ Machinery & Equip ‐ ‐ ‐ ‐ ‐ ‐ ‐ 12,000 12,000
TOTAL USES ‐ ‐ ‐ ‐ ‐ ‐ ‐ 12,000 12,000
An electric utility vehicle is requested to assist with Downtown District operations, and to assist in patrolling the Greenway.
Downtown operations necessitate the movement of equipment and personnel in areas not easily accessible by standard patrol vehicles. This request seeks an
electric vehicle to assist in Downtown Operations, as well as to help patrol the Greenway.
Minimal vehicle maintenance and electrical expenses are anticipated.
Capital Detail by Department FY20 Budget D-80

Police Department Priority
Wireless Communications (New) 8 of 12CS, Equipment Project Timeline: FY20 ‐ TBD
Project Description
Project Justification
Impact on Annual Operating Expenses
Financial Plan Project ID: New
FY18 FY19 FY20 FY21 FY22 FY23 FY24 FY25‐29 Total
End Bal. Budget Approved Proposed Proposed Proposed Proposed Proposed Proposed
SOURCES
Special Revenue: RLC ‐ ‐ 135,720 135,720 135,720 135,720 135,720 678,600 1,357,200
TOTAL SOURCES ‐ ‐ 135,720 135,720 135,720 135,720 135,720 678,600 1,357,200
USES
Capital ‐ Machinery & Equip ‐ ‐ 135,720 135,720 135,720 135,720 135,720 678,600 1,357,200
TOTAL USES ‐ ‐ 135,720 135,720 135,720 135,720 135,720 678,600 1,357,200
This request seeks to allow for the totality of wireless device funding (excluding telephones) to fall under a fully‐funded program. A stable funding source is
requested to ensure availability of funding for this core service delivery element.
This request seeks to allow for the totality of wireless funding to fall under a fully‐funded program. A stable fund source is requested to ensure availability of funding
for this core service delivery element.
There should be no impact on the Annual Operating Expenses.
Capital Detail by Department
FY20 Budget D-81

Police Department Priority
Replacement of TASER Conducted Energy Device (CED) Units 9 of 12CS, Equipment Project Timeline: FY21 ‐ TBD
Project Description
Project Justification
Impact on Annual Operating Expenses
Financial Plan Project ID: New
FY18 FY19 FY20 FY21 FY22 FY23 FY24 FY25‐29 Total
End Bal. Budget Approved Proposed Proposed Proposed Proposed Proposed Proposed
SOURCES
General Capital Fund ‐ ‐ ‐ ‐ ‐ ‐ ‐ 264,922 264,922
TOTAL SOURCES ‐ ‐ ‐ ‐ ‐ ‐ ‐ 264,922 264,922
USES
Capital ‐ Machinery & Equip ‐ ‐ ‐ ‐ ‐ ‐ ‐ 264,922 264,922
TOTAL USES ‐ ‐ ‐ ‐ ‐ ‐ ‐ 264,922 264,922
This request seeks to establish a five year replacement cycle for all 254 conducted energy devices (CEDs).
The use of conducted energy devices (CEDs), more commonly known as “TASERs”, is requisite in today's law enforcement environment. TASERs enhance the level of
safety experienced by officers and citizens alike as they allow for a less than lethal compliance tool. The ACCPD deployed its first CEDs in 2015 ‐ providing a TASER to
each patrol officer. All sworn officers now carry TASERs.
Officers are required to attend TASER recertification courses each year in which live cartridges are used. Such expenses have been factored into the department's
operating budget request.
Capital Detail by Department FY20 Budget D-82

Police Department Priority
Maintenance of Downtown Safety Camera System 10 of 12CS, Equipment Project Timeline: FY16 ‐ Ongoing
Project Description
Project Justification
Impact on Annual Operating Expenses
Financial Plan Project ID: c0685
FY18 FY19 FY20 FY21 FY22 FY23 FY24 FY25‐29 Total
End Bal. Budget Approved Proposed Proposed Proposed Proposed Proposed Proposed
SOURCES
General Capital Fund ‐ 59,000 35,000 ‐ ‐ ‐ ‐ 300,000 335,000
TOTAL SOURCES ‐ 59,000 35,000 ‐ ‐ ‐ ‐ 300,000 335,000
USES
Capital ‐ Machinery & Equip ‐ 59,000 60,000 ‐ ‐ ‐ ‐ 300,000 360,000
TOTAL USES ‐ 59,000 60,000 ‐ ‐ ‐ ‐ 300,000 360,000
Since 2005, the Athens‐Clarke County Police Department has operated a camera system within the Downtown District. Such cameras have added to the
department's situational awareness, have allowed for video recordings in investigative actions, and have added to the general level of safety enjoyed by citizens and
visitors to the district. The requested program funding seeks to allow for repair/maintenance of system components, and allow for all components to be integrated
within a single criminal justice stakeholder framework.
The camera system allows for an increased level of situational awareness for ACCPD personnel, contributes to officer safety, and allows for investigators to review
materials. Should a camera location need to be repaired/replaced/added, costs are approximately $5,000 per site (camera, mounts, connectivity). Each of the 29
camera sites needs to be placed on a 5 year replacement cycle, and a service & maintenance contract enacted for the totality of the system (estimated at $30,000
per year).
Annual maintenance and equipment replacement costs will appreciate as the number and age of cameras increase.
Capital Detail by Department
FY20 Budget D-83

Police Department Priority
Additional Police Vehicles (New) 11 of 12AI, Vehicles Project Timeline: FY21 ‐ Ongoing
Project Description
Project Justification
Impact on Annual Operating Expenses
Financial Plan Project ID: New
FY18 FY19 FY20 FY21 FY22 FY23 FY24 FY25‐29 Total
End Bal. Budget Approved Proposed Proposed Proposed Proposed Proposed Proposed
SOURCES
General Capital Fund ‐ ‐ ‐ ‐ ‐ ‐ 1,897,500 1,897,500
TOTAL SOURCES ‐ ‐ ‐ ‐ ‐ ‐ ‐ 1,897,500 1,897,500
USES
Capital ‐ Vehicles ‐ ‐ ‐ ‐ ‐ ‐ ‐ 1,897,500 1,897,500
TOTAL USES ‐ ‐ ‐ ‐ ‐ ‐ ‐ 1,897,500 1,897,500
The ACCPD has an inventory of 210 vehicles in support of standard police operations (non‐specialized vehicles). Of such vehicles, eighteen have approached the end
of their service life and an additional 37 are required to allow for a 1 to 1 vehicle issuance at the department's authorized strength of 254 officers. A replacement of
the department’s mobile command vehicle and two in‐custody transport vans are also requested.
An assigned vehicle program is requisite for the department to remain consistent with professional best practices. Eighteen ACCPD fleet vehicles are in need of
timely replacement as they are at, or nearing, the end of their serviceable life. The department's transport van is quickly approaching the end of its serviceable life
while operational needs also dictate that not one, but two transport vans should be in use. The Mobile Command Unit, a 2005 chassis and initially funded under the
terms of a grant, is similarly approaching the end of its anticipated service life.
Additional vehicles would necessitate the payment of additional insurance, corrective & preventative maintenance, and fuel. The proposed vehicles would also be
subject to a replacement cycle, proposed to be no more than five years for patrol vehicles, and fifteen years for the mobile command vehicle.
Capital Detail by Department FY20 Budget D-84

Police Department Priority
E911 Telephone System Replacement Plan 12 of 12CS, Equipment Project Timeline: TBD ‐ TBD
Project Description
Project Justification
Impact on Annual Operating Expenses
Financial Plan Project ID: N/A
FY18 FY19 FY20 FY21 FY22 FY23 FY24 FY25‐29 Total
End Bal. Budget Approved Proposed Proposed Proposed Proposed Proposed Proposed
SOURCES
General Capital Fund ‐ ‐ ‐ ‐ ‐ ‐ 765,908 ‐ 765,908
TOTAL SOURCES ‐ ‐ ‐ ‐ ‐ ‐ 765,908 ‐ 765,908
USES
Capital ‐ Machinery & Equip ‐ ‐ ‐ ‐ ‐ ‐ 765,905 ‐ 765,905
TOTAL USES ‐ ‐ ‐ ‐ ‐ ‐ 765,905 ‐ 765,905
This critical request is for the replacement of the 911 Communications Center operating core/platform. This equipment is required to log and process information on
events related to emergency services calls and responses including Police, Fire, and EMS disciplines. The E911 telephone system is used 24/7/365 by personnel in the
911 Communications Center and must maintain continuous reliability and uptime.
This system is the point of handoff between the community and public safety. Should the system not be timely replaced, critical functionalities may be reduced or
lost. However, if system components are timely replaced it will be possible to interface with future infrastructure improvements / capacities, which may allow for an
improved service delivery, in addition to sustained general system reliability.
It is estimated that software and equipment maintenance fees will be approximately $150,000 per year.
Capital Detail by Department
FY20 Budget D-85

Public Utilities Department Priority
W&S Lines ‐ Additions and Improvements 1 of 16CS, Infrastructure Project Timeline: Ongoing
Project Description
Project Justification
Impact on Annual Operating Expenses
Financial Plan Project ID: c0591
FY18 FY19 FY20 FY21 FY22 FY23 FY24 FY25‐29 Total
End Bal. Budget Approved Proposed Proposed Proposed Proposed Proposed Proposed
SOURCES
Water & Sewer Const. Fund ‐ 918,200 936,000 955,000 975,000 994,500 1,010,000 5,260,000 10,130,500
TOTAL SOURCES ‐ 918,200 936,000 955,000 975,000 994,500 1,010,000 5,260,000 10,130,500
USES
Capital ‐ Infrastructure ‐ 918,200 936,000 955,000 975,000 994,500 1,010,000 5,260,000 10,130,500
TOTAL USES ‐ 918,200 936,000 955,000 975,000 994,500 1,010,000 5,260,000 10,130,500
In‐house construction costs for capital project labor, equipment/vehicles and materials. Crews work out of the W&S construction office located at 1000 Alexander
Street.
To provide annual funding for labor and materials cost associated with in‐house construction projects to add and improve the water and sewer infrastructure.
No Impact
Capital Detail by Department FY20 Budget D-86

Public Utilities Department Priority
Meter and Water/Sewer Stub Additions 2 of 16CS, Equipment Project Timeline: Ongoing
Project Description
Project Justification
Impact on Annual Operating Expenses
Financial Plan Project ID: c0589
FY18 FY19 FY20 FY21 FY22 FY23 FY24 FY25‐29 Total
End Bal. Budget Approved Proposed Proposed Proposed Proposed Proposed Proposed
SOURCES
Water & Sewer Const. Fund ‐ 482,200 491,000 501,600 510,000 520,000 530,000 2,758,000 5,310,600
TOTAL SOURCES ‐ 482,200 491,000 501,600 510,000 520,000 530,000 2,758,000 5,310,600
USES
Other ‐ 482,200 491,800 501,600 510,000 520,000 530,000 2,758,000 5,311,400
TOTAL USES ‐ 482,200 491,800 501,600 510,000 520,000 530,000 2,758,000 5,311,400
In‐house construction costs for capital project labor, equipment/vehicles and materials. Crews work out of the Meter Management office located at 1025 Alexander
Street.
To provide annual funding for labor and materials cost associated with in‐house construction and installation of water meters and water and sewer stub additions.
No Impact
Capital Detail by Department
FY20 Budget D-87

Public Utilities Department Priority
Donated W&S Additions Management 3 of 16CS, Equipment Project Timeline: Ongoing
Project Description
Project Justification
Impact on Annual Operating Expenses
Financial Plan Project ID: c0590
FY18 FY19 FY20 FY21 FY22 FY23 FY24 FY25‐29 Total
End Bal. Budget Approved Proposed Proposed Proposed Proposed Proposed Proposed
SOURCES
Water & Sewer Const. Fund ‐ 218,000 224,000 226,800 230,000 234,600 239,000 1,246,000 2,400,400
TOTAL SOURCES ‐ 218,000 224,000 226,800 230,000 234,600 239,000 1,246,000 2,400,400
USES
Other ‐ 218,000 224,000 226,800 230,000 234,600 239,000 1,246,000 2,400,400
TOTAL USES ‐ 218,000 224,000 226,800 230,000 234,600 239,000 1,246,000 2,400,400
In‐house surveying, design and inspection costs for capital project labor, equipment/vehicles and materials. Crews work out of the Engineering Management office
located at 124 East Hancock Avenue.
To provide annual funding for labor and materials cost associated with management, inspection, and acceptance of donated additions to the water and sewer
infrastructure.
No Impact
Capital Detail by Department FY20 Budget D-88

Public Utilities Department Priority
Watershed Protection Long‐Term Monitoring 4 of 16CS, General Project Timeline: FY12 ‐ Ongoing
Project Description
Project Justification
Impact on Annual Operating Expenses
Financial Plan Project ID: c0654
FY18 FY19 FY20 FY21 FY22 FY23 FY24 FY25‐29 Total
End Bal. Budget Approved Proposed Proposed Proposed Proposed Proposed Proposed
SOURCES
Water & Sewer Const. Fund 46,496 100,000 100,000 100,000 100,000 100,000 100,000 500,000 1,000,000
TOTAL SOURCES 46,496 100,000 100,000 100,000 100,000 100,000 100,000 500,000 1,000,000
USES
Capital ‐ Other 46,496 100,000 100,000 100,000 100,000 100,000 100,000 500,000 1,000,000
TOTAL USES 46,496 100,000 100,000 100,000 100,000 100,000 100,000 500,000 1,000,000
This project provides annual funding to implement a Long‐Term Watershed Protection Plan and Monitoring to remain in compliance with the standards set by the
Georgia Environmental Protection Division (GAEPD). The Long‐Term Watershed Protection Plan was required by the EPD as part of the issuance of the new NPDES
permits for the upgrade/expansion of three (3) Water Reclamation Facilities. The Long‐Term Water Shed Protection Plan must be updated each year.
These funds will be used to cover expenses incurred in updating ACC PUD's Long‐Term Watershed Protection Plan in accordance with the EPD's requirements. The
scope of the services provided are to include monitoring water quality, compiling data and development of reports for submittal to the EPD. This project is aligned
with the Mayor and Commission strategic commitment of Healthy, Livable and Sustainable Athens‐Clarke County.
No Impact
Capital Detail by Department
FY20 Budget D-89
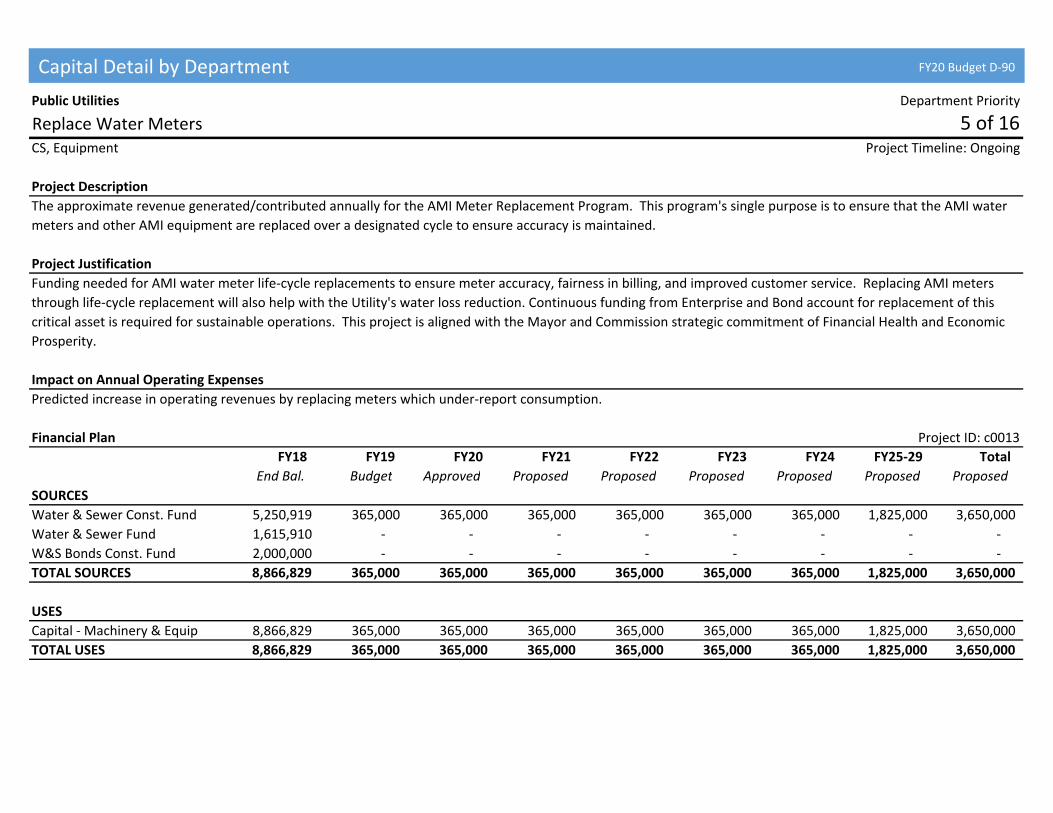
Public Utilities Department Priority
Replace Water Meters 5 of 16CS, Equipment Project Timeline: Ongoing
Project Description
Project Justification
Impact on Annual Operating Expenses
Financial Plan Project ID: c0013
FY18 FY19 FY20 FY21 FY22 FY23 FY24 FY25‐29 Total
End Bal. Budget Approved Proposed Proposed Proposed Proposed Proposed Proposed
SOURCES
Water & Sewer Const. Fund 5,250,919 365,000 365,000 365,000 365,000 365,000 365,000 1,825,000 3,650,000
Water & Sewer Fund 1,615,910 ‐ ‐ ‐ ‐ ‐ ‐ ‐ ‐
W&S Bonds Const. Fund 2,000,000 ‐ ‐ ‐ ‐ ‐ ‐ ‐ ‐
TOTAL SOURCES 8,866,829 365,000 365,000 365,000 365,000 365,000 365,000 1,825,000 3,650,000
USES
Capital ‐ Machinery & Equip 8,866,829 365,000 365,000 365,000 365,000 365,000 365,000 1,825,000 3,650,000
TOTAL USES 8,866,829 365,000 365,000 365,000 365,000 365,000 365,000 1,825,000 3,650,000
The approximate revenue generated/contributed annually for the AMI Meter Replacement Program. This program's single purpose is to ensure that the AMI water
meters and other AMI equipment are replaced over a designated cycle to ensure accuracy is maintained.
Funding needed for AMI water meter life‐cycle replacements to ensure meter accuracy, fairness in billing, and improved customer service. Replacing AMI meters
through life‐cycle replacement will also help with the Utility's water loss reduction. Continuous funding from Enterprise and Bond account for replacement of this
critical asset is required for sustainable operations. This project is aligned with the Mayor and Commission strategic commitment of Financial Health and Economic
Prosperity.
Predicted increase in operating revenues by replacing meters which under‐report consumption.
Capital Detail by Department FY20 Budget D-90

Public Utilities Department Priority
Rehabilitate and Replace Sewers 6 of 16CS, Infrastructure Project Timeline: FY12 ‐ Ongoing
Project Description
Project Justification
Impact on Annual Operating Expenses
Financial Plan Project ID: c0644
FY18 FY19 FY20 FY21 FY22 FY23 FY24 FY25‐29 Total
End Bal. Budget Approved Proposed Proposed Proposed Proposed Proposed Proposed
SOURCES
Water & Sewer Const. Fund 24,861,880 14,000,000 9,951,800 5,000,000 5,000,000 4,000,000 6,000,000 30,000,000 59,951,800
W&S Bonds Const. Fund 211,900 ‐ ‐ ‐ ‐ ‐ ‐ ‐ ‐
TOTAL SOURCES 25,073,780 14,000,000 9,951,800 5,000,000 5,000,000 4,000,000 6,000,000 30,000,000 59,951,800
USES
Capital ‐ Infrastructure 25,073,780 14,000,000 9,951,800 5,000,000 5,000,000 4,000,000 6,000,000 30,000,000 59,951,800
TOTAL USES 25,073,780 14,000,000 9,951,800 5,000,000 5,000,000 4,000,000 6,000,000 30,000,000 59,951,800
Evaluation of the sewer lines is the first step in determining specific locations in need of rehabilitation. The evaluation process is conducted utilizing a number of different procedures
such as TV inspection, smoke testing, as‐built surveys and monitoring existing flow conditions. The specific locations and the rehabilitation or replacement methods will be determined
on a case‐by‐case basis. This project also includes Sewer System Evaluation Survey (SSES) inspections and cured‐in‐place pipe lining rehabilitation where needed on sewer pipes in the
highest‐ranked‐flow meter basins, which comprise of 260 miles of pipe. SSES and R&R costs continue into out years to evaluate and rehabilitate trunk, interceptor and collection
system assets. Finally, and most importantly, the project work will add capacity to existing sewers for existing customers. The latter includes replacing sewers in these sewersheds:
Brooklyn, Tanyard, Upper North Oconee, Middle Oconee East and McNutt Creek.
Sections of the existing wastewater collection system are 80‐100 years old and much of the system was constructed with vitrified clay pipe. As a result, there are sections of pipe
within the wastewater collection system experiencing inflow and infiltration problems. These problems may be minor cracks in pipe or they could represent sections experiencing
major structural problems. Locating and correcting these problems will ensure the integrity of the wastewater collection system and help eliminate wet‐weather sewer system
overflows and will restore both sewer and plant capacity. Continuous funding for replacement of this critical asset is required for sustainable operations. This project is aligned with
the Mayor and Commission strategic commitments of Financial Health and Economic Prosperity and Accountable and Responsive Government.
Predicted decrease in emergency calls, overtime, and emergency repairs. Predicted decrease in wastewater reclamation costs and deferral of future Water Reclamation Facility
expansion. Added cost for depreciation.
Capital Detail by Department
FY20 Budget D-91
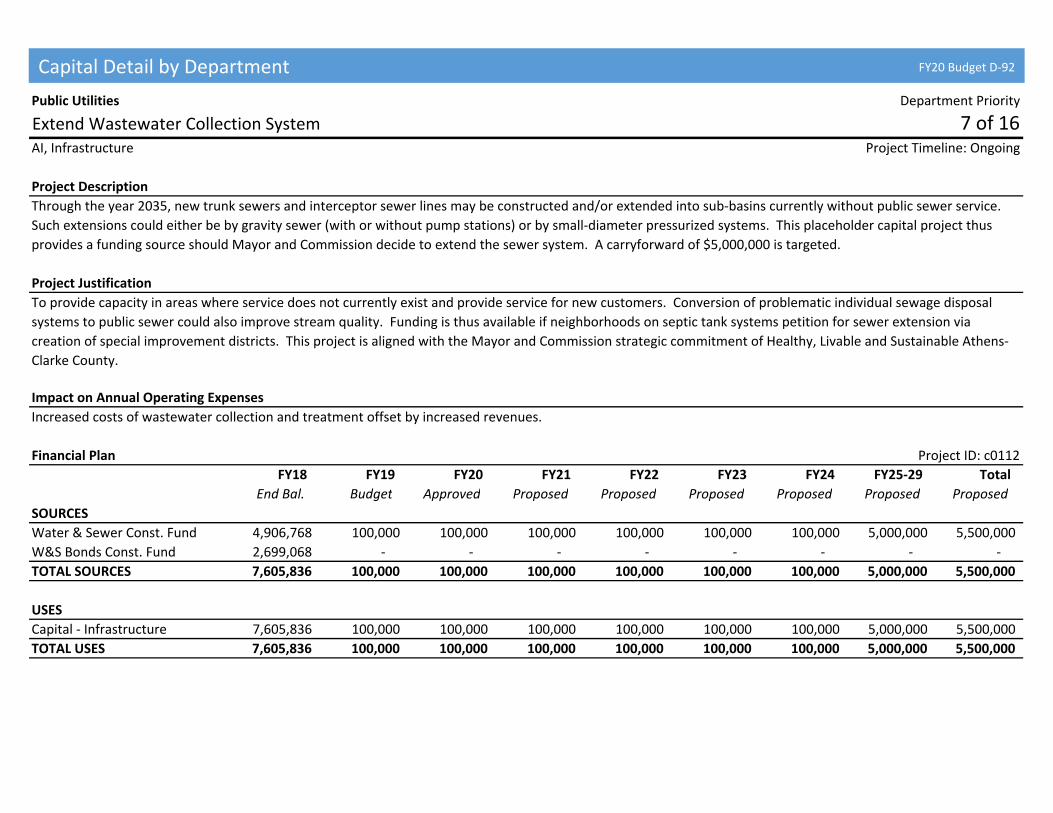
Public Utilities Department Priority
Extend Wastewater Collection System 7 of 16AI, Infrastructure Project Timeline: Ongoing
Project Description
Project Justification
Impact on Annual Operating Expenses
Financial Plan Project ID: c0112
FY18 FY19 FY20 FY21 FY22 FY23 FY24 FY25‐29 Total
End Bal. Budget Approved Proposed Proposed Proposed Proposed Proposed Proposed
SOURCES
Water & Sewer Const. Fund 4,906,768 100,000 100,000 100,000 100,000 100,000 100,000 5,000,000 5,500,000
W&S Bonds Const. Fund 2,699,068 ‐ ‐ ‐ ‐ ‐ ‐ ‐ ‐
TOTAL SOURCES 7,605,836 100,000 100,000 100,000 100,000 100,000 100,000 5,000,000 5,500,000
USES
Capital ‐ Infrastructure 7,605,836 100,000 100,000 100,000 100,000 100,000 100,000 5,000,000 5,500,000
TOTAL USES 7,605,836 100,000 100,000 100,000 100,000 100,000 100,000 5,000,000 5,500,000
Through the year 2035, new trunk sewers and interceptor sewer lines may be constructed and/or extended into sub‐basins currently without public sewer service.
Such extensions could either be by gravity sewer (with or without pump stations) or by small‐diameter pressurized systems. This placeholder capital project thus
provides a funding source should Mayor and Commission decide to extend the sewer system. A carryforward of $5,000,000 is targeted.
To provide capacity in areas where service does not currently exist and provide service for new customers. Conversion of problematic individual sewage disposal
systems to public sewer could also improve stream quality. Funding is thus available if neighborhoods on septic tank systems petition for sewer extension via
creation of special improvement districts. This project is aligned with the Mayor and Commission strategic commitment of Healthy, Livable and Sustainable Athens‐
Clarke County.
Increased costs of wastewater collection and treatment offset by increased revenues.
Capital Detail by Department FY20 Budget D-92

Public Utilities Department Priority
Replace and Upgrade Facilities and Equipment 8 of 16CS, Equipment Project Timeline: Ongoing
Project Description
Project Justification
Impact on Annual Operating Expenses
Financial Plan Project ID: c0216/c0217/c0218/c0219/c0563
FY18 FY19 FY20 FY21 FY22 FY23 FY24 FY25‐29 Total
End Bal. Budget Approved Proposed Proposed Proposed Proposed Proposed Proposed
SOURCES
Water & Sewer Const. Fund 7,181,734 5,400,000 5,300,000 3,300,000 3,400,000 3,450,000 3,300,000 17,250,000 36,000,000
W&S Bonds Const. Fund 1,511,459 ‐ ‐ ‐ ‐ ‐ ‐ ‐ ‐
TOTAL SOURCES 8,693,193 5,400,000 5,300,000 3,300,000 3,400,000 3,450,000 3,300,000 17,250,000 36,000,000
USES
Capital ‐ Machinery & Equip 8,693,193 5,400,000 5,300,000 3,300,000 3,400,000 3,450,000 3,300,000 17,250,000 36,000,000
TOTAL USES 8,693,193 5,400,000 5,300,000 3,300,000 3,400,000 3,450,000 3,300,000 17,250,000 36,000,000
Annual cost to replace and / or conduct major repairs to fixed equipment and facilities within the Public Utilities Department (PUD). Facilities include the drinking
water plant and intakes, water reclamation facilities, the Water Resources Center, 124 East Hancock Avenue, Water & Sewer Construction & Maintenance shop, and
the Meter Management shop. Also includes vehicles and stocking critical spare parts as required by EPD permits. This program also includes upgrades which
improve plant efficiency, permit compliance and / or performance reliability. Land acquisition and construction of new shops for Water & Sewer and Meters is
included.
Avoid spikes in the water rates by maintaining a consistent level of funding for major repairs and replacement. Continuous funding for replacement of equipment is
required for sustainable operations, reliable performance under the Safe Drinking Water Act and Clean Water Act, and for compliance with permit conditions. For
example, our Clean Water Act permits state that the "permittee shall maintain ... all treatment or control facilities and related equipment". This project is aligned
with the Mayor and Commission strategic commitments of Financial Health and Economic Prosperity and Accountable and Responsive Government.
Net zero impact. Cost savings can derive from the following: avoid permit penalties; shift from corrective maintenance to less expensive preventive maintenance;
gain treatment process efficiencies. Added cost from increased depreciation.
Capital Detail by Department
FY20 Budget D-93

Public Utilities Department Priority
Rehabilitate and Replace Water Lines 9 of 16CS, Infrastructure Project Timeline: FY17 ‐ Ongoing
Project Description
Project Justification
Impact on Annual Operating Expenses
Financial Plan Project ID: c0720
FY18 FY19 FY20 FY21 FY22 FY23 FY24 FY25‐29 Total
End Bal. Budget Approved Proposed Proposed Proposed Proposed Proposed Proposed
SOURCES
Water & Sewer Const. Fund 1,219,875 2,500,000 2,750,000 3,000,000 3,000,000 3,000,000 4,000,000 20,000,000 35,750,000
TOTAL SOURCES 1,219,875 2,500,000 2,750,000 3,000,000 3,000,000 3,000,000 4,000,000 20,000,000 35,750,000
USES
Capital ‐ Infrastructure 1,219,875 2,500,000 2,750,000 3,000,000 3,000,000 3,000,000 4,000,000 20,000,000 35,750,000
TOTAL USES 1,219,875 2,500,000 2,750,000 3,000,000 3,000,000 3,000,000 4,000,000 20,000,000 35,750,000
This R&R program includes a) replacement of small diameter water mains, b) leak detection program, c) repairing leaks, d) relining and replacing older mains, and e)
gridding or looping existing dead‐end lines. Where homes and businesses are on wells, this program includes funding for fire protection extensions. The individual
R&R projects will be turnkey and will therefore include reconnection of services to the main and, as needed, relocation of meters.
This reinvestment in a substantial part of the utility's public health and safety infrastructure will improve the hydraulic capacity of the water distribution system,
enhance fire protection, reduce discolored water complaints, help maintain ACC's ISO fire rating and extend the life of the older water mains. Replacing break‐prone
water lines will reduce the utility's real water losses and reduce customer outages. The leak detection program will make this program more cost effective by
maximizing the expenditure for R&R measured against real losses. This project is aligned with the Mayor and Commission strategic commitments of Financial Health
and Economic Prosperity and Accountable and Responsive Government.
Predicted decrease in emergency calls, overtime, and emergency repairs. Predicted decrease in water treatment costs and deferral of future water treatment plant
expansion. Added cost to depreciation.
Capital Detail by Department FY20 Budget D-94

Public Utilities Department Priority
Relocate Water & Sewer Lines for DOT Projects 10 of 16CS, Infrastructure Project Timeline: Ongoing
Project Description
Project Justification
Impact on Annual Operating Expenses
Financial Plan Project ID: c0102
FY18 FY19 FY20 FY21 FY22 FY23 FY24 FY25‐29 Total
End Bal. Budget Approved Proposed Proposed Proposed Proposed Proposed Proposed
SOURCES
Water & Sewer Const. Fund 405,055 100,000 100,000 100,000 100,000 100,000 100,000 500,000 1,000,000
TOTAL SOURCES 405,055 100,000 100,000 100,000 100,000 100,000 100,000 500,000 1,000,000
USES
Capital ‐ Infrastructure 405,055 100,000 100,000 100,000 100,000 100,000 100,000 500,000 1,000,000
TOTAL USES 405,055 100,000 100,000 100,000 100,000 100,000 100,000 500,000 1,000,000
This project provides annual funding to cover water / sewer line relocations for transportation projects not covered by another project. It is anticipated that in future
years FY21‐24 the proposed request will be removed, with a carryforward target of $500,000
To avoid spikes in the water rates by maintaining a consistent level of funding for DOT initiated water/sewer line relocation projects. This project is aligned with the
Mayor and Commission strategic commitment of Transportation Mobility and Connectivity.
No Impact
Capital Detail by Department
FY20 Budget D-95

Public Utilities Department Priority
Manage and Reuse Residual Solids 11 of 16CS, Infrastructure Project Timeline: Ongoing
Project Description
Project Justification
Impact on Annual Operating Expenses
Financial Plan Project ID: c0548
FY18 FY19 FY20 FY21 FY22 FY23 FY24 FY25‐29 Total
End Bal. Budget Approved Proposed Proposed Proposed Proposed Proposed Proposed
SOURCES
Water & Sewer Const. Fund 496,130 1,350,000 1,500,000 5,130,000 3,530,000 300,000 300,000 1,500,000 12,260,000
TOTAL SOURCES 496,130 1,350,000 1,500,000 5,130,000 3,530,000 300,000 300,000 1,500,000 12,260,000
USES
Capital ‐ Const. 496,130 1,350,000 1,500,000 5,130,000 3,530,000 300,000 300,000 1,500,000 12,260,000
TOTAL USES 496,130 1,350,000 1,500,000 5,130,000 3,530,000 300,000 300,000 1,500,000 12,260,000
Reduce and reuse residual solids from wastewater treatment. In addition to current composting, pursue opportunities for other modes of biosolids beneficial reuse
by upgrading biosolids stabilization and drying. Continue to dredge the alum sludge lagoon at the water plant approximately every 6‐7 years until the solids handling
facility is constructed at the J.G. Beacham Water Treatment Plant.
Alternative plans for biosolids could extend the life of the ACC landfill. Based on the volume of waste by‐product being received at the WTP, dredging the sludge
lagoon is the most cost effective at this time. This project is aligned with the Mayor and Commission strategic commitments of Healthy, Livable and Sustainable
Athens‐Clarke County.
Biosolids treatment, handling and disposal cost will increase by an undetermined amount. ACC landfill operating costs may decline with beneficial reuse.
Capital Detail by Department FY20 Budget D-96

Public Utilities Department Priority
Improve Water Supply Reliability 12 of 16CS, Infrastructure Project Timeline: FY18 ‐ FY38
Project Description
Project Justification
Impact on Annual Operating Expenses
Financial Plan Project ID: c0719
FY18 FY19 FY20 FY21 FY22 FY23 FY24 FY25‐29 Total
End Bal. Budget Approved Proposed Proposed Proposed Proposed Proposed Proposed
SOURCES
Water & Sewer Const. Fund 3,327,725 3,000,000 3,500,000 4,000,000 4,500,000 10,000,000 4,000,000 10,500,000 36,500,000
SPLOST 2020 ‐ ‐ 170,000 407,000 550,500 1,360,500 1,310,500 1,240,500 5,039,000
TOTAL SOURCES 3,327,725 3,000,000 3,670,000 4,407,000 5,050,500 11,360,500 5,310,500 11,740,500 41,539,000
USES
Capital ‐ Other 3,327,725 3,000,000 3,670,000 4,407,000 5,050,500 11,360,500 5,310,500 11,740,500 41,539,000
TOTAL USES 3,327,725 3,000,000 3,670,000 4,407,000 5,050,500 11,360,500 5,310,500 11,740,500 41,539,000
Extend the sufficiency and reliability of existing water supplies during drought. Make existing ratepayers less vulnerable to water shortages by switching bulk users of potable water to nonpotable water
(reclaimed wastewater), thus reducing demand on current potable supplies during a drought more severe than the drought for which current yield is calculated. Implement the first phase of a nonpotable
utility consistent with an overarching master plan of nonpotable and potable reuse.
Part of the intent of a reuse system is to displace demand on potable supplies; nonpotable reuse is thus an element of a larger strategy to drought‐proof existing supplies by reducing raw water
withdrawals from the rivers or reservoir. Other elements which make the community less vulnerable to drought include current and future conservation programs, tiered pricing on discretionary water (as
exists), and potable reuse where opportune. In the latter case, and if the community is willing, the foray into nonpotable reuse could be joined with another long‐range project identified in the SDP:
storage of raw water to carry the County through a protracted drought.
Raw water storage serves as ballast between intake (raw water withdrawal) and the drinking water plant; most large water systems that rely on river flow have many weeks of local raw water storage to
weather either reduced river flows or water quality problems with the supply source, such as a chemical spill. ACC’s share in Bear Creek Reservoir partially fulfills this purpose. But the prospects of a
drought worse than design are a chronic concern to water purveyors.
The first major step in further drought‐proofing current potable demand is to look for sites suitable for raw water storage devoted to ACC’s future water needs. For this reason the budget contains a total
of $20,000,000 across several years. This $20,000,000 figure is a placeholder estimate of initial costs and may not a) develop a site for storage of raw or reclaimed water nor b) connect that site to the rest
of the system.
This project is aligned with the M&C strategic commitment of Safe and Prepared Community.
To be determined. Although replacing potable with less‐expensive reuse water would diminish revenue from potable water sales, ratepayers benefit from the reduced likelihood of enforced reductions
during a drought.
Capital Detail by Department
FY20 Budget D-97
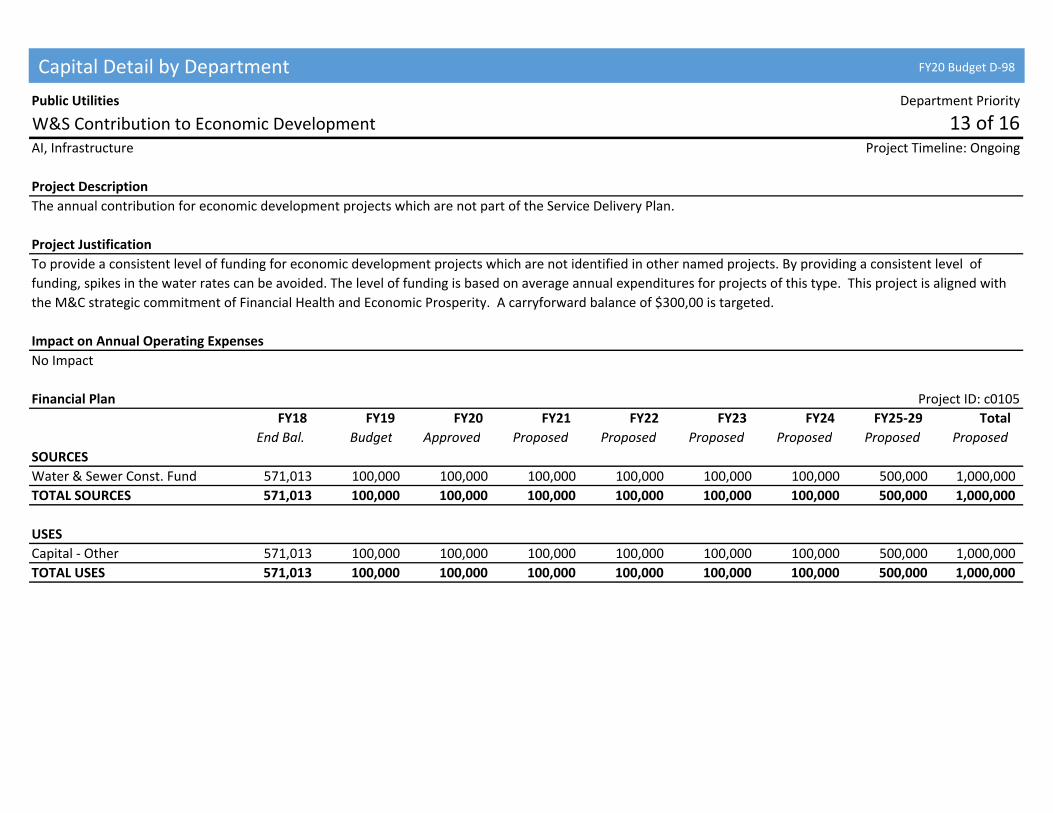
Public Utilities Department Priority
W&S Contribution to Economic Development 13 of 16AI, Infrastructure Project Timeline: Ongoing
Project Description
Project Justification
Impact on Annual Operating Expenses
Financial Plan Project ID: c0105
FY18 FY19 FY20 FY21 FY22 FY23 FY24 FY25‐29 Total
End Bal. Budget Approved Proposed Proposed Proposed Proposed Proposed Proposed
SOURCES
Water & Sewer Const. Fund 571,013 100,000 100,000 100,000 100,000 100,000 100,000 500,000 1,000,000
TOTAL SOURCES 571,013 100,000 100,000 100,000 100,000 100,000 100,000 500,000 1,000,000
USES
Capital ‐ Other 571,013 100,000 100,000 100,000 100,000 100,000 100,000 500,000 1,000,000
TOTAL USES 571,013 100,000 100,000 100,000 100,000 100,000 100,000 500,000 1,000,000
The annual contribution for economic development projects which are not part of the Service Delivery Plan.
To provide a consistent level of funding for economic development projects which are not identified in other named projects. By providing a consistent level of
funding, spikes in the water rates can be avoided. The level of funding is based on average annual expenditures for projects of this type. This project is aligned with
the M&C strategic commitment of Financial Health and Economic Prosperity. A carryforward balance of $300,00 is targeted.
No Impact
Capital Detail by Department FY20 Budget D-98

Public Utilities Department Priority
Investigate and Install Alternative Energy Generation 14 of 16CS, Equipment Project Timeline: Ongoing
Project Description
Project Justification
Impact on Annual Operating Expenses
Financial Plan Project ID: c0718
FY18 FY19 FY20 FY21 FY22 FY23 FY24 FY25‐29 Total
End Bal. Budget Approved Proposed Proposed Proposed Proposed Proposed Proposed
SOURCES
Water & Sewer Const. Fund 993,178 50,000 50,000 50,000 50,000 50,000 50,000 500,000 750,000
TOTAL SOURCES 993,178 50,000 50,000 50,000 50,000 50,000 50,000 500,000 750,000
USES
Capital ‐ Site Improvements 993,178 50,000 50,000 50,000 50,000 50,000 50,000 500,000 750,000
TOTAL USES 993,178 50,000 50,000 50,000 50,000 50,000 50,000 500,000 750,000
Investigate alternative sources of energy for water and wastewater treatment. This project includes the installation and maintenance of a solar energy generation
facility at the Cedar Creek Water Reclamation Facility.
This project is aligned with the Mayor and Commission strategic commitments of Healthy, Livable and Sustainable Athens‐Clarke County.
No Impact
Capital Detail by Department
FY20 Budget D-99

Public Utilities Department Priority
WRF Phosphorous Improvements 15 of 16AI, Equipment Project Timeline: FY19 ‐ Ongoing
Project Description
Project Justification
Impact on Annual Operating Expenses
Financial Plan Project ID: c0786
FY18 FY19 FY20 FY21 FY22 FY23 FY24 FY25‐29 Total
End Bal. Budget Approved Proposed Proposed Proposed Proposed Proposed Proposed
SOURCES
Water & Sewer Const. Fund ‐ ‐ ‐ 7,000,000 4,500,000 ‐ ‐ ‐ 11,500,000
TOTAL SOURCES ‐ ‐ ‐ 7,000,000 4,500,000 ‐ ‐ ‐ 11,500,000
USES
Capital ‐ Site Improvements ‐ ‐ ‐ 7,000,000 4,500,000 ‐ ‐ ‐ 11,500,000
TOTAL USES ‐ ‐ ‐ 7,000,000 4,500,000 ‐ ‐ ‐ 11,500,000
The NPDES permitted phosphorus limit is changing. This project addresses necessary upgrades at the three Water Reclamation Facilities.
This project was approved by Mayor & Commission on October 2, 2018. An agenda item was necessary to address the changes in timing and budget versus those
planned as part of the 2015 Service Delivery Update. This project aligns with the Healthy, Livable, Sustainable Athens‐Clarke County and the Safe and Prepared
Community FY19 Strategic Commitments.
A 1.1% increase in operating budget beginning in FY2020 is estimated due to advanced licensure required of the permit.
Capital Detail by Department FY20 Budget D-100

Public Utilities Department Priority
Water Transmission Grid Improvements 16 of 16AI, Infrastructure Project Timeline: FY19 ‐ Ongoing
Project Description
Project Justification
Impact on Annual Operating Expenses
Financial Plan Project ID: c0787
FY18 FY19 FY20 FY21 FY22 FY23 FY24 FY25‐29 Total
End Bal. Budget Approved Proposed Proposed Proposed Proposed Proposed Proposed
SOURCES
Water & Sewer Const. Fund ‐ 1,200,000 2,000,000 ‐ ‐ ‐ ‐ ‐ 2,000,000
TOTAL SOURCES ‐ 1,200,000 2,000,000 ‐ ‐ ‐ ‐ ‐ 2,000,000
USES
Capital ‐ Site Improvements ‐ 1,200,000 2,000,000 ‐ ‐ ‐ ‐ ‐ 2,000,000
TOTAL USES ‐ 1,200,000 2,000,000 ‐ ‐ ‐ ‐ ‐ 2,000,000
To provide redundancy in the water distribution system by performing interconnections at numerous junctures for large diameter pipes resulting in improved water
service reliability and fire protection.
Failure of the West Athens Transmission Line would impact much of the water service area with either total loss of service or water pressure below safe levels, with
accompanying boil water notices and impaired fire protection. Improvements to the grid structure will reduce the impact should the transmission line be out of
service because of breaks or the need for planned maintenance. This project is consistent with the M&C strategic commitment of Safe and Prepared Community.
This is an infrastructure improvement construction project. No annual operating expenses are anticipated.
Capital Detail by Department
FY20 Budget D-101

Sheriff Department Priority
Public Safety Initiative ‐Equip Tech 1 of 6AI, Equipment Project Timeline: FY05 ‐ Ongoing
Project Description
Project Justification
Impact on Annual Operating Expenses
Financial Plan Project ID: c0417
FY18 FY19 FY20 FY21 FY22 FY23 FY24 FY25‐29 Total
End Bal. Budget Approved Proposed Proposed Proposed Proposed Proposed Proposed
SOURCES
General Capital Fund 72,449 ‐ ‐ ‐ ‐ ‐ ‐ 150,000 150,000
TOTAL SOURCES 72,449 ‐ ‐ ‐ ‐ ‐ ‐ 150,000 150,000
USES
Capital ‐ Machinery & Equip 72,449 ‐ ‐ ‐ ‐ ‐ ‐ 150,000 150,000
TOTAL USES 72,449 ‐ ‐ ‐ ‐ ‐ ‐ 150,000 150,000
Public Safety, Field Service Initiative: Investment in new law enforcement technology, equipment and matching funds for grants as approved by Mayor and
Commission.
Continue office upgrades, along with camera and recording systems at the jail and courthouse, including repair and replacement of cameras, wiring, etc., as needed.
Purchase of new duty gear that utilizes the newest technology such as firearms, electronic control devices, wearable cameras, etc. Enhance the JTO and FTO
evaluation program (ADORE) from a local based computer software to the available web based program. Provide the necessary funding for a staffing analysis of the
Field Section of the Sheriff's Office. Provide matching local funds for grants. These funds have been needed for local cash match monies for grants and will be
needed for future grant opportunities.
No Impact
Capital Detail by Department FY20 Budget D-102

Sheriff Department Priority
Body Worn Cameras (New) 2 of 6CS, Public Safety Equipment Project Timeline: FY20 ‐ Ongoing
Project Description
Project Justification
Impact on Annual Operating Expenses
Financial Plan Project ID: New
FY18 FY19 FY20 FY21 FY22 FY23 FY24 FY25‐29 Total
End. Bal. Budget Approved Proposed Proposed Proposed Proposed Proposed Proposed
SOURCES
General Capital Fund ‐ ‐ 42,000 ‐ ‐ ‐ ‐ 212,000 254,000
TOTAL SOURCES ‐ ‐ 42,000 ‐ ‐ ‐ ‐ 212,000 254,000
USES
Capital ‐ Machinery & Equip ‐ ‐ 42,000 ‐ ‐ ‐ ‐ 212,000 254,000
TOTAL USES ‐ ‐ 42,000 ‐ ‐ ‐ ‐ 212,000 254,000
Provide Body Worn Camera to supply Sheriff Field Section (25 units) in FY20 and replacement of existing inventory for Sheriff Jail Section (125 units) in FY23. Project
provides for five (5) full years including camera purchase, service, software and support from time of initial purchase, plus additional future years use for the life of
the equipment.
Body Worn Cameras (BWC) contribute to safety, transparency, and accountability of field staff in community operations and detention staff in jail operations.
Availability and visibility of BWC equipment creates an immediate positive change in the demeanor and behavior of individuals in law enforcement encounters.
Availability of video and audio record of law enforcement encounters enhances investigative accuracy of information for investigation of criminal behavior, potential
citizen complaints, and review of law enforcement conduct. This combination of available information increases safety of law enforcement and community
members, increases transparency of incident information, and reduces liability and associated costs.
Annual Operating Costs begin at the conclusion of the 5 year Life Cycle Support Period. Upon full project completion this cost is $10,562. Split implementation makes
the annual replacement costs complicated. Given a 5 year life cycle of a body worn camera, the annual replacement cost for FY20 (Field units only) ‐ $8,400; FY21
(Field units only) ‐ $8,400; FY22 (Field units only) ‐ $8,400; FY23 (Field & Jail units) ‐ $42,400; FY24 (Field & Jail units) ‐ $42,400.
Capital Detail by Department
FY20 Budget D-103

Sheriff Department Priority
Replace Mobile Data Computers 3 of 6CS, Equipment Project Timeline: FY10 ‐ Ongoing
Project Description
Project Justification
Impact on Annual Operating Expenses
Financial Plan Project ID: c0715
FY18 FY19 FY20 FY21 FY22 FY23 FY24 FY25‐29 Total
End Bal. Budget Approved Proposed Proposed Proposed Proposed Proposed Proposed
SOURCES
General Capital Fund ‐ ‐ ‐ ‐ ‐ ‐ ‐ 76,000 76,000
TOTAL SOURCES ‐ ‐ ‐ ‐ ‐ ‐ ‐ 76,000 76,000
USES
Capital ‐ Machinery & Equip ‐ ‐ ‐ ‐ ‐ ‐ ‐ 76,000 76,000
TOTAL USES ‐ ‐ ‐ ‐ ‐ ‐ ‐ 76,000 76,000
To purchase 20 Mobile Data Terminals (computers) that will be used by the Clarke County Sheriff’s Office Field Deputies in their cars to conduct their daily duties
while out in the field. The cost of the project includes an extended maintenance and warranty plan for the equipment.
This project allows for deputies to access the Public Safety Records Management System in the field through mobile data terminals (computers) to conduct the
following tasks:
. Check status of arrest warrants
. Access photographs and other personal information on wanted persons
. Access Temporary Protection Orders to check for compliance
. Access the sexual offender registry to check for compliance
. Access maps and other tools for criminal investigations.
. Access criminal history information on wanted person
The ability to conduct these tasks in the field verses the office saves time and resources.
Annual Operating Costs will increase from $5,280 to $9,600 for a difference of $4,320. Annual Replacement Costs = $15,200
Capital Detail by Department FY20 Budget D-104

Sheriff Department Priority
Tasers and Related Equipment (New) 4 of 6CS, Public Safety Equipment Project Timeline: FY24 ‐ Ongoing
Project Description
Project Justification
Impact on Annual Operating Expenses
Financial Plan Project ID: New
FY18 FY19 FY20 FY21 FY22 FY23 FY24 FY25‐29 Total
End. Bal. Budget Approved Proposed Proposed Proposed Proposed Proposed Proposed
SOURCES
General Capital Fund ‐ ‐ ‐ ‐ ‐ ‐ ‐ 88,000 88,000
TOTAL SOURCES ‐ ‐ ‐ ‐ ‐ ‐ ‐ 88,000 88,000
USES
Capital ‐ Machinery & Equip ‐ ‐ ‐ ‐ ‐ ‐ ‐ 88,000 88,000
TOTAL USES ‐ ‐ ‐ ‐ ‐ ‐ ‐ 88,000 88,000
This project will provide provision and replacement for forty‐six (46) Tasers and support equipment (Holsters, cartridges, batteries, etc.) for the Sheriff's Office. This
project includes an extended warranty for the equipment. We anticipate this purchase need between FY 2024‐2026.
Electronic Control Weapons (Tasers) are an integral part of our force continuum model. Tasers are a 'less than lethal' use of force option that may assist our deputies
when dealing with combative, violent or aggressive people. The use of Tasers help reduce risk of injury to deputies, offenders, and members of the public. Taser
technology can immobilize a suspect who can overcome pain, might be on dangerous drugs like cocaine or methamphetamine or even emotionally disturbed,
whereas other non‐lethal tools rely upon pain compliance. The Taser system doesn't use pain compliance but immediately stops any coordinated action by the
subject only while the Taser system's current is flowing.
Annual Operating Expenses is $5,000. This includes cost of repairs and purchasing cartridges, batteries, and training supplies related to the use of the tasers. The
impact on the operations budget should remain the same as the CCSO is currently funded for operating expenses related to the tasers and related equipment. Given
the cost of the equipment and a life cycle of 5 years, the annual replacement cost is estimated at $18,000.
Capital Detail by Department
FY20 Budget D-105

Sheriff Department Priority
Replace Courthouse Security Equipment 5 of 6CS, Equipment Project Timeline: FY05 ‐ Ongoing
Project Description
Project Justification
Impact on Annual Operating Expenses
Financial Plan Project ID: c0500
FY18 FY19 FY20 FY21 FY22 FY23 FY24 FY25‐29 Total
End Bal. Budget Approved Proposed Proposed Proposed Proposed Proposed Proposed
SOURCES
General Capital Fund ‐ ‐ ‐ ‐ ‐ ‐ ‐ 75,000 75,000
TOTAL SOURCES ‐ ‐ ‐ ‐ ‐ ‐ ‐ 75,000 75,000
USES
Capital ‐ Machinery & Equip ‐ ‐ ‐ ‐ ‐ ‐ ‐ 75,000 75,000
TOTAL USES ‐ ‐ ‐ ‐ ‐ ‐ ‐ 75,000 75,000
This project involves the purchase of two security screening x‐ray machines (PX6.4 X‐Ray Systems at $30,000 each) and two walk through metal detectors (PD6500i
WTMD's at $4,000 each) in FY24‐28 to replace existing equipment. The current equipment has a ten year life cycle. Total cost is estimated at $75,000 for the initial
purchase. After the first year of purchase, there will also be operating expenses for a maintenance plan at an annual cost of $13,000 for both sets of machines.
The security screening machines and the walk through metal detectors are essential to providing the necessary security for the Clarke County Courthouse. The
screening machines are able to scan packages and other belongings that are brought into the courthouse. It also displays images of property for the purpose of
detecting weapons and/or explosive devices. The advanced features of the security screening machine include operator assistance, image archiving, and threat
image protection. The walk through metal detectors have the capability to detect metal objects in eight different zones within its frame. It will also provide visual
display that pinpoints the area of alarm.
Annual operating costs = $13,000 for the annual service contract. Annual replacement costs = $7,500.
Capital Detail by Department FY20 Budget D-106

Sheriff Department Priority
Replace Prisoner Transport Bus 6 of 6CS, Transportation Project Timeline: FY00 ‐ Ongoing
Project Description
Project Justification
Impact on Annual Operating Expenses
Financial Plan Project ID: N/A
FY18 FY19 FY20 FY21 FY22 FY23 FY24 FY25‐29 Total
End Bal. Budget Approved Proposed Proposed Proposed Proposed Proposed Proposed
SOURCES
General Capital Fund ‐ ‐ ‐ ‐ ‐ ‐ ‐ 250,000 250,000
TOTAL SOURCES ‐ ‐ ‐ ‐ ‐ ‐ ‐ 250,000 250,000
USES
Capital ‐ Vehicles ‐ ‐ ‐ ‐ ‐ ‐ ‐ 250,000 250,000
TOTAL USES ‐ ‐ ‐ ‐ ‐ ‐ ‐ 250,000 250,000
The existing prisoner transport bus (44 passenger) was purchased and delivered in February 2000. It was purchased through the Sheriff's Inmate Special Revenue
Fund. It is currently not in the vehicle replacement program.
The existing prisoner transport bus is used to transport inmates between the jail and the courthouse for court appearances. It is vital and necessary to the Sheriff's
Office to have this means of transportation because it reduces the number of trips back and forth from the jail to the courthouse because of its passenger capacity.
No Impact
Capital Detail by Department
FY20 Budget D-107

Solid Waste Department Priority
Replace Bulldozer 1 of 13CS, Equipment Project Timeline: Ongoing
Project Description
Project Justification
Impact on Annual Operating Expenses
Financial Plan Project ID: c0728
FY18 FY19 FY20 FY21 FY22 FY23 FY24 FY25‐29 Total
End Bal. Budget Approved Proposed Proposed Proposed Proposed Proposed Proposed
SOURCES
Landfill Fund 12,513 100,000 300,000 120,000 120,000 120,000 120,000 240,000 1,020,000
TOTAL SOURCES 12,513 100,000 300,000 120,000 120,000 120,000 120,000 240,000 1,020,000
USES
Capital ‐ Machinery & Equip 12,513 100,000 300,000 120,000 120,000 120,000 120,000 240,000 1,020,000
TOTAL USES 12,513 100,000 300,000 120,000 120,000 120,000 120,000 240,000 1,020,000
This project is for the routine replacement of the two (2) bulldozers used daily at the Athens‐Clarke County Municipal Solid Waste landfill.
The two (2) D8 bulldozers are the most heavily used pieces of equipment at the landfill. They are used daily for earth‐moving, pushing trash to the working face,
covering trash with dirt and rock removal. The current bulldozers are a 2011 and a 2014 Caterpillars . Their useful life is approximately seven years. The replacements
can be done using the Georgia Municipal Association loan program spreading the purchase over a three year time frame. On June 7, 2016, the Mayor & Commission
approved moving funding for one of the two new bulldozers to FY17 ‐ FY19. The new bulldozer was purchased in July 2016 (FY17) and replaced the 2011 due to a
catastrophic failure. The 2014 will be replaced FY20‐FY22 and the 2016 will be replaced in FY23‐FY25. Pricing was increased in FY20 due to market.
The two bulldozers are the most heavily used pieces of equipment at the landfill. Their useful life is short due to the harsh operating environment. Initial
maintenance costs are reduced due to warranty coverages. Depreciation is not normally impacted as the dozers have such a short replacement life span.
Capital Detail by Department FY20 Budget D-108

Solid Waste Department Priority
Replace Dump Truck (25 yard articulating) 2 of 13CS, Equipment Project Timeline: Ongoing
Project Description
Project Justification
Impact on Annual Operating Expenses
Financial Plan Project ID: c0601
FY18 FY19 FY20 FY21 FY22 FY23 FY24 FY25‐29 Total
End Bal. Budget Approved Proposed Proposed Proposed Proposed Proposed Proposed
SOURCES
Landfill Fund 210,027 134,000 134,000 134,000 ‐ ‐ ‐ 400,000 668,000
TOTAL SOURCES 210,027 134,000 134,000 134,000 ‐ ‐ ‐ 400,000 668,000
USES
Capital ‐ Vehicles 210,027 134,000 134,000 134,000 ‐ ‐ ‐ 400,000 668,000
TOTAL USES 210,027 134,000 134,000 134,000 ‐ ‐ ‐ 400,000 668,000
This project is for the routine replacement of the two 25 yard Articulating Dump Trucks for use at the ACC Municipal Solid Waste Landfill.
The landfill currently uses two 25 yard articulating dump trucks to haul dirt and other materials. The current vehicles are a 1996 Volvo and a 2016 Volvo. The vehicles
have a useful operational life of approximately 15 years. Due to changes in operation with the new Phase 3 cell and significant stockpiles of cover dirt the
replacement need has been extended. Vehicles are typically purchased using the Georgia Municipal Association loan program thereby spreading the payments our
over three years. Funds are set aside annually in the landfill's budget for equipment replacements. The 1996 Volvo will be replaced during the FY19‐FY21 cycle.
Reduced maintenance cost due to warranty coverage. Increased depreciation cost as older models are fully depreciated at time of replacement.
Capital Detail by Department
FY20 Budget D-109

Solid Waste Department Priority
Replace Trash Compactor 3 of 13CS, Equipment Project Timeline: Ongoing
Project Description
Project Justification
Impact on Annual Operating Expenses
Financial Plan Project ID: c0383
FY18 FY19 FY20 FY21 FY22 FY23 FY24 FY25‐29 Total
End Bal. Budget Approved Proposed Proposed Proposed Proposed Proposed Proposed
SOURCES
Landfill Fund ‐ ‐ 450,000 450,000 450,000 450,000 900,000 2,700,000
TOTAL SOURCES ‐ ‐ ‐ 450,000 450,000 450,000 450,000 900,000 2,700,000
USES
Capital ‐ Vehicles ‐ ‐ 450,000 450,000 450,000 450,000 900,000 2,700,000
TOTAL USES ‐ ‐ ‐ 450,000 450,000 450,000 450,000 900,000 2,700,000
This project is for the routine replacement of the two (2) trash compactors used daily at the Athens‐Clarke County Municipal Solid Waste Landfill. Equipment
purchase is planned to be funded over a three year period through the Georgia Municipal Association's (GMA) loan pool.
Trash compactor vehicles are essential to the efficient operation of the landfill. Subtitle D landfill requirements necessitate compaction for all refuse to save land and
air space. The expected life cycle of a compactor is eight (8) years. The current tonnage at the landfill allows for a slightly longer life cycle. The compactor is used to
properly position refuse in the working area of the landfill and then compact the materials by repeatedly driving over the area with spiked wheels. Compactors weigh
over 100,000 lbs. Two (2) compactors are required to be at the landfill by state Proposed Design and Operating Plans for the landfill. The FY20‐22 year funds will
replace a 2008 Al‐jon. The FY23‐25 year funds will replace a 2013 Al‐jon. In FY20, compactor purchase pushed back one year and increased budget amount because
Al‐jon no longer in business.
Reduction in initial maintenance costs due to warranty coverage. Depreciation remains fairly constant due to short life of equipment.
Capital Detail by Department FY20 Budget D-110

Solid Waste Department Priority
Replace Track Excavator 4 of 13CS, Equipment Project Timeline: Ongoing
Project Description
Project Justification
Impact on Annual Operating Expenses
Financial Plan Project ID: N/A
FY18 FY19 FY20 FY21 FY22 FY23 FY24 FY25‐29 Total
End Bal. Budget Approved Proposed Proposed Proposed Proposed Proposed Proposed
SOURCES
Landfill Fund ‐ ‐ ‐ 90,000 90,000 90,000 ‐ ‐ 270,000
TOTAL SOURCES ‐ ‐ ‐ 90,000 90,000 90,000 ‐ ‐ 270,000
USES
Capital ‐ Machinery & Equip ‐ ‐ ‐ 90,000 90,000 90,000 ‐ ‐ 270,000
TOTAL USES ‐ ‐ ‐ 90,000 90,000 90,000 ‐ ‐ 270,000
Replace the existing Track Excavator at the landfill.
The excavator is used daily to load dirt, rock, mulch and for maintenance and construction of drainage/detention areas. The current excavator is a 2001 and has an
estimated useful life of 12 years. Funds are set aside annually in the landfill enterprise fund for equipment replacements. Equipment purchase is planned to be
funded over a three year period through the Georgia Municipal Association's (GMA) loan pool. The 2001 track excavator will be replaced during the FY21‐FY23 cycle.
Initial maintenance cost would be lower due to warranty coverage.
Capital Detail by Department
FY20 Budget D-111
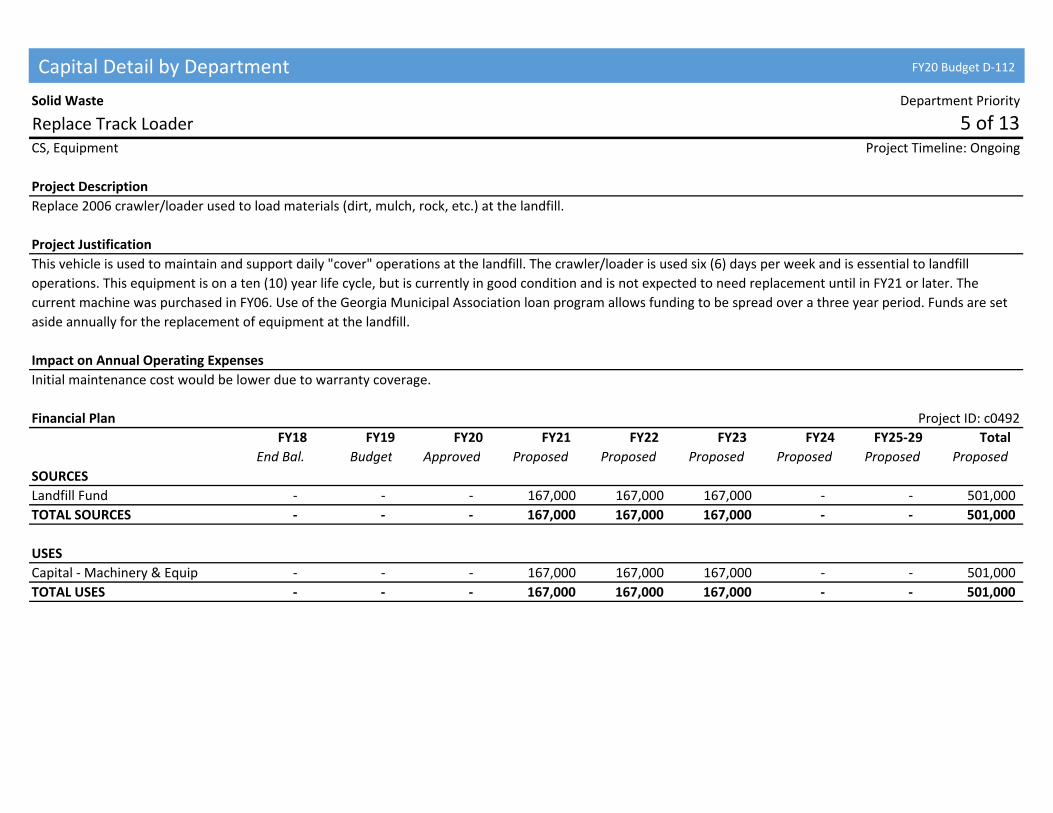
Solid Waste Department Priority
Replace Track Loader 5 of 13CS, Equipment Project Timeline: Ongoing
Project Description
Project Justification
Impact on Annual Operating Expenses
Financial Plan Project ID: c0492
FY18 FY19 FY20 FY21 FY22 FY23 FY24 FY25‐29 Total
End Bal. Budget Approved Proposed Proposed Proposed Proposed Proposed Proposed
SOURCES
Landfill Fund ‐ ‐ ‐ 167,000 167,000 167,000 ‐ ‐ 501,000
TOTAL SOURCES ‐ ‐ ‐ 167,000 167,000 167,000 ‐ ‐ 501,000
USES
Capital ‐ Machinery & Equip ‐ ‐ ‐ 167,000 167,000 167,000 ‐ ‐ 501,000
TOTAL USES ‐ ‐ ‐ 167,000 167,000 167,000 ‐ ‐ 501,000
Replace 2006 crawler/loader used to load materials (dirt, mulch, rock, etc.) at the landfill.
This vehicle is used to maintain and support daily "cover" operations at the landfill. The crawler/loader is used six (6) days per week and is essential to landfill
operations. This equipment is on a ten (10) year life cycle, but is currently in good condition and is not expected to need replacement until in FY21 or later. The
current machine was purchased in FY06. Use of the Georgia Municipal Association loan program allows funding to be spread over a three year period. Funds are set
aside annually for the replacement of equipment at the landfill.
Initial maintenance cost would be lower due to warranty coverage.
Capital Detail by Department FY20 Budget D-112

Solid Waste Department Priority
Replace Walking Floor Trailer (1986) 6 of 13CS, Equipment Project Timeline: FY23 ‐ FY23
Project Description
Project Justification
Impact on Annual Operating Expenses
Financial Plan Project ID: N/A
FY18 FY19 FY20 FY21 FY22 FY23 FY24 FY25‐29 Total
End Bal. Budget Approved Proposed Proposed Proposed Proposed Proposed Proposed
SOURCES
Landfill Fund ‐ ‐ ‐ ‐ 100,000 ‐ ‐ 100,000
TOTAL SOURCES ‐ ‐ ‐ ‐ ‐ 100,000 ‐ ‐ 100,000
USES
Capital ‐ Machinery & Equip ‐ ‐ ‐ ‐ 100,000 ‐ ‐ 100,000
TOTAL USES ‐ ‐ ‐ ‐ ‐ 100,000 ‐ ‐ 100,000
Purchase a replacement walking/live floor trailer as a replacement for the 1986 trailer for the Athens‐Clarke County MSW Landfill.
The current trailer is used to haul trash to the working face. The projected life cycle of a walking/live floor trailer is twenty (20) years and the current tractor is over
thirty‐one (31) years old and needs replaced.
Replacement: $5,000 annually
Capital Detail by Department
FY20 Budget D-113

Solid Waste Department Priority
Replace Trommel Screen in Compost Operations 7 of 13CS, Equipment Project Timeline: Ongoing
Project Description
Project Justification
Impact on Annual Operating Expenses
Financial Plan Project ID: c0566
FY18 FY19 FY20 FY21 FY22 FY23 FY24 FY25‐29 Total
End Bal. Budget Approved Proposed Proposed Proposed Proposed Proposed Proposed
SOURCES
Landfill Fund ‐ ‐ ‐ ‐ ‐ 200,000 ‐ ‐ 200,000
TOTAL SOURCES ‐ ‐ ‐ ‐ ‐ 200,000 ‐ ‐ 200,000
USES
Capital ‐ Machinery & Equip ‐ ‐ ‐ ‐ ‐ 200,000 ‐ ‐ 200,000
TOTAL USES ‐ ‐ ‐ ‐ ‐ 200,000 ‐ ‐ 200,000
Purchase of a replacement trommel screen to process finished compost at the ACC Municipal Solid Waste Landfill.
The trommel screen is used to sift finished compost material for final use. Materials that have met the processing and testing conditions are run through the screen
to remove the larger materials. Larger materials are returned to the processing area for re‐mixing. Finished materials are sold to the public or used in Landfill
operations. Funds for the replacement of this and other equipment at the Landfill are set aside annually for their replacement. Equipment purchase is planned to be
funded over a three year period through the Georgia Municipal Association's (GMA) loan pool.
Initial maintenance cost would be lower due to warranty coverage.
Capital Detail by Department FY20 Budget D-114

Solid Waste Department Priority
Replace Windrow Turner in Compost Operations 8 of 13CS, Equipment Project Timeline: Ongoing
Project Description
Project Justification
Impact on Annual Operating Expenses
Financial Plan Project ID: c0564
FY18 FY19 FY20 FY21 FY22 FY23 FY24 FY25‐29 Total
End Bal. Budget Approved Proposed Proposed Proposed Proposed Proposed Proposed
SOURCES
Landfill Fund ‐ ‐ 150,000 ‐ ‐ ‐ ‐ 150,000
TOTAL SOURCES ‐ ‐ ‐ 150,000 ‐ ‐ ‐ ‐ 150,000
USES
Capital ‐ Machinery & Equip ‐ ‐ 150,000 ‐ ‐ ‐ ‐ 150,000
TOTAL USES ‐ ‐ ‐ 150,000 ‐ ‐ ‐ ‐ 150,000
Purchase a replacement windrow turner for the bio‐solid/yard and food scrap composting program.
A windrow turner is a critical piece of equipment for the composting program. The turner self propelled and mixes the windrows of compost approximately once
every three days. Proper turning of the windrows is critical and mandated (when composting bio‐solids) to accelerate the composting process and reduce odors. The
equipment has a 12 year life and funds are set aside in the landfill enterprise fund annually for replacement. This purchase will assist the Department in reaching the
Mayor and Commission waste diversion goals with the final goal of 75% waste diverted by 2020. The only way to reach this goal is through an expanded composting
program. Pushed purchase from FY20‐FY21 due to ASP conversion.
Initial maintenance cost would be lower due to warranty coverage.
Capital Detail by Department
FY20 Budget D-115

Solid Waste Department Priority
Closure of Landfill‐ Phase 1 & 2 Areas 9 of 13CS, Facilities Project Timeline: Ongoing
Project Description
Project Justification
Impact on Annual Operating Expenses
Financial Plan Project ID: c0432
FY18 FY19 FY20 FY21 FY22 FY23 FY24 FY25‐29 Total
End Bal. Budget Approved Proposed Proposed Proposed Proposed Proposed Proposed
SOURCES
Landfill Fund ‐ ‐ ‐ ‐ ‐ ‐ ‐ 2,500,000 2,500,000
TOTAL SOURCES ‐ ‐ ‐ ‐ ‐ ‐ ‐ 2,500,000 2,500,000
USES
Capital ‐ Other ‐ ‐ ‐ ‐ ‐ ‐ ‐ 200,000 200,000
Capital ‐ Site Improvements ‐ ‐ ‐ ‐ ‐ ‐ ‐ 2,300,000 2,300,000
TOTAL USES ‐ ‐ ‐ ‐ ‐ ‐ ‐ 2,500,000 2,500,000
The existing Athens‐Clarke County Sanitary Landfill located at 5700 Lexington Road consist of approximately 460 acres on the Clarke/Oglethorpe County line. It has
been owned and operated as a municipal landfill since November 1976. A‐CC is currently operating a Sub‐title D (lined) landfill which is designed to meet all federal
standards, including a closure and post‐closure care plan to be implemented when the landfill has reached capacity. Closure of Phase 1 was funded in FY06 at $3.1
million, but due to operational changes the closure has been delayed. Two years of capacity are remaining in Phase 2.
The landfill has proposed to expand the landfill adjacent to Phase 1 (Phase 5). With this change the closure of Phase 1 may not be required in the next 10 years.
Funds previously set aside for closure of Phase 1 are proposed to be used for Phase 2 closure. The out year funds are requested for the closure of Phase 3 sometime
in FY18. Funds for closure and post closure care are set aside annually in the Landfill Enterprise Fund.
No Impact
Capital Detail by Department FY20 Budget D-116
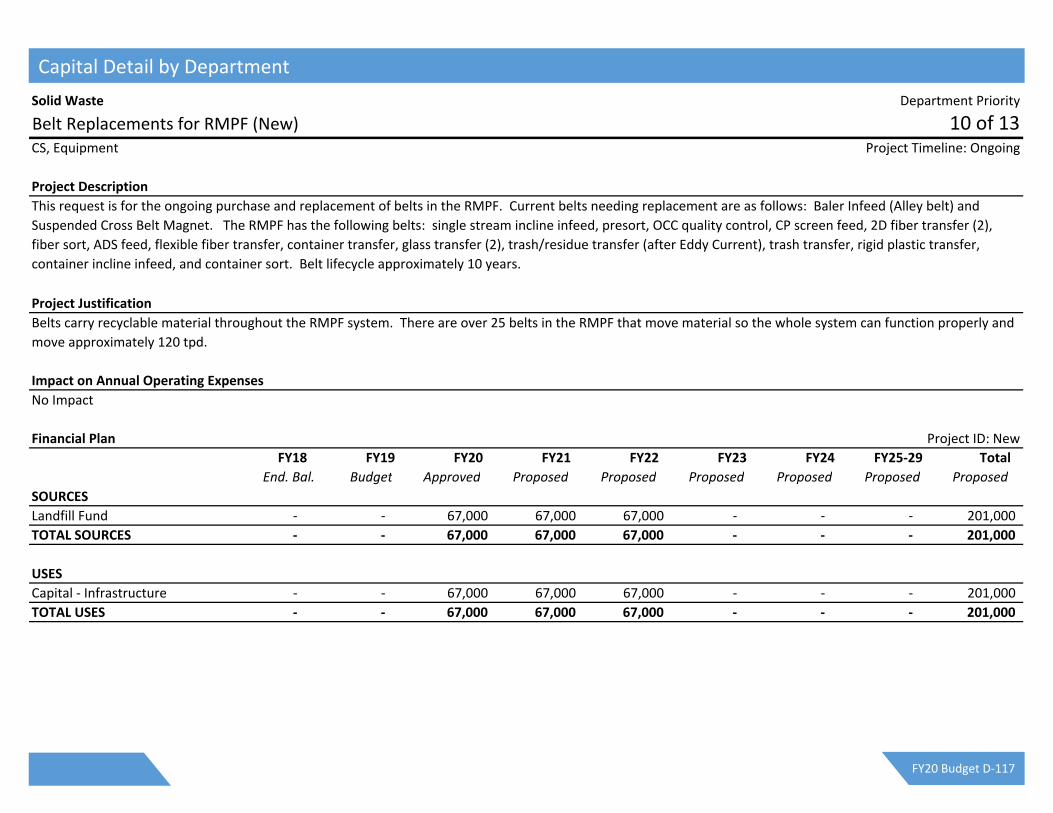
Solid Waste Department Priority
Belt Replacements for RMPF (New) 10 of 13CS, Equipment Project Timeline: Ongoing
Project Description
Project Justification
Impact on Annual Operating Expenses
Financial Plan Project ID: New
FY18 FY19 FY20 FY21 FY22 FY23 FY24 FY25‐29 Total
End. Bal. Budget Approved Proposed Proposed Proposed Proposed Proposed Proposed
SOURCES
Landfill Fund ‐ ‐ 67,000 67,000 67,000 ‐ ‐ ‐ 201,000
TOTAL SOURCES ‐ ‐ 67,000 67,000 67,000 ‐ ‐ ‐ 201,000
USES
Capital ‐ Infrastructure ‐ ‐ 67,000 67,000 67,000 ‐ ‐ ‐ 201,000
TOTAL USES ‐ ‐ 67,000 67,000 67,000 ‐ ‐ ‐ 201,000
This request is for the ongoing purchase and replacement of belts in the RMPF. Current belts needing replacement are as follows: Baler Infeed (Alley belt) and
Suspended Cross Belt Magnet. The RMPF has the following belts: single stream incline infeed, presort, OCC quality control, CP screen feed, 2D fiber transfer (2),
fiber sort, ADS feed, flexible fiber transfer, container transfer, glass transfer (2), trash/residue transfer (after Eddy Current), trash transfer, rigid plastic transfer,
container incline infeed, and container sort. Belt lifecycle approximately 10 years.
Belts carry recyclable material throughout the RMPF system. There are over 25 belts in the RMPF that move material so the whole system can function properly and
move approximately 120 tpd.
No Impact
Capital Detail by Department
FY20 Budget D-117

Solid Waste Department Priority
Control Panel/Cabinets Replacement for RMPF (New) 11 of 13CS, Equipment Project Timeline: Ongoing
Project Description
Project Justification
Impact on Annual Operating Expenses
Financial Plan Project ID: New
FY18 FY19 FY20 FY21 FY22 FY23 FY24 FY25‐29 Total
End. Bal. Budget Approved Proposed Proposed Proposed Proposed Proposed Proposed
SOURCES
Landfill Fund ‐ ‐ 65,000 ‐ ‐ ‐ 65,000
TOTAL SOURCES ‐ ‐ 65,000 ‐ ‐ ‐ ‐ ‐ 65,000
USES
Capital ‐ Infrastructure ‐ ‐ 65,000 ‐ ‐ ‐ 65,000
TOTAL USES ‐ ‐ 65,000 ‐ ‐ ‐ ‐ ‐ 65,000
This request is for the ongoing purchase and replacement of control panels and cabinets in the RMPF. Current panels/cabinets needing replacement are as follows:
touch screen for system control and container sort control cabinets. Panel lifecycle approximately 10 years.
Control panels ensure the system gets electrical needs and proper direction to function.
No Impact
Capital Detail by Department FY20 Budget D-118

Solid Waste Department Priority
Replacement Roll‐Off Container Truck 12 of 13CS, Equipment Project Timeline: Ongoing
Project Description
Project Justification
Impact on Annual Operating Expenses
Financial Plan Project ID: c0605
FY18 FY19 FY20 FY21 FY22 FY23 FY24 FY25‐29 Total
End Bal. Budget Approved Proposed Proposed Proposed Proposed Proposed Proposed
SOURCES
Landfill Fund ‐ 114,000 59,000 67,000 67,000 67,000 ‐ 200,000 460,000
TOTAL SOURCES ‐ 114,000 59,000 67,000 67,000 67,000 ‐ 200,000 460,000
USES
Capital ‐ Vehicles ‐ 114,000 59,000 67,000 67,000 67,000 ‐ 200,000 460,000
TOTAL USES ‐ 114,000 59,000 67,000 67,000 67,000 ‐ 200,000 460,000
Purchase replacement roll‐off container trucks which are used daily to service recycling drop‐off centers and open top trash roll‐offs throughout Athens‐Clarke
County. These trucks are used in a variety of applications both in the landfill and collection division environments.
The Solid Waste Department has a 2003, 2006 , 2011 and 2017 roll‐off container trucks. The use of the Georgia Municipal Association Loan program allows payments
to be spread out over a three year period. These trucks provide service to ten (10) drop‐off centers and service over 40 open top containers. The 2003 is designated
as a back‐up unit and is used daily at the landfill (six days a week). These trucks have an expected ten(10) year life cycle if biosolid hauling ceases. The use of the
Georgia Municipal Association loan program allows funding to be spread over a three year period. The 2003 is getting replaced this year, FY18. The 2006 will be
given to the landfill for to replace the 2003. The 2011 will be replaced during the FY21‐FY23 cycle. Tentative, 2017 will be replaced in FY27‐FY29 cycle.
Initial maintenance cost would be lower due to warranty coverage.
Capital Detail by Department
FY20 Budget D-119

Solid Waste Department Priority
Replace Pavement at Solid Waste Facilities (New) 13 of 13CS, Infrastructure Project Timeline: FY20 ‐ FY20
Project Description
Project Justification
Impact on Annual Operating Expenses
Financial Plan Project ID: New
FY18 FY19 FY20 FY21 FY22 FY23 FY24 FY25‐29 Total
End. Bal. Budget Approved Proposed Proposed Proposed Proposed Proposed Proposed
SOURCES
Landfill Fund ‐ ‐ 60,000 ‐ ‐ ‐ ‐ ‐ 60,000
TOTAL SOURCES ‐ ‐ 60,000 ‐ ‐ ‐ ‐ ‐ 60,000
USES
Capital ‐ Infrastructure ‐ ‐ 60,000 ‐ ‐ ‐ ‐ ‐ 60,000
TOTAL USES ‐ ‐ 60,000 ‐ ‐ ‐ ‐ ‐ 60,000
Replace paving in the parking lot and driveways around the Collections Maintenance Shop. Replace paving in the parking lot and driveway around the Recovered
Material Processing Facility (RMPF). Expected useful life is over 20 years.
The pavement at the RMPF is approaching 25 years old and is due for replacement and resurfacing for the safety of the private and public haulers. The Collections
Maintenance area is eight years old and has substantial amounts of truck traffic (over 20 solid waste trucks) and is failing according to paving experts.
No Impact
Capital Detail by Department FY20 Budget D-120

Solid Waste Department Priority
Replace Automated Refuse/Recycling Truck 1 of 4CS, Equipment Project Timeline: Ongoing
Project Description
Project Justification
Impact on Annual Operating Expenses
Financial Plan Project ID: c0679
FY18 FY19 FY20 FY21 FY22 FY23 FY24 FY25‐29 Total
End Bal. Budget Approved Proposed Proposed Proposed Proposed Proposed Proposed
SOURCES
Solid Waste Fund 540,000 540,000 200,000 310,000 310,000 ‐ ‐ ‐ 820,000
TOTAL SOURCES 540,000 540,000 200,000 310,000 310,000 ‐ ‐ ‐ 820,000
USES
Capital ‐ Vehicles 540,000 540,000 200,000 310,000 310,000 ‐ ‐ ‐ 820,000
TOTAL USES 540,000 540,000 200,000 310,000 310,000 ‐ ‐ ‐ 820,000
Replacement of automated residential refuse/recycling fleet. The current fleet consists of six 2015 Mack/Labrie ‐ automated sideloaders.
The original project reduced the Solid Waste Fleet by five vehicles and also reduced personnel by 9 employees by converting the fleet to automated vehicles.
Automated vehicles operate with a single person versus the current three person crews. The up front capital cost to replace the fleet is paid back is approximately
three years with the reduction in personnel and maintenance costs. Original costs were paid with a combination of current working capital and GMA loan pool.
There was a reduction in personnel cost of approximately $350,000 per year along with reduced maintenance cost.
Capital Detail by Department
FY20 Budget D-121

Solid Waste Department Priority
Replace Commercial Dumpster Collection Front‐end Loader 2 of 4CS, Equipment Project Timeline: Ongoing
Project Description
Project Justification
Impact on Annual Operating Expenses
Financial Plan Project ID: c0587
FY18 FY19 FY20 FY21 FY22 FY23 FY24 FY25‐29 Total
End Bal. Budget Approved Proposed Proposed Proposed Proposed Proposed Proposed
SOURCES
Solid Waste Fund (79,620) 165,000 180,000 90,000 90,000 90,000 90,000 90,000 630,000
TOTAL SOURCES (79,620) 165,000 180,000 90,000 90,000 90,000 90,000 85,000 625,000
USES
Capital ‐ Vehicles (79,620) 165,000 180,000 90,000 90,000 90,000 90,000 90,000 630,000
TOTAL USES (79,620) 165,000 180,000 90,000 90,000 90,000 90,000 90,000 630,000
Purchase replacement 40‐cubic yard front‐end load truck for commercial dumpster collection. These vehicles provide for commercial waste and recycling throughout
the community.
Systematic replacement of vehicles is necessary to keep the fleet in adequate operating condition and to provide efficient commercial dumpster collection (refuse
and recycling) to our customers. The expected useful life of front‐end load trucks is ten (10) years. Funds for the replacement of these vehicles is put in the Solid
Waste Enterprise fund annually. The use of the Georgia Municipal Association loan program allows funding to be spread over a three year period. Out year funding
will replace 2010 and 2012 vehicles. Funding in FY17‐FY19 is the new 2017 commercial dumpster FEL truck. In FY20 altered price due to rising costs to purchase a
FEL truck.
Initial maintenance cost would be lower due to warranty coverage.
Capital Detail by Department FY20 Budget D-122

Solid Waste Department Priority
Replace Mini‐Packer Trucks (New) 3 of 4CS, Equipment Project Timeline: Ongoing
Project Description
Project Justification
Impact on Annual Operating Expenses
Financial Plan Project ID: New
FY18 FY19 FY20 FY21 FY22 FY23 FY24 FY25‐29 Total
End Bal. Budget Approved Proposed Proposed Proposed Proposed Proposed Proposed
SOURCES
Solid Waste Fund ‐ ‐ 135,000 135,000 135,000 ‐ ‐ ‐ 405,000
TOTAL SOURCES ‐ ‐ 135,000 135,000 135,000 ‐ ‐ ‐ 405,000
USES
Capital ‐ Vehicles ‐ ‐ 135,000 135,000 135,000 ‐ ‐ ‐ 405,000
TOTAL USES ‐ ‐ 135,000 135,000 135,000 ‐ ‐ ‐ 405,000
Replace four(4) 2015 Hino/New Way (8 yard) mini‐packer trucks two used in residential operations (backyard and areas inaccessible by automated trucks) and two
used in commercial curbside operations (Central Business District, Five Points and Prince Avenue to Normaltown corridor).
The Solid Waste Department currently uses four (4) 2015 mini‐packer trucks for the residential and commercial curbside operations. These trucks should be replaced
every five ‐ seven years to capitalize on maintenance warranties, resale value and maintenance issues/costs exceed internal maintenance capabilities and budget.
The use of the Georgia Municipal Association loan program allows funding to be spread over a three year period.
Initial maintenance cost would be lower due to warranty coverage.
Capital Detail by Department
FY20 Budget D-123

Solid Waste Department Priority
Mini‐Packer Truck 4 of 4CS, Equipment Project Timeline: Ongoing
Project Description
Project Justification
Impact on Annual Operating Expenses
Financial Plan Project ID: c0750
FY18 FY19 FY20 FY21 FY22 FY23 FY24 FY25‐29 Total
End Bal. Budget Approved Proposed Proposed Proposed Proposed Proposed Proposed
SOURCES
Solid Waste Fund (293,446) 34,000 34,000 ‐ ‐ ‐ 34,000 68,000 136,000
TOTAL SOURCES (293,446) 34,000 34,000 ‐ ‐ ‐ 34,000 68,000 136,000
USES
Capital ‐ Vehicles (293,446) 34,000 34,000 ‐ ‐ ‐ 34,000 68,000 136,000
TOTAL USES (293,446) 34,000 34,000 ‐ ‐ ‐ 34,000 68,000 136,000
Purchase replacement Mini‐Packer Truck which is used daily to service Curbside, Commercial Trash/Recycling Customers throughout Athens‐Clarke County. This
truck will act as a back‐up to all mini‐packers in the current fleet. We currently have no back‐up truck for the mini‐packer fleet of four trucks.
The Solid Waste Department has over 100 small commercial businesses to service multiple times per week. Currently, staff has to share mini‐packer trucks to get the
routes done in the CBD, residential backyard and small business route which often hinders timely collection when sharing trucks. The use of the Georgia Municipal
Association Loan program allows payments to be spread out over a three year period. This truck purchase will occur in FY18. The tentative replacement of the back‐
up mini‐packer truck would be in FY24‐FY26.
Initial maintenance cost would be lower due to warranty coverage.
Capital Detail by Department FY20 Budget D-124

Transit Department Priority
Matching Funds for Transit Capital Improvement Grants 1 of 2CS, Transportation Project Timeline: Ongoing
Project Description
Project Justification
Impact on Annual Operating Expenses
Financial Plan Project ID: c0376
FY18 FY19 FY20 FY21 FY22 FY23 FY24 FY25‐29 Total
End Bal. Budget Approved Proposed Proposed Proposed Proposed Proposed Proposed
SOURCES
General Capital Fund 128,260 ‐ ‐ ‐ ‐ ‐ ‐ 400,000 400,000
TSPLOST 2017 Cap Proj Fund ‐ ‐ ‐ 776,000 1,261,000 776,000 776,000 3,888,000 7,477,000
TOTAL SOURCES 128,260 ‐ ‐ 776,000 1,261,000 776,000 776,000 4,288,000 7,877,000
USES
Capital ‐ Vehicles/Facilities 128,260 ‐ ‐ 776,000 1,261,000 776,000 776,000 4,288,000 7,877,000
TOTAL USES 128,260 ‐ ‐ 776,000 1,261,000 776,000 776,000 4,288,000 7,877,000
The Department is carrying forward $128,000 of funding from the sale of retired/surplus buses, therefore no GF Capital match is requested for FY20.
This project provides the local match funds for various Federal and State Transit Capital Grants. Typical funding is 80% Federal‐20% local match. Some projects may receive a 10% state
match, if State funding is appropriated. Federal Capital Grants have previously been submitted to and proposed by the M&C and been properly executed. The Projects receiving annual
grants and matching dollars are for replacements and expansions of transit vehicles (buses, demand response vans, and support vehicles) capital maintenance items and equipment,
transit facility improvements, bus shelters, benches and other various transit related capital equipment. This project corresponds to the 2018‐2021 Transportation Improvement Plan
(TIP) and the Madison Athens Clarke Oconee Regional Transportation Study (MACORTS) 2022‐23 Second Tier projects listing and 2040 Long Range Plan Transportation Plan.
The Federal Transit Administration and the Georgia Department of Transportation recommend replacement of transit buses when they are 12 or 14 years old and vans when they are
7 or 10 years old, depending on FTA useful life rating by specific vehicle type. The average cost for a hybrid electric bus is $725,000 per bus and $85,000 for vans. All grants require a
minimum 20% local match, which is reflected in the increased funding levels. It's anticipated that Federal funding will be available in FY20 for various vehicle replacements, capital
maintenance items and other capital equipment replacements. TSPLOST 2017 funding is available to cover the local match required for all vehicle replacements and Bus Stop Facilities
Improvements in FY19‐23 years. Note: Buses ordered in 2019 and 2020, will not be delivered until spring of calendar 2020 or 2021. (Funding sources identified in FY22‐23 and FY24‐28
are not approved)
The SPLOST 2011 Project # 7, Transit Vehicles and Bus Stop Improvements program will provide for the replacement of older transit vehicles or acquisition of new vehicles to expand
service and for capital improvements to system bus stops. Capital improvements are to include installation of signage, pad pavement, seating, covered shelters, landscaping, bicycle
racks, route information, and related bus stop improvements. This is a continuation of a SPLOST 2005, 2011 and TSPLOST 2017 program.
Capital Detail by Department
FY20 Budget D-125

Transit Department Priority
Update Transit Plans and Transit Studies 2 of 2AI, Transportation Project Timeline: FY19 ‐ FY23
Project Description
Project Justification
Impact on Annual Operating Expenses
Financial Plan Project ID: c0703
FY18 FY19 FY20 FY21 FY22 FY23 FY24 FY25‐29 Total
End Bal. Budget Approved Proposed Proposed Proposed Proposed Proposed Proposed
SOURCES
General Capital Fund ‐ ‐ ‐ ‐ ‐ ‐ ‐ 150,000 150,000
Grants ‐ ‐ ‐ 125,000 ‐ ‐ ‐ 500,000 625,000
TOTAL SOURCES ‐ ‐ ‐ 125,000 ‐ ‐ ‐ 650,000 775,000
USES
Capital ‐ Other ‐ ‐ ‐ 125,000 ‐ ‐ ‐ 650,000 775,000
TOTAL USES ‐ ‐ ‐ 125,000 ‐ ‐ ‐ 650,000 775,000
Annually revises 2018‐2021 Transit development plan, a five‐year action plan to improve planning, funding, and delivery of public transit services in Athens‐Clarke
County. Based on recommendations from the Mayor and Commission directed Transit Feasibility study that reviewed Athens Transit Systems current operations,
service delivery, a demand analysis, various surveys, and developed a plan for increasing services system wide.
This is a continuation of the Transit Feasibility study that was directed by Mayor and Commission and is a Federally mandated TDP. A study which is required once
every five years by Federal guidelines.
Staff will request additional funding through the Federal Grant process for FY19 and the out years for additional studies that may or will be required based on
recommendations of upcoming Transit services study. General Capital Funds will be needed for local match to grant requests.
Capital Detail by Department FY20 Budget D-126

Transportation & Public Works Department Priority
Signal Replacement 1 of 14CS, Transportation Project Timeline: Ongoing
Project Description
Project Justification
Impact on Annual Operating Expenses
Financial Plan Project ID: c0094
FY18 FY19 FY20 FY21 FY22 FY23 FY24 FY25‐29 Total
End Bal. Budget Approved Proposed Proposed Proposed Proposed Proposed Proposed
SOURCES
General Capital Fund 174,717 ‐ 100,000 250,000 250,000 175,000 250,000 5,287,500 6,312,500
SPLOST 2011 ‐ 100,000 ‐ ‐ ‐ ‐ ‐ ‐ ‐
TOTAL SOURCES 174,717 100,000 100,000 250,000 250,000 175,000 250,000 5,287,500 6,312,500
USES
Capital ‐ Infrastructure 174,717 100,000 100,000 250,000 250,000 175,000 250,000 5,287,500 6,312,500
TOTAL USES 174,717 100,000 100,000 250,000 250,000 175,000 250,000 5,287,500 6,312,500
Athens‐Clarke County is responsible for the routine maintenance and efficient operation of 172 traffic signals (90 are owned by ACC; 76 are owned by GDOT; and 6 are owned by UGA).
The life cycle for existing traffic signal equipment, to keep it operating efficiently and have it responsive to traffic flows, is approximately 13 years. Funds will be used to purchase and
install equipment necessary to rebuilding aging traffic signals including poles, controller equipment, signal heads, signal wire, and miscellaneous equipment. Should a new traffic signal
become warranted, this capital budget would fund installation.
The costs to maintain traffic signal equipment increase as the equipment ages beyond 13 years. The current average age of the 90 traffic signals owned by ACCGOV is about 21 years,
with 31 signals that are over 40 years old. At current funding levels, it is expected that this number would continue to grow. With increased age, required maintenance repairs also
increase which affects the Department's operating budget. Further, the increased likelihood of malfunctions threatens the safety and efficiency of the overall traffic signal system. The
proposed funding levels would achieve a sustainable 13‐year replacement cycle by FY22, considering costs of a new traffic signal to range between $100k and $175k in present dollars.
Specifically, Traffic Engineering would be able deliver 24 priority traffic signal rebuilds (which have an average age of 39 years) over the next five fiscal years based on these funding
levels.
No Impact
Capital Detail by Department
FY20 Budget D-127
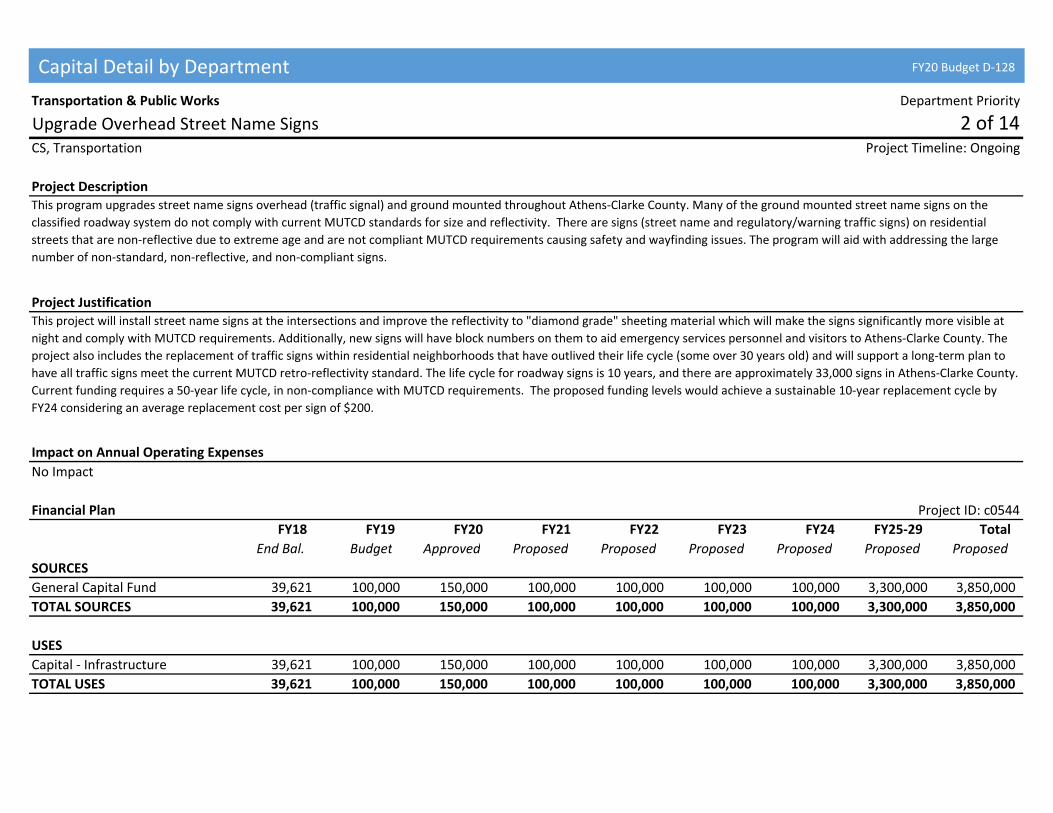
Transportation & Public Works Department Priority
Upgrade Overhead Street Name Signs 2 of 14CS, Transportation Project Timeline: Ongoing
Project Description
Project Justification
Impact on Annual Operating Expenses
Financial Plan Project ID: c0544
FY18 FY19 FY20 FY21 FY22 FY23 FY24 FY25‐29 Total
End Bal. Budget Approved Proposed Proposed Proposed Proposed Proposed Proposed
SOURCES
General Capital Fund 39,621 100,000 150,000 100,000 100,000 100,000 100,000 3,300,000 3,850,000
TOTAL SOURCES 39,621 100,000 150,000 100,000 100,000 100,000 100,000 3,300,000 3,850,000
USES
Capital ‐ Infrastructure 39,621 100,000 150,000 100,000 100,000 100,000 100,000 3,300,000 3,850,000
TOTAL USES 39,621 100,000 150,000 100,000 100,000 100,000 100,000 3,300,000 3,850,000
This program upgrades street name signs overhead (traffic signal) and ground mounted throughout Athens‐Clarke County. Many of the ground mounted street name signs on the
classified roadway system do not comply with current MUTCD standards for size and reflectivity. There are signs (street name and regulatory/warning traffic signs) on residential
streets that are non‐reflective due to extreme age and are not compliant MUTCD requirements causing safety and wayfinding issues. The program will aid with addressing the large
number of non‐standard, non‐reflective, and non‐compliant signs.
This project will install street name signs at the intersections and improve the reflectivity to "diamond grade" sheeting material which will make the signs significantly more visible at
night and comply with MUTCD requirements. Additionally, new signs will have block numbers on them to aid emergency services personnel and visitors to Athens‐Clarke County. The
project also includes the replacement of traffic signs within residential neighborhoods that have outlived their life cycle (some over 30 years old) and will support a long‐term plan to
have all traffic signs meet the current MUTCD retro‐reflectivity standard. The life cycle for roadway signs is 10 years, and there are approximately 33,000 signs in Athens‐Clarke County.
Current funding requires a 50‐year life cycle, in non‐compliance with MUTCD requirements. The proposed funding levels would achieve a sustainable 10‐year replacement cycle by
FY24 considering an average replacement cost per sign of $200.
No Impact
Capital Detail by Department FY20 Budget D-128

Transportation & Public Works Department Priority
Pavement Maintenance Program 3 of 14CS, Transportation Project Timeline: Ongoing
Project Description
Project Justification
Impact on Annual Operating Expenses
Financial Plan Project ID: c0183
FY18 FY19 FY20 FY21 FY22 FY23 FY24 FY25‐29 Total
End Bal. Budget Approved Proposed Proposed Proposed Proposed Proposed Proposed
SOURCES
General Capital Fund 711,797 ‐ ‐ 600,000 600,000 600,000 600,000 18,924,000 21,324,000
Grants ‐ ‐ ‐ ‐ ‐ ‐ ‐ 11,260,000 11,260,000
*TSPLOST 22,145,917 ‐ 2,750,000 4,688,500 4,500,000 5,150,000 ‐ ‐ 17,088,500
SPLOST 2011 Cap Proj Fund ‐ 600,000 600,000 ‐ ‐ ‐ ‐ 600,000
LMIG 1,352,000 1,352,000 1,352,000 1,352,000 1,352,000 6,760,000 13,520,000
Future SPLOST Est. Funding ‐ ‐ ‐ 1,300,000 1,300,000 1,300,000 1,300,000 6,500,000 11,700,000
TOTAL SOURCES 22,857,714 600,000 4,702,000 7,940,500 7,752,000 8,402,000 3,252,000 43,444,000 75,492,500
USES
Capital ‐ Infrastructure 22,802,714 600,000 4,630,600 7,867,700 7,677,700 8,326,200 3,174,600 43,169,000 74,845,800
Capital ‐ Other 55,000 ‐ 71,400 72,800 74,300 75,800 77,400 275,000 646,700
TOTAL USES 22,857,714 600,000 4,702,000 7,940,500 7,752,000 8,402,000 3,252,000 43,444,000 75,492,500
This Life Cycle program provides for the maintenance, repair, and reconstruction of pavements on Athens‐Clarke County roads. The majority of the maintenance work is performed by
a contractor under the direction of the Engineering Division within the Transportation & Public Works Department.
This program is critical to the effective operation of our transportation system and benefits all the citizens and motorists in Athens‐Clarke County. ACCGOV is responsible for
approximately 130 lane‐miles of arterial roads, 290 lane‐miles of collector roads, and 845 lane‐miles of local roads. According to the included analysis, pavement rehabilitation is a life
cycle item with an estimated annual capital cost of approximately $5.4 million, and this is expected to grow at a rate of 4% per year due to market forces. The Department's goal and
industry standard sets a resurfacing frequency of 10 years for arterials, 15 years for collectors, and 20 years for local roads. Frequencies longer than these recommendations result in
failing roadway structures and increased rehabilitation costs. This funding proposal equates to resurfacing 75 lane‐miles annually for a weighted frequency of about 17 years by FY23.
Current funding levels allow for an approximate 40 year resurfacing frequency. Given the ongoing underfunding of PMP, the funding deficit will continue to grow without the
proposed, significant funding increases.
The PMP Inspector position is fully funded through PMP General Capital funds, thereby reducing Annual Operating Expenses by ≈$70,000 each year (adjusted for inflation)
Capital Detail by Department
FY20 Budget D-129

Transportation & Public Works Department Priority
Bridge Improvement & Replacement Program 4 of 14CS, Transportation Project Timeline: Ongoing
Project Description
Project Justification
Impact on Annual Operating Expenses
Financial Plan Project ID: c0449
FY18 FY19 FY20 FY21 FY22 FY23 FY24 FY25‐29 Total
End Bal. Budget Approved Proposed Proposed Proposed Proposed Proposed Proposed
SOURCES
General Capital Fund 358,992 ‐ 50,000 50,000 50,000 50,000 50,000 500,000 750,000
SPLOST 2011 Cap Proj Fund ‐ 50,000 83,600 ‐ ‐ ‐ ‐ ‐ 83,600
*TSPLOST (Tallassee Rd) ‐ 285,000 300,000 5,104,274 ‐ ‐ 5,404,274
TOTAL SOURCES 358,992 335,000 433,600 5,154,274 50,000 50,000 50,000 500,000 6,237,874
USES
Capital ‐ Infrastructure 318,992 335,000 433,600 4,869,274 50,000 50,000 50,000 500,000 5,952,874
Capital ‐ Other 40,000 ‐ ‐ 285,000 ‐ ‐ ‐ ‐ 285,000
TOTAL USES 358,992 335,000 433,600 5,154,274 50,000 50,000 50,000 500,000 6,237,874
This program provides maintenance, rehabilitation, and construction on bridges along ACCGOV roads throughout Athens‐Clarke County. Locations of bridge work and
projects are identified by the Georgia Department of Transportation's Bi‐annual Bridge Inspection Report and by Athens‐Clarke County Transportation & Public
Works staff.
Most bridge structures in Athens‐Clarke County can achieve a service life of 50 years or greater with timely maintenance and upkeep. However, several bridges,
while structurally safe, do not meet current design standards for travel lanes, pedestrian/bike facilities, and other requirements. Funding for the program will be
prioritized for maintenance and rehabilitation work, and to meet current design standards. Additional funding has been included from the SPLOST 2011 and TSPLOST
programs.
No Impact
Capital Detail by Department FY20 Budget D-130

Transportation & Public Works Department Priority
Roadway Safety Devices Life Cycle Replacement 5 of 14CS, Transportation Project Timeline: Ongoing
Project Description
Project Justification
Impact on Annual Operating Expenses
Financial Plan Project ID: c0428
FY18 FY19 FY20 FY21 FY22 FY23 FY24 FY25‐29 Total
End Bal. Budget Approved Proposed Proposed Proposed Proposed Proposed Proposed
SOURCES
General Capital Fund 15,793 100,000 75,000 40,000 40,000 40,000 40,000 1,900,000 2,135,000
TOTAL SOURCES 15,793 100,000 75,000 40,000 40,000 40,000 40,000 1,900,000 2,135,000
USES
Capital ‐ Infrastructure 15,793 100,000 75,000 40,000 40,000 40,000 40,000 1,900,000 2,135,000
TOTAL USES 15,793 100,000 75,000 40,000 40,000 40,000 40,000 1,900,000 2,135,000
Transportation & Public Works installs three (3) primary roadway safety devices: pavement markings, raised pavement markers, and guardrails. Pavement markings
include the installation and replacement of thermoplastic markings and painted markings, long‐line striping and intersection lines throughout Athens‐Clarke County.
Raised pavement markers include the replacement and installation of pavement markers and fire hydrant location identifiers. Guardrail is part of a continuing
program that includes installation of new guardrails where applicable.
Providing for safe travel on Athens‐Clarke County roadways is the top priority of the Transportation & Public Works Department. These devices enhance safety,
reduce crash severity, and increase the visibility of lane markings during bad weather and at night. There are 430 lane miles roadway on which ACCGOV maintains
striping. The striping materials used have an average life span of 5 years. While resurfacing costs include pavement markings as applicable, reapplication of pavement
markings is required between pavement maintenance activities. The proposed funding levels would achieve a sustainable 5‐year replacement cycle by FY23
considering an average remarking cost of $8,800 per lane mile to install through contracted labor.
No Impact
Capital Detail by Department
FY20 Budget D-131

Transportation & Public Works Department Priority
Traffic Data Collection 6 of 14AI, Transportation Project Timeline: FY18 ‐ Ongoing
Project Description
Project Justification
Impact on Annual Operating Expenses
Financial Plan Project ID: c0759
FY18 FY19 FY20 FY21 FY22 FY23 FY24 FY25‐29 Total
End Bal. Budget Approved Proposed Proposed Proposed Proposed Proposed Proposed
SOURCES
General Capital Fund 16,488 ‐ 30,000 ‐ ‐ ‐ ‐ 200,000 230,000
TOTAL SOURCES 16,488 ‐ 30,000 ‐ ‐ ‐ ‐ 200,000 230,000
USES
Capital ‐ Other 16,488 ‐ 30,000 ‐ ‐ ‐ ‐ 200,000 230,000
TOTAL USES 16,488 ‐ 30,000 ‐ ‐ ‐ ‐ 200,000 230,000
Consultant contracted collection of intersection peak hour(s) turning movement count data to be used for traffic signal timing and signal system timing plan
development and traffic engineering studies. In Athens‐Clarke County there are 172 traffic signalized intersections, 72 of which are on major corridors and are
coordinated. As traffic patterns change over time, signal timing and system plans require updates and adjustments.
The major corridors are past due for timing plan updates, which creates excessive delays during peak hours. In order to create updated timing/system plans, peak
hour(s) intersection turning movement data is needed. Collecting intersection turning movement data requires a person or persons to physically sit at the
intersection and count all vehicles, pedestrians, and bicycles for each approach and movement. The Traffic Engineering Division has two staff members dedicated to
traffic studies, and the data collection need exceeds staff resources. Contracting field data collection allows enough time for staff to focus on entering the data into
signal software, creating timing plans, and entering the updated timing plans.
No Impact
Capital Detail by Department FY20 Budget D-132

Transportation & Public Works Department Priority
Local Road Improvement Projects 7 of 14AI, Transportation Project Timeline: Ongoing
Project Description
Project Justification
Impact on Annual Operating Expenses
Financial Plan Project ID: c0281
FY18 FY19 FY20 FY21 FY22 FY23 FY24 FY25‐29 Total
End Bal. Budget Approved Proposed Proposed Proposed Proposed Proposed Proposed
SOURCES
General Capital Fund 405,102 ‐ ‐ ‐ ‐ ‐ ‐ 625,000 625,000
SPLOST 2011 Cap Proj Fund ‐ 2,993,390 ‐ ‐ ‐ ‐ ‐ 2,993,390
*TSPLOST ‐ 8,759,943 ‐ ‐ ‐ ‐ ‐ ‐
TOTAL SOURCES 405,102 8,759,943 2,993,390 ‐ ‐ ‐ ‐ 625,000 3,618,390
USES
Capital ‐ Infrastructure 345,102 8,699,943 2,932,390 ‐ ‐ ‐ ‐ ‐ 2,932,390
Capital ‐ Other 60,000 60,000 61,000 ‐ ‐ ‐ ‐ 625,000 686,000
TOTAL USES 405,102 8,759,943 2,993,390 ‐ ‐ ‐ ‐ 625,000 3,618,390
The Local Road Improvement Program includes safety and operational transportation improvements to key intersections, interchanges, and roadway segments
within Athens‐Clarke County's roadway network. As traffic and safety patterns change over time, it is important to continually address and improve roadway
conditions. These changes may include, but are not limited to innovative intersections, additional lanes, signalization, improved alignment, increased sight distances,
and pedestrian / bicycle improvements.
The safe and efficient operation of traffic through intersections and corridors is a key component in allowing roadways to function at high levels of service. By
upgrading selected roadways and intersections throughout ACC, the roadway system will be improved and used more effectively and safely. TSPLOST funding was
allocated to two projects: Downtown Infrastructure (Clayton Street) and South Milledge at Whitehall Road. Once 2011 SPLOST and TSPLOST funding end in FY20,
additional capital will be required from General Capital or other sources to continue improvements to the transportation network.
The ROW Agent position is 60% funded through Local General Capital funds and the Eng. Design Tech I is 80% funded through this fund, thereby reducing Annual
Operating Expenses by ≈$90,000 each year (adjusted for inflation)
Capital Detail by Department
FY20 Budget D-133
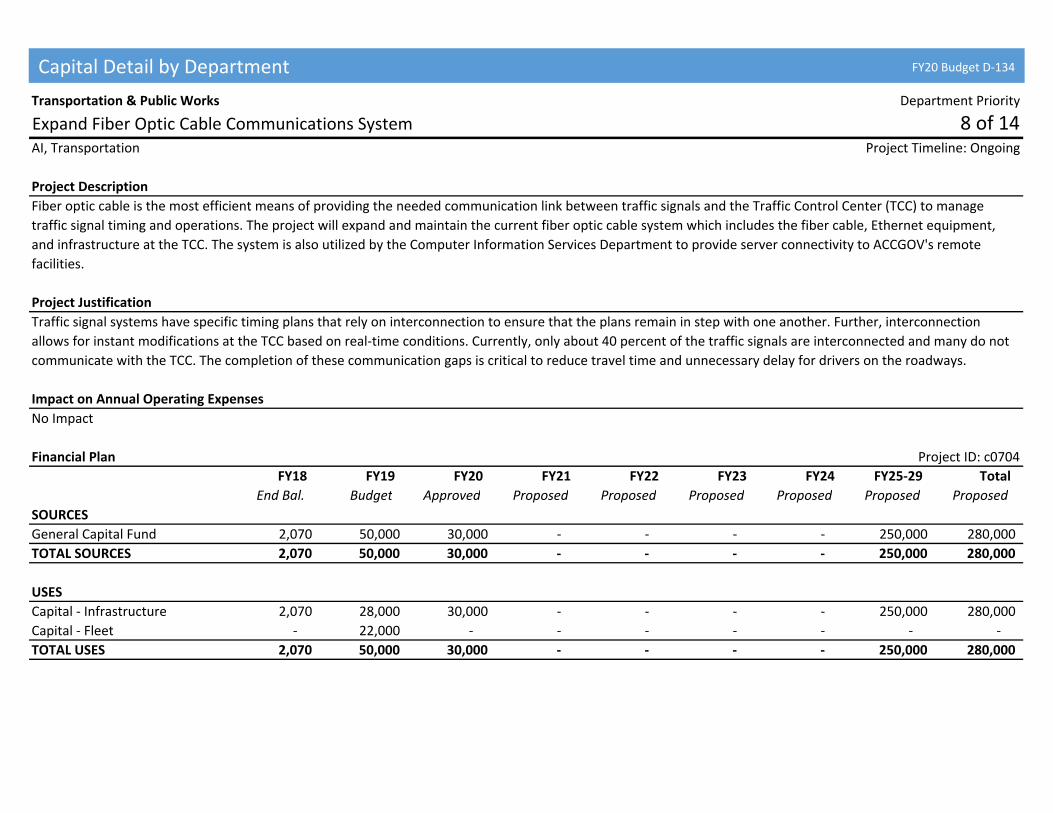
Transportation & Public Works Department Priority
Expand Fiber Optic Cable Communications System 8 of 14AI, Transportation Project Timeline: Ongoing
Project Description
Project Justification
Impact on Annual Operating Expenses
Financial Plan Project ID: c0704
FY18 FY19 FY20 FY21 FY22 FY23 FY24 FY25‐29 Total
End Bal. Budget Approved Proposed Proposed Proposed Proposed Proposed Proposed
SOURCES
General Capital Fund 2,070 50,000 30,000 ‐ ‐ ‐ ‐ 250,000 280,000
TOTAL SOURCES 2,070 50,000 30,000 ‐ ‐ ‐ ‐ 250,000 280,000
USES
Capital ‐ Infrastructure 2,070 28,000 30,000 ‐ ‐ ‐ ‐ 250,000 280,000
Capital ‐ Fleet ‐ 22,000 ‐ ‐ ‐ ‐ ‐ ‐ ‐
TOTAL USES 2,070 50,000 30,000 ‐ ‐ ‐ ‐ 250,000 280,000
Fiber optic cable is the most efficient means of providing the needed communication link between traffic signals and the Traffic Control Center (TCC) to manage
traffic signal timing and operations. The project will expand and maintain the current fiber optic cable system which includes the fiber cable, Ethernet equipment,
and infrastructure at the TCC. The system is also utilized by the Computer Information Services Department to provide server connectivity to ACCGOV's remote
facilities.
Traffic signal systems have specific timing plans that rely on interconnection to ensure that the plans remain in step with one another. Further, interconnection
allows for instant modifications at the TCC based on real‐time conditions. Currently, only about 40 percent of the traffic signals are interconnected and many do not
communicate with the TCC. The completion of these communication gaps is critical to reduce travel time and unnecessary delay for drivers on the roadways.
No Impact
Capital Detail by Department FY20 Budget D-134

Transportation & Public Works Department Priority
Stormwater Improvement Prog / Areawide 9 of 14CS, Equipment Project Timeline: Ongoing
Project Description
Project Justification
Impact on Annual Operating Expenses
Financial Plan Project ID: c0033
FY18 FY19 FY20 FY21 FY22 FY23 FY24 FY25‐29 Total
End Bal. Budget Approved Proposed Proposed Proposed Proposed Proposed Proposed
SOURCES
Storm Water Utility Fund 3,456,233 1,100,000 900,000 200,000 200,000 200,000 200,000 1,000,000 2,700,000
SPLOST 2011 Cap Proj Fund 920,463 ‐ 91,000 ‐ ‐ ‐ ‐ ‐ 91,000
TOTAL SOURCES 4,376,695 1,100,000 991,000 200,000 200,000 200,000 200,000 1,000,000 2,791,000
USES
Capital ‐ Infrastructure 4,286,695 1,010,000 901,000 190,000 190,000 190,000 190,000 950,000 2,611,000
Capital ‐ Land 10,000 10,000 10,000 10,000 10,000 10,000 10,000 50,000 100,000
Capital ‐ Other 80,000 80,000 80,000 ‐ ‐ ‐ ‐ ‐ 80,000
TOTAL USES 4,376,695 1,100,000 991,000 200,000 200,000 200,000 200,000 1,000,000 2,791,000
This is a continuing program of constructing improvements for publicly‐owned stormwater management facilities located throughout Athens‐Clarke County. Exact
project locations are determined through the Areawide Stormwater Master Plan, the requirements of the NPDES Phase II permit, the Live Stream Pipe Replacement
Program, and the Watershed Master Plan. Please note, the program reflects only the capital improvements associated with stormwater improvements since the
operating and general maintenance costs are included in the Stormwater Enterprise Fund annual budget.
The purpose of this program is to continue the implementation of water quality and quantity projects identified in the Areawide Stormwater Master Plan, Watershed
Master Plan, and Live Stream Pipe Replacement Program. The program includes the repair and upgrade of existing facilities and construction of new stormwater
management facilities. Priority for design and construction is based on a rating systems approved by Mayor and Commission.
No Impact
Capital Detail by Department
FY20 Budget D-135

Transportation & Public Works Department Priority
Pedestrian Safety and Traffic Calming Improvements 10 of 14AI, Transportation Project Timeline: Ongoing
Project Description
Project Justification
Impact on Annual Operating Expenses
Financial Plan Project ID: c0392
FY18 FY19 FY20 FY21 FY22 FY23 FY24 FY25‐29 Total
End Bal. Budget Approved Proposed Proposed Proposed Proposed Proposed Proposed
SOURCES
General Capital Fund 30,939 ‐ 125,000 ‐ ‐ ‐ ‐ 175,000 300,000
TOTAL SOURCES 30,939 ‐ 125,000 ‐ ‐ ‐ ‐ 175,000 300,000
USES
Capital ‐ Infrastructure 30,939 ‐ 125,000 ‐ ‐ ‐ ‐ 175,000 300,000
TOTAL USES 30,939 ‐ 125,000 ‐ ‐ ‐ ‐ 175,000 300,000
This project will fund transportation projects to improve pedestrian safety and traffic calming improvements throughout Athens‐Clarke County. This program is
aimed at constructing crosswalk improvements at new and existing locations to provide safer pedestrian crossings at unsignalized locations. Required signage,
thermoplastic markings, countdown pedestrian signals, and Rapid Flashing Beacon systems at these locations may be installed based on an engineering study and the
documented need of increased safety measures. All improvements shall be consistent with the installation guidelines for marked crosswalks as adopted by the
Mayor and Commission. Additionally, this project provides funding to identify and support small‐scale Roadway Safety Audit projects.
Additional signage, markings, and Rapid Flashing Beacon systems, when installed in a systematic and warranted manner, have all been proven to be an effective
measure at increasing motorist awareness of crossing pedestrians and bicyclists. Therefore, prior to the installation of any additional warning devices, an engineering
study is needed to determine if additional warnings are necessary and what is the most appropriate measure or device to be installed.
No Impact
Capital Detail by Department FY20 Budget D-136

Transportation & Public Works Department Priority
School Area Infrastructure 11 of 14CS, Transportation Project Timeline: Ongoing
Project Description
Project Justification
Impact on Annual Operating Expenses
Financial Plan Project ID: c0545
FY18 FY19 FY20 FY21 FY22 FY23 FY24 FY25‐29 Total
End Bal. Budget Approved Proposed Proposed Proposed Proposed Proposed Proposed
SOURCES
General Capital Fund 66,248 ‐ ‐ ‐ ‐ ‐ ‐ 150,000 150,000
SPLOST 2011 Cap Proj Fund ‐ ‐ ‐ ‐ ‐ ‐ ‐ ‐ ‐
TOTAL SOURCES 66,248 ‐ ‐ ‐ ‐ ‐ ‐ 150,000 150,000
USES
Capital ‐ Infrastructure 66,248 ‐ ‐ ‐ ‐ ‐ ‐ 150,000 150,000
TOTAL USES 66,248 ‐ ‐ ‐ ‐ ‐ ‐ 150,000 150,000
This project includes small roadway, drainage, and pedestrian improvement projects in close proximity to Clarke County school sites where infrastructure projects
have been identified. Improvements are often relative to a need that either currently exists or is created by school expansion. Funds from previous years, for
example, have been used to convert electric school flashers to solar power at various elementary schools sites throughout Athens‐Clarke County.
In the past, these types of improvement projects immediately adjacent to schools have been handled within the current operating budget of Transportation & Public
Works, typically at the expense of other infrastructure needs. This capital project has allowed Transportation & Public Works to continue to address these
infrastructure needs from a dedicated source of funds. Eligible projects include small intersection improvements, crosswalk modifications, and stormwater
conveyance system upgrades.
No Impact
Capital Detail by Department
FY20 Budget D-137

Transportation & Public Works Department Priority
Sidewalk and Other Improvements 12 of 14AI, Transportation Project Timeline: Ongoing
Project Description
Project Justification
Impact on Annual Operating Expenses
Financial Plan Project ID: c0071
FY18 FY19 FY20 FY21 FY22 FY23 FY24 FY25‐29 Total
End Bal. Budget Approved Proposed Proposed Proposed Proposed Proposed Proposed
SOURCES
General Capital Fund 48,743 ‐ ‐ ‐ ‐ ‐ ‐ 750,000 750,000
SPLOST 2011 Cap Proj Fund ‐ ‐ 782,000 ‐ ‐ ‐ ‐ ‐ 782,000
*TSPLOST ‐ ‐ 3,000,000 2,500,000 2,000,000 2,443,669 ‐ ‐ 9,943,669
TOTAL SOURCES 48,743 ‐ 3,782,000 2,500,000 2,000,000 2,443,669 ‐ 750,000 11,475,669
USES
Capital ‐ Infrastructure 48,743 ‐ 2,782,000 1,100,000 1,250,000 1,843,669 ‐ 525,000 7,500,669
Capital ‐ Land ‐ ‐ 600,000 850,000 450,000 350,000 ‐ 50,000 2,300,000
Capital ‐ Other ‐ ‐ 400,000 550,000 300,000 250,000 ‐ 175,000 1,675,000
TOTAL USES 48,743 ‐ 3,782,000 2,500,000 2,000,000 2,443,669 ‐ 750,000 11,475,669
The purpose of this project is to construct a comprehensive pedestrian system which provides enhanced pedestrian safety and accessibility. Annual project locations
have typically focused on Athens‐Clarke County owned arterial and collector roadways along bus routes in commercial and multi‐family zoned areas that meet
pedestrian needs for schools, shopping areas, recreation facilities, and access to public transportation. Future projects will address sidewalk connectivity needs
throughout Athens‐Clarke County consistent with the recommendation of the comprehensive Bicycle and Pedestrian Master Plan.
The FY18‐FY20 budget years incorporate funding from the SPLOST 2011 referendum project Pedestrian Safety and Safe Routes to School Program, and funding from
the TSPLOST referendum is available through FY23. The purpose of pedestrian improvements is to provide a safe and accessible pedestrian network throughout
Athens‐Clarke County. Improvements are to be guided through the recently approved Bicycle and Pedestrian Master Plan.
No Impact
Capital Detail by Department FY20 Budget D-138

Transportation & Public Works Department Priority
Bicycle Transportation Improvements 13 of 14AI, Transportation Project Timeline: FY01 ‐ Ongoing
Project Description
Project Justification
Impact on Annual Operating Expenses
Financial Plan Project ID: c0211
FY18 FY19 FY20 FY21 FY22 FY23 FY24 FY25‐29 Total
End Bal. Budget Approved Proposed Proposed Proposed Proposed Proposed Proposed
SOURCES
General Capital Fund ‐ ‐ ‐ ‐ ‐ ‐ ‐ 1,000,000 1,000,000
SPLOST 2011 Cap Proj Fund 1,246,418 ‐ 870,000 ‐ ‐ ‐ ‐ ‐ 870,000
*TSPLOST 5,790,294 ‐ 1,177,580 1,500,000 1,500,000 411,694 ‐ ‐ 4,589,274
TOTAL SOURCES 7,036,712 ‐ 2,047,580 1,500,000 1,500,000 411,694 ‐ 1,000,000 6,459,274
USES
Capital ‐ Infrastructure 7,011,712 ‐ 1,372,580 775,000 900,000 331,694 ‐ 680,000 4,059,274
Capital ‐ Land ‐ ‐ 425,000 450,000 375,000 50,000 ‐ 200,000 1,500,000
Capital ‐ Other 25,000 ‐ 250,000 275,000 225,000 30,000 ‐ 120,000 900,000
TOTAL USES 7,036,712 ‐ 2,047,580 1,500,000 1,500,000 411,694 ‐ 1,000,000 6,459,274
This is a continuing program to implement recommendations of the recently completed Bicycle and Pedestrian Master Plan, Athens in Motion. As defined in the
Master Plan projects to one or more of the following: construction of bicycle facilities, event‐based activities, education opportunities, information architecture,
respect and attention campaigns, and safety campaigns.
In addition to improving the connectivity of the bicycle network of Athens‐Clarke County through infrastructure, the purpose of this project is to improve the culture
of cycling through the following initiates, as identified in the Athens in Motion Plan: Education, Safety, and Encouragement. Education refers to teaching drivers and
cyclists how to properly interact; safety refers to planning and creating safe infrastructure, and encouragement refers to promoting cycling as a viable transportation
alternative.
No Impact
Capital Detail by Department
FY20 Budget D-139

Transportation & Public Works Department Priority
Corridor Management Program 14 of 14AI, Transportation Project Timeline: Ongoing
Project Description
Project Justification
Impact on Annual Operating Expenses
Financial Plan Project ID: c0201
FY18 FY19 FY20 FY21 FY22 FY23 FY24 FY25‐29 Total
End Bal. Budget Approved Proposed Proposed Proposed Proposed Proposed Proposed
SOURCES
General Capital Fund 464,000 ‐ ‐ ‐ ‐ ‐ ‐ 150,000 150,000
*TSPLOST ‐ ‐ 400,000 830,000 6,745,000 3,465,000 ‐ ‐ 11,440,000
TOTAL SOURCES 464,000 ‐ 400,000 830,000 6,745,000 3,465,000 ‐ 150,000 11,590,000
USES
Capital ‐ Infrastructure 454,000 ‐ 390,000 820,000 6,735,000 3,455,000 ‐ 100,000 11,500,000
Capital ‐ Other 10,000 ‐ 10,000 10,000 10,000 10,000 ‐ 50,000 90,000
TOTAL USES 464,000 ‐ 400,000 830,000 6,745,000 3,465,000 ‐ 150,000 11,590,000
This project includes the development and delivery of improvements to major corridors of the community to improve both function and appearance. Strategies and
improvements include corridor studies to identify needs and improve business development, infrastructure improvements to resolve transportation and traffic
problems, and projects to improve physical appearance of the corridors. It is expected that this project will result in improved appearance, safety, and operation to
key corridors in Athens‐Clarke County.
This project will promote economic development, enhance the quality of life, and preserve and enhance community assets. This program provides an opportunity to
continually improve the right of way on key corridors throughout Athens‐Clarke County. Lack of improvement to these corridors is detrimental to area business
sustainability and traffic operations.
No Impact
Capital Detail by Department FY20 Budget D-140

This section provides summary budget information by Fund for revenues and expenditures. A Fund is an individual accounting entity which segregates expenditures, revenues, and other transactions for a specific group of activities. In addition, this section includes a listing of Interfund Transfers (E‐36). The General Fund budget supports the major portion of basic governmental services such as police, fire, judicial, planning, public works, leisure services, etc. These services are primarily supported from tax revenues such as the property tax and the sales tax. Special Revenue Funds are established to account for specific revenue sources that are usually legally restricted. These include: ‐ Hotel/Motel Tax ‐ Affordable Housing Fund ‐ Community Development Block Grant (CDBG) ‐ Supportive Housing Fund ‐ Emergency Telephone (E‐911) ‐ Special Programs and Initiatives Fund ‐ Revolving Loan Fund ‐ Building Inspection ‐ HOME Grant Program ‐ Sheriff Inmate Fund ‐ Grants (All other grant programs) ‐ Corrections Inmate Fund ‐ Alternative Dispute Resolution (ADR) Capital Projects Funds are used to account for financial resources for the acquisition and construction of major Capital Facilities. This includes:
‐Public Facilities Authority Fund which accounts for the revenues and expenditures for maintenance and debt service for the Department of Family and Children Services Building.
‐Economic Development Fund which accounts for revenues and expenditures for infrastructure improvements needed to recruit new or expansions of existing industries
‐General Capital Projects Fund for capital projects which are not accounted for in the General Fund Enterprise Funds are used to account for operations which are similar to a private business enterprise or the governing body has identified a need to account for an operation in this manner. These include: ‐ Airport ‐ Water & Sewer ‐ Landfill ‐ Solid Waste Collection ‐ Transit ‐ Stormwater Utility Internal Service Funds are used to account for the operations of departments which provide goods and services to other government departments or agencies on a cost reimbursement basis. These include: ‐ Internal Support ‐ Self‐Funded Insurance & Claims ‐ Fleet Management ‐ Self‐Funded Health Insurance ‐ Fleet Replacement
Budgets by Fund
FY20 Budget E-1

Revenues & Expenditures by Fund Type
Total Total Total
Special Capital Total Internal Total
General Revenue Projects Enterprise Service All
Fund Funds Funds Funds Funds Funds
Revenues:
Property Taxes 65,206,378 0 0 0 0 65,206,378
Sales Tax 24,233,425 0 0 0 0 24,233,425
Other Taxes 22,779,134 3,750,000 0 0 0 26,529,134
Licenses & Permits 1,590,300 1,100,000 0 0 0 2,690,300
Intergovernmental 1,183,303 3,383,974 10,228 2,632,726 0 7,210,231
Charges for Services 12,954,290 2,456,613 0 72,006,543 24,623,959 112,041,405
Fines & Forfeitures 3,246,382 863,600 0 0 0 4,109,982
Other Revenues 1,118,206 218,560 0 305,966 0 1,642,732
Other Financing Sources/Transfers In 3,881,612 1,413,298 2,763,995 2,051,185 0 10,110,090
Total Revenues $136,193,030 $13,186,045 $2,774,223 $76,996,420 $24,623,959 $253,773,677
Use of Fund Balance 4,000,000 435,582 164,500 4,600,082
Use of Unrestricted Net Position 20,441,890 2,193,151 22,635,041
Total Revenues & Other Sources $140,193,030 $13,621,627 $2,938,723 $97,438,310 $26,817,110 $281,008,800
Less Interfund Transfers and Charges (32,005,982)
Total Net Revenues $140,193,030 $13,621,627 $2,938,723 $97,438,310 $26,817,110 $249,002,818
Expenditures:
Mayor & Commission 625,558 0 0 0 0 625,558
Manager's Office 2,273,472 0 252,500 0 0 2,525,972
Attorney 691,955 0 0 0 0 691,955
Operational Analysis 289,870 0 0 0 0 289,870
Finance 2,287,026 0 0 0 0 2,287,026
Human Resources 1,510,436 25,000 0 0 1,150,335 2,685,771
Tax Commissioner 1,540,102 0 0 0 0 1,540,102
Tax Assessor 1,129,298 0 0 0 0 1,129,298
Board of Elections 748,635 0 0 0 0 748,635
Information Technology 3,441,293 104,741 400,000 60,647 0 4,006,681
Other General Admin 16,650,455 930,015 200,000 16,674,110 17,701,279 52,155,859
General Government $31,188,100 $1,059,756 $852,500 $16,734,757 $18,851,614 $68,686,727
Superior Court 3,238,406 324,306 0 0 0 3,562,712
Clerk of Courts 1,471,687 0 0 0 0 1,471,687
State Court 805,751 263,288 0 0 0 1,069,039
Solicitor 1,272,128 79,826 0 0 0 1,351,954
District Attorney 1,382,120 783,029 26,000 0 0 2,191,149
Sheriff 17,819,259 35,000 42,000 0 0 17,896,259
Juvenile Court 618,815 0 0 0 0 618,815
Magistrate's Court 874,903 0 0 0 0 874,903
Coroner 58,736 0 0 0 0 58,736
Probate Court 508,263 0 0 0 0 508,263
Municipal Court 700,457 0 0 0 0 700,457
Judicial $28,750,525 $1,485,449 $68,000 $0 $0 $30,303,974
Police 21,929,255 3,441,059 466,000 0 0 25,836,314
Fire 14,246,379 0 32,000 0 0 14,278,379
Corrections 3,949,066 50,000 20,000 0 0 4,019,066
Public Safety $40,124,700 $3,491,059 $518,000 $0 $0 $44,133,759
All Funds Summary
FY20 Budget E-2

Total Total Total
Special Capital Total Internal Total
General Revenue Projects Enterprise Service All
Fund Funds Funds Funds Funds Funds
Airport 0 0 0 2,560,378 0 2,560,378
Transit 0 92,835 0 6,132,407 0 6,225,242
Transportation & Public Works 4,505,587 0 560,000 4,271,680 0 9,337,267
Public Utilities 0 0 0 47,832,412 0 47,832,412
Solid Waste 969,083 0 0 6,765,692 0 7,734,775
Central Services 10,569,087 40,000 251,000 0 7,072,086 17,932,173
Public Works $16,043,757 $132,835 $811,000 $67,562,569 $7,072,086 $91,622,247
Leisure Services 8,060,667 35,000 160,000 0 0 8,255,667
Culture & Recreation $8,060,667 $35,000 $160,000 $0 $0 $8,255,667
Housing & Comm. Dev. 531,171 2,040,677 0 0 0 2,571,848
Economic Development 454,126 265,000 0 0 0 719,126
Planning 1,186,094 566,043 0 0 0 1,752,137
Building Inspection 873,112 998,497 0 27,448 0 1,899,057
Cooperative Extension 255,002 0 0 0 0 255,002
Housing & Development $3,299,505 $3,870,217 $0 $27,448 $0 $7,197,170
Independent Agencies 5,574,443 3,240,125 0 0 0 8,814,568
Debt Service 1,057,855 0 529,223 9,673,969 269,445 11,530,492
Total Expenditures $134,099,552 $13,314,441 $2,938,723 $93,998,743 $26,193,145 $270,544,604
Other Financing Uses/Transfers Out 6,093,478 225,000 0 3,439,567 218,787 9,976,832
Total Expenditures & Other Financing Uses $140,193,030 $13,539,441 $2,938,723 $97,438,310 $26,411,932 $280,521,436
Less Interfund Transfers and Charges (32,005,982)
Total Net Expenditures $140,193,030 $13,539,441 $2,938,723 $97,438,310 $26,411,932 $248,515,454
Designated for Future Capital
Improvements & Debt Service 0 82,186 0 0 405,178 487,364
Total Expenditures & Designations $140,193,030 $13,621,627 $2,938,723 $97,438,310 $26,817,110 $249,002,818
All Funds Summary
FY20 Budget E-3

All Funds Summary
FY20 Budget E-4

Revenues & Expenditures by Type
FY18 FY19 FY20 FY20
Actual Budget Requested Approved $▲ %▲Revenues
Property Taxes 56,921,443 59,926,533 65,206,378 65,206,378 5,279,845 8.8%
Sales Tax 23,523,030 23,700,000 24,233,425 24,233,425 533,425 2.3%
Other Taxes 21,562,496 22,328,889 22,779,134 22,779,134 450,245 2.0%
Licenses & Permits 1,587,800 1,759,454 1,590,300 1,590,300 (169,154) ‐9.6%
Intergovernmental Revenues 1,571,781 1,189,663 1,183,303 1,183,303 (6,360) ‐0.5%
Charges for Services 12,446,653 13,071,260 12,954,290 12,954,290 (116,970) ‐0.9%
Fines & Forfeitures 2,956,611 3,389,770 3,246,382 3,246,382 (143,388) ‐4.2%
Other Revenues 1,215,382 1,086,123 1,118,206 1,118,206 32,083 3.0%
Other Financing Sources/Transfers In 3,032,678 3,520,086 3,856,614 3,881,612 361,526 10.3%
Total Revenues $124,817,874 $129,971,778 $136,168,032 $136,193,030 $6,221,252 4.8%
Prior Year Fund Balance ‐ Operating 0 871,444 0 4,000,000 3,128,556 359.0%
Prior Year Fund Balance ‐ Capital 756,040 3,451,600 0 0 (3,451,600) ‐100.0%
Total Revenues & Other Sources $125,573,914 $134,294,822 $136,168,032 $140,193,030 $5,898,208 4.4%
Expenditures
Personal Services 85,248,130 93,647,402 98,058,995 95,364,480 1,717,078 1.8%
Operating Expenditures 24,697,958 26,388,722 28,364,823 30,789,274 4,400,552 16.7%
Debt Service 1,045,085 1,052,561 1,057,855 1,057,855 5,294 0.5%
Operating Contingency 0 800,000 1,200,000 1,313,500 513,500 64.2%
Independent Agencies 5,239,748 5,497,269 5,631,962 5,574,443 77,174 1.4%
Transfers to Other Funds 3,747,393 3,457,268 3,606,959 3,848,478 391,210 11.3%
Transfers for Capital 5,595,600 3,451,600 10,152,600 2,245,000 (1,206,600) ‐35.0%
Total Expenditures $125,573,914 $134,294,822 $148,073,194 $140,193,030 $5,898,208 4.4%
General Fund Revenues
Property Taxes: 47.9%
Sales Tax: 17.8%
Other Taxes: 16.7%
Charges for Services: 9.5%
Transfers In: 2.9%
Fines & Forfeitures: 2.4%
Licenses & Permits: 1.2%
Intergovernmental Revenues: 0.9%
Other Revenues: 0.8%
General Fund Expenditures
Personal Services: 68.0%
Operating Expenditures: 22.0%
Independent Agencies: 4.0%
Transfers for Capital: 1.6%
Transfers to Other Funds: 2.7%
Debt Service: 0.8%
Operating Contingency: 0.9%
General Fund
FY20 Budget E-5
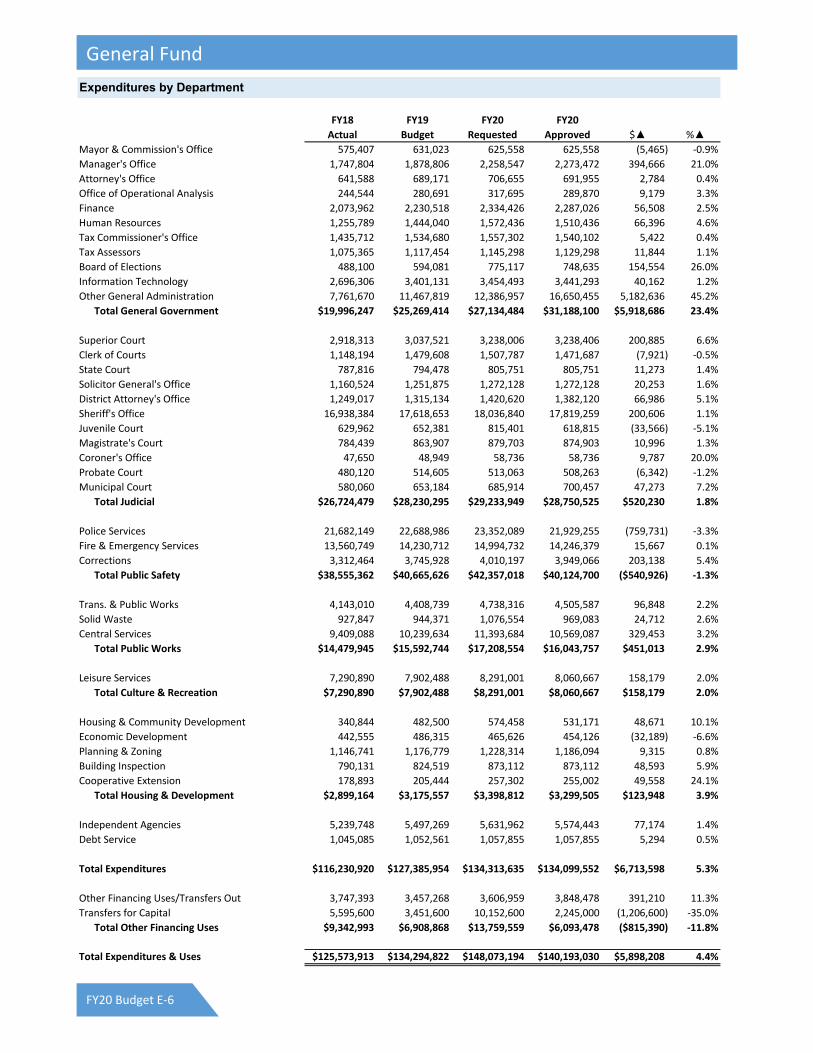
Expenditures by Department
FY18 FY19 FY20 FY20
Actual Budget Requested Approved $▲ %▲Mayor & Commission's Office 575,407 631,023 625,558 625,558 (5,465) ‐0.9%
Manager's Office 1,747,804 1,878,806 2,258,547 2,273,472 394,666 21.0%
Attorney's Office 641,588 689,171 706,655 691,955 2,784 0.4%
Office of Operational Analysis 244,544 280,691 317,695 289,870 9,179 3.3%
Finance 2,073,962 2,230,518 2,334,426 2,287,026 56,508 2.5%
Human Resources 1,255,789 1,444,040 1,572,436 1,510,436 66,396 4.6%
Tax Commissioner's Office 1,435,712 1,534,680 1,557,302 1,540,102 5,422 0.4%
Tax Assessors 1,075,365 1,117,454 1,145,298 1,129,298 11,844 1.1%
Board of Elections 488,100 594,081 775,117 748,635 154,554 26.0%
Information Technology 2,696,306 3,401,131 3,454,493 3,441,293 40,162 1.2%
Other General Administration 7,761,670 11,467,819 12,386,957 16,650,455 5,182,636 45.2%
Total General Government $19,996,247 $25,269,414 $27,134,484 $31,188,100 $5,918,686 23.4%
Superior Court 2,918,313 3,037,521 3,238,006 3,238,406 200,885 6.6%
Clerk of Courts 1,148,194 1,479,608 1,507,787 1,471,687 (7,921) ‐0.5%
State Court 787,816 794,478 805,751 805,751 11,273 1.4%
Solicitor General's Office 1,160,524 1,251,875 1,272,128 1,272,128 20,253 1.6%
District Attorney's Office 1,249,017 1,315,134 1,420,620 1,382,120 66,986 5.1%
Sheriff's Office 16,938,384 17,618,653 18,036,840 17,819,259 200,606 1.1%
Juvenile Court 629,962 652,381 815,401 618,815 (33,566) ‐5.1%
Magistrate's Court 784,439 863,907 879,703 874,903 10,996 1.3%
Coroner's Office 47,650 48,949 58,736 58,736 9,787 20.0%
Probate Court 480,120 514,605 513,063 508,263 (6,342) ‐1.2%
Municipal Court 580,060 653,184 685,914 700,457 47,273 7.2%
Total Judicial $26,724,479 $28,230,295 $29,233,949 $28,750,525 $520,230 1.8%
Police Services 21,682,149 22,688,986 23,352,089 21,929,255 (759,731) ‐3.3%
Fire & Emergency Services 13,560,749 14,230,712 14,994,732 14,246,379 15,667 0.1%
Corrections 3,312,464 3,745,928 4,010,197 3,949,066 203,138 5.4%
Total Public Safety $38,555,362 $40,665,626 $42,357,018 $40,124,700 ($540,926) ‐1.3%
Trans. & Public Works 4,143,010 4,408,739 4,738,316 4,505,587 96,848 2.2%
Solid Waste 927,847 944,371 1,076,554 969,083 24,712 2.6%
Central Services 9,409,088 10,239,634 11,393,684 10,569,087 329,453 3.2%
Total Public Works $14,479,945 $15,592,744 $17,208,554 $16,043,757 $451,013 2.9%
Leisure Services 7,290,890 7,902,488 8,291,001 8,060,667 158,179 2.0%
Total Culture & Recreation $7,290,890 $7,902,488 $8,291,001 $8,060,667 $158,179 2.0%
Housing & Community Development 340,844 482,500 574,458 531,171 48,671 10.1%
Economic Development 442,555 486,315 465,626 454,126 (32,189) ‐6.6%
Planning & Zoning 1,146,741 1,176,779 1,228,314 1,186,094 9,315 0.8%
Building Inspection 790,131 824,519 873,112 873,112 48,593 5.9%
Cooperative Extension 178,893 205,444 257,302 255,002 49,558 24.1%
Total Housing & Development $2,899,164 $3,175,557 $3,398,812 $3,299,505 $123,948 3.9%
Independent Agencies 5,239,748 5,497,269 5,631,962 5,574,443 77,174 1.4%
Debt Service 1,045,085 1,052,561 1,057,855 1,057,855 5,294 0.5%
Total Expenditures $116,230,920 $127,385,954 $134,313,635 $134,099,552 $6,713,598 5.3%
Other Financing Uses/Transfers Out 3,747,393 3,457,268 3,606,959 3,848,478 391,210 11.3%
Transfers for Capital 5,595,600 3,451,600 10,152,600 2,245,000 (1,206,600) ‐35.0%
Total Other Financing Uses $9,342,993 $6,908,868 $13,759,559 $6,093,478 ($815,390) ‐11.8%
Total Expenditures & Uses $125,573,913 $134,294,822 $148,073,194 $140,193,030 $5,898,208 4.4%
General Fund
FY20 Budget E-6

Changes in Fund Balance
FY18 FY19 FY20
Actual Budget Approved
Fund Balance ‐ Beginning $23,484,365 $22,717,237 $22,717,237
Excess Revenue over Expenditures ($756,040)
Less Nonspendable ($11,088)
Budgeted Use of Fund Balance ($4,323,044) ($4,000,000)
Estimated Savings $4,323,044
Fund Balance ‐ Ending $22,717,237 $22,717,237 $18,717,237
% of Expenditures and Transfers Out: 18.1% 17.5% 13.4%
Other Information
General Fund Balance as Percent of Total Expenditures & Transfers Out
The FY20 General Fund Operating Budget (not including capital) is $138.0 million, 5.4% higher than the FY19 Budget. Over the last several budget years, the General Fund Operating Budget has grown at a rate lower than the combined annual change of the Consumer Price Index (CPI) and population. However, for FY20 the growth rate in the General Fund has exceeded the CPI and population.
$0
$20
$40
$60
$80
$100
$120
$140
$160
FY11 FY12 FY13 FY14 FY15 FY16 FY17 FY18 FY19 FY20
General Fund Budgets Compared to Population and CPI Increases (FY11‐FY20)
Projected Budget Approved Budget
Millions
Note: FY91 = 1.0
25.3%
22.6%
19.2%18.1% 17.5%
13.4%
0%
5%
10%
15%
20%
25%
30%
FY15 FY16 FY17 FY18 FY19 (Est.) FY20 (Est.)
16.67% GFOA MinimumRecommended FundBalance (2 months)
General Fund
FY20 Budget E-7

Hotel/Motel Fund
FY18 FY19 FY20 FY20
Actual Budget Requested Approved $▲ %▲Revenues
Taxes 3,158,275 3,400,000 3,750,000 3,750,000 350,000 10.3%
Other Revenues 3,924 341 0 0 (341) ‐100.0%
Total Revenues $3,162,199 $3,400,341 $3,750,000 $3,750,000 $349,659 10.3%
Prior Year Fund Balance 134,499 95,325 0 (134,499) ‐100.0%
Total Revenues & Other Sources $3,162,199 $3,534,840 $3,845,325 $3,750,000 $215,160 6.1%
Expenditures
Airport 683 0 0 0 0 ‐‐
Economic Development 74,681 260,000 260,000 115,000 (145,000) ‐55.8%
Central Services 6,505 0 0 0 0 ‐‐
Independent Agencies:
Classic Center Authority & CVB 2,657,010 2,914,140 3,214,125 3,214,125 299,985 10.3%
Other General Administration
Tourism Improvement & Special Activities 57,818 120,700 121,200 156,200 35,500 29.4%
Mayor's Community Improvement Pgrm 19,875 20,000 20,000 20,000 0 0.0%
Other Financing Uses
Transfer to General Fund 190,000 190,000 190,000 190,000 0 0.0%
Total Expenditures $3,006,572 $3,504,840 $3,805,325 $3,695,325 $190,485 5.4%
Capital ‐ Central Services 82,552 30,000 40,000 40,000 10,000 33.3%
Total Operating & Capital Expenditures $3,089,124 $3,534,840 $3,845,325 $3,735,325 $200,485 5.7%
Excess of Revenues over Expenditures $73,075 $0 $0 $14,675
Changes in Fund Balance
FY18 FY19 FY20
Actual Budget Approved
Fund Balance ‐ Beginning $305,409 $378,484 $243,985
Excess Revenue over Expenditures $73,075 $14,675
Budgeted Use of Fund Balance (134,499) 0
Fund Balance ‐ Ending $378,484 $243,985 $258,660
Committed for Capital Projects $112,961 $112,961 $112,961
Assigned/Available Fund Balance $265,523 $131,024 $145,699
Hotel/Motel Fund Revenue FY11‐FY20
$0.0 M
$0.5 M
$1.0 M
$1.5 M
$2.0 M
$2.5 M
$3.0 M
$3.5 M
$4.0 M
FY11 FY12 FY13 FY14 FY15 FY16 FY17 FY18 FY19Budget
FY20Budget
Special Revenue Funds
FY20 Budget E-8

Community Development Block Grant Fund
FY18 FY19 FY20 FY20
Actual Budget Requested Approved $▲ %▲Revenues
Intergovernmental 1,209,612 1,187,911 1,255,988 1,255,988 68,077 5.7%
Other Revenues 1,301 0 0 0 0 ‐‐
Total Revenues $1,210,913 $1,187,911 $1,255,988 $1,255,988 $68,077 5.7%
Expenditures
CDBG Administration:
Housing & Community Development 229,969 231,782 245,698 245,698 13,916 6.0%
Other General Administration 7,613 5,800 5,500 5,500 (300) ‐5.2%
CDBG Grant Programs 972,030 950,329 1,004,790 1,004,790 54,461 5.7%
Total Expenditures $1,209,612 $1,187,911 $1,255,988 $1,255,988 $68,077 5.7%
Excess of Revenues over Expenditures $1,301 $0 $0 $0
Changes in Fund Balance
FY18 FY19 FY20
Actual Budget Approved
Fund Balance ‐ Beginning $1,919 $3,220 $3,220
Excess Revenue over Expenditures $1,301
Fund Balance ‐ Ending $3,220 $3,220 $3,220
Restricted Fund Balance $3,220 $3,220
Special Revenue Funds
FY20 Budget E-9

Revolving Loan Fund
FY18 FY19 FY20 FY20
Actual Budget Requested Approved $▲ %▲Revenues
Other Revenues 1,341 5,000 5,000 5,000 0 0.0%
Expenditures
Other General Administration 0 0 0 0 0 ‐‐
Excess of Revenues over Expenditures $1,341 $5,000 $5,000 $5,000
Changes in Fund Balance
FY18 FY19 FY20
Actual Budget Approved
Fund Balance ‐ Beginning $232,277 $233,618 $238,618
Excess Revenue over Expenditures $1,341 $5,000 $5,000
Fund Balance ‐ Ending $233,618 $238,618 $243,618
Nonspendable $92,617 $92,617
Restricted Fund Balance $141,001 $151,001
Special Revenue Funds
FY20 Budget E-10

Emergency Telephone System (E-911) Fund
FY18 FY19 FY20 FY20
Actual Budget Requested Approved $▲ %▲Revenues
Charges for Services 1,694,223 1,754,000 1,971,000 1,971,000 217,000 12.4%
Other Revenues 29,845 20,000 20,000 20,000 0 0.0%
Total Revenues $1,724,068 $1,774,000 $1,991,000 $1,991,000 217,000 12.2%
Other Financing Sources/Transfers In 625,000 675,933 704,033 758,044 82,111 12.1%
Prior Year Fund Balance 0 421,325 147,030 147,030 (274,295) ‐65.1%
Total Revenues & Other Sources $2,349,068 $2,871,258 $2,842,063 $2,896,074 $24,816 0.9%
Expenditures
Police 2,454,677 2,685,958 2,647,566 2,701,577 15,619 0.6%
Other General Administration 121,727 185,300 194,497 194,497 9,197 5.0%
Total Expenditures $2,576,404 $2,871,258 $2,842,063 $2,896,074 $24,816 0.9%
Excess of Revenues over Expenditures ($227,336) $0 $0 $0
Changes in Fund Balance
FY18 FY19 FY20
Actual Budget Approved
Fund Balance ‐ Beginning $835,848 $608,512 $187,187
Excess Revenue over Expenditures ($227,336)
Budgeted Use of Fund Balance ‐$421,325 ‐$147,030
Fund Balance ‐ Ending $608,512 $187,187 $40,157
Assigned/Available Fund Balance $608,512 $187,187 $40,157
Special Revenue Funds
FY20 Budget E-11

HUD HOME Grant Fund
FY18 FY19 FY20 FY20
Actual Budget Requested Approved $▲ %▲Revenues
Intergovernmental 527,625 401,105 467,246 467,246 66,141 16.5%
Total Revenues & Other Sources $527,625 $401,105 $467,246 $467,246 $66,141 16.5%
Expenditures
HOME Grant Administration:
Housing & Community Development 38,811 38,810 46,725 46,725 7,915 20.4%
Other General Administration 1,300 1,300 0 0 (1,300) ‐100.0%
HOME Grant Programs 487,515 360,995 420,521 420,521 59,526 16.5%
Total Expenditures $527,626 $401,105 $467,246 $467,246 $66,141 16.5%
Excess of Revenues over Expenditures ($1) $0 $0 $0
Changes in Fund Balance
FY18 FY19 FY20
Actual Budget Approved
Fund Balance ‐ Beginning $2,480 $2,479 $2,479
Excess Revenue over Expenditures ($1)
Fund Balance ‐ Ending $2,479 $2,479 $2,479
Restricted Fund Balance $2,479 $2,479
Special Revenue Funds
FY20 Budget E-12

Grants Special Revenue Fund
FY18 FY19 FY20 FY20
Actual Budget Requested Approved $▲ %▲Revenues
Intergovernmental 13,678,818 645,829 532,033 532,033 (113,796) ‐17.6%
Other Revenues 84,035 53,053 38,560 38,560 (14,493) ‐27.3%
Total Revenues $13,762,853 $698,882 $570,593 $570,593 (128,289) ‐18.4%
Other Financing Sources/Transfers In 289,703 212,324 229,804 229,804 17,480 8.2%
Total Revenues & Other Sources $14,052,556 $911,206 $800,397 $800,397 ($110,809) ‐12.2%
Expenditures
Manager's Office 1,823 0 0 0 0 ‐‐
Human Resources 963 0 0 0 0 ‐‐
Other General Administration 23,900 35,600 97,900 97,900 62,300 175.0%
Superior Court 395,357 0 0 0 0 ‐‐
Clerk of Courts 23,818 0 0 0 0 ‐‐
State Court 116,218 0 0 0 0 ‐‐
Solicitor General's Office 116,347 0 0 0 0 ‐‐
Sheriff's Office 17,110 0 0 0 0 ‐‐
Juvenile Court 187,836 0 0 0 0 ‐‐
Municipal Court 5,000 0 0 0 0 ‐‐
Police 323,152 254,626 224,060 224,060 (30,566) ‐12.0%
Fire 31,000 0 0 0 0 ‐‐
Corrections 10,095 0 0 0 0 ‐‐
Transit 0 90,448 92,726 92,835 2,387 2.6%
Central Services 8,738 0 0 0 0 ‐‐
Leisure Services 14,808 0 0 0 0 ‐‐
Planning 373,437 530,532 385,602 385,602 (144,930) ‐27.3%
Total Operating Expenditures $1,649,602 $911,206 $800,288 $800,397 ($110,809) ‐12.2%
Capital Expenditures 12,007,749 0 0 0 0 ‐‐
Total Operating & Capital Expenses $13,657,351 $911,206 $800,288 $800,397 ($110,809) ‐12.2%
Excess of Revenues over Expenditures $395,205 $0 $109 $0
Changes in Fund Balance
FY18 FY19 FY20
Actual Budget Approved
Fund Balance ‐ Beginning $1,121,124 $1,516,329 $1,516,329
Excess Revenue over Expenditures $395,205
Fund Balance ‐ Ending $1,516,329 $1,516,329 $1,516,329
Nonspendable $157,082
Restricted Fund Balance $1,860,413
Unassigned Fund Balance ($501,166)
Special Revenue Funds
FY20 Budget E-13

Alternative Dispute Resolution Fund
FY18 FY19 FY20 FY20
Actual Budget Requested Approved $▲ %▲Revenues
Charges for Services 191,890 208,706 219,513 219,513 10,807 5.2%
Expenditures
Superior Court 163,232 192,606 202,409 202,409 9,803 5.1%
Other General Administration 10,200 16,100 17,104 17,104 1,004 6.2%
Total Expenditures $173,432 $208,706 $219,513 $219,513 $10,807 5.2%
Excess of Revenues over Expenditures $18,458 $0 $0 $0
Changes in Fund Balance
FY18 FY19 FY20
Actual Budget Approved
Fund Balance ‐ Beginning $47,511 $65,969 $65,969
Excess Revenue over Expenditures $18,458
Fund Balance ‐ Ending $65,969 $65,969 $65,969
Unassigned Fund Balance $65,969 $65,969
Special Revenue Funds
FY20 Budget E-14

Affordable Housing Fund
FY18 FY19 FY20 FY20
Actual Budget Requested Approved $▲ %▲Revenues
Intergovernmental 0 135,000 135,000 135,000 0 0.0%
Prior Year Fund Balance 0 0 24,438 24,438 24,438 ‐‐
Total Revenues & Other Sources $0 $135,000 $159,438 $159,438 $24,438 18.1%
Expenditures
Building Inspection 0 39,000 54,238 54,238 15,238 39.1%
Other General Administration 0 96,000 105,200 105,200 9,200 9.6%
Total Expenditures $0 $135,000 $159,438 $159,438 $24,438 18.1%
Excess of Revenues over Expenditures $0 $0 $0 $0
Changes in Fund Balance
FY18 FY19 FY20
Actual Budget Approved
Fund Balance ‐ Beginning $0 $0 $148,000
Excess Revenue over Expenditures $0 $0 $0
Budgeted Use of Fund Balance ($24,438)
Additional Revenue Received $0 $148,000 $0
Fund Balance ‐ Ending $0 $148,000 $123,562
Special Revenue Funds
FY20 Budget E-15

Supportive Housing Grant Fund
FY18 FY19 FY20 FY20
Actual Budget Requested Approved $▲ %▲Revenues
Intergovernmental 234,857 322,943 322,943 322,943 0 0.0%
Total Revenues & Other Sources $234,857 $322,943 $322,943 $322,943 $0 0.0%
Expenditures
Housing & Community Development 234,857 322,943 322,943 322,943 0 0.0%
Total Expenditures $234,857 $322,943 $322,943 $322,943 $0 0.0%
Excess of Revenues over Expenditures $0 $0 $0 $0
Changes in Fund Balance
FY18 FY19 FY20
Actual Budget Approved
Fund Balance ‐ Beginning $0 $0 $0
Excess Revenue over Expenditures $0
Fund Balance ‐ Ending $0 $0 $0
Special Revenue Funds
FY20 Budget E-16

Special Programs Fund
FY18 FY19 FY20 FY20
Actual Budget Requested Approved $▲ %▲Revenues
Intergovernmental 496,461 616,335 670,764 670,764 54,429 8.8%
Charges for Services 256,294 301,100 266,100 266,100 (35,000) ‐11.6%
Fines & Forfeitures 1,156,385 952,700 863,600 863,600 (89,100) ‐9.4%
Other Revenues 171,929 0 35,000 35,000 35,000 ‐‐
Total Revenues $2,081,069 $1,870,135 $1,835,464 $1,835,464 ($34,671) ‐1.9%
Other Financing Sources/Transfers In 600,793 240,093 290,450 425,450 185,357 77.2%
Prior Year Fund Balance 0 0 0 0 ‐‐
Total Revenues & Other Sources $2,681,862 $2,110,228 $2,125,914 $2,260,914 $150,686 7.1%
Expenditures
Manager's Office 3,979 8,000 0 0 (8,000) ‐100.0%
Human Resources 110,717 25,000 40,000 25,000 0 0.0%
Information Technology 104,741 104,741 104,741 104,741 0 0.0%
Economic Development 0 0 0 150,000 150,000 ‐‐
Other General Administration 135,615 86,000 94,200 94,200 8,200 9.5%
Superior Court 242,182 310,440 121,897 121,897 (188,543) ‐60.7%
Clerk of Courts 49,374 0 0 0 0 ‐‐
State Court 189,224 263,104 263,288 263,288 184 0.1%
Solicitor General's Office 59,910 67,891 79,826 79,826 11,935 17.6%
District Attorney's Office 680,210 723,681 783,029 783,029 59,348 8.2%
Sheriff's Office 2,475 0 0 0 0 ‐‐
Juvenile Court 17,500 0 0 0 0 ‐‐
Police 709,937 478,144 515,422 515,422 37,278 7.8%
Solid Waste 27,549 0 0 0 0 ‐‐
Leisure Services 0 0 35,000 35,000 35,000 ‐‐
Independent Agencies 26,000 26,000 26,000 26,000 0 0.0%
Total Operating Expenditures $2,359,413 $2,093,001 $2,063,403 $2,198,403 $105,402 5.0%
Other Financing Uses/Transfers Out 9,868 0 0 0 0 ‐‐
Total Expenditures $2,369,281 $2,093,001 $2,063,403 $2,198,403 $0 ‐‐
Excess of Revenues over Expenditures $312,581 $17,227 $62,511 $62,511
Changes in Fund Balance
FY18 FY19 FY20
Actual Budget Approved
Fund Balance ‐ Beginning $2,838,079 $3,150,660 $3,167,887
Excess Revenue over Expenditures $312,581 $17,227 $62,511
Budgeted Use of Fund Balance
Fund Balance ‐ Ending $3,150,660 $3,167,887 $3,230,398
Restricted Fund Balance $622,993
Committed to Existing Programs $2,256,796
Assigned/Available Fund Balance $270,871
Special Revenue Funds
FY20 Budget E-17

Building Inspection Fund
FY18 FY19 FY20 FY20
Actual Budget Requested Approved $▲ %▲Revenues
Licenses & Permits 1,003,085 1,000,000 1,100,000 1,100,000 100,000 10.0%
Other Revenues 23,577 0 0 0 0 ‐‐
Total Revenues $1,026,662 $1,000,000 $1,100,000 $1,100,000 $100,000 10.0%
Prior Year Fund Balance 0 0 246,494 264,114 264,114 ‐‐
Total Revenues & Other Sources $1,026,662 $1,000,000 $1,346,494 $1,364,114 $364,114 36.4%
Expenditures
Building Inspection 772,575 812,517 881,639 899,259 86,742 10.7%
Planning & Zoning 87,213 88,566 180,441 180,441 91,875 103.7%
Other General Administration 51,200 80,800 239,414 239,414 158,614 196.3%
Total Expenditures $910,988 $981,883 $1,301,494 $1,319,114 $337,231 34.3%
Capital Funding 0 0 45,000 45,000 45,000 ‐‐
Total Operating & Capital Expenditures $910,988 $981,883 $1,346,494 $1,364,114 $382,231 38.9%
Excess of Revenues over Expenditures $115,674 $18,117 $0 $0
Changes in Fund Balance
FY18 FY19 FY20
Actual Budget Approved
Fund Balance ‐ Beginning $1,593,075 $1,708,749 $1,726,866
Excess Revenue over Expenditures $115,674 $18,117
Budgeted Use of Fund Balance ($264,114)
Fund Balance ‐ Ending $1,708,749 $1,726,866 $1,462,752
Committed/Available for Building Insp. $1,708,749 $1,462,752
Special Revenue Funds
FY20 Budget E-18

Sheriff Inmate Fund
FY18 FY19 FY20 FY20
Actual Budget Requested Approved $▲ %▲Revenues
Other Revenues 138,859 70,000 70,000 70,000 0 0.0%
Total Revenues $138,859 $70,000 $70,000 $70,000 $0 0.0%
Prior Year Fund Balance 0 ‐‐
Total Revenues & Other Sources $138,859 $70,000 $70,000 $70,000 $0 0.0%
Expenditures
Sheriff's Office 28,331 35,000 35,000 35,000 0 0.0%
Other Financing Uses/Transfers Out 19,600 35,000 35,000 35,000 0 0.0%
Total Expenditures & Other Financing Uses $47,931 $70,000 $70,000 $70,000 $0 0.0%
Excess of Revenues over Expenditures $90,928 $0 $0 $0
Changes in Fund Balance
FY18 FY19 FY20
Actual Budget Approved
Fund Balance ‐ Beginning $198,701 $289,629 $289,629
Excess Revenue over Expenditures $90,928
Fund Balance ‐ Ending $289,629 $289,629 $289,629
Committed for Sheriff Inmate Fund $289,629 $289,629
Special Revenue Funds
FY20 Budget E-19

Corrections Inmate Fund
FY18 FY19 FY20 FY20
Actual Budget Requested Approved $▲ %▲Revenues
Other Revenues 20,260 50,000 50,000 50,000 0 0.0%
Total Revenues & Other Sources $20,260 $50,000 $50,000 $50,000 $0 0.0%
Expenditures
Sheriff's Office 14,847 50,000 50,000 50,000 0 0.0%
Total Expenditures & Other Financing Uses $14,847 $50,000 $50,000 $50,000 $0 0.0%
Excess of Revenues over Expenditures $5,413 $0 $0 $0
Changes in Fund Balance
FY18 FY19 FY20
Actual Budget Approved
Fund Balance ‐ Beginning $190,247 $195,660 $195,660
Budgeted Use of Fund Balance
Fund Balance ‐ Ending $195,660 $195,660 $195,660
Committed for Sheriff Inmate Fund $195,660 $195,660
Special Revenue Funds
FY20 Budget E-20

Public Facilities Authority Fund
FY18 FY19 FY20 FY20
Actual Budget Requested Approved $▲ %▲Revenues
Intergovernmental 21,626 16,813 10,228 10,228 (6,585) ‐39.2%
Other Revenues 6,637 0 0 0 0 ‐‐
Total Revenues $28,263 $16,813 $10,228 $10,228 ($6,585) ‐39.2%
Other Financing Sources/Transfers In 513,080 516,223 518,995 518,995 2,772 0.5%
Total Revenues & Other Sources $541,343 $533,036 $529,223 $529,223 ($3,813) ‐0.7%
Expenditures
Debt Service 536,277 533,036 529,223 529,223 (3,813) ‐0.7%
Total Expenditures $536,277 $533,036 $529,223 $529,223 ($3,813) ‐0.7%
Excess of Revenues over Expenditures $5,066 $0 $0 $0
Changes in Fund Balance
FY18 FY19 FY20
Actual Budget Approved
Fund Balance ‐ Beginning $811,726 $816,792 $816,792
Excess Revenue over Expenditures $5,066
Fund Balance ‐ Ending $816,792 $816,792 $816,792
Assigned/Available Fund Balance $816,792 $816,792
Capital Funds
FY20 Budget E-21

Economic Development Capital Projects Fund
FY18 FY19 FY20 FY20
Actual Budget Requested Approved $▲ %▲Revenues
Other Revenues 6,577 0 0 0 0 ‐‐
Total Revenues $6,577 $0 $0 $0 $0 ‐‐
Other Financing Sources/Transfers In 225,000 225,000 225,000 200,000 (25,000) ‐11.1%
Total Revenues & Other Sources $231,577 $225,000 $225,000 $200,000 ($25,000) ‐11.1%
Expenditures
Economic Development Capital Program 525,000 225,000 225,000 200,000 (25,000) ‐11.1%
Total Expenditures $525,000 $225,000 $225,000 $200,000 ($25,000) ‐11.1%
Excess of Revenues over Expenditures ($293,423) $0 $0 $0
Changes in Fund Balance
FY18 FY19 FY20
Actual Budget Approved
Fund Balance ‐ Beginning $764,410 $470,987 $470,987
Excess Revenue over Expenditures ($293,423)
Fund Balance ‐ Ending $470,987 $470,987 $470,987
Committed to Capital Projects $433,100 $433,100
Assigned/Available Fund Balance $37,887 $37,887
Capital Funds
FY20 Budget E-22

General Capital Project Fund
FY18 FY19 FY20 FY20
Actual Budget Requested Approved $▲ %▲Revenues
Other Taxes 8,591 0 0 0 0 ‐‐
Other Revenues 671,620 0 0 0 0 ‐‐
Total Revenues $680,211 $0 $0 $0 $0 ‐‐
Other Financing Sources/Transfers In 5,470,600 3,226,600 9,927,600 2,045,000 (1,181,600) ‐36.6%
Prior Year Fund Balance 0 422,600 0 164,500 (258,100) ‐61.1%
Total Revenues & Other Sources $6,150,811 $3,649,200 $9,927,600 $2,209,500 ($1,439,700) ‐39.5%
Expenditures
Manager's Office 100,571 55,000 472,500 252,500 197,500 359.1%
Board of Elections 0 0 60,000 0 0 ‐‐
Information Technology 255,339 406,000 566,000 400,000 (6,000) ‐1.5%
Other General Administration 32,332 0 20,000 0 0 ‐‐
Clerk of Courts 50,000 35,000 0 0 (35,000) ‐100.0%
Solicitor General's Office 59,151 0 0 0 0 ‐‐
District Attorney's Office 111,224 0 26,000 26,000 26,000 ‐‐
Sheriff's Office 76,803 0 72,000 42,000 42,000 ‐‐
Coroner's Office 20,000 0 0 0 0 ‐‐
Police 1,023,118 656,200 631,000 466,000 (190,200) ‐29.0%
Fire 425,287 115,000 309,900 32,000 (83,000) ‐72.2%
Corrections 42,649 20,000 283,500 20,000 0 0.0%
Airport 88,281 30,000 389,000 0 (30,000) ‐100.0%
Transit 18,877 0 0 0 0 ‐‐
Transportation & Public Works 1,882,940 290,000 2,399,600 560,000 270,000 93.1%
Central Services 1,079,402 1,905,000 3,060,300 251,000 (1,654,000) ‐86.8%
Leisure Services 658,753 117,000 1,637,800 160,000 43,000 36.8%
Planning 109,462 20,000 0 0 (20,000) ‐100.0%
Other Financing Uses 84,000 0 0 0 0 ‐‐
Total Expenditures & Other Financing Uses $6,118,189 $3,649,200 $9,927,600 $2,209,500 ($1,439,700) ‐39.5%
Excess of Revenues over Expenditures $32,622 $0 $0 $0
Changes in Fund Balance
FY18 FY19 FY20
Actual Budget Approved
Fund Balance ‐ Beginning $9,334,981 $9,367,603 $8,945,003
Excess Revenue over Expenditures $32,622
Budgeted Use of Fund Balance ($422,600) ($164,500)
Fund Balance ‐ Ending $9,367,603 $8,945,003 $8,780,503
Nonspendable $235,763 $235,763
Committed to Capital Projects $8,709,240 $8,544,740
Assigned/Available Fund Balance $422,600 $0
FY20 Budget by Department
Police
Transportation & Public Works
Information Technology
Central Services
Manager's Office
Leisure Services
All Others
Capital Funds
FY20 Budget E-23

Airport Fund
FY18 FY19 FY20 FY20
Actual Budget Requested Approved $▲ %▲Revenues
Charges for Services
Fuel 2,138,772 1,789,675 2,371,279 2,371,279 581,604 32.5%
Leases 429,663 497,626 513,051 513,051 15,425 3.1%
Airport Fees 105,531 71,300 91,200 91,200 19,900 27.9%
Other Charges for Services 3,522 5,850 5,600 5,600 (250) ‐4.3%
Other Revenues 7,131 0 0 0 0 ‐‐
Total Operating Revenues $2,684,619 $2,364,451 $2,981,130 $2,981,130 $616,679 26.1%
Other Financing Sources/Transfers In 110,959 105,826 105,826 105,826 0 0.0%
Total Revenues & Other Sources $2,795,578 $2,470,277 $3,086,956 $3,086,956 $616,679 25.0%
Expenses
Personal Services 496,974 556,761 627,562 627,562 70,801 12.7%
Operating 544,085 650,120 644,034 644,034 (6,086) ‐0.9%
Fuel Expenses 1,395,510 1,275,957 1,541,522 1,541,522 265,565 20.8%
Depreciation 228,530 229,400 229,400 229,400 0 0.0%
Debt Service 23,818 22,327 19,448 19,448 (2,879) ‐12.9%
Total Expenses $2,688,917 $2,734,565 $3,061,966 $3,061,966 $327,401 $0
Other Financing Uses/Transfers Out 61,802 68,522 74,590 74,590 6,068 8.9%
Total Expenses & Other Financing Uses $2,750,719 $2,803,087 $3,136,556 $3,136,556 $333,469 11.9%
Capital Funding $52,510 0 0 0
Net Operating Income/(Loss) Incl. Capital ($7,651) ($332,810) ($49,600) ($49,600)
Changes in Unrestricted Net Position
FY18 FY19 FY20
Actual Budget Approved
Beginning Unrestricted Net Position $651,038 $783,852 $590,791
Net Income/(Loss) ($7,651) ($332,810) ($49,600)
Other Changes to Unrestricted Net Position:
Less Debt Service Principal Payments ($88,065) ($89,651) ($91,285)
Plus Depreciation $228,530 $229,400 $229,400
Ending Unrestricted Net Position $783,852 $590,791 $679,306
Less:
Approved Capital from prior years ($48,016) ($48,016) ($48,016)
Operating Reserve (3 months) ($339,000) ($382,000) ($399,000)
Available Unrestricted Net Position $396,836 $160,775 $232,290
Enterprise Funds
FY20 Budget E-24

Landfill Fund
FY18 FY19 FY20 FY20
Actual Budget Requested Approved $▲ %▲Revenues
Charges for Services 4,302,047 3,812,000 4,075,000 4,075,000 263,000 6.9%
Other Revenues 107,601 0 0 0 0 ‐‐
Total Revenues & Other Sources $4,409,648 $3,812,000 $4,075,000 $4,075,000 $263,000 6.9%
Expenses
Solid Waste
Recycling 1,029,915 1,100,532 1,202,066 1,202,066 101,534 9.2%
Landfill 1,272,776 1,358,083 1,390,590 1,390,590 32,507 2.4%
Closure/Post‐Closure 419,767 120,000 120,000 120,000 0 0.0%
Other General Administration 1,004,201 1,043,512 970,126 970,126 (73,386) ‐7.0%
Debt Service 0 0 204,105 204,105 204,105 ‐‐
Total Expenses $3,726,659 $3,622,127 $3,886,887 $3,886,887 $264,760 $0
Other Financing Uses/Transfers Out 290,071 307,779 331,277 331,277 23,498 7.6%
Total Expenses & Other Financing Uses $4,016,730 $3,929,906 $4,218,164 $4,218,164 $288,258 7.3%
Capital Funding 438,568 623,000 505,000 685,000
Net Operating Income/(Loss) Incl. Capital ($45,650) ($740,906) ($648,164) ($828,164)
Changes in Unrestricted Net Position
FY18 FY19 FY20
Actual Budget Approved
Beginning Unrestricted Net Position $1,885,222 $2,432,205 $2,283,839
Net Income/(Loss) ($45,650) ($740,906) ($828,164)
Other Changes to Unrestricted Net Position:
Less Debt Service Principal Payments $0 $0 ($465,250)
Plus Depreciation $592,633 $592,540 $592,540
Ending Unrestricted Net Position $2,432,205 $2,283,839 $1,582,965
Less:
Approved Capital from prior years ($530,541) ($530,541) ($530,541)
Operating Reserve (3 months) ($856,000) ($834,000) ($906,000)
Available Unrestricted Net Position $1,045,664 $919,298 $146,424
Enterprise Funds
FY20 Budget E-25

Transit Fund
FY18 FY19 FY20 FY20
Actual Budget Requested Approved $▲ %▲Revenues
Intergovernmental 2,563,000 2,563,000 2,632,726 2,632,726 69,726 2.7%
Charges for Services
Regular Farebox 642,141 650,000 630,000 531,000 (119,000) ‐18.3%
UGA Farebox 603,894 527,700 646,995 646,995 119,295 22.6%
Other Charges for Services 60,000 70,000 65,000 65,000 (5,000) ‐7.1%
Other Revenues 58,596 10,000 10,000 10,000 0 0.0%
Total Operating Revenues $3,927,631 $3,820,700 $3,984,721 $3,885,721 $65,021 1.7%
Other Financing Sources/Transfers In 10,565,133 1,706,859 1,757,851 1,810,359 103,500 6.1%
Total Revenues & Other Sources $14,492,764 $5,527,559 $5,742,572 $5,696,080 $168,521 3.0%
Expenses
Transit Department:
Administration 386,333 581,950 543,626 538,626 (43,324) ‐7.4%
Transit Operations 3,465,172 3,592,855 4,455,101 4,185,293 592,438 16.5%
Demand Response 304,646 320,526 380,071 360,071 39,545 12.3%
Transit Maintenance 918,452 1,009,181 1,058,417 1,048,417 39,236 3.9%
Other General Administration 2,370,187 3,502,878 3,376,157 3,376,157 (126,721) ‐3.6%
Total Expenses $7,444,790 $9,007,390 $9,813,372 $9,508,564 $501,174 5.6%
Other Financing Uses/Transfers Out 567,331 569,557 627,094 652,092 82,535 14.5%
Total Expenses & Other Financing Uses $8,012,121 $9,576,947 $10,440,466 $10,160,656 $583,709 6.1%
Net Operating Income/(Loss) Incl. Capital $6,480,643 ($4,049,388) ($4,697,894) ($4,464,576)
Changes in Unrestricted Net Position
FY18 FY19 FY20
Actual Budget Approved
Beginning Unrestricted Net Position $4,614,240 $3,970,683 $2,842,295
Net Income/(Loss) $6,480,643 ($4,049,388) ($4,464,576)
Other Changes to Unrestricted Net Position:
Less Donated Assets ($9,016,651) $0 $0
Plus Depreciation $1,892,451 $2,921,000 $2,921,000
Ending Unrestricted Net Position $3,970,683 $2,842,295 $1,298,719
Less:
Operating Reserve (3 months) ($1,530,000) ($1,664,000) ($1,810,000)
Available Unrestricted Net Position $2,440,683 $1,178,295 ($511,281)
FY20 Revenues
Intergovernmental: 46.2%
Transfers In: 31.8%
UGA Farebox: 11.4%
Regular Farebox: 9.3%
Other Charges for Services: 1.1%
Other Revenues: 0.2%
Enterprise Funds
FY20 Budget E-26

Water & Sewer Fund
Revenues & Expenditures by Type
FY18 FY19 FY20 FY20
Actual Budget Requested Approved $▲ %▲Revenues
Charges for Services 55,400,790 53,920,498 56,007,618 56,007,618 2,087,120 3.9%
Other Revenues 1,526,103 241,966 241,966 241,966 0 0.0%
Total Operating Revenues $56,926,893 $54,162,464 $56,249,584 $56,249,584 $2,087,120 3.9%
Other Financing Sources/Transfers In 1,011,523 0 0 0 0 ‐‐
Total Revenues & Other Sources $57,938,416 $54,162,464 $56,249,584 $56,249,584 $2,087,120 3.9%
Operating Expenses by Type
Personal Services 9,019,867 9,975,263 10,415,432 10,415,432 440,169 4.4%
Operating Expenses 10,314,540 12,110,839 12,031,465 12,031,465 (79,374) ‐0.7%
Depreciation 11,357,582 11,248,600 11,248,600 11,248,600 0 0.0%
Debt Service 10,143,150 9,807,709 9,450,416 9,450,416 (357,293) ‐3.6%
Other Expenses 3,000 3,000 3,000 3,000 0 0.0%
Total Expenses $40,838,139 $43,145,411 $43,148,913 $43,148,913 $3,502 0.0%
Other Financing Uses/Transfers Out 1,331,915 1,555,150 1,733,577 1,733,577 178,427 11.5%
Total Expenses & Other Financing Uses $42,170,054 $44,700,561 $44,882,490 $44,882,490 $181,929 0.4%
Capital Funding 16,251,500 28,683,400 27,467,800 27,467,800
Net Operating Income/(Loss) Incl. Capital ($483,138) ($19,221,497) ($16,100,706) ($16,100,706)
Changes in Unrestricted Net Position
FY18 FY19 FY20
Actual Budget Approved
Beginning Unrestricted Net Position $103,268,313 $95,828,448 $81,007,208
Net Income/(Loss) ‐$483,138 ‐$19,221,497 ‐$16,100,706
Other Changes to Unrestricted Net Position:
Less Donated Assets ‐$11,781,023 $0 $0
Less Debt Service Principal Payments ‐$6,533,286 ‐$6,848,343 ‐$6,533,286
Plus Depreciation $11,357,582 $11,248,600 $11,248,600
Ending Unrestricted Net Position $95,828,448 $81,007,208 $69,621,816
Less:
Approved Capital from prior years ‐$56,777,285 ‐$56,777,285 ‐$56,777,285
Operating Reserve (3 months) ‐$5,167,000 ‐$5,911,000 ‐$6,046,000
Available Unrestricted Net Position $33,884,163 $18,318,923 $6,798,531
Enterprise Funds
FY20 Budget E-27

Total Expenses & Financing Uses by Department/Division
FY18 FY19 FY20 FY20
Actual Budget Requested Approved $▲ %▲Public Utilities:
Administration 888,422 1,154,117 1,256,072 1,200,453 46,336 4.0%
Constr & Proj Management 5,805,309 6,363,135 6,619,732 6,675,351 312,216 4.9%
Plant Operations 10,265,764 11,695,233 11,911,302 11,911,302 216,069 1.8%
Engineering Management 485,370 541,770 577,506 577,506 35,736 6.6%
Information Technology 7,375 57,056 60,647 60,647 3,591 6.3%
Building Inspection 27,094 27,621 27,448 27,448 (173) ‐0.6%
Other General Administration 13,215,656 13,498,770 13,245,790 13,245,790 (252,980) ‐1.9%
Debt Service 10,143,150 9,807,709 9,450,416 9,450,416 (357,293) ‐3.6%
Other Financing Uses/Transfers Out 1,331,915 1,555,150 1,733,577 1,733,577 178,427 11.5%
Total Expenses & Other Financing Uses $42,170,055 $44,700,561 $44,882,490 $44,882,490 $181,929 0.4%
Expenses by Department
Public Utilities: 45.4%
Other General Admin.:29.5%
Debt Service: 21.1%
Transfers Out: 3.9%
Information Technology:0.1%
Building Inspection: 0.1%
Public Utilities by Division
Plant Operations: 58.5%
Constr & ProjManagement: 32.8%
Administration: 5.9%
EngineeringManagement: 2.8%
Enterprise Funds
FY20 Budget E-28

Solid Waste Fund
FY18 FY19 FY20 FY20
Actual Budget Requested Approved $▲ %▲Revenues
Charges for Services 3,451,226 3,396,800 3,422,300 3,422,300 25,500 0.8%
Other Revenues 11,062 0 4,000 4,000 4,000 ‐‐
Total Operating Revenues $3,462,288 $3,396,800 $3,426,300 $3,426,300 $29,500 0.9%
Other Financing Sources/Transfers In 135,000 135,000 135,000 135,000 0 0.0%
Total Revenues & Other Sources $3,597,288 $3,531,800 $3,561,300 $3,561,300 $29,500 0.8%
Expenses
Solid Waste Administration 359,645 373,593 378,022 378,022 4,429 1.2%
Solid Waste Collection 2,268,716 2,374,526 2,441,014 2,441,014 66,488 2.8%
Other General Administration 673,310 710,008 704,478 704,478 (5,530) ‐0.8%
Total Expenses $3,301,671 $3,458,127 $3,523,514 $3,523,514 $65,387 1.9%
Other Financing Uses/Transfers Out 210,559 243,062 268,473 268,473 25,411 10.5%
Total Expenses & Other Financing Uses $3,512,230 $3,701,189 $3,791,987 $3,791,987 $90,798 2.5%
Capital Funding 247,580 739,000 799,000 549,000
Net Operating Income/(Loss) Incl. Capital ($162,522) ($908,389) ($1,029,687) ($779,687)
Changes in Unrestricted Net Position
FY18 FY19 FY20
Actual Budget Approved
Beginning Unrestricted Net Position $1,121,650 $1,292,090 $703,201
Net Income/(Loss) ‐$162,522 ‐$908,389 ‐$779,687
Other Changes to Unrestricted Net Position:
Plus Depreciation $332,962 $319,500 $319,500
Ending Unrestricted Net Position $1,292,090 $703,201 $243,014
Less:
Approved Capital from prior years ‐$660,555 ‐$660,555 ‐$660,555
Operating Reserve (3 months) ‐$795,000 ‐$845,000 ‐$868,000
Available Unrestricted Net Position ($163,465) ($802,354) ($1,285,541)
Enterprise Funds
FY20 Budget E-29

Stormwater Fund
FY18 FY19 FY20 FY20
Actual Budget Requested Approved $▲ %▲Revenues
Charges for Services 4,193,512 4,169,800 4,277,500 4,277,500 107,700 2.6%
Other Revenues 99,092 0 50,000 50,000 50,000 ‐‐
Total Operating Revenues $4,292,604 $4,169,800 $4,327,500 $4,327,500 $157,700 3.8%
Other Financing Sources/Transfers In 13,249,800 0 0 0 0 ‐‐
Total Revenues & Other Sources $17,542,404 $4,169,800 $4,327,500 $4,327,500 $157,700 3.8%
Expenses
Transportation & Public Works 2,723,940 3,219,708 3,371,680 3,371,680 151,972 4.7%
Other General Administration 590,089 594,981 816,419 816,419 221,438 37.2%
Total Expenses $3,314,029 $3,814,689 $4,188,099 $4,188,099 $373,410 9.8%
Other Financing Uses/Transfers Out 294,360 349,971 379,558 379,558 29,587 8.5%
Total Expenses & Other Financing Uses $3,608,389 $4,164,660 $4,567,657 $4,567,657 $402,997 9.7%
Capital Funding 1,097,028 1,100,000 900,000 900,000
Net Operating Income/(Loss) Incl. Capital $12,836,987 ($1,094,860) ($1,140,157) ($1,140,157)
Changes in Unrestricted Net Position
FY18 FY19 FY20
Actual Budget Approved
Beginning Unrestricted Net Position $5,806,133 $5,824,515 $5,113,755
Net Income/(Loss) $12,836,987 ‐$1,094,860 ‐$1,140,157
Other Changes to Unrestricted Net Position:
Less Donated Assets ‐$13,249,800 $0 $0
Plus Depreciation $431,195 $384,100 $384,100
Ending Unrestricted Net Position $5,824,515 $5,113,755 $4,357,698
Less:
Approved Capital from prior years ‐$3,456,232 ‐$3,456,232 ‐$3,456,232
Operating Reserve (3 months) ‐$794,000 ‐$945,000 ‐$1,046,000
Available Unrestricted Net Position $1,574,283 $712,523 ($144,534)
Enterprise Funds
FY20 Budget E-30

Internal Support Fund
FY18 FY19 FY20 FY20
Actual Budget Requested Approved $▲ %▲Revenues
Charges for Services 1,684,382 1,892,200 1,926,328 1,926,328 34,128 1.8%
Other Revenues 6,827 0 0 0 0 ‐‐
Total Operating Revenues $1,691,209 $1,892,200 $1,926,328 $1,926,328 $34,128 1.8%
Other Financing Sources/Transfers In 5,000 0 0 0 0 ‐‐
Total Revenues & Other Sources $1,696,209 $1,892,200 $1,926,328 $1,926,328 $34,128 1.8%
Expenses
Central Services 1,594,436 1,780,301 1,533,060 1,533,060 (247,241) ‐13.9%
Other General Administration 57,434 56,000 53,980 53,980 (2,020) ‐3.6%
Debt Service ‐ Capital Lease 0 0 269,445 269,445 269,445 ‐‐
Total Expenses $1,651,870 $1,836,301 $1,856,485 $1,856,485 $20,184 1.1%
Other Financing Uses/Transfers Out 33,728 38,459 41,459 41,459 3,000 7.8%
Total Expenses & Other Financing Uses $1,685,598 $1,874,760 $1,897,944 $1,897,944 $23,184 1.2%
Capital Funding 28,750 40,000 40,000 40,000
Net Operating Income/(Loss) Incl. Capital ($18,139) ($22,560) ($11,616) ($11,616)
Changes in Unrestricted Net Position
FY18 FY19 FY20
Actual Budget Approved
Beginning Unrestricted Net Position $565,624 $594,096 $615,536
Net Income/(Loss) ‐$18,139 ‐$22,560 ‐$11,616
Other Changes to Unrestricted Net Position:
Less Donated Assets ‐$5,000 $0 $0
Plus Depreciation $51,611 $44,000 $44,000
Ending Unrestricted Net Position $594,096 $615,536 $647,920
Less:
Approved Capital from prior years ‐$354,435 ‐$354,435 ‐$354,435
Operating Reserve (1 month) ‐$136,000 ‐$153,000 ‐$154,000
Available Unrestricted Net Position $103,661 $108,101 $139,485
Internal Service Funds
FY20 Budget E-31

Fleet Management Fund
FY18 FY19 FY20 FY20
Actual Budget Requested Approved $▲ %▲Revenues
Charges for Services 2,501,900 2,541,080 2,565,036 2,565,036 23,956 0.9%
Other Revenues 2,382 0 0 0 0 ‐‐
Total Revenues & Other Sources $2,504,282 $2,541,080 $2,565,036 $2,565,036 $23,956 0.9%
Expenses
Central Services 2,413,395 2,407,798 2,387,026 2,387,026 (20,772) ‐0.9%
Other General Administration 27,301 45,200 39,630 39,630 (5,570) ‐12.3%
Total Expenses $2,440,696 $2,452,998 $2,426,656 $2,426,656 ($26,342) ‐1.1%
Other Financing Uses/Transfers Out 82,878 95,992 103,992 103,992 8,000 8.3%
Total Expenses & Other Financing Uses $2,523,574 $2,548,990 $2,530,648 $2,530,648 ($18,342) ‐0.7%
Capital Funding 0 30,000 10,000 10,000
Net Operating Income/(Loss) Incl. Capital ($19,292) ($37,910) $24,388 $24,388
Changes in Unrestricted Net Position
FY18 FY19 FY20
Actual Budget Approved
Beginning Unrestricted Net Position $153,089 $148,292 $124,982
Net Income/(Loss) ‐$19,292 ‐$37,910 $24,388
Other Changes to Unrestricted Net Position:
Plus Depreciation $14,495 $14,600 $14,600
Ending Unrestricted Net Position $148,292 $124,982 $163,970
Less:
Approved Capital from prior years ‐$39,564 ‐$39,564 ‐$39,564
Operating Reserve (1 month) ‐$209,000 ‐$211,000 ‐$210,000
Available Unrestricted Net Position ($100,272) ($125,582) ($85,594)
Internal Service Funds
FY20 Budget E-32

Fleet Replacement Fund
FY18 FY19 FY20 FY20
Actual Budget Requested Approved $▲ %▲Revenues
Charges for Services 1,578,514 1,858,035 2,167,433 1,010,465 (847,570) ‐45.6%
Other Revenues 141,861 0 0 0 0 ‐‐
Total Operating Revenues $1,720,375 $1,858,035 $2,167,433 $1,010,465 ($847,570) ‐45.6%
Other Financing Sources/Transfers In 196,118 0 0 0 0 ‐‐
Total Revenues & Other Sources $1,916,493 $1,858,035 $2,167,433 $1,010,465 ($847,570) ‐45.6%
Expenses
Other General Administration 1,957,150 90,000 90,000 90,000 0 0.0%
Equipment Expenses 110,579 0 0 0 0 ‐‐
Debt Service 26,148 0 0 0 0 ‐‐
Total Expenses & Other Financing Uses $2,093,877 $90,000 $90,000 $90,000 $0 0.0%
Capital Funding 1,341,107 2,790,800 3,102,000 3,102,000
Net Operating Income/(Loss) Incl. Capital ($1,518,491) ($1,022,765) ($1,024,567) ($2,181,535)
Changes in Unrestricted Net Position
FY18 FY19 FY20
Actual Budget Approved
Beginning Unrestricted Net Position $7,546,106 $7,864,317 $6,841,552
Net Income/(Loss) ‐$1,518,491 ‐$1,022,765 ‐$2,181,535
Other Changes to Unrestricted Net Position:
Less Donated Assets ‐$4,300 $0 $0
Plus Depreciation $1,841,002 $0 $0
Ending Unrestricted Net Position $7,864,317 $6,841,552 $4,660,017
Less:
Reserve ‐$1,100,000 ‐$1,100,000 ‐$1,100,000
Available Unrestricted Net Position $6,764,317 $5,741,552 $3,560,017
Internal Service Funds
FY20 Budget E-33

Insurance & Claims Fund
FY18 FY19 FY20 FY20
Actual Budget Requested Approved $▲ %▲Revenues
Charges for Services 3,192,340 3,265,000 3,414,350 3,414,350 149,350 4.6%
Intergovernmental 31,068 0 0 0 0 ‐‐
Other Revenues 213,929 0 0 0 0 ‐‐
Total Operating Revenues $3,437,337 $3,265,000 $3,414,350 $3,414,350 $149,350 4.6%
Expenses
Human Resources 301,712 465,147 469,022 469,022 3,875 0.8%
Other General Administration 2,435,385 2,701,800 2,851,334 2,851,334 149,534 5.5%
Total Expenses $2,737,097 $3,166,947 $3,320,356 $3,320,356 $153,409 4.8%
Other Financing Uses/Transfers Out 47,917 39,971 42,971 42,971 3,000 7.5%
Total Expenses & Other Financing Uses $2,785,014 $3,206,918 $3,363,327 $3,363,327 $156,409 4.9%
Net Operating Income/(Loss) Incl. Capital $652,323 $58,082 $51,023 $51,023
Changes in Unrestricted Net Position
FY18 FY19 FY20
Actual Budget Approved
Beginning Unrestricted Net Position $2,078,437 $2,730,760 $2,788,842
Net Income/(Loss) $652,323 $58,082 $51,023
Ending Unrestricted Net Position $2,730,760 $2,788,842 $2,839,865
Less:
Operating Reserve (1 month) ‐$232,000 ‐$267,000 ‐$280,000
Available Unrestricted Net Position $2,498,760 $2,521,842 $2,559,865
Internal Service Funds
FY20 Budget E-34

Health Insurance Fund
FY18 FY19 FY20 FY20
Actual Budget Requested Approved $▲ %▲Revenues
Charges for Services 15,590,907 16,480,870 15,707,780 15,707,780 (773,090) ‐4.7%
Other Revenues 12,616 0 0 0 0 ‐‐
Total Revenues & Other Sources $15,603,523 $16,480,870 $15,707,780 $15,707,780 ($773,090) ‐4.7%
Expenses
Human Resources 547,601 689,883 681,313 681,313 (8,570) ‐1.2%
Other General Administration 14,282,321 15,423,259 14,666,335 14,666,335 (756,924) ‐4.9%
Total Expenses $14,829,922 $16,113,142 $15,347,648 $15,347,648 ($765,494) ‐4.8%
Other Financing Uses/Transfers Out 25,300 28,365 30,365 30,365 2,000 7.1%
Total Expenses & Other Financing Uses $14,855,222 $16,141,507 $15,378,013 $15,378,013 ($763,494) ‐4.7%
Net Operating Income/(Loss) Incl. Capital $748,301 $339,363 $329,767 $329,767
Changes in Unrestricted Net Position
FY18 FY19 FY20
Actual Budget Approved
Beginning Unrestricted Net Position ($981,977) ($233,676) $105,687
Net Income/(Loss) $748,301.00 $339,363.00 $329,767.00
Ending Unrestricted Net Position ($233,676) $105,687 $435,454
Less:
Operating Reserve (1 month) ‐$1,238,000.00 ‐$1,345,000.00 ‐$1,282,000.00
Available Unrestricted Net Position ($1,471,676) ($1,239,313) ($846,546)
Internal Service Funds
FY20 Budget E-35

Listed below are the budgeted transfers and charges for services between ACCGOV Funds. In order to avoid
"double counting" these dollars, they are subtracted from the aggregate total of all funds.
FY20 FY20
Approved Approved
General Fund Transfers to: Transfers to General Fund from:
Emergency Telephone Fund 758,044 Hotel/Motel Fund 190,000
Grant Special Revenue Fund 229,804 Sheriff Inmate Fund 35,000
Economic Dev Cap Proj Fund 200,000 Airport Fund 74,590
Special Prog Spec Rev Fund 425,450 Landfill Fund 196,277
General Capital Proj Fund 2,045,000 Transit System Fund 652,092
Public Facilities Auth Fund 518,995 Water & Sewer Fund 1,840,968
Airport Enterprise Fund 105,826 Solid Waste Fund 268,473
Transit Fund 1,810,359 Storm Water Utility Fund 379,558
Subtotal $6,093,478 Internal Support Fund 41,459
Fleet Management Fund 103,992
Insurance & Claims Fund 42,971
Landfill Transfer for Administration to: Health Insurance Fund 30,365
Solid Waste Fund 135,000 Subtotal $3,855,745
Total Interfund Transfers $10,084,223
FY20 FY20
Approved Approved
General Fund Admin. Overhead Charge to: Internal Service Fund Operations:
Building Inspection Fund 155,502 Internal Support Fund 1,926,328
Airport Fund 161,968 Fleet Management Fund 2,565,036
Landfill Fund 102,418 Fleet Replacement Fund 1,010,465
Transit System Fund 309,650 Insurance & Claims Fund 3,414,350
Water & Sewer Fund 1,233,952 Health Insurance Fund 10,380,379
Solid Waste Fund 322,811 Subtotal $19,296,558
Storm Water Utility Fund 338,900
Subtotal $2,625,201
Total Interfund Charges for Services $21,921,759
Total Interfund Transfers and Charges $32,005,982
Interfund Transfers
Charges for Services
Interfund Transfers & Charges
FY20 Budget E-36

FY18 FY19 FY20 FY20
General Fund Budget Budget Requested Approved $▲ %▲Advantage Behavioral Health 163,842 180,206 216,247 180,206 0 0.0%
Athens Community Council on Aging 287,300 287,300 287,300 287,300 0 0.0%
Athens Neighborhood Health Center 100,000 100,000 100,000 100,000 0 0.0%
Athens Regional Library System 1,916,680 2,002,263 2,049,675 2,028,197 25,934 1.3%
Clarke County Public Health Department 946,354 946,354 946,354 946,354 0 0.0%
Department of Family & Children Services 208,600 208,600 208,600 208,600 0 0.0%
Total Quasi‐Governmental $3,622,776 $3,724,723 $3,808,176 $3,750,657 $25,934 0.7%
FY18 FY19 FY20 FY20
Budget Budget Requested Approved $▲ %▲Athens Cultural Affairs Commission 21,000 21,000 21,000 21,000 0 0.0%
Athens Tutorial Program 3,500 3,500 3,500 3,500 0 0.0%
Oconee Rivers Greenway 13,000 16,500 16,500 16,500 0 0.0%
United Way of NE GA 2‐1‐1 24,402 24,402 24,402 24,402 0 0.0%
Total Community Service Agencies $61,902 $65,402 $65,402 $65,402 $0 0.0%
Total General Fund $3,684,678 $3,790,125 $3,873,578 $3,816,059 $25,934 0.7%
Hotel/Motel Tax Special Revenue Fund
FY18 FY19 FY20 FY20
Budget Budget Requested Approved $▲ %▲Classic Center Authority 1,682,990 1,845,860 2,035,875 2,035,875 190,015 10.3%
Convention & Visitors Bureau 974,020 1,068,280 1,178,250 1,178,250 109,970 10.3%
Total Hotel/Motel Fund $2,657,010 $2,914,140 $3,214,125 $3,214,125 $299,985 10.3%
Special Programs/Special Revenue Fund
FY18 FY19 FY20 FY20
Budget Budget Requested Approved $▲ %▲Project Safe, Inc. 26,000 26,000 26,000 26,000 0 0.0%
Total Special Revenue Fund $26,000 $26,000 $26,000 $26,000 $0 0.0%
Grand Total Independent Agencies $6,367,688 $6,730,265 $7,113,703 $7,056,184 $325,919 4.8%
Appropriation Summary
Independent Agencies
FY20 Budget F-1

Independent Agencies are separate legal entities or commissions not included within an Athens‐Clarke
County (ACCGOV) department budget.
Similar to ACCGOV departments, Independent Agencies were asked to provide specific descriptions &
justification details for amounts requested over FY19 Budget level.
Agency requests totaled $7,113,703, a 5.70% increase above FY19 Budget
$3,873,578 was requested from the General Fund, an increase of $83,453 or 2.2%
FY20 Budget for Independent Agencies is $7,056,184, a 4.8% increase above FY19 Budget.
Two Independent Agencies, Classic Center & Convention/Visitors Bureau (CVB), receive funding from the
Hotel/Motel tax, which is included in a separate special revenue fund.
FY20 Budget for Hotel/Motel Tax Fund is based on the current 7 percent tax rate projected to generate
revenue of $3.75 million, a 10.3% increase over the $3.4 million budgeted for FY19.
FY20 Budget includes funding amounts requested by Classic Center & Convention & Visitors Bureau
totaling $3,214,125.
Project Safe funding of $26,000, same as requested and prior year Budget, is included from the Special
Programs/Special Revenue Fund.
Additional information and the FY20 Budget amounts are provided below.
Advantage Behavioral Health Systems (ABHS) provides person‐centered community‐based services/treatment
to individuals and families experiencing mental illness, developmental disabilities, and addictions, by
collaboratively using personal, community and organizational resources.
The agency’s FY20 request was $216,247, a $36,041 increase or 20% above FY19 funding of $180,206 to
support the Homeless Day Service Center (HDSC) and street outreach activities to expand impact on the
unsheltered homeless population. This increase was requested to cover reductions in federal and state grant
funds, which have occurred in recent years.
FY20 Budget includes $180,206 for ABHS, same funding level as FY19.
Athens Community Council on Aging promotes a lifetime of wellness through advocacy and education by
providing a continuum of services to meet the needs of older adults, persons with disabilities and their
caregivers.
The agency’s FY20 Budget request totaled $287,300, the same as FY19. The amount is to go toward the
purchase of a replacement vehicle used to transport clients to daily programs, medical appointments, and on
group outings in the community for $20,000; and a portion of salary and benefits for staff in the supported
programs in the amount of $267,300.
FY20 Budget includes $287,300 as requested.
Overview
Quasi-Governmental Agencies
Independent Agencies
FY20 Budget F-2

Athens Neighborhood Health Center (ANHC) offers comprehensive, high quality primary health care, which is
affordable and accessible to the medically underserved citizens of ACCGOV. Serving the ACCGOV community
for over 48 years, ANHC remains steadfast in its commitment to provide comprehensive health care services
targeting the medically underserved, uninsured, and low‐income individuals.
The agency’s FY20 Budget request was $100,000, the same as FY19 funding level.
FY20 Budget includes $100,000 as requested.
Athens Regional Library System provides gateways to resources, which address community issues and needs
as well as preserve the history and culture of Athens‐Clarke County. The Libraries offer programs, services,
training classes, collections, and databases. There are five facilities including the main headquarters on Baxter
Street, East Athens Resource Center, Lay Park Resource Center, Pinewoods Library, and the Winterville branch.
The agency’s FY20 request was $2,049,675, an increase of $47,412 or 2.4% over the FY19 level and included:
- increase in mandatory employer share of Teacher Retirement System pension, $2,835 - 3% pay increase for Library Staff, $34,577
(or same % increase budgeted for ACCGOV employees)
- 8.5 hours of security presence per week at Baxter Street headquarters, $10,000 FY20 Budget includes $2,028,197 for the Library System, $25,934 above FY19 Budget.
Clarke County Public Health Department is a state agency providing core public services that promote and
protect the health of citizens and enhance quality of life for all residents. ACCGOV funding helps support two
Teen Matters clinics, one adjacent to each Clarke County School District high school (Clarke Central and Cedar
Shoals).
The agency’s FY20 request totaled $946,354, the same funding level as FY19. FY20 requested funding covers
approximately 33% of the Health Department’s salary and benefit expenses as well as approximately 20% of
the agency’s overall budget.
FY20 Budget for the Health Department is $946,354 as requested.
Department of Family & Children Services (DFCS) delivers local, state and federal assistance to vulnerable
families in the community. The mission of DFCS is to provide these services in such a way that it strengthens
families by helping them to become safer and financially self‐sufficient. The agency provides financial assistance
such as Food Stamps, Medicaid, Temporary Assistance for Needy Families (TANF) and serves children in the
Foster Care System. The two major program areas are Social Services (Child Welfare) and Economic Support.
The agency’s FY20 request was $208,600, the same funding level as FY19, to support:
‐ Child Protective Services/Foster Care Program, $26,000
‐ Emergency financial assistance to any qualifying citizen of Athens‐Clarke County, $35,000
‐ Staff positions to support critical functions of child safety and family stability, $115,877
‐ Other administrative expenses, $31,723
FY20 Budget for DFCS is $208,600 as requested.
Independent Agencies
FY20 Budget F-3
Athens Cultural Affairs Commission (ACAC) is responsible for advising the Mayor and Commission with
respect to all aspects of planning, programming, procurement, installation, operation, inventory and
maintenance of public art projects and artworks, including art donations, commissions, and temporary
projects.
The agency’s FY20 request was $21,000, same funding level as FY19.
FY20 Budget for ACAC is $21,000 as requested.
Athens Tutorial Program has provided academic enrichment services for school age children in the East
Athens community since 1981. The program provides afterschool one‐on‐one assistance with homework,
preparation for tests, career exploration, cultural enrichment, and life skills development. Services are
provided from tutorial centers at the East Athens Center on McKinley Street, as well as Howard B Stroud and
Gaines elementary schools.
The agency’s FY20 request was $3,500, the same funding level as FY19.
FY20 Budget for Athens Tutorial is $3,500 as requested.
Oconee Rivers Greenway Commission advises the Mayor and Commission on the protection of the natural
resources of the North and Middle Oconee Rivers and their major tributaries and floodplains for the benefit of
Athens Clarke County citizens.
The agency’s FY20 request was $16,500, the same level as FY19 funding, to support:
‐ Greenway Network Planning, $2,000
‐ Partnerships for Greenway Protection, $3,500
‐ Greenway Improvement/Management, $4,500
‐ Educational Grants, $1,000
‐ Public Info/Interpretation, $4,000
‐ ORGC Member Education & Development, $1,000
‐ Office Supplies, Reproduction, etc., $500
FY20 Budget for Oconee Rivers Greenway is $16,500 as requested.
United Way of NE Georgia 2‐1‐1 program seeks to motivate and mobilize resources to meet the highest
priority needs for those living in Northeast Georgia by providing access to quality information and referrals.
FY20 Services and Programs will include 2‐1‐1 Resource Navigation, Resource Directory, as well as Education &
Outreach.
The agency’s FY20 request totaled $24,402, the same level as FY19
FY20 Budget for United Way 2‐1‐1 program is $24,402 as requested.
Community Service Agencies
Independent Agencies
FY20 Budget F-4

During FY20, the seven percent Hotel/Motel Tax is projected to generate approximately $3.75 million, an
increase of 10.3% over the $3.4 million budgeted for FY19.
Classic Center Authority seeks to enhance the quality of life in Athens‐Clarke County by serving as the cultural, civic, and social center for the southeast and by generating maximum economic impact. Convention & Visitors Bureau (CVB) is a proactive destination marketing organization charged with increasing the economic impact of the hospitality industry, with active involvement in tourism product development and workforce development. FY20 Budget includes a request for six of the seven percent Hotel/Motel Tax collections to support the operations of the Classic Center and CVB consistent with previous year funding levels as follows:
Classic Center Authority $2,035,875 CVB $1,178,250 $3,214,125
This is a total increase of $299,985 or 10.3% above FY19 budgeted levels.
Project Safe, Inc. works to end domestic violence through crisis intervention, ongoing supportive services,
prevention education, and systems change advocacy. The agency offers comprehensive services in order to
reduce incidents of domestic violence and increase victims’ access to safety and justice.
The agency’s FY20 request was $26,000 from the Special Programs/Special Revenue Fund (5% Crime Victims
Assistance revenue), equal to the FY19 funding level. This request is to support approximately 40% of the
agency’s volunteer program to recruit, train, and place those willing to serve. A portion of the funding
($8,500/year) is to provide grant match for victim outreach services and batterer accountability tracking in
Athens‐Clarke County.
FY20 Budget for Project Safe is $26,000 as requested.
Hotel/Motel Funded Agencies
Special Programs/Special Revenue Fund
Independent Agencies
FY20 Budget F-5

Geography • Approximately 122 square miles (78,000 acres) • Smallest in land area of Georgia’s 159 counties • Approximately 65 miles northeast of Atlanta History • Clarke County created from Jackson County in 1801 and named for Revolutionary War General Elijah Clarke • Town of Athens chartered in 1806 and was named for Greek city of learning • Clarke County and City of Athens Unified on January 14, 1991, becoming the 2nd consolidated government in
Georgia and 28th in the nation • 34 landmarks and 16 neighborhoods are listed on the National Register of Historic Places. Demographics (2015-2018 estimate unless noted) • Population: 127,330 (2018 Estimate) • Median Household Income: $34,258 • Median Age: 27.2 • White: 65.2% | Black or African-American: 28.6% | Asian: 5.2% | Other: 3.5% |Hispanic or Latino: 10.7% • High school graduates (ages 25+): 86.6% • Bachelor’s degree or higher (ages 25+): 41.3% • Persons below poverty: 34.4% • Unemployment rate: 3.2% (Nov 2018 as reported by the Georgia Department of Labor) • Total registered voters as of 4/15/19: 81,046 (72,652 active) Major Attractions • University of Georgia; State Botanical Garden; Historic Homes; Downtown Athens; Morton Theater;
Georgia Museum of Art; Classic Center (Convention Center & Theater) Health • Public Hospital – 1; Private Hospital – 1; Doctors – 310+; Dentists – 40+; Mental Health Practitioners – 60+;
Ambulance Services – 7; Nursing Homes / Assisted Living – 9 Recreation • Tennis Courts – 13; Parks – 16; Golf Courses – 4; Swimming Pools – 6; Country Clubs – 2; Zoos – 1 • City and University of Georgia performing arts centers: theater groups, symphony, dance, drama, art groups;
Other university cultural activities including State Botanical Garden and Georgia Museum of Art; Convention center with concerts, dance, drama and comedy acts.
Transportation • Airport – 1; Bus Depot – 1 (served by Southeastern Stages); Public Transit System – 1; University of Georgia
Transit System – 1; Megabus – 1; Groome Transportation Public Accommodations • Lodging – 25; Restaurants – 150+; Conference Centers/Meeting Facilities – 8; Civic Center – 1; Enclosed Malls – 1
Athens-Clarke County by the Numbers
FY20 Budget G-1

ACC Unified Government • Legislative: Elected Mayor and 10 elected Commissioners from 10 geographical districts. • Executive: Day-to-day operations are overseen by a manager appointed by the mayor and commission. There
are 26 main departments, divisions, and offices under the managerial group. • Judicial: Athens-Clarke County houses Magistrate, Juvenile, Municipal, Probate, State, and Superior Courts.
The Superior Court covers the Western Judicial Circuit, which also includes Oconee County. ACC Unified Government • ACC government positions (FY20 – Commission Approved): 1,691 • ACC employees per 1000 residents: 13.3 (FY20) • Web site: www.accgov.com • Television: ACTV Channel 180 (Charter Cable) Education • Clarke County School District is separate from the Unified Government • Public schools: 14 elementary, 4 middle, 3 high schools • Private schools: 6 • Higher education: The University of Georgia, Athens Area Technical College, Piedmont College Extension. Principal Employers No. of Employees
University of Georgia 10,700 Piedmont Athens Regional 3,300 Clarke County School District 2,400 St. Mary’s Health Care 2,090 Athens-Clarke County Unified Government 1,691 Pilgrim’s 1,650 Other Figures • Sales tax (2019): 8% 4% - State of Georgia 1% - SPLOST (Special Purpose Local Option Sales Tax) Projects 1% - LOST (Local Option Sales Tax) ACC General Fund 1% - ELOST (Education Special Purpose Local Option Sales Tax) Projects 1% - TSPLOST (Transportation Special Purpose Local Option Sales Tax) – added as of April 1, 2018 Miscellaneous • Sister cities: Cortona, Italy (1978), Lasi, Romania (2001) • Official tree: Gingko (1964) • Official flower: Iris (1964) Information provided by the Georgia County Guide Online, Georgia Department of Labor, Georgia Department of Community Affairs, United States Census Bureau, GeorgiaFacts.net and Athens-Clarke County Unified Government Departments, University of Georgia website, Clarke County School District website.
Athens-Clarke County by the Numbers
FY20 Budget G-2

Programs and activities planned for FY20 from the Community Development Block Grant (CDBG) and HOME Grant appropriation, as approved by the Mayor and Commission on April 2, 2019, are listed below. CDBG and HOME grants are programs funded from the U. S. Department of Housing and Urban Development. These federal funds are directed toward community development programs in the areas of affordable housing, economic development, and public service. CDBG Funding Available for FY20 (July 1, 2019 - June 30, 2020) ………………………………………………………..$1,255,988
1. Athens Area Habitat for Humanity ………………...…………………………………….....................................$214,600
Complete 6 Brush with Kindness repairs, build 10 emergency handicap accessibility ramps, 43 ReNew
Athens rentals, and build/repair 2 houses for homeowners.
2. Athens-Clarke Heritage Foundation…………….……………………………………………………………………………..$65,000
Repair 16 owner-occupied historic homes
3. Athens Housing Authority……………………..…………………………………………………..………………...............$150,000
Acquire 2 properties for redevelopment of affordable housing (1 vacant lot and 1 lot with a dilapidated
structure to be demolished).
4. Athens Land Trust……………………..……………………………………………………………………………………………..$211,392
Acquire 2 - 4 properties, rehabilitate or construct 5 -7 units of affordable housing.
Total Affordable Housing ………………………………………………………………………………………………………………..$640,992* *Includes $44,600 additional CDBG funds carried forward from prior year
5. Athens Land Trust.......................................................................................................................... $90,000
Business coaching for 25 low-to-moderate income West Broad Farmers Market vendors, 15
microenterprise owners/vendors, and 12 Young Urban Farmer high school students
6. East Athens Development Corporation, Inc. ................................................................................. $50,000
Nursing Assistant training for 30 residents and Phlebotomy training for 10 East Athens residents
7. East Athens Development Corporation, Inc....................................................................................$20,000
East Athens Academic Achievement Program through Athens Tutorial and Chess & Community for 65
children
8. Goodwill of North Georgia............................................................................................................. $60,000
Micro-enterprise training for 30 low-income entrepreneurs and existing businesses
Total Economic Development and Neighborhood Revitalization …………………………………………………..$220,000
Overview
Affordable Housing Objectives
Micro-enterprise, Economic Development & Neighborhood Revitalization Objectives
FY20 CDBG & HOME
FY20 Budget G-3

9. Advantage Behavioral Health Systems............................................................................................$30,000
Case management and rapid rehousing assistance to 35 individuals through Advantage Homeless Day Service Center 10. Athens Area Homeless Shelter....................................................................................................... $20,000
Case management for 28 families at the ARCH facility
11. Athens Community Council on Aging............................................................................................. $20,000
Transportation Demand Response Program for 225 elder and/or disabled residents
12. Athens Land Trust.......................................................................................................................... $38,398
Comprehensive housing counseling and education services to 294 residents
13. Casa de Amistad............................................................................................................................. $20,000
ESL and Spanish GED services for 80 individuals
14. The Ark UMOC................................................................................................................................ $20,000
Common Wealth Athens Program –Financial literacy and Emergency Loan for 200 residents
15. Chess and Community Conference.................................................................................................$20,000
After school educational and employment enrichment for 60 youth ages 11-17
16. Feed My Sheep................................................................................................................................$10,000
Tutoring program for 35 children attending Gaines Elementary School
17. YWCO............................................................................................................................................ ..$10,000
Summer girls club program for 300 girls, ages 5-14
Total Public Services ………………………………………………………………………………………………………………………..$188,398
Total Administration ………………………………………………………………………………………………………………..……..$251,198
_______________________________________________________________________
Total Proposed FY20 CDBG Expenditures………………………………………....….…$1,255,988* *Does not include carried forward from prior year
Public Service Objectives – Subject to the 15% Cap
Administration
FY20 CDBG & HOME
FY20 Budget G-4

HOME Funding Available for FY20 (July 1, 2019 - June 30, 2020) …………………………………………………………..$467,256
1. Housing and Community Development ….……………………………………………………………………………………..$420,521 To maximize the impact of HOME program funds and leverage public and private resources, HOME funds
will be available as “gap financing” for eligible housing activities under the HOME Investment Partnership Program. In order to maintain compliance with HOME regulations and utilizing the maximum allowable subsidy for individual units, HOME funds may also be made available to open projects that are approaching non-compliance with portions of the recently revised HOME Final Rule. Applications for HOME funds will be accepted on a “first come, funds available” basis on affordable housing developments where:
- the proposed property site has been identified;
- total development costs have been projected (including sales price and/or rental rates);
- additional financial resources have been secured and committed. This will enable HCD to determine the actual investment of HOME funds required to make the development financially feasible and provide increased housing opportunities for decent, safe, and affordable housing for low to moderate income households in Athens-Clarke County. 2. Administration……………………………………………………………………………………………………………..…………………..... $46,725
HCD administration of HOME program (10% cap)
TOTAL PROPOSED FY20 HOME EXPENDITURES……………………………..……….……….$467,246
HOME Grant Appropriation
FY20 CDBG & HOME
FY20 Budget G-5

Athens‐Clarke County is currently well within the debt limits established under Georgia Law. Georgia Law limits a county's indebtedness to 10% of the assessed value of all taxable property located within the county. Only General Obligation Bonds, which are repaid by property tax revenues, fall under the legal debt limit. Revenue Bonds are to be repaid from specific revenue sources and do not fall under the legal debt limit. Computation of Legal Debt Margin
Estimated Net Assessed Value of Taxable Property $ 4,300,000,000 (1) Debt Limit (10% of Assessed Value) $ 430,000,000 General Obligation Bonds outstanding $ 0
Debt Margin $ 430,000,000
(1) – Estimated Net Assessed Value of Taxable Property for 2019. Below is a summary of the debt service obligations of Athens‐Clarke County as of July 1, 2019. These obligations represent the annual installment payments of principal and interest for previous capital improvement projects or acquisitions funded through the issuance of debt. The following is a description of each obligation outstanding for FY20. General Obligation Bonds: 2013 Jail Expansion
Purpose: Expand the Jail
Interest Rate: 2 to 4%
Maturity Date: 2019
Original Principal Amount: $52,380,000
July 1, 2019 Principal Outstanding: $0
Funding Source: SPLOST 2011 Revenue Revenue Bonds: 2012 Economic Development Authority (Caterpillar Project)
Purpose: Construct infrastructure improvements for Caterpillar project
Interest Rate: 2 to 5%
Maturity Date: 2032
Original Principal Amount: $5,475,000
July 1, 2019 Principal Outstanding: $4,900,000
Funding Source: General Fund Revenue
Debt Service Requirements
FY20 Budget G-6

2007 Georgia Environmental Finance Authority (Clean Water State Revolving Loan Fund – Ph I)
Purpose: Interceptor sewer line projects
Interest Rate: 3%
Maturity Date: 2031
Original Principal Amount: $14,772,863
July 1, 2019 Principal Outstanding: $9,319,132
Funding Source: Water and Sewer Service Fees 2009 Georgia Environmental Finance Authority (Clean Water State Revolving Loan Fund– Ph 2)
Purpose: Interceptor sewer line projects
Interest Rate: 3%
Maturity Date: 2033
Original Principal Amount: $4,469,301
July 1, 2019 Principal Outstanding: $3,232,055
Funding Source: Water and Sewer Service Fees 2017 Georgia Environmental Finance Authority (Clean Water State Revolving Loan Fund)
Purpose: Purchase land designated as greenspace.
Interest Rate: 0.5%
Maturity Date: 2028
Original Principal Amount: $500,000
July 1, 2019 Principal Outstanding: $323,007
Funding Source: Special Purpose Local Option Sales Tax 2015 Water and Sewerage Revenue Bonds
Purpose: Construct Water & Sewerage System and facility improvements and expansions
Interest Rate: 1 to 5%
Maturity Date: 2038
Original Principal Amount: $210,140,000
July 1, 2019 Principal Outstanding: $189,810,000
Funding Source: Water and Sewer Service Fees Other Long Term Debt: 2011 ADDA ‐ Parking Deck Guaranteed Revenue Debt
Purpose: Construct Downtown Parking Deck
Interest Rate: 3.51%
Maturity Date: 2026
Original Principal Amount: $6,131,700
July 1, 2019 Principal Outstanding: $3,317,800
Funding Source: General Fund – Parking Fees
Debt Service Requirements
FY20 Budget G-7
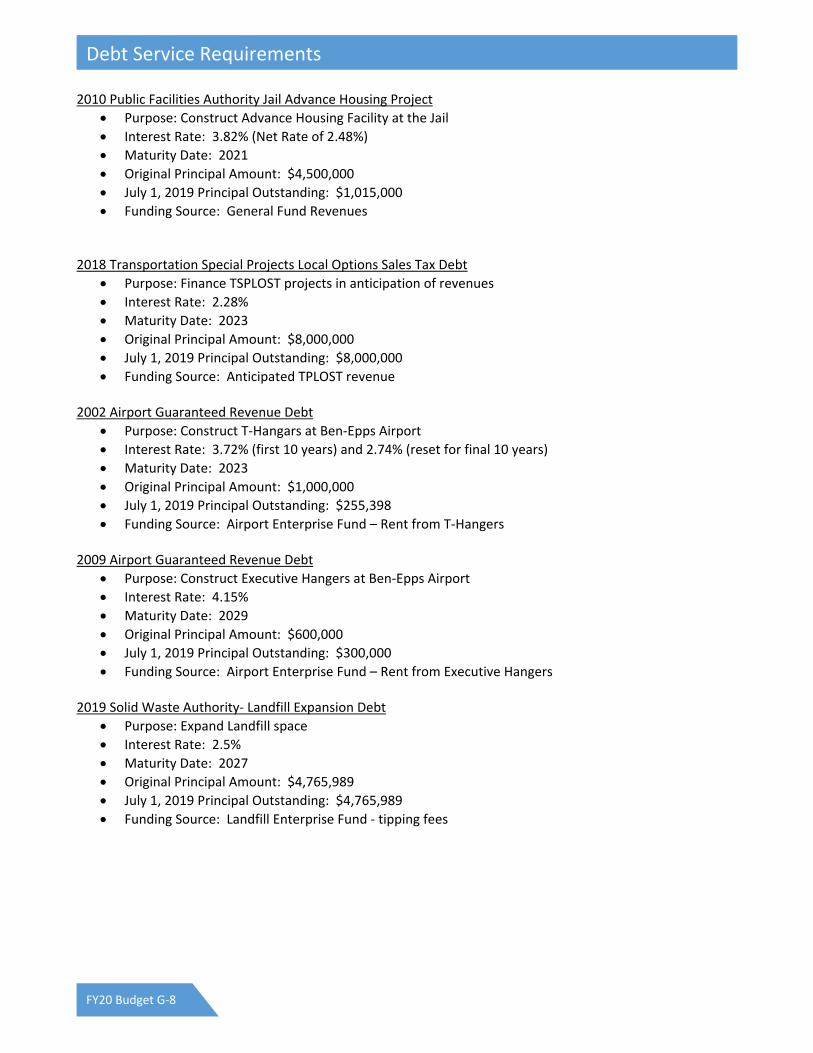
2010 Public Facilities Authority Jail Advance Housing Project
Purpose: Construct Advance Housing Facility at the Jail
Interest Rate: 3.82% (Net Rate of 2.48%)
Maturity Date: 2021
Original Principal Amount: $4,500,000
July 1, 2019 Principal Outstanding: $1,015,000
Funding Source: General Fund Revenues 2018 Transportation Special Projects Local Options Sales Tax Debt
Purpose: Finance TSPLOST projects in anticipation of revenues
Interest Rate: 2.28%
Maturity Date: 2023
Original Principal Amount: $8,000,000
July 1, 2019 Principal Outstanding: $8,000,000
Funding Source: Anticipated TPLOST revenue 2002 Airport Guaranteed Revenue Debt
Purpose: Construct T‐Hangars at Ben‐Epps Airport
Interest Rate: 3.72% (first 10 years) and 2.74% (reset for final 10 years)
Maturity Date: 2023
Original Principal Amount: $1,000,000
July 1, 2019 Principal Outstanding: $255,398
Funding Source: Airport Enterprise Fund – Rent from T‐Hangers 2009 Airport Guaranteed Revenue Debt
Purpose: Construct Executive Hangers at Ben‐Epps Airport
Interest Rate: 4.15%
Maturity Date: 2029
Original Principal Amount: $600,000
July 1, 2019 Principal Outstanding: $300,000
Funding Source: Airport Enterprise Fund – Rent from Executive Hangers
2019 Solid Waste Authority‐ Landfill Expansion Debt
Purpose: Expand Landfill space
Interest Rate: 2.5%
Maturity Date: 2027
Original Principal Amount: $4,765,989
July 1, 2019 Principal Outstanding: $4,765,989
Funding Source: Landfill Enterprise Fund ‐ tipping fees
Debt Service Requirements
FY20 Budget G-8

FISCAL POLICIES OF ATHENS-CLARKE COUNTY, GEORGIA LAST REVISED BY MAYOR AND COMMISSION ON DECEMBER 1,1998
Fiscal Policies
FY20 Budget G-9

1. The Unified Government will finance all current expenditures with current revenues. The Unified
Government will avoid budgetary procedures that balance current expenditures through the obligation of future resources. The Unified Government will not use short‐term borrowing to meet operating budget requirements.
2. The operating budget will provide for adequate maintenance of capital equipment and facilities and
for their orderly replacement. 3. All Governmental Funds are subject to the annual budget process. Budgets will be prepared for
Proprietary Funds (Enterprise and Internal Service) to establish fees and charges and control expenses. 4. The budget must be balanced for all budgeted funds. Total anticipated revenues and other resources
available must equal total estimated expenditures for each fund. 5. All budgets will be adopted on a basis of accounting consistent with Generally Accepted Accounting
Principles (GAAP). Revenues are budgeted when they become measurable and available and expenditures are charged against the budget when they become measurable, a liability has been incurred, and the liability will be liquidated with current resources.
6. All unencumbered operating budget appropriations will lapse at year‐end. Encumbered balances will
be re‐appropriated in the following fiscal period in accordance with Generally Accepted Accounting Principles.
7. The budget shall be adopted at the legal level of budgetary control which is the fund/department level
(i.e., expenditures may not exceed the total for any department within a fund). Transfers of appropriations within a Department shall require only the approval of the Budget Officer. Transfers between departments or funds, an increase of a personal services appropriation, or an increase in the level of authorized positions shall require the approval of the Mayor and Chair and Commission in accordance with Section 7‐408 of the Unified Government charter. Department heads and management personnel are directed to operate within budget limitations to prevent "emergency" situations.
8. The Unified Government will strive to include an amount in the General Fund budget approved by the
Mayor and Chair and Commission (i.e., a line item for contingencies) for unforeseen (e.g., emergency type) operating expenditures. The amount of the contingency will be no more than 5% of the operating budget.
9. The Unified Government will integrate performance measurement and objectives and productivity
indicators within the budget. 10. The Unified Government will maintain a budgetary control system to ensure adherence to the budget
and will prepare timely financial reports comparing actual revenues, expenditures and encumbrances with budgeted amounts.
Operating Budget Policies
Fiscal Policies
FY20 Budget G-10

11. The operating budget shall be developed to control both the direct and indirect costs of programs and
services whenever practical. 12. The Unified Government shall comply with all state laws applicable to budget hearings, public notices,
public inspection, and budget adoption. 13. Enterprise and Internal Service fund budgets shall be self supporting whenever possible. Excess
revenues of Enterprise funds shall not be transferred to other funds unless authorized in the Annual Budget.
1. Capital projects will be undertaken to: A. Preserve infrastructure and public facilities. B. Promote economic development and enhance the quality of life. C. Improve the delivery of services. D. Preserve community and historical assets. E. Improve economically depressed areas and those with low and moderate income households. 2. The Unified Government will develop a five year Capital Improvement Program (CIP) and update the
CIP annually to direct the financing of and appropriations for all capital projects. The Unified Government defines a capital project for inclusion in the CIP as any asset or project in excess of $30,000 with an estimated useful life of three years.
3. The Unified Government will coordinate the development of the Capital Improvement Program with
the development of the operating budget to insure that future operating costs are projected and included in the operating budget where appropriate.
4. The Unified Government will develop a program to replace authorized vehicles and equipment without
significant impact to the capital budget. 5. The Unified Government will aggressively seek public and private grants, contracts, and other outside
sources of revenue to fund projects included in the Capital Improvement Program. 6. The balances of appropriations for capital projects will be designated by management at yearend and
re‐appropriated in the following years until the project is completed. 7. Proprietary Funds will depreciate capital assets in accordance with GAAP and all annual depreciation
amounts available from earnings will be appropriated for replacement of existing capital plant and equipment.
8. Unreserved, undesignated fund balances for governmental funds should be used only for one time
capital non‐operating expenditures as appropriated by governing authority.
Capital Budget Policies
Fiscal Policies
FY20 Budget G-11

1. The Unified Government will strive to accumulate a General Fund working reserve at least equal to
one month of the total General Fund budget. This reserve shall be created and maintained to provide the capacity to:
A. Offset significant downturns and revision in any general government activity. B. Provide sufficient working capital. C. Provide a sufficient cash flow for current financial needs at all times. 2. The Unified Government will maintain reserves in compliance with all debt service requirements to
maintain bond ratings and the marketability of bonds. 3. The Unified Government will accumulate sufficient cash reserves in Enterprise Funds to equal three
months of operating expenses to provide sufficient working capital without short‐term borrowing. 4. In periods of economic decline and recessionary periods, the Unified Government will reduce
expenditures and direct reserve funds using the following sequence of actions: A. Reduce or eliminate current year funding for the Capital Additions and Improvements Program; B. Reduce or eliminate current year funding for Capital Maintenance and Repair projects and fund
essential Maintenance and Repair Projects; C. Utilize General Fund Working Reserve to sustain essential services; D. And if necessary, reduce essential services
1. The Unified Government will try to maintain a diversified and stable revenue system to shelter it from
short‐run fluctuations in any one revenue source. The revenue mix should combine elastic and inelastic revenue sources to minimize the effect of an economic downturn.
2. The Unified Government will estimate its revenues by an objective analytical process in a prudent
manner. 3. The Unified Government will follow a policy of paying for services with user charges when possible to
reduce the reliance on taxes and other general revenue sources. 4. The Unified Government will aggressively seek public and private grants, contracts, and other outside
sources of revenues for funding projects where appropriate.
Reserve Fund Policies
Revenue Administration Policies
Fiscal Policies
FY20 Budget G-12

5. The Unified Government will establish the levels of all user charges based on an analysis of the cost of
providing the services. User charges will be evaluated annually. 6. The Unified Government will set fees charges for each Enterprise and Internal Service Fund, at a level
that fully supports the total direct and indirect cost of the activity. Indirect costs include the cost of annual depreciation of capital assets and requirements for future capital costs.
1. An independent audit in compliance with Generally Accepted Audit Standards will be performed
annually by a qualified external auditor in accordance with GA. Code 36‐81‐7 and Section 7‐411 of the charter.
2. The Unified Government will maintain a strong internal audit function to conduct: financial,
operational, compliance, and performance audits. 3. The Unified Government will prepare a Comprehensive Annual Financial Report in accordance with
Generally Accepted Accounting Principles (GAAP). The Unified Government will strive to prepare the Comprehensive Annual Financial Report to meet the standards of the GFOA Certificate of Achievement in Financial Reporting Program.
4. The Unified Government will establish and maintain a high degree of accounting practice, accounting
systems will conform to Generally Accepted Accounting Principles. 5. The Unified Government will maintain accurate records of all assets to insure a high degree of
stewardship for public property. 6. The Unified Government will develop an ongoing system of financial reporting to meet the needs of
the governing authority, the manager, department heads, and the general public. Reporting systems will monitor the cost of providing services where possible. The reporting systems will promote budgetary control and comparative analysis.
1. The Unified Government will confine long‐term borrowing to capital improvements and moral
obligations. 2. The Unified Government will not use short‐term debt for operating purposes. 3. The Unified Government will follow a policy of full disclosure on every financial report and bond
prospectus. 4. General obligation debt will not be used for enterprise activities.
Accounting, Auditing, & Financial Reporting
Debt Policies
Fiscal Policies
FY20 Budget G-13

5. The Unified Government will use voted general obligation debt to fund general purpose public
improvements which cannot be financed from current revenues, available fund balances, or other current sources of capital financing.
6. Enterprise Fund debt will be used only when revenues are sufficient to satisfy operating expenses and
debt service requirements. 7. The Unified Government will limit the use of lease purchase and other short term debt when possible.
1. The Unified Government will maintain an aggressive program of investing all government funds under
the direction of the Manager or designate. 2. All investments shall be made with consideration for environmental and human rights impact. 3. The investment program shall be operated based on the following principles, in the order listed. A. Legality ‐ all investments comply with state and local laws. B. Safety ‐ principal is protected from loss with secure investment practices and collateralization. C. Liquidity ‐ investments are readily convertible to cash when needed without losses. D. Yield or Return on Investment ‐ earnings are maximized without diminishing the other principles. 4. The investment program shall comply with all Georgia laws and federal/state regulations for investing
public funds and safekeeping/security requirements. 5. The investment program should use a competitive selection process for investments in excess of 30
days. Investments should be placed with only qualified financial institutions. 6. The investment program should provide for a system of internal control over investments and timely
financial reporting over investing activities.
1. It is the intent of the governing authority of the Unified Government of Athens‐Clarke County, Georgia,
to establish uniform regulations and procedures to provide for an efficient and fiscally responsible system for the purchase of materials and services necessary for the effective operations of the Unified Government. The administration of this system will comply with the highest ethical and fiscal standards and applicable laws.
2. The Manager shall be responsible for the operation of the Unified Government's purchasing system.
Investment Policies
Purchasing Policies
Fiscal Policies
FY20 Budget G-14

3. All departments and agencies of the Unified Government must utilize competitive bidding procedures,
as specified in an ordinance adopted by Commission. Bids will be awarded on a nondiscriminatory basis with appropriate efforts to include local and minority businesses.
4. The Unified Government will strive to obtain the highest quality of goods and services for the most
economical costs. Bulk purchases, quantity discounts, standardization of common items, and other approaches will be used to economically acquire goods and services.
Fiscal Policies
FY20 Budget G-15
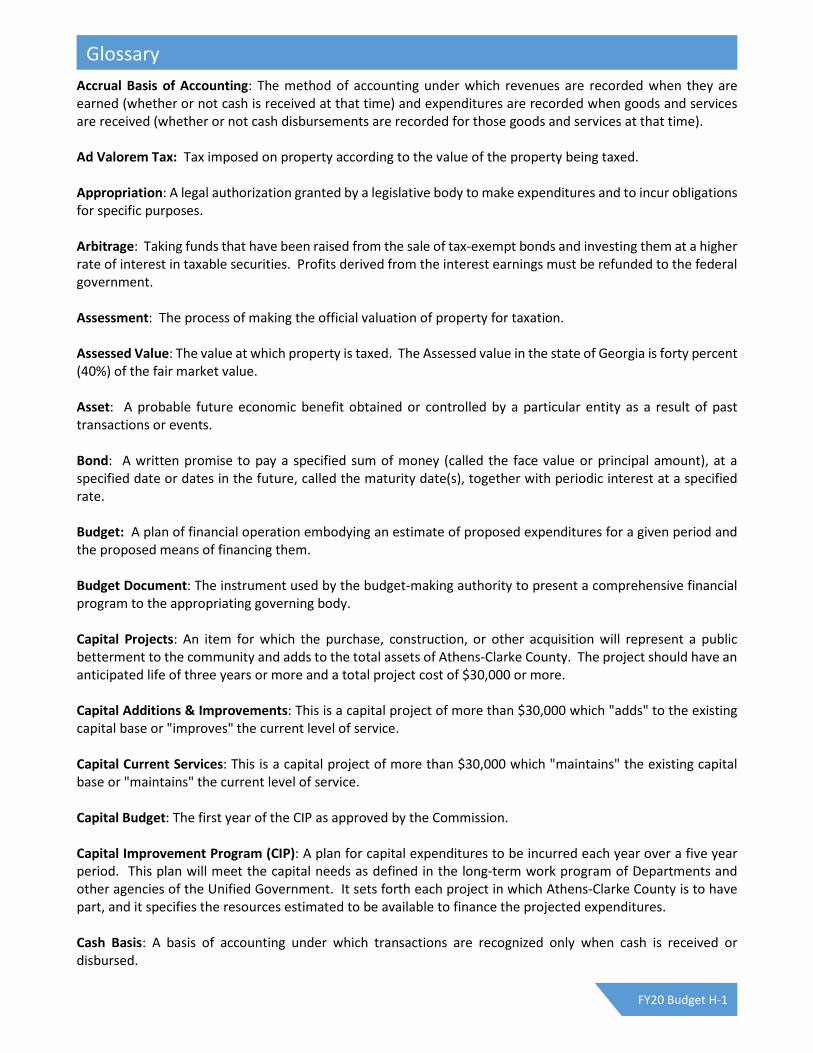
Accrual Basis of Accounting: The method of accounting under which revenues are recorded when they are earned (whether or not cash is received at that time) and expenditures are recorded when goods and services are received (whether or not cash disbursements are recorded for those goods and services at that time). Ad Valorem Tax: Tax imposed on property according to the value of the property being taxed. Appropriation: A legal authorization granted by a legislative body to make expenditures and to incur obligations for specific purposes. Arbitrage: Taking funds that have been raised from the sale of tax-exempt bonds and investing them at a higher rate of interest in taxable securities. Profits derived from the interest earnings must be refunded to the federal government. Assessment: The process of making the official valuation of property for taxation. Assessed Value: The value at which property is taxed. The Assessed value in the state of Georgia is forty percent (40%) of the fair market value. Asset: A probable future economic benefit obtained or controlled by a particular entity as a result of past transactions or events. Bond: A written promise to pay a specified sum of money (called the face value or principal amount), at a specified date or dates in the future, called the maturity date(s), together with periodic interest at a specified rate. Budget: A plan of financial operation embodying an estimate of proposed expenditures for a given period and the proposed means of financing them. Budget Document: The instrument used by the budget-making authority to present a comprehensive financial program to the appropriating governing body. Capital Projects: An item for which the purchase, construction, or other acquisition will represent a public betterment to the community and adds to the total assets of Athens-Clarke County. The project should have an anticipated life of three years or more and a total project cost of $30,000 or more. Capital Additions & Improvements: This is a capital project of more than $30,000 which "adds" to the existing capital base or "improves" the current level of service. Capital Current Services: This is a capital project of more than $30,000 which "maintains" the existing capital base or "maintains" the current level of service. Capital Budget: The first year of the CIP as approved by the Commission. Capital Improvement Program (CIP): A plan for capital expenditures to be incurred each year over a five year period. This plan will meet the capital needs as defined in the long-term work program of Departments and other agencies of the Unified Government. It sets forth each project in which Athens-Clarke County is to have part, and it specifies the resources estimated to be available to finance the projected expenditures. Cash Basis: A basis of accounting under which transactions are recognized only when cash is received or disbursed.
Glossary
FY20 Budget H-1

Community Development Block Grant (CDBG): A federal domestic assistance grant to develop viable urban communities by providing adequate housing and a suitable living environment as well as expanding economic opportunities for persons of low and moderate income. Contingency: Those funds included in the budget for the purpose of providing a means to cover unexpected costs during the budget year. These funds can only be expended with Manager and/or Commission approval. Debt: An obligation resulting from the borrowing of money or from the purchase of goods and services. Delta▲: In this document, the delta symbol is used to represent change from prior year. Department: A major unit of organization in Athens-Clarke County comprised of subunits named divisions or cost centers and responsible for the provision of a specific package of services. Depreciation: The portion of the cost of a fixed asset charged as an expense during a particular period. The cost of a fixed asset, less any salvage value, is prorated over the estimated service life of such an asset, and each period is charged with a portion of such cost. Encumbrance: Commitment related to an unperformed contract for goods and services. Encumbered funds may not be used for any other purpose. Enterprise Funds: A fund established to account for operations that are financed and operated in a manner similar to private enterprise - where the intent of the governing body is to provide goods or services to the general public, charging user fees to recover financing costs. Examples are public utilities and airports. Expendable Trust Funds: A trust fund whose resources, including both principal and earnings, may be expended. Expenditures: Decreases in net financial resources. Expenditures include current operating expenses requiring the present or future use of net current assets, debt service and capital outlay, and intergovernmental grants, entitlement and shared revenues. Fiscal Year (FY): The twelve-month period to which the annual operating budget applies. In Athens-Clarke County this is July 1 to June 30. Franchise Fees: A fee levied on utilities in exchange for allowing the utilities the use of public right-of-way. Fringe Benefits: Expenditures related to employee benefits such as Vacation, Sick Leave, and Health Insurance. Fund: An independent fiscal and accounting entity with self-balancing set of accounts recording cash and/or other resources together with all related liabilities, obligations, reserves and equities which are segregated for the purpose of carrying on specific activities or attaining certain objectives. General Service District: This district consists of the total area of Clarke County. Generally Accepted Accounting Principles (GAAP): Uniform minimum standards for financial accounting and recording, encompassing the conventions, rules, and procedures that define accepted accounting principles. General Fund: The fund used to account for all financial resources, except those required to be accounted for in another fund.
Glossary
FY20 Budget H-2

General Obligation Bonds: Bonds backed by the full faith and credit of government. Grant: A contribution of assets (usually cash) from one governmental unit or organization to another. Typically, these contributions are made to local governments from the state or federal governments to be used for specific purposes and require distinctive reporting. Goal: The Goal statements included in Department budget requests are designed to inform the reader of the department's expectations for improvement, change, and/or growth in service level and activities. A goal is a standard against which to measure progress. Governmental Funds: This category of funds includes typical governmental activities and includes funds such as the General Fund, Special Revenue Funds, and the Debt Service Fund. These funds are set up to measure current expendable financial resources (only current assets and current liabilities) and uses the modified accrual basis of accounting. Homestead Exemption: A tax relief measure whereby state law permits local governments to exempt a fixed dollar amount of appraised value of qualifying residential property. Independent Agencies: Separate legal entities or commissions not included within an Athens-Clarke County (ACCGOV) department. Internal Service Fund: Funds used to account for the financing of goods or services provided by one department or agency to another department or agency of a government on a cost reimbursement basis. Lease-purchase Agreements: Contractual agreements that are termed leases, but that in substance are purchase contracts. Levy: To impose taxes, special assessments or service charges for the support of government activities. Liabilities: Probable future sacrifices of economic benefits, arising from present obligations of a particular entity to transfer assets or provide services to other entities in the future as a result of past transactions or events. Line Item Budget: Listing of each category of expenditures and revenues by fund, agency, department, division and or cost center. L.O.S.T. (Local Option Sales Tax): Tax levied at the rate of one percent which applies to the same items as the State sales tax, except that the local option sales tax also applies to sales of motor fuels. Mill: One one-thousandth of a dollar of assessed value. A tax rate of one mill produces one dollar of taxes for each $1,000 of assessed property valuation. Millage: Rate used in calculating taxes based upon the value of property, expressed in mills per dollar of property value. Mission: The Mission statements included in Department budget requests are designed to inform the reader of the department's essential functions or activities/responsibilities/tasks they are charged to accomplish, as well as, the major services they provide.
Glossary
FY20 Budget H-3

Modified Accrual Basis: The accrual basis of accounting adapted to the governmental fund-type measurement focus. Under it, revenues and other financial resource increments are recognized when they become susceptible to accrual, that is when they become both "measurable" and "available to finance expenditures of the current period." Net Position: The difference between (a) assets and deferred outflows of resources and (b) liabilities and deferred inflows of resources. OPEB (Other Post-Employment Benefits): Non-pension benefits provided to employees after employment ends such as health insurance coverage for retirees, dental insurance, life insurance and term care coverage. Operating Budget: Plans of current expenditures and the proposed means of financing them. Performance Measures: Specific quantitative productivity measures of work performed within an activity or program. Also, a specific quantitative measure of results obtained through a program or activity. Personal Property: Property that can be moved with relative ease, such as motor vehicles, boats, machinery, and inventoried goods. Personal Services: Expenditures for the payment of salaries, wages and fringe benefits of employees. Property Tax: Tax based on assessed value of a property, either real estate or personal. Tax liability falls on the owner of record as of the appraisal date. Proprietary Funds: This category of funds often emulates the private sector and includes Enterprise Funds and Internal Service Funds. These funds are set up to measure the flow of economic resources (all assets and liabilities) and uses the accrual basis of accounting. Real Property: Land, buildings, permanent fixtures, and improvements. Refunding: A procedure whereby an issuer of bonds refinances an outstanding bond issue by issuing new bonds. Retained Earnings: An equity account reflecting the accumulated earnings of an enterprise or internal service fund. Revenue: Increases in the net current assets of a governmental fund type from other than expenditure refunds and residual equity transfers. Examples include property taxes, licenses and fees, and charges for services. Revenue Bonds: Bonds whose principal and interest are payable exclusively from earnings of an enterprise fund. Sales Tax: Tax levied on a broad range of goods and services at the point of sale and specified as a percentage of the transaction price. The vendor collects and reports the tax on behalf of the taxing jurisdiction. Self-Insurance: The formal assumption or partial assumption of risks and the accounting of results. Specific accounts are set aside to fund the risks, and losses which do occur are charged against those accounts or funds. S.P.L.O.S.T. (Special Purpose Local Option Sales Tax): An additional 1 percent sales tax that may be imposed for a specific time period on the same items as the State sales tax. The tax may be levied with voter approval and must be used for specific capital projects or capital outlay.
Glossary
FY20 Budget H-4

Special Revenue Fund: A fund used to account for the proceeds of specific revenue sources (other than expendable trusts or major capital projects) that are legally restricted to expenditure for specified purposes. TAVT (Title Ad Valorem Tax): A one-time title fee/tax paid at the time a motor vehicle title is transferred, based on the fair market value of the vehicle. TAVT replaced sales and use tax and the annual ad valorem tax (the “birthday” tax). TAVT is mandatory for motor vehicles purchased on or after March 1, 2013 and titled in Georgia. Tax Anticipation Note: Borrowing by a local government against future anticipated tax revenue. Tax Digest: The total assessed value of taxable property for a particular area. Trust Funds: Funds used to account for assets held by a government in a trustee capacity for individuals, private organizations, other governments, and/or other funds. T.S.P.L.O.S.T. (Transportation Special Purpose Local Option Sales Tax): A sales tax used to fund capital outlay projects proposed by the county government and municipal governments where the outlays are intended for transportation purposes only. Urban Service District: This district consists of the area within the corporate limits of the city of Athens at the time Unification became effective. VOIP (Voice Over Internet Protocol) Telephone: A category of hardware and software that enables voice communication (telephone service) and multimedia sessions over the internet.
Glossary
FY20 Budget H-5

ACCGOV (Athens-Clarke County Government) ACA (American Correctional Association) ACCFES (Athens-Clarke County Fire & Emergency Services) ACCPD (Athens-Clarke County Police Department) ADDA (Athens Downtown Development Authority) ADR (Alternative Dispute Resolution) AHA (Athens Housing Authority) ATS (Athens Transit Service) AWWA (American Water Works Association) AMI (Advanced Metering Infrastructure) CAFR (Comprehensive Annual Financial Report) CALEA (Commission on Accreditation for Law Enforcement Agencies) CBD (Central Business District) CDBG (Community Development Block Grant) CHaRM (Center for Hard to Recycle Materials) CHS (Consumer Healthy Solutions) CIP (Capital Improvement Plan) CJCC (Criminal Justice Coordinating Council) CMMS (Computerized Maintenance Management System) COPPS (Community Oriented Policing Performance System) CPI (Consumer Price Index) CVB (Convention & Visitors Bureau) CS (Current Services) CY (Calendar Year) DATE (Drug Abuse Treatment and Education) DFCS (Department of Family and Children’s Services) DOT (Department of Transportation) DUI (Driving Under the Influence) EMS (Emergency Medical Services) EPD (Environmental Protection Division) FAA (Federal Aviation Administration) FMV (Fair Market Value) FTA (Federal Transit Administration) FTE (Full-time equivalent) FY (Fiscal Year) GAAFR (Governmental Accounting, Auditing, and Financial Reporting) GAAP (Generally Accepted Accounting Principles) GACP (Georgia Association of Chiefs of Police) GASB (Governmental Accounting Standards Board) GCIC (Georgia Crime Information Center) GDOT (Georgia Department of Transportation) GEFA (Georgia Environmental Finance Authority) GFOA (Government Finance Officers Association) GICH (Georgia Initiative for Community Housing) GIS (Geographic Information System) HCD (Housing & Community Development)
Glossary
FY20 Budget H-6

HSA (Health Savings Account) HUD (U. S. Department of Housing and Urban Development) HVAC (Heating, Ventilation & Air Conditioning) ISO (Insurance Service Office) KACCB (Keep Athens-Clarke County Beautiful) LOST (Local Option Sales Tax) MACORTS (Madison Athens Clarke Oconee Regional Transportation Study) NCCHC (National Commission on Correctional Health Care) NRPA (National Recreation & Park Association) OCGA (Official Code of Georgia Annotated) OPEB (Other Post-Employment Benefits) PILOT (Payment in Lieu of Taxes) PMP (Performance Management Program) POS (Point of Service) RFP (Request for Proposal) SDWA (Safe Drinking Water Act) SHP (Supportive Housing Program) SPLOST (Special Purpose Local Option Sales Tax) TAVT (Title Ad Valorem Tax) TSPLOST (Transportation Special Local Option Sales Tax) UGA (University of Georgia) VAWA (Stop Violence Against Women Act) VOIP (Voice Over Internet Protocol) WEF (Water Environment Federation) WRF (Water Reclamation Facility)
Glossary
FY20 Budget H-7
![arim/CS2019/CS2017-1.pdf · RC9 =)- ] ;, 2017.10.02 ¢Á³»Ã©¥¦«º 12 u¬¦ ª¶¢Á³»Ã©_ghpiqmn^fmknrqho` t } "Q8 < Lz }?>wba_nhopmldj^ fmknrqho` w¬ ¦¶¾ v øîv¹](https://static.fdocuments.in/doc/165x107/5e57270fbaf3fa19194e276b/arimcs2019cs2017-1pdf-rc9-20171002-f-12-u.jpg)


![(ÈØ © d ] ã - King's AgriSeeds€¦ · (ÈØ © d ] ã Èç ¼ V¼ ö B¯õ  ÂÂç ¼ Á¯õãçØ ã ã ô¯¼¼ ©¯ó Èã ×ç¯ ¹ ¨ ¼¼ ©ØÈôã Â](https://static.fdocuments.in/doc/165x107/603a939306b2671639099094/-d-kings-agriseeds-d-v-b.jpg)


![cesamiæ ä½ ã ã ã ¥ã ¢ã «ï¼ å ©ç ¨è ï¼ .ppt [äº æ 㠢㠼ã ]](https://static.fdocuments.in/doc/165x107/61e096d23e6110489c3fa9c0/cesami-.jpg)