Y W l U c § ~ §±Ã [ ¯ § Y `±¯ ¿ ª¯ w£ Y cñ·£mohe.gov.sy/master/Message/Mc/alaa...
148
The Accounting Disclosure Of Banking Risks And Its Role In Control - _
Transcript of Y W l U c § ~ §±Ã [ ¯ § Y `±¯ ¿ ª¯ w£ Y cñ·£mohe.gov.sy/master/Message/Mc/alaa...
The Accounting Disclosure Of Banking Risks
And Its Role In Control
-
_
:
:
:
:
:
:
:
:
:
:
:
:
:
:
:
:
:
:
: :
: :
:

:/" :/
"
:// :
: 36
: 37
: 37
: 38
: ) ( 40
: 41
: 43
: 47
: 47
: 48
: 49
: 50
: 51
: 53
: 54
: 54
: 56
:/ // : 61
: : :CAMELS

-
// )(
)(
//
)(
//
)(
//
%
)(
)(
)(
)(
)(
)(
)(
)(
)(
)(
)(
)(
)(
)(
)(
)(
)(
)(
)(
)(
)(
)(

)(
)(
)(
)(
)(
T
:
.
.
–
-
.
:
.
.
:
.
. ) (
. ) (
) (
:
) ( )
(
.
.
:
:

.
)(
.
.
.
:
. ".
. "
.
.
. "
// "
/ /
.
. ."II :
. "

.
.
. Chaung- Yuang Lin ;Ming- Yuan Cheng "
"
.
. " .
."
.
. " .
."

.
. " . “ .
.
. . "
. "
.
. . "
)" ( .
) (
) (
) (

.
. . "
" .
) (
.
:
. .
. .
.
.
:
.
:
:
) .(
)
.(

1
:
: : :
:
/" /
"
.
.
2
: :
"Oxford ""Disclousre " :.
. ::
.
.
.
1 The concise oxford Dictionary or Current English , Oxford University press , 1982, p.273
. .
..
. . -.

3
.
.
:
:
. Full Disclosure
. Adequate Disclosure
. Fair Disclosure
. Differential Disclosure
- :
.
.. .
. . . ..
.

4
:
:
.
:
.
.
:
) :(
.
:
.
:
.
. .. .
. ) - – (
.

5
:
.
- :
:
:
.
:
.
-
" :
."
.
: .

6
-
.
:
:
. :
.
. :
....
. :
.2005 ..
7
:- - -
.
.
.
. :
.
. :
.
.

8
::
.
.
.
.
.
/
.
.
.

9
.
.
.
.
)
(
.
.
.
. – .
.

10
:
.
:
.
.
.
.
.
.

11
:
:
.
:
.
.
.
.
.
. . .. .
12
.:
Self Liquidation
.
.
.
.:
......
.
.
:
. .. :Syndicated Loans :
. :. . . ..

13
Unlooked Unwanted
.
.
.
.
:Systematic Risks
Nonsystematic Risks .
.
.
....
.
:
.Laker Airlines
. :
) ( .
. :Marshall and V.Bansal , Financial Engineering , (2nd ed) , Kolb Publishing Company , 1993, p243-244.
. . )– – – . (. 3 Emett j. Vaughan . Risk Management .( John & Sons . Inc, U.S.A 1997 ), p.p.8-9 4 Joel Bessis . Risk Management in Banking , ( John wiley & Sons Ltd,1998 ) , p.5.
. . . .-.

14
:
. :
.
. :
.
. :
.
. :
.
. :
.
:
. :.
. :
.
. :
.
. :
.
. : .
. .. ) (
. 2 Steve cocbeo , Risk Management , A B A Banking Journal , ( January , 1997) , pp 47- 49.

15
. :
.
. / :
.
. :
.
. :
.
:
: ) (
.
:
:
. :
.
. :
.
. :
.
. :
.
1 Ranjit Punja , Risk Management ( Alexandria ; Banking Institute , 2000) , P.98.

16
. :
.
.
:
:
: ::
• .
• .
• .
: ::
• .
• .
• .
• .
.
:

17
.
.
:
.
.
.
.
. ).(
.
. . .
2 William H. Beaver & George Parker , Risk Management : Problem & Solution ,( Stanford University : Mc Graw – Hill , Inc , 1995) p.248.
18
:
::
. .
. .
. .
. .
. .
. .
. .
. . ::
. )(....
. ).(
:
- .
- .
- .
- .
.....
. ..
.
19
.
) (
) (
.
.
.
...
.
:
.
. :
20
:
• :
.
• :
.
:
.
.
. :
. . –
. . . . . . . .. . . .
.
21
.
. :
.
:
.
.
:
.
. . .. . . . . .
22
.
. :
).(
.
/
:
. :
.
. :
.
:
• :
.
• :
1 Basel Committee On Banking Supervision , International Convergence Of Capital Measurement and Capital Standards ,op . cit. p137. 2 Joseph F . Sinkey , Jr . Commercial Banking Financial Management . Fourth Edition . New York : Macmillm Publishing Co . 1992. p. 419.

23
.
• :
.
• :
.
• :
.
:
• .
• .
. :
.
.
. . . .
. .. . . .. . .
. . . ..
24
:
:
:
.
. .
. .
. .
.
.
.
:
. . - .. ..–
.

25
1 - :
.
2 – .
3 – .
4 -
:
*.
*.
*.
:
. .
. .
.
.
. .
:
.
- . . .-.

26
:
.
.
.
.
.
.
.
).(
:
.
.
. –
.

27
.
.
:
. – –
.
.
.
. .
:
:
.
)(
"– – " .
2 IASB. International Accounting Standards NO1 ." Financial Instruments: Discloser and Presentation" . IASC, London.

28
:
:
. .
. .
. .
. .
. .
.

29
.
.
:/ :/"
"
.
.
:
:
:
.
.
.. . . .

30
.
:
.
.
:
.
.
.
:
. .. - .
.

31
.
.
:
.
.
:
) .(
:
.
.
:

32
.
:
.
:
.
/ /
:
.
:/ /
:
. . -.
33
:
.
:
.
:
.
:
.
.
.

34
/ /
:
. :
:
:
.
:
.
:
.
. :
) (
.
. :
.
. :
.
.
:
.
2 IASB. International Accounting Standards NO ." Financial Instruments: Discloser and Presentation" . IASC, (London ’ March , 1995) , Para42.
35
:
.
.
. .
.
.
.
.
.
.
:
.
.
.
: :
:
:
. . . . . . ..

36
.
Bis ")Bank of International Settlements (
:
.
.
.
.
:
:
37
.
:
:
. :
.
. :
.
. :
.
. :
.
. :
= +
= + +.
= +
:
:
.... ..

38
.
.
.
.
. "
" "
.
. :
.
.
)
() (
"
.

39
. : " "
.
:
. .
. .
.
.
.
.
.
: ) (
.
:
: :
II ) (- . . . . . - .

40
.
.
::
.
.
.
::
– - .. "" ) (.
41
) (
.
.
:
)(:
. :
" "
.

42
.
. :
.
. :
.
.
:
•
•
•
:

43
:
.
.
.
/ /
//
.
.
.
.
.
.
.
:
: )
( %.
:
.
:
)(
/ ///
II- – II /. II- – II /.
44
////
////
/ /
//
/ /
//
/ /
//
:
)(
/ ///
/ /
//
/ /
//
/ /
//
45
:
)(
/ /
//
/ /
//
:
)(
/ /
//
/ /
//
/ /
//
:
/ ///
.
:
• .
• .
II- – II /

46
•
.
•
.
• .
.
:
:
.
.
:

47
.
.
" "
.
)
(
.
:
:
. .II ... . . .
. . .II . ..
48
.
.
.
.
.
:
.
:
. .
. .
. :
:
.
.
.
. .II . ..

49
.
. :
:
.
.
.
.
.
.
.
)(
.
:
.
:
1 Basel Committee On Banking Supervision , “Reports to G7 Finance Ministers And Central Bank Governors On International Accounting Standards “ Bank for International Settlements, Basel Switzerland .(April 2000) , PP.1-37.
. .II . .

50
.
.
. :
:
.
.
. :
.
.
.
.
:
.
:
. .
. .
.:
:
.
.
.:
)
(.

51
.
.
.
.
:
.
.
.

52
:
:
:
:
.
cont-role
.
.
. – – .
53
:
:
.
:
" :
."
.
. – - -.
2 - Stephen p . Robbins , Marry Coulter 1996 – Management – Prentice Hall International ,NEW JERSY, P654
. -.

54
.
: :
.
.
:
• :
.
• :
) (
.
. .
- .
3 Andrew J .Durbin ,1997– Essentials of Management – South – Western College Publishing, Ohio. P339

55
.
:
:
. .
. .
. .
. .
.:
.
:
.
:
..

56
paying deficit )PD ( Loss Growing Deficit )LGD ( Exposur At Deficit
)EAD (M) Matured .(
.
.
.:
.
.:
.
. :
) (
- . . . . .-.

57
.
:/ /
/ //
//
.
:
:
• .
•
.
• .
• .
•
.
•
.
•
.
• .
:
/ / . / . ..

58
•
.
•
.
•
.
• .
:
• .
• .
•
.
:
• .
•
.
•
.
• .
•
.
/ / . / . ..

59
•
.
• .
:
• .
•
.
• .
•
.
• .
•
.

60
:
:
.
::
.
- :
:
61
.
- :
:
.
- :
.
:
. . . ... . . .. . .. . . ..
62
.
- :
:
.
- :
+
.
. . . . ..

63
.
-
:
:
.
.

64
......
.
:
)(

65
:
)(
::
"
. "
.
.
: CAMELS :
1 Board of Directors the Institute of Internal Auditors , " Definition Of Internal Auditing" . The Institute Of Internal Auditors , June1999.
. .II . ..

66
CAMELS
:
:
.
:
.
:
.
CAMELS
:
Capital Adequacy
Assets Quality
Management
Earnings
Liquidity
Sensitivity of Market Risk
. . . .-.
67
.
:
.
:
( .] [
.
( .] [
] [
.
( ] [
] [
.
( ] [
.
1 Examiner Orientation , Bank rating ,op.cit,p13. 2 Andrea Schaehter , Issues in Electronic : An overview , IMF Policy Discussion Paper IMF , 2002, p.p13-17.
68
( ] [
.
.
:
.
.
.
:
. .)Camels (
" . " . . . ..
69
.
Camels
.
:
.
.
] [ .%
] [ % %
] [ % %
] [ % %
] [ %.
:
.
. . ..

70
:
.
.
:
Camels
:
- :
.
- :
.
- :
.
1 Clifford Griep in the changing Gredit Risk management Environment , The 2nd EIBFS international conference . Emirates Institution for Banking & Financial Studies , Abu Dabi UAE ,2001, p.p1-3.
71
Camels
Camels
.
-
:
:
.
:.
. :
: :

72
.
.
.
.
::
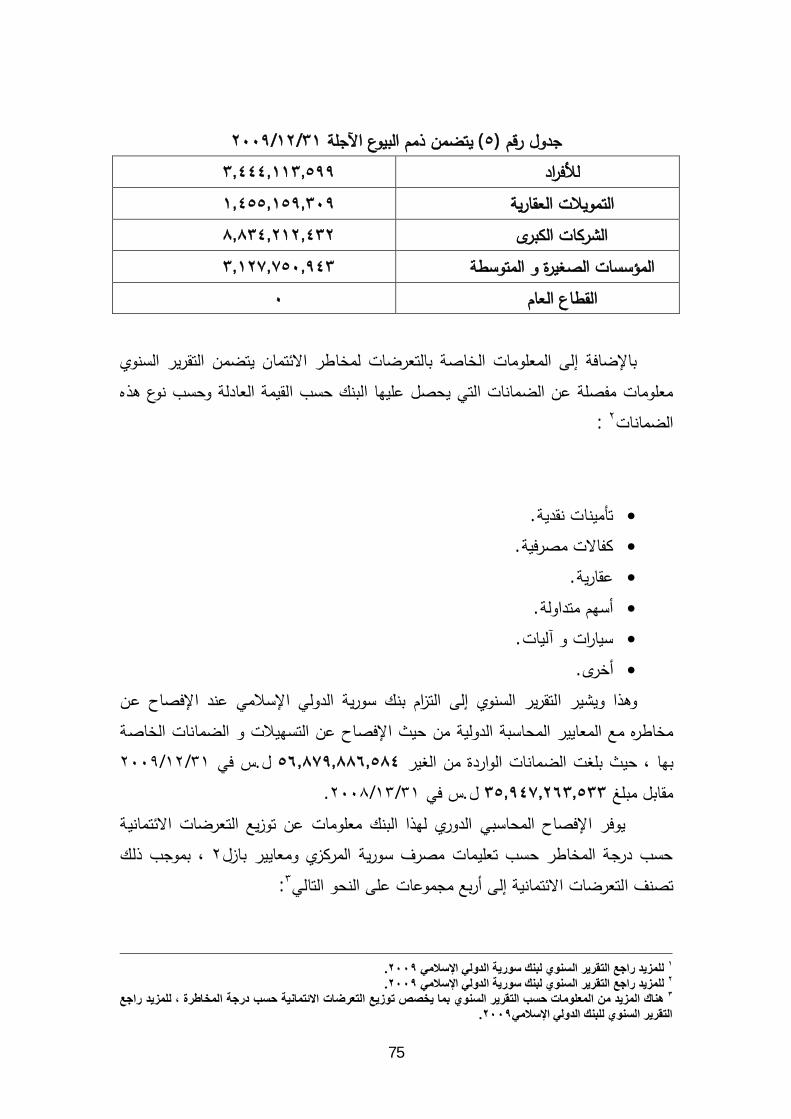
//2009 :
.
.
.
.
.
:

73
)
(.
:
:
.
:
.
:
.
:
:
.
:
.
:
.
:
. .
74
. .
. .
. .
.
:
. :
.
.
.
.
. :
.
.
. :
.
.
.
:
:
:
.
75
) (//
:
.
.
.
.
.
.
.//
.// .
:
. .
.

76
) (
.
% %
% %
.
.
:
. :
.

77
. :
) (
%.
) (//
%
. .
±%
±%
.
. :
% :
) (//
. .

78
%
. .
±% 290.509
±%
:
/ / /
/ %
.
.
.:
::
.
–
79
:
.
...
.
.
.
.
).(...
.
) (Visa .
.
.
.
%:
.
.
).(
.
:
.
.
.
.
.

80
.
)– – .(
::
:
.
.
.
.
.
.
)
.(
:
.

81
.
)(
,
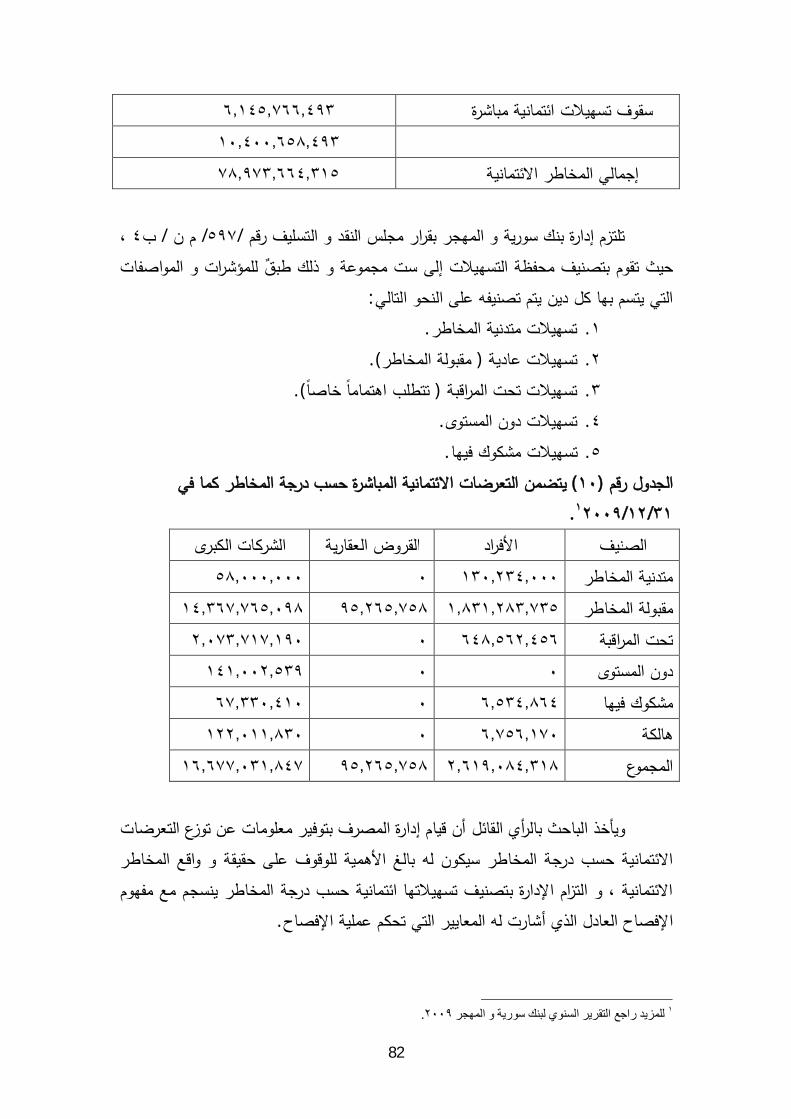
82
/ / /
:
. .
. ).(
. ) .(
. .
. .
) (
//.
.
.

83
:
.
.
.
.
.
:
) (
)– – .(
) (
)– – .(
.
) (
.
84
.
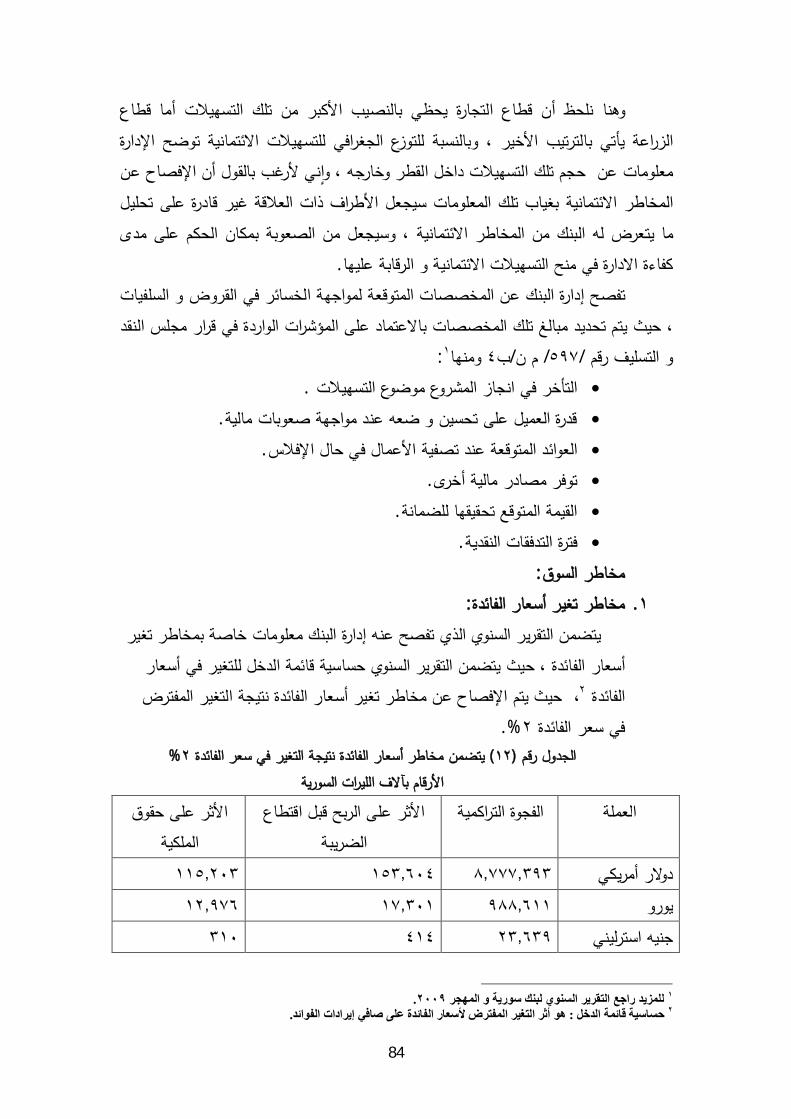
/ // :
.
.
.
.
.
.
:
. :
.% ) (%
. :.
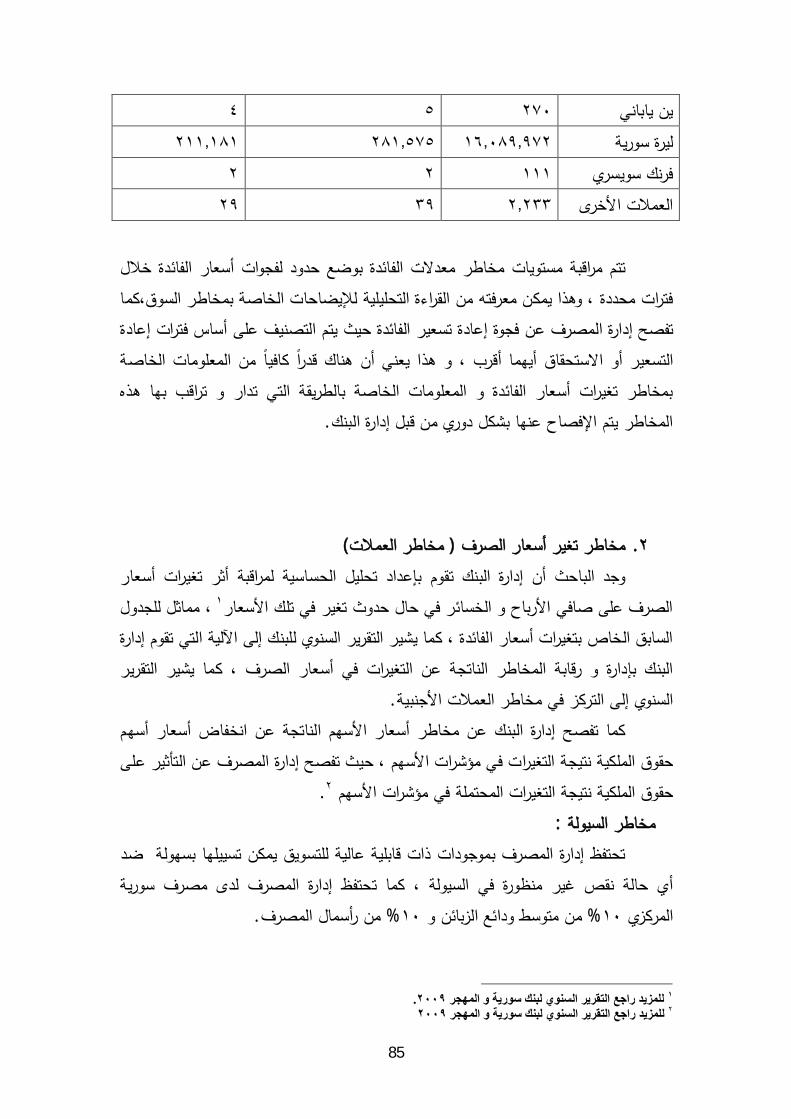
85
.
. )(
.
.
:
% %.
.
86
.
.
:
).(
.
.
.
.
.
.
.
.
.
:.
:
.
87
:
.
.
.
.
.
.
.
: -:
/ /:
:
. .
. .
.
.
::
.
.
.
88
:
. .
. .
. .
. .
.
:
.
:
-
-
-
-
- .
.
89
.
.
)– - (......
.
.
.
.
:
.
.
) – (:
90
:–
– – .
.
.
)
(
.:
T= G=
G
T .
:–
– – . . .
.
:)/ ()/ ()/ ()/.(
:.
.
.
:
./ .
91
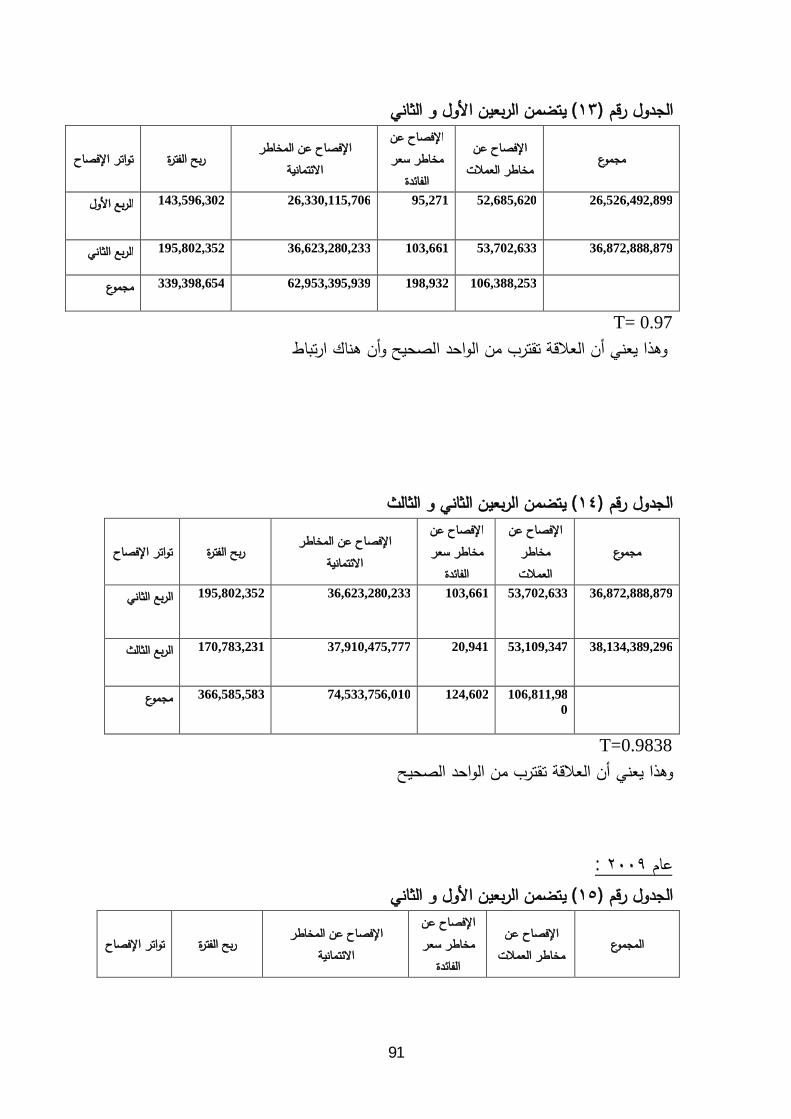
) (
26,526,492,899 52,685,620 95,271 26,330,115,706 143,596,302
36,872,888,879 53,702,633 103,661 36,623,280,233 195,802,352
106,388,253 198,932 62,953,395,939 339,398,654
T= 0.97
) (
36,872,888,879 53,702,633 103,661 36,623,280,233 195,802,352
38,134,389,296 53,109,347 20,941 37,910,475,777 170,783,231
106,811,980
124,602 74,533,756,010 366,585,583
T=0.9838
:
) (
92
20,585,239,657 27,505,641 21,891 20,433,298,758 124,413,367
21,926890,615 26,563,697 89,782 1,344,001,180 122,919,202
54,069,338 107,778 21,777,299,938 268,818,439
T= 0.9772 .
) (
21,926890,615 26,563,697 89,782 1,344,001,180 122,919,202
23,899,604,720 50,736,950 64,347 23,724,546,834 124,313,368
23,899,604,720 77,243,868 172,125 45,501,846,772 247,232,570
T=0.992
) (
23,899,604,720 50,736,950 64,347 23,724,546,834 124,313,368

93
95,558,234,261 50,680,171 89,722 94,882,920,113 624,544,195
772,438,868 197,560 118,607,366,947 747,463,397
T=0.925
T
) ( :–
–
.

94
: :
: .
:
%
%
SPSS
.

95
:: :
)(
32 28.1 28.1 52 45.6 73.7 20 17.5 91.2 10 8.8 100.0
114 100.0
% %
%
.
:
)(
4 3.5 3.5
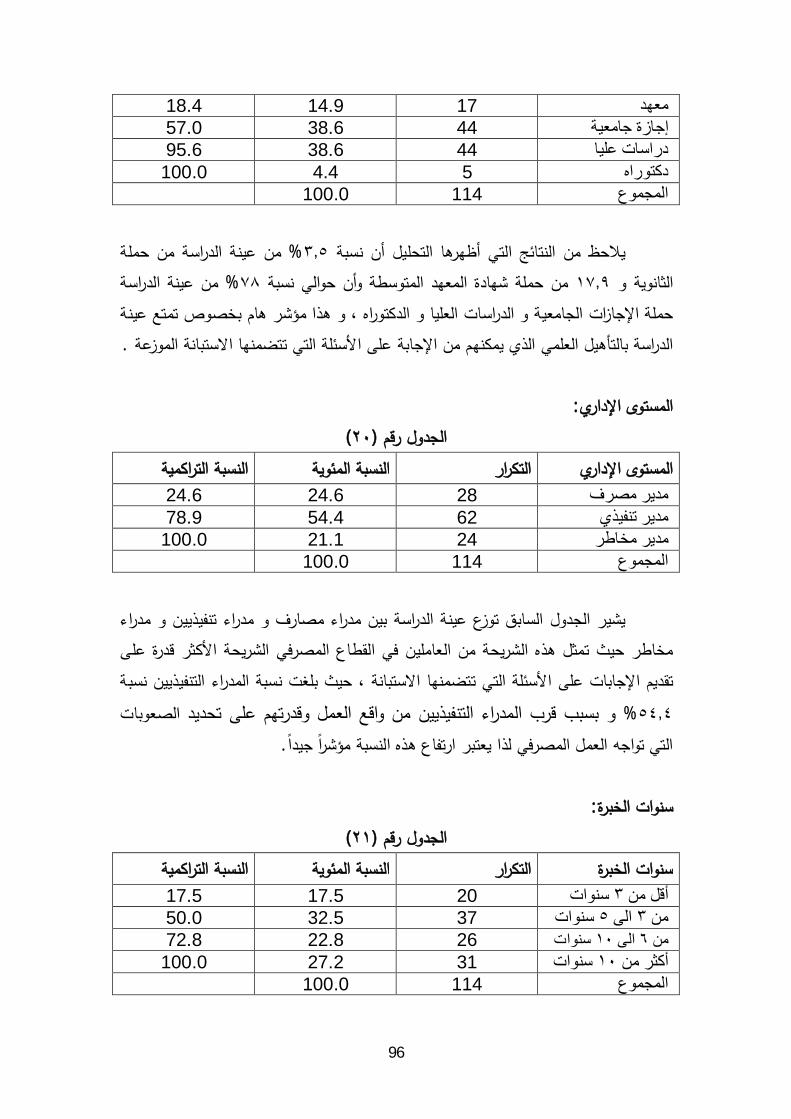
96
17 14.9 18.4 44 38.6 57.0 44 38.6 95.6
5 4.4 100.0 114 100.0
%
%
.
:
)(
28 24.6 24.6
62 54.4 78.9 24 21.1 100.0
114 100.0
%
.
:
)(
20 17.5 17.5
37 32.5 50.0 26 22.8 72.8
31 27.2 100.0 114 100.0
97
%
% %
.
:
)(
43 37.7 37.7
14 12.3 50.0 41 36.0 86.0 16 14.0 100.0
114 100.0
%
%
%
.
::
Cronbach's Alpha
%
%.
:Kolmogorov-Smirnov
.
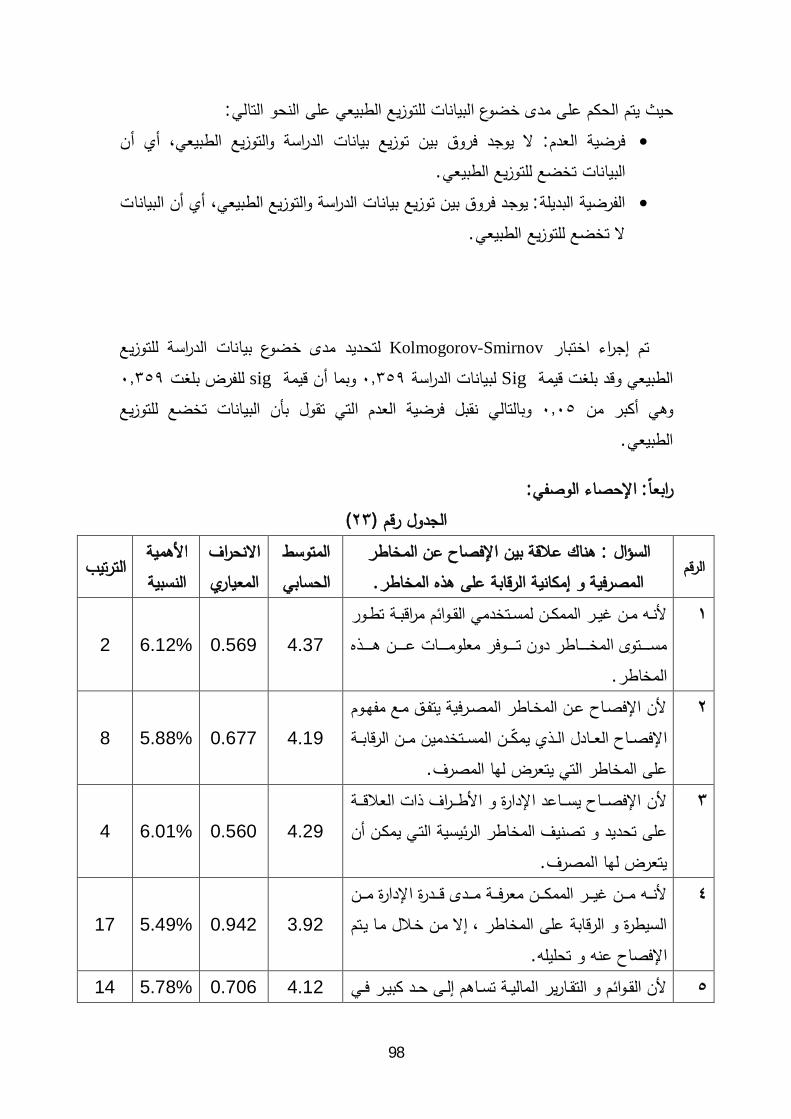
98
:
:
.
:
.
Kolmogorov-Smirnov
Sig sig
.
::
)(
:
.
.
4.37 0.569 6.12% 2
.
4.19 0.677 5.88% 8
.
4.29 0.560 6.01% 4
.
3.92 0.942 5.49% 17
4.12 0.706 5.78% 14

99
.
. 4.23 0.704 5.93% 7
. 4.18 0.613 5.85% 12
. 4.18 0.632 5.86% 10
.
4.09 0.618 5.73% 15
.
4.24 0.656 5.94% 6
.
4.25 0.603 5.95% 5
.
4.08 0.597 5.72% 16
.
4.17 0.637 5.84% 13
. 4.18 0.732 5.85% 11
.
4.18 0.573 5.86% 9
. 4.32 0.569 6.05% 3

100
.
4.39 0.602 6.15% 1
4. %
)(
.
) (
.
% % %
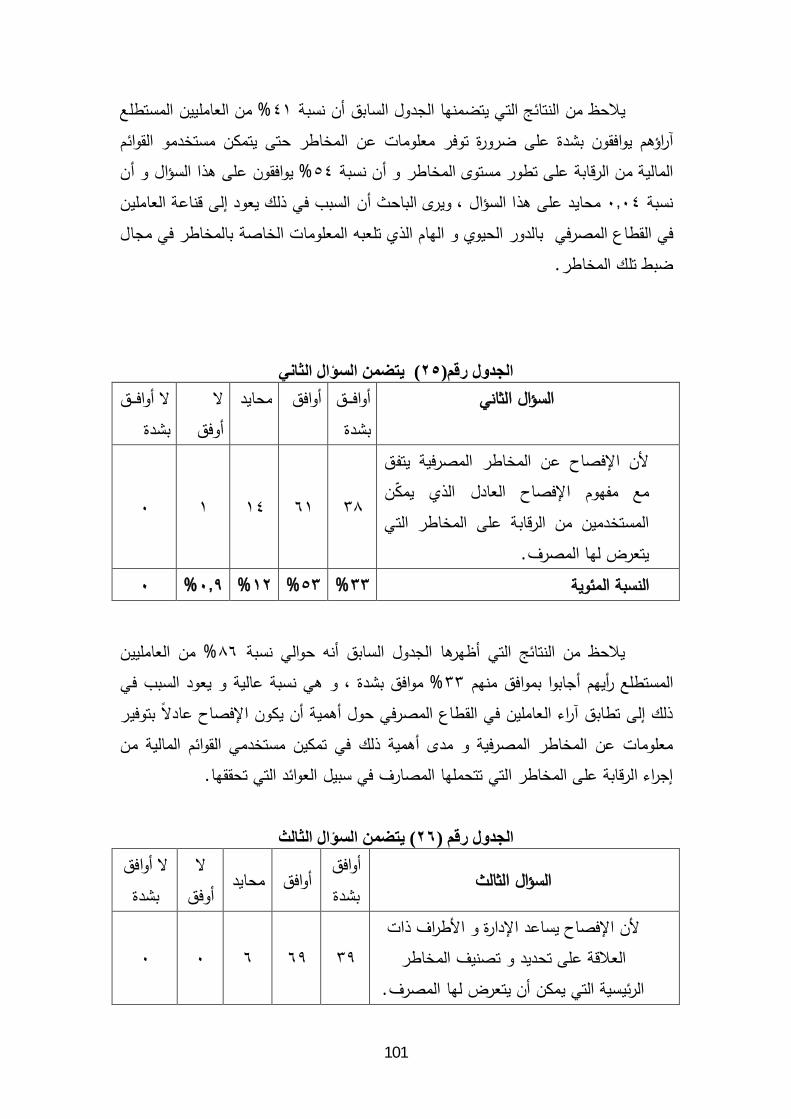
101
%
%
.
) (
.
% % % %
%
%
.
) (
.

102
% % %
) ( %
.
)(
.
% % % % %
.
) (
.

103
% % %
%
.
) (
.
% % %
%
.
)(
.
% %

104
%
.
) (
.
% % %
%
.
) (

105
.
% % % %
%
.
) (
.
% % % %
% %
.
) (

106
.
% %
%.
) (
.
% % %
%
.
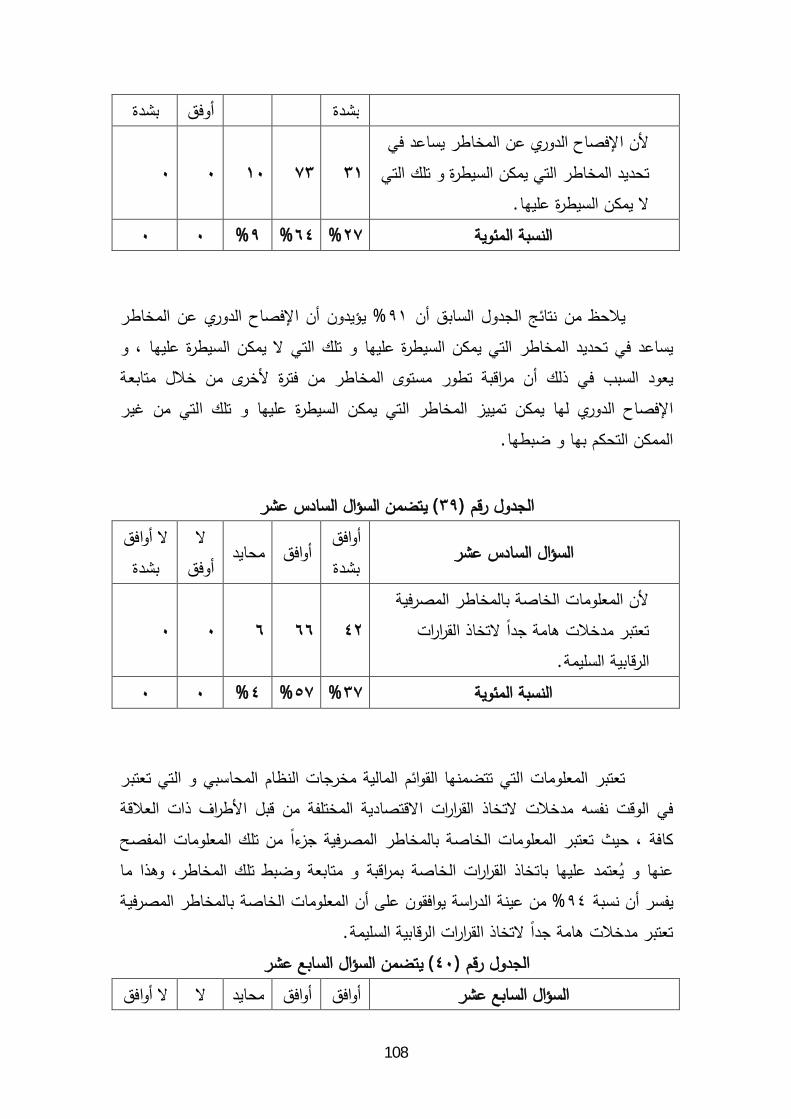
) (
34 65 15 0 0

107
.
% % %
%
.
) (
.
% % % %
%
) (
.
) (
108
.
% % %
%
.
) (
.
% % %
%
.
) (
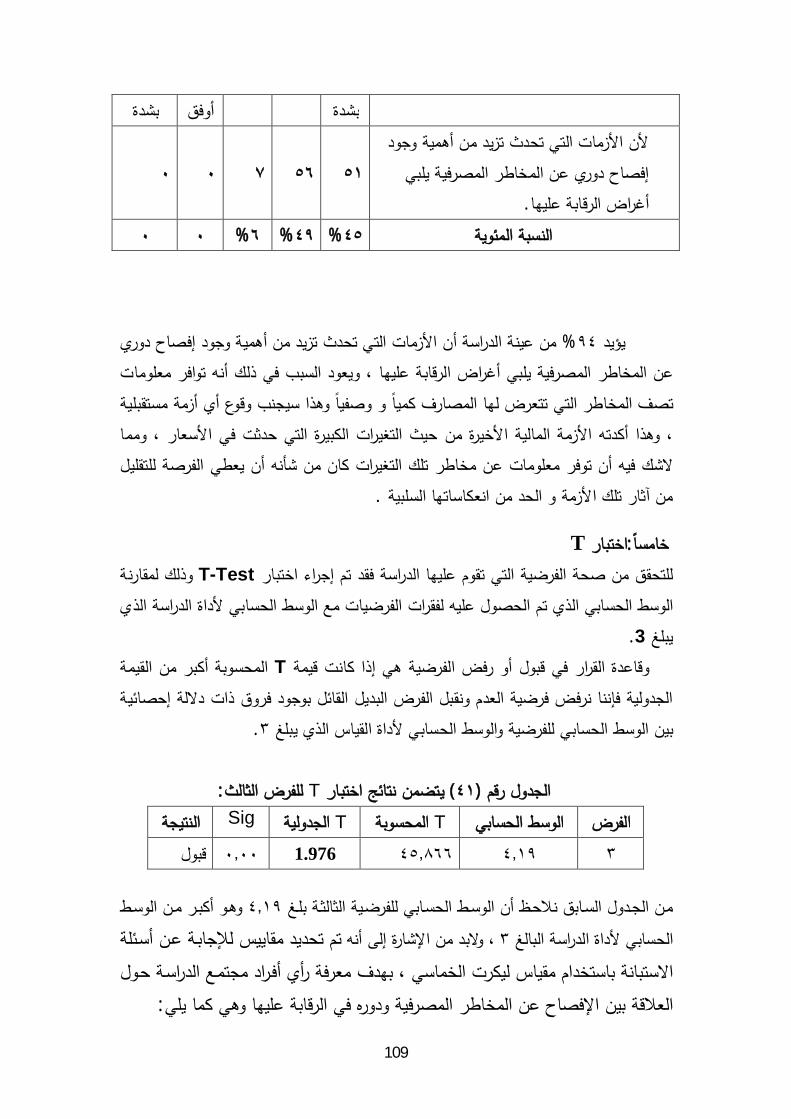
109
.
% % %
%
.
:T T-Test
3.
T
.
) (T :
T T Sig
1.976
:
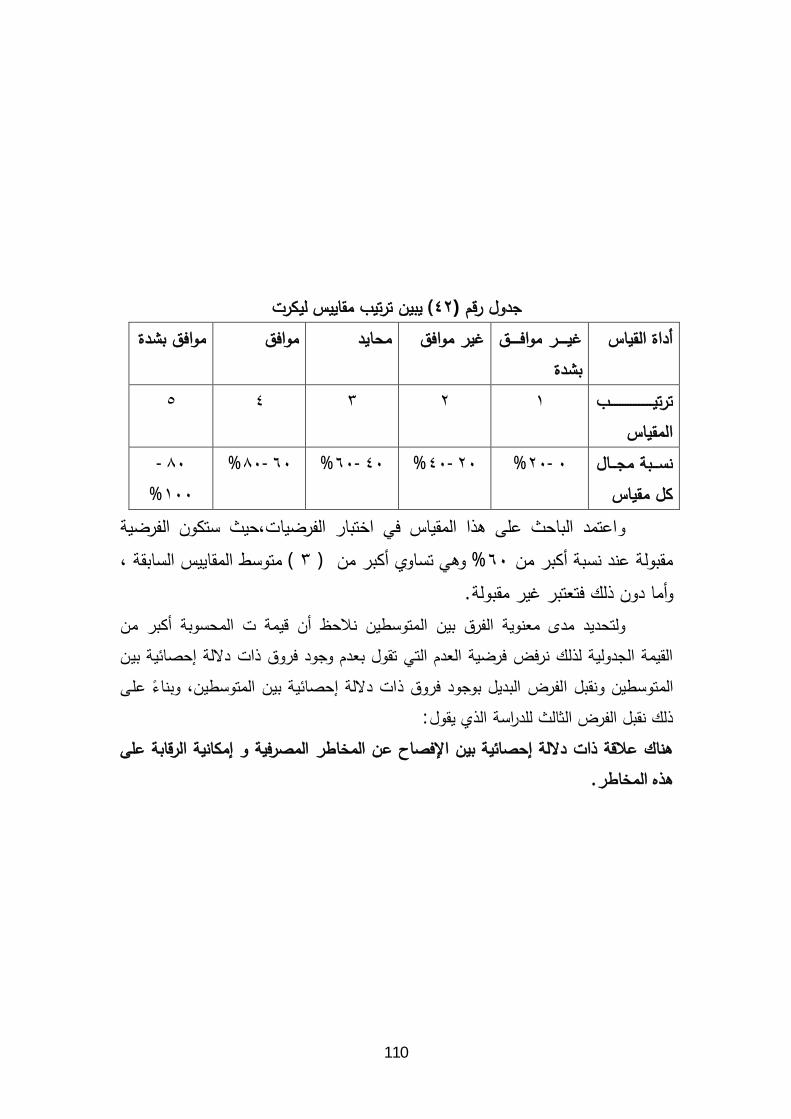
110
)(
-
%
-% -% -% -%
% ) (
.
:
.
111
:
.
.
.
.
.
.
.
.
.
:

112
.
.
.
.

113
:
:
.
.
.
.
.
.
.
.
. .
. .

114
. CAMELS .
:
:
. . . .
.
. . – - .
. "
" )
. (
. . .
.
. –
.
. . . .
..
. II )
(.
. . . ...
. . . ..
. . . )– – –
. (
.
.
115
. )- – (
.
. .
.
.
. . ..
) (.
. . ..
. ..
. .. .
.
. ..
–
.
. .
.
. . .
...
. – -
.
.
.
. ) .(
.
. ..- .
.
. .
.
. .

116
. . – –
.
. ...
.
. . .
. . .Camels
" . ."
. ...
. .
. . . - .
.
.
.
.
- .
. . .
.
. . . .
.
. . . . .
.
.
.
.
...
. .
:

117
. . .
– .
. . ..
. . .
. . ..
. II- – II /
.
. . . ..
. .
. ) ( .
. ) (.
. .
. –
.
.
- .
. .
. .
.
.
. ) . .(
-
.
. -
:.

118
. ) . .(
""
.
. .
.
.
.
.
. .
.
.
:
.
. .
.
.
.
:
. . .
. .
. ..
. . .
.
. ..
.
.
119
. . .
. ..
:
1. . Ranjit Punja , Risk Management ( Alexandria ; Banking Institute ,
2000).
2. :Marshall and V.Bansal , Financial Engineering , (2nd ed) , Kolb
Publishing Company , 1993. 3. Andrea Schaechter, Issues in Electronic Banking: Anoverview,
IMF policy Discussion Paper, IMF,2002. 4. Andrew J .Durbin ,1997– Essentials of Management – South –
Western College Publishing, Ohio. 5. Basel Committee On Banking Supervision , “Reports to G7
Finance Ministers And Central Bank Governors On International Accounting Standards “ Bank for International Settlements, Basel Switzerland .(April 2000).
6. Basel Committee On Banking Supervision , International Convergence Of Capital Measurement and Capital Standards ,op . cit
7. Board of Directors the Institute of Internal Auditors , " Definition Of Internal Auditing" . The Institute Of Internal Auditors , June1999.
8. Clifford Griep Ratings in the changing Gredit Risk management Environment, The 2nd EIBFS international Conference. Emirates Institution for Banking & Financial Studies, Abu Dabi UAE, 2001.
9. Emett j. Vaughan . Risk Management .( John & Sons . Inc, U.S.A 1997 ).
10. Examiner orientation, Bank Rating System report on safety and soundness specialty module, 1998.
11. IASB. International Accounting Standards NO1 ." Financial
Instruments: Discloser and Presentation" . IASC, London. 12. Jimkates & Stephen Nickson,"The Reality of Hockers", Risk
management, 2001,

120
13. Joel Bessis . Risk Management in Banking , ( John wiley & Sons Ltd,1998 ).
14. Joseph F . Sinkey , Jr . Commercial Banking Financial Management . Fourth Edition . New York : Macmillm Publishing Co . 1992.
15. Stephen p . Robbins , Marry Coulter 1996 – Management – Prentice Hall International ,NEW JERSY.
16. Steve cocbeo , Risk Management , A B A Banking Journal , ( January , 1997)
17. The concise oxford Dictionary or Current English , Oxford University press , 1982.
18. William H. Beaver & George Parker , Risk Management : Problem & Solution ,( Stanford University : Mc Graw – Hill , Inc , 1995).
121
:
: .
:
.
.
.
)- (
.
.

122
:
.
.
.
.
.
.
.
.
.
.
.
.

123
.
.
.
.
.
.
.
.
.
.
.
.
.
.

124
.
.
.
.
.
.
.
.
.

125
: Reliability Scale: ALL VARIABLES
Case Processing Summary N %
Cases Valid 114 100.0 Excludeda 0 .0
Total 114 100.0 a. Listwise deletion based on all variables in the
procedure.
Reliability Statistics
Cronbach's
Alpha N of Items .720 17
NPAR TESTS /K-S(NORMAL)=H3 /MISSING ANALYSIS.
NPar Tests
One-Sample Kolmogorov-Smirnov Test
N 114 Normal Parametersa,b Mean 4.1976

126
Std. Deviation .27879 Most Extreme Differences Absolute .087
Positive .087 Negative -.073-
Kolmogorov-Smirnov Z .925 Asymp. Sig. (2-tailed) .359
a. Test distribution is Normal. b. Calculated from data.
DESCRIPTIVES VARIABLES=Q1 Q2 Q3 Q4 Q5 Q6 Q7 Q8 Q9 Q10 Q11 Q12 Q13 Q14 Q15 Q16 Q17
/STATISTICS=MEAN STDDEV MIN MAX.
Descriptives
Descriptive Statistics
N Minimum Maximum Mean Std. Deviation Q1 114 3 5 4.37 .569 Q2 114 2 5 4.19 .677 Q3 114 3 5 4.29 .560 Q4 114 1 5 3.92 .942 Q5 114 2 5 4.12 .706 Q6 114 2 5 4.23 .704 Q7 114 2 5 4.18 .613 Q8 114 3 5 4.18 .632 Q9 114 2 5 4.09 .618
Q10 114 2 5 4.24 .656 Q11 114 2 5 4.25 .603 Q12 114 2 5 4.08 .597 Q13 114 3 5 4.17 .637 Q14 114 1 5 4.18 .732 Q15 114 3 5 4.18 .573 Q16 114 3 5 4.32 .569 Q17 114 3 5 4.39 .602
Valid N (listwise) 114
SAVE OUTFILE='C:\Documents and Settings\As\Desktop\Alaa.sav' /COMPRESSED. T-TEST /TESTVAL=3 /MISSING=ANALYSIS /VARIABLES=H3

127
/CRITERIA=CI(.95).
T-Test
One-Sample Statistics
N Mean Std. Deviation Std. Error Mean
114 4.1976 .27879 .02611
One-Sample Test
Test Value = 3
t df Sig. (2-tailed)
Mean
Difference
95% Confidence Interval of the
Difference
Lower Upper
45.866 113 .000 1.19763 1.1459 1.2494
FREQUENCIES VARIABLES=Age Qualification MangLvel Experiance Speci /ORDER=ANALYSIS. Frequencies
Statistics
N Valid 114 114 114 114 114
Missing 0 0 0 0 0
Frequency Table

128
Frequency Percent Valid Percent
Cumulative
Percent
Valid 32 28.1 28.1 28.1
52 45.6 45.6 73.7
20 17.5 17.5 91.2
10 8.8 8.8 100.0
Total 114 100.0 100.0
Frequency Percent Valid Percent
Cumulative
Percent
Valid 4 3.5 3.5 3.5
17 14.9 14.9 18.4
44 38.6 38.6 57.0
44 38.6 38.6 95.6
5 4.4 4.4 100.0
Total 114 100.0 100.0
Frequency Percent Valid Percent
Cumulative
Percent
Valid 28 24.6 24.6 24.6
62 54.4 54.4 78.9
24 21.1 21.1 100.0
Total 114 100.0 100.0
Frequency Percent Valid Percent
Cumulative
Percent
Valid 20 17.5 17.5 17.5

129
37 32.5 32.5 50.0
26 22.8 22.8 72.8
31 27.2 27.2 100.0
Total 114 100.0 100.0
Frequency Percent Valid Percent
Cumulative
Percent
Valid 43 37.7 37.7 37.7
14 12.3 12.3 50.0
41 36.0 36.0 86.0
16 14.0 14.0 100.0
Total 114 100.0 100.0
Frequencies
Statistics
Q1 Q2 Q3 Q4 Q5 Q6 Q7 Q8 Q9
N Valid 114 114 114 114 114 114 114 114
Missing 0 0 0 0 0 0 0 0
Frequency Table
Q1
Frequency Percent Valid Percent
Cumulative
Percent
Valid 5 4.4 4.4 4.4

130
62 54.4 54.4 58.8
47 41.2 41.2 100.0
Total 114 100.0 100.0
Q2
Frequency Percent Valid Percent
Cumulative
Percent
Valid 1 .9 .9 .9
14 12.3 12.3 13.2
61 53.5 53.5 66.7
38 33.3 33.3 100.0
Total 114 100.0 100.0
Q3
Frequency Percent Valid Percent
Cumulative
Percent
Valid 6 5.3 5.3 5.3
69 60.5 60.5 65.8
39 34.2 34.2 100.0
Total 114 100.0 100.0
Q4
Frequency Percent Valid Percent
Cumulative
Percent
Valid 1 .9 .9 .9
10 8.8 8.8 9.6
19 16.7 16.7 26.3
51 44.7 44.7 71.1
33 28.9 28.9 100.0
Total 114 100.0 100.0
Q5

131
Frequency Percent Valid Percent
Cumulative
Percent
Valid 3 2.6 2.6 2.6
13 11.4 11.4 14.0
65 57.0 57.0 71.1
33 28.9 28.9 100.0
Total 114 100.0 100.0
Q6
Frequency Percent Valid Percent
Cumulative
Percent
Valid 2 1.8 1.8 1.8
12 10.5 10.5 12.3
58 50.9 50.9 63.2
42 36.8 36.8 100.0
Total 114 100.0 100.0
Q7
Frequency Percent Valid Percent
Cumulative
Percent
Valid 2 1.8 1.8 1.8
7 6.1 6.1 7.9
74 64.9 64.9 72.8
31 27.2 27.2 100.0
Total 114 100.0 100.0
Q8
Frequency Percent Valid Percent
Cumulative
Percent
Valid 14 12.3 12.3 12.3
65 57.0 57.0 69.3
35 30.7 30.7 100.0
Total 114 100.0 100.0

132
Q9
Frequency Percent Valid Percent
Cumulative
Percent
Valid 1 .9 .9 .9
14 12.3 12.3 13.2
73 64.0 64.0 77.2
26 22.8 22.8 100.0
Total 114 100.0 100.0
Q10
Frequency Percent Valid Percent
Cumulative
Percent
Valid 1 .9 .9 .9
11 9.6 9.6 10.5
62 54.4 54.4 64.9
40 35.1 35.1 100.0
Total 114 100.0 100.0
Q11
Frequency Percent Valid Percent
Cumulative
Percent
Valid 2 1.8 1.8 1.8
4 3.5 3.5 5.3
72 63.2 63.2 68.4
36 31.6 31.6 100.0
Total 114 100.0 100.0
Q12
Frequency Percent Valid Percent
Cumulative
Percent
Valid 1 .9 .9 .9
13 11.4 11.4 12.3
76 66.7 66.7 78.9
24 21.1 21.1 100.0
Total 114 100.0 100.0

133
Q13
Frequency Percent Valid Percent
Cumulative
Percent
Valid 15 13.2 13.2 13.2
65 57.0 57.0 70.2
34 29.8 29.8 100.0
Total 114 100.0 100.0
Q14
Frequency Percent Valid Percent
Cumulative
Percent
Valid 1 .9 .9 .9
16 14.0 14.0 14.9
58 50.9 50.9 65.8
39 34.2 34.2 100.0
Total 114 100.0 100.0
Q15
Frequency Percent Valid Percent
Cumulative
Percent
Valid 10 8.8 8.8 8.8
73 64.0 64.0 72.8
31 27.2 27.2 100.0
Total 114 100.0 100.0

134
Q16
Frequency Percent Valid Percent
Cumulative
Percent
Valid 6 5.3 5.3 5.3
66 57.9 57.9 63.2
42 36.8 36.8 100.0
Total 114 100.0 100.0
Q17
Frequency Percent Valid Percent
Cumulative
Percent
Valid 7 6.1 6.1 6.1
56 49.1 49.1 55.3
51 44.7 44.7 100.0
Total 114 100.0 100.0


![ººººº U d ¸ Sººººº Y ^¦kalakamin.com/wa_files/Eng_Baraket.pdf4 Y ] ¯ c ª U x ± n [ v rÃà Y S U § ª U x ± n [ § ¹Ã rà W ± ] £ À U [ § w¯ [ l à w¯ [ l§](https://static.fdocuments.in/doc/165x107/5f18eaf15c84984aaf7f5df4/-u-d-s-y-4-y-c-u-x-n-v-rff-y-s-u-.jpg)


![ã - Welcome to NDF Research - Welcome to NDF Research · y y z x a ] ^ [ ] y _ á ä \ ã y ` z x y _](https://static.fdocuments.in/doc/165x107/5f1cd6f0cc4f4547c87376c7/-welcome-to-ndf-research-welcome-to-ndf-y-y-z-x-a-y-y.jpg)


![à ËÁ y ¾ ¨¸e |uYÁ Ô a w d Zz ] w ¾ Ìf¿Y M ½ Y|Ì» ½ Y Æe · °§ à ËÁ y ¾ ¨¸e |uYÁ Ô a w d Zz ] w ¾ Ìf¿Y M ½ Y|Ì» ½ Y Æe. °§ à ËÁ y ¾ ¨¸e |uYÁ](https://static.fdocuments.in/doc/165x107/6026b4902e41600b436e2463/f-y-e-uy-a-w-d-zz-w-oefy-m-yoe-y-e-.jpg)
![4楽天㠧ã ã æ é ã ¡ã 㠥㠼表 202004 v1ë & R ® ¸ } 4 R ¥ È S y Z T f ® ® ¸ B b C d ® ¸ B b C (2 J Z á]5]+]0]W]d] Ä º\Ø y ¯ ` @ ú * # Þ N:K](https://static.fdocuments.in/doc/165x107/5f1a3fb27472f560b842a63b/4-202004-v1-r-.jpg)