æy ¢0SJHJOBMBSUJDMF - ffpri.affrc.go.jp
17
「森林総合研究所研究報告」(Bulletin of FFPRI) Vol.12 No.3 (No.428) 125 - 141 September 2013 論 文(Original article) 原稿受付:平成 25 年 2 月 12 日 Received 12 February 2013 原稿受理:平成 25 年 7 月 9 日 Accepted 9 July 2013 1) Tohoku Research Center, Forestry and Forest Products Research Institute (FFPRI) 2) Iwatehokubu District Forest Office, Touhoku Regional Forest Office, Forest Agency 3) Japan International Research Center for Agricultural Science 4) Forestry and Forest Products Research Institute (FFPRI) * Tohoku Research Center, 92-25, Nabeyashiki, Shimo-Kuriyagawa, Morioka, Iwate 020-0123, JAPAN 1. Introduction Measuring carbon dioxide (CO 2 ) flux using micrometeorological techniques is a means of determining carbon (C) dynamics in forested ecosystems (Mizoguchi et al. 2012). Determining net ecosystem production (NEP), gross primary production (GPP), and ecosystem respiration (R E ) via CO 2 flux in forest ecosystems is an important part of understanding C dynamics in forested ecosystems. The Forestry and Forest Product Research Institute has formed a research group (Forestry and Forest Product Research Institute Flux Observation Network (FFPRI FluxNet)) which has observed CO 2 flux in several forest types in Japan since 1995 (FFPRI FluxNet 2013). Since then, FFPRI FluxNet has continuously measured CO 2 exchange between vegetated surfaces and the atmosphere at six research sites in Japan (five currently active) (FFPRI FluxNet 2013). One of these FFPRI sites is the Appi forest meteorology research site (API site; FFPRI FluxNet 2013), located in northern Japan. The API site is a secondary cool- temperate deciduous hardwood forest mainly dominated by Japanese beech ( Fagus crenata), very typical species in the cool-temperate region which occurs over large areas of northeastern Japan (Kira 1977, Maruyama 1977). The results of various studies and observations at the API site, e.g., litter production (Hoshino, JIRCAS, personal communication), soil respiration (Hashimoto et al. 2009, Ishizuka et al. 2006), soil carbon dynamics (Koarashi et al. 2009), CO 2 flux observation (Yasuda et al. 2012) have already been published allowing the comparison and validation of the results of various scientific techniques typically used in Japanese beech forest. Forest biomass and productivity in the API site have not yet been estimated and should be determined using an ecological summation method to validate and predict the future changes of C Abstract To estimate forest biomass and productivity in a cool-temperate deciduous hardwood forest of the Appi Highlands in northern Japan, we developed allometric equations for estimating relationships between size-related variable (stem diameter at breast height (dbh)) and biomass of leaves, branches, stems, and roots for Japanese beech (Fagus crenata) trees. This is one of the most typical species growing in the cool-temperate zones of Japan. At the present study site, Japanese beech trees comprised 75% of all forest trees (1,666 trees ha -1 in 2012) and 80% of the sum of basal areas for all species. Twelve trees of various sizes were comprehensively harvested to measure tree biomass at the study site. Allometric equations developed for all parts of biomass as a function of dbh showed high correlations (Adjusted R 2 = 0.92-0.99). Using two independent external datasets, validation results for stem biomass estimates were quite good although those for branch, leaf, and root biomass were not as accurate because of relatively large SEP (standard error of prediction) of branch and leaf biomass estimates for the validation dataset and underestimation of leaf and root biomass for small-sized trees. Insufficient accuracy of those biomass estimates may not have hindered the accurate estimation of forest biomass in the Appi Highlands because stem biomass was a main component of forest biomass and the low accuracy estimates only involved inaccuracies in the estimates for some of small-sized trees (dbh < 10 cm). Forest biomass in the Appi Highlands was estimated to be 343 t ha -1 using the equations developed here. This value was slightly higher than average values of Japanese beech forest in previously published biomass data. Results of the present study will be helpful for advancing further studies on the determination of annual changes in forest productivity and carbon dynamics in Japanese beech forests in the Appi Highlands. Key words : dbh-based allometric equations, Fagus crenata, forest biomass, root excavation, temperate secondary forest Estimating forest biomass using allometric model in a cool-temperate Fagus crenata forest in the Appi Highlands, Iwate, Japan Kenji ONO 1)* , Yukio YASUDA 1) , Toru MATSUO 2) , Daisuke Hoshino 3) , Yukihiro CHIBA 4) and Shigeta MORI 4)
Transcript of æy ¢0SJHJOBMBSUJDMF - ffpri.affrc.go.jp

「森林総合研究所研究報告」(Bulletin of FFPRI) Vol.12 No.3 (No.428) 125 - 141 September 2013
論 文(Original article)
原稿受付:平成 25年 2月 12日 Received 12 February 2013 原稿受理:平成 25年 7月 9日 Accepted 9 July 20131) Tohoku Research Center, Forestry and Forest Products Research Institute (FFPRI)2) Iwatehokubu District Forest Office, Touhoku Regional Forest Office, Forest Agency3) Japan International Research Center for Agricultural Science4) Forestry and Forest Products Research Institute (FFPRI)* Tohoku Research Center, 92-25, Nabeyashiki, Shimo-Kuriyagawa, Morioka, Iwate 020-0123, JAPAN
1. IntroductionM e a s u r i n g c a r b o n d i o x i d e ( C O 2) f l u x u s i n g
micrometeorological techniques is a means of determining carbon (C) dynamics in forested ecosystems (Mizoguchi et al. 2012). Determining net ecosystem production (NEP), gross primary production (GPP), and ecosystem respiration (RE) via CO2 flux in forest ecosystems is an important part of understanding C dynamics in forested ecosystems. The Forestry and Forest Product Research Institute has formed a research group (Forestry and Forest Product Research Institute Flux Observation Network (FFPRI FluxNet)) which has observed CO2 flux in several forest types in Japan since 1995 (FFPRI FluxNet 2013). Since then, FFPRI FluxNet has continuously measured CO2 exchange between vegetated surfaces and the atmosphere at six research sites in Japan (five currently active) (FFPRI FluxNet 2013).
One of these FFPRI sites is the Appi forest meteorology
research site (API site; FFPRI FluxNet 2013), located in northern Japan. The API site is a secondary cool-temperate deciduous hardwood forest mainly dominated by Japanese beech (Fagus crenata), very typical species in the cool-temperate region which occurs over large areas of northeastern Japan (Kira 1977, Maruyama 1977). The results of various studies and observations at the API site, e.g., litter production (Hoshino, JIRCAS, personal communication), soil respiration (Hashimoto et al. 2009, Ishizuka et al. 2006), soil carbon dynamics (Koarashi et al. 2009), CO2 flux observation (Yasuda et al. 2012) have already been published allowing the comparison and validation of the results of various scientific techniques typically used in Japanese beech forest. Forest biomass and productivity in the API site have not yet been estimated and should be determined using an ecological summation method to validate and predict the future changes of C
AbstractTo estimate forest biomass and productivity in a cool-temperate deciduous hardwood forest of the Appi
Highlands in northern Japan, we developed allometric equations for estimating relationships between size-related variable (stem diameter at breast height (dbh)) and biomass of leaves, branches, stems, and roots for Japanese beech (Fagus crenata) trees. This is one of the most typical species growing in the cool-temperate zones of Japan. At the present study site, Japanese beech trees comprised 75% of all forest trees (1,666 trees ha-1 in 2012) and 80% of the sum of basal areas for all species. Twelve trees of various sizes were comprehensively harvested to measure tree biomass at the study site. Allometric equations developed for all parts of biomass as a function of dbh showed high correlations (Adjusted R2 = 0.92-0.99). Using two independent external datasets, validation results for stem biomass estimates were quite good although those for branch, leaf, and root biomass were not as accurate because of relatively large SEP (standard error of prediction) of branch and leaf biomass estimates for the validation dataset and underestimation of leaf and root biomass for small-sized trees. Insufficient accuracy of those biomass estimates may not have hindered the accurate estimation of forest biomass in the Appi Highlands because stem biomass was a main component of forest biomass and the low accuracy estimates only involved inaccuracies in the estimates for some of small-sized trees (dbh < 10 cm). Forest biomass in the Appi Highlands was estimated to be 343 t ha-1 using the equations developed here. This value was slightly higher than average values of Japanese beech forest in previously published biomass data. Results of the present study will be helpful for advancing further studies on the determination of annual changes in forest productivity and carbon dynamics in Japanese beech forests in the Appi Highlands.
Key words : dbh-based allometric equations, Fagus crenata, forest biomass, root excavation, temperate secondary forest
Estimating forest biomass using allometric model in a cool-temperateFagus crenata forest in the Appi Highlands, Iwate, Japan
Kenji ONO 1)*, Yukio YASUDA 1), Toru MATSUO 2),Daisuke Hoshino 3), Yukihiro CHIBA 4) and Shigeta MORI 4)
森林総合研究所研究報告 第 12巻 3号 , 2013
ONO, K. et al.126
balances in forested ecosystems in Japan.Therefore, we conducted destructive sampling of
several variously-sized Japanese beech trees including roots in the Appi Highlands and estimated stem, branch, leaf, and root biomass of each tree individually. Next, we used these data to develop and calibrate allometric equations between tree diameter at breast height (= 1.3 m; dbh) and individual plant-part biomass data to accurately determine forest biomass at the API site. Using two previously reported forest biomass datasets (Karizumi 1990, Mori et al. 1979) as the independent external datasets, we also validated the allometric relationships developed here. Finally, we estimated forest biomass at the API site and compared the results obtained in the present study with estimates of Japanese beech biomass previously reported (e.g., Japanese Committee for the International Biological Program (JIBP) project (Shidei and Kira 1977)).
2. Methods2.1 Site description
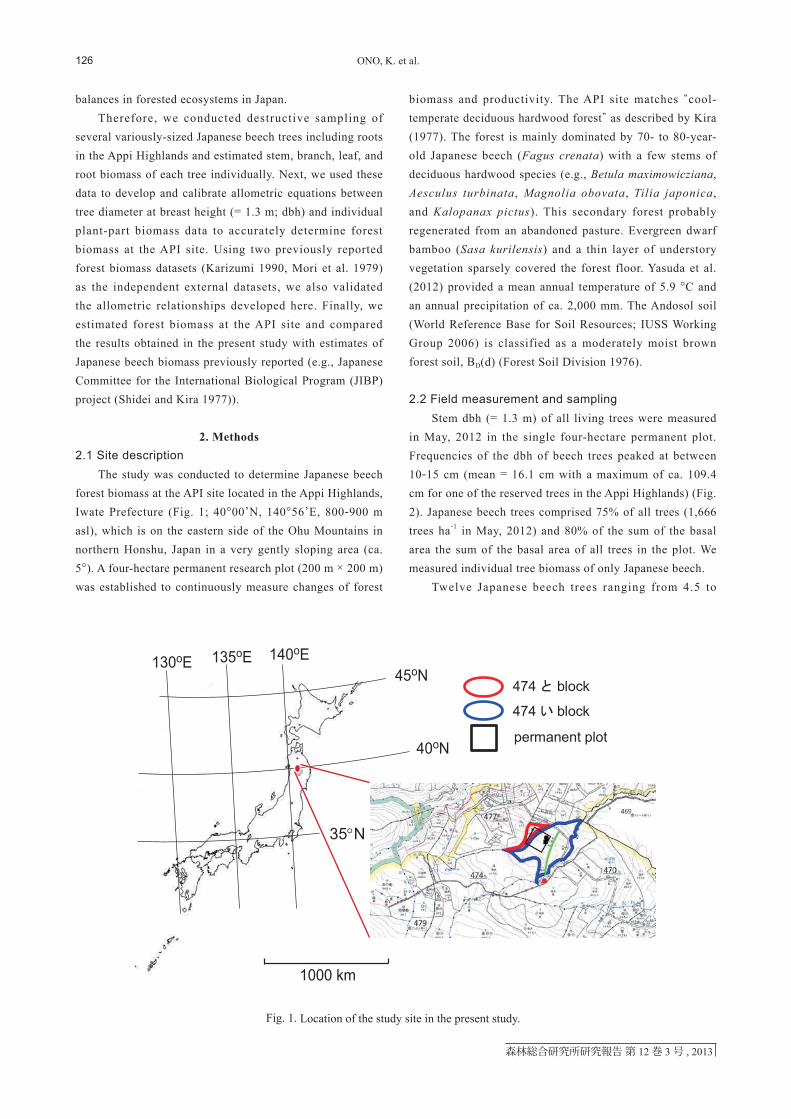
The study was conducted to determine Japanese beech forest biomass at the API site located in the Appi Highlands, Iwate Prefecture (Fig. 1; 40°00’N, 140°56’E, 800-900 m asl), which is on the eastern side of the Ohu Mountains in northern Honshu, Japan in a very gently sloping area (ca. 5°). A four-hectare permanent research plot (200 m × 200 m) was established to continuously measure changes of forest
biomass and productivity. The API site matches “cool-temperate deciduous hardwood forest” as described by Kira (1977). The forest is mainly dominated by 70- to 80-year-old Japanese beech (Fagus crenata) with a few stems of deciduous hardwood species (e.g., Betula maximowicziana, Aesculus turbinata, Magnolia obovata, Tilia japonica, and Kalopanax pictus). This secondary forest probably regenerated from an abandoned pasture. Evergreen dwarf bamboo (Sasa kurilensis) and a thin layer of understory vegetation sparsely covered the forest floor. Yasuda et al. (2012) provided a mean annual temperature of 5.9 °C and an annual precipitation of ca. 2,000 mm. The Andosol soil (World Reference Base for Soil Resources; IUSS Working Group 2006) is classified as a moderately moist brown forest soil, BD(d) (Forest Soil Division 1976).
2.2 Field measurement and samplingStem dbh (= 1.3 m) of all living trees were measured
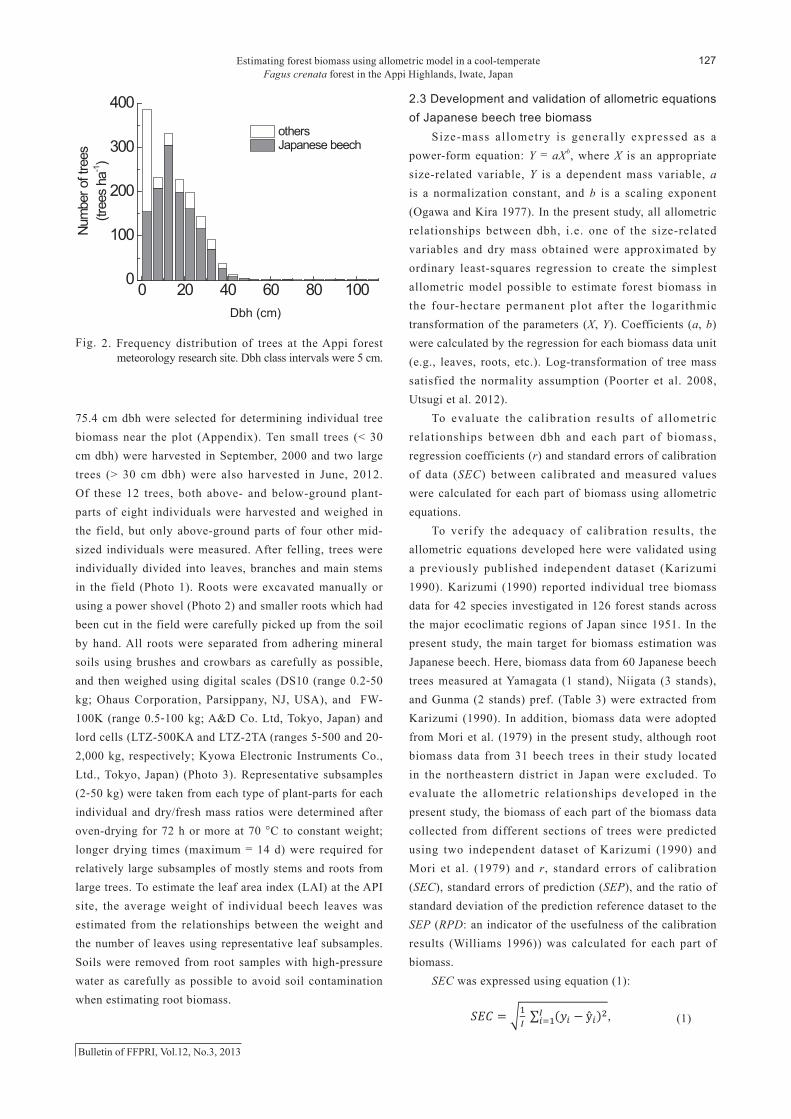
in May, 2012 in the single four-hectare permanent plot. Frequencies of the dbh of beech trees peaked at between 10-15 cm (mean = 16.1 cm with a maximum of ca. 109.4 cm for one of the reserved trees in the Appi Highlands) (Fig. 2). Japanese beech trees comprised 75% of all trees (1,666 trees ha-1 in May, 2012) and 80% of the sum of the basal area the sum of the basal area of all trees in the plot. We measured individual tree biomass of only Japanese beech.
Twelve Japanese beech trees ranging from 4.5 to
Fig. 1. Location of the study site in the present study.
27
441
442
Figure 1 Location of the study site in the present study.
1000 km
130oE 135oE 140oE45oN
40oN
35oN35°N
474 と block
474 い block
permanent plot
Estimating forest biomass using allometric model in a cool-temperateFagus crenata forest in the Appi Highlands, Iwate, Japan
127
Bulletin of FFPRI, Vol.12, No.3, 2013
75.4 cm dbh were selected for determining individual tree biomass near the plot (Appendix). Ten small trees (< 30 cm dbh) were harvested in September, 2000 and two large trees (> 30 cm dbh) were also harvested in June, 2012. Of these 12 trees, both above- and below-ground plant-parts of eight individuals were harvested and weighed in the field, but only above-ground parts of four other mid-sized individuals were measured. After felling, trees were individually divided into leaves, branches and main stems in the field (Photo 1). Roots were excavated manually or using a power shovel (Photo 2) and smaller roots which had been cut in the field were carefully picked up from the soil by hand. All roots were separated from adhering mineral soils using brushes and crowbars as carefully as possible, and then weighed using digital scales (DS10 (range 0.2-50 kg; Ohaus Corporation, Parsippany, NJ, USA), and FW-100K (range 0.5-100 kg; A&D Co. Ltd, Tokyo, Japan) and lord cells (LTZ-500KA and LTZ-2TA (ranges 5-500 and 20-2,000 kg, respectively; Kyowa Electronic Instruments Co., Ltd., Tokyo, Japan) (Photo 3). Representative subsamples (2-50 kg) were taken from each type of plant-parts for each individual and dry/fresh mass ratios were determined after oven-drying for 72 h or more at 70 °C to constant weight; longer drying times (maximum = 14 d) were required for relatively large subsamples of mostly stems and roots from large trees. To estimate the leaf area index (LAI) at the API site, the average weight of individual beech leaves was estimated from the relationships between the weight and the number of leaves using representative leaf subsamples. Soils were removed from root samples with high-pressure water as carefully as possible to avoid soil contamination when estimating root biomass.
2.3 Development and validation of allometric equations of Japanese beech tree biomass
Size-mass al lometry is generally expressed as a power-form equation: Y = aXb, where X is an appropriate size-related variable, Y is a dependent mass variable, a is a normalization constant, and b is a scaling exponent (Ogawa and Kira 1977). In the present study, all allometric relationships between dbh, i.e. one of the size-related variables and dry mass obtained were approximated by ordinary least-squares regression to create the simplest allometric model possible to estimate forest biomass in the four-hectare permanent plot after the logarithmic transformation of the parameters (X, Y). Coefficients (a, b) were calculated by the regression for each biomass data unit (e.g., leaves, roots, etc.). Log-transformation of tree mass satisfied the normality assumption (Poorter et al. 2008, Utsugi et al. 2012).
To evaluate the calibration results of al lometric relationships between dbh and each part of biomass, regression coefficients (r) and standard errors of calibration of data (SEC) between calibrated and measured values were calculated for each part of biomass using allometric equations.
To verify the adequacy of calibration results, the allometric equations developed here were validated using a previously published independent dataset (Karizumi 1990). Karizumi (1990) reported individual tree biomass data for 42 species investigated in 126 forest stands across the major ecoclimatic regions of Japan since 1951. In the present study, the main target for biomass estimation was Japanese beech. Here, biomass data from 60 Japanese beech trees measured at Yamagata (1 stand), Niigata (3 stands), and Gunma (2 stands) pref. (Table 3) were extracted from Karizumi (1990). In addition, biomass data were adopted from Mori et al. (1979) in the present study, although root biomass data from 31 beech trees in their study located in the northeastern district in Japan were excluded. To evaluate the allometric relationships developed in the present study, the biomass of each part of the biomass data collected from different sections of trees were predicted using two independent dataset of Karizumi (1990) and Mori et al. (1979) and r, standard errors of calibration (SEC), standard errors of prediction (SEP), and the ratio of standard deviation of the prediction reference dataset to the SEP (RPD: an indicator of the usefulness of the calibration results (Williams 1996)) was calculated for each part of biomass.
SEC was expressed using equation (1):
(1)
11
Yamagata (1 stand), Niigata (3 stands), and Gunma (2 stands) pref. (Table 3) were extracted 148
from Karizumi (1990). In addition, biomass data were adopted from Mori et al. (1979) in the 149
present study, although root biomass data from 31 beech trees in their study located in the 150
northeastern district in Japan were excluded. To evaluate the allometric relationships developed151
in the present study, the biomass of each part of the biomass data collected from different 152
sections of trees were predicted using two independent dataset of Karizumi (1990) and Mori et 153
al. (1979) and r, standard errors of calibration (SEC), standard errors of prediction (SEP), and 154
the ratio of standard deviation of the prediction reference dataset to the SEP (RPD: an indicator 155
of the usefulness of the calibration results (Williams 1996)) was calculated for each part of 156
biomass.157
SEC was expressed using equation (1):158
𝑆𝑆𝑆𝑆𝑆𝑆 = �1𝐼𝐼
∑ (𝑦𝑦𝑖𝑖 − ŷ𝑖𝑖)2𝐼𝐼𝑖𝑖=1 , (1)159
where y is the measured value and ŷ is the calibrated value of sample i, and I is the total number 160
of samples. For external predictions, the bias was determined as follows:161
𝑏𝑏𝑏𝑏𝑏𝑏𝑏𝑏 = �1𝐼𝐼
∑ (𝑦𝑦𝑖𝑖 − ŷ𝑖𝑖)𝐼𝐼𝑖𝑖=1 , (2)162
SEP was corrected for bias using equation (3):163
𝑆𝑆𝑆𝑆𝑆𝑆 = �1𝐼𝐼
∑ (𝑦𝑦𝑖𝑖 − ŷ𝑖𝑖 − 𝑏𝑏𝑏𝑏𝑏𝑏𝑏𝑏)2𝐼𝐼𝑖𝑖=1 , (3) 164
and RPD was also described as:165
RPD = (standard deviation of independent external dataset) / SEP. (4)166
167
28
443
Figure 2. Frequency distribution of trees at the Appi forest meteorology research site. Dbh class
intervals were 5 cm.
0 20 40 60 80 1000
100
200
300
400Nu
mbe
r of t
rees
(tree
s ha
-1)
dbh (cm)
others Japanese beech
Dbh (cm)
Fig. 2. Frequency distribution of trees at the Appi forest meteorology research site. Dbh class intervals were 5 cm.

森林総合研究所研究報告 第 12巻 3号 , 2013
ONO, K. et al.128
37
455
456
Phot
o 1.
Pro
cess
of d
ivid
ing
leav
es, b
ranc
hes a
nd m
ain
stem
s in
the
field
afte
r fel
ling
tree.
Fellin
g tre
e.R
emov
ing
bran
ches
Rem
ovin
g le
aves
from
bra
nche
sC
lass
ifyin
gle
aves
, bra
nche
s, a
nd m
ain
stem
s
Befo
re fe
lling.
Cut
ting
mai
n st
ems.
Phot
o 1.
Pro
cess
of d
ivid
ing
leav
es, b
ranc
hes a
nd m
ain
stem
s in
the
field
afte
r fel
ling.

Estimating forest biomass using allometric model in a cool-temperateFagus crenata forest in the Appi Highlands, Iwate, Japan
129
Bulletin of FFPRI, Vol.12, No.3, 2013
Photo 2. Root excavation using a power shovel and carefully picking up of small roots by hand which were left behind in the field.
38
Photo 2. Root excavation using a power shovel and carefully picking up of small roots by
hand which were left behind in the field.
Root excavation using a power shovel.
Carefully picking up of small roots from the soil.
Removing the soil from the stump.
Dividing small roots into several boxes after collection.

森林総合研究所研究報告 第 12巻 3号 , 2013
ONO, K. et al.130
39
459
Photo 3. Weight of all parts of a felled tree using a lord cell in the field.
After weighing, representative subsamples were taken back to the laboratory and
dry/fresh mass ratios were determined after over-drying at 70 °C.
Weighing root stumps.Weighing main stems.
Weighing leaves and branches.
Photo 3. Weight of all parts of a felled tree using a lord cell in the field. After weighing, representative subsamples were taken back to the laboratory and dry/fresh mass ratios were determined after over-drying at 70 °C.
where y is the measured value and ŷ is the calibrated value of sample i, and I is the total number of samples. For external predictions, the bias was determined as follows:
(2)
SEP was corrected for bias using equation (3):
(3)
and RPD was also described as:
RPD = (standard deviation o f independent external dataset) / SEP. (4)
2.4 Comparison of Japanese beech tree biomass estimation at the API site with previous studies
Allometric equations were developed to estimate the biomass of Japanese beech trees at the API site. Then these forest biomass estimates were compared with previously reported biomass data such as data from the research project established by the Japanese Committee for the International Biological Program (JIBP) (Shidei and Kira 1977).
11
Yamagata (1 stand), Niigata (3 stands), and Gunma (2 stands) pref. (Table 3) were extracted 148
from Karizumi (1990). In addition, biomass data were adopted from Mori et al. (1979) in the 149
present study, although root biomass data from 31 beech trees in their study located in the 150
northeastern district in Japan were excluded. To evaluate the allometric relationships developed151
in the present study, the biomass of each part of the biomass data collected from different 152
sections of trees were predicted using two independent dataset of Karizumi (1990) and Mori et 153
al. (1979) and r, standard errors of calibration (SEC), standard errors of prediction (SEP), and 154
the ratio of standard deviation of the prediction reference dataset to the SEP (RPD: an indicator 155
of the usefulness of the calibration results (Williams 1996)) was calculated for each part of 156
biomass.157
SEC was expressed using equation (1):158
𝑆𝑆𝑆𝑆𝑆𝑆 = �1𝐼𝐼
∑ (𝑦𝑦𝑖𝑖 − ŷ𝑖𝑖)2𝐼𝐼𝑖𝑖=1 , (1)159
where y is the measured value and ŷ is the calibrated value of sample i, and I is the total number 160
of samples. For external predictions, the bias was determined as follows:161
𝑏𝑏𝑏𝑏𝑏𝑏𝑏𝑏 = �1𝐼𝐼
∑ (𝑦𝑦𝑖𝑖 − ŷ𝑖𝑖)𝐼𝐼𝑖𝑖=1 , (2)162
SEP was corrected for bias using equation (3):163
𝑆𝑆𝑆𝑆𝑆𝑆 = �1𝐼𝐼
∑ (𝑦𝑦𝑖𝑖 − ŷ𝑖𝑖 − 𝑏𝑏𝑏𝑏𝑏𝑏𝑏𝑏)2𝐼𝐼𝑖𝑖=1 , (3) 164
and RPD was also described as:165
RPD = (standard deviation of independent external dataset) / SEP. (4)166
167
Estimating forest biomass using allometric model in a cool-temperateFagus crenata forest in the Appi Highlands, Iwate, Japan
131
Bulletin of FFPRI, Vol.12, No.3, 2013
.3. Results3.1 Allometric equation development
The allometric equations developed for estimation of biomass of stems, branches, leaves, and roots of beech trees at the API site were strongly positively correlated with dbh (Adjusted R2 = 0.92 to 0.99; Table 1, Fig. 3). Calibration results using the allometric equations developed for each part of biomass of Japanese beech trees agreed very closely with measured biomass values (Fig. 4). Regression coefficients (r) showed high values ranging from 0.97 to 1.00 and SEC was less than 10% of data ranges for all parts of biomass except for leaf biomass (Fig. 4, Appendix). Thus, the allometric equations developed in the present study showed a close fit as well (Fig. 4).
Figure 5 shows the validation results using the external independent datasets of Karizumi (1990) and Mori et al. (1979). The values determined by destructive measurement showed a close correlation with those predicted by the allometric equation developed in the present study for stem (n = 91, r = 0.97), branch (n = 91, r = 0.94), and root (n = 60, r = 0.94) biomass, respectively. However, the regression coefficient for leaf biomass, which is a very small proportion of an entire tree, was not as high, r = 0.73, because the SEP for leaf biomass was relatively large when compared to other parts of biomass. Also, for prediction results of leaf and root biomass, their biomass for some of small-sized trees (dbh < 10 cm) were underestimated although those for middle- and large-sized trees were estimated quite well (Fig. 5). Moreover, RPD values for branch and leaf biomass were low, below 2.0 (Fig. 5). Inversely, those for stem and root biomass were high, 3.4 and 2.6, respectively (Fig. 5).
Meanwhile, the prediction data for individual parts of Japanese beech tree were close to the 1:1 line except for leaf and root biomass for some of small-sized trees (dbh < 10). Thus, the allometric equations developed in the present study showed relatively good prediction results (Fig. 5).
3.2 Biomass and biomass allocation in Japanese beech forests at the Appi Highlands
Table 2 summarizes estimates of above- and below-ground biomass in a Japanese beech forest at the API site in May, 2012. The estimates of respective parts of beech tree biomass were 184, 31, 3, and 52 t ha-1 for stems, branches, leaves, and roots, respectively. Total above-ground biomass (TAGB) was estimated to be 217 t ha-1 and the ratio of TAGB to root biomass (T/R) was 4.2. At the API site, 25% of the trees and 20% of the sum of the stand basal areas were not Japanese beech trees. By assuming that all trees in the stand except for Japanese beech have the same allometric relationships as those of the same-sized Japanese beech trees, the biomass of the API site was estimated to be 343 t ha-1 (Table 2). Therefore, 27% of forest biomass at the API site was attributed to tree biomass of species other than Japanese beech. Since the average dry weight of a single leaf was estimated to be 0.174 ± 0.009 g in 2012, gravimetry could be used to calculate that there were
32
447 Table 1. Coefficients and other allometric statistics (Y = a × Xb) used for estimating respective
parts of biomass. X, an appropriate size-related variable; Dbh, means stem diameter at breast
height (= 1.3 m).
n Adjusted R 2
Y (kg per tree) X (cm) a bStem Dbh 0.0946 2.44 12 0.99
Branch Dbh 0.0049 2.78 12 0.96Leaf Dbh 0.0010 2.56 12 0.92Root Dbh 0.0147 2.62 8 0.99
Variables Coefficients
Table 1. Coefficients and other allometric statistics (Y = a × Xb) used for estimating respective parts of biomass. X, an appropriate size-related variable; Dbh, means stem diameter at breast height (= 1.3 m).
33
448
449
450
451
Table 2. Estimates of respective parts of tree biomass, total above-ground biomass (TAGB), total
biomass (TB), and T/R at the Appi forest meteorology research site.
Beech tree All tree*
Stem (t ha-1) 183.9 233.8Branch (t ha-1) 30.5 39.2Leaf (t ha-1) 2.8 3.5Root (t ha-1) 52.3 66.9TAGB (t ha-1) 217.1 276.5TB (t ha-1) 269.4 343.4T/R 4.2 4.1*taking tree biomass of other tree speciesaside from Japanese beech intoconsideration.
Table 2. Estimates of respective parts of tree biomass, total above-ground biomass (TAGB), total biomass (TB), and T/R at the Appi forest meteorology research site.

森林総合研究所研究報告 第 12巻 3号 , 2013
ONO, K. et al.132
29
Figure 3. Allometric relationships between dbh and dry mass of above- and below-ground
biomass of Japanese beech trees at the Appi forest meteorology research site. Solid lines were
drawn by least-square regression.
1 10 1001
10
100
1000
Stem
(kg)
dbh (cm)
(a)
1 10 1000.1
1
10
100
1000(b)
Bran
ch (k
g)dbh (cm)
1 10 1000.01
0.1
1
10
100 (c)
dbh (cm)
Leaf
(kg)
1 10 100
1
10
100
1000 (d)Ro
ot (k
g)
dbh (cm)Dbh (cm) Dbh (cm)
Dbh (cm)Dbh (cm)
Fig. 3. Allometric relationships between dbh and dry mass of above- and below-ground biomass of Japanese beech trees at the Appi forest meteorology research site. Solid lines were drawn by least-square regression.
ca. 0.4 million of leaves in a measured tree with large dbh (= 75.4 cm), which is a reserved size tree, and that there were approximately 20 million of leaves in one-hectare of Japanese beech forest at the API site. In our previous study, Yasuda et al. (2012) reported that the specific leaf area (SLA) in the API site was 0.0154 m2 g-1. Based on this value, the mean area of a single leaf and LAI at the API site were estimated at 0.00268 m2 per leaf and 5.45 m2 m-2, respectively.
4. Discussion4.1 Accuracy of allometric relationships
C u r r e n t l y, t h e c h a r a c t e r i z a t i o n o f a l l o m e t r i c relationships between individual parts of biomass including roots and size-related variables (dbh and height) has been widely accepted and applied by numerous previous studies for estimating forest biomass (i .e. , Karizumi 1974, Shidei and Kira 1977). The accuracy of forest biomass estimates depends on the variation and quality of data used for developing allometric equations because

Estimating forest biomass using allometric model in a cool-temperateFagus crenata forest in the Appi Highlands, Iwate, Japan
133
Bulletin of FFPRI, Vol.12, No.3, 2013
30
445
Figure 4. Calibrated values versus measured values for each part of biomass of Japanese beech
trees. Solid lines are the 1:1 line, having a slope of 1. r: regression coefficients; SEC:
standard errors of calibration.
1 10 100 10001
10
100
1000
StemCa
libra
ted
valu
es (k
g)
Measured values (kg)
n = 12r = 0.99SEC = 122.8
0.1 1 10 1000.1
1
10
100
n = 12r = 0.97SEC = 8.6
Leaf
Calib
rate
d va
lues
(kg)
Measured values (kg)
0.1 1 10 100 10000.1
1
10
100
1000
n = 12r = 0.99SEC = 47.3
branch
Calib
rate
d va
lues
(kg)
Measured values (kg)0.1 1 10 100 1000
0.1
1
10
100
1000
n = 8r = 1.00SEC = 34.9
RootCa
libra
ted
valu
es (k
g)
Measured values (kg)
Branch
Fig. 4. Calibrated values versus measured values for each part of biomass of Japanese beech trees. Solid lines are the 1:1 line, having a slope of 1. r: regression coefficients; SEC: standard errors of calibration.
allometric relationships between tree biomass and size-related variables shows specific tendencies under different environmental conditions (i .e. , tree species, cl imate zone) (Kira and Shidei 1967, Research Group on Forest Productivity of the Four Universities 1960). In the present study, sample trees used for making allometric equation for estimating each part of biomass of Japanese beech ranged from small- to large-sized trees typical of the forest at the API site (Fig. 2 and Appendix). In addition, dbh was adopted as an appreciable size-related variable to make the simplest allometric equation used to estimate forest biomass in a four-hectare plot (Fig. 3). As a result of allometric equation development for estimating tree biomass, linear relationships and high regression coefficients (r) were
obtained between calibrated and measured values (Fig. 4). Moreover, RPD values, an indicator of the usefulness of the calibration results, were calculated for validating the accuracy of these allometric equations. According to Williams (1996), an RPD value of 2.5-3.0 is regarded as adequate for rough prediction. Validation results for stem and root biomass estimates using independent external datasets (n = 91 and 60, respectively) reported by Karizumi (1990) and Mori et al. (1979) were also good: r = 0.97 and 0.94, and RPD = 3.4 and 2.6, respectively (Fig. 5). However, validation results for branch and leaf biomass estimates showed that these estimates were not as accurate (RPD = 2.0 and 1.4, respectively) because of relatively larger SEP of branch and leaf estimates for the validation

森林総合研究所研究報告 第 12巻 3号 , 2013
ONO, K. et al.134
dataset when compared with stem and root biomass estimates (Fig. 5). In addition, site-specific characteristics (i.e., soil condition, forest structure, tree density, age, climate, etc.) may influence the allometric relationships between size-related variables (e.g., dbh) and each part of biomass except for stem (Research Group on Forest Productivity of Four Universities and Shinshu University 1966, Saito et al. 1968). Therefore, leaf and root biomass for some of small-sized trees were underestimated although those for middle- and large-sized trees were reasonable estimates (Fig. 5). However, insufficient accuracy of biomass estimates might be insignificant and relatively unaffected when estimating the total forest biomass at the
API site because stem biomass was a main component of forest biomass and biomass underestimation occurred only for other plant-parts and only for some of small-sized trees (dbh < 10 cm).
4.2 Forest biomass of Japanese beechIn the present study, nine reports covering a total of
39 forest stands were selected regarding the study of forest biomass of Japanese beech (Table 3). They were based on destructive measurements of each part of biomass of individual trees. Some reports did not provide (or did not determine) some parts of biomass data (e.g., root biomass). Most of these studies were conducted as part of a research
31
446
Figure 5. Predicted values versus measured values of external independent data for each part of
biomass of Japanese beech trees. Solid lines are the 1:1 line, having a slope of 1. n: number
of data; r: regression coefficients; SEP: standard errors of prediction; RPD: ratio of standard
deviation of prediction dataset to SEP.
0.1 1 10 1000.1
1
10
100
n = 60r = 0.94SEP = 13.1RPD = 2.6
RootPr
edict
ed v
alue
s (k
g)
Measured values (kg)
0.1 1 10 100 10000.1
1
10
100
1000Stem
Pred
icted
val
ues
(kg)
Measured values (kg)
n = 91r = 0.97SEP = 73.0RPD = 3.4
1E-3 0.01 0.1 1 101E-3
0.01
0.1
1
10
n = 91r = 0.73SEP = 3.2RPD = 1.4
Leaf
Pred
icted
val
ues
(kg)
Measured values (kg)
0.01 0.1 1 10 100 10000.01
0.1
1
10
100
1000
n = 91r = 0.94SEP = 45.2RPD = 2.0
branch
Pred
icted
val
ues
(kg)
Measured values (kg)
Branch
Fig. 5. Predicted values versus measured values of external independent data for each part of biomass of Japanese beech trees. Solid lines are the 1:1 line, having a slope of 1. r: regression coefficients; SEP: standard errors of prediction; RPD: ratio of standard deviation of prediction dataset to SEP.

Estimating forest biomass using allometric model in a cool-temperateFagus crenata forest in the Appi Highlands, Iwate, Japan
135
Bulletin of FFPRI, Vol.12, No.3, 2013
project established by the Japanese Committee for the International Biological Program (JIBP) in 1960s-1970s, which focused on biological productivity and ecological processes in the forest ecosystems in Japan (e.g., Shidei and Kira 1977). All these studies applied allometric equations for estimating forest biomass using the relationships between tree biomass and tree size-related variables (dbh, diameter at the stem base (d0), and tree height) (Kira and Shidei 1967).
Forest biomass of Japanese beech forests greatly varied among the forest stands, ranging from 35 to 441 t ha-1 because the study sites have a variety of microsite conditions (elevation, slope direction, age, density, growth stage, forest type, tree size, etc.) (Table 3). The relationships between tree age, tree size (tree height, BA) and forest biomass were not clear. However, stands with small amount of biomass (e.g., Gunma F2, Mie P1) tended to be relatively young forest with small tree sizes, while most of the stands with a large biomass exceeding 300 t ha-1 were mature and older-aged forests, which probably negated the effects of tree size or tree density because they reflected the influences of past and more extensive forest management. The forest biomass at the API site was estimated to be 343 t ha-1, which is slightly higher than average values from other studies (Tables 2 and 3). Furthermore, the amount of biomass allocated to each part of the tree varied among the stands (Table 3). As a result, the ratio of TAGB to root biomass (T/R) ranged widely from 2.4 to 6.7 (Table 3), and was probably affected by each stand’ s growth stages and site conditions.
5. ConclusionWe developed accurate allometric relationships for
estimating whole tree biomass of Japanese beech in the Appi Highlands. Using two independent external datasets, validation results for stem, branch, and root biomass estimates were quite good although those for leaf biomass were not very accurate estimates because of the relatively large SEP of branch and leaf biomass for the validation dataset and underestimation of leaf and root biomass for small-sized trees. Low accuracy of their biomass estimates may have not hindered the estimation of forest biomass at the API site. This occurred because stem biomass was the main component of forest biomass and insufficient accuracy for estimates of other parts of biomass were caused only by data from some small-sized trees (dbh < 10 cm). The forest biomass in the API site was estimated to be 343 t ha-1 using the developed allometric equations. This value was slightly higher than average values of Japanese beech forest that
had already been estimated in previous studies. The results of the present study will be helpful for advancing further studies on the determination and clarification of NEP and the cross-validation of the results of GPP estimation and carbon flux observation in Japanese beech forests, which is one of the most typical species in the cool-temperate regions of northeastern Japan.
Acknowledgments We are grateful to Drs. Kaoru Niiyama, Tomomasa
Amano, and Gaku Hitsuma for their valuable advice and comments, and we thank Drs. Masaki Jinkawa, Tatsuya Sasaki , Shoji Noguchi , Tsutomu Yagihashi , Takashi Okamoto, Yu Ichihara, Tsuyoshi Yamada, Takuya Aikawa, Koji Shichi, Mohoko Noguchi, Mayuko Jomura, Mr. Toshihiko Takahashi, and Ms. Keiko Sawai for their help with field work and laboratory analysis. We wish to express our appreciation to the staff of Abe Ringyo Co. Ltd. and the Iwate-hokubu District Forest Office since their advice and assistance were extremely helpful during our study. This study was supported in part by the Japanese Ministry of the Environment program, titled “Evaluation, Adaptation and Mitigation of Global Warming in Agriculture, Forestry, and Fisheries: Research and Development (A1120)” and by Grants-in-Aid for scientific research from the Japanese Ministry of Education, Culture, Sports, Science, and Technology, titled “Evaluation of the GHGs emission processes from forest soil surface to atmosphere in snow cold areas (No. 24380086)” .
ReferencesFFPRI FluxNet (2013) FFPRI FluxNet website, http://
www2.ffpri.affrc.go.jp/labs/flux/index. html, Accessed 29 Jan 2013.
Forest Soil Division (1976) Classification of forest soil in Japan (1975). Bull. Gov. For. Exp. Stat., 280, 1-28.
Hash imoto , T. , Miu ra , S . and I sh i zuka , S . (2009) Temperature controls temporal variation in soil CO2 efflux in a secondary beech forest in Appi Highlands, Japan. J. For. Res., 14, 44-50.
Ishizuka, S., Sakata, T., Sawata, S., Ikeda, S., Takenaka, C., Tamai, N., Sakai, H., Shimizu, T., Kan-na, K., Onodera, S., Tanaka, N. and Takahashi, M. (2006) High potential for increase in CO2 fluz from forest soil surface dur to global warming in cooler areas of Japan. Ann. For. Sci., 63, 537-546.
IUSS Working Group (2006) World Reference Base for Soil Resource 2006: A Framework for International Classification, Correlation and Communication: World

森林総合研究所研究報告 第 12巻 3号 , 2013
ONO, K. et al.136
Soil Resource Reports, vol. 103, 128 pp.Kakubari, Y. (1977) Chapter 7. Studies at IBP Research
Sites (JIBP/PT Supporting Projects). 7.3 Beech forests in Naeba Mountains. [Part II] Distribution of primary productivity along the altitudinal gradient. In Shidei, T. and Kira, T. (eds.) “JIBP synthesis. Vol. 16. Primary productivity of Japanese forests. - Productivity of terrestrial communities -”. Japanese Committee for the International Biological Program, University of Tokyo press, 201-212.
Karizumi, N. (1974) The mechanism and Function of tree root in the process of forest production. I. Methods of investigation and estimation of the root biomass. Bull. Gov. For. Exp. Sta., 259, 1-99.
Karizumi, N. (1990) The mechanism and Function of tree root in the process of forest production. V. Reduction of inorganic matters to soil and formation of porosity resulting from root system. Bull. FFPRI., 357, 1-49.
Karizumi, N. (2010) The latest illustrations of tree roots. General remarks. Seibundo Shinkosha Publishing Co. Ltd, 937 pp.
Katagiri, S. and Tsutsumi, T. (1975) The relationship between site condition and circulation of nutrients in forest ecosystem (III). Above ground biomass and nutrient contents of stands. J. Jap. For. Soc., 57, 412-419.
Kawahara, T., Tadaki, Y., Takeuchi, I., Sato, A., Higuchi, K. and Kamo, K. (1979) Productivity and cycling of organic matter in natural Fagus crenata and two olanted Chamaecyparis obtuse forests. Jap. J. Ecol., 29, 387-395.
Kawaguchi, H. and Yoda, K. (1986) Carbon-cycling changes during regeneration of a deciduous broadleaf forest after clear-cutting. I. Changes in organic matter and carbon storage. Jap. J. Ecol., 35, 551-563
Kawaguchi, H. and Yoda, K. (1989) Carbon-cycling changes during regeneration of a deciduous broadleaf forest after clear-cutting. II. Aboveground net production. Ecol. Res., 4, 271-286.
Kira, T. (1977) Chapter 1. Forest vegetation of Japan. 1.1 Introduction. In Shidei, T. and Kira, T. (eds.) “JIBP synthesis. Vol. 16. Primary productivity of Japanese forests. - Productivity of terrestrial communities -”. Japanese Committee for the International Biological Program, University of Tokyo press, 1-9.
Kira , T. and Shide i , T. (1967) Pr imary product ion and turnover of organic matter in different forest ecosystems of the western Pacific. Jap. J. Ecol., 17, 70-87.
Koarashi, J., Atarashi-Andoh, M., Ishizuka, S., Miura, S., Saito, T. and Hirai, K. (2009) Quantitative aspects of heterogeneity in soil organic matter dynamics in a cool-temperate Japanese beech forest: a radiocarbon-based approach. Global Change Biology, 15, 631-642.
Maruyama K (1977) Chapter 7. Studies at IBP Research Sites (JIBP/PT Supporting Projects). 7.3 Beech forests in Naeba Mountains. [Part I] Comparison of forest structure, biomass and net productivity between the upper and lower parts of beech forest zone. In Shidei, T. and Kira, T. (eds.) “JIBP synthesis. Vol. 16. Primary productivity of Japanese forests. - Productivity of terrestrial communities -”. Japanese Committee for the International Biological Program, University of Tokyo press, 185-200.
Mizoguchi, Y., Ohtani, Y., Takanashi, S., Iwata, H., Yasuda, Y. and Nakai, Y. (2012) Seasonal and interannual variation in net ecosystem production of an evergreen needleleaf forest in Japan. J. For. Res., 17, 283-295.
Mori M., Inuma M., Sato A. and Saito K. (1979) Land-use and management of Japanese beech natural forests in east- northern district of Japan (Investigation of forest biomass and forest production). In Agriculture, Forestry and Fisheries Research Council (ed.) “Report of Comprehensive studies on conservation technology in agriculture, forestry, and Fishery environments.” Agriculture, Forestry and Fisheries Research Council, 5:83-93.
Ogawa, H. and Kira, T. (1977) Chapter 2. Methodology. 2.1 Methods of estimating forest biomass. In Shidei, T., and Kira, T. (eds.) “JIBP synthesis. Vol. 16. Primary productivity of Japanese forests. - Productivity of terrestrial communities -”. Japanese Committee for the International Biological Program, University of Tokyo press, 15-25.
Ogino, K. (1977) Chapter 7. Studies at IBP Research Sites (JIBP/PT Supporting Projects). 7.2 A beech forest at Ashiu. - biomass, its increment and net production. In Shidei, T. and Kira, T. (eds.) “JIBP synthesis. Vol. 16. Primary productivity of Japanese forests. - Productivity of terrestrial communities -”. Japanese Committee for the International Biological Program, University of Tokyo press, 172-185.
Poorter, L., Wright, S. J., Paz, H., Ackerly, D. D., Condit, R., Ibarra-Manriquez, G., Harms, K. E., Licona, J. C., Martinez-Ramos, M., Mazer, S. J., Muller-Landau, H. C., Pena-Claros, M., Webb, C. O. and Wright, J. J. (2008) Are functional traits good predictors of demographic rates? Evidence from five neotropical

Estimating forest biomass using allometric model in a cool-temperateFagus crenata forest in the Appi Highlands, Iwate, Japan
137
Bulletin of FFPRI, Vol.12, No.3, 2013
forests. Ecology, 89, 1908-1920.Research Group on Forest Product ivi ty of the Four
Universities (1960) Studies on the productivity of the forest. Part I. Essential needle-leaved forests of Hokkaido. Kokusaku Pulp Industry Ltd. 99 pp.
Research Group on Forest Productivity of Four Universities and Sh inshu Unive r s i ty (1966) S tud ies on the productivity of forest. Part III. Productivity of Sugi forests. Jap. For. Tech. Assoc. 63 pp.
Saito, H., Tamai, S., Ogino, K. and Shidei, T. (1968) Studies on the effects of thinning from small diameter trees (III). Changes in stand condition after the second growing season. Bull. Kyoto Uni. For., 40, 81-92.
Shidei, T. and Kira, T. (1977) JIBP synthesis. Vol. 16. Primary productivity of Japanese forests. - Productivity of terrestrial communities -”. Japanese Committee for the International Biological Program, University of Tokyo press, 289 pp.
Tadaki, Y., Hachiya, K. and Tochiaki, K. (1969) Studies on the production structure of forest (XV). Primary productivity of Fagus crenata in plantation. J. Jap. For. Soc., 51, 331-339.
Tateno, R., Hishi, T. and Takeda, H. (2004) Above- and Belowground biomass and net primary production in a cool-temperate deciduous forest in relation to topographical changes in soil nitrogen. For. Ecol. Manag., 193, 297-306.
Ustugi , H. , Suganuma, H. , Aikawa, S. , Koj ima, T. , Tanouchi, H. and Tabuchi, R. (2012) General allometric equations for Eucalyptus camaldulensis and other tree species. J. For. Manage., 6, 241-250.
Yasuda, Y., Saito, T., Hoshino, D., Ono, K., Ohtani, Y., Mizoguchi, Y. and Morisawa, T. (2012) Carbon balance in a cool-temperate deciduous forest in northern Japan: seasonal and interannual variations, and environmental controls of its annual balance. J. For. Res., 17, 253-267.
Williams, P. (1996) Recent advances in near-infrared applications for the agriculture and food industries. Dai 12kai Nihon syokuhin kagaku kougaku-kai Hihakai keisoku Symposium Kouen Yousisyuu, 1-11.

森林総合研究所研究報告 第 12巻 3号 , 2013
ONO, K. et al.138
34
452
Table 3. Biomass of Japanese beech forests.
(m) (yr) (trees ha-1) (m) (m2 ha-1)Iwate 40°00'N 140°56'E 825 API Natural 80 1,666 13.9 44.4Yamagata 38°36'N 140°11'E -- F3 Natural 40 1,246 16.1 25.1Niigata 37°30'N 139°00'E 400 P3 Planted 35 5,233 10.0 40.6
470 P4 Planted 41 2,186 13.6 38.8580 P6 Planted >50 2,829 13.9 39.9
Niigata 37°01'N 138°37'E -- F4 Planted 35 1,154 11.5 45.6-- F5 Planted 37 2,184 12.6 34.8-- F6 Planted 37 2,829 16.1 46.3
Niigata 36°51'N 138°41'E 550 P1 Natural to 100 375 18.8 24.9700 P2 Natural to 100 327 15.6 24.5700 P3 Natural to 100 235 24.6 32.7900 P4 Natural to 100 680 11.2 22.7
1100 P5 Natural to 100 1,050 7.3 21.91300 P6 Natural to 100 875 8.3 14.41500 P7 Natural to 100 590 9.6 17.71500 P8 Natural to 100 357 12.6 21.4
Niigata 36°51'N 138°41'E 650 650-1 Natural to 100 367 24.6 43.3650 650-2 Natural to 100 289 23.6 41.3700 700-1 Natural to 100 321 25.3 44.0700 700-2 Natural to 100 470 18.7 39.2700 700-3 Natural to 100 356 22.3 46.9700 700-4 Natural to 100 400 23.0 39.1900 900-1 Natural to 100 1,016 8.7 40.4
1300 1300-1 Natural to 100 959 11.3 38.51500 1500-1 Natural to 100 639 11.5 37.51500 1500-2 Natural to 100 422 13.2 33.51500 1500-3 Natural to 100 820 10.6 34.7
Gunma 36°46'N 138°58'E -- F2 Natural 40 975 7.6 4.536°52'N 139°05'E -- F1 Natural 125 611 21.0 31.0
Tochigi 36°47'N 139°56'E 940 -- Natural mature 868 11.2 29.7940 -- Natural mature 844 11.5 30.9
Kyoto 35°20'N 135°45'E 680 -- Natural ca. 150 785 14.3 30.7Kyoto 35°18'N 135°43'E 725 N-1 Natural -- 2,737 7.9 19.9
35°18'N 135°43'E 725 N-7 Natural -- 3,808 6.0 25.6Kyoto 35°18'N 135°43'E 680-720 Natural ca. 100 1,572 -- 31.7Mie 34°41'N 136°16'E 670 P1 Natural 12 63,258 3.4 25.1
34°41'N 136°16'E 670 P2 Natural 45 19,893 6.5 34.134°41'N 136°16'E 675 P3 Natural 75 19,279 8.8 43.534°41'N 136°16'E 675 P4 Natural 100 3,540 11.4 44.134°41'N 136°16'E 650 P5 Natural mature 11,063 15.0 54.8
Ave. -- -- -- -- -- -- -- 13.7 33.5SD -- -- -- -- -- -- -- 5.7 10.4Min. -- -- -- -- -- -- -- 3.4 4.5Max. -- -- -- -- -- -- -- 24.6 54.8Range -- -- -- -- -- -- -- 21.3 50.3
Prefecture Lat. Long. Elev.ForestType
Subsites Age DensityAve.Tree
Height
BasalArea
Table 3. Biomass of Japanese beech forests.

Estimating forest biomass using allometric model in a cool-temperateFagus crenata forest in the Appi Highlands, Iwate, Japan
139
Bulletin of FFPRI, Vol.12, No.3, 201335
453 Stem Branch Leaf TAGB Root
(t ha-1) (t ha-1) (t ha-1) (t ha-1) (t ha-1) (t ha-1)343.4 233.8 39.2 3.5 276.5 66.9 4.1 allometry the present study252.0 162.7 37.4 3.6 203.7 48.3 4.2 allometry Karizumi (1990, 2010)258.4 168.0 31.4 4.8 204.2 54.2 3.8272.9 166.5 43.5 4.7 214.7 58.2 3.7296.5 202.2 39.5 4.9 246.6 49.9 4.9372.6 233.3 58.2 7.1 298.6 74.0 4.0289.3 171.9 53.2 5.1 230.2 59.1 3.9441.0 292.6 60.2 7.3 360.1 80.9 4.5332.3 227.2 45.9 2.4 275.5 56.8 4.9370.5 250.6 54.0 2.4 307.0 63.5 4.8415.4 281.6 60.0 2.7 344.3 71.1 4.8417.7 243.9 99.8 3.8 347.5 70.2 5.0364.8 213.9 86.1 3.6 303.6 61.2 5.0241.6 161.0 42.2 2.4 205.6 36.0 5.7183.3 118.3 31.0 1.8 151.1 32.2 4.7208.1 133.9 35.6 1.9 171.4 36.7 4.7334.2 275.1 56.1 3.0 334.2 -- --349.2 287.7 58.6 2.9 349.2 -- --361.6 299.7 58.9 3.0 361.6 -- --313.8 256.9 54.4 2.5 313.8 -- --365.2 301.1 60.9 3.2 365.2 -- --311.6 258.0 50.9 2.7 311.6 -- --256.4 181.0 72.2 3.2 256.4 -- --245.8 192.3 50.4 3.1 245.8 -- --207.1 161.6 43.0 2.5 207.1 -- --152.9 119.4 31.6 1.9 152.9 -- --214.0 167.0 44.3 2.7 214.0 -- --35.3 18.1 5.9 1.0 25.0 10.3 2.4 Karizumi (1990, 2010)
304.3 237.2 26.0 1.7 264.9 39.4 6.7233.1 156.1 77.0 -- 233.1 -- --247.2 163.0 81.2 3 247.2 -- --357.0 194.3 95.1 3 292.4 64.6 4.5 allometry Ogino (1977)79.1 56.0 19.9 3.2 79.1 -- --78.5 56.5 18.7 3.3 78.5 -- --
195.8 -- -- -- 156.2 39.6 3.9 allometry Tateno & Takeda (2004)39.6 23.5 6.2 2.3 32.0 7.6 4.290.1 55.5 14.7 1.9 72.2 17.9 4.0
156.2 96.8 25.7 2.4 124.9 31.3 4.0226.6 141.2 37.5 2.4 181.0 45.6 4.0321.8 201.0 53.3 2.6 256.9 64.9 4.0263.4 183.6 47.7 3.1 232.4 49.6 4.4104.2 76.8 22.1 1.3 92.7 19.7 0.835.3 18.1 5.9 1.0 25.0 7.6 2.4
441.0 301.1 99.8 7.1 365.2 80.9 6.7405.7 283.0 93.9 6.1 340.2 73.3 4.3
Katagiri and Tsutsumi(1975)
Biomass of respective tree partsBiomass
estimationmethod
T/R Reference
Tadaki et al. (1969)
Forestbiomass
Maruyama (1977)
Kakubari (1977)
Kawahara et al. (1979)
allometry
allometry
Karizumi (1990, 2010)allometry
allometry
Kawaguchi and Yoda(1986, 1989)
allometry
allometry
allometry
allometry

森林総合研究所研究報告 第 12巻 3号 , 2013
ONO, K. et al.140
36
454 Appendix. All data sets for dry weight (kg) of plant parts biomass, total above-ground biomass
(TAGB), total biomass (TB), diameter at breast height (dbh), tree height (H), and bole height
(HB).
Dbh H HB Stem Branch Leaf TAGB Root TB(cm) (m) (m) (kg) (kg) (kg) (kg) (kg) (kg)
F1 17.3 17.4 9.7 130.5 17.6 2.6 150.7 -- --F2 8.0 11.1 7.2 13.9 0.6 0.1 14.6 3.3 17.9F3 19.1 18.7 13.4 159.0 34.1 2.7 195.8 37.3 233.0F4 7.3 10.0 7.0 12.4 1.9 0.2 14.5 3.6 18.0F5 6.2 7.8 4.2 8.2 0.6 0.1 8.8 2.1 10.9F6 4.5 5.3 2.0 3.9 0.5 0.1 4.5 0.7 5.2F7 28.4 18.3 10.7 307.9 29.0 2.9 339.7 -- --F8 21.0 18.6 8.6 220.3 39.0 1.6 260.8 -- --F9 13.3 12.2 6.4 45.1 5.8 0.2 51.1 -- --F10 12.4 12.3 7.6 30.0 5.2 0.4 35.6 7.1 42.7F11 55.9 18.2 5.1 1394.6 409.0 54.6 1858.2 533.7 2391.9F12 75.4 23.8 5.4 3816.9 680.0 69.5 4566.3 1328.4 5894.7Ave. 22.4 14.5 7.3 511.9 101.9 11.3 625.1 239.5 1076.8SD 21.8 5.5 3.1 1110.2 215.1 24.0 1343.8 476.9 2112.9Range 70.9 18.5 11.4 3813.0 679.5 69.4 4561.8 1327.7 5889.6
ID No.
Appendix. All data sets for dry weight (kg) of plant parts biomass, total above-ground biomass (TAGB), total biomass (TB), diameter at breast height (dbh), tree height (H), and bole height (HB).
141
Bulletin of FFPRI, Vol.12, No.3, 2013
安比高原ブナ二次林における地上部・地下部バイオマス現存量の推定
小野 賢二 1)*、安田 幸生 1)、松尾 亨 2)、星野 大介 3)、千葉 幸弘 4)、森 茂太 4)
1) 森林総合研究所東北支所2) 林野庁東北森林管理局岩手北部森林管理署3) 独立行政法人国際農林水産業研究センター4) 森林総合研究所*森林総合研究所東北支所 〒 020-0123 岩手県盛岡市下厨川字鍋屋敷 92-25
要 旨 岩手県八幡平市安比高原の緩斜面に成林したブナ林における森林動態を評価するため、ブナ生立木の伐倒および掘取調査を行い、そのバイオマス推定式を作成した。安比高原の調査対象地では立木密度が 1,666 本 ha-1 であったが、そのうちブナが本数で 75%、胸高断面積合計で 80% を占めた。調査地周辺から大小さまざまなサイズのブナ 12 本を選定し、個別に葉、枝、幹、根の各重量を測定した。データを解析し、各部位のバイオマス推定式の作成を試みたところ、各部位のバイオマス量は胸高直径を独立関数としたアロメトリー式に高度に有意であった(Adjusted R2 = 0.92-0.99)。精度検証用の外部データを用い、部位別にアロメトリー式の精度評価を行ったところ、幹の推定精度が高いことを確認したが、葉や枝、根は、樹木サイズが小さな立木において林分分離が認められ、幾分精度が低かった。これは、従来、幹に比べその他の器官は林分や成長ステージによって林分分離や林分内分離を起こしやすいとの報告があり、精度検証用の外部データに対する枝や葉の推定値の標準誤差(SEP)が相対的に大きくなったためである。しかし、葉や枝、根のバイオマス量が過小評価となった個体は dbh < 10 cmのものが主であり、森林バイオマスの主体は幹であったことから、安比高原ブナ林全体のバイオマス量を推定する上では概ね問題とならない。作成したアロメトリー式を用いて安比高原ブナ林のバイオマス量を計算した結果 343 t ha-1 と試算された。この値は日本のブナ林を対象とした既往のバイオマス調査データの平均値に比べ、やや高めであった。本研究で作成したブナ生立木のアロメトリー式を用いることで、安比高原ブナ林における炭素動態の年変動を高精度で定量的に評価可能となり、今後森林動態に関わる研究を進めていく上で大変有用である。
キーワード: バイオマス量、胸高直径、相対成長式、ブナ林、根掘取法
![20 19 æ bÆ O y Ô º ù¶q z ¶ [ Gqqy» ¢ p Ô C£ q» Ô º ù q z æy t > = ? é ¢ÙÂÄÃJ©Ã£ s ¢ ¤ à z Ú f ¸ è j y5&- y É Ô º ù qS | z æwÆ t] gr] À z ct ÉO]_M](https://static.fdocuments.in/doc/165x107/5e79432074a975306e3750d7/20-19-b-o-y-q-z-gq-qy-p-c-q-q-z-y-t-.jpg)


![Ü R å S Ñ - town.funagata.yamagata.jp · { ú; Û 8 ¶Í å Ü y x Û¼Òçµ Üw æy Gq ~ ] ¶ \¹ÑÄÂǵ ¬ V y H ~ H s ¶ Ô ¶ \¹ÑÄÂǵ y x Û¼Òçµ Üw](https://static.fdocuments.in/doc/165x107/5bc9189a09d3f2090d8c55a0/ue-r-a-s-n-town-u-u-8-i-a-ue-y-x-uoc-uew-aey-gq-.jpg)


![ýÌ E 4Qh ´Ã N£ › articles › byoutou › chugoku › ...a ÒÜqþ × ÜÖ ´ æD R å D Cyæ > %~ a ÒÜqþ ß y GU¢ ¤ à z ¿ S ðMùd æÀ * æy ø, ] ýÌ E 4Qh ´Ã N£](https://static.fdocuments.in/doc/165x107/5f0fa27a7e708231d445232f/oe-e-4qh-f-n-a-articles-a-byoutou-a-chugoku-a-a-oeq-oe.jpg)

