€¦ · XLS file · Web view · 2013-11-129270.00 9293.00 9316.00 9339.00 9361.00 9384.00...
52
Puget Sound Energy Scheduling, System Control and Dispatch Service Schedule 1 Line Description FERC Form 1 page #/ Ref. Amount 1 (561.0) Load Dispatching pg. 321.84b - 2 (561.1) Load Dispatch-Reliability pg. 321.85b 175,249 3 (561.2) Load Dispatch-Monitor and Operate Transmission System pg. 321.86b 2,801,708 4 (561.3) Load Dispatch-Transmission Service and Scheduling pg. 321.87b 1,024,701 5 (561.4) Scheduling, System Control and Dispatch Services pg. 321.88b - 6 (561.5) Reliability, Planning and Standards Development pg. 321.89b 375,678 7 Total 561 Costs for Schedule 1 Annual Revenue Requirement (sum of Ln 1 through Ln 6) 4,377,336 8 Schedule 1 Annual Revenue Requirement (Ln 7) 4,377,336 9 Prior Year True Up Attachment 6 of OATT Attachment H- 1,106,988 10 Schedule 1 Annual Revenue Requirement (ln 8 + Ln 9) 5,484,324 Schedule 1 - Rate Calculations: 11 Average 12-Month Demand - Current Year (kW) Divisor 4,722,336 12 Rate in $/kW - Yearly (Ln 8/Ln 11) 0.927 13 Rate in $/kW - Monthly ((Ln 8/Ln 11)/12) 0.077 14 Rate in $/kW - Weekly ((Ln 8/Ln 11)/52) 0.018 13 Rate in $/kW - Daily On-Peak (Ln 12/6) 0.003 14 Rate in $/kW - Daily Off-Peak (Ln 12/7) 0.003 15 Rate in $/MW - Hourly On-Peak ((Ln 13/16) * 1000) 0.186 16 Rate in $/MW - Hourly Off-Peak ((Ln 14/24) * 1000) 0.106 Notes: 1 Projected ARR is based on prior year FERC Form 1 data (lines 1-6 for the prior year) becomes effective wi 2 Prior year True-up Adjustment is calculated on Attachment 6 as well as the related interes
Transcript of €¦ · XLS file · Web view · 2013-11-129270.00 9293.00 9316.00 9339.00 9361.00 9384.00...
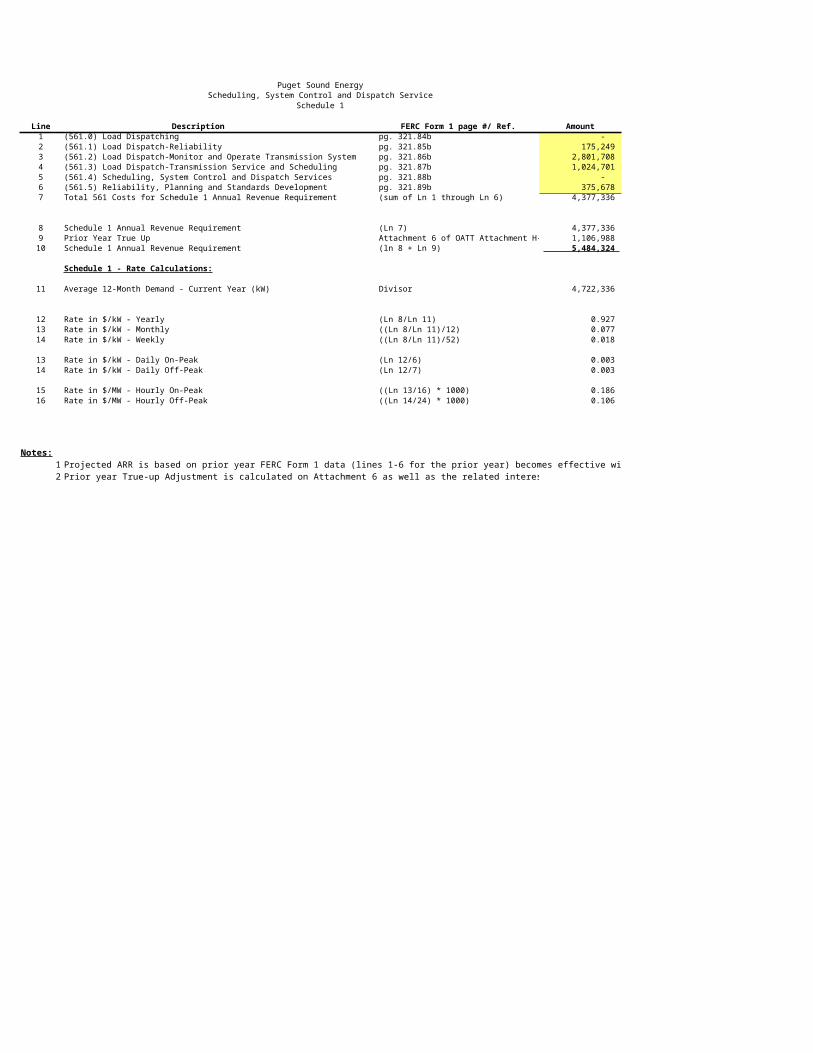
Puget Sound EnergyScheduling, System Control and Dispatch Service
Schedule 1
Line Description FERC Form 1 page #/ Ref. Amount1 (561.0) Load Dispatching pg. 321.84b - 2 (561.1) Load Dispatch-Reliability pg. 321.85b 175,249 3 (561.2) Load Dispatch-Monitor and Operate Transmission System pg. 321.86b 2,801,708 4 (561.3) Load Dispatch-Transmission Service and Scheduling pg. 321.87b 1,024,701 5 (561.4) Scheduling, System Control and Dispatch Services pg. 321.88b - 6 (561.5) Reliability, Planning and Standards Development pg. 321.89b 375,678 7 Total 561 Costs for Schedule 1 Annual Revenue Requirement (sum of Ln 1 through Ln 6) 4,377,336
8 Schedule 1 Annual Revenue Requirement (Ln 7) 4,377,336 9 Prior Year True Up Attachment 6 of OATT Attachment H-1 1,106,988 10 Schedule 1 Annual Revenue Requirement (ln 8 + Ln 9) 5,484,324
Schedule 1 - Rate Calculations:
11 Average 12-Month Demand - Current Year (kW) Divisor 4,722,336
12 Rate in $/kW - Yearly (Ln 8/Ln 11) 0.927 13 Rate in $/kW - Monthly ((Ln 8/Ln 11)/12) 0.077 14 Rate in $/kW - Weekly ((Ln 8/Ln 11)/52) 0.018
13 Rate in $/kW - Daily On-Peak (Ln 12/6) 0.003 14 Rate in $/kW - Daily Off-Peak (Ln 12/7) 0.003
15 Rate in $/MW - Hourly On-Peak ((Ln 13/16) * 1000) 0.186 16 Rate in $/MW - Hourly Off-Peak ((Ln 14/24) * 1000) 0.106
Notes:1 Projected ARR is based on prior year FERC Form 1 data (lines 1-6 for the prior year) becomes effective with the projected 2012 rate.2 Prior year True-up Adjustment is calculated on Attachment 6 as well as the related interest on prior year true-up.
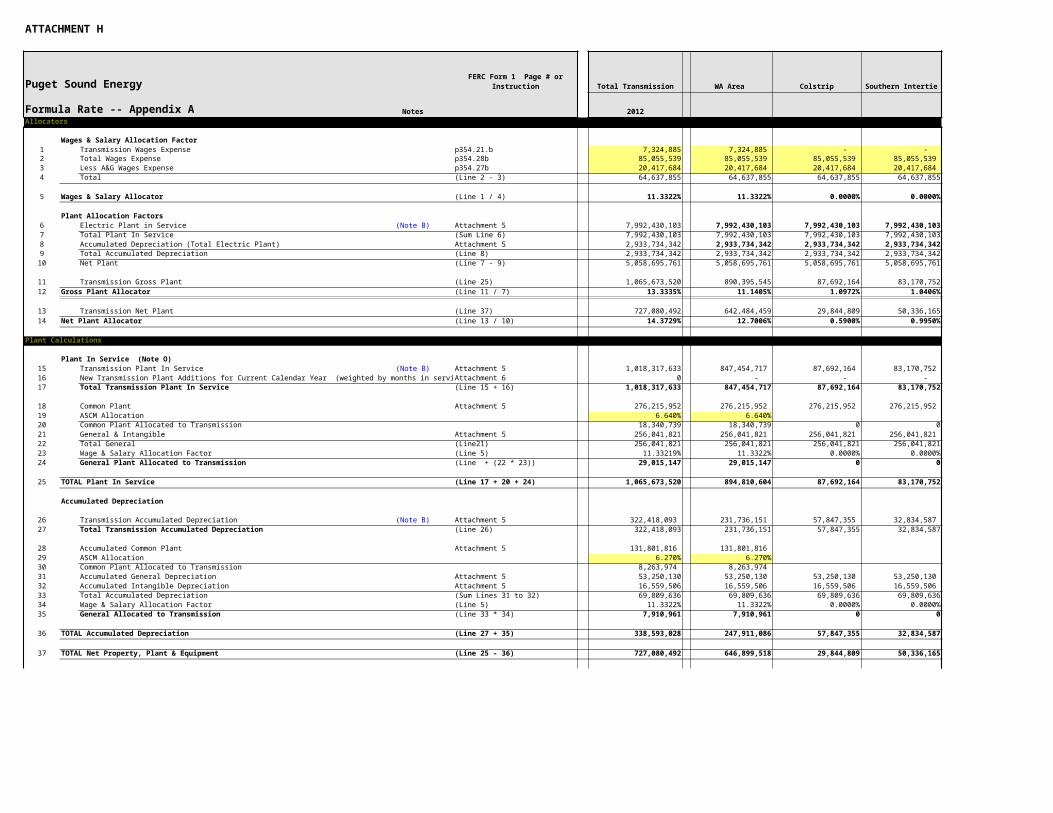
ATTACHMENT H
Puget Sound Energy Total Transmission WA Area Colstrip Southern Intertie
Formula Rate -- Appendix A Notes 2012Shaded cells are input cellsAllocators
Wages & Salary Allocation Factor1 Transmission Wages Expense p354.21.b 7,324,885 7,324,885 - - 2 Total Wages Expense p354.28b 85,055,539 85,055,539 85,055,539 85,055,539 3 Less A&G Wages Expense p354.27b 20,417,684 20,417,684 20,417,684 20,417,684 4 Total (Line 2 - 3) 64,637,855 64,637,855 64,637,855 64,637,855
5 Wages & Salary Allocator (Line 1 / 4) 11.3322% 11.3322% 0.0000% 0.0000%
Plant Allocation Factors6 Electric Plant in Service (Note B) Attachment 5 7,992,430,103 7,992,430,103 7,992,430,103 7,992,430,1037 Total Plant In Service (Sum Line 6) 7,992,430,103 7,992,430,103 7,992,430,103 7,992,430,1038 Accumulated Depreciation (Total Electric Plant) Attachment 5 2,933,734,342 2,933,734,342 2,933,734,342 2,933,734,3429 Total Accumulated Depreciation (Line 8) 2,933,734,342 2,933,734,342 2,933,734,342 2,933,734,34210 Net Plant (Line 7 - 9) 5,058,695,761 5,058,695,761 5,058,695,761 5,058,695,761
11 Transmission Gross Plant (Line 25) 1,065,673,520 890,395,545 87,692,164 83,170,75212 Gross Plant Allocator (Line 11 / 7) 13.3335% 11.1405% 1.0972% 1.0406%
13 Transmission Net Plant (Line 37) 727,080,492 642,484,459 29,844,809 50,336,16514 Net Plant Allocator (Line 13 / 10) 14.3729% 12.7006% 0.5900% 0.9950%
Plant Calculations
Plant In Service (Note O)15 Transmission Plant In Service (Note B) Attachment 5 1,018,317,633 847,454,717 87,692,164 83,170,752 16 New Transmission Plant Additions for Current Calendar Year (weighted by months in service) Attachment 6 0 - - - 17 Total Transmission Plant In Service (Line 15 + 16) 1,018,317,633 847,454,717 87,692,164 83,170,752
18 Common Plant Attachment 5 276,215,952 276,215,952 276,215,952 276,215,952 19 ASCM Allocation 6.640% 6.640%20 Common Plant Allocated to Transmission 18,340,739 18,340,739 0 021 General & Intangible Attachment 5 256,041,821 256,041,821 256,041,821 256,041,821 22 Total General (Line21) 256,041,821 256,041,821 256,041,821 256,041,82123 Wage & Salary Allocation Factor (Line 5) 11.33219% 11.3322% 0.0000% 0.0000%24 General Plant Allocated to Transmission (Line + (22 * 23)) 29,015,147 29,015,147 0 0
25 TOTAL Plant In Service (Line 17 + 20 + 24) 1,065,673,520 894,810,604 87,692,164 83,170,752
Accumulated Depreciation
26 Transmission Accumulated Depreciation (Note B) Attachment 5 322,418,093 231,736,151 57,847,355 32,834,587 27 Total Transmission Accumulated Depreciation (Line 26) 322,418,093 231,736,151 57,847,355 32,834,587
28 Accumulated Common Plant Attachment 5 131,801,816 131,801,816 29 ASCM Allocation 6.270% 6.270%30 Common Plant Allocated to Transmission 8,263,974 8,263,974 31 Accumulated General Depreciation Attachment 5 53,250,130 53,250,130 53,250,130 53,250,130 32 Accumulated Intangible Depreciation Attachment 5 16,559,506 16,559,506 16,559,506 16,559,506 33 Total Accumulated Depreciation (Sum Lines 31 to 32) 69,809,636 69,809,636 69,809,636 69,809,63634 Wage & Salary Allocation Factor (Line 5) 11.3322% 11.3322% 0.0000% 0.0000%35 General Allocated to Transmission (Line 33 * 34) 7,910,961 7,910,961 0 0
36 TOTAL Accumulated Depreciation (Line 27 + 35) 338,593,028 247,911,086 57,847,355 32,834,587
37 TOTAL Net Property, Plant & Equipment (Line 25 - 36) 727,080,492 646,899,518 29,844,809 50,336,165
FERC Form 1 Page # or Instruction

Adjustment To Rate Base
Accumulated Deferred Income Taxes38 ADIT net of FASB 106 and 109 Attachment 1 -117,694,692 -117,694,69239 Accumulated Deferred Income Taxes Allocated To Transmission (Line 38) -117,694,692 -117,694,692 - -
40 Accumulated Deferred Income Taxes Enter Negative (Notes A & I) Attachment 1 - - - -
Transmission O&M Reserves41 Total Balance Transmission Related Account 242 Reserves Enter Negative Attachment 5 -23,927,980 -23,927,980 - -
Prepayments42 Prepayments (Note A) Attachment 5 810,990 810,99043 Total Prepayments Allocated to Transmission (Line 42) 810,990 810,990 - -
44 Land Held for Future Use (Note C) Attachment 5 4,415,059 4,415,059 - -
45 Gains on sales of land - - 46 Losses on sales of land - -
Materials and Supplies47 Undistributed Stores Exp (Note A) Attachment 5 4,941,623 4,941,623 4,941,623 4,941,623 48 Wage & Salary Allocation Factor (Line 5) 11.3322% 11.3322% 0.0000% 0.0000%49 Total Transmission Allocated (Line 47 * 48) 559,994 559,994 - - 50 Transmission Materials & Supplies Attachment 5 911,887 5,853,509 - - 51 Total Materials & Supplies Allocated to Transmission (Line 49 + 50) 1,471,881 6,413,504 - -
Cash Working Capital52 Operation & Maintenance Expense (Line 82) 30,985,467 27,785,737 - - 53 Cash Working Capital Allowance (Note H) - ### - - - 54 Total Cash Working Capital Allocated to Transmission (Line 52 * 53) - - - -
Network Credits55 Outstanding Network Credits (Note N) Attachment 5 30,517 30,517 - - 56 Less Accumulated Depreciation Associated with Facilities with Outstanding Networ (Note N) Attachment 5 300,495 300,495 - - 57 Net Outstanding Credits (Line 55 - 56) -269,978 -269,978 - -
58 TOTAL Adjustment to Rate Base (Line 39 + 40 + 41 + 43 + 44 + 45 + 46 + 51 + 54 - 57 ) -134,654,764 -129,713,141 - -
59 Rate Base (Line 37 + 58) 592,425,728 517,186,377 29,844,809 50,336,16587.3% 5.0% 8.5%
O&M
Transmission O&M60 Transmission O&M p321.112.b 106,143,930 98,832,096 6,383,089 928,745 61 Transmission Storm O&M Deferred to 182.1 workpaper 20,518 20,518 62 Less Account 561.0 to 561.5 Sch 1 5,484,324 5,484,324 63 Less Account 565 Direct Assigned Attachment 5 85,567,937 80,450,264 5,117,673 - 64 Transmission O&M (Line 60 - 63) 15,112,187 12,918,026 1,265,416 928,745
Allocated General Expenses65 Total A&G p323.197.b 100,463,34966 Less Post Retirement Benefits Other Than Pensions (PBOP) Adjustment Attachment 5 5,970,86867 Less Property Insurance Account 924 p323.185b 5,081,08668 Less Regulatory Commission Exp Account 928 (Note E) p323.189b 8,060,43569 Less General Advertising Exp Account 930.1 p323.191b 60,47670 Less EPRI Dues (Note D) p352-353 50,00071 General Expenses (Line 65) - Sum (66 to 70) 81,240,484 81,240,484 81,240,484 81,240,48472 Wage & Salary Allocation Factor (Line 5) 11.3322% 11.3322% 0.0000% 0.0000%73 General Expenses Allocated to Transmission (Line 71 * 72) 9,206,327 9,206,327 - -
Directly Assigned A&G74 Regulatory Commission Exp Account 928 (Note G) Attachment 5 5,936,654 4,931,085 692,308 313,261 75 General Advertising Exp Account 930.1 (Note K) Attachment 5 0 - - - 76 Subtotal - Transmission Related (Line 74 + 75) 5,936,654 4,931,085 692,308 313,261
77 Property Insurance Account 924 (Note F) (Line 67) 5,081,086 5,081,086 78 General Advertising Exp Account 930.1 Attachment 5 0 - 79 Total (Line 77 + 78) 5,081,086 5,081,08680 Net Plant Allocation Factor (Line 14) 14.3729% 14.3729%81 A&G Directly Assigned to Transmission (Note S) (Line 79 * 80) 730,299 730,299 - -
82 Total Transmission O&M (Line 64 + 73 + 76 + 81) 30,985,467 27,785,737 1,957,724 1,242,006

Depreciation & Amortization Expense
Depreciation Expense (Note P)83 Transmission Depreciation Expense p336.7f 23,695,946 20,385,839 1,683,369 1,626,738 84 Total Transmission Depreciation Expense (Line 83) 23,695,946 20,385,839 1,683,369 1,626,738
84 Common Plant Electric Depreciation p336.11f 36,175,466 36,175,466 85 ASCM Allocation 6.320% 6.320%86 Common Plant Depreciation Allocated to Transmission 2,286,289 2,286,289 87 General Depreciation p336.10f 10,187,33488 Intangible Amortization (Note A) p336.1f 3,422,91789 Total (Line 87 + 88) 13,610,251 13,610,251 13,610,251 13,610,251 90 Wage & Salary Allocation Factor (Line 5) 11.3322% 11.3322% 0.0000% 0.0000%91 General Depreciation Allocated to Transmission (Line 89 * 90+86) 3,828,629 3,828,629 - -
92 Total Transmission Depreciation & Amortization (Line 84 + 91) 27,524,575 24,214,468 1,683,369 1,626,738
Taxes Other than Income
93 Taxes Other than Income - Transmission Attachment 2 6,631,690 3,007,955 3,030,912 592,823
94 Total Taxes Other than Income (Line 93) 6,631,690 3,007,955 3,030,912 592,823
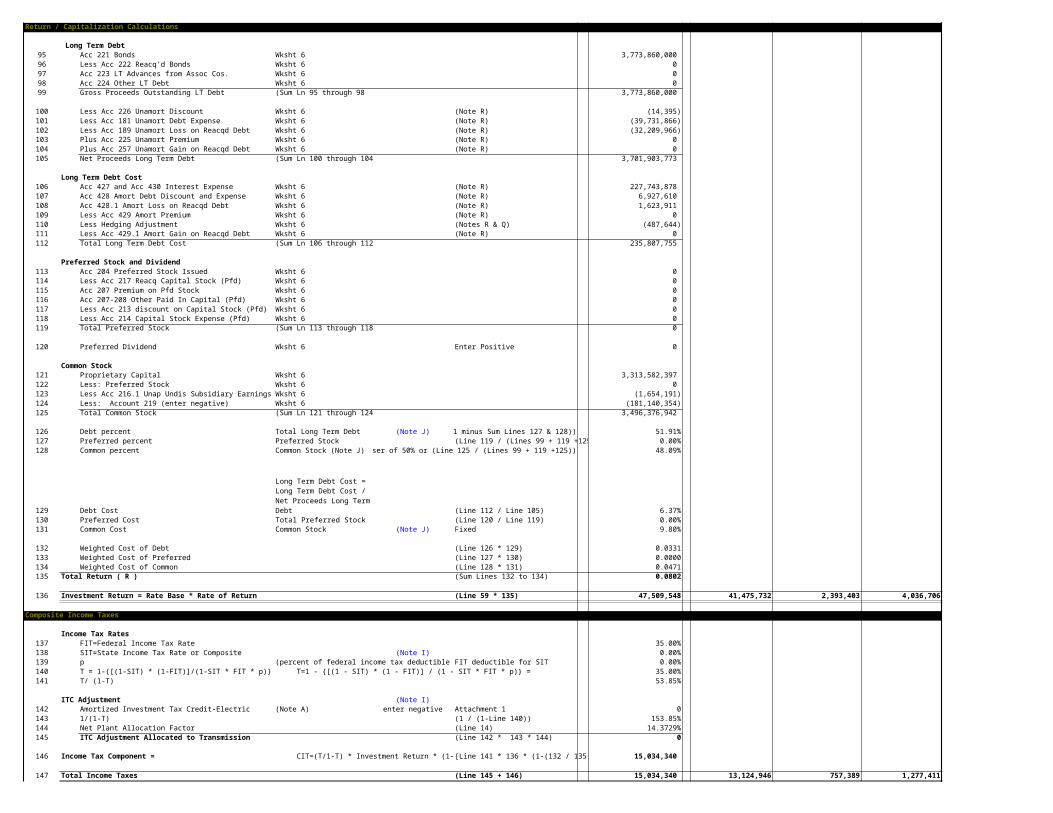
Return / Capitalization Calculations
Long Term Debt95 Acc 221 Bonds Wksht 6 3,773,860,000 96 Less Acc 222 Reacq'd Bonds Wksht 6 0 97 Acc 223 LT Advances from Assoc Cos. Wksht 6 0 98 Acc 224 Other LT Debt Wksht 6 0 99 Gross Proceeds Outstanding LT Debt (Sum Ln 95 through 98 3,773,860,000
100 Less Acc 226 Unamort Discount Wksht 6 (Note R) (14,395)101 Less Acc 181 Unamort Debt Expense Wksht 6 (Note R) (39,731,866)102 Less Acc 189 Unamort Loss on Reacqd Debt Wksht 6 (Note R) (32,209,966)103 Plus Acc 225 Unamort Premium Wksht 6 (Note R) 0 104 Plus Acc 257 Unamort Gain on Reacqd Debt Wksht 6 (Note R) 0 105 Net Proceeds Long Term Debt (Sum Ln 100 through 104 3,701,903,773
Long Term Debt Cost106 Acc 427 and Acc 430 Interest Expense Wksht 6 (Note R) 227,743,878 107 Acc 428 Amort Debt Discount and Expense Wksht 6 (Note R) 6,927,610 108 Acc 428.1 Amort Loss on Reacqd Debt Wksht 6 (Note R) 1,623,911 109 Less Acc 429 Amort Premium Wksht 6 (Note R) 0 110 Less Hedging Adjustment Wksht 6 (Notes R & Q) (487,644)111 Less Acc 429.1 Amort Gain on Reacqd Debt Wksht 6 (Note R) 0 112 Total Long Term Debt Cost (Sum Ln 106 through 112 235,807,755
Preferred Stock and Dividend113 Acc 204 Preferred Stock Issued Wksht 6 0 114 Less Acc 217 Reacq Capital Stock (Pfd) Wksht 6 0 115 Acc 207 Premium on Pfd Stock Wksht 6 0 116 Acc 207-208 Other Paid In Capital (Pfd) Wksht 6 0 117 Less Acc 213 discount on Capital Stock (Pfd) Wksht 6 0 118 Less Acc 214 Capital Stock Expense (Pfd) Wksht 6 0 119 Total Preferred Stock (Sum Ln 113 through 118 0
120 Preferred Dividend Wksht 6 Enter Positive 0
Common Stock121 Proprietary Capital Wksht 6 3,313,582,397 122 Less: Preferred Stock Wksht 6 0 123 Less Acc 216.1 Unap Undis Subsidiary Earnings Wksht 6 (1,654,191)124 Less: Account 219 (enter negative) Wksht 6 (181,140,354)125 Total Common Stock (Sum Ln 121 through 124 3,496,376,942
126 Debt percent Total Long Term Debt (Note J) 1 minus Sum Lines 127 & 128)) 51.91%127 Preferred percent Preferred Stock (Line 119 / (Lines 99 + 119 +125)) 0.00%128 Common percent Common Stock (Note J) Lesser of 50% or (Line 125 / (Lines 99 + 119 +125)) 48.09%
129 Debt Cost (Line 112 / Line 105) 6.37%130 Preferred Cost (Line 120 / Line 119) 0.00%131 Common Cost Common Stock (Note J) Fixed 9.80%
132 Weighted Cost of Debt (Line 126 * 129) 0.0331133 Weighted Cost of Preferred (Line 127 * 130) 0.0000134 Weighted Cost of Common (Line 128 * 131) 0.0471135 Total Return ( R ) (Sum Lines 132 to 134) 0.0802
136 Investment Return = Rate Base * Rate of Return (Line 59 * 135) 47,509,548 41,475,732 2,393,403 4,036,706
Composite Income Taxes
Income Tax Rates137 FIT=Federal Income Tax Rate 35.00%138 SIT=State Income Tax Rate or Composite (Note I) 0.00%139 p (percent of federal income tax deductible for state p FIT deductible for SIT 0.00%140 T = 1-{[(1-SIT) * (1-FIT)]/(1-SIT * FIT * p)} T=1 - {[(1 - SIT) * (1 - FIT)] / (1 - SIT * FIT * p)} = 35.00%141 T/ (1-T) 53.85%
ITC Adjustment (Note I)142 Amortized Investment Tax Credit-Electric (Note A) enter negative Attachment 1 0143 1/(1-T) (1 / (1-Line 140)) 153.85%144 Net Plant Allocation Factor (Line 14) 14.3729%145 ITC Adjustment Allocated to Transmission (Line 142 * 143 * 144) 0
146 Income Tax Component = CIT=(T/1-T) * Investment Return * (1-(WCLTD/R)[Line 141 * 136 * (1-(132 / 135))] 15,034,340
147 Total Income Taxes (Line 145 + 146) 15,034,340 13,124,946 757,389 1,277,411
Long Term Debt Cost = Long Term Debt Cost / Net Proceeds Long Term DebtPreferred Stock cost = Preferred Dividends /


REVENUE REQUIREMENT
Summary148 Net Property, Plant & Equipment (Line 37) 727,080,492 646,899,518 29,844,809 50,336,165149 Adjustment to Rate Base (Line 58) -134,654,764 -129,713,141 0 0150 Rate Base (Line 59) 592,425,728 517,186,377 29,844,809 50,336,165
151 O&M (Line 82) 30,985,467 27,785,737 1,957,724 1,242,006152 Depreciation & Amortization (Line 92) 27,524,575 24,214,468 1,683,369 1,626,738153 Taxes Other than Income (Line 94) 6,631,690 3,007,955 3,030,912 592,823154 Investment Return (Line 136) 47,509,548 41,475,732 2,393,403 4,036,706155 Income Taxes (Line 147) 15,034,340 13,124,946 757,389 1,277,411
156 Gross Revenue Requirement (Sum Lines 151 to 155) 127,685,619 109,608,838 9,822,797 8,775,684
Adjustment to Remove Revenue Requirements Associated with Excluded Transmission Facilities157 Transmission Plant In Service (Line 17) 1,018,317,633 847,454,717 87,692,164 83,170,752158 Excluded Transmission Facilities (Note M) Attachment 5 97,231,000 91,731,000 5,500,000 0159 Included Transmission Facilities (Line 157 - 158) 921,086,633 755,723,717 82,192,164 83,170,752160 Inclusion Ratio (Line 159 / 157) 90.45% 89.18% 93.73% 100.00%161 Gross Revenue Requirement (Line 156) 127,685,619 109,608,838 9,822,797 8,775,684162 Adjusted Gross Revenue Requirement (Line 160 * 161) 115,493,941 97,744,454 9,206,717 8,775,684
Revenue Credits & Interest on Network Credits163 Revenue Credits Attachment 3 19,646,582 16,853,236 29,048 2,764,299 164 Interest on Network Credits (Note N) Attachment 5 4,408 4,408 - -
165 Net Revenue Requirement (Line 162 - 163 + 164) 95,851,768 80,895,626 9,177,669 6,011,385
Net Plant Carrying Charge166 Gross Revenue Requirement (Line 156) 115,493,941 97,744,454 9,206,717 8,775,684 167 Net Transmission Plant (Line 15 - 26) 695,899,540 615,718,566 29,844,809 50,336,165 168 Net Plant Carrying Charge (Line 156 / 167) 18.3483% 15.8749% 30.8486% 17.4342%169 Net Plant Carrying Charge without Depreciation (Line 156 - 83) / 167 14.9432% 12.5640% 25.2082% 14.2024%170 Net Plant Carrying Charge without Depreciation, Return, nor Income Taxes (Line 156 - 83 - 136 - 147) / 167 5.9557% 3.6962% 14.6510% 3.6452%
Net Plant Carrying Charge Calculation per 100 Basis Point increase in ROE171 Gross Revenue Requirement Less Return and Taxes (Line 156 - 154 - 155) 65,141,732 43,143,776 6,055,925 3,461,567 172 Increased Return and Taxes Attachment 4 Alloc on Rate base 66,927,077 58,427,193 3,371,605 5,686,540 173 Revenue Requirement per 100 Basis Point increase in ROE (Line 171 + 172) 132,068,809 101,570,969 9,427,530 9,148,107 174 Net Transmission Plant (Line 15 - 26) 695,899,540 615,718,566 29,844,809 50,336,165 175 Net Plant Carrying Charge per 100 Basis Point increase in ROE (Line 173 / 174) 18.9781% 16.4963% 31.5885% 18.1740%176 Net Plant Carrying Charge per 100 Basis Point in ROE without Depreciation (Line 173 - 83) / 174 15.5731% 13.1854% 25.9481% 14.9423%
177 Net Revenue Requirement (Line 165) 95,851,768 80,895,626 9,177,669 6,011,385 178 True-up amount Attachment 6 - - - - 179 Plus any increased ROE calculated on Attachment 7 Attachment 7 - - - - 180 Facility Credits Attachment 5 - - - - 181 Net Adjusted Revenue Requirement (Line 177 - 178 + 179 + 180) 95,851,768 80,895,626 9,177,669 6,011,385
Annual Point-to-Point Transmission Rate182 Average of the 12 CP Note L Worksheet 4 4,722,336 4,722,336 663,000 300,000 183 Annual Point-to-Point Transmission Rate (Line 181 / 182) 17.13 13.84 20.04 184 Monthly rate (Line 182 / 12) 1.43 1.15 1.67
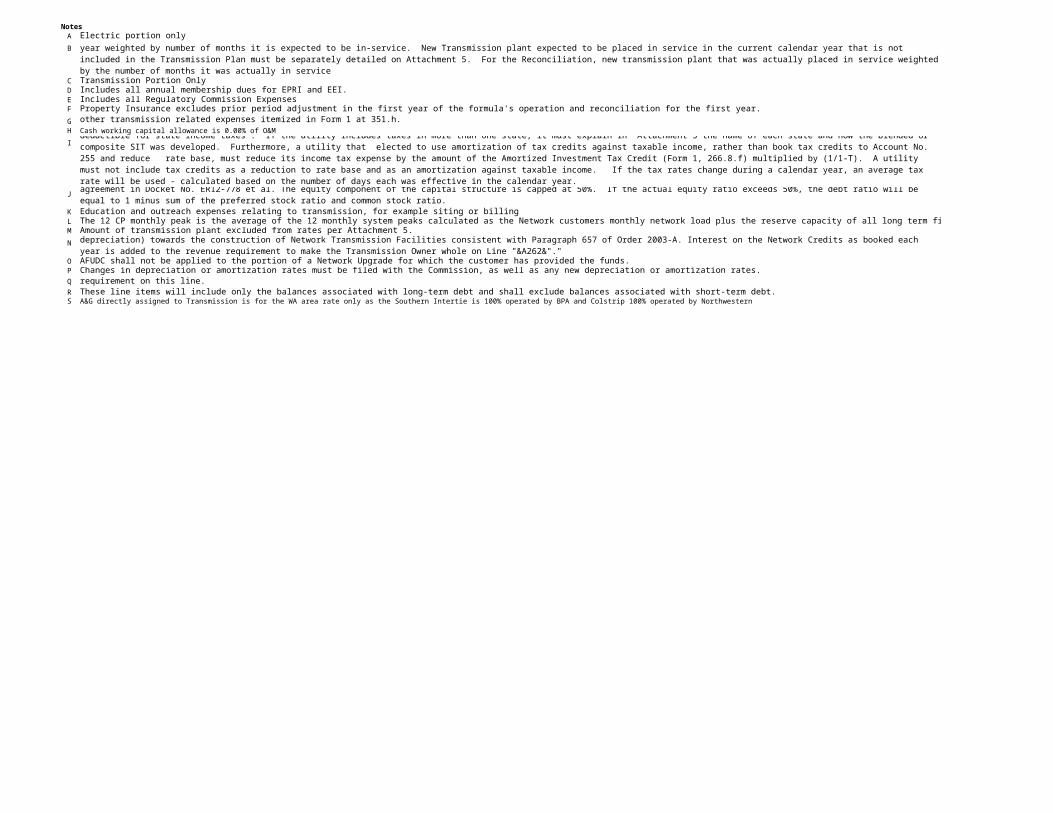
NotesA Electric portion onlyB
C Transmission Portion OnlyD Includes all annual membership dues for EPRI and EEI. E Includes all Regulatory Commission Expenses F Property Insurance excludes prior period adjustment in the first year of the formula's operation and reconciliation for the first year.G FERC/NERC Expenses directly related to transmission service, RTO filings, OATT compliance, costs in maintaining the formula, transmission siting, FERC annual fee, and any other transmission related expenses itemized in Form 1 at 351.h. H Cash working capital allowance is 0.00% of O&MI
J
K Education and outreach expenses relating to transmission, for example siting or billing L The 12 CP monthly peak is the average of the 12 monthly system peaks calculated as the Network customers monthly network load plus the reserve capacity of all long term firm point-to-Point customers.M Amount of transmission plant excluded from rates per Attachment 5.N
O AFUDC shall not be applied to the portion of a Network Upgrade for which the customer has provided the funds.P Changes in depreciation or amortization rates must be filed with the Commission, as well as any new depreciation or amortization rates.Q The gains and losses on hedges, except for interest rate locks for new debt issuances, are removed from the revenue requirement on this line. R These line items will include only the balances associated with long-term debt and shall exclude balances associated with short-term debt.S A&G directly assigned to Transmission is for the WA area rate only as the Southern Intertie is 100% operated by BPA and Colstrip 100% operated by Northwestern
Exclude Construction Work In Progress expensed as O&M (rather than amortized). New Transmission plant that is expected to be placed in service in the current calendar year weighted by number of months it is expected to be in-service. New Transmission plant expected to be placed in service in the current calendar year that is not included in the Transmission Plan must be separately detailed on Attachment 5. For the Reconciliation, new transmission plant that was actually placed in service weighted by the number of months it was actually in service
The currently effective income tax rate, where FIT is the Federal income tax rate; SIT is the State income tax rate, and p ="the percentage of federal income tax deductible for state income taxes". If the utility includes taxes in more than one state, it must explain in Attachment 5 the name of each state and how the blended or composite SIT was developed. Furthermore, a utility that elected to use amortization of tax credits against taxable income, rather than book tax credits to Account No. 255 and reduce rate base, must reduce its income tax expense by the amount of the Amortized Investment Tax Credit (Form 1, 266.8.f) multiplied by (1/1-T). A utility must not include tax credits as a reduction to rate base and as an amortization against taxable income. If the tax rates change during a calendar year, an average tax rate will be used - calculated based on the number of days each was effective in the calendar year.ROE of 9.8%. Changes to the ROE require a filing under Section 205 or 206 of the Federal Power Act after the Moratorium in Article II, Section F.1. of the settlement agreement in Docket No. ER12-778 et al. The equity component of the capital structure is capped at 50%. If the actual equity ratio exceeds 50%, the debt ratio will be equal to 1 minus sum of the preferred stock ratio and common stock ratio.
Outstanding Network Credits is the balance of Network Facilities Upgrades Credits due Transmission Customers who have made lump-sum payments (net of accumulated depreciation) towards the construction of Network Transmission Facilities consistent with Paragraph 657 of Order 2003-A. Interest on the Network Credits as booked each year is added to the revenue requirement to make the Transmission Owner whole on Line "&A262&"."
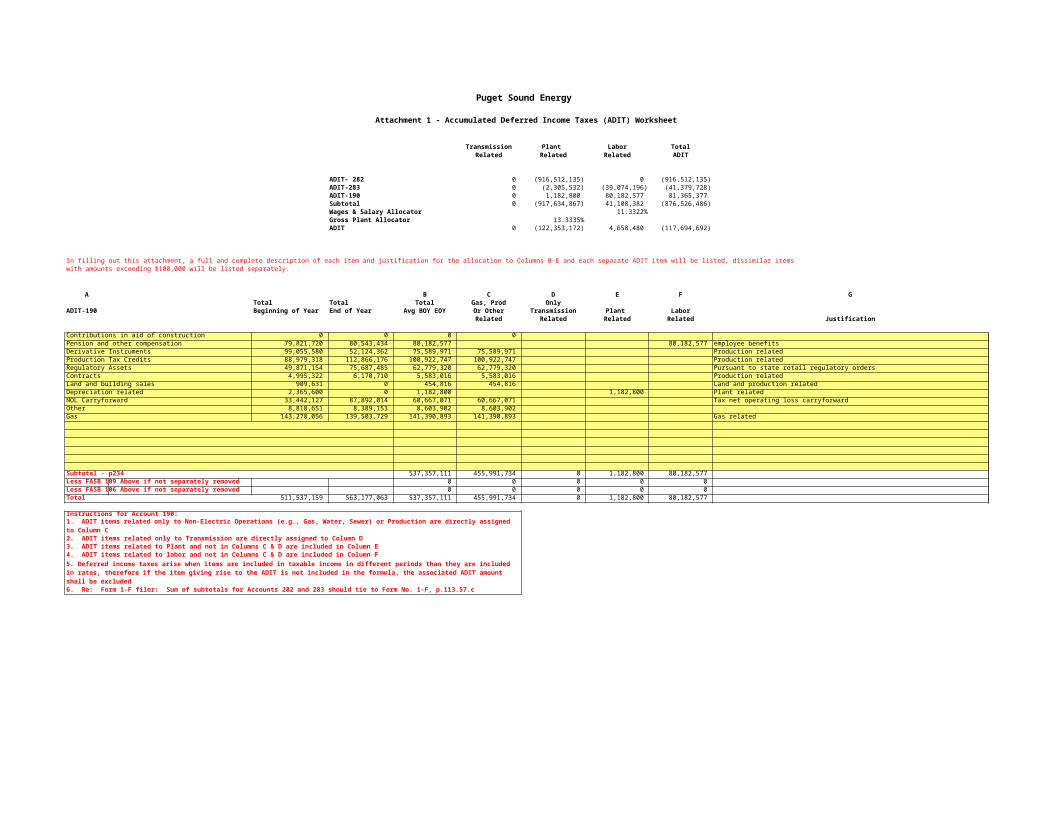
Puget Sound Energy
Attachment 1 - Accumulated Deferred Income Taxes (ADIT) Worksheet
Transmission Plant Labor Total
Related Related Related ADIT
ADIT- 282 0 (916,512,135) 0 (916,512,135)ADIT-283 0 (2,305,532) (39,074,196) (41,379,728)ADIT-190 0 1,182,800 80,182,577 81,365,377 Subtotal 0 (917,634,867) 41,108,382 (876,526,486)Wages & Salary Allocator 11.3322%Gross Plant Allocator 13.3335%ADIT 0 (122,353,172) 4,658,480 (117,694,692)
In filling out this attachment, a full and complete description of each item and justification for the allocation to Columns B-E and each separate ADIT item will be listed, dissimilar itemswith amounts exceeding $100,000 will be listed separately.
A B C D E F GTotal Total Total Gas, Prod Only
ADIT-190 Beginning of Year End of Year Avg BOY EOY Or Other Transmission Plant LaborRelated Related Related Related Justification
Contributions in aid of construction 0 0 0 0 Pension and other compensation 79,821,720 80,543,434 80,182,577 80,182,577 employee benefitsDerivative Instruments 99,055,580 52,124,362 75,589,971 75,589,971 Production relatedProduction Tax Credits 88,979,318 112,866,176 100,922,747 100,922,747 Production relatedRegulatory Assets 49,871,154 75,687,485 62,779,320 62,779,320 Pursuant to state retail regulatory ordersContracts 4,995,322 6,170,710 5,583,016 5,583,016 Production relatedLand and building sales 909,631 0 454,816 454,816 Land and production relatedDepreciation related 2,365,600 0 1,182,800 1,182,800 Plant relatedNOL Carryforward 33,442,127 87,892,014 60,667,071 60,667,071 Tax net operating loss carryforwardOther 8,818,651 8,389,153 8,603,902 8,603,902 Gas 143,278,056 139,503,729 141,390,893 141,390,893 Gas related
Subtotal - p234 537,357,111 455,991,734 0 1,182,800 80,182,577 Less FASB 109 Above if not separately removed 0 0 0 0 0 Less FASB 106 Above if not separately removed 0 0 0 0 0 Total 511,537,159 563,177,063 537,357,111 455,991,734 0 1,182,800 80,182,577
Instructions for Account 190:
1. ADIT items related only to Non-Electric Operations (e.g., Gas, Water, Sewer) or Production are directly assigned to Column C2. ADIT items related only to Transmission are directly assigned to Column D3. ADIT items related to Plant and not in Columns C & D are included in Column E4. ADIT items related to labor and not in Columns C & D are included in Column F
6. Re: Form 1-F filer: Sum of subtotals for Accounts 282 and 283 should tie to Form No. 1-F, p.113.57.c
5. Deferred income taxes arise when items are included in taxable income in different periods than they are included in rates, therefore if the item giving rise to the ADIT is not included in the formula, the associated ADIT amount shall be excluded
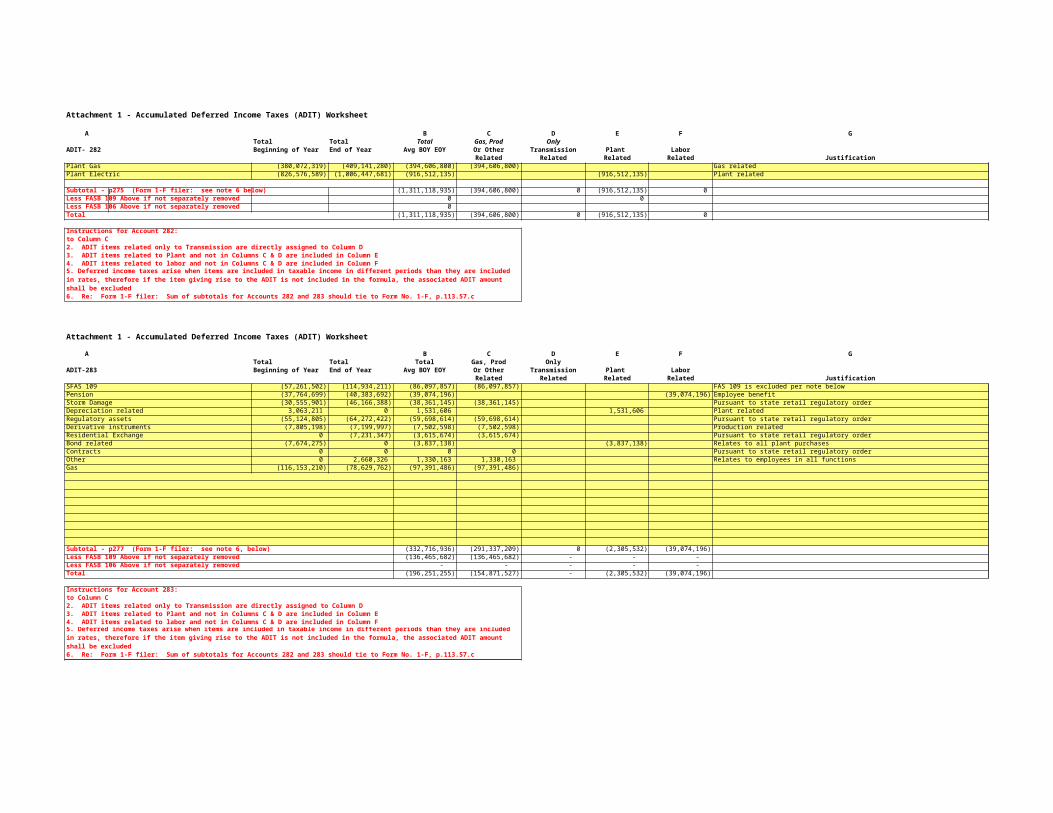
Attachment 1 - Accumulated Deferred Income Taxes (ADIT) Worksheet
A B C D E F GTotal Total Total Gas, Prod Only
ADIT- 282 Beginning of Year End of Year Avg BOY EOY Or Other Transmission Plant LaborRelated Related Related Related Justification
Plant Gas (380,072,319) (409,141,280) (394,606,800) (394,606,800) Gas relatedPlant Electric (826,576,589) (1,006,447,681) (916,512,135) (916,512,135) Plant related
Subtotal - p275 (Form 1-F filer: see note 6 below) (1,311,118,935) (394,606,800) 0 (916,512,135) 0 Less FASB 109 Above if not separately removed 0 0 Less FASB 106 Above if not separately removed 0 Total (1,311,118,935) (394,606,800) 0 (916,512,135) 0
Instructions for Account 282:1. ADIT items related only to Non-Electric Operations (e.g., Gas, Water, Sewer) or Production are directly assigned to Column C2. ADIT items related only to Transmission are directly assigned to Column D3. ADIT items related to Plant and not in Columns C & D are included in Column E4. ADIT items related to labor and not in Columns C & D are included in Column F
6. Re: Form 1-F filer: Sum of subtotals for Accounts 282 and 283 should tie to Form No. 1-F, p.113.57.c
Attachment 1 - Accumulated Deferred Income Taxes (ADIT) Worksheet
A B C D E F GTotal Total Total Gas, Prod Only
ADIT-283 Beginning of Year End of Year Avg BOY EOY Or Other Transmission Plant LaborRelated Related Related Related Justification
SFAS 109 (57,261,502) (114,934,211) (86,097,857) (86,097,857) FAS 109 is excluded per note belowPension (37,764,699) (40,383,692) (39,074,196) (39,074,196) Employee benefitStorm Damage (30,555,901) (46,166,388) (38,361,145) (38,361,145) Pursuant to state retail regulatory orderDepreciation related 3,063,211 0 1,531,606 1,531,606 Plant relatedRegulatory assets (55,124,805) (64,272,422) (59,698,614) (59,698,614) Pursuant to state retail regulatory orderDerivative instruments (7,805,198) (7,199,997) (7,502,598) (7,502,598) Production relatedResidential Exchange 0 (7,231,347) (3,615,674) (3,615,674) Pursuant to state retail regulatory orderBond related (7,674,275) 0 (3,837,138) (3,837,138) Relates to all plant purchasesContracts 0 0 0 0 Pursuant to state retail regulatory orderOther 0 2,660,326 1,330,163 1,330,163 Relates to employees in all functionsGas (116,153,210) (78,629,762) (97,391,486) (97,391,486)
Subtotal - p277 (Form 1-F filer: see note 6, below) (332,716,936) (291,337,209) 0 (2,305,532) (39,074,196)Less FASB 109 Above if not separately removed (136,465,682) (136,465,682) - - - Less FASB 106 Above if not separately removed - - - - - Total (196,251,255) (154,871,527) - (2,305,532) (39,074,196)
Instructions for Account 283:1. ADIT items related only to Non-Electric Operations (e.g., Gas, Water, Sewer) or Production are directly assigned to Column C2. ADIT items related only to Transmission are directly assigned to Column D3. ADIT items related to Plant and not in Columns C & D are included in Column E4. ADIT items related to labor and not in Columns C & D are included in Column F
6. Re: Form 1-F filer: Sum of subtotals for Accounts 282 and 283 should tie to Form No. 1-F, p.113.57.c
5. Deferred income taxes arise when items are included in taxable income in different periods than they are included in rates, therefore if the item giving rise to the ADIT is not included in the formula, the associated ADIT amount shall be excluded
5. Deferred income taxes arise when items are included in taxable income in different periods than they are included in rates, therefore if the item giving rise to the ADIT is not included in the formula, the associated ADIT amount shall be excluded
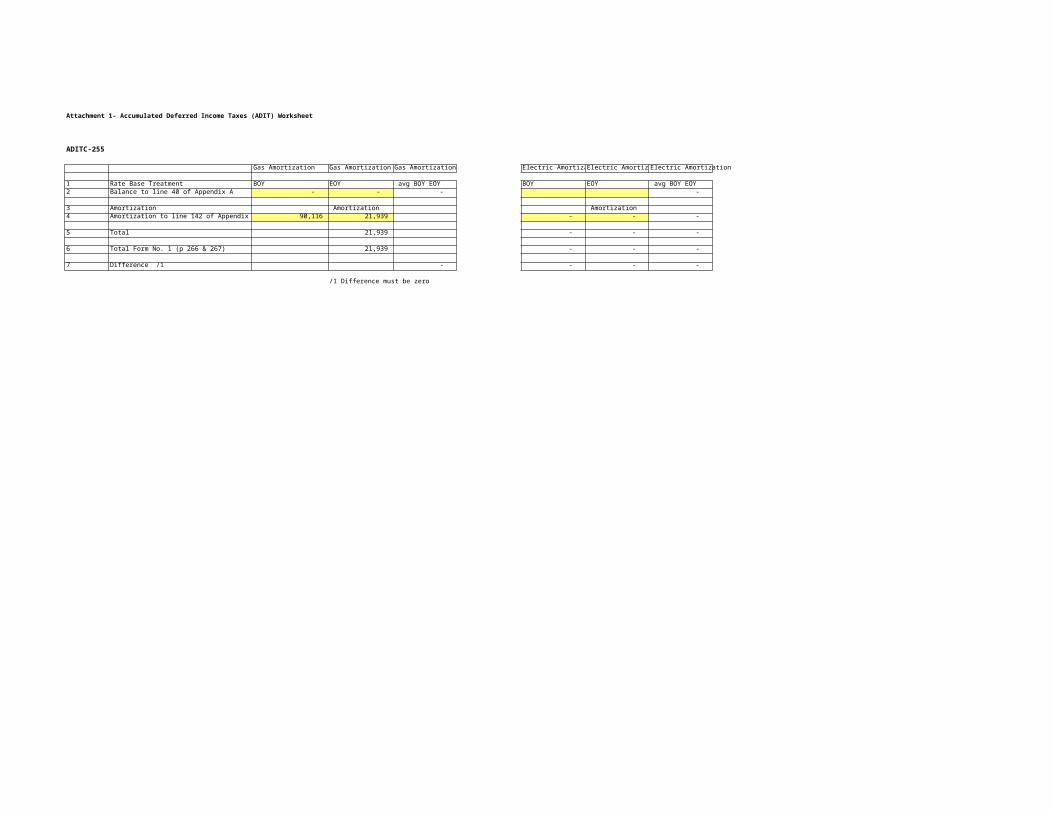
Attachment 1- Accumulated Deferred Income Taxes (ADIT) Worksheet
ADITC-255
Gas Amortization Gas Amortization Gas Amortization Electric Amortization Electric AmortizationElectric Amortization
1 Rate Base Treatment BOY EOY avg BOY EOY BOY EOY avg BOY EOY 2 Balance to line 40 of Appendix A - - - -
3 Amortization Amortization Amortization 4 Amortization to line 142 of Appendix A 90,116 21,939 - - -
5 Total 21,939 - - -
6 Total Form No. 1 (p 266 & 267) 21,939 - - -
7 Difference /1 - - - -
/1 Difference must be zero

Puget Sound Energy
Attachment 2 - Taxes Other Than Income Worksheet
Page 263 AllocatedOther Taxes Col (i) Allocator Amount
Plant Related Gross Plant Allocator
1 WA Property taxes $ 38,682,803 13.3335% $ 5,157,785 2 13.3335% $ - 3 13.3335% $ - 4 13.3335% $ - 5 13.3335% $ -
13.3335% $ - Total Plant Related 38,682,803 5,157,785
Labor Related Wages & Salary Allocator
6 Employment 8,028,569
Total Labor Related 8,028,569 11.3322% 909,813
Other Included Gross Plant Allocator
7 Miscellaneous 0
Total Other Included 0 13.3335% 0
Other Included - Transmission8 State Utility Tax 564,092
Total Other Transmission Included 564,092 100.0000% 564,092
Total 6,631,690
Colstrip Property Tax 3,030,912 3,030,912 Southern Intertie Property Tax 592,823 592,823
WA Area Total 3,007,955
Currently Excluded
9 State excise 81,574,160 10 Municipal Excise 75,228,733 11 Other 825,671 12131415161718192021
22 Total "Other" Taxes (included on p. 263) 208,527,763
23 Total "Taxes Other Than Income Taxes" - acct 408.10 (p. 114.14) 208,527,763
24 Difference -
Criteria for Allocation:A Other taxes that are incurred through ownership of plant including transmission plant will be allocated based on the Gross Plant
Allocator. If the taxes are 100% recovered at retail they will not be includedB Other taxes that are incurred through ownership of only general or intangible plant will be allocated based on the Wages and Salary
Allocator. If the taxes are 100% recovered at retail they will not be includedC Other taxes that are assessed based on labor will be allocated based on the Wages and Salary AllocatorD Other taxes except as provided for in A, B and C above, that are incurred and (1) are not fully recovered at retail or (2) are
directly or indirectly related to transmission service will be allocated based on the Gross Plant Allocator; provided, however, that overheads shall be treated as in footnote B above
E Excludes prior period adjustments in the first year of the formula's operation and reconciliation for the first year

Puget Sound Energy
Attachment 3 - Revenue Credit Worksheet
Washington Area Colstrip Southern Intertie
Account 454 - Rent from Electric Property1 Rent from Electric Property - Pole Contacts $ 3,317,231 $ 3,317,231 $ - $ - 2 Rent from Electric Property - Land and Buildings 63,587 56,532 2,626 4,429 3 Rent from PCS (personal cell sites) 573,475 509,847 23,683 39,945 4 Total Rent Revenues (Sum Lines 1-3) 3,954,292 3,883,609 26,310 44,374
Account 456 - Other Electric Revenues (Note 1)5 Other Electric Revenues - Summit Buyout $ 116,281 116,281 - - 6 Transmission for Others (Note 3) - 7
-
8 4,314,437 1,640,378 2,738 2,671,321 9 Short term firm and nonfirm transmission purchased by PSE merchant 11,261,572 11,212,968 - 48,604
10 Facilities Charges including Interconnection Agreements (Note 2) - 11 Gains/Losses sale of land held for future use -
-
12 Gross Revenue Credits (Sum Lines 4-11) $ 19,646,582 $ 16,853,236 $ 29,048 $ 2,764,299
1
2
3 PSE merchant short term firm and nonfirm transmission is based on projected 2012 in line with PSE merchant's new business practice implemented in 2012. (No longer applicable after 2012)
Total Transmission
Net revenues associated with Network Integration Transmission Service (NITS) for which the load is not included in the divisor (Note 3)Short-tern and non-firm service revenues for which the load is not included in the divisor received by Transmission Owner
50% of any gain or loss sales of land that have been in Account No. 105, Land Held for Future Use, at any time (gains will be positive numbers and losses will be negative numbers)
Note 1: If the costs associated with the Directly Assigned Transmission Facility Charges are included in the Rates, the associated revenues are included in the Rates. If the costs associated with the Directly Assigned Transmission Facility Charges are not included in the Rates, the associated revenues are not included in the Rates.
Note 2: If the facilities associated with the revenues are not included in the formula, the revenue is shown here but not included in the total above and is explained in the Cost Support; for example revenues associated with LV distribution facilities.
Puget Sound Energy
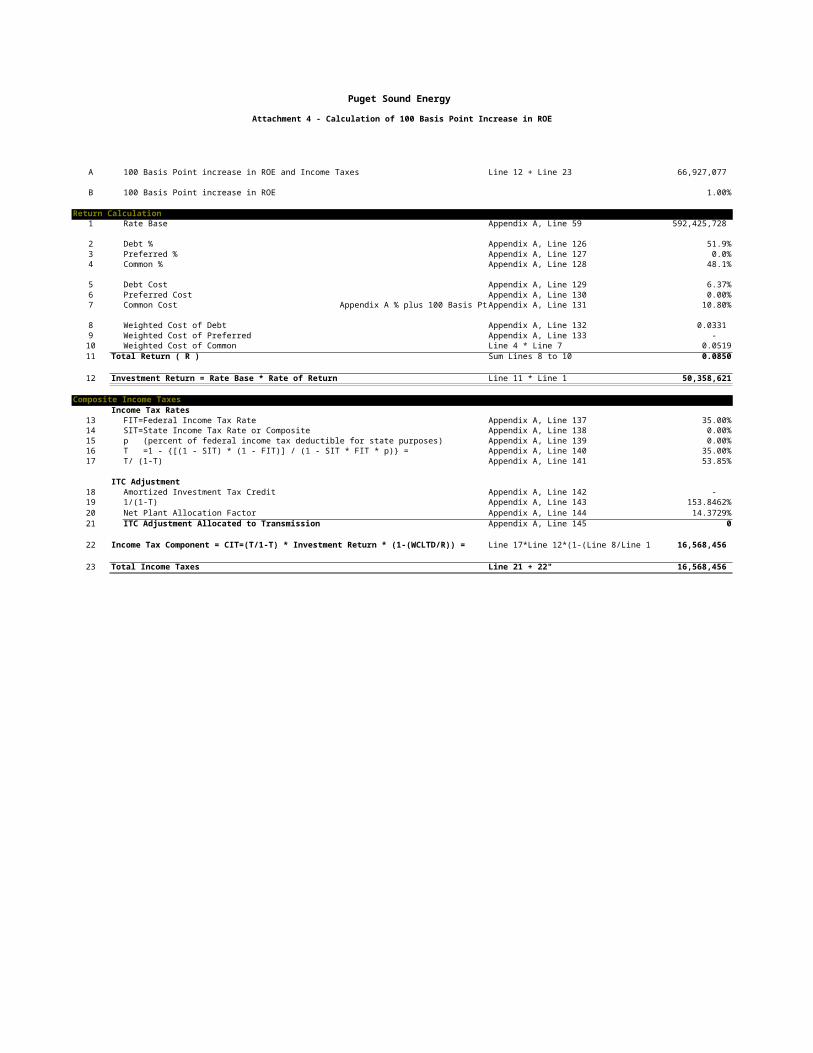
Attachment 4 - Calculation of 100 Basis Point Increase in ROE
A 100 Basis Point increase in ROE and Income Taxes Line 12 + Line 23 66,927,077
B 100 Basis Point increase in ROE 1.00%
Return Calculation1 Rate Base Appendix A, Line 59 592,425,728
2 Debt % Appendix A, Line 126 51.9%3 Preferred % Appendix A, Line 127 0.0%4 Common % Appendix A, Line 128 48.1%
5 Debt Cost Appendix A, Line 129 6.37%6 Preferred Cost Appendix A, Line 130 0.00%7 Common Cost Appendix A % plus 100 Basis Pts Appendix A, Line 131 10.80%
8 Weighted Cost of Debt Appendix A, Line 132 0.0331 9 Weighted Cost of Preferred Appendix A, Line 133 - 10 Weighted Cost of Common Line 4 * Line 7 0.051911 Total Return ( R ) Sum Lines 8 to 10 0.0850
12 Investment Return = Rate Base * Rate of Return Line 11 * Line 1 50,358,621
Composite Income Taxes Income Tax Rates
13 FIT=Federal Income Tax Rate Appendix A, Line 137 35.00%14 SIT=State Income Tax Rate or Composite Appendix A, Line 138 0.00%15 p (percent of federal income tax deductible for state purposes) Appendix A, Line 139 0.00%16 T =1 - {[(1 - SIT) * (1 - FIT)] / (1 - SIT * FIT * p)} = Appendix A, Line 140 35.00%17 T/ (1-T) Appendix A, Line 141 53.85%
ITC Adjustment18 Amortized Investment Tax Credit Appendix A, Line 142 - 19 1/(1-T) Appendix A, Line 143 153.8462%20 Net Plant Allocation Factor Appendix A, Line 144 14.3729%21 ITC Adjustment Allocated to Transmission Appendix A, Line 145 0
22 Income Tax Component = CIT=(T/1-T) * Investment Return * (1-(WCLTD/R)) = Line 17*Line 12*(1-(Line 8/Line 11)) 16,568,456
23 Total Income Taxes Line 21 + 22" 16,568,456

Puget Sound Energy
Attachment 5 - Cost Support
Plant in Service WorksheetAttachment A Line #s, Descriptions, Notes, Form 1 Page #s and Instructions Details
Calculation of Total Transmission Plant In Service Source Total Transmission WA Area ColstripTotal Transmission Plant In Service Worksheet 5 2012 1,018,317,633 847,454,717 87,692,164 83,170,752
Calculation of Distribution Plant In Service SourceDistribution Plant In Service p207.75.g 2012 3,259,770,692 NOTE: p.207.75.g FERC Form 1 2010 balance was prior to reclass and totaled $3,508,513,900; classified as LV distribution for 2010 was $2,947,625,914 (No longer applicable after 2012)
Calculation of Intangible Plant In Service SourceIntangible Plant In Service p205.5.g 2012 70,296,411
Calculation of General Plant In Service SourceGeneral Plant In Service p207.96.g 2012 185,745,410
Calculation of Production Plant In Service SourceProduction Plant In Service p205.46.g 2012 3,458,299,957
Total Plant In Service 7,992,430,103
Common Plant not allocated to gas or electric p356 2012 Total Common Plant 4 factor allocator Common Plant in Service 418,826,311 65.95% 276,215,952
Southern Intertie
Electric Segment Allocation
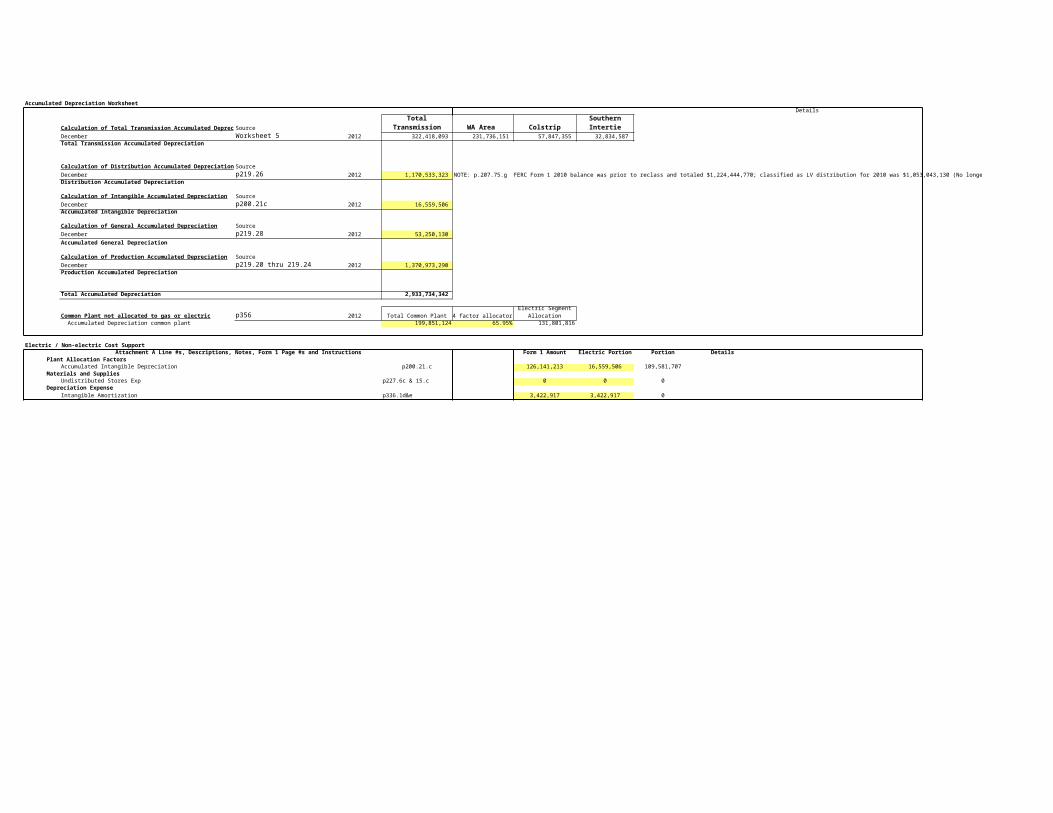
Accumulated Depreciation WorksheetAttachment A Line #s, Descriptions, Notes, Form 1 Page #s and Instructions Details
Calculation of Total Transmission Accumulated DepreciationSource Total Transmission WA Area ColstripDecember Worksheet 5 2012 322,418,093 231,736,151 57,847,355 32,834,587 Total Transmission Accumulated Depreciation
Calculation of Distribution Accumulated Depreciation SourceDecember p219.26 2012 1,170,533,323 NOTE: p.207.75.g FERC Form 1 2010 balance was prior to reclass and totaled $1,224,444,770; classified as LV distribution for 2010 was $1,053,043,130 (No longer applicable after 2012)Distribution Accumulated Depreciation
Calculation of Intangible Accumulated Depreciation SourceDecember p200.21c 2012 16,559,506 Accumulated Intangible Depreciation
Calculation of General Accumulated Depreciation SourceDecember p219.28 2012 53,250,130 Accumulated General Depreciation
Calculation of Production Accumulated Depreciation SourceDecember p219.20 thru 219.24 2012 1,370,973,290 Production Accumulated Depreciation
Total Accumulated Depreciation 2,933,734,342
Common Plant not allocated to gas or electric p356 2012 Total Common Plant 4 factor allocator Accumulated Depreciation common plant 199,851,124 65.95% 131,801,816
Electric / Non-electric Cost SupportAttachment A Line #s, Descriptions, Notes, Form 1 Page #s and Instructions Form 1 Amount Electric Portion Non-electric Portion Details
Plant Allocation FactorsAccumulated Intangible Depreciation p200.21.c 126,141,213 16,559,506 109,581,707
Materials and SuppliesUndistributed Stores Exp p227.6c & 15.c 0 0 0
Depreciation ExpenseIntangible Amortization p336.1d&e 3,422,917 3,422,917 0
Southern Intertie
Electric Segment Allocation

Transmission / Non-transmission Cost Support
Attachment A Line #s, Descriptions, Notes, Form 1 Page #s and Instructions Beg of year End of Year Details44 Land Held for Future Use p214 Total 13,831,085 13,865,588 13,848,337
Transmission future use 4,415,059 4,415,059 - -
Transmission Related 4,415,059 4,415,059 4,415,059
PBOPs Cost SupportAttachment A Line #s, Descriptions, Notes, Form 1 Page #s and Instructions Form 1 Amount PBOBs All other Details
66 Allocated General ExpensesAccount 926 (2009) 23,049,542 8,912,154 14,137,388 Base yearAccount 926 (Current Year) p323.187b 26,411,077 14,883,022 11,528,055 Current YearChange in PBOP Expense 5,970,868
Hydro power expense
Attachment A Line #s, Descriptions, Notes, Form 1 Page #s and Instructions Total DetailsAllocated General Expenses A&G
70 Less Fish Friendly hydropower turbine development and deployment p352-353 - 0
Regulatory Expense Related to Transmission Cost SupportAttachment A Line #s, Descriptions, Notes, Form 1 Page #s and Instructions Form 1 Amount Multiplier Total Wash Area Colstrip So. Intertie Details
LT loads 68,224 56,668 7956 3600 Worksheet 4Long tern Loads charged under the OATT 28,815 17,259 7,956 3,600 Worksheet 4Multiplier 3.28 1.00 1.00 Worksheet 4
Directly Assigned A&G1 FERC Annual Fees 884,839 Yes 2,095,031 1,740,168 244,314 110,549 The total is directly assigned to the three areas where2 Formula rate and OATT compliance matters 1,622,515 Yes 3,841,624 3,190,918 447,994 202,712 possible, if not possible then allocated based on 3 NERC Compliance No loads under the tariff4 RTO Filings No 5 Transmission Siting No 6 Other Transmission regulatory Commission Expenses 32,220 No 7 Excluded Items 5,520,773 NA
75 8 Regulatory Commission Exp Account 928 p350.1 thru 350.21 8,060,347 5,936,654 4,931,085 692,308 313,261
Safety Related Advertising Cost Support
Attachment A Line #s, Descriptions, Notes, Form 1 Page #s and Instructions Form 1 Amount Safety Related Non-safety Related DetailsDirectly Assigned A&G
69, 75, 78 General Advertising Exp Account 930.1 p323.191.b 264,362 - - 0 None
Excluded Plant Cost Support
Attachment A Line #s, Descriptions, Notes, Form 1 Page #s and Instructions Description of the FacilitiesAdjustment to Remove Revenue Requirements Associated with Excluded Transmission Facilities
158 Excluded Transmission Facilities - Colstrip Facilities Worksheet 3 5,500,000 General Description of the FacilitiesExcluded Transmission Facilities - WA Area Transmission Worksheet 3 91,731,000 Excluded Transmission Facilities - Southern Intertie Worksheet 3 - Total 97,231,000
Add more lines if necessary
End of Year for Est. Average for
Final
Education & Outreach
Excluded Transmission
Facilities - Colstrip Facilities

Transmission Related Account 242 Reserves
Attachment A Line #s, Descriptions, Notes, Form 1 Page #s and Instructions Beg of year End of Year Allocation Trans Related Details41 Transmission Related Account 242 Reserves (exclude current year environmental site related reserves) Enter $
Directly Assignable to TransmissionWash St Annual Filing Fee-Electric 4,433,968 4,264,276 FERC Fees Payable - Power Supply Transaction 128,667 141,741
Total (A) Total 4,562,635 4,406,017 4,484,326 100.00% 4,484,326 Stays in rate base
Labor Related, or General plant relatedDeferred Compensation - Salary Deferred 20,666,800 15,924,748 18,295,774 Other Deferred Credits - LTIP Liability 3,893,316 4,368,664 4,130,990 Accrued - 401(k) 1% Contributions 1,771,260 1,850,992 1,811,126 Liability Reserve - Electric 300,000 20,000 160,000 SERP Pension & Benefit Plan Liability 49,693,115 53,306,631 51,499,873 Postretirement Benefit Plan Liability 7,892,936 8,606,103 8,249,520 Qualified Pension Plan Liability 86,196,737 85,090,938 85,643,838 Accrual - 401(k) Match on Incentive Pla 1,323,842 1,240,116 1,281,979 Bothell Landlord Incentive 1,308,490 1,170,755 1,239,622 NERC Standards Compliance 273,040 130,530 201,785 Severance Payable 149,553 124,810 137,181 Redmond West Landlord Incentive - 217,406 108,703 BofA Rebate - 100,000 50,000
(B) Sum Labor Related 173,046,496 171,578,947 172,312,722 11.33% 19,443,653
Other
24200621 Accrued Real Estate (A) - (B) 62,349 35,595 48,972 24200651 Elec-Concrete Fundg 24,500 26,500 25,500 24200661 Elec-Up Skag Trb MOU 285,023 293,574 289,299 24200671 Elec-Sauk-Suiattle 84,413 86,946 85,679 24200681 Elec-Swinomish Tribe 84,413 86,946 85,679 24200741 Ref Bond-Lease Permi 1,000 - 500 24200751 Clstrp Unit 1-4 Ash 2,244,375 2,244,375 2,244,375 24200761 BLKD-REC Fnd LIW 360,220 - 180,110 24200811 Art 103-Upstream Fsh 86,253 108,903 97,578 24200821 Art 105-Dnstream Fsh 86,253 108,903 97,578 24200831 Art 511-Decayng Wood 86,060 89,074 87,567 24200841 Art 505-O&M Aqua Rpa 525,822 583,252 554,537 24200851 Art 602-O&M RecAdap 215,397 202,641 209,019 24200861 Art 512-Bald Eagle 26,294 26,360 26,327 24200891 Art 110-Shorelin O&M 248,381 202,510 225,446 24200921 Art 503-Elk Capital 561,675 565,651 563,663 24200931 Art 503-Elk Habi O&M 76,841 47,760 62,301 24200951 Art 504-Wetland O&M 11,192 162,924 87,058 24200971 Art 508-Noxious O&M 85,836 91,256 88,546 24200011 Baker SA 318 Law Enf - (1,986) (993) 24200103 JR Achievement Prepaid Contributions - ST - 25,000 12,500 24200451 US Trsr Grnts-Sch95A 9,159 101,098 55,129 24200521 FERC Land Use Fee ST 57,914 61,791 59,852 24200541 Lower Baker - FERC L 94,368 86,155 90,262 24200551 Upper Baker - FERC L 94,368 86,155 90,262 24200561 Snoqualmie #1 - FERC 21,008 9,671 15,340 24200571 Snoqualmie #2 - FERC 21,008 9,671 15,340 24200622 Accrued WUTC Fee - Gas 2,340,665 2,158,095 2,249,380 24200871 Art 514-Use Habitat 9,342 6,933 8,137 24200881 Art 101-Fish Pro O&M - 67,591 33,796 24200901 Art 502-Forest Capit 467,260 467,399 467,330 24200911 Art 502-Forest O&M 5,207 10,505 7,856 24200941 Art 504-Wetland Capi - 371,918 185,959 24200961 Art 505-Aquatic Capi 2,173,300 2,175,504 2,174,402 24200991 Art 602-Terrestr O&M - 8,172 4,086 24201031 Art 302 - Aest Mgmt - 4,506 2,253 24201041 Art 304 Bak Rrs Rec - 4,506 2,253 24201101 LSR MOU Deposit 190,508 - 95,254
10,640,406 10,615,855 10,628,130 0.00% -
23,927,980
End of Year for Est. Average for
Final

Prepayments
Attachment A Line #s, Descriptions, Notes, Form 1 Page #s and Instructions 13 month average Allocation Trans Related Details42 Prepayments
Labor Related Worksheet 2 3,542,413 11.332% 401,433
Plant Related Worksheet 2 1,817,782 14.373% 261,268
100% Transmission Related Worksheet 2 148,290 100.000% 148,290 Other (Excluded) Worksheet 2 9,417,231 0.000% -
810,990
Materials & SuppliesAttachment A Line #s, Descriptions, Notes, Form 1 Page #s and Instructions
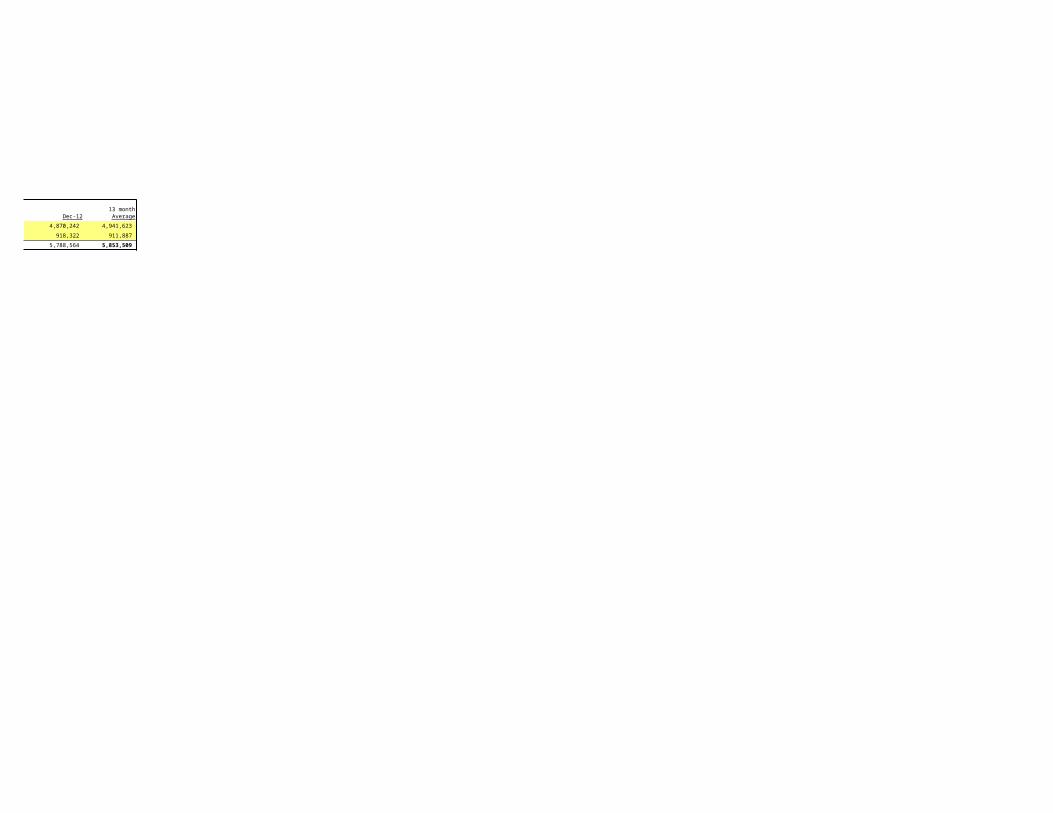
45 Materials and Supplies 13 monthDec-11 Jan-12 Feb-12 Mar-12 Apr-12 May-12 Jun-12 Jul-12 Aug-12 Sep-12 Oct-12 Nov-12 Dec-12 Average
Undistr. Stores Exp, Account 163 4,174,874 4,431,122 4,626,806 4,884,397 5,154,695 5,272,873 5,364,073 5,293,600 5,231,947 4,933,967 5,057,256 4,945,242 4,870,242 4,941,623
Transmission Plant materials from Account 154 283,283 894,598 916,479 948,841 985,412 998,927 1,005,063 971,214 978,892 956,508 985,530 1,011,460 918,322 911,887
Total 4,458,157 5,325,720 5,543,285 5,833,238 6,140,107 6,271,800 6,369,136 6,264,814 6,210,839 5,890,475 6,042,786 5,956,702 5,788,564 5,853,509
Outstanding Network Credits Cost SupportAttachment A Line #s, Descriptions, Notes, Form 1 Page #s and Instructions Description of the Credits
Network Credits Beg of year End of Year55 Outstanding Network Credits General Description of the Credits
December Account 253 For 2011 30,517 30,517
December Account 253 For 2012 30,517 30,517
Average Beginning and End of Year 30,517 30,517
56 Accumulated Depreciation Associated with Facilities with Outstanding Network CreditsDecember Account 253 For 2011 204,480 204,480 December Account 253 For 2012 396,510 396,510 Average Beginning and End of Year 300,495 300,495
Interest on Outstanding Network Credits Cost Support
Attachment A Line #s, Descriptions, Notes, Form 1 Page #s and Instructions Description of the Interest on the CreditsCredits
164 Interest on Network Credits 4,408 General Description of the Credits
Add more lines if necessary
Transmission of Electricity By Others; Account 565
63 Transmission of Electricity By Others; Account 565 FERC Form 1 p321.96b BPA O&M BPA Lease Rights Northwestern O&MWA Area Transmission 80,620,819 7,296 154,956 8,303 80,450,264
Colstrip 5,536,326 418,653 5,117,673
Southern Intertie 928,745 928,745 -
Total 87,085,890 936,041 154,956 8,303 418,653 85,567,937
End of Year Est. Average for Final
Interest on Network Credits
Whatcom PUD Line Loss
Total 565 to Reduce O&M

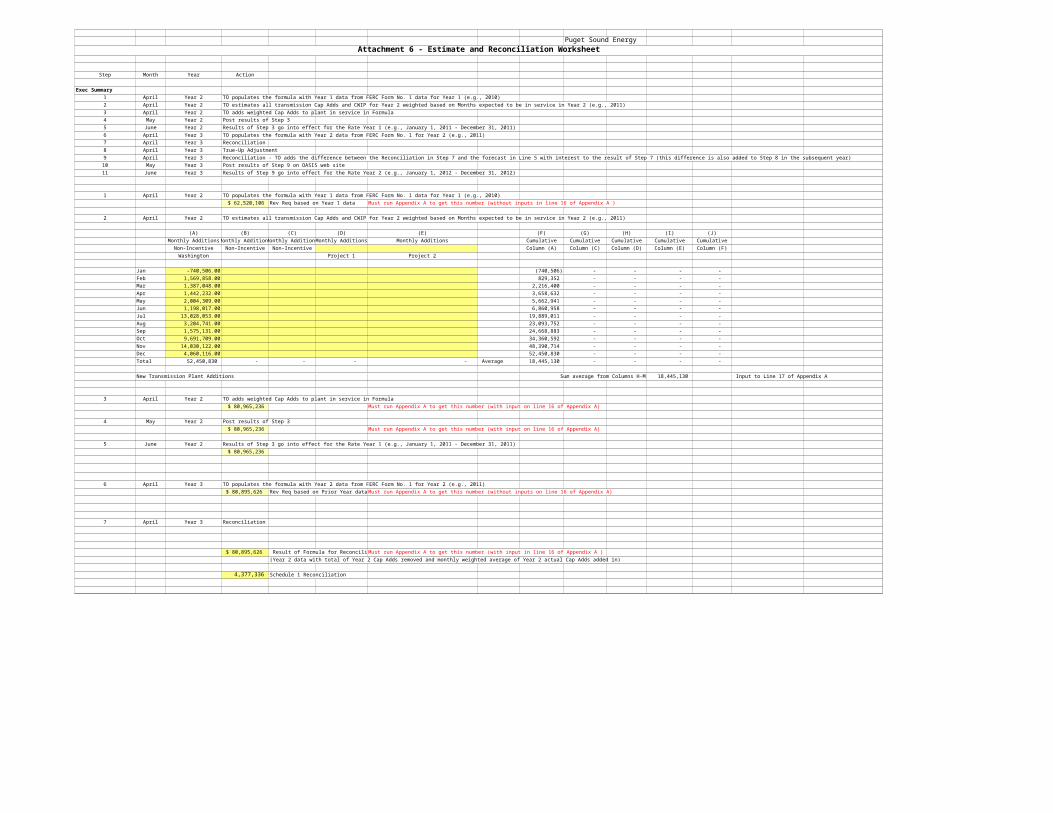
Puget Sound Energy Attachment 6 - Estimate and Reconciliation Worksheet
Step Month Year Action
Exec Summary1 April Year 2 TO populates the formula with Year 1 data from FERC Form No. 1 data for Year 1 (e.g., 2010)2 April Year 2 TO estimates all transmission Cap Adds and CWIP for Year 2 weighted based on Months expected to be in service in Year 2 (e.g., 2011)3 April Year 2 TO adds weighted Cap Adds to plant in service in Formula4 May Year 2 Post results of Step 35 June Year 2 Results of Step 3 go into effect for the Rate Year 1 (e.g., January 1, 2011 - December 31, 2011)6 April Year 3 TO populates the formula with Year 2 data from FERC Form No. 1 for Year 2 (e.g., 2011)7 April Year 3 Reconciliation8 April Year 3 True-Up Adjustment9 April Year 3 Reconciliation - TO adds the difference between the Reconciliation in Step 7 and the forecast in Line 5 with interest to the result of Step 7 (this difference is also added to Step 8 in the subsequent year)
10 May Year 3 Post results of Step 9 on OASIS web site11 June Year 3 Results of Step 9 go into effect for the Rate Year 2 (e.g., January 1, 2012 - December 31, 2012)
1 April Year 2 TO populates the formula with Year 1 data from FERC Form No. 1 data for Year 1 (e.g., 2010) $ 62,520,106 Rev Req based on Year 1 data Must run Appendix A to get this number (without inputs in line 16 of Appendix A )
2 April Year 2 TO estimates all transmission Cap Adds and CWIP for Year 2 weighted based on Months expected to be in service in Year 2 (e.g., 2011)
(A) (B) (C) (D) (E) (F) (G) (H) (I) (J)Monthly Additions Monthly Additions Monthly Additions Monthly Additions Monthly Additions Cumulative Cumulative Cumulative Cumulative Cumulative
Non-Incentive Non-Incentive Non-Incentive Column (A) Column (C) Column (D) Column (E) Column (F)Washington Project 1 Project 2
Jan -740,506.00 (740,506) - - - - Feb 1,569,858.00 829,352 - - - - Mar 1,387,048.00 2,216,400 - - - - Apr 1,442,232.00 3,658,632 - - - - May 2,004,309.00 5,662,941 - - - - Jun 1,198,017.00 6,860,958 - - - - Jul 13,028,053.00 19,889,011 - - - - Aug 3,204,741.00 23,093,752 - - - - Sep 1,575,131.00 24,668,883 - - - - Oct 9,691,709.00 34,360,592 - - - - Nov 14,030,122.00 48,390,714 - - - - Dec 4,060,116.00 52,450,830 - - - - Total 52,450,830 - - - - Average 18,445,130 - - - -
New Transmission Plant Additions Sum average from Columns H-M 18,445,130 Input to Line 17 of Appendix A
3 April Year 2 TO adds weighted Cap Adds to plant in service in Formula $ 80,965,236 Must run Appendix A to get this number (with input on line 16 of Appendix A)
4 May Year 2 Post results of Step 3 $ 80,965,236 Must run Appendix A to get this number (with input on line 16 of Appendix A)
5 June Year 2 Results of Step 3 go into effect for the Rate Year 1 (e.g., January 1, 2011 - December 31, 2011) $ 80,965,236
6 April Year 3 TO populates the formula with Year 2 data from FERC Form No. 1 for Year 2 (e.g., 2011) $ 80,895,626 Rev Req based on Prior Year data Must run Appendix A to get this number (without inputs on line 16 of Appendix A)
7 April Year 3 Reconciliation
$ 80,895,626 Result of Formula for Reconciliation Must run Appendix A to get this number (with input in line 16 of Appendix A )(Year 2 data with total of Year 2 Cap Adds removed and monthly weighted average of Year 2 actual Cap Adds added in)
4,377,336 Schedule 1 Reconciliation

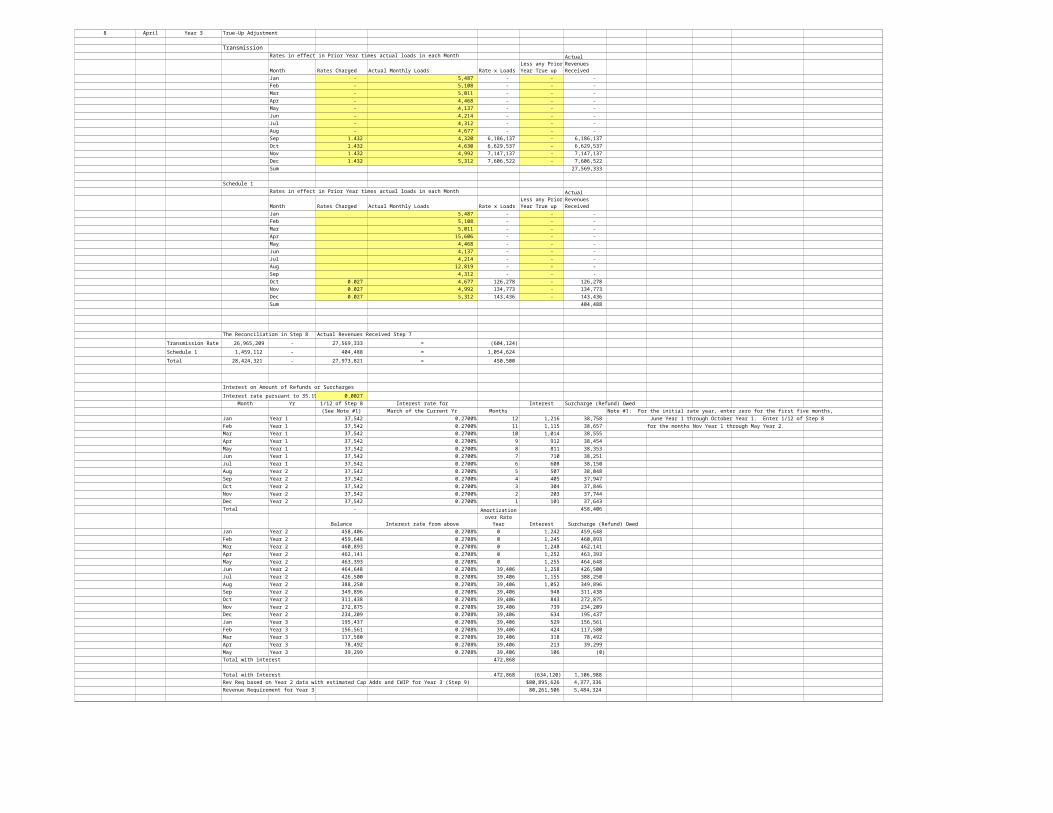
8 April Year 3 True-Up Adjustment
TransmissionRates in effect in Prior Year times actual loads in each Month
Month Rates Charged Actual Monthly Loads Rate x LoadsJan - 5,487 - - - Feb - 5,108 - - - Mar - 5,011 - - - Apr - 4,468 - - - May - 4,137 - - - Jun - 4,214 - - - Jul - 4,312 - - - Aug - 4,677 - - - Sep 1.432 4,320 6,186,137 - 6,186,137 Oct 1.432 4,630 6,629,537 - 6,629,537 Nov 1.432 4,992 7,147,137 - 7,147,137 Dec 1.432 5,312 7,606,522 - 7,606,522 Sum 27,569,333
Schedule 1Rates in effect in Prior Year times actual loads in each Month
Month Rates Charged Actual Monthly Loads Rate x LoadsJan 5,487 - - - Feb 5,108 - - - Mar 5,011 - - - Apr 15,606 - - - May 4,468 - - - Jun 4,137 - - - Jul 4,214 - - - Aug 12,819 - - - Sep 4,312 - - - Oct 0.027 4,677 126,278 - 126,278 Nov 0.027 4,992 134,773 - 134,773 Dec 0.027 5,312 143,436 - 143,436 Sum 404,488
The Reconciliation in Step 8 Actual Revenues Received Step 7
Transmission Rate 26,965,209 - 27,569,333 = (604,124)
Schedule 1 1,459,112 - 404,488 = 1,054,624
Total 28,424,321 - 27,973,821 = 450,500
Interest on Amount of Refunds or Surcharges
Interest rate pursuant to 35.19a for March of th 0.0027 Month Yr 1/12 of Step 8 Interest rate for Interest Surcharge (Refund) Owed
(See Note #1) March of the Current Yr Months Note #1: For the initial rate year, enter zero for the first five months, Jan Year 1 37,542 0.2700% 12 1,216 38,758 June Year 1 through October Year 1. Enter 1/12 of Step 8Feb Year 1 37,542 0.2700% 11 1,115 38,657 for the months Nov Year 1 through May Year 2.Mar Year 1 37,542 0.2700% 10 1,014 38,555 Apr Year 1 37,542 0.2700% 9 912 38,454 May Year 1 37,542 0.2700% 8 811 38,353 Jun Year 1 37,542 0.2700% 7 710 38,251 Jul Year 1 37,542 0.2700% 6 608 38,150 Aug Year 2 37,542 0.2700% 5 507 38,048 Sep Year 2 37,542 0.2700% 4 405 37,947 Oct Year 2 37,542 0.2700% 3 304 37,846 Nov Year 2 37,542 0.2700% 2 203 37,744 Dec Year 2 37,542 0.2700% 1 101 37,643 Total - 458,406
Balance Interest rate from above Interest Surcharge (Refund) Owed Jan Year 2 458,406 0.2708% 0 1,242 459,648 Feb Year 2 459,648 0.2708% 0 1,245 460,893 Mar Year 2 460,893 0.2708% 0 1,248 462,141 Apr Year 2 462,141 0.2708% 0 1,252 463,393 May Year 2 463,393 0.2708% 0 1,255 464,648 Jun Year 2 464,648 0.2708% 39,406 1,258 426,500 Jul Year 2 426,500 0.2708% 39,406 1,155 388,250 Aug Year 2 388,250 0.2708% 39,406 1,052 349,896 Sep Year 2 349,896 0.2708% 39,406 948 311,438 Oct Year 2 311,438 0.2708% 39,406 843 272,875 Nov Year 2 272,875 0.2708% 39,406 739 234,209 Dec Year 2 234,209 0.2708% 39,406 634 195,437 Jan Year 3 195,437 0.2708% 39,406 529 156,561 Feb Year 3 156,561 0.2708% 39,406 424 117,580 Mar Year 3 117,580 0.2708% 39,406 318 78,492 Apr Year 3 78,492 0.2708% 39,406 213 39,299 May Year 3 39,299 0.2708% 39,406 106 (0)Total with interest 472,868
Total with Interest 472,868 (634,120) 1,106,988 Rev Req based on Year 2 data with estimated Cap Adds and CWIP for Year 3 (Step 9) $ 80,895,626 4,377,336 Revenue Requirement for Year 3 80,261,506 5,484,324
Less any Prior Year True up
Actual Revenues Received
Less any Prior Year True up
Actual Revenues Received
Amortization over Rate Year
9 April Year 3 TO estimates Cap Adds and CWIP during Year 3 weighted based on Months expected to be in service in Year 3 (e.g., 2012)
(A) (B) (C) (D) (E) (F) (H) (I) (J) (K) (L) (M)Monthly Additions Monthly Additions Monthly Additions Monthly Additions Monthly Additions Monthly Additions Cumulative Cumulative Cumulative Cumulative Cumulative Cumulative
Non-Incentive Non-Incentive Non-Incentive Column (A) Column (B) Column (C) Column (D) Column (E) Column (F)Washington Project 1 Project 2 Project 3
Jan - - - - - - - Feb 9,537,878 9,537,878 - - - - - Mar - 9,537,878 - - - - - Apr - 9,537,878 - - - - - May - 9,537,878 - - - - - Jun 3,185,811 12,723,689 - - - - - Jul 2,483,547 15,207,236 - - - - - Aug 16,816,324 32,023,560 - - - - - Sep 5,316,137 37,339,697 - - - - - Oct 19,015,475 56,355,172 - - - - - Nov 1,842,084 58,197,256 - - - - - Dec 2,768,353 60,965,609 - - - - - Total 60,965,609 - - - - - Average 25,913,644 - - - - -
New Transmission Plant Additions Sum average from Columns H-M 25,913,644
10 May Year 3 Post results of Step 9 on OASIS web site 80,261,506 Post results of Step 3
11 June Year 3 Results of Step 9 go into effect for the Rate Year 2 (e.g., January 1, 2012 - December 31, 2012) $ 80,261,506
Puget Sound Energy Attachment 6A - Estimate and Reconciliation Worksheet - Colstrip
Step Month Year Action
Exec Summary1 April Year 2 TO populates the formula with Year 1 data from FERC Form No. 1 data for Year 1 (e.g., 2010)2 April Year 2 TO estimates all transmission Cap Adds and CWIP for Year 2 weighted based on Months expected to be in service in Year 2 (e.g., 2011)
3 April Year 2 TO adds weighted Cap Adds to plant in service in Formula4 May Year 2 Post results of Step 35 June Year 2 Results of Step 3 go into effect for the Rate Year 1 (e.g., January 1, 2011 - December 31, 2011)
6 April Year 3 TO populates the formula with Year 2 data from FERC Form No. 1 for Year 2 (e.g., 2011)
7 April Year 3 Reconciliation
8 April Year 3 True-Up Adjustment9 April Year 3 Reconciliation - TO adds the difference between the Reconciliation in Step 7 and the forecast in Line 5 with interest to the result of Step 7 (this difference is also added to Step 8 in the subsequent year)
10 May Year 3 Post results of Step 9 on OASIS web site
11 June Year 3 Results of Step 9 go into effect for the Rate Year 2 (e.g., January 1, 2012 - December 31, 2012)
1 April Year 2 TO populates the formula with Year 1 data from FERC Form No. 1 data for Year 1 (e.g., 2010) $ 9,177,669 Rev Req based on Year 1 data Must run Appendix A to get this number (without inputs in line 16 of Appendix A )
2 April Year 2 TO estimates all transmission Cap Adds and CWIP for Year 2 weighted based on Months expected to be in service in Year 2 (e.g., 2011)
(A) (B) (C) (D) (E) (F) (H) (I) (J) (K) (L) (M)
Monthly Additions Monthly Additions Monthly Additions Monthly Additions Monthly Additions Monthly Additions Cumulative Cumulative Cumulative Cumulative Cumulative CumulativeNon-Incentive Non-Incentive Non-Incentive Non-Incentive Column (A) Column (B) Column (C) Column (D) Column (E) Column (F)
Project 1 Project 2
Jan - - - - - -
Feb - - - - - - Mar - - - - - - Apr - - - - - -
May - - - - - - Jun - - - - - -
Jul - - - - - - Aug - - - - - -
Sep - - - - - - Oct - - - - - - Nov - - - - - -
Dec - - - - - - Total - - - - - - Average - - - - - -
New Transmission Plant Additions Sum average from Columns H - Input to Line 17 of Appendix A
3 April Year 2 TO adds weighted Cap Adds to plant in service in Formula
$ - Must run Appendix A to get this number (with input on line 16 of Appendix A)
4 May Year 2 Post results of Step 3 $ - Must run Appendix A to get this number (with input on line 16 of Appendix A)
5 June Year 2 Results of Step 3 go into effect for the Rate Year 1 (e.g., January 1, 2011 - December 31, 2011) $ -
6 April Year 3 TO populates the formula with Year 2 data from FERC Form No. 1 for Year 2 (e.g., 2011) $ - Rev Req based on Prior Year data Must run Appendix A to get this number (without inputs on line 16 of Appendix A)
7 April Year 3 Reconciliation
$ 9,177,669 Result of Formula for Reconciliation Must run Appendix A to get this number (with input in line 16 of Appendix A )
(Year 2 data with total of Year 2 Cap Adds removed and monthly weighted average of Year 2 actual Cap Adds added in)
$ - Schedule 1 Reconciliation
8 April Year 3 True-Up Adjustment
TransmissionRates in effect in Prior Year times actual loads in each Month
Month Rates Charged Actual Monthly Loads Rate x LoadsJan 663.00 - - -
Feb 663.00 - - - Mar 663.00 - - - Apr 1.090 663.00 722,670 - 722,670
May 1.090 663.00 722,670 - 722,670 Jun 1.090 663.00 722,670 - 722,670
Jul 1.090 663.00 722,670 - 722,670 Aug 1.090 663.00 722,670 - 722,670
Sep 1.090 663.00 722,670 - 722,670 Oct 1.090 663.00 722,670 - 722,670 Nov 1.090 663.00 722,670 - 722,670
Dec 1.090 663.00 722,670 - 722,670 Sum 6,504,030
The Reconciliation in Step 8 Actual Revenues Received Step 7
Transmission Rate 6,883,252 - 6,504,030 = 379,222
Interest on Amount of Refunds or Surcharges
Interest rate pursuant to 35.19a for March of the Current Yr 0.0027 Month Yr 1/12 of Step 8 Interest rate for Interest Surcharge (Refund) Owed
(See Note #1) March of the Current Yr Months Note #1: For the initial rate year, enter zero for the first five months,
Jan Year 1 31,602 0.2708% 12 1,027 32,629 June Year 1 through October Year 1. Enter 1/12 of Step 8Feb Year 1 31,602 0.2708% 11 941 32,543 for the months Nov Year 1 through May Year 2.
Mar Year 1 31,602 0.2708% 10 856 32,458 Apr Year 1 31,602 0.2708% 9 770 32,372 May Year 1 31,602 0.2708% 8 685 32,287
Jun Year 1 31,602 0.2708% 7 599 32,201 Jul Year 1 31,602 0.2708% 6 514 32,115
Aug Year 2 31,602 0.2708% 5 428 32,030 Sep Year 2 31,602 0.2708% 4 342 31,944
Oct Year 2 31,602 0.2708% 3 257 31,859 Nov Year 2 31,602 0.2708% 2 171 31,773 Dec Year 2 31,602 0.2708% 1 86 31,687
Total - 385,898
Balance Interest rate from above Interest Surcharge (Refund) Owed Jan Year 2 385,898 0.2708% 0 1,045 386,943 Feb Year 2 386,943 0.2708% 0 1,048 387,991
Mar Year 2 387,991 0.2708% 0 1,051 389,042 Apr Year 2 389,042 0.2708% 0 1,054 390,096
May Year 2 390,096 0.2708% 0 1,057 391,152 Jun Year 2 391,152 0.2708% 33,173 1,059 359,039
Jul Year 2 359,039 0.2708% 33,173 972 326,838 Aug Year 2 326,838 0.2708% 33,173 885 294,551 Sep Year 2 294,551 0.2708% 33,173 798 262,176
Oct Year 2 262,176 0.2708% 33,173 710 229,713 Nov Year 2 229,713 0.2708% 33,173 622 197,163
Dec Year 2 197,163 0.2708% 33,173 534 164,524 Jan Year 3 164,524 0.2708% 33,173 446 131,797 Feb Year 3 131,797 0.2708% 33,173 357 98,981
Mar Year 3 98,981 0.2708% 33,173 268 66,077 Apr Year 3 66,077 0.2708% 33,173 179 33,083
May Year 3 33,083 0.2708% 33,173 90 0 Total with interest 398,072
Total with interest 398,072 Rev Req based on Year 2 data with estimated Cap Adds and CWIP for Year 3 (Step 9) $ 9,177,669
Revenue Requirement for Year 3 9,575,742
Less any Prior Year True up
Actual Revenues Received
Amortization over Rate Year

9 April Year 3 TO estimates Cap Adds and CWIP during Year 3 weighted based on Months expected to be in service in Year 3 (e.g., 2012)
(A) (B) (C) (D) (E) (F) (H) (I) (J) (K) (L) (M)
Monthly Additions Monthly Additions Monthly Additions Monthly Additions Monthly Additions Monthly Additions Cumulative Cumulative Cumulative Cumulative Cumulative CumulativeNon-Incentive Non-Incentive Non-Incentive Column (A) Column (B) Column (C) Column (D) Column (E) Column (F)
Project 1 Project 2 Project 3
Jan - - - - - -
Feb - - - - - - Mar - - - - - - Apr - - - - - -
May - - - - - - Jun - - - - - -
Jul - - - - - - Aug - - - - - -
Sep - - - - - - Oct - - - - - - Nov - - - - - -
Dec - - - - - - Total - - - - - - Average - - - - - -
New Transmission Plant Additions Sum average from Columns H - Input to Line 17 of Appendix A
10 May Year 3 Post results of Step 9 on OASIS web site
Post results of Step 3
11 June Year 3 Results of Step 9 go into effect for the Rate Year 2 (e.g., January 1, 2012 - December 31, 2012) $ -

Puget Sound Energy Attachment 6B - Estimate and Reconciliation Worksheet - Southern Intertie
Step Month Year Action
Exec Summary1 April Year 2 TO populates the formula with Year 1 data from FERC Form No. 1 data for Year 1 (e.g., 2010)2 April Year 2 TO estimates all transmission Cap Adds and CWIP for Year 2 weighted based on Months expected to be in service in Year 2 (e.g., 2011)3 April Year 2 TO adds weighted Cap Adds to plant in service in Formula4 May Year 2 Post results of Step 35 June Year 2 Results of Step 3 go into effect for the Rate Year 1 (e.g., January 1, 2011 - December 31, 2011)
6 April Year 3 TO populates the formula with Year 2 data from FERC Form No. 1 for Year 2 (e.g., 2011)7 April Year 3 Reconciliation - TO calculates Reconciliation by removing from Year 2 data - the total Cap Adds placed in service in Year 2 and adding weighted average in Year 2 actual Cap Adds and CWIP in Reconciliation
(adjusted to include any Reconciliation amount from prior year)8 April Year 3 TO estimates Cap Adds and CWIP during Year 3 weighted based on Months expected to be in service in Year 3 (e.g., 2012)9 April Year 3 Reconciliation - TO adds the difference between the Reconciliation in Step 7 and the forecast in Line 5 with interest to the result of Step 7 (this difference is also added to Step 8 in the subsequent year)10 May Year 3 Post results of Step 9 on OASIS web site11 June Year 3 Results of Step 9 go into effect for the Rate Year 2 (e.g., January 1, 2012 - December 31, 2012)
1 April Year 2 TO populates the formula with Year 1 data from FERC Form No. 1 data for Year 1 (e.g., 2010) $ 1,277,411 Rev Req based on Year 1 data Must run Appendix A to get this number (without inputs in line 16 of Appendix A )
2 April Year 2 TO estimates all transmission Cap Adds and CWIP for Year 2 weighted based on Months expected to be in service in Year 2 (e.g., 2011)
(A) (B) (C) (D) (E) (F) (H) (I) (J) (K) (L) (M)Monthly Additions Monthly Additions Monthly Additions Monthly Additions Monthly Additions Monthly Additions Cumulative Cumulative Cumulative Cumulative Cumulative Cumulative
Non-Incentive Non-Incentive Non-Incentive Non-Incentive Column (A) Column (B) Column (C) Column (D) Column (E) Column (F)Project 1 Project 2
Jan - - - - - - Feb - - - - - - Mar - - - - - - Apr - - - - - - May - - - - - - Jun - - - - - - Jul - - - - - - Aug - - - - - - Sep - - - - - - Oct - - - - - -
Nov - - - - - - Dec - - - - - - Total - - - - - - Average - - - - - -
New Transmission Plant Additions Sum average from Columns H-M - Input to Line 17 of Appendix A
3 April Year 2 TO adds weighted Cap Adds to plant in service in Formula $ 6,011,385 Must run Appendix A to get this number (with input on line 16 of Appendix A)
4 May Year 2 Post results of Step 3 $ - Must run Appendix A to get this number (with input on line 16 of Appendix A)
5 June Year 2 Results of Step 3 go into effect for the Rate Year 1 (e.g., January 1, 2011 - December 31, 2011)
$ -
6 April Year 3 TO populates the formula with Year 2 data from FERC Form No. 1 for Year 2 (e.g., 2011) $ - Rev Req based on Prior Year data Must run Appendix A to get this number (without inputs on line 16 of Appendix A)
7 April Year 3 Reconciliation
$ - Result of Formula for Reconciliation Must run Appendix A to get this number (with input in line 16 of Appendix A )(Year 2 data with total of Year 2 Cap Adds removed and monthly weighted average of Year 2 actual Cap Adds added in)
$ - Schedule 1 Reconciliation

8 April Year 3 True-Up Adjustment
TransmissionRates in effect in Prior Year times actual loads in each Month
Month Rates Charged Actual Monthly Loads Rate x LoadsJan 400.00 - - - Feb 400.00 - - - Mar 100.00 - - - Apr 1.460 100.00 146,000 - 146,000 May 1.460 100.00 146,000 - 146,000 Jun 1.460 400.00 584,000 - 584,000 Jul 1.460 400.00 584,000 - 584,000 Aug 1.460 400.00 584,000 - 584,000 Sep 1.460 400.00 584,000 - 584,000 Oct 1.460 100.00 146,000 - 146,000 Nov 1.460 400.00 584,000 - 584,000 Dec 1.460 400.00 584,000 - 584,000
Sum 3,942,000.00
The Reconciliation in Step 8 Actual Revenues Received Step 7
Transmission Rate 4,508,539 - 3,942,000 = 566,539
Interest on Amount of Refunds or Surcharges
Interest rate pursuant to 35.19a for March of the Current Yr 0.00 Month Yr 1/12 of Step 8 Interest rate for Interest Surcharge (Refund) Owed
(See Note #1) March of the Current Yr Months Note #1: For the initial rate year, enter zero for the first five months, Jan Year 1 47,212 0.2708% 12 1,534 48,746 June Year 1 through October Year 1. Enter 1/12 of Step 8Feb Year 1 47,212 0.2708% 11 1,407 48,618 for the months Nov Year 1 through May Year 2.Mar Year 1 47,212 0.2708% 10 1,279 48,490 Apr Year 1 47,212 0.2708% 9 1,151 48,362 May Year 1 47,212 0.2708% 8 1,023 48,235 Jun Year 1 47,212 0.2708% 7 895 48,107 Jul Year 1 47,212 0.2708% 6 767 47,979 Aug Year 2 47,212 0.2708% 5 639 47,851 Sep Year 2 47,212 0.2708% 4 511 47,723 Oct Year 2 47,212 0.2708% 3 384 47,595 Nov Year 2 47,212 0.2708% 2 256 47,467
Dec Year 2 47,212 0.2708% 1 128 47,339 Total - 576,513
Balance Interest rate from above Amortization over Rate Year Interest Surcharge (Refund) Owed Jan Year 2 576,513 0.2708% 0 1,561 578,074 Feb Year 2 578,074 0.2708% 0 1,566 579,640 Mar Year 2 579,640 0.2708% 0 1,570 581,209 Apr Year 2 581,209 0.2708% 0 1,574 582,784 May Year 2 582,784 0.2708% 0 1,578 584,362 Jun Year 2 584,362 0.2708% 49,558 1,583 536,386 Jul Year 2 536,386 0.2708% 49,558 1,453 488,281 Aug Year 2 488,281 0.2708% 49,558 1,322 440,045 Sep Year 2 440,045 0.2708% 49,558 1,192 391,678 Oct Year 2 391,678 0.2708% 49,558 1,061 343,181 Nov Year 2 343,181 0.2708% 49,558 929 294,552 Dec Year 2 294,552 0.2708% 49,558 798 245,791
Jan Year 3 245,791 0.2708% 49,558 666 196,898 Feb Year 3 196,898 0.2708% 49,558 533 147,873 Mar Year 3 147,873 0.2708% 49,558 400 98,715 Apr Year 3 98,715 0.2708% 49,558 267 49,424 May Year 3 49,424 0.2708% 49,558 134 0 Total with interest 594,700
Total with interest 594,700 Rev Req based on Year 2 data with estimated Cap Adds and CWIP for Year 3 (Step 9) $ 6,011,385 Revenue Requirement for Year 3 6,606,086
Less any Prior Year True up
Actual Revenues Received

9 April Year 3 TO estimates Cap Adds and CWIP during Year 3 weighted based on Months expected to be in service in Year 3 (e.g., 2012)
(A) (B) (C) (D) (E) (F) (H) (I) (J) (K) (L) (M)Monthly Additions Monthly Additions Monthly Additions Monthly Additions Monthly Additions Monthly Additions Cumulative Cumulative Cumulative Cumulative Cumulative Cumulative
Non-Incentive Non-Incentive Non-Incentive Column (A) Column (B) Column (C) Column (D) Column (E) Column (F)Project 1 Project 2 Project 3
Jan - - - - - - Feb - - - - - - Mar - - - - - - Apr - - - - - - May - - - - - - Jun - - - - - - Jul - - - - - - Aug - - - - - - Sep - - - - - - Oct - - - - - - Nov - - - - - - Dec - - - - - -
Total - - - - - - Average - - - - - -
New Transmission Plant Additions Sum average from Columns H-M - Input to Line 17 of Appendix A
10 May Year 3 Post results of Step 9 on OASIS web site Month In Servi - - - Post results of Step 3
11 June Year 3 Results of Step 9 go into effect for the Rate Year 2 (e.g., January 1, 2012 - December 31, 2012) $ -

Puget Sound Energy
Attachment 7 - Transmission Enhancement Charge Worksheetline # Formula Line
Total Transmission WA Area Colstrip
Fixed Charge Rate (FCR) if not a CIAC1 A 169 Net Plant Carrying Charge without Depreciation 14.9432% 12.5640% 25.2082% 14.2024%2 B 176 Net Plant Carrying Charge per 100 Basis Point in ROE without Depreciation 15.5731% 13.1854% 25.9481% 14.9423%3 C Line B less Line A 0.6299% 0.6215% 0.7399% 0.7399%
FCR if a CIAC4 D 170 Net Plant Carrying Charge without Depreciation, Return, nor Income Taxes 5.9557% 3.6962% 14.6510% 3.6452%
The FCR resulting from Formula in a given year is used for that year only.Therefore actual revenues collected in a year do not change based on cost data for subsequent years
Beginning = 13 month Plant CWIP or Plant balance Total = Sum all projectsDeprec = 13 month avg Accumulated Depreciation Line 179 Attach H = Total for "W Increased ROE" rowRevenue= FCR* 13 Month + Depreciation Non-Incentive = Total for ''FCR W base ROE'' row
Details PSANI Project (Note 1) Project B
5 Life - - 6 CIAC - - 7 Increased ROE (Basis Points) 50 - 8 FCR W base ROE 12.564% 12.564%9 FCR W increased ROE 12.875% 12.564%
10 13 Month Balance - 11 Annual Depreciation Exp - -
12 Invest Yr Depreciation (Note 2) 13 Month * FCR + Depreciation Depreciation (Note 2) 13 Month * FCR + Depreciation Total Non-incentive Increase13 FCR W base ROE 2010 - - - - - - $ - $ - $ - 14 W Increased ROE 2010 - - - - - - $ - $ - 15 FCR W base ROE 2011 - - - - - - $ - $ - $ - 16 W Increased ROE 2011 - - - - - - $ - $ - 17 FCR W base ROE 2012 - - - - - - $ - $ - $ - 18 W Increased ROE 2012 - - - - - - $ - $ - 19 FCR W base ROE 2013 - - - - - - $ - $ - $ - 20 W Increased ROE 2013 - - - - - - $ - $ - 21 FCR W base ROE 2014 - - - - - - $ - $ - $ - 22 W Increased ROE 2014 - - - - - - $ - $ - 23 FCR W base ROE 2015 - - - - - - $ - $ - $ - 24 W Increased ROE 2015 - - - - - - $ - $ - 25 FCR W base ROE 2016 - - - - - - $ - $ - $ - 26 W Increased ROE 2016 - - - - - - $ - $ - 27 FCR W base ROE 2017 - - - - - - $ - $ - $ - 28 W Increased ROE 2017 - - - - - - $ - $ - 29 FCR W base ROE 2018 - - - - - - $ - $ - $ - 30 W Increased ROE 2018 - - - - - - $ - $ - 31 FCR W base ROE 2019 - - - - - - $ - $ - $ - 32 W Increased ROE 2019 - - - - - - $ - $ - 33 FCR W base ROE 2020 - - - - - - $ - $ - $ - 34 W Increased ROE 2020 - - - - - - $ - $ - 35 FCR W base ROE 2021 - - - - - - $ - $ - $ - 36 W Increased ROE 2021 - - - - - - $ - $ - 37 FCR W base ROE 2022 - - - - - - $ - $ - $ - 38 W Increased ROE 2022 - - - - - - $ - $ - 39 FCR W base ROE 2023 - - - - - - $ - $ - $ - 40 W Increased ROE 2023 - - - - - - $ - $ - 41 FCR W base ROE 2024 - - - - - - $ - $ - $ - 42 W Increased ROE 2024 - - - - - - $ - $ - 43 FCR W base ROE 2025 - - - - - - $ - $ - $ - 44 W Increased ROE 2025 - - - - - - $ - $ - 45 FCR W base ROE 2026 - - - - - - $ - $ - $ - 46 W Increased ROE 2026 - - - - - - $ - $ - 47 FCR W base ROE 2027 - - - - - - $ - $ - $ - 48 W Increased ROE 2027 - - - - - - $ - $ - 49 FCR W base ROE 2028 - - - - - - $ - $ - $ - 50 W Increased ROE 2028 - - - - - - $ - $ - 51 FCR W base ROE 2029 - - - - - - $ - $ - $ - 52 W Increased ROE 2029 - - - - $ - $ - 53 2030 …. …. …… 54 2030 …. ….. ….
Southern Intertie
13 Month Balance
13 Month Balance
Line 179 Attach H

Note 1
Note 2 The depreciation expense will be the estimated amount for the projection based on the projected in-service dates and the actual depreciation expense for the yearNote 3 CWIP is a placeholder that is zero until PSE receives authorization by FERC to include amounts.
"Pursuant to the Settlement Agreement approved by the Commission in Docket No. ER12-778-000 et al. PSE is entitled to earn a return of 10.3 percent with respect to its transmission rate base comprising those facilities identified in the Memorandum of Agreement between BPA, PSE, and Seattle City Light dated 1/1/2012. The Increased ROE (Basis Points) for PSE's share of the PSANI Project in Line 7 of this Attachment 7 shall be calculated by subtracting the ROE stated in Note J of Attachment H Direct from 10.3."

Puget Sound Energy Attachment 8 - Depreciation Rates
Plant Type PSE
Transmission Easements 1.90 Structures and Improvements 1.70 Station Equipment 2.11 Towers and Fixtures 1.67 Poles and Fixtures 3.02 Overhead Conductors and Devices 2.11 Underground Conductors and Devices 1.92 Roads and Trails 1.43
DistributionStructures and Improvements 1.81Station Equipment 1.97Poles, Towers and Fixtures 3.11Overhead Conductors and Devices 2.83Underground Conduit 2.26Underground Conductors and Devices 3.53Line Transformers 3.26Services 2.33Meters 2.32Street Lighting and Signal Systems 3.34Easements 2.24
General & CommonStructures and Improvements 6.60Office Furniture 5.00Office Equipment 20.00Transportation Equipment 9.00Stores and Equipment 5.00Tools, Shop, Garage and Other Tangible Equipment 5.00Power Operated Equipment 6.00Laboratory Equipment 5.00Communications Equipment 6.67Miscellaneous Equipment 6.67

Worksheet 1 - Revenue CreditsWA Area Colstrip Southern Intertie
Property Alloc 12.7006% 0.5900% 0.9950%Account 454 - Rent from Electric Property Wage Alloc 11.3322% 0.0000% 0.0000%Description Amount Allocator for Pole Contact Rental Revenues:Rent from Electric Property - Pole Contacts - J 6,080,984 3,317,231 - - Gross Book ValueRent from Electric Property - Transformers 4,901,465 Total TransmissionRent from Electric Property - Land and Buildings 445,112 56,532 2,626 4,429 FERC 354 Towers and Fixtures (p.207.51.g) 92,172,252 Rent from PCS 4,014,353 509,847 23,683 39,945 FERC 355 Poles and Fixtures (p.308.52.g) 273,449,262 Rent from Common Property - Land and Buildings 92 365,621,514 54.55%Rent Revenue from Colstrip #1 & #2 16,212 Rent Revenue from Colstrip #3 & #4 48,324 Total Distribution Rent from Electric Property - Light Pole Rental 64,233 FERC 364 Poles, Towers, and Fixtures (p.207.64.g) 304,617,884 45.45%Total 15,570,775 Total Account 454 (p300,19.b.) 15,570,775 Total Transmission and Distribution 670,239,398 100%Difference (must be zero) -
Total Allocated to Transmission 365,621,514 54.55%Account 456 - Other Electric RevenuesDescription AmountOther Electric Revenues - Summit Buyout 1,026,108 116,281 - - Other Electric Revenues - Other Misc 200,000 Other Electric Revenues - CLX 150 INTOLIGHT Service Revenue 511 DBU - Other Electric Revenues (30,787)PCS Revenue (reimbursement, not fees) 70,079 Green Energy Option 130,683 Other Electric Revenues - Sale of Non Core Gas 50,309,184 Other Electric Revenues - Cost Non Core Gas Sold (70,927,674)Other Electric Revenues - Cedar Hills Facility Fee 28,997 REC Revenue per Tariff Schedule -E 5,518,429 Other Electric Revenue Cost of Non Core Gas (1,295,549)Other Electric Revenue Sale of Non Core Gas 600,271 Attorney General settlement - Elec (3)Sumas DeMinizd H2O Sale - Socco 10,158 Lifetime O&M Revenue - Elec 247,943 Total (14,111,500)Total Account 456 (p300,21.b.) (14,111,500)Difference (must be zero) (0)

Account 456.1 - Revenues from Transmission of Electricity of Others
CUSTOMER Classification Demand Charges Energy Charges Other Charges Total RevenuesSeattle City Light OLF 332,297 0 0 332,297 Snohomish County PUD OS 0 0 600 600 Snohomish County PUD OLF 7,290 0 600 7,890 Snohomish County PUD OLF 1,496 0 600 2,096 Tacoma City Light OS 0 0 4,576 4,576
Bonneville Power Admin FNO 70,639 0 209,461 280,100 Bonneville Power Admin FNO 34,618 0 153,313 187,931
Bonneville Power Admin FNO 13,510 0 83,311 96,821 1,563 Bonneville Power Admin FNO 208,246 0 395,008 603,254 Bonneville Power Admin FNO 20,889 0 40,336 61,225 Bonneville Power Admin FNO 12,405 0 35,276 47,681 Bonneville Power Admin FNO 57,494 0 67,491 124,985 Bonneville Power Admin FNO 114,293 0 402,435 516,728 Bonneville Power Admin NF 0 2,877 396 3,273 2,877 ORBonneville Power Admin NF 0 2 0 2 2 WA
Bonneville Power Admin AD (6,644) 0 (40,201) (46,845) (6,644)Bonneville Power Admin AD 0 0 (2,130) (2,130)
Cargill Power Marketers, LLC SFP 35,632 0 6,895 42,527 35,632 ORCargill Power Marketers, LLC NF 0 86,198 25,773 111,971 86,198 ORConstellation Energy Commod Group SFP 298,675 0 71,041 369,716 298,675 ORConstellation Energy Commod Group NF 0 19,793 5,058 24,851 19,793 ORCP Energy Marketing, Inc. NF 0 0 (1) (1) 0 WAEagle Energy Partners SFP 48 0 9 57 48 OREagle Energy Partners NF 0 4,395 654 5,049 4,395 ORMacquarie Energy, LLC NF 0 9,549 2,680 12,229 9,549 ORMorgan Stanley Capital SFP 718,920 0 142,479 861,399 718,920 ORMorgan Stanley Capital NF 0 302 99 401 302 MTMorgan Stanley Capital NF 0 103,431 24,499 127,930 103,431 ORMorgan Stanley Capital NF 0 109 7 116 109 WAMorgan Stanley Capital AD 0 0 (9) (9)PPL Energy Plus NF 0 2,255 900 3,155 2,255 MTPortland General Electric Marketing NF 0 181 20 201 181 MTPortland General Electric Marketing NF 0 2,483 551 3,034 2,483 ORPowerex LFP 501,262 0 69,358 570,620
Powerex LFP 2,705,372 0 446,624 3,151,996 157,031 Powerex LFP 527,161 0 2,143,608 2,670,769 Powerex SFP 597,575 0 62,059 659,634 597,575 ORPowerex SFP 63,848 0 22,468 86,316 63,848 WAPowerex NF 0 497,511 65,038 562,549 497,511 ORPowerex NF 0 62,036 44,812 106,848 62,036 WAPowerex AD (338) 0 (7,132) (7,470)Powerex AD 0 0 (1,731) (1,731)Seattle City Light NF 0 152 32 184 152 ORShell Energy North America SFP 1,084,380 0 1,132,897 2,217,277 1,084,380 WAShell Energy North America NF 0 258,569 247,841 506,410 258,569 WAShell Energy North America NF 0 1,834 364 2,198 1,834 ORSierra Pacific Industries LFP 252,193 0 112,545 364,738 Sierra Pacific Industries NF 0 23,519 10,462 33,981 23,519 WA
Sierra Pacific Industries AD (8,388) 0 (34,922) (43,310) (8,388)Sierra Pacific Industries AD 0 0 (608) (608)Snohomish County PUD AD 0 0 (9) (9)Southern California Edison NF 0 25,965 7,987 33,952 25,965 ORTacoma Power NF 0 1,828 554 2,382 1,828 WATacoma Power AD 0 0 (12) (12)The Energy Authority SFP 3,600 0 1,224 4,824 3,600 ORThe Energy Authority NF 0 2,479 662 3,141 2,479 ORTransAlta Energy LFP 1,503,663 0 244,917 1,748,580 TransAlta Energy SFP 229,875 0 19,534 249,409 229,875 ORTransAlta Energy NF 0 30,329 5,842 36,171 30,329 ORTransAlta Energy AD 0 0 (2) (2)TransCanada NF 0 13 3 16 13 WATenaska Power Service Co. NF 0 2,483 1,803 4,286 2,483 WAVantage Wind Energy LLC-Invenergy LFP (1,561) 0 (63) (1,624)
Vantage Wind Energy LLC-Invenergy AD 29 0 (17,020) (16,991) 29 Whatcom County PUD LFP 26,547 0 10,408 36,955
Whatcom County PUD AD 0 0 (64) (64)Whatcom County PUD AD 0 0 2,928 2,928
0 0 0 0 Transportation Customers 0 0 0 0 Air Liquide FNO 58,404 0 163,990 222,394
Air Liquide AD 0 0 (32) (32)Air Products FNO 29,370 0 355,457 384,827 Air Products AD 0 0 (107) (107)
AMCOR Petroleum Containers FNO 27,783 0 71,001 98,784 AMCOR Petroleum Containers AD 0 0 (61) (61)Bellingham Cold Storage - Orchard FNO 14,151 0 (51,861) (37,710)
Bellingham Cold Storage - Orchard AD 0 0 (58) (58)Bellingham Cold Storage - Roeder FNO 15,885 0 (47,757) (31,872)
Bellingham Cold Storage - Roeder AD 0 0 (59) (59)Boeing FNO 462,604 0 208,476 671,080 Boeing AD 0 0 (1,656) (1,656)
BP Westcoast Products FNO 507,637 0 187,073 694,710 BP Westcoast Products AD 0 0 (2,474) (2,474)Intel FNO 19,978 0 (217,089) (197,111)
Intel AD 0 0 (85) (85)Shell (Equilon) FNO 263,976 0 459,826 723,802 Shell (Equilon) AD 0 0 (574) (574)
Tesoro FNO 190,691 0 373,512 564,203 Tesoro AD 0 0 (563) (563)
Various 0 0 (1,314,502) (1,314,502)Miscellaneous Adjustments AD 0 0 34 33
Total 10,995,505 1,138,293 6,406,625 18,540,422 0 0 0 0 4,314,437 Account 456.1 (p300,22.b.) 18,540,422 Difference (must be zero) - Exclude PTP Scheduling from Ancillary Services - WA area credits 1,640,378 Colstrip area credits 2,738 Southern Intertie area credits 2,671,321 Total Revenue Credits 4,314,437
$ Included on Attachment 3
WA - Additional revenue from LT redirect to ST
WA - Prior Period Adjustment for Transmission due to Unreserved Use from 2011
WA - Additional revenue from unreserved use by NT customer
WA - April Prior Period Adjustment for Transmission due to Unreserved Use
WA - Prior Period Adjustment for Transmission due to Unreserved Use from 2011

Worksheet 2 - Prepayments December January February March April May June July August September October November December 13 month
Related to GL Texts 2011 2012 2012 2012 2012 2012 2012 2012 2012 2012 2012 2012 2012 Average balance Not Include 100% Trans Plant LaborPlant Related:
Plant Related 16500033 Prepmts - Puget Crime Insurance 9,164 6,873 4,582 2,291 - - - - - - - - - 1,762 Insurance 1,762 Plant Related 16500083 Prepmts - All Risk Property Insurance 872,565 581,710 290,855 - 3,425,400 3,166,407 2,835,359 2,520,319 2,205,279 1,890,239 1,575,199 1,260,159 945,120 1,659,124 Insurance 1,659,124 Plant Related 16500253 Prepmts - Misc - Prepaid Insurance 6,199 5,267 5,476 4,544 3,613 4,240 3,322 7,420 - - - - - 3,083 Insurance 3,083 Plant Related 16500583 Prepaid - plant accounting software Maintenance 109,606 99,642 89,678 79,714 69,750 59,785 49,821 39,857 29,893 19,928 9,964 - 113,991 59,356 System 59,356 Plant Related 16500283 Prepaid SAP Support - 2,794,939 2,540,853 2,286,768 2,032,683 1,778,597 1,524,512 1,270,427 1,016,341 762,256 508,171 254,085 - 21,203 System 21,203 Plant Related 16500673 Prepmts - Treasury Licensing Fees - 161,156 143,250 125,344 107,438 89,531 71,625 53,719 35,812 17,906 - 73,253 Licensing 73,253
Total Plant Related 997,534 3,488,431 2,931,444 2,534,473 5,674,695 5,134,373 4,520,451 3,927,553 3,323,138 2,726,142 2,129,146 1,532,151 1,059,110 1,817,782 1,817,782
Labor Related:Labor Related 16500013 Prepmts - Puget Auto / General Liability 3,149,786 2,860,489 2,571,191 2,281,894 1,992,596 1,707,940 1,423,283 1,138,626 853,970 569,313 284,657 - 3,345,869 1,706,124 vehicle 1,706,124 Labor Related 16500051 Prepmts - BC Auto Liability 28,991 24,159 19,327 14,496 9,664 4,832 - 72,802 66,183 59,565 52,947 37,217 30,599 32,368 vehicle 32,368 Labor Related 16500063 Prepmts - Puget Workman's Comp - Aegis 320,843 291,676 262,508 233,341 204,173 175,006 145,838 116,670 87,503 58,335 29,168 - 366,372 176,264 Insurance 176,264 Labor Related 16500073 Prepmts - Workman Comp 19,946 16,730 12,862 9,647 6,431 35,444 32,228 64,456 - - - - - 15,211 Insurance 15,211 Labor Related 16500093 Prepmts - King Air Aircraft Insurance 16,483 14,984 13,486 11,987 10,489 8,990 7,492 5,994 4,495 2,997 1,498 - 14,621 8,732 insurance 8,732 Labor Related 16500143 Prepmts - D&O Insurance (annual) 182,416 136,812 91,208 45,604 - 416,667 378,788 340,909 303,030 265,152 222,720 184,841 147,873 208,925 insurance 208,925 Labor Related 16500313 Prepmts - Misc Employee Benefits 1,725,564 1,577,139 302,974 2,313,640 - 301,881 - 2,326,822 2,313,112 - 301,036 - - 858,628 labor 858,628 Labor Related 16500333 Prepmts - Heavy Vehicle Licenses 1,224 1,009 795 580 365 151 (64) - 2,361 2,147 1,932 1,717 1,503 1,055 vehicle 1,055 Labor Related 16500373 Prepmts - Interest - 1,313 - - - - - 717 11,463 18,503 25,542 39,937 20,096 9,044 labor 9,044 Labor Related 16500413 Prepmts - Alstrom Software Support Services - 313,389 284,899 256,409 227,919 199,429 170,939 142,449 113,960 85,470 56,980 28,490 - 144,641 system 144,641 Labor Related 16500123 Prepmts - WECC Dues 1,337,595 1,226,129 1,114,663 1,003,196 891,730 780,264 668,798 557,331 445,865 334,399 222,933 1,586,104 1,474,638 895,665 licensing 895,665 Labor Related 16500683 Prepaid - NICE Systems 28,528 14,264 - 192,720 175,200 157,680 140,160 122,640 105,120 87,600 70,080 52,560 35,040 90,892 System 90,892 Labor Related 16500593 Prepmts - Annual Bus Passes - - - - - - - - - - - - 54,801 4,215 labor 4,215 Labor Related 16500383 Prepmts - Microsoft Maintenance Contract 614,995 512,495 409,996 307,497 204,998 102,499 - 1,247,002 1,155,781 1,064,559 973,338 882,117 790,896 635,860 System 635,860 Labor Related 16500563 Prepmts - Licensing Fees (Vehicles) 164,423 161,413 146,739 132,065 117,391 102,717 88,044 73,370 58,696 44,022 29,348 14,674 180,531 101,033 licensing 101,033 Labor Related 16500633 Prepaid - CISCO Smartnet (Dimension Data) Main 137,071 68,536 - 753,891 738,421 669,886 601,350 619,549 551,013 342,678 274,142 205,607 137,071 392,247 system 392,247 Labor Related 16500643 Prepaid - INSSINC - Futrak Maintenance 201,729 195,616 189,503 183,390 177,277 171,164 165,051 158,938 152,825 146,712 140,599 134,486 128,373 165,051 systemLabor Related 16500923 Prepaid - Lacima Analytic SW Maintenance ST - - - - - - - - - - - - 41,863 3,220 systemLabor Related 16500933 Prepaid - Tax SW ST - - - - - - - - - - - - 40,523 3,117 systemLabor Related 16500153 Prepmnts - Datalink Symantec SW Maintenance - - - 131,135 120,207 109,280 98,352 87,424 76,496 65,568 54,640 43,712 32,784 63,046 systemLabor Related 16500251 Prepmts - Prometheus Software Maintenance - - - - - - - - - - - - 33,288 2,561 systemLabor Related 16500433 Prepaid- Ecologic Analytics Software - 267,971 269,077 242,169 215,262 188,354 161,446 134,539 107,631 80,723 53,815 26,908 - 134,453 systemLabor Related 16500443 Prepaid- OSIsoft Software Renewal - 314,353 285,775 257,198 228,620 200,043 171,465 142,888 114,310 85,733 57,155 28,577 - 145,086 systemLabor Related 16500453 Prepmts- Apptio Software Subscription - 150,563 136,875 123,188 109,500 95,813 82,125 68,438 54,750 41,063 27,375 13,688 - 69,490 systemLabor Related 16500691 Prepaid - OMS HW Maintenance Agreement 96,671 87,316 77,961 68,606 59,250 49,895 40,540 31,184 21,829 12,474 3,118 - - 42,219 systemLabor Related 16500693 Prepaid-GE Smallworld Software Support - 382,313 347,557 312,802 278,046 243,290 208,534 173,779 139,023 104,267 69,511 34,756 - 176,452 systemLabor Related 16500743 Prepaid-CGI Mobile Workforce SW Support 68,640 51,480 34,320 17,160 - 194,423 176,748 159,073 141,398 123,724 106,049 88,374 70,699 94,776 systemLabor Related 16500753 Prepaid - Oracle Software Support 217,665 174,132 130,599 87,066 43,533 548,938 503,194 457,449 411,704 365,959 320,214 274,469 228,724 289,511 systemLabor Related 16500763 Prepaid - Sycamore SW Support 74,455 63,819 53,182 42,546 31,909 21,273 10,636 - 117,001 106,365 130,409 115,919 101,429 66,842 systemLabor Related 16500773 Prepaid - Gartner Services- IT 338,191 300,614 263,037 225,460 187,884 150,307 112,730 75,153 37,577 - - 96,056 88,128 144,241 systemLabor Related 16500783 Prepayment-SAS SW Maintenance Renewal - - - - - - - - - 103,948 95,286 86,624 77,961 27,986 systemLabor Related 16500793 Prepmts - RSA Envision Renewal - - - - - - - - - 223,930 205,269 186,608 51,317 systemLabor Related 16500903 Prepaid - SAP - IT Services Long Term - 932,400 932,400 932,400 932,400 932,400 932,400 932,400 932,400 254,291 286,090 286,090 - 637,359 systemLabor Related 16500913 Prepaid - SAP Max Attn Short Term - - - - - - - - - - - - 111,650 8,588 systemLabor Related 16500703 Prepaid-Optimize Networks Steelhead Support 21,538 10,769 - 126,141 114,674 103,206 91,739 80,271 68,804 57,337 45,869 34,402 22,935 59,822 systemLabor Related 16500893 Prepaid - CheckPoint Structure LT - - - - - - 966,348 937,926 909,504 881,082 852,660 824,238 795,816 474,429 systemLabor Related 16501051 Prepmts - EMC - SW/HW Maintenance Renewal ST - - - - - - - - - - - 102,547 8,546 systemLabor Related 16501061 Prepmts - JD Power - Residential Survey - Short Te - - - - - - - - - - - 30,000 30,000 4,615 dataLabor Related 16501062 Prepmts - JD Power - Residential Survey - Short Te - - - - - - - - - - - 25,000 25,000 3,846 dataLabor Related 16501071 Prepmts - JD Power - Residential Survey - Long Ter - - - - - - - - - - - 55,000 55,000 8,462 dataLabor Related 16501072 Prepmts - JD Power - Residential Survey - Long Ter - - - - - - - - - - - 50,000 50,000 7,692 dataLabor Related 16501083 Prepmts - Linked In Advertising - Short Term - - - - - - - - - - - 14,548 1,212 labor
- Total Labor Related 8,746,755 10,151,882 7,950,936 10,306,228 7,077,940 7,671,769 7,378,163 10,268,798 9,357,803 5,363,982 5,013,042 5,486,833 8,837,788 7,974,846 3,542,413
Transmission Related:Transmission relat 16500071 Prepaid - Swinomish Tribal Res 115kv TSM-Long Te - - - - - - 153,563 152,252 151,544 150,731 149,917 149,103 148,290 148,290 148,290
- Total Transmission Related: - - - - - - 153,563 152,252 151,544 150,731 149,917 149,103 148,290 148,290 148,290
Excluded:Other (Excluded) 16500021 Prepmts - WIES - Blackout / Brownout 10,258 8,206 6,155 4,103 2,051 - - - - - - - - 2,367 Insurance 2,367 Other (Excluded) 16500113 Prepmts - Pollution Control Bond 40,465 20,233 - 111,279 101,163 91,046 80,930 70,814 60,698 50,581 40,465 30,349 20,233 55,250 Insurance 55,250 Other (Excluded) 16500573 Prepaid insurance - Liab - Navy Contract 17,312 14,427 11,542 8,656 5,771 2,885 - - - - - - - 4,661 Insurance 4,661 Other (Excluded) 16500582 Prepmts - Caminus GMS Prepaid Maintenance (gas) 33,578 27,982 22,385 16,789 11,193 5,596 - 62,975 57,250 51,525 45,800 40,075 34,350 31,500 System 31,500 Other (Excluded) 16500611 Prepaid Edison Electric Institute dues - 542,613 493,284 443,956 394,627 345,299 295,970 246,642 197,314 147,985 98,657 49,328 - 250,437 Membership 250,437 Other (Excluded) 16500612 Prepaid American Gas Association Dues - 378,315 353,342 318,007 282,673 247,339 212,005 176,671 141,337 106,002 70,668 35,334 - 178,592 Membership 178,592 Other (Excluded) 16500622 Prepaid NW Gas Association Dues - 66,757 60,688 54,620 48,551 42,482 36,413 30,344 24,275 18,207 12,138 6,069 - 30,811 Membership 30,811 Other (Excluded) 16500623 Prepaid - Market Data Subscriptions - ERC 8,960 4,307 - 71,104 64,640 63,702 56,624 49,546 42,468 35,390 28,312 21,234 14,156 35,419 Data 35,419 Other (Excluded) 16500631 Prepaid - NW Energy Coalition Membership 20,641 17,201 13,761 10,321 6,880 3,440 - - - - - - - 5,557 Membership 5,557 Other (Excluded) 16500103 Prepmts - Marsh USA - 38,333 19,167 57,500 38,333 19,167 57,500 38,333 19,167 - 41,393 19,167 - 26,774 26,774 Other (Excluded) 16500401 Prepmts - FERC Annual Land Use - Lower Baker - - - - 53,800 43,040 32,280 21,520 10,760 - - - - 12,415 plant 12,415 Other (Excluded) 16500411 Prepmts - FERC Annual Land Use - Upper Baker - - - - 53,800 43,040 32,280 21,520 10,760 - - - - 12,415 plant 12,415 Other (Excluded) 16500553 Prepaid- Miscellaneous 234,842 64,525 49,795 35,066 20,336 5,606 168,907 155,262 140,318 125,373 110,429 97,023 80,541 99,079 99,079 Other (Excluded) 16500591 Prepaid - Goldendale Capital Maintenance Major 47,278 47,278 142,612 142,612 142,612 142,612 142,612 142,612 169,328 169,328 169,328 254,865 254,865 151,380 plant 151,380 Other (Excluded) 16500601 Prepaid - Goldendale Expense Maintenance Major 202,260 202,260 608,176 608,176 608,176 608,176 608,176 608,176 722,192 722,192 722,192 1,087,604 1,087,604 645,797 plant 645,797 Other (Excluded) 16500651 Prepaid - Freddy 1 Capital FFH 405,209 417,806 420,702 435,327 436,641 436,652 436,652 436,662 436,662 446,513 472,011 496,497 496,497 444,141 plant 444,141 Other (Excluded) 16500661 Prepaid - Freddy 1 Expense FFH 876,643 903,896 910,162 941,801 944,644 944,667 944,667 944,690 944,690 966,001 1,021,166 1,074,139 1,074,139 960,870 plant 960,870 Other (Excluded) 16500671 Prepaid - Freddy 1 Inventory 393,519 405,753 408,566 422,768 424,044 424,055 424,055 424,065 424,065 433,631 1,621,071 1,644,850 1,644,850 699,638 plant 699,638 Other (Excluded) 16500681 Prepaid Goldendale Inventory 10,894 10,894 32,493 32,493 32,493 32,493 32,493 32,493 38,594 38,594 38,594 57,754 57,754 34,464 plant 34,464 Other (Excluded) 16500731 Prepaid - Mint Farm Capital FFH 810,587 810,587 810,587 1,048,863 1,048,863 1,048,863 1,113,705 1,113,705 1,113,705 1,316,979 1,316,979 1,316,979 1,545,558 1,108,920 plant 1,108,920 Other (Excluded) 16500741 Prepaid - Mint Farm Expense FFH 908,840 908,840 908,840 1,175,998 1,175,998 1,175,998 1,248,699 1,248,699 1,248,699 1,476,613 1,476,613 1,476,613 1,732,899 1,243,334 plant 1,243,334 Other (Excluded) 16500841 Prepaid - Sumas Capital FFH Long-Term 60,371 60,371 60,371 60,371 60,371 60,371 60,371 60,371 60,371 60,371 60,371 60,371 60,371 60,371 plant 60,371 Other (Excluded) 16500851 Prepaid - Sumas Expense FFH Long-Term 446,232 446,232 446,232 446,232 446,232 446,232 446,232 446,232 446,232 446,232 446,232 446,232 - 411,907 plant 411,907 Other (Excluded) 16500881 Prepmts - Colstrip 3&4 Lime Contract - Short-Term 750,000 750,000 750,000 750,000 750,000 750,000 750,000 750,000 750,000 750,000 750,000 750,000 750,000 750,000 plant 750,000 Other (Excluded) 16501003 Prepmts - Advance/Down Payments 41,081 43,371 49,249 40,220 44,169 39,505 42,090 42,158 45,906 56,742 54,499 50,360 41,100 45,419 plant 45,419 Other (Excluded) 16501013 Prepaid - Future Year Expenses 199,131 - - - - - - - - - - 58,143 143,930 30,862 plant 30,862 Other (Excluded) 16501031 Prepaid - Wild Horse DVAR Sys Maintenance 66,172 64,037 61,903 59,768 57,634 55,499 53,365 51,230 49,095 46,961 44,826 42,692 40,557 53,365 plant 53,365 Other (Excluded) 16501041 Prepaid - Ellensburg REC - Green Power 17,684 17,684 17,684 17,684 16,961 16,961 16,961 16,961 16,961 16,961 16,317 16,317 16,317 17,035 Green Power 17,035 Other (Excluded) 16599011 Prepaid Colstrip 1&2 WECo Coal Resv Dedication P 4,444,444 4,398,148 4,351,852 4,305,556 4,259,259 - - - - - - - - 1,673,789 plant 1,673,789 Other (Excluded) 16500901 Prepaid - LSR Leaseholder Minimum Rent - - 8,682 856,302 667,625 459,824 347,596 259,199 163,155 191,924 329,008 283,322 201,784 289,879 plant 289,879 Other (Excluded) 16500911 Prepaid - ROW Dist Crossing Rainbow Bridge LT - - - - - - - - - - - - 275,644 21,203 plant 21,203 Other (Excluded) 16500163 Prepmts -Fiduciary Liability Insurance - - - - - 54,113 49,194 44,274 39,355 34,436 29,516 24,597 19,677 22,705 22,705 Other (Excluded) 16500943 Prepaid - Ferndale Property Insurance - - - - - - - - - - - 51,076 38,306 6,876 plant 6,876
- Total Excluded 10,046,402 10,670,056 11,018,230 12,475,571 12,199,541 7,608,664 7,689,777 7,495,155 7,373,357 7,708,542 9,016,586 9,490,990 9,631,133 9,417,231 9,417,231
Total Prepayments 19,790,691 24,310,369 21,900,610 25,316,272 24,952,176 20,414,806 19,741,955 21,843,758 20,205,842 15,949,397 16,308,692 16,659,077 19,676,320

Worksheet 3 - Generator Interconnection Facilities - Transmission Plant
Line No. Facility Name Net Plant 12/31/20121 E35099 (GIF) Easement, Colstrip 1-2 4,000.00 3,000.00 1,000.00 2 E3539 (GIF) Sta Eq, Colstrip 1-2 1,231,000.00 1,042,000.00 189,000.00 3 E3539 (GIF) Sta Eq, Colstrip 3-4 3,515,000.00 2,392,000.00 1,123,000.00 4 E3549 (GIF) Twr/Fixt, Colstrip 1-2 89,000.00 74,000.00 15,000.00 5 E3549 (GIF) Twr/Fixt, Colstrip 3-4 - - - 6 E3559 (GIF) Poles, Colstrip 1-2 49,000.00 53,000.00 (4,000.00)7 E3559 (GIF) Poles, Colstrip 3-4 89,000.00 41,000.00 48,000.00 8 E3569 (GIF) O/H Cond, Colstrip 1-2 254,000.00 151,000.00 103,000.00 9 E3569 (GIF) O/H Cond, Colstrip 3-4 269,000.00 164,000.00 105,000.00 10 Generation Interconnection Facilities - Colstrip - Transmission $5,500,000.00 $3,920,000.00 $1,580,000.001112 E3509 (GIF) Land, Wild Horse 2,000.00 - 2,000.00 13 E35099 (GIF) Easement, Hopkins 29,000.00 5,000.00 24,000.00 14 E35099 (GIF) Easement, Poison Sprin 132,000.00 18,000.00 114,000.00 15 E35099 (GIF) Easement, Upper Baker 1,000.00 1,000.00 - 16 E35099 (GIF) Easement, Wild Horse 7,000.00 - 7,000.00 17 E3529 (GIF) Struc/Improv, Fredonia 40,000.00 24,000.00 16,000.00 18 E3529 (GIF) Struc/Improv, Mint Farm 153,000.00 14,000.00 139,000.00 19 E3529 (GIF) Struc/Improv, Whitehorn 79,000.00 56,000.00 23,000.00 20 E3538 (LIF) Sta Eq, Sub-Txe 323,000.00 132,000.00 191,000.00 21 E3539 (GIF) Sta Eq, Arco Central 144,000.00 68,000.00 76,000.00 22 E3539 (GIF) Sta Eq, Baker River Sw 134,000.00 63,000.00 71,000.00 23 E3539 (GIF) Sta Eq, Electron 322,000.00 177,000.00 145,000.00 24 E3539 (GIF) Sta Eq, Electron Height 112,000.00 63,000.00 49,000.00 25 E3539 (GIF) Sta Eq, Encogen 5,413,000.00 4,117,000.00 1,296,000.00 26 E3539 (GIF) Sta Eq, Fred 1/Epcor 5,035,000.00 885,000.00 4,150,000.00 27 E3539 (GIF) Sta Eq, Frederickson 1,074,000.00 653,000.00 421,000.00 28 E3539 (GIF) Sta Eq, Fredonia 1&2 3,537,000.00 1,028,000.00 2,509,000.00 29 E3539 (GIF) Sta Eq, Fredonia 3&4 1,734,000.00 394,000.00 1,340,000.00 30 E3539 (GIF) Sta Eq, Goldendale 411,000.00 45,000.00 366,000.00 31 E3539 (GIF) Sta Eq, Hopkins Ridge 8,264,000.00 1,035,000.00 7,229,000.00 32 E3539 (GIF) Sta Eq, HPK sub@plant 9,150,000.00 1,470,000.00 7,680,000.00 33 E3539 (GIF) Sta Eq, Lower Baker 2,236,000.00 274,000.00 1,962,000.00 34 E3539 (GIF) Sta Eq, Mint Farm 1,783,000.00 158,000.00 1,625,000.00 35 E3539 (GIF) Sta Eq, Nooksack 18,000.00 6,000.00 12,000.00 36 E3539 (GIF) Sta Eq, Poison Spring 180,000.00 10,000.00 170,000.00 37 E3539 (GIF) Sta Eq, Shannon 127,000.00 17,000.00 110,000.00 38 E3539 (GIF) Sta Eq, Snoqualmie 2 377,000.00 91,000.00 286,000.00 39 E3539 (GIF) Sta Eq, Snoqualmie Sw 277,000.00 145,000.00 132,000.00 40 E3539 (GIF) Sta Eq, Stillwater 26,000.00 9,000.00 17,000.00 41 E3539 (GIF) Sta Eq, Sumas OP-SMC 3,525,000.00 2,907,000.00 618,000.00 42 E3539 (GIF) Sta Eq, Terrell 137,000.00 53,000.00 84,000.00 43 E3539 (GIF) Sta Eq, Texaco West 13,000.00 6,000.00 7,000.00 44 E3539 (GIF) Sta Eq, Upper Baker 2,706,000.00 281,000.00 2,425,000.00 45 E3539 (GIF) Sta Eq, WHDE sub@plant 2,879,000.00 138,000.00 2,741,000.00 46 E3539 (GIF) Sta Eq, Whitehorn 2,128,000.00 1,318,000.00 810,000.00 47 E3539 (GIF) Sta Eq, Wild H sub@plt 10,815,000.00 1,487,000.00 9,328,000.00 48 E3539 (GIF) Sta Eq, Wild Horse 9,688,000.00 1,206,000.00 8,482,000.00 49 E3539 (GIF) Sta Eq, Wild Horse Exp 8,292,000.00 377,000.00 7,915,000.00 50 E3539 (GIF) Sta Eq, Wind Ridge 152,000.00 20,000.00 132,000.00 51 E3539 (GIF) Sta Eq, WindRid NonProj 159,000.00 19,000.00 140,000.00 52 E3559 (GIF) Poles, Electron 31,000.00 16,000.00 15,000.00 53 E3559 (GIF) Poles, Hopkins Ridge 1,549,000.00 257,000.00 1,292,000.00 54 E3559 (GIF) Poles, Lower Baker 16,000.00 15,000.00 1,000.00 55 E3559 (GIF) Poles, Poison Spring 968,000.00 123,000.00 845,000.00 56 E3559 (GIF) Poles, Scl-Tolt 19,000.00 6,000.00 13,000.00 57 E3559 (GIF) Poles, Snoqualmie 1 - - - 58 E3559 (GIF) Poles, Snoqualmie 2 137,000.00 63,000.00 74,000.00 59 E3559 (GIF) Poles, Sumas 63,000.00 53,000.00 10,000.00 60 E3559 (GIF) Poles, Upper Baker 152,000.00 104,000.00 48,000.00 61 E3559 (GIF) Poles, Wild Horse 1,156,000.00 168,000.00 988,000.00 62 E3569 (GIF) O/H Cond, Electron 38,000.00 25,000.00 13,000.00 63 E3569 (GIF) O/H Cond, Hopkins 1,665,000.00 361,000.00 1,304,000.00 64 E3569 (GIF) O/H Cond, Lower Baker 14,000.00 15,000.00 (1,000.00)65 E3569 (GIF) O/H Cond, Poison Spring 253,000.00 35,000.00 218,000.00 66 E3569 (GIF) O/H Cond, Scl-Tolt 9,000.00 4,000.00 5,000.00 67 E3569 (GIF) O/H Cond, Snoqualmie 1 3,000.00 3,000.00 - 68 E3569 (GIF) O/H Cond, Snoqualmie 2 60,000.00 50,000.00 10,000.00 69 E3569 (GIF) O/H Cond, Sumas 63,000.00 52,000.00 11,000.00 70 E3569 (GIF) O/H Cond, Upper Baker 59,000.00 40,000.00 19,000.00 71 E3569 (GIF) O/H Cond, Wild Horse 379,000.00 51,000.00 328,000.00 72 E3589 (GIF) U/G Cond, Fred 1/Epcor 3,475,000.00 784,000.00 2,691,000.00 73 E35999 (GIF) Rd/Trail, Upper Baker 8,000.00 2,000.00 6,000.00 7475 Generation Interconnection Facilities - Other than Colstrip $91,731,000.00 $20,997,000.00 $70,734,000.007677 Total Generation Interconnection Facilities as of 12/31/2010 $97,231,000.00 $24,917,000.00 $72,314,000.00
Original Cost 12/31/2012
Accumulated Depreciation 12/31/2012

Worksheet 4 - Monthly Transmission System Peak Worksheet
Puget Sound Energy, Inc. FERC Form 1, Page 400NAME OF SYSTEM: WA Area Facilities
Line No. Month (a)
1 January 5,487 7 800 4,112 347 992 36 4,026 - 2 February 5,108 22 800 3,790 293 992 33 560 - 3 March 5,011 9 800 3,698 291 992 30 285 - 4 Total for Quarter 15,606 11,600 931 2,976 99 4,871 - 5 April 4,468 2 1100 3,175 267 992 33 195 - 6 May 4,137 5 800 2,844 268 992 32 449 - 7 June 4,214 16 1000 2,579 315 992 328 420 - 8 Total for Quarter 12,819 8,599 850 2,976 393 1,064 - 9 July 4,312 8 1800 2,678 315 992 327 618 -
10 August 4,677 16 1700 3,020 337 992 328 714 - 11 September 4,320 27 2000 2,686 317 992 326 729 - 12 Total for Quarter 13,309 8,384 969 2,976 981 2,061 - 13 October 4,630 26 1900 3,278 329 992 31 674 - 14 November 4,992 24 1800 3,615 350 992 35 357 - 15 December 5,312 31 1800 3,934 351 992 36 4,474 - 16 Total for Quarter 14,934 10,827 1,030 2,976 101 5,505 - 17 Total for Year 56,668 39,410 3,780 11,904 1,575 13,501 -
Average of the 12 CP 4,722,336
Total Transmission Load 56,668
Load paying the Formula Rate 17,259
NAME OF SYSTEM: Southern Intertie
Line No. Month
1 January 400 - - 100 300 100 - 2 February 400 - - 100 300 75 - 3 March 100 - - 100 - 300 - 4 Total for Quarter 900 - - 300 600 475 - 5 April 100 - - 100 - 300 - 6 May 100 - - 100 - 300 - 7 June 400 - - 100 300 - - 8 Total for Quarter 600 - - 300 300 600 - 9 July 400 - - 100 300 - -
10 August 400 - - 100 300 - - 11 September 400 - - 100 300 - - 12 Total for Quarter 1,200 - - 300 900 - - 13 October 100 - - 100 - 184 - 14 November 400 - - 100 300 142 - 15 December 400 - - 100 300 346 - 16 Total for Quarter 900 - - 300 600 672 - 17 Total for Year 3,600 - - 1,200 2,400 1,747 -
Average of the 12 CP 300,000
NAME OF SYSTEM: Colstrip
Line No. Month
1 January 663 - 0 - - 663 - - - 2 February 663 - 0 - - 663 - - - 3 March 663 - 0 - - 663 - - - 4 Total for Quarter 1,989 - - 1,989 - - - 5 April 663 - 0 - - 663 - - - 6 May 663 - 0 - - 663 - - - 7 June 663 - 0 - - 663 - - - 8 Total for Quarter 1,989 - - 1,989 - - - 9 July 663 - 0 - - 663 - - -
10 August 663 - 0 - - 663 - - - 11 September 663 - 0 - - 663 - - - 12 Total for Quarter 1,989 - - 1,989 - - - 13 October 663 - 0 - - 663 - - - 14 November 663 - 0 - - 663 - - - 15 December 663 - 0 - - 663 - - - 16 Total for Quarter 1,989 - - 1,989 - - - 17 Total for Year 7,956 - - 7,956 - - -
Average of the 12 CP 663,000
Monthly Peak MW - Total (b)
Day of Monthly
Peak (c )
Hour of Monthly Peak
(d)
Firm Network Service for
Self (e)
Firm Network
Service for Others (f)
Long-Term Firm Point-to-point
Reservations (g)
Other Long Term Firm
Service (h)
Short-Term Firm Point-to-Point
Reservation (i)
Other Service (j)
Sum of Total for Year of: (f) Firm Network Service for Others + (g) Long-Term Firm Point-to-Point Reservations + (h) Other Long-Term Firm Service
Monthly Peak MW - Total
Day of Monthly
Peak
Hour of Monthly
Peak
Firm Network Service for
Self
Firm Network
Service for Others
Long-Term Firm Point-to-point Reservations
Other Long Term Firm
Service
Short-Term Firm Point-to-Point Reservation
Other Service
Monthly Peak MW - Total
Day of Monthly
Peak
Hour of Monthly
Peak
Firm Network Service for
Self
Firm Network
Service for Others
Long-Term Firm Point-to-point Reservations
Other Long Term Firm
Service
Short-Term Firm Point-to-Point Reservation
Other Service

Worksheet 5 - Transmission Plant Average Balances
WA Area Transmission Plant in ServiceMonths in Thousands Dec-11 Jan-12 Feb-12 Mar-12 Apr-12 May-12 Jun-12 Jul-12 Aug-12 Sep-12 Oct-12 Nov-12 Dec-12 AverageE3500 TSM Land & Land Rights 890 890 890 890 890 890 890 890 890 890 890 890 890 890,049 E3500 TSM Land, Baker 0 0 0 0 0 0 0 0 0 0 0 0 0 0 E3500 TSM Land, N Intertie 31 31 31 31 31 31 31 31 31 31 31 31 31 30,604 E3500 TSM Land, Wild Horse 0 0 0 0 0 0 0 0 0 0 0 0 0 0 E3500 TSM Land, Wind Ridge 52 52 52 52 52 52 52 52 52 52 52 52 52 52,087 E3501 TSM Easement 3,877 3,877 3,877 3,877 3,877 3,877 3,877 3,877 3,877 3,877 3,877 3,877 3,877 3,877,443 E3501 TSM Easement, Baker Common 0 0 0 0 0 0 0 0 0 0 0 0 0 0 E3501 TSM Easement, Upper Baker 0 0 0 0 0 0 0 0 0 0 0 0 0 0 E3501 TSM Easement, Wild Horse-NonP 0 0 0 0 0 0 0 0 0 0 0 0 0 0 E3501 TSM Easement, Wild Horse-Proj 0 0 0 0 0 0 0 0 0 0 0 0 0 0 E35016 TSM Easements 0 0 0 0 0 0 0 12 12 12 12 12 12 5,357 E35017 DONOTUSE, Alpac 281 281 281 281 281 281 281 281 281 281 281 281 280,945 E35017 TSM Easements 20,509 20,509 20,509 20,509 20,509 20,509 20,509 20,509 20,509 20,509 20,509 20,509 20,509,193 E35017 TSM Easements, Baker Com 70 70 70 70 70 70 70 70 70 70 70 70 69,900 E35017 TSM Easements, Upper Baker 57 57 57 57 57 57 57 57 57 57 57 57 56,577 E3506 TSM Land & Land Rights 0 0 0 0 0 0 0 802 802 802 802 802 802 367,508 E3507 TSM Land & Land Rights 18,733 18,733 18,733 18,733 18,733 18,733 18,733 18,733 18,733 18,733 18,733 18,733 18,733,296 E352 TSM Str/Impv, Baker Common 0 0 0 0 0 0 0 0 0 0 0 0 0 0 E352 TSM Str/Impv, Mint Farm 0 0 0 0 0 0 0 0 0 0 0 0 0 0 E352 TSM Str/Impv, Mint Farm OP 0 0 0 0 0 0 0 0 0 0 0 0 0 0 E352 TSM Structures & Improvement 778 778 778 778 778 778 778 778 778 773 773 773 773 776,511 E3526 TSM Structures & Improvement 0 0 0 0 0 0 0 0 0 0 0 0 0 0 E3527 DONOTUSE Sub Arco North 14 14 14 14 14 14 14 14 14 14 14 14 14,175 E3527 DONOTUSE Sub Arco South 14 14 14 14 14 14 14 14 14 14 14 14 14,175 E3527 DONOTUSE Sub Texaco West 41 41 41 41 41 41 41 41 41 41 41 41 40,848 E3527 TSM Str/Impv, Baker Common 0 0 0 0 0 0 0 0 0 0 0 0 0 0 E3527 TSM Structures & Improvement 2,309 2,309 2,309 2,309 2,309 2,309 2,309 2,309 2,309 2,309 2,298 2,298 2,307,787 E353 HOPKINS SUB@PLANT 0 0 0 0 0 0 0 0 0 0 0 0 0 0 E353 TSM Sta Eq LSR 0 0 0 0 0 0 0 0 0 0 0 0 0 0 E353 TSM Sta Eq, Baker Common 0 0 0 0 0 0 0 0 0 0 0 0 0 0 E353 TSM Sta Eq, Cov-Ber NOT USED 0 0 0 0 0 0 0 0 0 0 0 0 0 0 E353 TSM Sta Eq, Fred 1/Epcor 0 0 0 0 0 0 0 0 0 0 0 0 0 0 E353 TSM Sta Eq, Fredonia 1&2 OP 0 0 0 0 0 0 0 0 0 0 0 0 0 0 E353 TSM Sta Eq, Lower Baker 0 0 0 0 0 0 0 0 0 0 0 0 0 0 E353 TSM Sta Eq, Mint Farm 0 0 0 0 0 0 0 0 0 0 0 0 0 0 E353 TSM Sta Eq, Mint Farm OP 0 0 0 0 0 0 0 0 0 0 0 0 0 0 E353 TSM Sta Eq, Snoqualmie 1 0 0 0 0 0 0 0 0 0 0 0 0 0 0 E353 TSM Sta Eq, Snoqualmie 2 0 0 0 0 0 0 0 0 0 0 0 0 0 0 E353 TSM Sta Eq, Upper Baker 0 0 0 0 0 0 0 0 0 0 0 0 0 0 E353 TSM Sta Eq, Wild Horse 0 0 0 0 0 0 0 0 0 0 0 0 0 0 E353 TSM Sta Eq, Wild Horse-WindRid 3,603 3,603 3,451 3,451 3,451 3,451 3,451 3,451 3,451 3,451 3,451 3,451 3,451 3,470,164 E353 TSM Sta Eq, Wind Ridge-NonProj 4,452 4,452 4,293 4,293 4,293 4,293 4,293 4,293 4,293 4,293 4,293 4,293 4,293 4,312,566 E353 TSM Station Equipment 67,289 67,892 67,676 68,070 68,248 69,069 81,227 81,875 83,034 93,013 93,615 108,158 109,405 80,852,151 E353 WILD HORSE EXP SUB 0 0 0 0 0 0 0 0 0 0 0 0 0 0 E353 WILD HORSE EXP SUB@PLANT 0 0 0 0 0 0 0 0 0 0 0 0 0 0 E353 WILD HORSE SUB@PLANT 0 0 0 0 0 0 0 0 0 0 0 0 0 0 E3536 TSM Sta Eq, Baker Common 0 0 0 0 0 0 0 0 0 0 0 0 0 0 E3536 TSM Sta Eq, Encogen 0 0 0 0 0 0 0 0 0 0 0 0 0 0 E3536 TSM Sta Eq, Fredonia3&4 OP 0 0 0 0 0 0 0 0 0 0 0 0 0 0 E3536 TSM Sta Eq, Goldendale 0 0 0 0 0 0 0 0 0 0 0 0 0 0 E3536 TSM Sta Eq, Hopkins Ridge 0 0 0 0 0 0 0 0 0 0 0 0 0 0 E3536 TSM Sta Eq, Hopkins Ridge Exp 0 0 0 0 0 0 0 0 0 0 0 0 0 0 E3536 TSM Sta Eq, Lower Baker 0 0 0 0 0 0 0 0 0 0 0 0 0 0 E3536 TSM Sta Eq, Mint Farm 0 0 0 0 0 0 0 0 0 0 0 0 0 0 E3536 TSM Sta Eq, Snoqualmie 1 0 0 0 0 0 0 0 0 0 0 0 0 0 0 E3536 TSM Sta Eq, Snoqualmie 2 0 0 0 0 0 0 0 0 0 0 0 0 0 0 E3536 TSM Sta Eq, Sumas SMC 0 0 0 0 0 0 0 0 0 0 0 0 0 0 E3536 TSM Sta Eq, Sumas SMS 0 0 0 0 0 0 0 0 0 0 0 0 0 0 E3536 TSM Sta Eq, Upper Baker 0 0 0 0 0 0 0 0 0 0 0 0 0 0 E3536 TSM Sta Eq, Wild Horse Solar 0 0 0 0 0 0 0 0 0 0 0 0 0 0 E3536 TSM Substation Equipment 0 0 0 0 0 0 0 0 0 0 0 0 0 0 E3537 DONOTUSE Sub, Fairchild 0 0 0 0 0 0 0 0 0 0 0 0 0 E3537 DONOTUSE Sub, Texaco E 536 536 536 536 536 536 536 536 536 536 536 536 549,920 E3537 DONOTUSE, Cov-Ber 0 0 0 0 0 0 0 0 0 0 0 0 0 E3537 DONOTUSE, Sub, Alpac 128 128 128 128 128 128 128 128 128 128 128 128 127,703 E3537 DONOTUSE, Sub, Arco C 1,049 1,049 1,049 1,049 1,049 1,049 1,049 1,049 1,049 1,049 1,049 1,049 1,049,310 E3537 DONOTUSE, Sub, Arco N 552 552 552 552 552 552 552 552 552 552 552 552 552,384 E3537 DONOTUSE, Sub, Arco S 755 755 755 755 755 755 755 755 755 755 755 755 754,836 E3537 DONOTUSE, Sub, BoeingRen 506 506 506 506 506 506 506 506 506 506 506 506 506,453 E3537 DONOTUSE, Sub, Capitol 164 164 164 164 164 164 164 164 164 164 164 125 162,465 E3537 DONOTUSE, Sub, Clover V 91 91 91 91 91 91 91 91 91 91 91 91 90,883 E3537 DONOTUSE, Sub, LiquidAir 123 123 123 123 123 123 123 123 123 123 123 123 123,338 E3537 DONOTUSE, Sub, MillerBay 139 139 139 139 139 139 139 139 139 139 139 139 139,256 E3537 DONOTUSE, Sub, Olym Avon 77 77 77 77 77 77 77 77 77 77 77 77 77,343
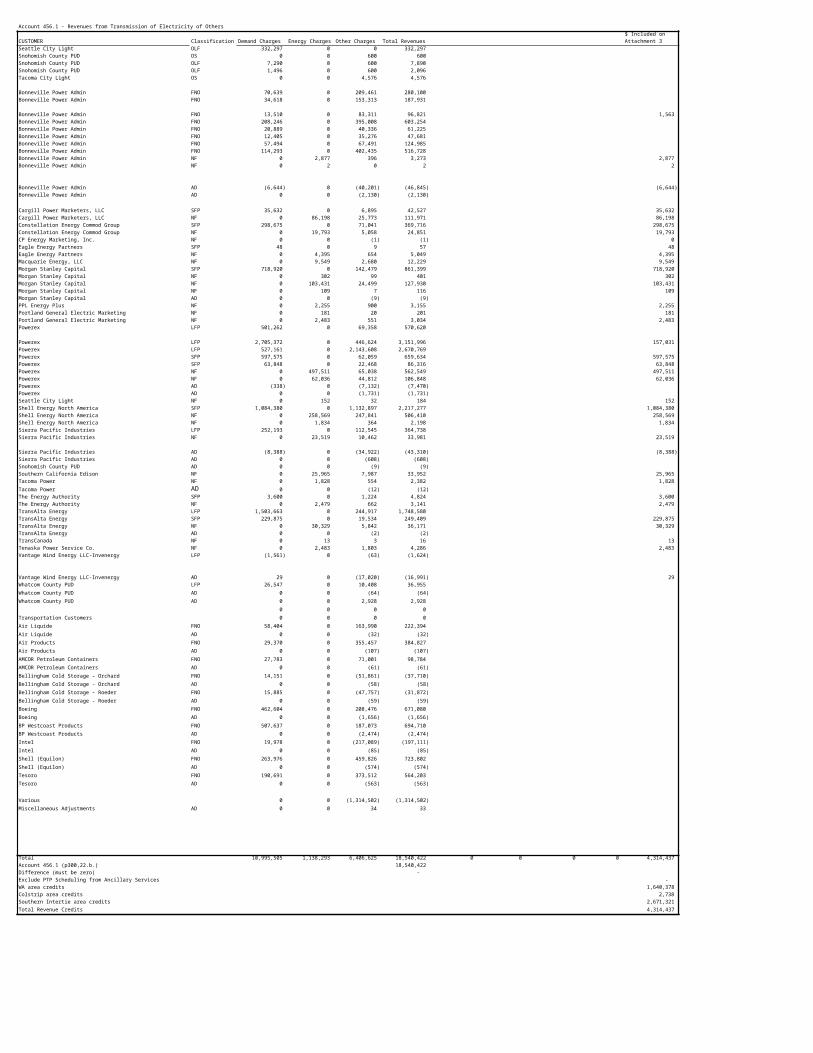
E3537 DONOTUSE, Sub, Olym Rntn 65 65 65 65 65 65 65 65 65 65 65 65 64,569 E3537 DONOTUSE, Sub, Paccar 150 150 150 150 150 150 150 150 150 150 150 150 150,160 E3537 DONOTUSE, Sub, Texaco W 452 453 453 453 453 453 453 453 453 453 453 453 453,046 E3537 DONOTUSE, Sub, Vitulli 1,376 1,376 1,376 1,376 1,376 1,376 1,376 1,376 1,376 553 553 546 1,204,061 E3537 DONOTUSE, Sub, Waterfront 0 0 0 0 0 0 0 0 0 0 0 0 0 E3537 TSM Poles, Sumas OP 0 0 0 0 0 0 0 0 0 0 0 0 0 E3537 TSM Sta Eq, Baker Common 0 0 0 0 0 0 0 0 0 0 0 0 0 E3537 TSM Sta Eq, Encogen 0 0 0 0 0 0 0 0 0 0 0 0 0 E3537 TSM Sta Eq, Fredonia3&4 OP 4,009 4,628 4,628 4,275 4,275 4,275 4,275 4,275 4,275 4,275 4,275 4,275 4,300,904 E3537 TSM Sta Eq, Goldendale 0 0 0 0 0 0 0 0 0 0 0 0 0 E3537 TSM Sta Eq, Goldendale OP 0 0 0 0 0 0 0 0 0 0 0 0 0 E3537 TSM Sta Eq, Hopkins Ridge 0 0 0 0 0 0 0 0 0 0 0 0 0 E3537 TSM Sta Eq, Hopkins Ridge Exp 795 795 795 795 795 795 795 795 795 795 795 795 795 795,330 E3537 TSM Sta Eq, Lower Baker 0 0 0 0 0 0 0 0 0 0 0 0 0 E3537 TSM Sta Eq, Mint Farm 0 0 0 0 0 0 0 0 0 0 0 0 0 E3537 TSM Sta Eq, Mint Farm OP 0 0 0 0 0 0 0 0 0 0 0 0 0 E3537 TSM Sta Eq, Snoqualmie 1 0 0 0 0 0 0 0 0 0 0 0 0 0 E3537 TSM Sta Eq, Snoqualmie 2 0 0 0 0 0 0 0 0 0 0 0 0 0 E3537 TSM Sta Eq, Sumas SMC 0 0 0 0 0 0 0 0 0 0 0 0 0 E3537 TSM Sta Eq, Sumas SMS 0 0 0 0 0 0 0 0 0 0 0 0 0 E3537 TSM Sta Eq, Upper Baker 0 0 0 0 0 0 0 0 0 0 0 0 0 E3537 TSM Sta Eq, Wild Horse Solar 0 0 0 0 0 0 0 0 0 0 0 0 0 E3537 TSM Sub Eq, Sumas OP-SMC 0 0 0 0 0 0 0 0 0 0 0 0 0 E3537 TSM Sub Eq, Sumas OP-SMS 1 1 1 1 1 1 1 1 1 1 1 1 820 E3537 TSM Substation Equipment 201,601 202,869 202,657 202,833 203,554 203,555 202,973 199,691 199,675 199,467 199,273 199,091 201,443,934 E354 TSM Poles, Mint Farm 0 0 0 0 0 0 0 0 0 0 0 0 0 0 E354 TSM Poles, Mint Farm OP 0 0 0 0 0 0 0 0 0 0 0 0 0 0 E354 TSM Towers & Fixtures 26,963 26,963 26,963 26,963 26,963 26,963 26,963 26,963 26,963 26,963 26,963 26,963 26,963 26,962,869 E354 TSM Twr/Fixt, Mint Farm 0 0 0 0 0 0 0 0 0 0 0 0 0 0 E354 TSM Twr/Fixt, Mint Farm OP 0 0 0 0 0 0 0 0 0 0 0 0 0 0 E354 TSM Twr/Fixt, N Intertie 5,744 5,744 5,744 5,744 5,744 5,744 5,744 5,744 5,744 5,744 5,744 5,744 5,744 5,744,097 E354 TSM Twr/Fixt, Wild Horse-WindR 0 0 0 0 0 0 0 0 0 0 0 0 0 0 E354 TSM Twr/Fixt, Wind Ridge-NonPr 0 0 0 0 0 0 0 0 0 0 0 0 0 0 E3546 TSM Towers/Fixtures 0 0 0 0 0 0 0 0 0 0 0 0 0 0 E3547 TSM Towers, Hopkins Ridge 0 0 0 0 0 0 0 0 0 0 0 0 0 0 E3547 TSM Towers/Fixtures 1,528 1,528 1,528 1,528 1,520 1,520 1,520 1,520 1,520 1,520 1,520 1,520 1,523,218 E355 TSM Poles & Fixtures 57,704 58,138 58,144 57,873 57,563 57,581 57,582 57,571 57,574 57,579 57,582 57,592 63,797 57,960,930 E355 TSM Poles, Baker Common 0 0 0 0 0 0 0 0 0 0 0 0 10,695 445,624 E355 TSM Poles, Cov-Ber NOT USED 0 0 0 0 0 0 0 0 0 0 0 0 0 0 E355 TSM Poles, Lower Baker 0 0 0 0 0 0 0 0 0 0 0 0 0 0 E355 TSM Poles, N Intertie 3,517 3,517 3,517 3,517 3,517 3,517 3,517 3,517 3,517 3,517 3,517 3,517 3,517 3,516,565 E355 TSM Poles, Snoqualmie 1 0 0 0 0 0 0 0 0 0 0 0 0 0 0 E355 TSM Poles, Snoqualmie 2 0 0 0 0 0 0 0 0 0 0 0 0 0 0 E355 TSM Poles, Upper Baker 0 0 0 0 0 0 0 0 0 0 0 0 0 0 E355 TSM Poles, Wild Horse 0 0 0 0 0 0 0 0 0 0 0 0 0 0 E355 TSM Poles, Wild Horse-WindRidg 861 861 861 861 861 861 861 861 861 861 861 861 861 861,087 E355 TSM Poles, Wind Ridge-NonProje 5,072 5,072 5,072 5,072 5,072 5,072 5,072 5,072 5,072 5,072 5,072 5,072 5,072 5,072,337 E3556 TSM Poles 0 540 810 958 3,006 3,333 3,900 4,189 4,365 4,235 4,309 4,376 6,051 3,087,148 E3557 TSM Poles 173,465 173,469 173,040 173,026 171,674 171,678 171,089 171,130 171,126 171,089 171,047 171,426 171,997,836 E3557 TSM Poles, Baker Common 7,381 7,381 7,382 7,382 7,379 7,383 7,383 7,383 7,383 7,383 7,383 7,383 7,382,379 E3557 TSM Poles, Cov-Ber DONOTUSE 0 0 0 0 0 0 0 0 0 0 0 0 0 E3557 TSM Poles, Hopkins Ridge 0 0 0 0 0 0 0 0 0 0 0 0 0 E3557 TSM Poles, Lower Baker 0 0 0 0 0 0 0 0 0 0 0 0 0 E3557 TSM Poles, Snoqualmie 2 0 0 0 0 0 0 0 0 0 0 0 0 0 E3557 TSM Poles, Sumas 0 0 0 0 0 0 0 0 0 0 0 0 0 E3557 TSM Poles, Upper Baker 214 214 214 214 214 214 214 214 214 214 214 214 214,027 E356 TSM O/H Cond, Baker Common 0 0 0 0 0 0 0 0 0 0 0 0 0 0 E356 TSM O/H Cond, Lower Baker 0 0 0 0 0 0 0 0 0 0 0 0 0 0 E356 TSM O/H Cond, Mint Farm 0 0 0 0 0 0 0 0 0 0 0 0 0 0 E356 TSM O/H Cond, Mint Farm OP 0 0 0 0 0 0 0 0 0 0 0 0 0 0 E356 TSM O/H Cond, N Intertie 12,701 12,701 12,701 12,701 12,701 12,701 12,701 12,701 12,701 12,701 12,701 12,701 12,701 12,700,860 E356 TSM O/H Cond, Snoqualmie 1 0 0 0 0 0 0 0 0 0 0 0 0 0 0 E356 TSM O/H Cond, Snoqualmie 2 0 0 0 0 0 0 0 0 0 0 0 0 0 0 E356 TSM O/H Cond, Upper Baker 0 0 0 0 0 0 0 0 0 0 0 0 0 0 E356 TSM O/H Cond, Wild Horse (2) (2) (2) (2) (2) (2) (2) (2) (2) (2) (2) (2) (2) (1,811)E356 TSM O/H Cond, Wild Horse-WindR 286 286 286 286 286 286 286 286 286 286 286 286 286 285,560 E356 TSM O/H Cond, Wind Ridge-NonPr 5,400 5,400 5,400 5,400 5,400 5,400 5,400 5,400 5,400 5,400 5,400 5,400 5,400 5,400,292 E356 TSM O/H Conductor & Devices 48,226 48,447 48,447 48,459 48,369 48,371 48,371 48,371 48,418 48,518 48,518 48,518 48,520 48,431,662 E356 TSM O/H Cov-Ber NOT USED 0 0 0 0 0 0 0 0 0 0 0 0 0 0 E3566 TSM O/H Conductor/Devices 0 2 51 115 274 355 415 472 543 560 566 601 723 359,595 E3567 TSM O/H Cond, Baker Common 6,804 6,804 6,812 6,812 6,817 6,821 6,824 6,825 6,825 6,827 6,827 6,827 6,817,944 E3567 TSM O/H Cond, Hopkins Ridge 0 0 0 0 0 0 0 0 0 0 0 0 0 E3567 TSM O/H Cond, Lower Baker 0 0 0 0 0 0 0 0 0 0 0 0 0 E3567 TSM O/H Cond, Snoqualmie 1 0 0 0 0 0 0 0 0 0 0 0 0 0 E3567 TSM O/H Cond, Snoqualmie 2 0 0 0 0 0 0 0 0 0 0 0 0 0 E3567 TSM O/H Cond, Sumas 0 0 0 0 0 0 0 0 0 0 0 0 0 E3567 TSM O/H Cond, Sumas OP 0 0 0 0 0 0 0 0 0 0 0 0 0 E3567 TSM O/H Cond, Upper Baker 683 683 683 683 683 683 683 683 683 683 683 683 683,462 E3567 TSM O/H Conductor/Devices 130,366 130,360 131,654 131,452 132,512 132,484 132,497 132,409 132,416 132,414 132,241 131,612 131,783,337

E3567 TSM O/H Cov-Ber-DONOTUSE 0 0 0 0 0 0 0 0 0 0 0 0 0 E357 TSM U/G CONDUIT WILD HORSE 0 0 0 0 0 0 0 0 0 0 0 0 0 0 E3576 TSM U/G Conduit 0 0 0 0 0 0 0 0 0 0 0 0 0 0 E3577 TSM U/G Conduit 701 701 701 701 701 701 701 701 701 701 701 701 700,575 E3577 TSM U/G Conduit, Koma Kuls 0 0 0 0 0 0 0 0 0 0 0 0 0 E358 TSM U/G Cond, Fred 1/Epcor 0 0 0 0 0 0 0 0 0 0 0 0 0 0 E358 TSM U/G COND, WILD HORSE 0 0 0 0 0 0 0 0 0 0 0 0 0 0 E358 TSM U/G Conductor & Devices 0 0 0 0 0 0 0 0 0 0 0 0 0 0 E358 TSM U/G Conduit-DONOTUSE 0 0 0 0 0 0 0 0 0 0 0 0 0 0 E3586 TSM U/G Conductor/Devices 0 0 0 0 0 0 0 0 0 0 0 0 0 0 E3587 TSM U/G Cond, Koma Kulshan 0 0 0 0 0 0 0 0 0 0 0 0 0 0 E3587 TSM U/G Conductor/Devices 2,933 2,933 2,933 2,933 2,933 2,933 2,933 2,933 2,933 2,933 2,933 2,933 2,932,873 E3590 TSM Roads & Trails 391 391 391 380 380 380 380 380 380 380 380 380 380 382,094 E3590 TSM Roads, Baker Common 0 0 0 0 0 0 0 0 0 0 0 0 0 0 E3590 TSM Roads, Upper Baker 0 0 0 0 0 0 0 0 0 0 0 0 0 0 E3596 TSM Roads & Trails 0 0 0 0 0 0 0 0 0 0 0 0 0 0 E3597 TSM Roads & Trails 1,006 1,006 574 574 574 574 574 574 574 574 574 574 663,968 E3597 TSM Roads/Trails, Baker Com 7 7 0 0 0 0 0 0 0 0 0 0 1,488 E3597 TSM Roads/Trails, Upper Baker 0 0 0 0 0 0 0 0 0 0 0 0 0 0 E3599 TSM ARO Transmission 2,321 2,321 2,321 2,321 2,321 2,321 2,321 2,321 2,321 2,321 2,321 2,321 2,698 2,336,650
Total WA area 250,951 831,641 833,325 833,884 835,476 837,148 849,919 850,561 848,689 858,642 858,259 872,494 892,339 847,454,717
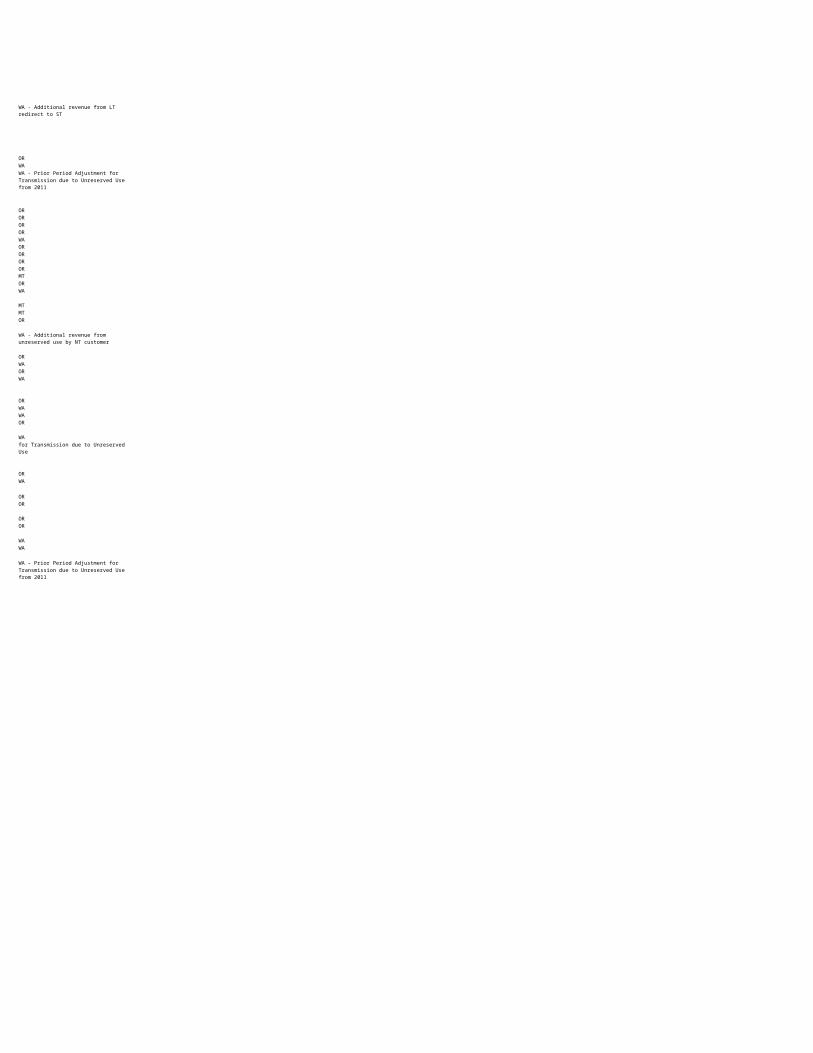
Colstripin thousands Dec-11 Jan-12 Feb-12 Mar-12 Apr-12 May-12 Jun-12 Jul-12 Aug-12 Sep-12 Oct-12 Nov-12 Dec-12 Average
E3500 TSM Land, Colstrip 10 10 10 10 10 10 10 10 10 10 10 10 10 10,247 E3501 TSM Easement, Colstrip 1-2Com 682 682 682 682 682 682 682 682 682 682 682 682 682 682,303 E3501 TSM Easement, Colstrip 3-4Com 1,071 1,071 1,071 1,071 1,071 1,071 1,071 1,071 1,071 1,071 1,071 1,071 1,071 1,071,124 E352 TSM Str/Impv, Colstrip 3-4 Com 489 489 489 489 489 489 489 489 489 489 489 489 489 488,761 E353 TSM Sta Eq, Colstrip 1-2 Com 0 0 0 0 0 0 0 0 0 0 0 0 0 0 E353 TSM Sta Eq, Colstrip 3-4 17,032 17,040 17,045 17,072 17,092 17,109 17,298 17,484 17,504 17,531 17,547 17,572 17,188 17,283,532 E354 TSM Twr/Fixt, Colstrip 1-2 Com 14,486 14,486 14,486 14,486 14,486 14,486 14,486 14,486 14,486 14,486 14,486 14,486 14,486 14,485,598 E354 TSM Twr/Fixt, Colstrip 3-4 Com 20,589 20,589 20,589 20,589 20,589 20,589 20,589 20,589 20,589 20,589 20,589 20,589 20,589 20,589,184 E355 TSM Poles, Colstrip 1-2 Com 0 0 0 0 0 0 0 0 0 0 0 0 0 0 E355 TSM Poles, Colstrip 3-4 Com 0 0 0 0 0 0 0 0 0 0 0 0 0 0 E356 TSM O/H Cond, Colstrip 1-2 Com 12,904 12,904 12,904 12,904 12,904 12,904 12,904 12,904 12,904 12,904 12,904 12,904 12,904 12,903,739 E356 TSM O/H Cond, Colstrip 3-4 Com 19,723 19,723 19,723 19,732 19,732 19,732 19,732 19,732 19,732 19,732 19,732 19,732 19,732 19,730,283 E3590 TSM Roads, Colstrip 1-2 Com 114 114 114 114 114 114 114 114 114 114 114 114 114 113,968 E3590 TSM Roads, Colstrip 3-4 Com 341 341 341 331 331 331 331 331 331 331 331 331 331 333,425
87,441 87,449 87,454 87,480 87,500 87,517 87,706 87,892 87,912 87,939 87,955 87,980 87,596 87,692,164
Southern Intertiein thousandsE3500 TSM Land, 3rd AC 1,769 1,769 1,769 1,769 1,769 1,769 1,769 1,769 1,769 1,769 1,769 1,769 1,769 1,769,178 E352 TSM Str/Impv, 3rd AC Line 1,276 1,276 1,276 1,276 1,276 1,276 1,276 1,276 1,276 1,276 1,276 1,276 1,276 1,276,264 E353 TSM Sta Eq, 3rd AC Line 33,143 33,017 33,027 33,027 33,191 33,909 33,614 33,760 33,760 34,107 33,763 33,626 35,273 33,584,122 E354 TSM Twr/Fixt, 3rd AC Line 22,781 22,781 22,781 22,781 22,781 22,781 22,781 22,781 22,781 22,781 22,781 22,781 22,781 22,781,417 E355 TSM Poles, 3rd AC Line 204 204 204 204 204 204 204 204 204 204 204 204 204 204,200 E356 TSM O/H Cond, 3rd AC Line 23,498 23,498 23,498 23,498 23,498 23,498 23,490 23,496 23,496 23,496 23,496 23,496 23,496 23,496,356 E3590 TSM Roads, 3rd AC Line 59 59 59 59 59 59 59 59 59 59 59 59 59 59,215
82,730 82,604 82,614 82,614 82,778 83,496 83,193 83,345 83,345 83,692 83,348 83,211 84,858 83,170,752 1,064,793

WA Area Transmission Plant Accumulated Depreciationin Thousands Dec-11 Jan-12 Feb-12 Mar-12 Apr-12 May-12 Jun-12 Jul-12 Aug-12 Sep-12 Oct-12 Nov-12 Dec-12 AverageE3500 TSM Land & Land Rights - - - - - - - - - - - - - - E3500 TSM Land, Baker - - - - - - - - - - - - - - E3500 TSM Land, N Intertie - - - - - - - - - - - - - - E3500 TSM Land, Wild Horse - - - - - - - - - - - - - - E3500 TSM Land, Wind Ridge - - - - - - - - - - - - - - E3501 TSM Easement 2,173 2,179 2,186 2,192 2,198 2,204 2,210 2,216 2,222 2,229 2,235 2,241 2,247 2,210,106 E3501 TSM Easement, Baker Common - - - - - - - - - - - - - - E3501 TSM Easement, Upper Baker - - - - - - - - - - - - - - E3501 TSM Easement, Wild Horse-NonP - - - - - - - - - - - - - - E3501 TSM Easement, Wild Horse-Proj - - - - - - - - - - - - - - E35016 TSM Easements - - - - - - - - - - - - - - E35017 DONOTUSE, Alpac 43 43 44 44 45 45 46 46 47 47 48 48 49 45,781 E35017 TSM Easements 7,899 7,937 7,976 8,014 8,052 8,090 8,128 8,166 8,204 8,243 8,281 8,319 8,357 8,128,129 E35017 TSM Easements, Baker Com 56 56 56 56 56 57 57 57 57 57 57 57 58 56,719 E35017 TSM Easements, Upper Baker 40 40 40 40 40 40 40 40 40 41 41 41 41 40,253 E3506 TSM Land & Land Rights - - - - - - - - - - - - - - E3507 TSM Land & Land Rights - - - - - - - - - - - - - 45 E352 TSM Str/Impv, Baker Common - - - - - - - - - - - - - - E352 TSM Str/Impv, Mint Farm - - - - - - - - - - - - - - E352 TSM Str/Impv, Mint Farm OP - - - - - - - - - - - - - - E352 TSM Structures & Improvement 286 287 288 289 291 292 293 294 295 291 292 293 294 291,145 E3526 TSM Structures & Improvement - - - - - - - - - - - - - - E3527 DONOTUSE Sub Arco North 11 11 11 11 11 11 11 11 11 11 11 11 11 11,060 E3527 DONOTUSE Sub Arco South 11 11 11 11 11 11 11 11 11 11 11 11 11 11,060 E3527 DONOTUSE Sub Texaco West 16 16 16 16 16 16 16 17 17 17 17 17 17 16,468 E3527 TSM Str/Impv, Baker Common - - - - - - - - - - - - - - E3527 TSM Structures & Improvement 1,087 1,090 1,094 1,097 1,101 1,104 1,108 1,111 1,115 1,118 1,122 1,123 1,126 1,107,315 E353 HOPKINS SUB@PLANT - - - - - - - - - - - - - - E353 TSM Sta Eq LSR - - - - - - - - - - - - - - E353 TSM Sta Eq, Baker Common - - - - - - - - - - - - - - E353 TSM Sta Eq, Cov-Ber NOT USED - - - - - - - - - - - - - - E353 TSM Sta Eq, Fred 1/Epcor - - - - - - - - - - - - - - E353 TSM Sta Eq, Fredonia 1&2 OP - - - - - - - - - - - - - - E353 TSM Sta Eq, Lower Baker - - - - - - - - - - - - - - E353 TSM Sta Eq, Mint Farm - - - - - - - - - - - - - - E353 TSM Sta Eq, Mint Farm OP - - - - - - - - - - - - - - E353 TSM Sta Eq, Snoqualmie 1 - - - - - - - - - - - - - - E353 TSM Sta Eq, Snoqualmie 2 - - - - - - - - - - - - - - E353 TSM Sta Eq, Upper Baker - - - - - - - - - - - - - - E353 TSM Sta Eq, Wild Horse - - - - - - - - - - - - - - E353 TSM Sta Eq, Wild Horse-WindRid 407 413 402 408 414 420 426 432 438 444 450 457 463 428,355 E353 TSM Sta Eq, Wind Ridge-NonProj 445 453 444 452 459 467 474 482 489 497 504 512 520 476,252 E353 TSM Station Equipment 11,770 11,898 11,530 11,651 11,772 10,192 10,322 10,464 10,605 12,942 13,138 13,338 13,484 11,706,637 E353 WILD HORSE EXP SUB - - - - - - - - - - - - - - E353 WILD HORSE EXP SUB@PLANT - - - - - - - - - - - - - - E353 WILD HORSE SUB@PLANT - - - - - - - - - - - - - - E3536 TSM Sta Eq, Baker Common - - - - - - - - - - - - - - E3536 TSM Sta Eq, Encogen - - - - - - - - - - - - - - E3536 TSM Sta Eq, Fredonia3&4 OP - - - - - - - - - - - - - - E3536 TSM Sta Eq, Goldendale - - - - - - - - - - - - - - E3536 TSM Sta Eq, Hopkins Ridge - - - - - - - - - - - - - - E3536 TSM Sta Eq, Hopkins Ridge Exp - - - - - - - - - - - - - - E3536 TSM Sta Eq, Lower Baker - - - - - - - - - - - - - - E3536 TSM Sta Eq, Mint Farm - - - - - - - - - - - - - - E3536 TSM Sta Eq, Snoqualmie 1 - - - - - - - - - - - - - - E3536 TSM Sta Eq, Snoqualmie 2 - - - - - - - - - - - - - - E3536 TSM Sta Eq, Sumas SMC - - - - - - - - - - - - - - E3536 TSM Sta Eq, Sumas SMS - - - - - - - - - - - - - - E3536 TSM Sta Eq, Upper Baker - - - - - - - - - - - - - - E3536 TSM Sta Eq, Wild Horse Solar - - - - - - - - - - - - - - E3536 TSM Substation Equipment - - - - - - - - - - - - - - E3537 DONOTUSE Sub, Fairchild - - - - - - - - - - - - - - E3537 DONOTUSE Sub, Texaco E 312 187 188 189 190 191 191 192 193 194 195 196 197 196,688 E3537 DONOTUSE, Cov-Ber - - - - - - - - - - - - - - E3537 DONOTUSE, Sub, Alpac 29 29 29 30 30 30 30 31 31 31 31 31 32 30,305 E3537 DONOTUSE, Sub, Arco C 372 374 376 378 379 381 383 384 386 388 390 391 393 382,727 E3537 DONOTUSE, Sub, Arco N 237 238 239 239 240 241 242 243 244 245 246 247 248 242,196 E3537 DONOTUSE, Sub, Arco S 215 216 217 219 220 221 222 223 225 226 227 228 230 222,249 E3537 DONOTUSE, Sub, BoeingRen 193 193 194 195 196 197 198 198 199 200 201 202 203 197,599 E3537 DONOTUSE, Sub, Capitol 49 50 50 50 50 51 51 51 51 52 52 52 - 48,730 E3537 DONOTUSE, Sub, Clover V 59 59 59 59 59 59 59 60 60 60 60 60 60 59,441 E3537 DONOTUSE, Sub, LiquidAir 92 92 92 92 92 93 93 93 93 93 94 94 94 92,740 E3537 DONOTUSE, Sub, MillerBay 55 55 56 56 56 56 56 57 57 57 57 58 58 56,453 E3537 DONOTUSE, Sub, Olym Avon 49 49 49 49 50 50 50 50 50 50 50 50 51 49,803 E3537 DONOTUSE, Sub, Olym Rntn 48 48 48 48 48 48 48 48 49 49 49 49 49 48,308
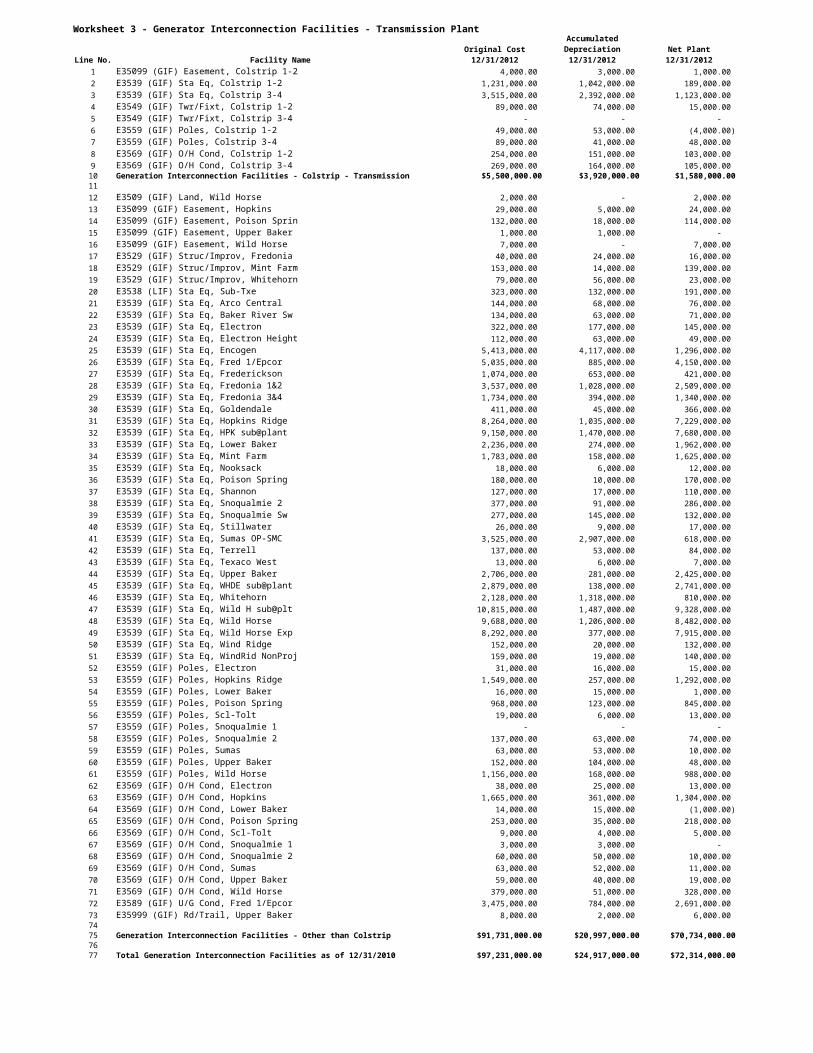
E3537 DONOTUSE, Sub, Paccar 69 70 70 70 70 71 71 71 71 72 72 72 72 70,761 E3537 DONOTUSE, Sub, Texaco W 79 80 81 82 82 81 81 82 83 84 84 85 86 82,337 E3537 DONOTUSE, Sub, Vitulli 225 227 230 232 234 236 239 241 243 246 226 226 212 233,234 E3537 DONOTUSE, Sub, Waterfront - - - - - - - - - - - - - - E3537 TSM Poles, Sumas OP - - - - - - - - - - - - - - E3537 TSM Sta Eq, Baker Common - - - - - - - - - - - - - - E3537 TSM Sta Eq, Encogen - - - - - - - - - - - - - - E3537 TSM Sta Eq, Fredonia3&4 OP 1,546 1,553 1,560 1,567 1,574 1,581 1,587 1,594 1,601 1,608 1,614 1,621 1,628 1,587,345 E3537 TSM Sta Eq, Goldendale - - - - - - - - - - - - - - E3537 TSM Sta Eq, Goldendale OP - - - - - - - - - - - - - - E3537 TSM Sta Eq, Hopkins Ridge - - - - - - - - - - - - - - E3537 TSM Sta Eq, Hopkins Ridge Exp 60 61 62 64 65 66 67 69 70 71 73 74 75 67,430 E3537 TSM Sta Eq, Lower Baker - - - - - - - - - - - - - - E3537 TSM Sta Eq, Mint Farm - - - - - - - - - - - - - - E3537 TSM Sta Eq, Mint Farm OP - - - - - - - - - - - - - - E3537 TSM Sta Eq, Snoqualmie 1 (195) (195) (195) (195) - - - - - - - - - (56,901)E3537 TSM Sta Eq, Snoqualmie 2 - - - - - - - - - - - - - - E3537 TSM Sta Eq, Sumas SMC - - - - - - - - - - - - - - E3537 TSM Sta Eq, Sumas SMS - - - - - - - - - - - - - - E3537 TSM Sta Eq, Upper Baker - - - - - - - - - - - - - - E3537 TSM Sta Eq, Wild Horse Solar - - - - - - - - - - - - - - E3537 TSM Sub Eq, Sumas OP-SMC - - - - - - - - - - - - - - E3537 TSM Sub Eq, Sumas OP-SMS 3 3 3 3 3 3 3 3 3 3 3 3 3 2,681 E3537 TSM Substation Equipment 57,053 57,036 57,835 57,927 58,189 58,218 58,544 58,816 58,780 59,053 59,377 59,439 59,485 58,456,695 E354 TSM Poles, Mint Farm - - - - - - - - - - - - - - E354 TSM Poles, Mint Farm OP - - - - - - - - - - - - - - E354 TSM Towers & Fixtures 4,709 4,747 4,784 4,822 4,859 4,897 4,934 4,972 5,009 5,047 5,085 5,122 5,160 4,934,446 E354 TSM Twr/Fixt, Mint Farm - - - - - - - - - - - - - - E354 TSM Twr/Fixt, Mint Farm OP - - - - - - - - - - - - - - E354 TSM Twr/Fixt, N Intertie 1,469 1,477 1,485 1,493 1,501 1,509 1,517 1,525 1,533 1,541 1,549 1,557 1,565 1,517,050 E354 TSM Twr/Fixt, Wild Horse-WindR - - - - - - - - - - - - - - E354 TSM Twr/Fixt, Wind Ridge-NonPr - - - - - - - - - - - - - - E3546 TSM Towers/Fixtures - - - - - - - - - - - - - - E3547 TSM Towers, Hopkins Ridge - - - - - - - - - - - - - - E3547 TSM Towers/Fixtures 680 684 688 692 696 698 702 706 710 714 717 721 725 702,433 E355 TSM Poles & Fixtures 11,929 12,038 12,153 11,574 11,688 11,791 11,912 12,009 12,122 12,238 12,351 12,464 12,678 12,053,792 E355 TSM Poles, Baker Common - - - - - - - - - - - - 161 6,729 E355 TSM Poles, Cov-Ber NOT USED - - - - - - - - - - - - - - E355 TSM Poles, Lower Baker - - - - - - - - - - - - - - E355 TSM Poles, N Intertie 1,420 1,429 1,437 1,446 1,455 1,459 1,468 1,477 1,486 1,494 1,503 1,512 1,521 1,469,764 E355 TSM Poles, Snoqualmie 1 - - - - - - - - - - - - - - E355 TSM Poles, Snoqualmie 2 - - - - - - - - - - - - - - E355 TSM Poles, Upper Baker - - - - - - - - - - - - - - E355 TSM Poles, Wild Horse - - - - - - - - - - - - - (3)E355 TSM Poles, Wild Horse-WindRidg 114 116 118 120 123 125 127 129 131 133 136 138 140 126,890 E355 TSM Poles, Wind Ridge-NonProje 985 997 1,010 1,023 1,036 1,048 1,061 1,074 1,087 1,099 1,112 1,125 1,138 1,061,145 E3556 TSM Poles - 1 2 3 8 14 21 28 37 45 53 61 96 26,724 E3557 TSM Poles 31,696 32,131 32,403 32,577 33,034 33,175 33,591 33,374 33,759 34,171 34,613 35,057 35,550 33,458,926 E3557 TSM Poles, Baker Common 503 522 541 557 576 594 614 633 652 671 690 709 728 614,547 E3557 TSM Poles, Cov-Ber DONOTUSE - - - - - - - - - - - - - - E3557 TSM Poles, Hopkins Ridge - - - - - - - - - - - - - - E3557 TSM Poles, Lower Baker - - - - - - - - - - - - - - E3557 TSM Poles, Snoqualmie 2 - - - - - - - - - - - - - - E3557 TSM Poles, Sumas - - - - - - - - - - - - - - E3557 TSM Poles, Upper Baker 158 158 159 159 160 160 161 161 162 163 163 164 164 160,936 E356 TSM O/H Cond, Baker Common - - - - - - - - - - - - - - E356 TSM O/H Cond, Lower Baker - - - - - - - - - - - - - - E356 TSM O/H Cond, Mint Farm - - - - - - - - - - - - - - E356 TSM O/H Cond, Mint Farm OP - - - - - - - - - - - - - - E356 TSM O/H Cond, N Intertie 4,702 4,724 4,747 4,769 4,791 4,814 4,836 4,858 4,881 4,903 4,925 4,948 4,970 4,836,109 E356 TSM O/H Cond, Snoqualmie 1 - - - - - - - - - - - - - - E356 TSM O/H Cond, Snoqualmie 2 - - - - - - - - - - - - - - E356 TSM O/H Cond, Upper Baker - - - - - - - - - - - - - - E356 TSM O/H Cond, Wild Horse - - - - - - - - - - - - - (4)E356 TSM O/H Cond, Wild Horse-WindR 35 36 36 37 37 38 38 39 39 40 40 41 41 38,466 E356 TSM O/H Cond, Wind Ridge-NonPr 1,384 1,394 1,403 1,413 1,422 1,432 1,441 1,451 1,460 1,470 1,479 1,489 1,498 1,441,023 E356 TSM O/H Conductor & Devices 17,755 17,840 17,925 18,012 18,097 18,182 18,267 18,352 18,437 18,522 18,607 18,693 18,778 18,266,525 E356 TSM O/H Cov-Ber NOT USED - - - - - - - - - - - - - - E3566 TSM O/H Conductor/Devices - - - 2 (24) 14 15 16 17 18 19 20 23 9,025 E3567 TSM O/H Cond, Baker Common 824 840 856 875 891 908 924 940 956 972 988 1,004 1,020 922,973 E3567 TSM O/H Cond, Hopkins Ridge - - - - - - - - - - - - - - E3567 TSM O/H Cond, Lower Baker - - - - - - - - - - - - - - E3567 TSM O/H Cond, Snoqualmie 1 - - - - - - - - - - - - - - E3567 TSM O/H Cond, Snoqualmie 2 - - - - - - - - - - - - - - E3567 TSM O/H Cond, Sumas - - - - - - - - - - - - - - E3567 TSM O/H Cond, Sumas OP - - - - - - - - - - - - - - E3567 TSM O/H Cond, Upper Baker 563 565 566 568 569 571 573 574 576 577 579 581 582 572,590 E3567 TSM O/H Conductor/Devices 56,993 57,300 57,603 58,323 58,615 58,981 59,306 59,578 59,972 60,272 60,584 60,877 61,117 59,205,654 E3567 TSM O/H Cov-Ber-DONOTUSE - - - - - - - - - - - - - -

E357 TSM U/G CONDUIT WILD HORSE - - - - - - - - - - - - - - E3576 TSM U/G Conduit - - - - - - - - - - - - - - E3577 TSM U/G Conduit 300 302 303 304 306 307 308 309 311 312 313 315 316 308,176 E3577 TSM U/G Conduit, Koma Kuls - - - - - - - - - - - - - - E358 TSM U/G Cond, Fred 1/Epcor - - - - - - - - - - - - - - E358 TSM U/G COND, WILD HORSE - - - - - - - - - - - - - - E358 TSM U/G Conductor & Devices - - - - - - - - - - - - - - E358 TSM U/G Conduit-DONOTUSE - - - - - - - - - - - - - - E3586 TSM U/G Conductor/Devices - - - - - - - - - - - - - - E3587 TSM U/G Cond, Koma Kulshan - - - - - - - - - - - - - - E3587 TSM U/G Conductor/Devices 2,024 2,033 2,041 2,050 2,059 2,067 2,076 2,084 2,093 2,102 2,110 2,119 2,128 2,075,853 E3590 TSM Roads & Trails 42 43 43 41 41 42 42 43 43 44 44 45 45 42,896 E3590 TSM Roads, Baker Common - - - - - - - - - - - - - - E3590 TSM Roads, Upper Baker - - - - - - - - - - - - - - E3596 TSM Roads & Trails - - - - - - - - - - - - - - E3597 TSM Roads & Trails 314 316 319 206 207 209 210 211 213 214 216 217 219 233,716 E3597 TSM Roads/Trails, Baker Com 2 2 2 - - - - - - - - - - 452 E3597 TSM Roads/Trails, Upper Baker - - - - - - - - - - - - - - E3599 TSM ARO Transmission 1,033 1,036 1,038 1,041 1,044 1,046 1,049 1,052 1,055 1,057 1,060 1,063 1,066 1,049,172
224,428 225,590 227,003 227,742 229,484 228,904 230,550 231,448 232,781 236,549 238,244 239,688 241,283 231,736,151

Colstripin thousands Dec-11 Jan-12 Feb-12 Mar-12 Apr-12 May-12 Jun-12 Jul-12 Aug-12 Sep-12 Oct-12 Nov-12 Dec-12 Average
E3500 TSM Land, Colstrip - - - - - - - - - - - - - - E3501 TSM Easement, Colstrip 1-2Com 428 429 430 431 432 433 434 435 436 437 438 440 441 434,176 E3501 TSM Easement, Colstrip 3-4Com 660 662 664 666 667 669 671 672 674 676 677 679 681 670,596 E352 TSM Str/Impv, Colstrip 3-4 Com 302 303 304 304 305 306 306 307 308 308 309 310 311 306,410 E353 TSM Sta Eq, Colstrip 1-2 Com - - - - - - - - - - - - - - E353 TSM Sta Eq, Colstrip 3-4 9,917 9,947 9,977 10,007 10,037 10,067 10,097 10,128 10,158 10,189 10,220 10,251 9,849 10,079,926 E354 TSM Twr/Fixt, Colstrip 1-2 Com 9,372 9,392 9,412 9,433 9,453 9,473 9,493 9,513 9,533 9,553 9,574 9,594 9,614 9,493,020 E354 TSM Twr/Fixt, Colstrip 3-4 Com 13,074 13,103 13,132 13,160 13,189 13,218 13,246 13,275 13,304 13,332 13,361 13,389 13,418 13,246,222 E355 TSM Poles, Colstrip 1-2 Com - - - - - - - - - - - - - - E355 TSM Poles, Colstrip 3-4 Com - - - - - - - - - - - - - - E356 TSM O/H Cond, Colstrip 1-2 Com 9,202 9,225 9,248 9,270 9,293 9,316 9,339 9,361 9,384 9,407 9,429 9,452 9,475 9,338,524 E356 TSM O/H Cond, Colstrip 3-4 Com 13,790 13,825 13,860 13,900 13,935 13,969 14,004 14,039 14,073 14,108 14,143 14,177 14,212 14,002,828 E3590 TSM Roads, Colstrip 1-2 Com 70 70 70 70 71 71 71 71 71 71 71 72 72 70,847 E3590 TSM Roads, Colstrip 3-4 Com 207 207 208 202 203 203 204 204 204 205 205 206 206 204,806
57,022 57,163 57,305 57,443 57,585 57,725 57,865 58,005 58,145 58,286 58,427 58,570 58,279 57,847,355 ###
Southern Intertiein thousandsE3500 TSM Land, 3rd AC - - - - - - - - - - - - - - E352 TSM Str/Impv, 3rd AC Line 425 427 428 430 432 434 436 437 439 441 443 445 447 435,672 E353 TSM Sta Eq, 3rd AC Line 13,154 13,212 13,270 13,329 13,387 13,446 13,505 13,564 13,623 13,683 13,742 13,800 13,876 13,506,512 E354 TSM Twr/Fixt, 3rd AC Line 7,706 7,737 7,769 7,801 7,833 7,864 7,896 7,928 7,959 7,991 8,023 8,055 8,086 7,896,014 E355 TSM Poles, 3rd AC Line 79 80 80 81 81 82 82 83 83 84 84 85 85 82,371 E356 TSM O/H Cond, 3rd AC Line 10,654 10,696 10,737 10,778 10,820 10,861 10,902 10,943 10,985 11,026 11,067 11,109 11,150 10,902,169 E3590 TSM Roads, 3rd AC Line 11 11 12 12 12 12 12 12 12 12 12 12 12 11,849
32,029 32,163 32,296 32,431 32,565 32,699 32,833 32,967 33,101 33,237 33,371 33,506 33,656 32,834,587
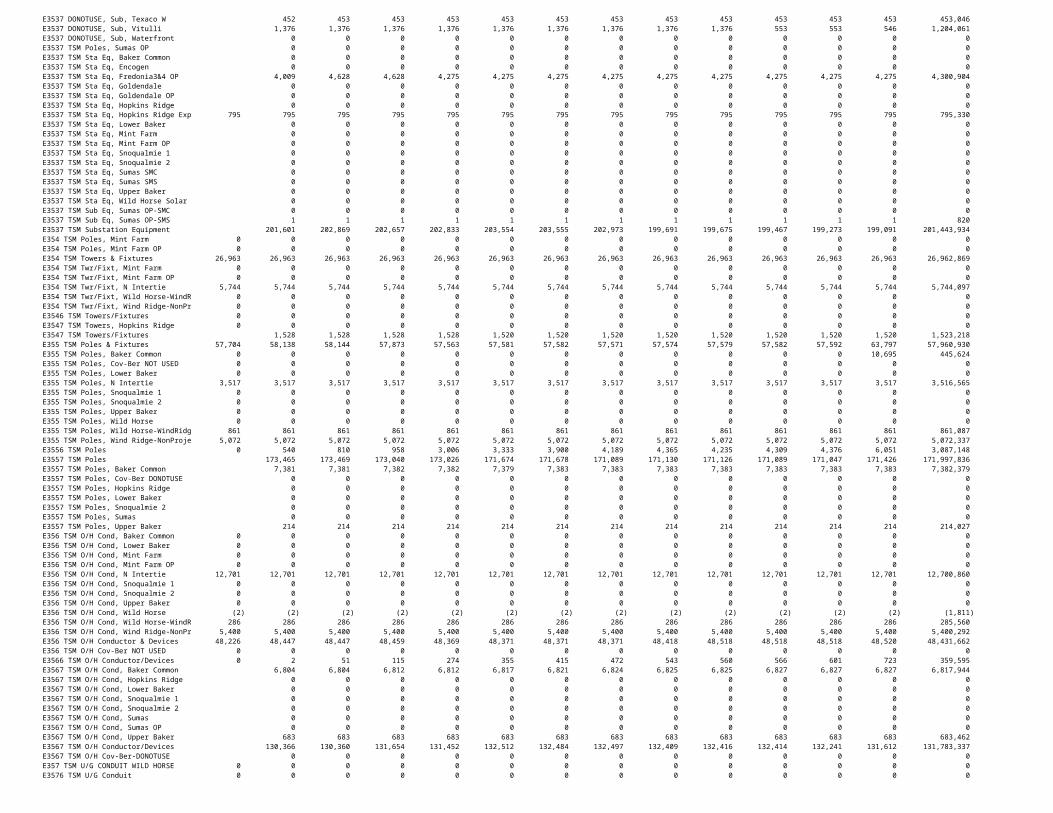
Worksheet 6 - Cost of Capital13 Month
Description Reference December-11 January-12 February-12 March-12 April-12 May-12 June-12 July-12 August-12 September-12 October-12 November-12 December-12 AverageLong Term DebtAcct 221 - Bonds p.112.18.c,d 3,773,860,000 3,773,860,000 3,773,860,000 3,773,860,000 3,773,860,000 3,773,860,000 3,773,860,000 3,773,860,000 3,773,860,000 3,773,860,000 3,773,860,000 3,773,860,000 3,773,860,000 3,773,860,000 Less Acct 222 Reaq'd Bonds p.112.19.c,d 0 0 0 0 0 0 0 0 0 0 0 0 0 0
Acct 223 LT Advances from Assoc Cos. p.256, various lines, col a,b 0 0 0 0 0 0 0 0 0 0 0 0 0 0 Acct 224 Other LT Debt p.112.21.c,d 0 0 0 0 0 0 0 0 0 0 0 0 0 0 Gross Proceeds Outstanding LT Debt 3,773,860,000
Less Acct 226 Unamort Discount p.112.23.c,d (14,646) (14,604) (14,562) (14,521) (14,479) (14,437) (14,395) (14,353) (14,311) (14,269) (14,228) (14,186) (14,144) (14,395) Less Acct 181 Unamort Debt Expense p.111.69.c,d (43,181,844) (42,604,604) (42,042,484) (41,465,197) (40,888,966) (40,311,831) (39,734,537) (39,157,256) (38,579,974) (38,002,735) (37,425,496) (36,848,258) (36,271,069) (39,731,866) Less Acct 189 Unamort Loss Reaq'd Debt p.111.81.c,d (33,023,258) (32,886,967) (32,750,676) (32,614,385) (32,479,381) (32,344,377) (32,209,372) (32,074,368) (31,939,364) (31,804,360) (31,669,356) (31,534,351) (31,399,347) (32,209,966) Plus Acct 225 Unamort Premium p.112.22.c,d 0 0 0 0 0 0 0 0 0 0 0 0 0 0 Plus Acct 257 Unamort Gain Reaq'd Debt p.113.61.c,d 0 0 0 0 0 0 0 0 0 0 0 0 0 0 Net Proceeds Long Term Debt 3,701,903,773
Long Term Debt CostTotal 427 Interest 19,027,724 19,027,724 19,017,607 19,017,607 19,017,607 19,017,607 19,017,607 19,017,607 19,017,607 19,017,607 19,017,607 19,017,607 228,231,522 Adjustments - Hedges (40,637) (40,637) (40,637) (40,637) (40,637) (40,637) (40,637) (40,637) (40,637) (40,637) (40,637) (40,637) (487,644) Adjustments - Accrued to Cash (20,233) (20,233) (10,116) (10,116) (10,116) (10,116) (10,116) (10,116) (10,116) (10,116) (10,116) (10,116) (141,628)Acct 427 & Acc 430 Interest Expense p.257.33.i 18,987,086.67 18,987,086.67 18,976,970.42 18,976,970.42 18,976,970.42 18,976,970.42 18,976,970.42 18,976,970.42 18,976,970.42 18,976,970.42 18,976,970.42 18,976,970.42 227,743,878 Acct 428 Amort Debt Discount & Expense p.117.63.c 577,282 577,320 577,318 577,323 577,324 577,324 577,324 577,324 577,281 577,281 577,281 577,230 6,927,610 Acct 428.1 Amort Loss on Reaq'd Debt p.117.64.c 136,291 136,291 136,291 135,004 135,004 135,004 135,004 135,004 135,004 135,004 135,004 135,004 1,623,911 Less Acct 429 Amort Premium p.117.65.c - - - - - - - - - - - - 0 Less Acct 429.1 Amort Gain Reaq'd Debt p.117.66.c - - - - - - - - - - - - 0 Total Long Term Debt Cost 236,295,399
Preferred Stock & DividendAcct 204 Preferred Stock Issued p.112.3.c,d 0 0 0 0 0 0 0 0 0 0 0 0 0 0 Less Acct 217 Reaq'd Capital Stock (Pfd) p.112.13.c,d (portion) 0 0 0 0 0 0 0 0 0 0 0 0 0 0 Acct 207 Premium on Pfd Stock p112.6.c,d (portion) 0 0 0 0 0 0 0 0 0 0 0 0 0 0 Acct 208-211 Other Paid in Capital (Pfd) p.112.7.c,d (portion) 0 0 0 0 0 0 0 0 0 0 0 0 0 0 Less Acct 213 discount on Capital Stock (Pfd) p.112.9.c,d (portion) 0 0 0 0 0 0 0 0 0 0 0 0 0 0 Less Acct 214 Capital Stock Exp (Pfd) p.112.10.c,d (portion) 0 0 0 0 0 0 0 0 0 0 0 0 0 0 Total Preferred StockPreferred Dividend p.118.29.c 0 0 0 0 0 0 0 0 0 0 0 0 0 0
Common StockProprietary Capital p.112.16.c,d 3,222,219,929 3,251,719,245 3,294,361,684 3,267,886,691 3,294,415,066 3,323,052,356 3,287,072,162 3,316,850,671 3,316,602,387 3,338,254,311 3,371,071,716 3,388,920,268 3,404,144,680 3,313,582,397 Less Preferred Stock p.112.3.c,d 0 0 0 0 0 0 0 0 0 0 0 0 0 0 Less Acct 216.1 Unap Undis Subs Earnings p.112.12.c,d (737,289) (737,289) (737,289) (1,138,178) (1,138,178) (1,138,178) (1,313,403) (1,313,403) (1,313,403) (1,671,456) (1,671,456) (1,671,456) (6,923,503) (1,654,191) Less Acct 219 (enter negative) p.112.15.c,d (188,579,238) (187,892,363) (185,951,059) (184,161,318) (182,461,310) (180,613,078) (179,985,949) (178,350,004) (177,278,877) (176,011,941) (174,168,499) (172,172,420) (187,198,543) (181,140,354)Total Common Stock 3,411,536,456 3,440,348,898 3,481,050,032 3,453,186,187 3,478,014,553 3,504,803,613 3,468,371,514 3,496,514,078 3,495,194,667 3,515,937,708 3,546,911,671 3,562,764,144 3,598,266,726 3,496,376,942
Proprietary Capital Common Stock Issued (201) p.112.2.c,d 859,038 859,038 859,038 859,038 859,038 859,038 859,038 859,038 859,038 859,038 859,038 859,038 859,038 859,038 Premium on Capital Stock (207) p.112.6.c,d (portion) 478,145,250 478,145,250 478,145,250 478,145,250 478,145,250 478,145,250 478,145,250 478,145,250 478,145,250 478,145,250 478,145,250 478,145,250 478,145,250 478,145,250 Other Pd in Capital (208-211) p.112.7.c,d (portion) 2,775,196,691 2,775,196,691 2,775,196,691 2,775,196,691 2,775,196,691 2,775,196,691 2,775,196,691 2,775,196,691 2,775,196,691 2,775,196,691 2,775,196,691 2,775,196,691 2,775,196,691 2,775,196,691 Less Acct 213 discount on Capital Stock (Comm p.112.9.c,d (portion) 0 0 0 0 0 0 0 0 0 0 0 0 0 0 Less Stock Expense (214) p.112.10.c,d (portion) (7,133,879) (7,133,879) (7,133,879) (7,133,879) (7,133,879) (7,133,879) (7,133,879) (7,133,879) (7,133,879) (7,133,879) (7,133,879) (7,133,879) (7,133,879) (7,133,879) Retained Earnings (215, 215.1, 216) p.112.11.c,d 164,469,356 193,281,987 233,983,306 206,119,087 230,947,638 257,736,708 221,304,413 249,446,828 248,127,785 268,870,608 299,844,210 315,697,293 351,199,626 249,309,911 Unappr Undistr Sub Retnd Earn (216.1) p.112.12.c,d (737,289) (737,289) (737,289) (1,138,178) (1,138,178) (1,138,178) (1,313,403) (1,313,403) (1,313,403) (1,671,456) (1,671,456) (1,671,456) (6,923,503) (1,654,191)Accumulated OCI (219) p.112.15.c,d (188,579,238) (187,892,363) (185,951,059) (184,161,318) (182,461,310) (180,613,078) (179,985,949) (178,350,004) (177,278,877) (176,011,941) (174,168,499) (172,172,420) (187,198,543) (181,140,354)
3,222,219,929 3,251,719,434 3,294,362,058 3,267,886,691 3,294,415,250 3,323,052,551 3,287,072,161 3,316,850,521 3,316,602,605 3,338,254,311 3,371,071,355 3,388,920,517 3,404,144,679 3,313,582,466