Xipp Menu, Tool Bars and Commands
34
Xipp Menu, Tool Bars and Commands Start XippPanel using xipp command with no arguments. Show/Run a Study Select 'bbNew (HPr)' under 'Studies (by File)' and click Show to display the Canvas and Table windows for bbNew Study. Auto-Save While a Study is running any changes to Peak-Pick, assignments, or coupling data is automatically saved to their associated file every 1 to 2 minutes. The save frequency is defined in various AutoSave objects in Python files. The AutoSave only writes the file if the data in Xipp has been modified since the last save. Save on Exit When a Study is stopped by any normal ending mechanism (Menu Exit or Quit, canvas command 'e' or 'q', or closing window to Canvas or Table) will cause all files to be saved regardless of whether the data indicates that it has been modified since last save. Note using ^C, the kill command or Xipp crashing is not a normal ending mechanism and the files will not be saved except for the most recent Auto-Save. Recovery Files Every time a Xipp Study starts and when it exits a copy of all of the relevant files (Peak-Pick, Assignment, *.xipp and xipp log file) are packaged into a Jar file under the directory backupJars which is created at the working directory where xipp was started. The Jar file name is: <studyName>_<S|E>_<day><Month><Yr>_<Hr>_<Min>.jar For study bbNew the Jar file name when xipp starts: bbNew_S_25Aug14_09_48.jar The corresponding Jar file name when xipp exits: bbNew_E_25Aug14_10_21.jar The command jar can be used to extract the entire contents of a Jar file or a single file. The arguments for the jar command are very similar to the tar command: jar tvf bbNew_E_25Aug14_10_21.jar to see the file names in a Jar file jar xf bbNew_E_25Aug14_10_21.jar to extract all files from a Jar file
Transcript of Xipp Menu, Tool Bars and Commands

Xipp Menu, Tool Bars and Commands
Start XippPanel using xipp command with no arguments.
Show/Run a StudySelect 'bbNew (HPr)' under 'Studies (by File)' and click Show to display the Canvas and Table windows for bbNew Study.
Auto-SaveWhile a Study is running any changes to Peak-Pick, assignments, or coupling data is automatically saved to their associated file every 1 to 2 minutes. The save frequency is defined in various AutoSave objects in Python files. The AutoSave only writes the file if the data in Xipp has been modified since the last save.
Save on ExitWhen a Study is stopped by any normal ending mechanism (Menu Exit or Quit, canvas command 'e' or 'q', or closing window to Canvas or Table) will cause all files to be saved regardless of whether the data indicates that it has been modified since last save. Note using ^C, the kill command or Xipp crashing is not a normal ending mechanism and the files will not be saved except for the most recent Auto-Save.
Recovery Files Every time a Xipp Study starts and when it exits a copy of all of the relevant files (Peak-Pick, Assignment, *.xipp and xipp log file) are packaged into a Jar file under the directory backupJars which is created at the working directory where xipp was started. The Jar file name is: <studyName>_<S|E>_<day><Month><Yr>_<Hr>_<Min>.jarFor study bbNew the Jar file name when xipp starts: bbNew_S_25Aug14_09_48.jarThe corresponding Jar file name when xipp exits: bbNew_E_25Aug14_10_21.jar
The command jar can be used to extract the entire contents of a Jar file or a single file. The arguments for the jar command are very similar to the tar command:
jar tvf bbNew_E_25Aug14_10_21.jar to see the file names in a Jar file
jar xf bbNew_E_25Aug14_10_21.jar to extract all files from a Jar file

bbNew Study
Canvas Window Table Window
Showing a Study such as bbNew will create and display 2 Windows: Canvas Window and Table WindowThe Menu, Tool bar and commands described below are all done on the Canvas Window. The Table Window can show Peak-Pick Table, ShiftTable, Name Peak-Pick Table, BAMTable, or Coupling Constant Table depending on the typeof study. The default Table shown for all studies is the Peak-Pick Table.
See the document backboneAssignStudy for a tutorial on backbone assignments with Xipp.

Xipp Menu
File Menu
• Save Data will save all Peak Pick, assignment, relaxation and coupling constant data to files. Xipp also has an auto-saver which saves any data that has changed since the last auto-save. The default frequency for auto-save is 1-5 minutes and is configured in Python startup files.
• Plot File provides access to sub-menu for plotting individual NMR experiments. This is exactly the same as Right-Clicking Experiment Button in tool bar.
• Quit Study is same as typing 'q' in canvas and will immediately exit the Canvas and Table of the Study but leave the XippPanel and any other Study Windows up. All data associated with this Study is saved.
• Exit All is same as typing 'e' in canvas and will show 'Confirm Exit All' prior to saving all data and exiting all Studies, closing XippPanel and terminating the Java virtual machine.
Edit Menu Unused at this time.

View Menu
• Activity Monitor will bring up the non-modal Xipp Activity Monitor (see below) which has tabs showing all running Studies, property panels being Edited, and Processes such as CAPP, ps_contour or MARS that are running outside of Java. Use the frames X to exit the Activity Monitor. Only 1 copy of the Activity Monitor exists at any time and if it is iconified this menu option will open it up instead of creating a second panel.
• XippPanel will display the XippPanel. If XippPanel has been exited this create a new XippPanel. Only 1 copy of the XippPanel exists at any time and if it is iconified this menu option will open it up instead of creating a second panel.
• Full is same as typing 'f' in canvas and will set the displayed X,Y PPM range to the full width as defined in the Edit View panel on the Study specific panel such as the Backbone Assign Panel. This can also be thought of as resetting the display stack to 0.
• Up is the same as typing 'u' in canvas and changes the displayed X,Y PPM range to a wider/larger range previously used by going Up the display stack. When the display stack is at 0, ie the top, this command will have no effect.
• Down is the same as typing 'd' in canvas and changes the displayed X,Y PPM range to a narrower/smaller range previously used by going Down the display stack. When the display stack is at its largest value, ie the bottom, this command will have no effect.
Xipp Activity Monitor
The Studies tab shows the XippPanel and all studies that are being shown are displayed in the Studies tab. Clicking on one of the buttons under Study such as bbNew (HPr) will bring that study to the foreground and un-iconify if needed.
The Editing tab shows all property panels being edited such as Study, Experiment, Molecule, and Assignment Table. Click button under Entity Name to bring that dialog panel to the top.
The Processes tab shows all external processes that have been run or are running since the most recent start of Xipp. The processes shown include CAPP, ps_contour and Mars. Click a button under Status such as that labeled A to see the details of the process such as ant text printed by process. Click a button under Action such as labeled B to either Remove the process (if it has finished) or terminate the process (if it is still running). Note this only terminates the process started by Xipp which is usually a shell script that sets properties prior to calling the executable. For CAPP and ps_contour terminating the shell script does not stop the CAPP executable. You must open a terminal, find the process and use the kill command.

Assign Menu
• Backbone is used to access two sub-menus for making backbone assignments.
• MARS Auto Assign menu is parent Menu to the name of an assignment table. When user clicks on the assignment table under MARS Auto Assign the Backbone Auto-Assign via MARS panel is shown to let the user set the most common MARS properties and run the MARS program externally when the OK button is pressed. Note MARS requires (i,i) and (i,i-1) assignments for CA and CB assigned to Spin-Systems or as MARS calls them pseudo-residues. See the backboneAssignStudy document for more details.
• Manually menu is parent Menu to the name of an assignment table. When user clicks on the assignment table under Manually the Manual Backbone Assign dialog is shown which details which residues are assigned. This dialog is not functional yet and has been superseded by the BAMTable described in the backboneAssignStudy document..
Study Chooser • This is the first drop down chooser button after the Assign Menu. Currently this always has one
option which is the name of the current Study. Prior to creating the XippPanel this was supposed to hold different studies that are active at same time.
View Chooser
• This is the second drop down chooser button after the Assign Menu. This shows the different views of the data that were defined in Edit Views in XippPanel. Selecting a different View will change the tool bar and NMR Exps shown in canvas.

Tool Bar(s)● There is a separate tool bar for each View and there are different types of tool bars depending on what
is shown.
● Single Experiment 2D Tool Bar
This is used whenever xipp starts with the name of a 2D NMRPipe file as its sole argument. This is also used when a new Study of the type Single Experiment for a 2D is created in XippPanel.
Update creates new contours using the current contour level properties as shown in the tool bar.Changes made here to contour level, multiplier and which sign to calculate are temporary and will be lost when Xipp exits and restarts. Only changes that are done from XippPanel as described in Setting Xipp properties are permanent.
Level defines the minimum level absolute value for generating contours.Multiplier is the exponential multiplier used to define successive contour levels.
▪ Given the contour properties from above the contour values for first 6 levels are:
0 8.000e5
1 1.040e6
2 1.352e6
3 1.7576e6
4 2.28488e6
5 2.970344e6
▪ Calculate: All indicates that positive going and negative going contours are calculated. Selecting Pos will generate only positive going contours and selecting Neg will generate only negative going contours.
▪ ResID defines a Residue chooser that allows finding a peak by residue. User can jump to a specific residue if assignments are known by selecting the number by ResID and entering a residue number or by typing 'Alt-j' in canvas which has the effect of temporarily moving the focus to the Residue Chooser until the user clicks the enter key. For 2D data a residue jump will result in cross-hairs placed on the canvas at the PPM values for the residue, ie HN, N PPM for 15N-HSQC. The cross-hairs are actually ShiftCursor ImageComponent objects whose value is taken from the Shift-Table.
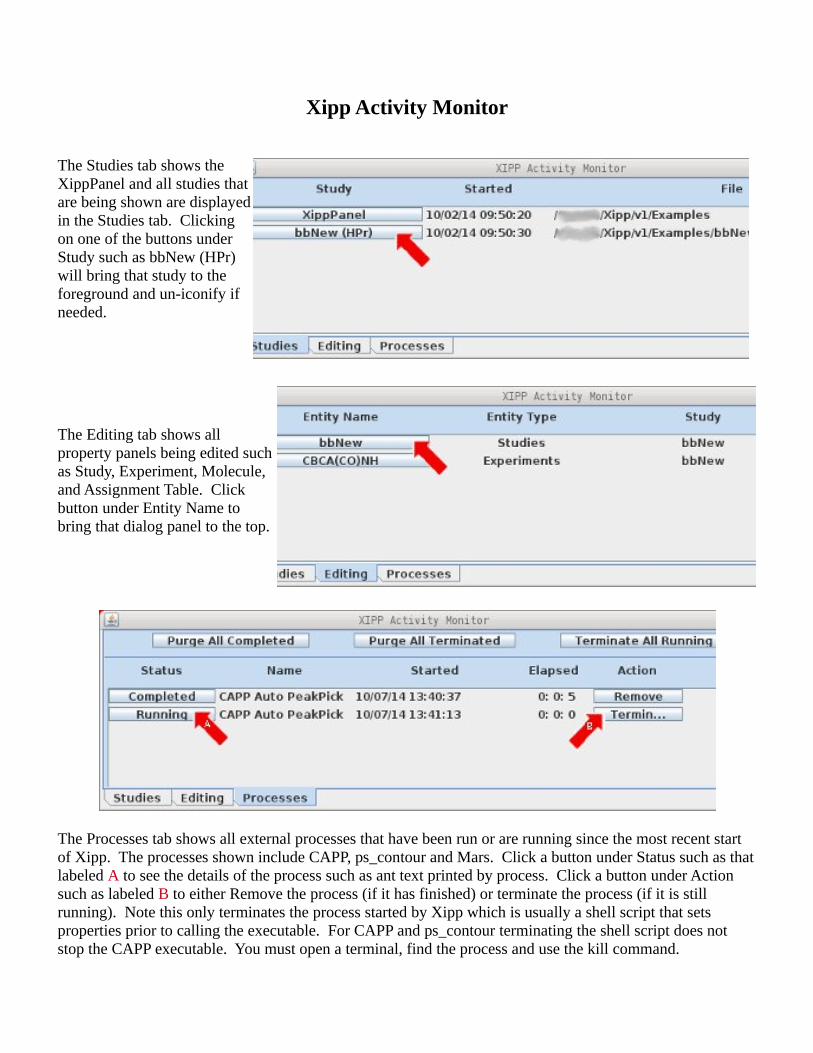
● Single Experiment 3D Tool Bar
The Single Experiment 3D Tool Bar includes all of the same features as the 2D version with the addition of the Z slice chooser shown above Residue Chooser.
Z slice chooser allows user to enter slice by plane number or by PPM. If value entered is an integer (ie no decimal) then it is interpreted as a plane number. If value entered contains a decimal then it is interpreted as a PPM value. The canvas command 'j' can be used to jump by slice number or PPM.
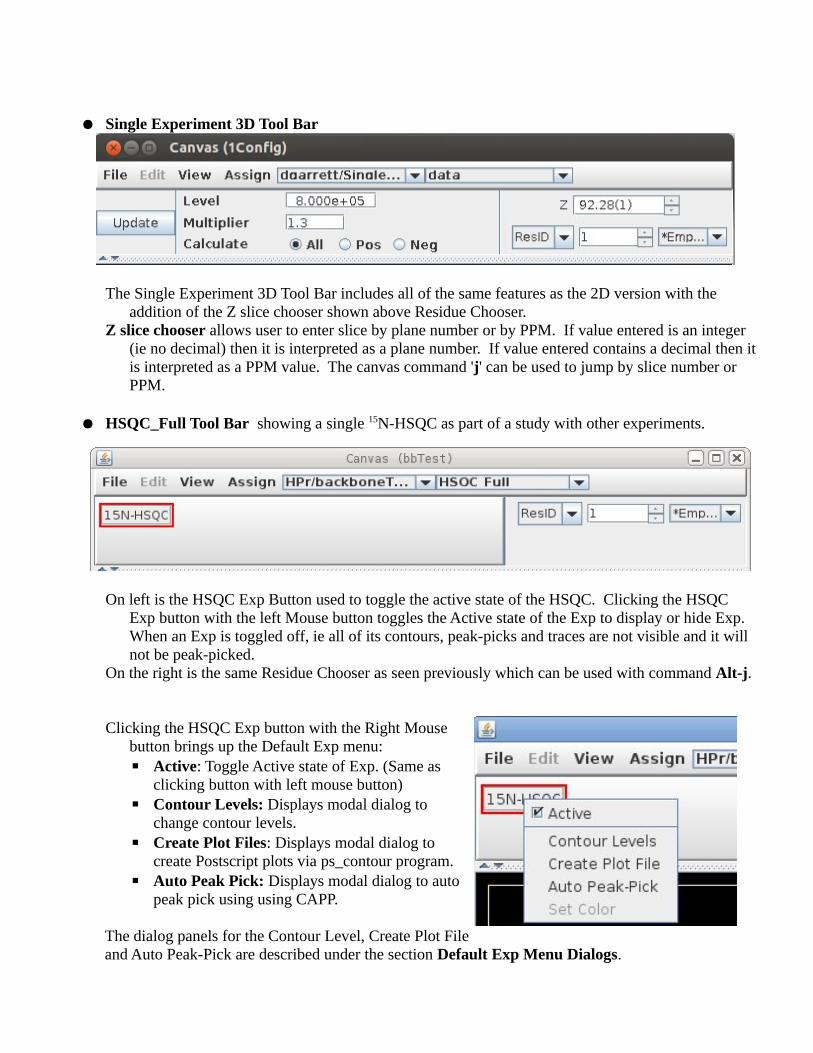
● HSQC_Full Tool Bar showing a single 15N-HSQC as part of a study with other experiments.
On left is the HSQC Exp Button used to toggle the active state of the HSQC. Clicking the HSQC Exp button with the left Mouse button toggles the Active state of the Exp to display or hide Exp. When an Exp is toggled off, ie all of its contours, peak-picks and traces are not visible and it will not be peak-picked.
On the right is the same Residue Chooser as seen previously which can be used with command Alt-j.
Clicking the HSQC Exp button with the Right Mouse button brings up the Default Exp menu:▪ Active: Toggle Active state of Exp. (Same as
clicking button with left mouse button)▪ Contour Levels: Displays modal dialog to
change contour levels.▪ Create Plot Files: Displays modal dialog to
create Postscript plots via ps_contour program.▪ Auto Peak Pick: Displays modal dialog to auto
peak pick using using CAPP.
The dialog panels for the Contour Level, Create Plot File and Auto Peak-Pick are described under the section Default Exp Menu Dialogs.

● Backbone Study (N) Tool Bar with Split Panel showing 3D Exps in top Panel and 2D Exp in bottom.
On left are Exp Buttons used to toggle active state of Experiments on canvas. Clicking an Exp button with the left Mouse button toggles the Active state of the Exp to display or hide Exp. When an Exp is toggled off all of its contours, peak-picks and traces are not visible and it will not be peak-picked.
On the right are the same Frequency Slice Chooser and Residue Chooser as seen previously.The Frequency Slice and Residue Choosers only control the slice for the CBCA(CO)NH and
HNCACB only. The Seq-<ExpName> exists to overlay slices from possible sequential (ie adjacent) residues which can be at a different slice than set with Frequency Slice and Residue Choosers.
Clicking the CBCA(CO)NH or HNCACB Exp button with the Right Mouse button brings up the Default Exp Menu:▪ Active: Toggle Active state of Exp. (Same
as clicking button with left mouse button)▪ Contour Levels: Displays modal dialog to
change contour levels.▪ Create Plot Files: Displays modal dialog
to create Postscript plots via ps_contour program.
▪ Auto Peak Pick: Displays modal dialog to auto peak pick using using CAPP.
These are same menu items as shown for the HSQC Exp button above. The dialog panels for the Contour Levels, Create Plot File and Auto Peak-Pick are described under the section Default Exp Menu Dialogs.

Clicking the Seq-CBCA(CO)NH or Seq-HNCACB Exp button with the Right Mouse button brings up the Seq-Exp Menu:▪ Active: Toggle Active state of Exp.▪ Linked: Toggles linked state of Exp.▪ Jump to Slice: Displays non-modal
Frequency/Residue Chooser dialog for this Seq-<Exp-Name> view. Non-modal so you keep it open while making other changes..
▪ Contour Levels: Displays a modal dialog to change contour levels.
▪ Clear PPM Cursors: PPM Cursors identify potential sequential residues on the Seq-<Exp-Name> view. This option clears all PPM cursors from this Seq-<Exp-Name> view.
The Seq-<Exp-Name> buttons/views allows overlaying 2 planes from the same experiment to help in finding sequential assignments. See the section on Backbone Assignments for more details on using Seq-<Exp-Name>
● Backbone Study (C) Tool Bar shows CACB_FULL(C) view from CBCA(CO)NH and HNCACB with 13C defining the plane instead of 15N. This tool bar can also be used with CA(CO)NH, CB(CO)NH, HNCA and HNCB NMR experiments.
On left are Exp Buttons based on atom names used to manage 4 overlayed views shown on canvas paired with a Frequency Slice Chooser that controls the slice for each atom view. Clicking an atom view button with the left Mouse button toggles the Active state of the atom view to display or hide atom view.
On the right is the Residue Chooser as seen previously.
Clicking the atom view buttons with the Right Mouse button brings up the Default Exp Menu with the same menu items as previously shown except without the Auto Peak Pick item. The dialog panels for the Contour Levels and Create Plot File are described under the section Default Exp Menu Dialogs.

● 3D Symmetry Tool Bar used with Sidechain Study for HCCH-COSY and HCCH-Tocsy. The Symmetry Tool Bar is also used with Noesy Studies for 13C-NOESY and 15N-NOESY experiments. For 15N-NOESY the symmetry should only be used with amide to amide NOEs which is why the menu for the experiments has a toggle to turn symmetry off.
On left are Exp/view Buttons used to toggle which Experimental views are shown on canvas. Clicking an Exp/view button with the left Mouse button toggles the active state of the view to display or hide the experiment. When a view is toggled off all of its contours, peak-picks and traces are not visible and it will not be peak-picked.
On the right are the same Frequency Slice Chooser and Residue Chooser as seen previously.The Frequency Slice and Residue Choosers only control the slice for the CBCA(CO)NH and
HNCACB only. The Sym-<ExpName> exists to overlay slices from possible 3D symmetry peaks.
Clicking the CBCA(CO)NH or HNCACB Exp button with the Right Mouse button brings up the Default Exp Menu:▪ Active: Toggle Active state of Exp. ▪ Symmetry Enabled: Toggles requiring symmetry for
finding assignments. Useful for 15N-Noesy Experiments.▪ Contour Levels: Displays modal contour level dialog.▪ Create Plot Files: Displays modal plot file dialog.▪ Auto Peak Pick: Displays modal dialog to CAPP peak pick.
These are same menu items as shown with the addition of Symmetry Enabled. The dialog panels for the Contour Levels, Create Plot File and Auto Peak-Pick are described under the section Default Exp Menu Dialogs.
Clicking the Sym-Cosy or Sym-Tocsy Exp/View button with the Right Mouse button brings up the Sym-Exp Menu:▪ Active: Toggle Active state of Exp.▪ Linked: Toggles linked state of Exp.▪ Jump to Slice: Displays non-modal Frequency/Residue
Chooser dialog for this Sym-<Exp-Name> view. Non-modal so you do not have to exit window.
▪ Contour Levels: Displays modal dialog to change contour levels.
The Sym-<Exp-Name> buttons/views allows overlaying 2 planes from the same experiment to help in finding 3D symmetry peaks. See the section on Sidechain Assignments for more details on using Sym-<Exp-Name>
Default Exp Menu Dialogs
These dialogs are obtained from using the right mouse button on an Exp button in a tool bar and selecting one of the options:
▪ Contour Levels: Displays modal dialog to change contour levels.
▪ Create Plot Files: Displays modal dialog to create Postscript plots via ps_contour program.
▪ Auto Peak Pick: Displays modal dialog to auto peak pick using using CAPP.
Modal dialogs such as these require that you make your changes on the dialog and click OK or Cancel before you can do anything else with Xipp. When a modal dialog is up no other window will respond to input. The Canvas, Table and XippPanel are all locked when there is a model Dialog such as this being shown.
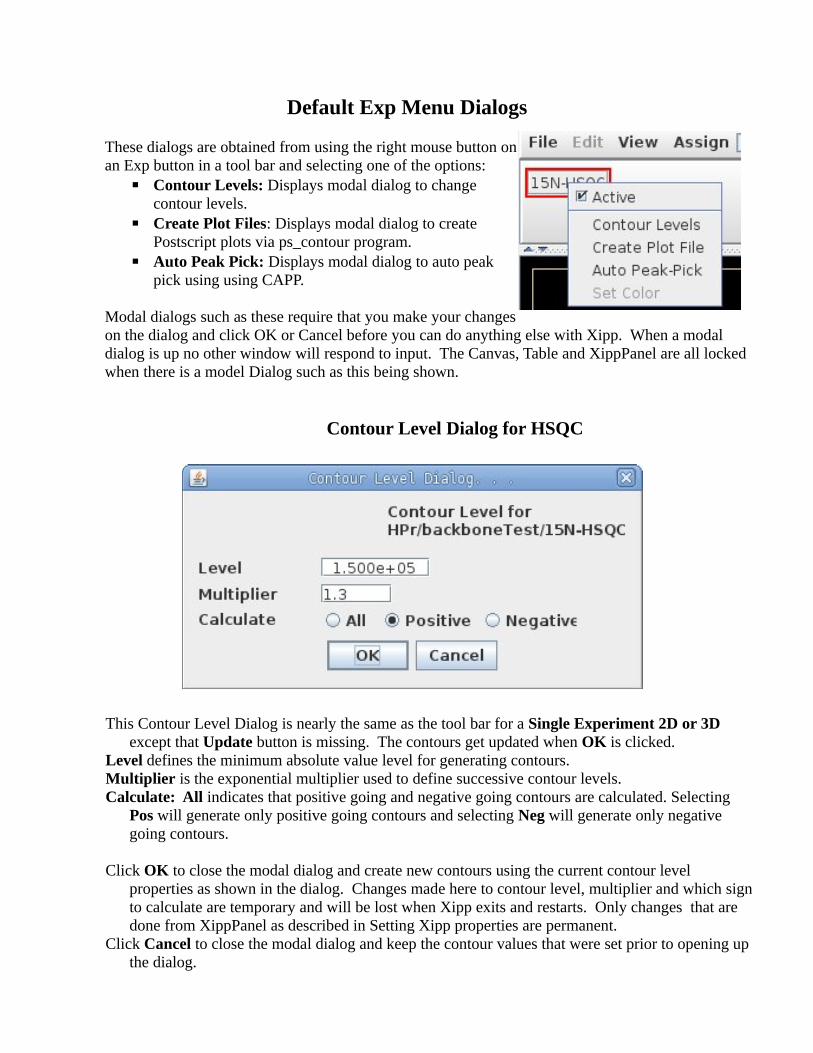
Contour Level Dialog for HSQC
This Contour Level Dialog is nearly the same as the tool bar for a Single Experiment 2D or 3D except that Update button is missing. The contours get updated when OK is clicked.
Level defines the minimum absolute value level for generating contours.Multiplier is the exponential multiplier used to define successive contour levels.Calculate: All indicates that positive going and negative going contours are calculated. Selecting
Pos will generate only positive going contours and selecting Neg will generate only negative going contours.
Click OK to close the modal dialog and create new contours using the current contour level properties as shown in the dialog. Changes made here to contour level, multiplier and which sign to calculate are temporary and will be lost when Xipp exits and restarts. Only changes that are done from XippPanel as described in Setting Xipp properties are permanent.
Click Cancel to close the modal dialog and keep the contour values that were set prior to opening up the dialog.

Create Plot File Dialog
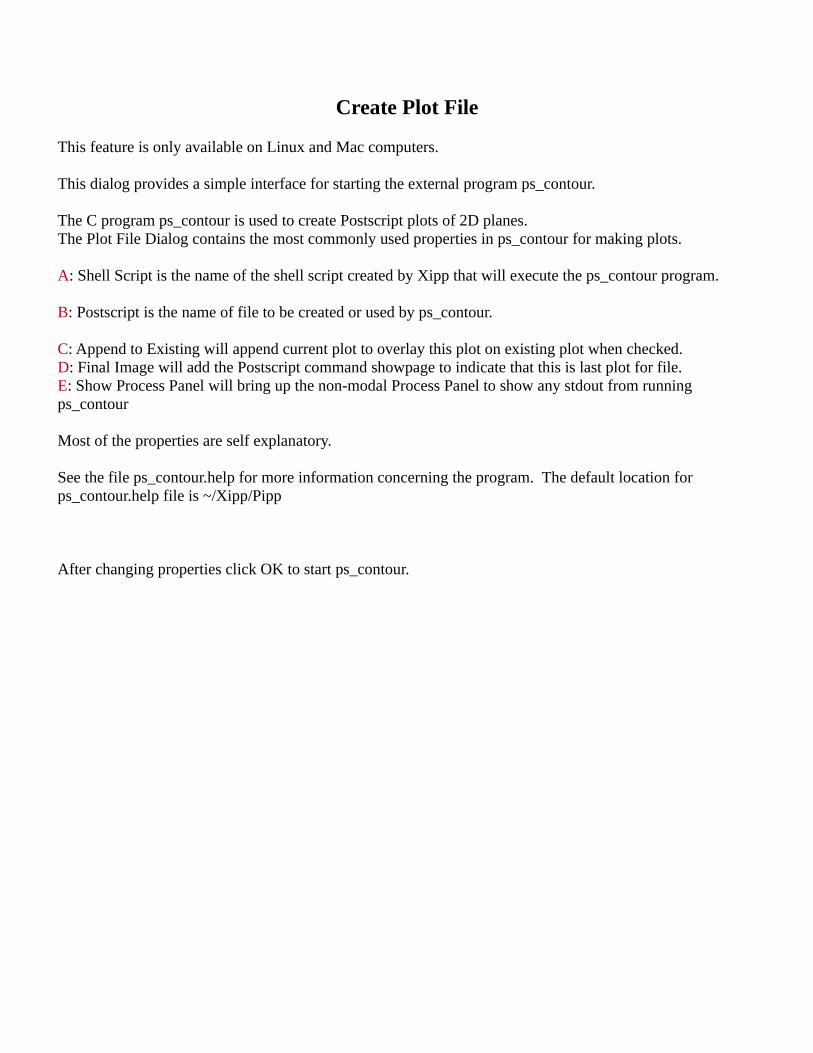
Create Plot File
This feature is only available on Linux and Mac computers.
This dialog provides a simple interface for starting the external program ps_contour.
The C program ps_contour is used to create Postscript plots of 2D planes. The Plot File Dialog contains the most commonly used properties in ps_contour for making plots.
A: Shell Script is the name of the shell script created by Xipp that will execute the ps_contour program.
B: Postscript is the name of file to be created or used by ps_contour.
C: Append to Existing will append current plot to overlay this plot on existing plot when checked.D: Final Image will add the Postscript command showpage to indicate that this is last plot for file.E: Show Process Panel will bring up the non-modal Process Panel to show any stdout from running ps_contour
Most of the properties are self explanatory.
See the file ps_contour.help for more information concerning the program. The default location for ps_contour.help file is ~/Xipp/Pipp
After changing properties click OK to start ps_contour.

Auto Peak Pick Dialog

Auto Peak Pick
This feature is only available on Linux and Mac computers.
This dialog provides a simple interface for starting the external program CAPP.
The C program capp is used to create automatically peak-pick 2D and 3D NMR experiments. The Auto Peak Pick Dialog contains the most commonly used properties.
A: File Name is the name of the shell script created by xipp that will execute the capp program.B: Show Capp Process Panel will bring up the non-modal Process Panel used to monitor the external process.C: Peak File is used to choose a Peak-Pick file.
D: Assign Peaks using Xipp combines the peak-picking capability of CAPP and the assignment capability of Xipp. CAPP does not and can not assign peaks. However, when this is selected Xipp will attempt to assign every peak that was found by CAPP only if the CAPP created peak-pick table is read in immediately after CAPP runs. When CAPP completes the modal dialog 'Capp Auto Peak-Pick Completed' is displayed and asks if the Peak-Pick should be read in. Click Ok to read in the newly created Peak-Pick file and have Xipp assign each peak (iff Assign Peaks Selected). Click Cancel to not read in the newly created Peak-Pick file and not assign the Capp created Peak-Pick file. After clicking Cancel if you read in the CAPP created Peak-Pick file later it will be unassigned.
E: Write Fitting Details to SIM_RMS creates a file called SIM_RMS which shows how each contour was modeled by an ellipse. This can be used to manually set the Ellipse Fitting properties: Min Radius, Max Radius, Min Radius Ratio, Max Radius Ratio, Max RMS Fit, and Max Circumference Dev.
Most of the rest of the properties are self explanatory.
See the capp.help file for more information concerning the program. The default location for capp.help file is ~/Xipp/Pipp
After changing properties click OK to start capp.

Peak-Pick Labels in Canvas Window
Peak-Pick labels are centered over the peak and identify the peak with the Peak-Pick ID or the assigned atoms for the peak. The frame surrounding the peak label is either a rectangle indicating that the maximum intensity of the peak is on the current slice or an oval indicating that the major intensity is on a different slice. The red mark below or above the oval indicates the direction to look for the maximum intensity of the peak. Use the Canvas Command z to get a Z trace or scroll with Down or Up Arrow Keys to find maximum.
Peak-Pick ID values are shown as an integer such as Peak-Pick ID 97 shown at right whose 15N slice is 33 at 123.76 PPM.
Peak-Pick labels for assigned peaks could belong to a residue such as A26 (on this slice) or to an unassigned Spin-System #11402 on slice 32. Spin-System ID(SS-ID) are always labeled with # to differentiate from Peak-ID and residue ID. By default the SS-ID numbers are always larger than 10,000.
Xipp Canvas Commands
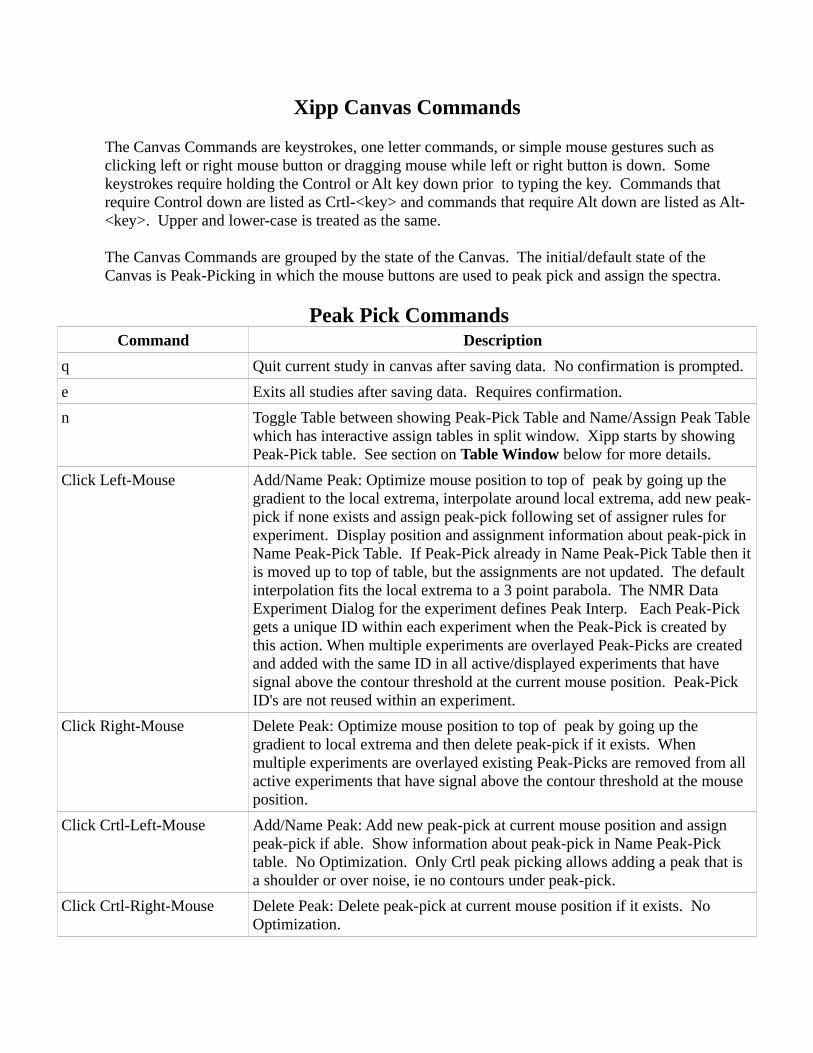
The Canvas Commands are keystrokes, one letter commands, or simple mouse gestures such as clicking left or right mouse button or dragging mouse while left or right button is down. Some keystrokes require holding the Control or Alt key down prior to typing the key. Commands that require Control down are listed as Crtl-<key> and commands that require Alt down are listed as Alt-<key>. Upper and lower-case is treated as the same.
The Canvas Commands are grouped by the state of the Canvas. The initial/default state of the Canvas is Peak-Picking in which the mouse buttons are used to peak pick and assign the spectra.
Peak Pick CommandsCommand Description
q Quit current study in canvas after saving data. No confirmation is prompted.
e Exits all studies after saving data. Requires confirmation.
n Toggle Table between showing Peak-Pick Table and Name/Assign Peak Table which has interactive assign tables in split window. Xipp starts by showing Peak-Pick table. See section on Table Window below for more details.
Click Left-Mouse Add/Name Peak: Optimize mouse position to top of peak by going up the gradient to the local extrema, interpolate around local extrema, add new peak-pick if none exists and assign peak-pick following set of assigner rules for experiment. Display position and assignment information about peak-pick in Name Peak-Pick Table. If Peak-Pick already in Name Peak-Pick Table then it is moved up to top of table, but the assignments are not updated. The default interpolation fits the local extrema to a 3 point parabola. The NMR Data Experiment Dialog for the experiment defines Peak Interp. Each Peak-Pick gets a unique ID within each experiment when the Peak-Pick is created by this action. When multiple experiments are overlayed Peak-Picks are created and added with the same ID in all active/displayed experiments that have signal above the contour threshold at the current mouse position. Peak-Pick ID's are not reused within an experiment.
Click Right-Mouse Delete Peak: Optimize mouse position to top of peak by going up the gradient to local extrema and then delete peak-pick if it exists. When multiple experiments are overlayed existing Peak-Picks are removed from all active experiments that have signal above the contour threshold at the mouse position.
Click Crtl-Left-Mouse Add/Name Peak: Add new peak-pick at current mouse position and assign peak-pick if able. Show information about peak-pick in Name Peak-Pick table. No Optimization. Only Crtl peak picking allows adding a peak that is a shoulder or over noise, ie no contours under peak-pick.
Click Crtl-Right-Mouse Delete Peak: Delete peak-pick at current mouse position if it exists. No Optimization.

Drag Left-Mouse Vector Add/Name Peak with optimization. Used with Fast-Exchange Study. Point mouse at one end of a set of peaks, push down on Left Mouse button and then drag while mouse button is down to opposite end of set of peaks involved in a fast exchange. Since the Fast Exchange Study defines the fraction distance from the initial experiment for each experiment in the series the end-points of the fast exchange series are used to determine the magnitude of change which is used to determine a starting point for each experiment in the series. Since Crtl was not down the initial starting position and ending position of the mouse is optimized by going up the gradient to find the top of the peaks before calculating initial positions of the intermediate experiments. Each initial position of the intermediate experiments is also optimized by going up the gradient to find the local extrema and interpolate. The absolute value of end-points is used to determine vector orientation so that user can start the drag from either end of the set of peaks.
Drag Right-Mouse Vector Delete Peak with optimization. Same as Drag Left Mouse except deletes Peak-Pick from Fast-Exchange Study experiments
Drag Crtl-Left-Mouse Vector Add/Name Peak with NO optimization. See notes for Drag Left-Mouse and note that since Crtl is down there is no optimization in peak position for any experiment in the Fast-Exchange Study.
Drag Crtl-Right-Mouse Vector Delete Peak with NO optimization. Same as Drag Right Mouse except since Crtl is down there is no optimization in peak position for any experiment in the Fast-Exchange Study
Click Alt-Left-Mouse Copy Peak-Pick for Move: Optimize mouse position to top of peak by going up the gradient to local extrema and then copies existing Peak-Pick to Peak Move Buffer. The mouse icon should change and the Name Peak-Pick Table should show the Peak-Pick that was added to Move Buffer. To copy the peak at a new location indicated by mouse use one of the following:Click Left-Mouse Move Peak-Pick after optimize mouse position.
Click Crtl-Left-Mouse Move Peak-Pick to mouse position, no optim.
Drag Left-Mouse Move Peak-Pick over a Vector after optim.
Drag Alt-Left-Mouse Move Peak-Pick over a Vector after optimization and if needed copy PkID and Label from one experiment to another.
Esc Removes Peak-Pick from Move Buffer without copying to new location.
Drag Left Mouse invokes Vector Peak Picking which is used with Fast-Exchange Study to easily peak pick the set of exps. See description above.
Click Crtl-Alt-Left-Mouse Copy Peak-Pick for Move with NO optimization. This is same as Click Alt-Left-Mouse, but does not optimize position. This is useful if the Peak-Pick was copied from different conditions and is not over the peak. Only Crtl peak picking allows selecting a peak that is over noise, ie no contours under peak-pick.

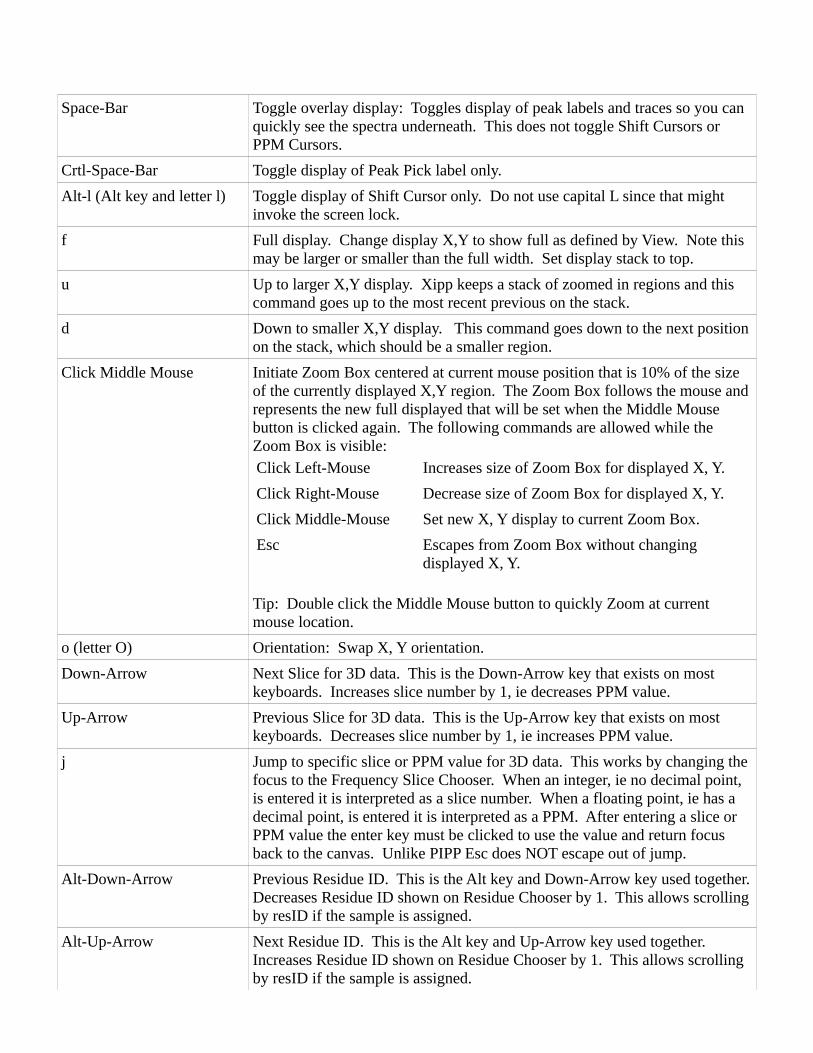
Space-Bar Toggle overlay display: Toggles display of peak labels and traces so you can quickly see the spectra underneath. This does not toggle display Shift Cursors or PPM Cursors.
Crtl-Space-Bar Toggle display of Peak Pick label only.
Alt-l (Alt key and letter L) Toggle display of Shift Cursor only.
f Full display. Change display X,Y to show full as defined by View. Note this may be larger or smaller than the full width. Set display stack to top.
u Up to larger X,Y display. Xipp keeps a stack of zoomed in regions and this command goes up to the most recent previous on the stack.
d Down to smaller X,Y display. This command goes down to the next position on the stack, which should be a smaller region.
Click Middle Mouse Initiate Zoom Box centered at current mouse position that is 10% of the size of the currently displayed X,Y region. The Zoom Box follows the mouse and represents the new full displayed that will be set when the Middle Mouse button is clicked again. To modify size or set the Zoom Box use:Click Left-Mouse Increases size of Zoom Box for displayed X, Y.
Click Right-Mouse Decrease size of Zoom Box for displayed X, Y.
Click Middle-Mouse Set new X, Y display to current Zoom Box.
Esc Escapes from Zoom Box without changing displayed X, Y.
Tip: Double click the Middle Mouse button to quickly Zoom at current mouse location.
o (letter O) Orientation: Swap X, Y orientation.
Down-Arrow Next Slice for 3D data. This is the Down-Arrow key that exists on most keyboards. Increases slice number by 1, ie decreases PPM value.
Up-Arrow Previous Slice for 3D data. This is the Up-Arrow key that exists on most keyboards. Decreases slice number by 1, ie increases PPM value.
j Jump to specific slice or PPM value for 3D data. This works by changing the focus to the Frequency Slice Chooser. When an integer, ie no decimal point, is entered it is interpreted as a slice number. When a floating point, ie has a decimal point, is entered it is interpreted as a PPM. After entering a slice or PPM value the enter key must be clicked to use the value and return focus back to the canvas. Unlike PIPP Esc does NOT escape out of jump.
Alt-Down-Arrow Previous Residue ID. This is the Alt key and Down-Arrow key used together. Decreases Residue ID shown on Residue Chooser by 1. This allows scrolling by resID if the sample is assigned.
Alt-Up-Arrow Next Residue ID. This is the Alt key and Up-Arrow key used together. Increases Residue ID shown on Residue Chooser by 1. This allows scrolling by resID if the sample is assigned.

Alt-j Jump to specific Residue ID or Spin-System ID (SSID). This is the Alt key and j key used together and often referred to as res jumping.
h Horizontal Trace. Display trace going horizontally at current mouse position. See Trace Commands below.
v Vertical Trace. Display trace going vertically at current mouse position. See Trace Commands below.
z Perpendicular Trace along Z axis. Display a Z trace at current mouse position horizontally. See Trace Commands below.
a Perpendicular Trace along A axis. Display an A trace at current mouse position horizontally. See Trace Commands below.
Crtl-h Horizontal Cursor. Just shows a horizontal line at the current mouse position that can be dragged with Left-Mouse. Use Esc to get rid of Cursor. This can be used to determine if multiple peaks have same HN when they are far away on 13C axis. The Cursor stays at a specific PPM regardless of Zoom.
Crtl-v Vertical Cursor. Just shows a vertical line at the current mouse position that can be dragged with Left-Mouse. Use Esc to get rid of Cursor.

Trace Commands
The Trace Commands are active whenever there is a Trace. Multiple traces along the same direction can occur from multiple spectra being overlayed. The selected Trace is drawn in red. The non-selected traces are drawn in light blue. If no traces are observed after initiating Trace then use Space-Bar to toggle display of overlay. Xipp does not automatically toggle on overlay if they were off when Trace was initiated.The figure above shows a single Horizontal Trace. The lower Red line is where the trace is selected from the NMR data. The zero intensity is the red line shown touching the baseline of the trace. The HHC-No just outside the spectrum that is centered on the baseline of the trace is the trace label box described below which is used to choose the selected trace when multiple traces are displayed.
Esc Escape from Trace Commands. This will remove all traces from display and revert to Peak Pick Commands.
Click Left-Mouse Select new Trace at current Mouse position. For Horizontal Trace this will use the Y mouse position to select a trace. For Vertical Trace this will use the X mouse position to select a trace. For Z or A Trace this use the X,Y mouse position to select a new Trace. All Traces, selected and non selected, are modified by this.
Drag Left-Mouse Continuously select a new Horizontal or Vertical Trace as mouse position changes. For Z or A Trace a new Trace is selected at position where Left Mouse button is released, ie no Z traces as mouse moves. All Traces, selected and non selected, are modified by this.
Click Right-Mouse Select a Trace. The mouse must be inside the box that labels the trace in order to select that trace. The trace label box is shown over the PPM reference and is centered at the zero intensity value for the trace. As the trace is offset by use of Drag Right-Mouse outside displayed region the trace label box moves as well. This command has no effect if the mouse is outside the trace label box.
Drag Right-Mouse If mouse is over trace this will modify scale of trace so that data point of trace matches mouse position. The scale is determined by the selected Trace, but all Traces are scaled by the same amount. If mouse is outside displayed region, ie over PPM reference labels, then position of trace is moved up or down for Horizontal Trace or position of Vertical Trace is moved left or right depending on direction that mouse is dragged. This changing the offset for the selected trace only.
Space-Bar Toggle overlay display: Toggles display of peak labels and traces so you can quickly see the spectra underneath. This does not toggle Shift Cursors or PPM Cursors.
Crtl-Space-Bar Toggle display of Peak Pick label only.
Alt-l (Alt key and letter l) Toggle display of Shift Cursor only. Do not use capital L since that might invoke the screen lock.
f Full display. Change display X,Y to show full as defined by View. Note this may be larger or smaller than the full width. Set display stack to top.
u Up to larger X,Y display. Xipp keeps a stack of zoomed in regions and this command goes up to the most recent previous on the stack.
d Down to smaller X,Y display. This command goes down to the next position on the stack, which should be a smaller region.
Click Middle Mouse Initiate Zoom Box centered at current mouse position that is 10% of the size of the currently displayed X,Y region. The Zoom Box follows the mouse and represents the new full displayed that will be set when the Middle Mouse button is clicked again. The following commands are allowed while the Zoom Box is visible:Click Left-Mouse Increases size of Zoom Box for displayed X, Y.
Click Right-Mouse Decrease size of Zoom Box for displayed X, Y.
Click Middle-Mouse Set new X, Y display to current Zoom Box.
Esc Escapes from Zoom Box without changing displayed X, Y.
Tip: Double click the Middle Mouse button to quickly Zoom at current mouse location.
o (letter O) Orientation: Swap X, Y orientation.
Down-Arrow Next Slice for 3D data. This is the Down-Arrow key that exists on most keyboards. Increases slice number by 1, ie decreases PPM value.
Up-Arrow Previous Slice for 3D data. This is the Up-Arrow key that exists on most keyboards. Decreases slice number by 1, ie increases PPM value.
j Jump to specific slice or PPM value for 3D data. This works by changing the focus to the Frequency Slice Chooser. When an integer, ie no decimal point, is entered it is interpreted as a slice number. When a floating point, ie has a decimal point, is entered it is interpreted as a PPM. After entering a slice or PPM value the enter key must be clicked to use the value and return focus back to the canvas. Unlike PIPP Esc does NOT escape out of jump.
Alt-Down-Arrow Previous Residue ID. This is the Alt key and Down-Arrow key used together. Decreases Residue ID shown on Residue Chooser by 1. This allows scrolling by resID if the sample is assigned.
Alt-Up-Arrow Next Residue ID. This is the Alt key and Up-Arrow key used together. Increases Residue ID shown on Residue Chooser by 1. This allows scrolling by resID if the sample is assigned.

Alt-j Jump to specific Residue ID or Spin-System ID (SSID). This is the Alt key and j key used together and often referred to as res jumping.
h Horizontal Trace. Display trace going horizontally at current mouse position. Yes, you can create multiple traces along same or different axis, but only one trace can be selected at a time. A single Esc will escape from all Traces
v Vertical Trace. Display trace going vertically at current mouse position. Yes, you can create multiple traces along same or different axis, but only one trace can be selected at a time. A single Esc will escape from all Traces
z Perpendicular Trace along Z axis. Display a Z trace at current mouse position horizontally. Yes, you can create multiple traces along same or different axis, but only one trace can be selected at a time. A single Esc will escape from all Traces
a Perpendicular Trace along A axis. Display an A trace at current mouse position horizontally. Yes, you can create multiple traces along same or different axis, but only one trace can be selected at a time. A single Esc will escape from all Traces
Crtl-h Horizontal Cursor. Just shows a horizontal line at the current mouse position that can be dragged with Left-Mouse. Use Esc to get rid of Cursor. This can be used to determine if multiple peaks have same HN when they are far away on 13C axis. The Cursor stays at a specific PPM regardless of Zoom. Yes, you can mix Traces and Cursors. A single Esc will escape from all Traces and Cursors.
Crtl-v Vertical Cursor. Just shows a vertical line at the current mouse position that can be dragged with Left-Mouse. Yes, you can mix Traces and Cursors. A single Esc will escape from all Traces and Cursors.
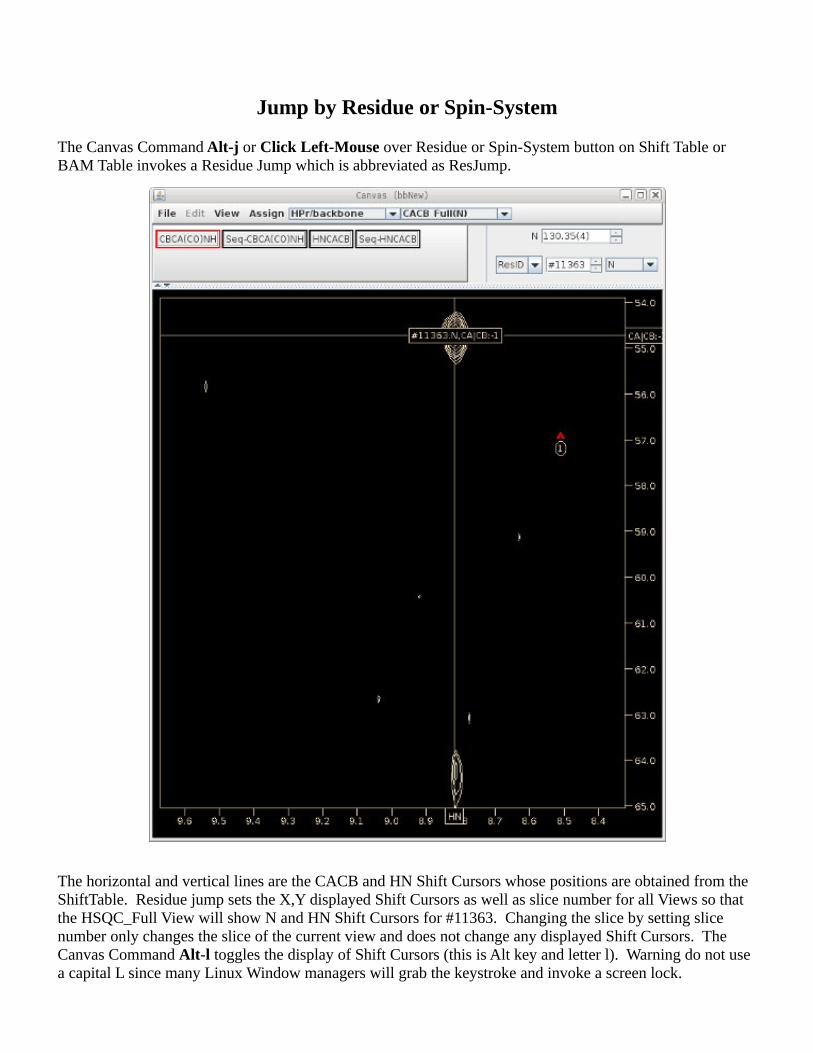
Jump by Residue or Spin-System
The Canvas Command Alt-j or Click Left-Mouse over Residue or Spin-System button on Shift Table or BAM Table invokes a Residue Jump which is abbreviated as ResJump.
The horizontal and vertical lines are the CACB and HN Shift Cursors whose positions are obtained from the ShiftTable. Residue jump sets the X,Y displayed Shift Cursors as well as slice number for all Views so that the HSQC_Full View will show N and HN Shift Cursors for #11363. Changing the slice by setting slice number only changes the slice of the current view and does not change any displayed Shift Cursors. The Canvas Command Alt-l toggles the display of Shift Cursors (this is Alt key and letter l). Warning do not use a capital L since many Linux Window managers will grab the keystroke and invoke a screen lock.

Table Window
The initial view is the Peak-Pick Table which shows one line for each Peak-Pick on current slice in zoomed in region.
The Canvas Command n toggles between the Peak-Pick Table shown at right and the Assign/Name Table shown below.
The Assign/Name Peak Table is split with assignments and study specific tables in tabs above the Name Peak-Pick Table. For Backbone Assign Study the tabs in the top show the ShiftTable with all assigned shifts and in a separate tab the BAMTable which is the Backbone Assign Map Table.
Click Left-Mouse on Residue button to jump to that Residue in the Canvas Window. Equivalent to Canvas Command Alt-j followed by typing the residue number.
The bottom of the Assign/Name Peak Table always shows the Name Peak-Pick Table which gives information about peaks that have been recently picked with the mouse in the Canvas Window. This is equivalent to the information shown in PIPP's Name mode which is why the Canvas Command to toggle the table is n.
Name Peak Table Buttons
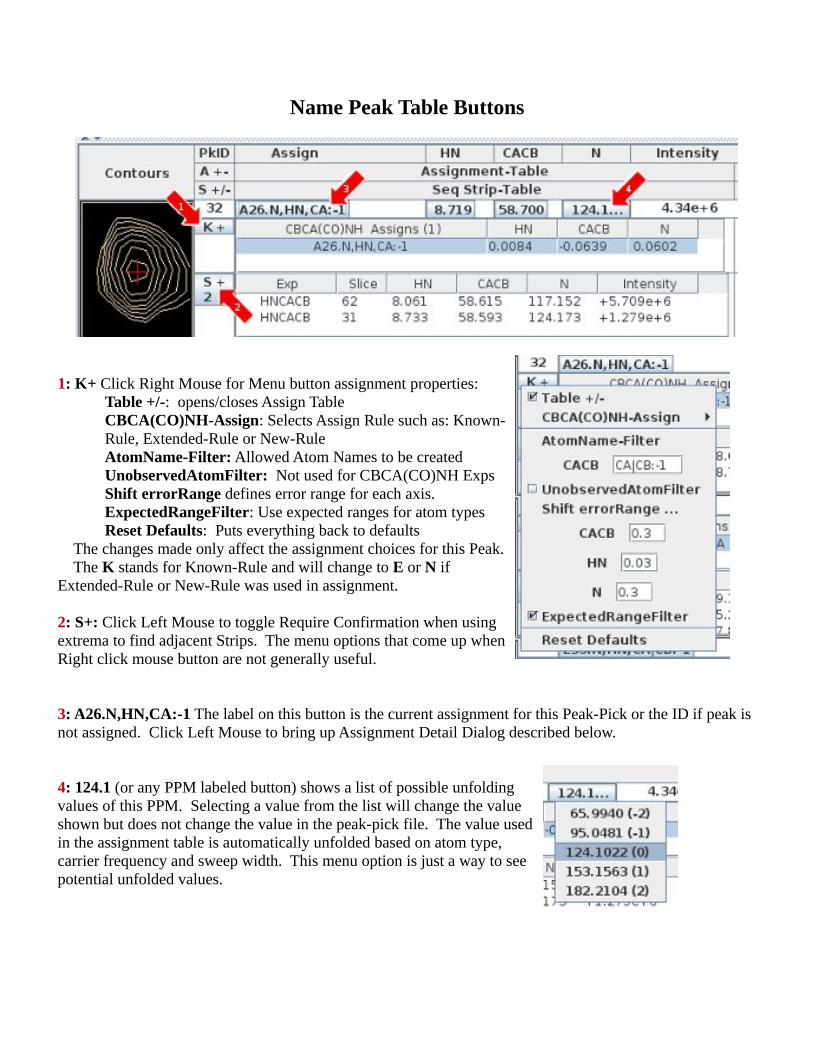
1: K+ Click Right Mouse for Menu button assignment properties:Table +/-: opens/closes Assign TableCBCA(CO)NH-Assign: Selects Assign Rule such as: Known-Rule, Extended-Rule or New-RuleAtomName-Filter: Allowed Atom Names to be createdUnobservedAtomFilter: Not used for CBCA(CO)NH ExpsShift errorRange defines error range for each axis.ExpectedRangeFilter: Use expected ranges for atom typesReset Defaults: Puts everything back to defaults
The changes made only affect the assignment choices for this Peak. The K stands for Known-Rule and will change to E or N if Extended-Rule or New-Rule was used in assignment.
2: S+: Click Left Mouse to toggle Require Confirmation when using extrema to find adjacent Strips. The menu options that come up when Right click mouse button are not generally useful.
3: A26.N,HN,CA:-1 The label on this button is the current assignment for this Peak-Pick or the ID if peak is not assigned. Click Left Mouse to bring up Assignment Detail Dialog described below.
4: 124.1 (or any PPM labeled button) shows a list of possible unfolding values of this PPM. Selecting a value from the list will change the value shown but does not change the value in the peak-pick file. The value used in the assignment table is automatically unfolded based on atom type, carrier frequency and sweep width. This menu option is just a way to see potential unfolded values.

Assignment Detail Dialog
This is obtained by clicking on the Peak-Pick assignment button in the Name Peak Table.
1: Click this button to bring up Residue Change Dialog to change Residue/Moiety of assignment of Peak.
2, 3, 4: Click any of these buttons to bring up the Select Atom Dialog to change atom assignment.
5: Click this ComboBox to select units for table from options: PPM, Hz, Pts. This does not change units shown in Peak-Pick table
6: Click this to have PeakPick unfolded to match table or have table folded to match peak-Pick. This only affects the table shown on this dialog it does not affect PeakPick Table.
7: Click this ComboBox to select the assignment Rule from Known-Rule, Extended-Rule or New-Rule.
8: Click one of the mutually exclusive buttons under Results to show the possible assignments in the Assign Table at that point in the assigner Rule.
9: Select an assignment in the Assign Table to change the assignment of the Peak-Pick. The entries in the Assign Table get updated based on Assigner Rule and Results button selected.
Click OK when the desired Peak-Pick assignment is shown at the top in 1.

Change Residue Dialog
This is obtained from a variety buttons and is used to select or change the Residue or Moiety. In this case the Change Residue Dialog was obtained by clicking the Assign button from Assignment Detail Dialog, button with red arrow labeled 1 shown above.
1: Click this Select button to choose the residue number that has been previously entered to the left.
2: Click this Select button to choose a Moiety/Spin-System number that has been previously entered to the left. If Moiety # is invalid button will be inactive.
3: Click this Select button to create a New Moiety/Spin-System with id #12250.
Immediately after any Select button is released this dialog closes and notifies the calling action of the selection.
Click Cancel to return to previous dialog with out making a selection.

Select Atom Dialog
This is obtained from a variety buttons and is used to select an atom for assignment. In this case the Change Atom Dialog was obtained by clicking the Atom Assigned button from Assignment Detail Dialog, button with red arrow labeled 3 shown above. The atom selected can be an existing atom from section B or a new atom will be created if selected from section C. The sections B and C are mutually excelusive.
1: The selected atom label at the top will always show the name of the atom(s) selected and should be verified before clicking OK.
There are three distinct sections to this dialog. Section A provides control over what atoms are shown in sections B and C. Section B provides a list of toggle buttons for existing atoms to select from Moieties defined in 2. Section C provides a list of toggle buttons for new atom namess to create in Moiety shown at 6. The atom names shown in section C is the intersection of the set from those defined in section A and the monomer type(s) shown at 7. For instance if Monomer(s) is set to all monomers and the Moiety is set to a Gly residue then only atoms from Gly are shown. Selections from section B and C are mutually exclusive. You either use an existing atom from section B or create a new atom from section C. Within sections B and C single or multiple selections are allowed. If multiple atoms are selected in section B then an ambiguous atom is created and added to the Moiety.

1: The selected atom label will always show the name of the atom(s) selected and should be verified before clicking OK.
A: Controls which atom names are shown in sections B and C.2: Click this to change the Moiety used to select existing atoms which will also change the Moiety for new atoms shown at 6. Up to 4 moieties can be defined by increasing Spinner before Moieties.3: Select atom types to show. Default type is always same as original atom.4: Select this to show individual atom names in methyl groups.
B: List of Existing Atoms to select. Selecting one of these will toggle on 5 Select Existing Atom.5: Flag to indicate that an existing atom or atoms will be used.Selecting more than one atom in section B will create an ambiguous atom in this Moiety.
C: List of New Atoms to create in Moiety shown in 6.6: ComboBox defines Moiety to put newly created atom. Choose from list of all Moieties defined in 2. 7: Click this button to bring up the Select Monomer Dialog8: Add new atoms at a residue offset from current Moiety/Spin-System, ie CA|CB:-1
Click OK to accept selected atom label shown at 1. Click Cancel to exit without making a selection.

Select Monomer(s) Dialog
This is obtained by clicking the Show Atoms from Monomer(s) button from Select Atom Dialog, with red arrow labeled 7 shown above.
The selected monomer label identified by red arrow above should be verified before clicking OK.
The two buttons 'Select All' and 'Clear Selections' do as expected.
The toggle buttons allow for multiple selections.

BAMTable: Backbone Assign Map
The BAMTable tab is specific to the Backbone Assign Study and is used to facilitate manual backbone assignments. The BAMTable shows 1 row for each SS-ID (Spin-System ID). The table is sorted to show all residues in sequence followed by all unassigned SS-ID. Assigned SS-ID are shown on row with their assigned Res-ID. An SS-ID is only shown on 1 row, ie can only be assigned to one Res-ID at a time.
Click Left-Mouse on Res-ID or SS-ID button to jump to that Residue or Spin-System in the Canvas Window. Equivalent to Canvas Command Alt-j followed by typing residue number or typing # with SS-ID for unassigned Spin-Systems. The Canvas Alt-j can not use # SS-ID for assigned Spin-Systems because the ShiftTable used for ResJump does not know about assigned Spin-Systems. Only the BAMTable which has a Backbone Assign Map knows the SS-ID of assigned Spin-Systems. When the Left-Mouse is used on an assigned Spin-System in the BAMTable the Res-ID is used for the ResJump.
The unassigned SS-ID are listed in numerical order after the last Res-ID.

Click Right-Mouse on Res-ID or SS Button
These menu commands with the Res-ID and SS-ID buttons form the basis for manual backbone assignment and are described in greater detail in the backboneAssignStudy document.
Assign Res-ID by Click Right-Mouse and select desired assigned or unassigned Spin-System.
Click Right-Mouse over SS-ID → Find Prev SS-ID and select an SS-ID from list of possible previous Spin-Systems. Selecting a Prev SS-ID from list will jump to E25 and initialize Seq-* Experiments to show on Canvas if Spin-Systems are sequential. In addition the Name Peak-Pick is updated with assigned Peak-Picks from E25.
Click Right-Mouse over SS-ID → Prev ResTypes to show possible residue type of previous Spin-System. This does not set the residue type, it only shows what residue types are consistent with the CA:-1 and CB:-1 shift.