
Xiaofei Hu, Aziz Dogan Ilgun, Alberto Passalacqua*, Rodney ...
15
Xiaofei Hu, Aziz Dogan Ilgun, Alberto Passalacqua*, Rodney O. Fox, Francesco Bertola, Miran Milosevic and Frans Visscher CFD simulations of stirred-tank reactors for gas- liquid and gas-liquid-solid systems using OpenFOAM ® https://doi.org/10.1515/ijcre-2019-0229 Received December 26, 2019; accepted November 25, 2020; published online February 5, 2021 Abstract: An open-source CFD software OpenFOAM ® is used to simulate two multiphase stirred-tank reactors relevant to industrial processes such as slurry polymeri- zation and fuel production. Gas-liquid simulations are first performed in a single-impeller stirred-tank reactor, studied experimentally by Ford, J. J., T. J. Heindel, T. C. Jensen, and J. B. Drake. 2008. “X-Ray Computed Tomog- raphy of a Gas-Sparged Stirred-Tank Reactor.” Chemical Engineering Science 63: 2075–85. Three impeller rotation speeds (200, 350 and 700 rpm) with three different bubble diameters (0.5, 1.5 and 2.5 mm) are investigated. Flow patterns compared qualitatively to those from experi- ments. Compared to the experimental data, the simula- tions are in relatively good agreement for gas holdup in the reactor. The second multiphase system is a multi- impeller stirred-tank reactor, studied experimentally by Shewale, S. D., and A. B. Pandit. 2006. “Studies in Mul- tiple Impeller Agitated Gas-Liquid Contractors.” Chemical Engineering Science 61: 486–504. Gas-liquid simulations are performed at two impeller rotation speeds (3.75 and 5.08 RPS). The simulated flow patterns agree with pub- lished pictures from the experiments. Gas-liquid-solid simulations of the multi-impeller stirred-tank reactor are also carried out at impeller rotation speed 5.08 RPS. The addition of solid particles with a volume fraction char- acteristic of slurry reactors changes the flow pattern significantly. The bottom Rushton turbine becomes floo- ded, while the upper pitched-blade downflow turbines present a radial-pumping flow pattern instead of down- pumping. Nonetheless, the solid phase has a similar flow pattern to the liquid phase, indicating that the particles modify the effective density of the fluid. Keywords: gas-liquid flow; gas-liquid-solid flow; multi-fluid model; multiphase CFD simulations; multiple impellers; stirred-tank reactor. 1 Introduction Stirred-tank reactors (STRs) are widely used in industrial processes, such as in the chemical, biological, pharmaceu- tical, as well as many other industries. Usually, multiphase systems are of most interest in these processes, including two- phase (gas-liquid/gas-solid/solid-liquid/liquid-liquid) sys- tems and three-phase (gas-liquid-solid) systems (Achouri et al. 2012; You et al. 2014). Gas-liquid STRs with a single impeller have been studied extensively using experiments. Investigations of the effects of reactor parameters and oper- ating conditions such as the geometry of the tank, impeller type, size and location, impeller rotation speed and gas flow rate on the reactor characteristics including flow regimes and patterns, gas hold-up, power-consumption, mixing time and mass-transfer coefficient between the phases have been car- ried out for decades (Ford et al. 2008; Joshi et al. 2011a; Kumaresan and Joshi 2006; Miller 1974; Nienow et al. 1985; Nienow 1998; Parasu-Veera, Patwardhan, and Joshi 2001; Rewatkar et al. 1993; Sawant and Joshi 1979). For large-scale, tall-thin, industrial gas-liquid STRs, multiple impellers are usually preferred over a single impeller because multiple impellers can have better gas utilization due to the high residence time of gas bubbles, maintain homogeneity in the reactor, provide high surface-to-volume ratio and offer lower shear than single-impeller STRs for shear-sensitive systems (Ahmed et al. 2010; Dutta and Pangarkar 1995; Himmelsbach et al. 2006; Kasat and Pandit 2004; Khopkar et al. 2006; *Corresponding author: Alberto Passalacquaa, Department of Mechanical Engineering, Iowa State University, 2529 Union Dr, Ames, IA 50011-2030, USA, E-mail: [email protected] Xiaofei Hu, Department of Mechanical Engineering, Iowa State University, 2529 Union Dr, Ames, IA 50011-2030, USA Aziz Dogan Ilgun, Department of Mechanical Engineering, Iowa State University, 2529 Union Dr, Ames, IA 50011-2030, USA; and Department of Chemical and Biological Engineering, Iowa State University, 618 Bissell Rd, Ames, IA 50011-1098, USA. https:// orcid.org/0000-0002-9500-5095 Rodney O. Fox, Department of Chemical and Biological Engineering, Iowa State University, 618 Bissell Rd, Ames, IA 50011-1098, USA Francesco Bertola, Miran Milosevic and Frans Visscher, SABIC, Urmonderbaan 22, P.O. Box 319, 6160 AH, Geleen, The Netherlands Int. J. Chem. React. Eng. 2021; 19(2): 193–207 Open Access. © 2021 Xiaofei Hu et al., published by De Gruyter. This work is licensed under the Creative Commons Attribution 4.0 International License.
Transcript of Xiaofei Hu, Aziz Dogan Ilgun, Alberto Passalacqua*, Rodney ...
Xiaofei Hu, Aziz Dogan Ilgun, Alberto Passalacqua*, Rodney O. Fox, Francesco Bertola,Miran Milosevic and Frans Visscher
CFD simulations of stirred-tank reactors for gas-liquid and gas-liquid-solid systems usingOpenFOAM®
https://doi.org/10.1515/ijcre-2019-0229Received December 26, 2019; accepted November 25, 2020;published online February 5, 2021
Abstract: An open-source CFD software OpenFOAM® isused to simulate two multiphase stirred-tank reactorsrelevant to industrial processes such as slurry polymeri-zation and fuel production. Gas-liquid simulations arefirst performed in a single-impeller stirred-tank reactor,studied experimentally by Ford, J. J., T. J. Heindel, T. C.Jensen, and J. B. Drake. 2008. “X-Ray Computed Tomog-raphy of a Gas-Sparged Stirred-Tank Reactor.” ChemicalEngineering Science 63: 2075–85. Three impeller rotationspeeds (200, 350 and 700 rpm) with three different bubblediameters (0.5, 1.5 and 2.5 mm) are investigated. Flowpatterns compared qualitatively to those from experi-ments. Compared to the experimental data, the simula-tions are in relatively good agreement for gas holdup inthe reactor. The second multiphase system is a multi-impeller stirred-tank reactor, studied experimentally byShewale, S. D., and A. B. Pandit. 2006. “Studies in Mul-tiple Impeller Agitated Gas-Liquid Contractors.” ChemicalEngineering Science 61: 486–504. Gas-liquid simulationsare performed at two impeller rotation speeds (3.75 and5.08 RPS). The simulated flow patterns agree with pub-lished pictures from the experiments. Gas-liquid-solidsimulations of the multi-impeller stirred-tank reactor arealso carried out at impeller rotation speed 5.08 RPS. The
addition of solid particles with a volume fraction char-acteristic of slurry reactors changes the flow patternsignificantly. The bottom Rushton turbine becomes floo-ded, while the upper pitched-blade downflow turbinespresent a radial-pumping flow pattern instead of down-pumping. Nonetheless, the solid phase has a similar flowpattern to the liquid phase, indicating that the particlesmodify the effective density of the fluid.
Keywords: gas-liquid flow; gas-liquid-solid flow; multi-fluidmodel; multiphase CFD simulations; multiple impellers;stirred-tank reactor.
1 Introduction
Stirred-tank reactors (STRs) are widely used in industrialprocesses, such as in the chemical, biological, pharmaceu-tical, as well as many other industries. Usually, multiphasesystemsareofmost interest in theseprocesses, including two-phase (gas-liquid/gas-solid/solid-liquid/liquid-liquid) sys-tems and three-phase (gas-liquid-solid) systems (Achouriet al. 2012; You et al. 2014). Gas-liquid STRs with a singleimpeller have been studied extensively using experiments.Investigations of the effects of reactor parameters and oper-ating conditions such as the geometry of the tank, impellertype, size and location, impeller rotation speed and gas flowrate on the reactor characteristics including flow regimes andpatterns, gas hold-up, power-consumption, mixing time andmass-transfer coefficient between the phases have been car-ried out for decades (Ford et al. 2008; Joshi et al. 2011a;Kumaresan and Joshi 2006; Miller 1974; Nienow et al. 1985;Nienow 1998; Parasu-Veera, Patwardhan, and Joshi 2001;Rewatkar et al. 1993; Sawant and Joshi 1979). For large-scale,tall-thin, industrial gas-liquid STRs, multiple impellers areusually preferred over a single impeller because multipleimpellers can have better gas utilization due to the highresidence time of gas bubbles, maintain homogeneity in thereactor, provide high surface-to-volume ratio and offer lowershear than single-impeller STRs for shear-sensitive systems(Ahmed et al. 2010; Dutta and Pangarkar 1995; Himmelsbachet al. 2006; Kasat and Pandit 2004; Khopkar et al. 2006;
*Corresponding author: Alberto Passalacquaa, Department ofMechanical Engineering, Iowa State University, 2529 Union Dr, Ames,IA 50011-2030, USA, E-mail: [email protected] Hu, Department of Mechanical Engineering, Iowa StateUniversity, 2529 Union Dr, Ames, IA 50011-2030, USAAziz Dogan Ilgun, Department of Mechanical Engineering, Iowa StateUniversity, 2529 Union Dr, Ames, IA 50011-2030, USA; andDepartment of Chemical and Biological Engineering, Iowa StateUniversity, 618 Bissell Rd, Ames, IA 50011-1098, USA. https://orcid.org/0000-0002-9500-5095Rodney O. Fox, Department of Chemical and Biological Engineering,Iowa State University, 618 Bissell Rd, Ames, IA 50011-1098, USAFrancesco Bertola, Miran Milosevic and Frans Visscher, SABIC,Urmonderbaan 22, P.O. Box 319, 6160 AH, Geleen, The Netherlands
Int. J. Chem. React. Eng. 2021; 19(2): 193–207
Open Access. © 2021 Xiaofei Hu et al., published by De Gruyter. This work is licensed under the Creative Commons Attribution 4.0 InternationalLicense.

Shewale and Pandit 2006; You et al. 2014). However, thecomplexity of the flow in STRs with multiple impellers in-creaseswith increasing number of impellers as any change inthe reactor parameters, such as tank aspect ratio, number,type, size, location and configuration of impellers and oper-ating conditions, may influence the reactor operating char-acteristics significantly. Therefore, many researchers havestudied multiple-impeller STRs experimentally (Kasat andPandit 2004; Shewale and Pandit 2006; Vr’abel et al., 1999,2000; You et al. 2014) for gas-liquid two-phase flows. On theother hand, experiments of gas-liquid-solid STRs with singleor multiple impellers are reported less in the literature thangas-liquidSTRs (Boyer,Duquennt, andWild 2002; Chen,Bao,and Gao 2009; Conway, Kyle, and Rielly 2002; Dohi et al.,2002, 2004; Dutta and Pangarkar 1995; Fishwick, Winter-bottom, and Stitt 2003; Joshi et al. 2011a; Micale et al. 2000;Nienow and Bujalski 2002; Rewatkar and Joshi 1992), as theaddition of a solid phase increases the flow complexity in thereactor and greatly limits the range of optical-based mea-surement techniques that can be applied.
Computational fluid dynamics (CFD) simulation isanother approach to study mixing and fluid dynamics inSTRs. While, many single-phase CFD simulations of STRswith single or multiple impellers has been reported inliterature, for gas-liquid systems the main focus isdevoted to single impeller STRs (Achouri et al. 2012; Arlov,Revstedt, and Fuchs 2008; Bakker and Van Den Akker1994; Gosman et al. 1992; Jahoda, Tomaskove, and Moste2009; Jahoda et al. 2007; Joshi et al. 2011a; K’alal, Jahoda,and Fort 2014; Lane, Schwarz, and Evans 2005; Luo, Issa,and Gosman 1994; Moilanen et al. 2008; Murthy and Joshi2008; Petitti et al. 2013; Ranade and Van Den Akker 1994;Scargiali et al. 2007; Tyagi et al. 2007) and in thesestudies, the effects of reactor parameters and operatingconditions, and different models such as turbulencemodels, drag correlations and bubble coalescence andbreakagemodels have been studied. Asmentioned above,due to complicated flow regimes and patterns in gas-liquid STRs with multiple impellers, not as many works asfor single-impeller STRs are reported in the literature(Ahmed et al. 2010; Joshi et al. 2011b; Kerdouss, Bannaari,and Proulx 2006; Khopkar and Tanguy 2008; Khopkaret al. 2006; Min et al. 2008; Tyagi et al. 2007). Even more,for gas-liquid-solid systems, very few studies are reportedfor single-impeller STRs (Murthy, Ghadge, and Joshi 2007;Panneerselvam, Savithri, and Surender 2009) while formulti-impeller STRs, works found in the literature are verylimited and almost all of these studies are performed us-ing commercial CFD software, such as ANSYS FLUENT®
and CFX®.
In this work, an open-source CFD software, Open-FOAM®, is used to numerically investigate two stirred-tankreactors studied experimentally (Ford et al. 2008; Shewaleand Pandit 2006), but also of interest for industrial appli-cations such as slurry reactors. Gas-liquid simulations arefirst performed in a single-impeller STR, reported in (Fordet al. 2008). Then a multi-impeller STR, studied experi-mentally by (Shewale and Pandit 2006), is simulated forboth gas-liquid and gas-liquid-solid systems. However, itshould be noted, in their study, Shewale and Pandit (2006)only studied gas-liquid two phase system. On the otherhand, in this study, in order to observe the effect of theaddition of solid phase to the gas and liquid phase indi-vidually, three-phase (gas-liquid-solid) simulations arealso presented. In the remainder of this work, Section 2describes modeling of the multiphase system. The equa-tions used to model the system are outlined. Section 3 in-troduces the two simulated STRs, and the simulationconditions are described in detail. Section 4 discusses thesimulation results, where Section 4.1 presents results ob-tained in the single-impeller STR and comparison to ex-periments, and Section 4.2 presents gas-liquid simulationresults of the multi-impeller STR. Gas-liquid-solid simula-tions are discussed in Section 4.3. Conclusions are drawn inSection 5. Results for parameters outside the range re-ported in the main text are available in the SupplementaryMaterials.
2 Modeling of the multiphasesystem
2.1 Governing equations
The Eulerian multi-fluid method (Drew 1983) is used tomodel the systems in this work. All phases are treated asinterpenetrating continua and represented by their volumefractions. The governing equations are summarized below.
The continuity equations are written as
∂
∂( αkρk) + ∇ ⋅ ( αkρkUk) = 0 (1)
where αk, ρk and Uk are the volume fraction, density andvelocity of the gas (k = g), liquid (k = l) and solid phase(k = s), respectively.
The momentum equation is written as
∂
∂t( αkρkUk) + ∇ ⋅ ( αk ρkUkUk)= −αk ∇ p + ∇ ⋅ ( αkτk) + αkρkg +Mjk (2)
194 X. Hu et al.: CFD simulations of stirred-tank reactors

where p is the shared pressure, τk is the stress tensor ofphase k, g is the acceleration due to gravity and Mjk rep-resents the momentum exchange between phases j and k.The momentum exchange between phases can includecontributions from the following forces: drag, lift, virtualmass, turbulent dispersion and wall lubrication. In thiswork, drag, virtual mass and turbulent-dispersion forcesare included. The buoyancy force results in the shared-pressure term in Eq. (2). The turbulent-dispersion force isrequired to ensure that the multi-fluid model is hyperbolicwhen a separate bubble pressure is not employed. Due tothe intense mixing provided by the impellers, other ex-change forces such as lift were neglected.
2.1.1 Interphase drag correlation
The drag force between the gas and liquid, or the solid andliquid phases is expressed as
FDkl = Kkl(Uk − Ul)
where the dispersed phase can be the gas (k = g) or solidphase (k = s), and the coefficientKkl depends on the specificdrag correlation.
The drag correlation of (Tomiyama et al. 1998) is usedfor the drag force between the gas and liquid phases:
Kgl = 34CD
αgρldg
Ug − Ul
(3)
where dg is the diameter of gas bubbles, and the drag co-efficient CD is
CD = max{24Re
( 1 + 0.15Re0.687), 83
EoEo + 4
} (4)
The bubble Reynolds number Re and Eötvös numberEo are defined as
Re = ρldg
Ug − Ul
μl
Eo =g( ρl − ρg)d2
g
σ
with μl and σ being viscosity and surface tension,respectively.
TheWen and Yu drag correlation (Wen and Hu 1966) isused for fluid-solid interactions:
Ksl = 34CD
αsαlρlds
|Us − Ul|α−2.65l (5)
where
CD =⎧⎪⎪⎨⎪⎪⎩
24Re
(1 + 0.15Re)0.687 Re < 1000
0.44 Re ≥ 1000
⎫⎪⎪⎬⎪⎪⎭ (6)
and the slip Reynolds number Re is
Re = αlρlds|Us − Ul|μl
with ds being the representative particle diameter (taken tobe constant).
2.1.2 Virtual mass force
A constant virtual-mass coefficient (CVM = 0.5) (Drew andLahey 1987) is used to account for the gas-liquid virtualmass force, defined by
FVMgl = CVMαgρl(DUg
Dt−DUl
Dt) (7)
where DDt represents the material derivative based on each
velocity field.
2.1.3 Turbulent-dispersion force
The gas-liquid turbulent-dispersion force can be expressedas
FTDgl = CTDαgρlkl ∇ αg (8)
where a constant turbulent-dispersion coefficient(CTD = 1.0) (Burns et al. 2004) is used, and kl is the turbulentkinetic energy of the liquid. This force is required to keepthemulti-fluidmodel hyperbolic when the bubble pressureis neglected in the shared-pressure model.
In summary, in Eq. (2), Mjl = −Mgl +Msl = FDgl + FVM
gl +FTDgl + FD
sl for the liquid phase (k = l), Mlg = −Mgl = −(FDgl +
FVMgl + FTD
gl ) for the gas phase (k = g), andMls = −Msl = −FDls
for the solid phase.
2.2 Turbulence models
In the present work, large-eddy simulations (LES) are usedto account for the turbulence in the reactor for each phase.The sub-grid scale (SGS) viscosity for phase k is calculatedusing the Smagorinsky sub-grid model (Smagorinsky1963):
μk, SGS = ρk(CSΔ)2Dk
(9)
where the Smagorinsky constant CS = 0.168 in this work. Δis the filter width calculated as the cubic root of the volumeof each cell, and Dk is the rate-of-strain tensor of phase k.The stress tensor of phase k, τk in Eq. (2), is expressed as
τk = ( μk, lam +μk, SGS)[ ∇ Uk + (∇Uk)T − 23(∇ ⋅ Uk)I] (10)
X. Hu et al.: CFD simulations of stirred-tank reactors 195
where μk, lam is the dynamic viscosity of phase k, and I is theunit tensor. The SGS turbulent kinetic energy of phase k canbe found by assuming local equilibrium for kk, expressed as
Dk : Bk + CEk3/2k
Δ= 0 (11)
where the SGS stress tensor Bk = 23 ρkkkI − 2μk, SGS[Dk −
13 tr(Dk)I] and the constant CE = 1.048 in this work.
2.3 Multiple reference frame (MRF) model
The rotation of the impellers is treated by using the MRFmodel (Luo, Issa, and Gosman 1994), which divides thecomputational region into a rotating region and a stationaryregion. In the stationary region, governing equations aresolved in a rotating reference frame. At the interface of thetwo regions, a reference frame transformation is performed.
The fluid velocities can be transformed from the sta-tionary reference frame to the rotating reference frame bycalculating the relative velocities as
Ur, k = Uk − ω × r (12)
where Ur, k is the relative velocity of phase k viewed fromthe rotating reference frame, Uk is the absolute velocityviewed from the stationary reference frame, ω is theangular velocity of the rotating coordinate system relativeto the stationary reference frame, and r is the positionvector of a point in the rotating region with respect to theorigin of the rotating reference frame. When the governingequations are solved in the rotating reference frame, thecontinuity equation is written as
∂
∂t( αkρk) + ∇ ⋅ ( αk ρkUr, k) = 0 (13)
The momentum equation in the rotating referenceframe is expressed as
∂
∂t( αkρkUk) + ∇ ⋅ ( αk ρkUr, kUk) + αkρk(ω × Uk)= −αk ∇ p + ∇ ⋅ ( αkτk) + αkρkg +Mjk (14)
where the extra term αkρk(ω × Uk) represents the Coriolisand centripetal accelerations.
3 Simulated reactors andoperating conditions
Two stirred-tank reactors are studied in the present work.The first reactor was investigated experimentally by
(Ford et al. 2008) and is referred to as Reactor 1. Thesecond reactor, referred to as Reactor 2, was investigatedexperimentally by (Shewale and Pandit 2006). Detailsabout these reactors and the operating conditions aredescribed next.
3.1 Description of reactor 1 and operatingconditions
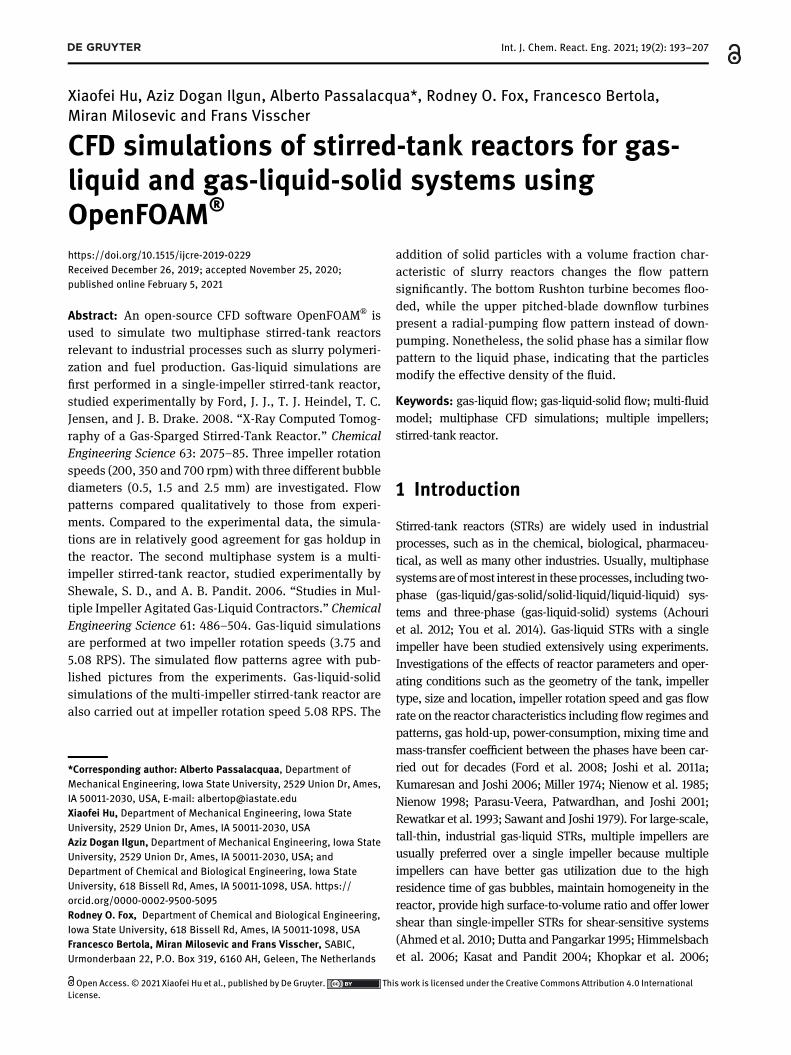
Reactor 1, as described in Ford et al. (2008), is a cylindricalvessel with a flat bottom and four baffles. A six-bladeRushton turbine (RT) is mounted on the shaft near thebottom of the reactor. Air at 300 K is injected uniformlyfrom a ring sparger located at the bottom of the tank intowater (300 K). Details on the tank and impeller geometriesare listed in Table 1.
The commercial mesh generation software Point-wise® is used to generate 420,624 three-dimensionalhexahedral and 2436 polyhedral cells with 1,308,248 facesfor Reactor 1, as shown in Figure 1. The grid convergence
Table : Geometric parameters for reactor .
Parameter Value (m)
Tank height, H .Tank diameter, T .Baffle width .Baffle thickness .Impeller diameter, D .RT distance to bottom .RT blade height .RT blade thickness .Impeller hub diameter .Ring sparger diameter .
Figure 1: (a) Illustration of the computational mesh for reactor 1. (b)Enlarged view of the mesh near the impeller.
196 X. Hu et al.: CFD simulations of stirred-tank reactors
study is performed and given in Table S1 in Supplemen-tary Materials. The gas-liquid flow is found from the two-fluid solver reactingTwoPhaseEulerFoam in OpenFOAM®
(OpenFOAM 2015). The initial water level in the reactor is0.21 m. Air is injected uniformly from the sparger at gasflow rate 1.5 × 10⁻⁴ m3/s (9 LPM in Ford et al. 2008). Threeimpeller rotation speeds are considered 200, 350 and700 rpm. No-slip boundary conditions are used for boththe gas and liquid phases at the tank wall and baffles.Constant gas inlet velocity and atmospheric pressure areused at the gas inlet and outlet, respectively. At the shaftand impeller surfaces, zero relative velocity (Ur, k = 0) isassumed for both phases. The simulated flow time for allcases of Reactor 1 is 65 s, and results are time averagedover the last 60 s.
3.2 Description of reactor 2 and operatingconditions
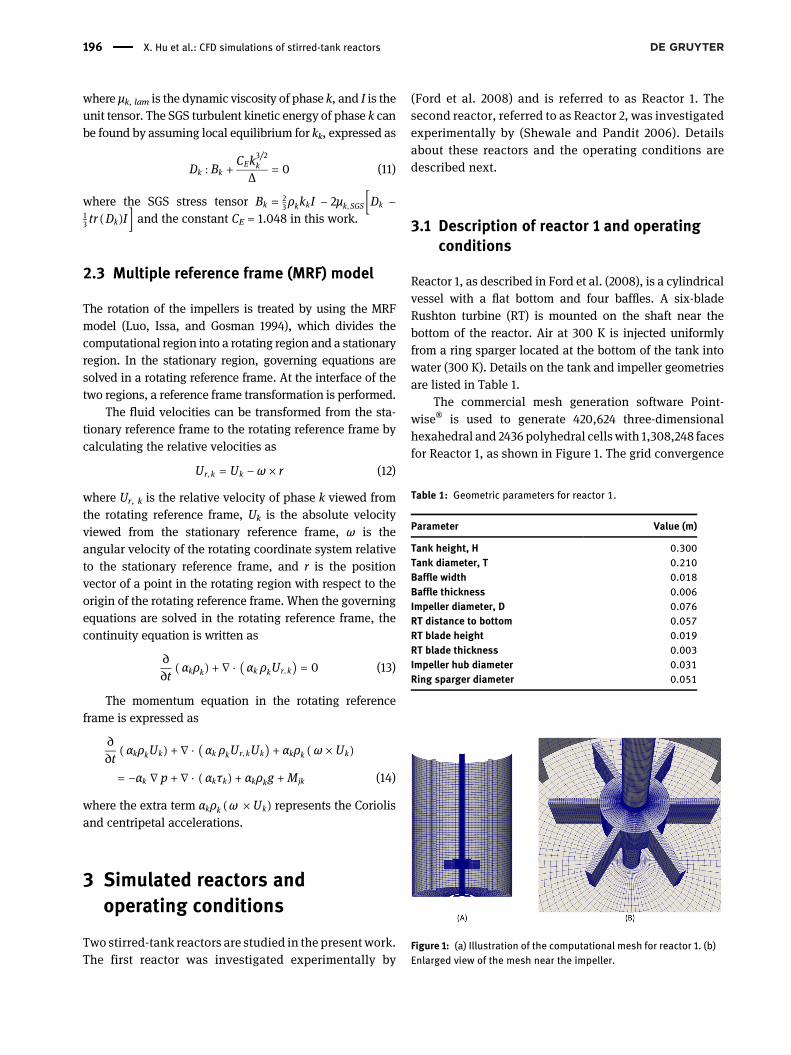
The stirred-tank reactor, studied by (Shewale and Pandit2006) and referred to as Reactor 2, is a cylindrical vesselwith a flat bottom and four baffles. Three impellers aremounted on the shaft and rotate synchronously. The bot-tom impeller is a six-blade RT, and the middle and topimpellers are pitched-blade downflow turbines (PBTD).Details on the tank and impeller geometries are listed inTable 2. In total 669,888 three-dimensional hexahedralcells are generated for Reactor 2 using Pointwise®, asshown in Figure 2. The grid convergence study for Reactor 2is given in Table S2 in Supplementary Materials.
The OpenFOAM® solver reactingTwoPhaseEulerFoam(OpenFOAM 2015) is used to solve for the gas-liquid(air-water) flow in the reactor. Initially thewater level in thetank is 0.87 m. A gas-liquid-solid flow is also simulated
with OpenFOAM® solver reactingMultiphaseEulerFoam(OpenFOAM 2015). The three phases are air, water andpolymethyl methacrylate (PMMA) particles, respectively.The initial mixture level is 0.81 m, with solid and liquidvolume fractions 0.2 and 0.8, respectively. For both two-phase and three-phase systems, air at 300 K is injecteduniformly from the sparger located below the RT into awater-PMMA mixture at 300 K with superficial velocity0.01m/s. A uniform bubble diameter (0.5 cm) is used for allsimulations of Reactor 2. For the gas-liquid-solid simula-tions, the particle diameter is assumed constant at 150 µmwith density 1190 kg/m3. The impellers are rotating atspeeds of 3.75 and 5.08 rps in the down-pumping directionfor the gas-liquid simulations, and a rotation speed of5.08 rps for the gas-liquid-solid simulation. At the tankwalland baffles, a no-slip boundary condition is used for allphases. Constant gas inlet velocity and atmospheric pres-sure are used at the gas inlet and outlet, respectively. At theshaft and impeller surfaces, zero relative velocity (Ur, k = 0)is used for all phases. Simulatedflow time for the gas-liquidsystem is 65 s, and results are time averaged over the last60 s. For the gas-liquid-solid system, results are timeaveraged over 40 s due to the heavy computational cost.
4 Results and discussion
In (Ford et al. 2008), X-ray computed tomography (CT)images of the local gas holdup obtained at different planes
Table : Geometric parameters for reactor .
Parameter Value (m)
Tank height, H .Tank diameter, T .Baffle width .Ring sparger diameter .Sparger distance to bottom .Impeller diameter, D .Impeller spacing, S .RT distance to bottom .RT blade height .RT blade length .PBTD height .PBTD blade angle °
Figure 2: (a) Illustration of the computational mesh for reactor 2. (b,c) Enlarged views of the mesh near the RT impeller (bottom) andPBTD impeller (top).
X. Hu et al.: CFD simulations of stirred-tank reactors 197

are presented. They also report local gas holdup along aline at a specific height and average gas holdup at differentheights. Section 4.1 discusses simulation results of thiswork and compares simulation results to the experimentaldata. In Shewale and Pandit (2006), experimental resultsobtained for a gas-liquid flow are discussed, including flowpatterns for different regimes and the relationship betweenthe overall gas holdup and power consumption. Section 4.2presents the gas-liquid simulation results of Reactor 2 andcomparisons to experimental data. For the gas-liquid-solidsystem, no experiment results are reported in the literature,but this system is of interest for slurry polymerization andother industrial processes. Section 4.3 therefore discussessimulation results only.
4.1 Gas-liquid simulations of reactor 1
The overall gas holdup in the vessel αOverall can be calcu-lated as
αOverall = H − H0
H(15)
where H0 is the initial water level in the tank (0.21 m). Ta-ble 3 lists the averaged mixture height and overall gasholdup in the tank at different impeller rotation speeds andfor three bubble diameters of 0.5, 1.5 and 2.5 mm. Thecomparison of other bubble diameters (3.5 and 5 mm) withthe experimental gas holdups are given in the Supple-mentary Materials (Table S3). The simulation results arecompared to experimental data reported in Ford et al.2008, where αCT and αGlobal are the values obtained usingdifferent techniques. Overall, the agreement between thesimulations and experiments is good and indicate that abubble diameter of approximately 0.5 mm can capture thedependence of the overall gas holdup on all rotationalspeed. Thus,wewill look next at the predictions of the localgas holdup at different heights and radial positions in thereactor.
Figure 3 compares the experimental data for the gasholdup to the simulation results as a function of theheight and radial position in the reactor for three bubble
sizes. In Figure 3 (a, c and e) the gas volume fractionsalong a line (x-axis in Ford et al. 2008) at height 0.065 mis plotted for bubble diameters of 0.5, 1.5 and 2.5 mm.From the experimental results the gas volume fractionincreases in the impeller region. Although a similar trendis observed from simulations, in general, the simulationsunderestimate the gas volume fraction, and only the0.5 mm bubble diameter at 700 rpm mixing rate agreeswell with experiments. On the other hand, as shown inTable 3 the average gas hold-up values are well corre-lated with the experimental results where αCT and αGlobalare the averaged gas holdup in the CT imaging regionand global value in the tank, respectively. This agree-ment indicates that, since CT imaging is a time averagedtechnique and cannot capture the cavities behind theimpellers (especially at high mixing rates due to bladerotation), relatively small discrepancies between exper-iments and simulations are obtained.
These results are more obvious in Figure 3(b, d, f)which provides the comparison of gas volume fractionsalong the reactor in the axial direction. As given in Table 1,the distance of the end of blades from the bottom is 0.076mand up to this height the experimental and simulation re-sults are different yet in closeness, proximity. Away fromthe impeller blades, the simulation results are almost thesame as the experimental measurements. In comparison ofFigure 3(a, b) at high mixing rate (700 rpm – dispersedregime) although the gas holdup is estimated well in theimpeller region with 0.5 mm bubble diameter, betteragreement is obtained for higher bubble diameters, 1.5 and2.5 mm, outside of this region. Therefore, it can beconcluded that the bubble size distribution is most likelynot uniform in the reactor and break-up of bubbles hap-pens within the impeller region due to applied shear andcoalescence is the dominant mechanism above the blades.Furthermore, in the loaded regime (350 rpm) good agree-ment is obtainedwith 1.5mmbubble diameter (Figure 3(d))since a more uniform velocity profile (hence shear appliedon the bubbles) can be expected in this regime. Thisconclusion is supported by the gas and liquid phase ve-locity magnitude profiles shown in Figure 4 (and in Sup-plementary Materials Figure S4).
Table : Overall gas holdup in the vessel for three bubble sizes and experiments.
. mm . mm . mm Ford et al.
Rotation speed H (m) αoverall, % H (m) αoverall, % H (m) αoverall, % αCT, % αglobal, %
. . . . . . . . . . . . . . . . . . . . . .
198 X. Hu et al.: CFD simulations of stirred-tank reactors

In Figure 4(a–c) contour plots of the gas-phase velocitymagnitudes for the bubble diameter of 1.5 mm are given atimpeller rotation speed 200 rpm at three heights 0.065,0.087 and 0.11 m, corresponding to z = 0.8, 3.0 and 5.3 cmin Figure 5 of (Ford et al. 2008), respectively. (The gas-phase velocity profiles for d = 0.5 and 2.5 mm are given inSupplementary Materials Figures S1 and S2). Comparing
the three different bubble diameters, although the velocityprofiles are similar, the velocity magnitudes increase pro-portionally with the bubble size. These results clearlyindicate that the impeller is flooded at this rotation speedand gas flow rate. The bubbles concentrate near theimpeller and shaft and are barely dispersed away from theimpeller region (Paglianti 2002) and bubbles spread
0.5
(A) (B)
1.5
(C) (D)
2.5
(E) (F)
Figure 3: Comparison of simulated and experimental gas volume fractions as a function of height and radial position. Black lines with circles,red lines with triangles and blue lines with rectangles represent the experimental results for 700, 350 and 200 rpmmixing rates respectively,and corresponding colored symbols represent simulation results: (a, c, e) Gas volume fraction along a line at height 0.065 m for 0.5, 1.5 and2.5 mm bubble diameter. (b, d, f) Averaged gas volume fractions at different heights for 0.1, 1.5 and 2.5 mm bubble diameter at differentheights.
X. Hu et al.: CFD simulations of stirred-tank reactors 199

radially due to the decreased pressure and bubble risevelocity (Ford et al. 2008). Compared to (Ford et al. 2008),similar patterns are observed, i.e., gas holdup is high nearthe blades, and bubbles spread radially with increasingvertical distance. The gas volume fraction is very low nearthe tank wall. (In the Supplementary Materials, the flowpattern of water at impeller rotation speed 200 rpm isshown in Figure S4(a–c) at the same heights with the gasphase velocities. The flow pattern of water for 0.5 and2.5 mm bubble diameters are also provided in Figures S3and S5). For all bubble diameters no radial-pumping flowpattern can be observed because the impeller is flooded.
Figure 4(d, e, f) gives contour plots of the gas-phase ve-locity magnitude profiles at impeller rotation speed 350 rpm.Compared to Figure 6 in Ford et al. 2008, similar patterns canbe observed, and the impeller is loaded. The gas volumefraction is still high near the impeller (see Figure S9(e) in
Supplementary Materials). However, a high gas volumefraction region can be found near the impeller tips, whichindicates bubbles are beginning to be dispersed. As seen inFigure 6of (Ford et al. 2008), a ringpattern canbeobserved inFigure 4, which means that gas is going radially and aroundthe impeller. As is typical of the loaded regime, a well-dispersed gas phase can be expected, while the gas volumefraction is low below the impeller. Similar to air flow pattern,radial-pumping flow patterns is observed in the liquid phase(see Figure S4(d–f) in Supplementary Materials) as well.
Contour plots of the gas-phase velocity magnitudeprofiles at impeller rotation speed 700 rpm are shown inFigure 4(g, h, i). Similar patterns to Figure 7 in (Ford et al.2008) can be observed, and the flow is in the completelydispersed regime so that the gas is well dispersedthroughout the reactor. (Figure S4(g, h, i) in the Supple-mentary Materials shows the flow pattern of water at
0.065 m 0.087 m 0.11 m20
0 rp
m
(A) (B) (C)
350
rpm
(D) (E) (F)
700
rpm
(G) (H) (I)
Figure 4: Gas velocity magnitude profiles for bubble diameter d = 1.5 mm at different mixing rates and different heights (0.065, 0.087 and0.11 m): (a–c) 200 rpm, (d–f) 350 rpm, (g–i) 700 rpm.
200 X. Hu et al.: CFD simulations of stirred-tank reactors
impeller rotation speed 700 rpm.) Like the air velocityprofile at this rotation speed, a radial-pumpingflowpatternfor liquid phase is obtained.
4.2 Gas-liquid simulations of reactor 2
Table 4 lists the gassed impeller power consumption PG inthe tank at two different impeller rotation speeds (3.75 and5.08 rps) found from the simulations. The comparison offractional gas holdup, εG, at the corresponding PG both forexperiments and simulations are also given in Table 4.
For the experimental fractional gas holdup values, inShewale and Pandit (2006) a power-law type correlation asa function of (PG/V) andVG is used, where PG,V andVG arethe gassed impeller power consumption, bulk volume andsuperficial gas velocity, respectively, with fitting constantsgiven in (2). Our simulation results overpredict the
experimental fractional gas holdups (see Table 4) withapproximately 30% percent error. The difference can beattributed to different power consumptions, calculated inexperiments and in simulations. In Shewale and Pandit(2006), power consumption is calculated according to
PG = α(P2oNRD
3
Q0.56G
)n
(16)
where Po and QG are the ungassed impeller power con-sumption and gas flow rate. Although a similar correlationis proposed in (Michael and Miller 1962) for single discturbine, α and n parameters are added in Shewale andPandit (2006) as fitting parameters for PBTD and are givenin Table 2 of (Shewale and Pandit 2006).
On the other hand, in the simulations the gassedimpeller power consumption in the vessel (PG) is calculatedby multiplying the magnitude of the torque (T ) by theangular velocity ω:
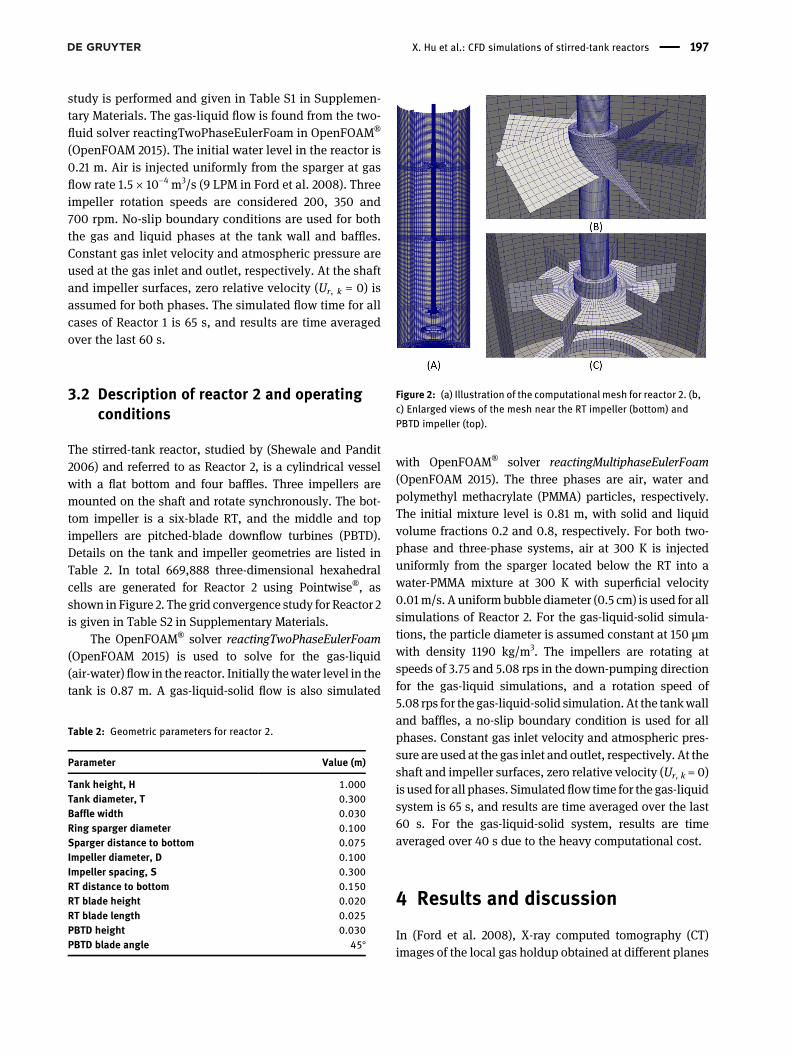
Figure 5: Contour plots of gas volumefraction at 3.75 rps for gas-liquid system:(a) Axial cross section. (b) Radial crosssection at bottom RT (0.15 m). (c) Radialcross section at middle PBTD (0.45 m). (d)Radial cross section at top PBTD (0.75 m).
X. Hu et al.: CFD simulations of stirred-tank reactors 201
PG = |T| ⋅ ω = |T| ⋅ ( 2πNR) (17)
where NR is the impeller rotational speed. The torque iscalculated by integrating the cross product of the totalstress (σ) on the surfaces of the impellers and the positionvector (r), written as
T = ∫S
( σ ⋅ n) × rdS (18)
where n is the normal vector of cell face on the surface ofshaft and impellers, and total stress (σ) is defined as
σ = −pI + ( τg + τl) (19)
with stress tensors τg and τl being calculated using Eq. (10).It is unclear whether the results from Eq. (17) can becompared quantitatively to the correlation in Eq. (16)whichis based on the total power consumption.
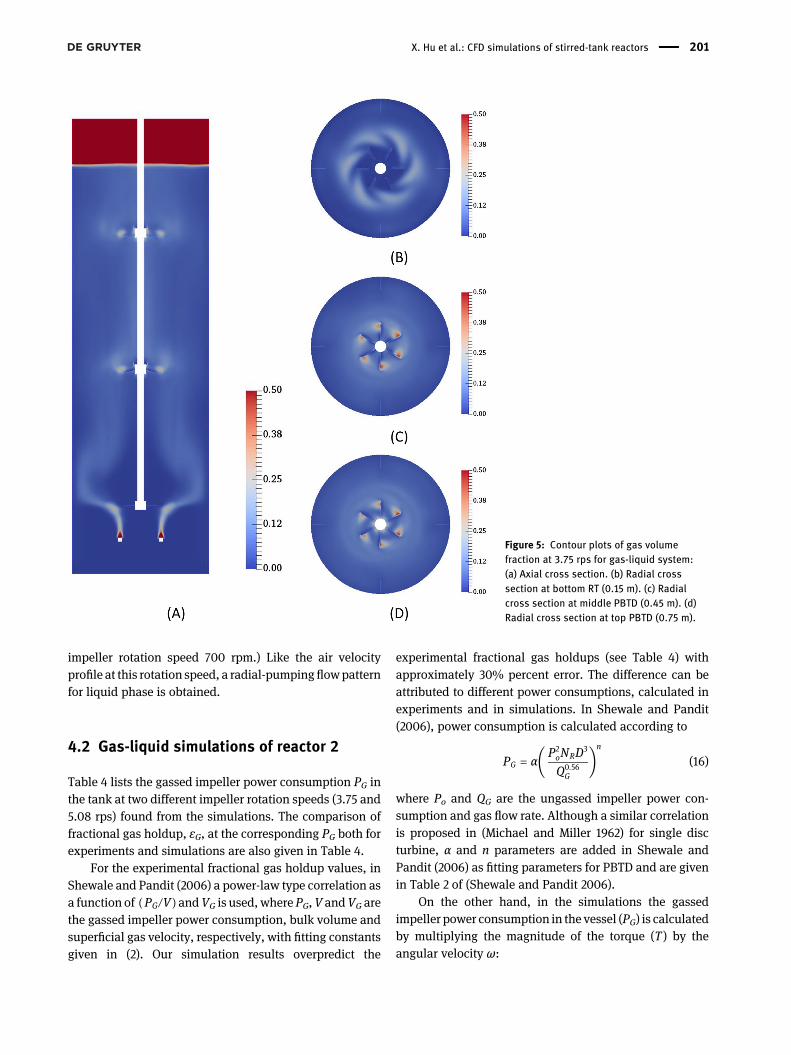
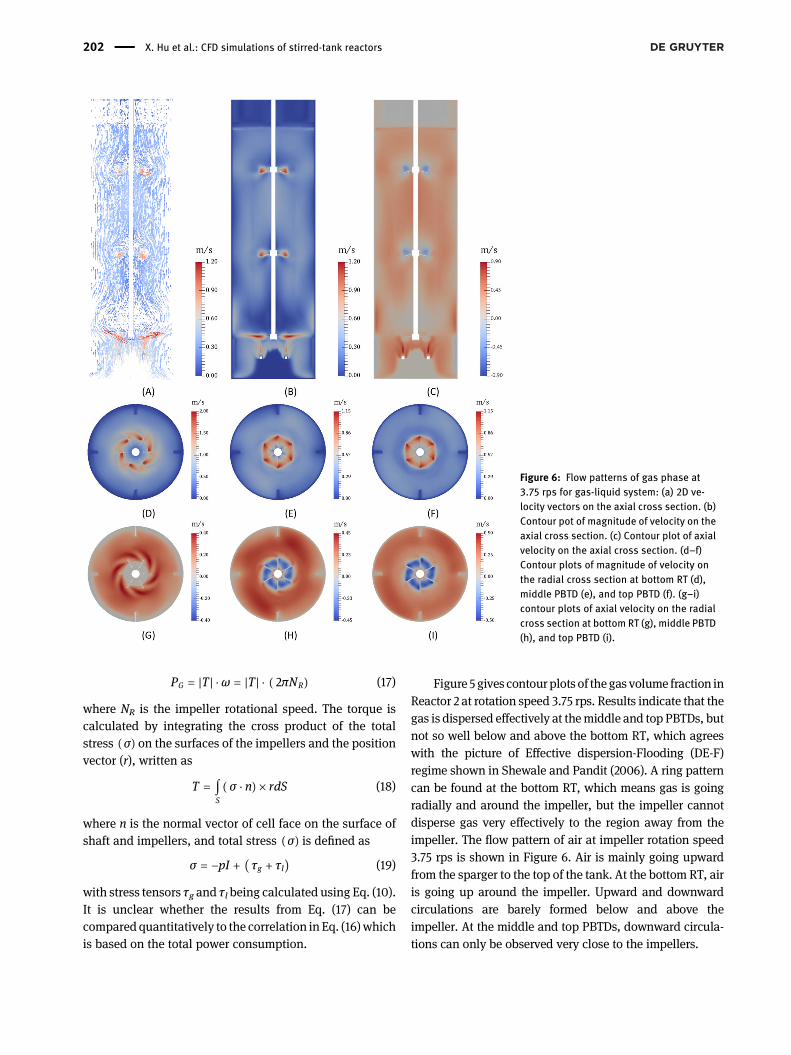
Figure 5 gives contourplots of thegas volume fraction inReactor 2 at rotation speed 3.75 rps. Results indicate that thegas is dispersed effectively at themiddle and top PBTDs, butnot so well below and above the bottom RT, which agreeswith the picture of Effective dispersion-Flooding (DE-F)regime shown in Shewale and Pandit (2006). A ring patterncan be found at the bottom RT, which means gas is goingradially and around the impeller, but the impeller cannotdisperse gas very effectively to the region away from theimpeller. The flow pattern of air at impeller rotation speed3.75 rps is shown in Figure 6. Air is mainly going upwardfrom the sparger to the top of the tank. At the bottom RT, airis going up around the impeller. Upward and downwardcirculations are barely formed below and above theimpeller. At the middle and top PBTDs, downward circula-tions can only be observed very close to the impellers.
Figure 6: Flow patterns of gas phase at3.75 rps for gas-liquid system: (a) 2D ve-locity vectors on the axial cross section. (b)Contour pot of magnitude of velocity on theaxial cross section. (c) Contour plot of axialvelocity on the axial cross section. (d–f)Contour plots of magnitude of velocity onthe radial cross section at bottom RT (d),middle PBTD (e), and top PBTD (f). (g–i)contour plots of axial velocity on the radialcross section at bottom RT (g), middle PBTD(h), and top PBTD (i).
202 X. Hu et al.: CFD simulations of stirred-tank reactors

Radial-pumping and down-pumping flow patterns ofwater are found at the bottom RT, and air is going uparound the impeller (see Figure S10 in SupplementaryMaterials). Upward and downward circulations are barelyformed below and above the impeller. At the middle andtop PBTDs, downward circulations can only be observed
very close to the impellers. Radial-pumping and down-pumping flow patterns of water at the bottom RT andupper PBTDs at 3.75 rps are more obvious than the flowpatterns of air, shown in Figure 5. At the bottom RT, anupward and a downward circulation can be seen clearlybelow and above the impeller, and water is movingdownward near the tank wall. At the middle PBTD, adownward circulation is formed, but still close to impellerregion. An upward circulation is also formed between thebottom RT and middle PBTD. At the top PBTD, a down-ward circulation if formed, and expanded to regions awayfrom the impeller.
Figure 7 shows contour plots of gas volume fraction atrotation speed 5.08 rps. Gas is dispersed effectively at theupper PBTDs, and dispersed better above the bottom RT,
Figure 7: Contour plots of gas volumefraction at 5.08 rps for gas-liquid system:(a) Axial cross section. (b) Radial crosssection at bottom RT (0.15 m). (c) Radialcross section at middle PBTD (0.45 m). (d)Radial cross section at top PBTD (0.75 m).
Table : Fractional gas holdup.
Fractional gas holdup
Rotation speed (rps) log (PG/V) W/m Experimental Simulation
. . . .. . . .
X. Hu et al.: CFD simulations of stirred-tank reactors 203

compared to gas dispersion at rotation speed 3.75 rps. Atthe bottom RT, a high gas volume fraction region can alsobe observed near the tank wall and baffles. Simulationresults are similar to the photo shown in Shewale andPandit (2006), described as the Effective-Loading (DE-L)regime.
The air flow pattern at impeller rotation speed 5.08 rpsshown in Figure 8. Like the flowpattern of air at 3.75 rps, airismainly going upward. A radial-pumpingflowpattern canbe observed at the bottom RT, although the upward anddownward circulations are very subtle below and abovethe impeller. At the middle and top PBTDs, downwardcirculations are formed close to the impellers (Figure S11 inthe Supplementary Materials shows the water flow patternat rotation speed of 5.08 rps). A radial-pumping flowpattern is clear at the bottom RT. Below the bottom RT, anupward circulation is formed, while above the impeller, a
downward circulation can be observed. At the upperPBTDs, downward circulations that are expanded to re-gions away from the impellers are generated.
4.3 Gas-liquid-solid simulations of reactor 2
Contour plots of gas, solid and liquid volume fractions atimpeller rotation speed 5.08 rps are shown in Figure 9. Theaddition of solid particles changes the volume fractionprofile significantly. Air is sucked into the mixture near thefree surface. At the bottom RT, the ring pattern of gas vol-ume fraction disappears, and the impeller tends to becomeflooded. A high gas volume fraction is observed near theshaft and impellers, while outside the impeller regions gasis not dispersed effectively. Accordingly, solid and watervolume fractions are low near the shaft and impellers. For
Figure 8: Flow patterns of gas phase at5.08 rps for gas-liquid system: (a) 2D ve-locity vectors on the axial cross section. (b)Contour pot of magnitude of velocity on theaxial cross section. (c) Contour plot of axialvelocity on the axial cross section. (d–f)Contour plots of magnitude of velocity onthe radial cross section at bottom RT (d),middle PBTD (e), and top PBTD (f). (g–i)Contour plots of axial velocity on the radialcross section at bottom RT (g), middle PBTD(h), and top PBTD (i).
204 X. Hu et al.: CFD simulations of stirred-tank reactors

the solid phase, the particle concentration increasesslightly with decreasing distance from the bottom of thevessel.
With the addition of a solid phase, the radial-pumping flow pattern at the bottom RT seen in the gas-liquid system disappears, and downward circulations atthe upper PBTDs can barely be observed. Air mostly goesupward throughout the vessel, and only goes downwardin a small region between the blades of the upper PBTDs.Compared to the gas-liquid system, the water flow patternchanges dramatically with the addition of solid particles(See Figure S12 in Supplementary Materials). The radial-pumping flow pattern at the bottom RT cannot beobserved anymore. Instead, an upward circulation is
formed near the impeller. The upper PBTDs present aradial-pumping more than a down-pumping flow pattern.Upward and downward circulations are formed belowand above both impellers. Furthermore, solid particlesfollow the liquid, and therefore the solid phase has asimilar flow pattern to the liquid phase.
5 Conclusions
Multiphase CFD simulations were performed for two STRs.In Reactor-1, gas-liquid simulations were performed.Similar flow patterns with experiments in Ford et al. (2008)are found and the simulation gas holdup values are in
Figure 9: Contour plots of gas (left), solid(middle) and liquid (right) volume fractionsat 5.08 rps: (A–C) axial cross section. (D–F)radial cross section at bottom RT. (G–I)radial cross section at middle PBTD. (J–L)radial cross section at top PBTD. (A, D, G, J)gas phase. (B, E, H, K) solid phase. (C, F, I, L)liquid phase.
X. Hu et al.: CFD simulations of stirred-tank reactors 205

good agreement with experimental overall gas holdupvalues. In Reactor-2, the flow patterns from gas-liquidsimulations agree well with experiments (Shewale andPandit 2006), however, calculated gassed power con-sumption is smaller than the experimental value. Whensolid particles added to the Reactor-2 simulations, thebottomRT tends to beflooded,while a radial-pumping flowpattern is observed at the upper PBTDs instead of down-pumping flow.
Acknowledgments: X. Hu, A. Passalacqua and R. O. Foxgratefully acknowledge financial support from SABICGeleen, The Netherlands.Author contributions: All the authors have acceptedresponsibility for the entire content of this submittedmanuscript and approved submission.Research funding: None declared.Conflict of interest statement: The authors declare noconflicts of interest regarding this article.
References
Achouri, R., I. Mokni, H. Mhiri, and P. Bournot. 2012. “A 3D CFDSimulation of a Self-Inducing Pitched Blade Turbine Downflow.”Energy Conversion and Management 64: 633–41.
Ahmed, S. U., P. Ranganathan, A. Pandey, and S. Sivaraman. 2010.“Computational Fluid Dynamics Modeling of Gas Dispersion inMulti Impeller Bioreactor.” Journal of Bioscience andBioengineering 109: 588–97.
Arlov, D., J. Revstedt, and L. Fuchs. 2008. “Numerical Simulation of aGas-Liquid Rushton Stirred Reactor LES and LPT.” Computers &Fluids 37: 793–801.
Bakker, A., and H. E. A. Van Den Akker. 1994. “A Computational Modelfor the Gas-Liquid Flow in Stirred Reactors.” ChemicalEngineering Research & Design 72: 594–606.
Boyer, C., A. M. Duquennt, and G. Wild. 2002. “Measuring Techniquesin Gas-Liquid and Gas-Liquid-Solid Reactors.” ChemicalEngineering Science 57: 31853215.
Burns, A. D., T. Frank, I. Hamill, and J.M.Shi. 2004. “The Favre AveragedDrag Model for Turbulent Dispersion in Eulerian Multi-PhaseFlows.” In 5th International Conference on Multiphase Flow.ICMF’04 Yokohama, Japan, May 30–June 4, Paper No. 392.Yokohama, Japan: ICMF
Chen, L., Y. Bao, and Z. Gao. 2009. “Void Fraction Distribution in Cold-Gassed and Hot-Sparged Three Phase Stirred Tanks with Multi-Impeller.” Chinese Journal of Chemical Engineering 17: 887–95.
Conway, K., A. Kyle, and C. D. Rielly. 2002. “Gas-Liquid-SolidOperation of a Vortex Ingesting Stirred Tank Reactor.” ChemicalEngineering Research and Design 80: 839–45.
Dohi, N., Y. Matsuda, K. Shimizu, K. Minekawa, and Y. Kawase. 2002.“An Experimental Investigation into Vapor Dispersion and SolidSuspension in Boiling Stirred Tank Reactors.” ChemicalEngineering and Processing: Process Intensification 41: 267–79.
Dohi, N., T. Takahashi, K. Minekawa, and Y. Kawase. 2004. “PowerConsumption and Solid Suspension Performance of Large-ScaleImpellers in Gas-Liquid-Solid Three-Phase Stirred TankReactors.” Chemical Engineering Journal 97: 103–14.
Drew, D. A. 1983. “Mathematical Modeling of Two-Phase Flow.”Annual Review of Fluid Mechanics 15: 261–91.
Drew, D. A., and R. T. Lahey. 1987. “The VirtualMass and Lift Force on aSphere in Rotating and Straining Inviscid Flow.” InternationalJournal of Multiphase Flow 13: 113–21.
Dutta, N. N., and V. G. Pangarkar. 1995. “Critical Impeller Speed forSolid Suspension Un Multi-Impeller Three Phase AgitatedContactors.” The Canadian Journal of Chemical Engineering 73:273–83.
Fishwick, R. P., J. M. Winterbottom, and E. H. Stitt. 2003. “Effect ofGassing Rate on Solid-Liquid Mass Transfer Coefficients andParticle Slip Velocities in Stirred Tank Reactors.” ChemicalEngineering Science 58: 1087–93.
Ford, J. J., T. J. Heindel, T. C. Jensen, and J. B. Drake. 2008. “X-RayComputed Tomography of a Gas-Sparged Stirred-Tank Reactor.”Chemical Engineering Science 63: 2075–85.
Gosman, A. D., C. Lekakou, S. Politis, R. I. Issa, andM. K. Looney. 1992.“Multidimensional Modeling of Turbulent Two-Phase Flows inStirred Vessels.” AIChE Journal 38: 1946–56.
Himmelsbach, W., D. Houlton, D. Ortlieb, and M. Lovallo. 2006. “NewAdvances in Agitation Technology for Exothermic Reactions inVery Large Reactors.” Chemical Engineering Science 61:3044–52.
Jahoda, M., M. Mostek, A. Kukukukova, and V. Machon. 2007. “CFDModelling of Liquid Homogenization in Stirred Tanks with Oneand Two Impellers Using Large Eddy Simulation.” ChemicalEngineering Research & Design 85: 616–25.
Jahoda, M., L. Tomaskove, and M. Moste. 2009. “CFD Prediction ofLiquid Homogenisation in a Gas-Liquid Stirred Tank.” ChemicalEngineering Research and Design 87: 460–7.
Joshi, J. B., N. K. Nere, C. V. Rane, B. N. Murthy, and C. S. Mathpati.2011a. “CFD Simulation of Stirred Tanks: Comparison ofTurbulenceModels (Part 1: Radial Flow Impellers).” The CanadianJournal of Chemical Engineering 89: 23–82.
Joshi, J. B., N. K. Nere, C. V. Rane, B. N. Murthy, C. S. Patwardhan,A. W. Mathpati, and V. V. Ranade. 2011b. “CFD Simulation ofStirred Tanks: Comparison of Turbulence Models (Part II: AxialFlow Impellers, Multiple Impellers and MultiphaseDispersions).” TheCanadian Journal of Chemical Engineering89:754–816.
K’alal, Z., M. Jahoda, and I. Fort. 2014. “CFD Prediction of Gas-LiquidFlow in an Aerated Stirred Vessel Using the Population BalanceModel.” Chemical and Process Engineering 35: 55–73.
Kasat, G. R., and A. B. Pandit. 2004. “Mixing Time Studies in MultipleImpeller Agitated Reactors.” The Canadian Journal of ChemicalEngineering 82: 892–904.
Kerdouss, F., A. Bannaari, and P. Proulx. 2006. “CFD Modeling of GasDispersion and Bubble Size in a Double Turbine Stirred Tank.”Chemical Engineering Science 61: 3313–22.
Khopkar, A. R., and P. A. Tanguy. 2008. “CFD Simulation of Gas-LiquidFlows in Stirred Vessel Equipped with Dual Rushton Turbines:Influence of Parallel, Merging and Diverging FlowConfigurations.” Chemical Engineering Science 63: 3810–20.
Khopkar, A. R., G. R. Kasat, A. B. Pandit, and V. V. Ranade. 2006.“CFD Simulation of Mixing in Tall Gas-Liquid Stirred Vessel:
206 X. Hu et al.: CFD simulations of stirred-tank reactors

Role of Local Flow Patterns.” Chemical Engineering Science61: 2921–9.
Kumaresan, T., and J. B. Joshi. 2006. “Effect of Impeller Design on theFlow Pattern andMixing in Stirred Tanks.” Chemical EngineeringJournal 115: 173–93.
Lane, G. L., M. P. Schwarz, and G. M. Evans. 2005. “NumericalModelling of Gas-Liquid Flow in Stirred Tanks.” ChemicalEngineering Science 60: 2203–14.
Luo, J. Y., Y. Issa, and A. D. Gosman. 1994. “Prediction of Impeller-Induced Flow in Mixing Vessels Using Multiple Frames ofReferences.” Institution of Chemical Engineering SymposiumSeries 136: 549–56.
Micale, G., V. Carrara, F. Grisafi, and A. Brucato. 2000. “SolidsSuspension in Three-Phase Stirred Tanks.” ChemicalEngineering Research and Design 78: 319–26.
Michael, B. J., and S. A. Miller. 1962. “Power Requirements of Gas-Liquid Agitated Systems.” AIChE Journal 8: 262–6.
Miller, D. N. 1974. “Scale-Up of Agitated Vessels Gas-Liquid MassTransfer.” AIChE Journal 20: 445–53.
Min, J., Y. Bao, L. Chen, Z. Gao, and J. M. Smith. 2008. “NumericalSimulation of Gas Dispersion in an Aerated Stirred Reactor withMultiple Impellers.” Industrial & Engineering ChemistryResearch 47: 7112–7.
Moilanen, P., M. Laakkonen, O. Visuri, V. Alopaeus, and J. Aittamaa.2008. “Modelling Mass Transfer in an Aerated 0.2 M3 VesselAgitated by Rushton, Phasejet and Combijet Impellers.”Chemical Engineering Journal 142: 95–108.
Murthy, B. N., and J. B. Joshi. 2008. “Assessment of StandardK-Epsilon, RSM and LES Turbulence Models in a Baffled StirredVessel Agitated by Various Impeller Designs.” ChemicalEngineering Science 63: 5468–95.
Murthy, B. N., R. S. Ghadge, and J. B. Joshi. 2007. “CFD Simulations ofGas-Liquid-Solid Stirred Reactor: Prediction of Critical ImpellerSpeed for Solid Suspension.” Chemical Engineering Science 62:7184–95.
Nienow, A. W. 1998. “Hydrodynamics of Stirred Bioreactors.” AppliedMechanics Reviews 51: 3–32.
Nienow, A. W., and W. Bujalski. 2002. “Recent Studies on AgitatedThree-Phase (Gas-Solid-Liquid) Systems in the TurbulentRegime.” Chemical Engineering Research andDesign80: 832–8.
Nienow, A. W., M. C. G. Warmoeskerken, J. M. Smith, and M. Konno.1985. “On the Flooding/Loading Transition and the CompleterDispersal Condition in Aerated Vessels Agitated by a RushtonTurbine.” In Proceedings of the 5th European Conference onMixing, 143–54. Wurzburg: BHRA Cranfield.
OpenFOAM. 2015. The Open Source CFD Toolbox – User’s Guide.United Kingdom: OpenCFD Ltd.
Paglianti, A. 2002. “Simple Model to Evaluate Loading/FloodingTransition in Aerated Vessels Stirred by Rushton Disc Turbines.”The Canadian Journal of Chemical Engineering 80: 1–5.
Panneerselvam, R., S. Savithri, and G. D. Surender. 2009.“Computational Fluid Dynamics Simulation of Solid Suspensionin a Gas-Liquid-Solid Mechanically Agitated Contactor.”Industrial & Engineering Chemistry Research 48: 1608–20.
Parasu-Veera, U., A. W. Patwardhan, and J. B. Joshi. 2001.“Measurement of Gas Hold-Up Profiles in Stirred Tank Reactors
by Gamma Ray Attenuation Technique.” Chemical EngineeringResearch and Design 79: 684–8.
Petitti, M., M. Vanni, D. L. Marchisio, A. Buffo, and F. Podenzani. 2013.“Simulation of Coalescence, Break-Up and Mass Transfer in aGas-Liquid Stirred Tank with CQMOM.” Chemical EngineeringJournal 228: 1182–94.
Ranade, V. V., and H. E. A. Van Den Akker. 1994. “A ComputationalSnapshot of Gas-Liquid Flow in Baffled Stirred Reactors.”Chemical Engineering Science 49: 5175–92.
Rewatkar, V. B., and J. B. Joshi. 1992. “Effect of Addition of Alcoholon the Design Parameters of Mechanically Agitated Three-Phase Reactors.” The Chemical Engineering Journal 49:107–17.
Rewatkar, V. B., A. J. Deshpande, A. B. Pandit, and J. B. Joshi. 1993.“Gas Hold-Up Behavior of Mechanically Agitated Gas-LiquidReactors Using PitchedBladeDownflow Turbines.” The CanadianJournal of Chemical Engineering 71: 226–37.
Sawant, S. B., and J. B. Joshi. 1979. “Critical Impeller Speed for theOnset of Gas Induction in Gas-Inducing Types of AgitatedContactors.” The Chemical Engineering Journal 18: 87–91.
Scargiali, F., A. D’Orazio, F. Grisafi, and A. Brucato. 2007. “Modellingand Simulation of Gas-Liquid Hydrodynamics in MechanicallyStirred Tanks.” Chemical Engineering Research & Design 85:637–46.
Shewale, S. D., and A. B. Pandit. 2006. “Studies in Multiple ImpellerAgitated Gas-Liquid Contractors.” Chemical Engineering Science61: 486–504.
Smagorinsky, J. 1963. “General Circulation Experiments with thePrimitive Equations.” Monthly Weather Review 91: 99–164.
Tomiyama, A., I. Kataoka, I. Zun, and T. Sakaguchi. 1998. “DragCoefficients of Single Bubbles under Normal and MicroGravity Conditions.” JSME International Journal Series B 41:472–9.
Tyagi, M., S. Roy, A. D. Harvey III, and S. Acharya. 2007. “Simulation ofLaminar and Turbulent Impeller Stirred Tanks Using ImmersedBoundaryMethod and Large Eddy Simulation Technique inMulti-Block Curvilinear Geometries.” Chemical Engineering Science62: 1351–63.
Vr’abel, P., R. G. J. M. Van der Lans, Y. Q. Cui, and K. C. A. M. Luyben.1999. “Compartment Model Approach: Mixing in Large ScaleAeraated Reactors with Multiple Impellers.” ChemicalEngineering Research and Design 77: 291–302.
Vr’abel, P., R. G. J. M. Van der Lans, K. C. A. M. Luyben, L. Boon, andA. W. Nienow. 2000. “Mixing in Large-Scale Vessels Stirred withMultiple Radial or Radial and Axial Up-Pumping Impellers:Modelling and Measurements.” Chemical Engineering Science55: 5881–96.
Wen, C. Y., and Y. H. Hu. 1966. “Mechanics of Fluidization.” ChemicalEngineering Progress Symposium Series 62: 100–11.
You, S. T., A. A. A. Raman, R. S. S. R. E. Shah, and N. M. I. Mohamad.2014. “Multiple-Impeller Stirred Vessel Stuides.” Reviews inChemical Engineering 30: 323–36.
Supplementary Material: The online version of this article offerssupplementary material (https://doi.org/10.1515/ijcre-2019-0229).
X. Hu et al.: CFD simulations of stirred-tank reactors 207