Copyright by Xiaofei Ren 2011
41
Copyright by Xiaofei Ren 2011
Transcript of Copyright by Xiaofei Ren 2011

Copyright
by
Xiaofei Ren
2011
The Report Committee for Xiaofei Ren Certifies that this is the
approved version of the following report:
A Case Study of
Lean Software Practices in an IT Application Support Department
Committee:
Dewayne Perry, Supervisor
Herb Krasner, Co-Supervisor

A Case Study of
Lean Software Practices in an IT Application Support Department
by
Xiaofei Ren, BE
Report
Presented to the Faculty of the Graduate School of
The University of Texas at Austin
in Partial Fulfillment
of the Requirements
for the Degree of
Master of Science in Engineering
The University of Texas at Austin
December, 2011
iv
Acknowledgement
I would like to thank my supervisor, Professor Herb Krasner and Professor
Dewayne Perry for giving me the opportunity to work on this project, as well as
providing me their patience and technical guidance. I would also like to thank my
husband Hebin Chen, my son Edward Chen, and Owen Chen, for their encouragement
and support me in pursuing a Master Degree of Software Engineering.

v
A Case Study of
Lean Software Practices in an IT Application Support Department
Xiaofei Ren, MSE
The University of Texas at Austin, 2011
Supervisor: Dewayne Perry
Co-Supervisor: Herb Krasner
The concept of lean manufacturing was formed at Toyota by Taiichi Ohno, who
originated the system of “Just-in-Time” production with the goals of delivering high
value and cutting down waste. These concepts were partially adapted to software
development in an Agile development context [1] where the goal is to deliver value to the
customers more quickly by eliminating waste and improving quality. However, we are
not aware of any published attempt to adapt lean principles to IT maintenance work.
The purpose of the case study reported here is to demonstrate that the principles
of lean software development could be effectively applied to a specific IT application
support department. It is an empirical study of lean practices in the maintenance
department of a large organization. A comparison was made from the collected data from
our release management tool before and after applying the lean principles to our IT
group. Our analysis shows that the lean principles improved the developers’ focus on the
given corrective or preventive task. Application quality also improved to a significant
extent. More importantly, our customers did see more efficient support efforts that
delivered good quality in a shorter time. All in all, the newly conceived support process

vi
adapting lean principles to our situation did, in fact, deliver more highly valued software
to our customers more quickly while cutting down waste. On the other hand, we also
learned that there were some challenges that arose from a conflict between the new lean
practices and our previous practices. The most significant of these conflicts was revealed
in developer work load imbalances and customer confusion due to having to
communicate with different IT support teams for different type of maintenance requests.
A future adjustment of how the lean principles can be applied to IT maintenance may be
necessary.

vii
Table of Contents
List of Tables ......................................................................................................... ix
List of Figures ..........................................................................................................x
Lean Principles and Software Development ............................................................1
Introducing Lean Principles and Practice ......................................................7
Defining Lean IT Support ...............................................................................8
Re-organizing the Lean Support Team ...........................................................9
Lean Objectives and How they were addressed ...........................................11
Deliver Customer Needs Fast ..............................................................11
Eliminate Waste ...................................................................................12
Estimate Support Efforts ......................................................................13
Build Quality In ...................................................................................14
Create Knowledge ................................................................................15
Defining the Measures for Improvement ...............................................................16
Waste Reduction ...........................................................................................16
Customer Satisfaction ...................................................................................16
Employee Productivity..................................................................................17
Software Quality ...........................................................................................17
Time To Market ............................................................................................18
Data Collection And Analysis Methods .......................................................19
Results of Lean Practices Implementation .............................................................21
Customer Satisfaction Increased ...................................................................21
Productivity Improved ..................................................................................23
Quality of Maintenance Effort Improved .....................................................25
Time To Market Improvement Unknown .....................................................27

viii
Conclusion .............................................................................................................28
Appendix ................................................................................................................30
Acronym Table .............................................................................................30
Bibliography ..........................................................................................................31

ix
List of Tables
Table 1: Request Priority ...............................................................................12
Table 2: Average Request Completing Days ..................................................23
Table 3: System Failure Hours ........................................................................24
x
List of Figures
Figure 1: Organizational Context: Before Introducing Lean Principles ............4
Figure 2: IT Support Task Process .....................................................................5
Figure 3: Developer’s Assignments ...................................................................8
Figure 4: Organizational Context: After Introducing Lean Principles .............10
Figure 5: System Availability ...........................................................................21
Figure 6: Implemented Requests ......................................................................22
Figure 7: Average Request Completing Days ..................................................23
Figure 8: Waste Reduction ...............................................................................24
Figure 9: Average Hours of Implementing One Request .................................25
Figure 10: Quality Improvement ........................................................................26

1
Lean Principles and Software Development
In the late 1940s, Toyota, now the world’s largest car manufacturing
company, confronted typical problems: waste and low quality. They worked to
eliminate seven forms of waste (overproduction, time on hand, transportation,
processing, stock at hand, movement and defective products), developing a process
now known as lean manufacturing. In Toyota’s lean thinking, anything that does
not create value for a customer is waste.
In the book “Lean Software Development: An Agile Toolkit” [1], the
authors introduced their concept of applying lean principles to software
development in an Agile context by giving seven fundamental areas for “lean”
software development:
Eliminate waste
Build quality
Create knowledge
Defer commitment
Deliver fast
Respect people
Achieve Optimization
There are few papers on case studies of lean software development. [3,4,5].
As software quality affects multiple sectors of the company, it is essential to a
company to focus on widening its efforts rather than just being confined to the
software developers [6]. A major implementation issue is that lean software
development may require drastic changes in the way an organization is managed.

2
After an extensive search of the published literature, no articles were found
that describe how to apply lean principles to an IT application support situation.
That gap in the literature motivated this study of such a situation. This report is
about an IT maintenance group and their three year journey into leanness. Their
progress was tracked as a case study in the application of lean principles to IT
application support.

3
Organizational Context: Before Lean
The IT organization of the studied company A comprised of two main
departments, namely the IT Development Department, and the IT Support
Department. There are application development teams named, for example, the
Application A project team, Application B project team, etc. Every large
development project is implemented by a development team, and after system
deployment, the maintenance and support department takes ownership of the
applications in order to perform the ongoing maintenance work.
The Support Group which is focused on supporting application systems was
chosen for this case study reported in this paper. The same 100 developers were in
this support group both before and after this case study. Before there were nine
business applications focus support teams in this group. The groups’ organization
context before the case study is shown in Figure 1.

4
Figure 1: Organizational Context: Before Introducing Lean Principles
The Application A Support team supported business application A which
had been implemented by the Application A project development team. The
responsibilities of the staff in support team A were to fix application A production
defects, implement application A small enhancements, and all maintenance work
related to application A. The same application focus model applied to all the other
support teams in the IT Support Group.
Software support is an important phase in the software development life
cycle. The more effective the system support effort is, the higher the stability and
availability of IT system capabilities provided to the customers will be. The
5
application support team is very important to the company to ensure the high
quality and availability of support to customers [7]. Maintenance consists of four
parts:
Corrective maintenance, which deals with fixing bugs in the code
Adaptive maintenance, which deals with adapting the software to
new environments
Perfective maintenance, which deals with updating the software
according to changes in user requirements
Preventive maintenance, which deals with updating documentation
and making the software more maintainable
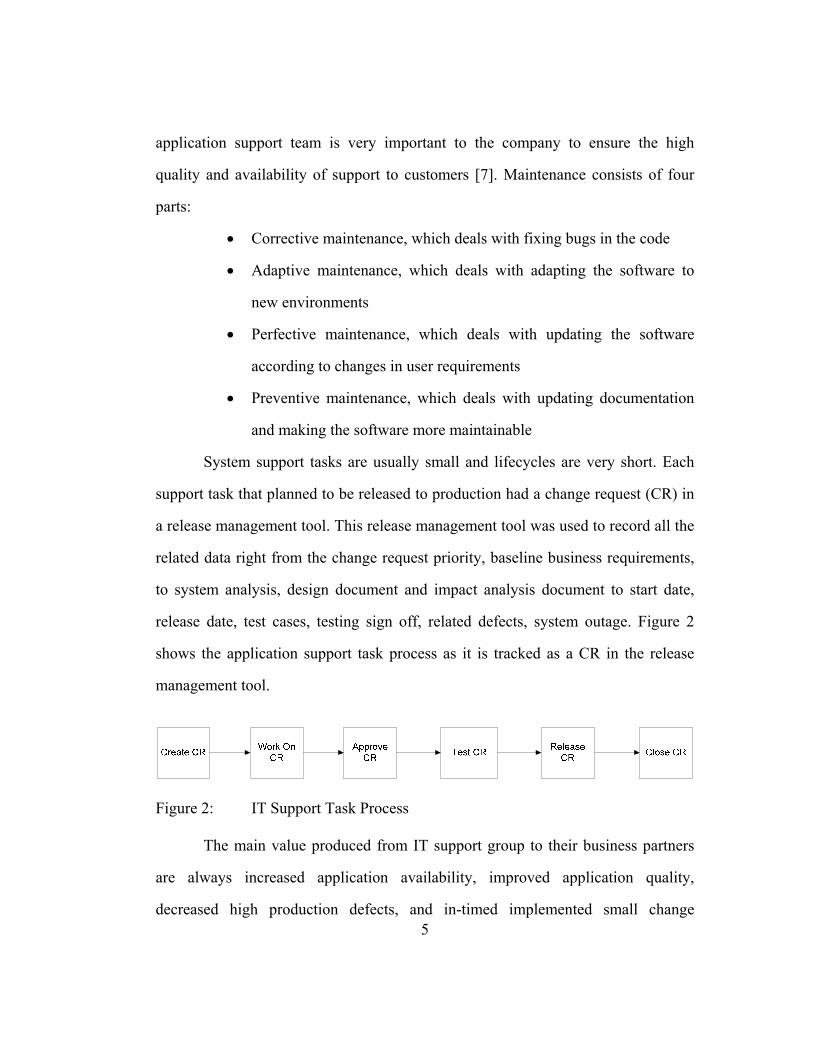
System support tasks are usually small and lifecycles are very short. Each
support task that planned to be released to production had a change request (CR) in
a release management tool. This release management tool was used to record all the
related data right from the change request priority, baseline business requirements,
to system analysis, design document and impact analysis document to start date,
release date, test cases, testing sign off, related defects, system outage. Figure 2
shows the application support task process as it is tracked as a CR in the release
management tool.
Figure 2: IT Support Task Process
The main value produced from IT support group to their business partners
are always increased application availability, improved application quality,
decreased high production defects, and in-timed implemented small change

6
requirements. Even though the support team believed that they were doing a good
job, the disheartening comment from their business partner (representing the
Application A users) was “though there is a cost, there seems to be no value.”

7
Introducing Lean Principles and Practice
In order to address that perceived problem, new practices based on lean
principles were implemented in the IT support group in late 2009 with the goal of
delivering more value to the customer in order to increase their level of satisfaction.
There were two main areas of change in practices introduced into the IT
maintenance department based on lean principles, namely creating a leaner
organization and also creating a leaner support process. Both areas are described in
the following paragraphs.
IT SUPPORT BEFORE LEAN
Before applying Lean practices in the IT support group before, each support
team in support group was responsible for all system maintenance and support
works related to all systems. The primary responsibilities of all developers were
similar and shown as:
Monitored systems and ensuring it’s high availability
Assigned task of upgrading and validating software or license of the
systems
Analyzed system defects of the system and applied corrections
Worked on small change requirements from the business partner
An example as shown in Figure 3 is one developer in old support team’s
assignments in 2 weeks. It stated he had to stop his defect and small enhancement
assignments to start a new assignment of fixing system failure. But only after the
system failure had been solved he continued his defect assignment in the following
week. Thus, there is a handoff of assignments resulting in identifying waste.

8
Figure 3: Developer’s Assignments
All remaining nine system support teams had similar responsibilities, but to
support other different system applications. Every developer worked at a frantic
pace, but the business users still complained about the availability -- that was still
around 97-98 -- which is not the required goal. The end users complained that the
system response time was too slow and there were still some defects in system for a
long time. There were similar issues in every team. In spite of their best efforts,
productivity remained low and business partners were not convinced of the teams’
value. Therefore, the company decided to implement the Lean IT Support team
process in late 2009.
DEFINING LEAN IT SUPPORT
The core idea of leaner IT support teams is maximizing customer value by
minimizing waste. A lean organization must understand customer values and focus
its key processes continuously to meet or exceed customer expectations. This
ensures provision of more value to customer, and with fewer resources. Leaner
team solves the issue of low productivity and lower customer satisfaction using the
current support group.
Lean principles in support group practices were the concept of “Task
Focus.” By focusing the tasks, both managers and developers were grouped on the

9
basis of specific support tasks. Developers focused only on assigned single type of
support task, rendered more effective assignments and improvement of
productivity, thereby produced more value with which to satisfy the business
partner and end users. For example, task of fixing system defects is one of the most
important tasks in the support team to provide quality system to users. Given that, a
Corrective team was formed that the developers’ responsibility was only to fix
system defects. The leaner organization was described in the following session.
RE-ORGANIZING THE LEAN SUPPORT TEAM
The organization chart shown in Figure 4 shows how the support teams
were re-organized based on the specific type of support tasks that they performed.
Support task types include, for instance, defect fixing, small enhancements, etc. In
this new organization model, staffs on the Corrective team only work on fixing
defects for all systems. Similarly, staffs on the Perfective team only work on small
enhancement tasks for all systems.

10
Figure 4: Organizational Context: After Introducing Lean Principles
Preventative Team: This team worked on monitoring the deployed
applications to fix System Failure (SF) for all system. A System Failure
occurs when the system no long delivers a service to end users. The
responsibility of this team was creating a System Failure in release
management tool, fixing the root cause of the System Failure, and returning
back the system to service.
Adaptive Team: This team only worked on software upgrades and
maintenance.

11
Corrective Team: This team only worked on the system defects analysis
and fixes. If system defects were reported, a defect Change Request was
created and assigned to corrective this team.
Perfective Team: This team included Java developers, VB developers, and
mainframe developers. Their single task was adding small business change
requirements to systems.
LEAN OBJECTIVES AND HOW THEY WERE ADDRESSED
Lean principles aim to eliminate waste, and multiple advanced processes
were used in the studied support group. Key processes were defined and
implemented as below description.
Deliver Customer Needs Fast
The change request priority list was created by business teams delineating
all the business requests which were to be completed by IT support group. The
change requests were ranked by an appropriate prioritization score. The score was
given by business partner that based on business priority, users’ impacts, system
volume, etc.
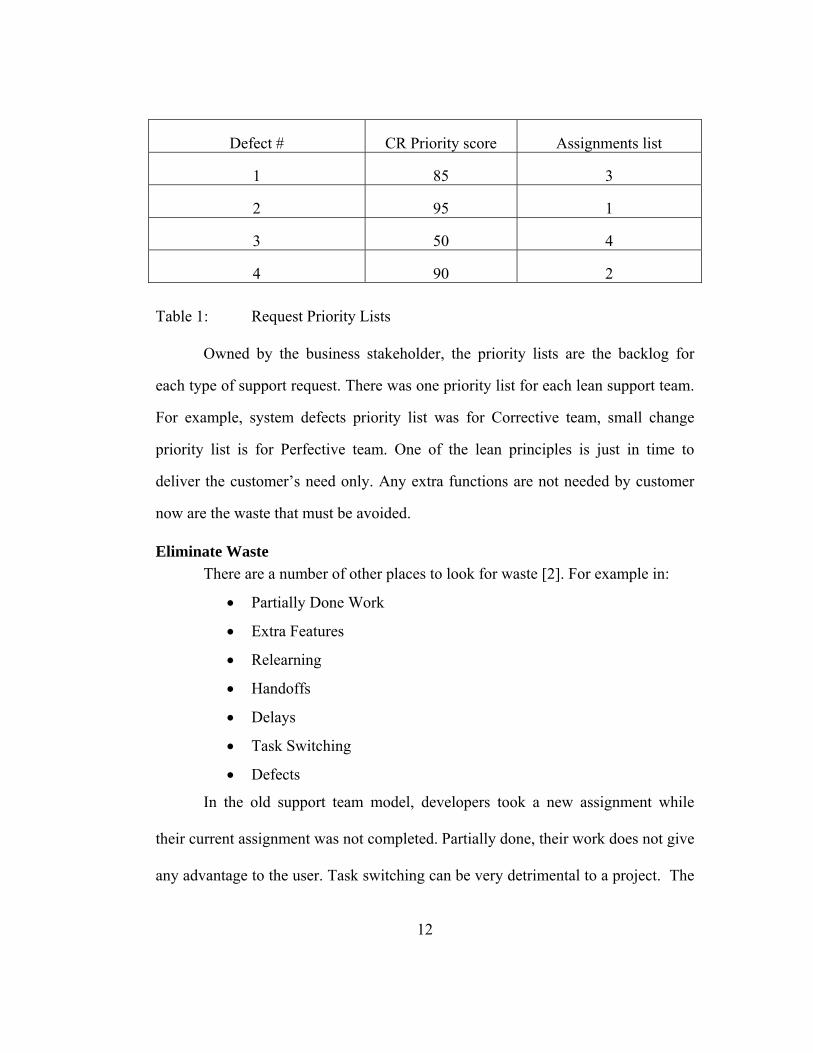
Table 1 is an example of a defect priority list for Corrective team which is
designed to assist manager to assign assignment to developers. Defect #2 has the
highest score in the list so it will be the #1 assignment in Corrective manager’s task
lists.
12
Defect # CR Priority score Assignments list
1 85 3
2 95 1
3 50 4
4 90 2
Table 1: Request Priority Lists
Owned by the business stakeholder, the priority lists are the backlog for
each type of support request. There was one priority list for each lean support team.
For example, system defects priority list was for Corrective team, small change
priority list is for Perfective team. One of the lean principles is just in time to
deliver the customer’s need only. Any extra functions are not needed by customer
now are the waste that must be avoided.
Eliminate Waste
There are a number of other places to look for waste [2]. For example in:
Partially Done Work
Extra Features
Relearning
Handoffs
Delays
Task Switching
Defects
In the old support team model, developers took a new assignment while
their current assignment was not completed. Partially done, their work does not give
any advantage to the user. Task switching can be very detrimental to a project. The

13
The amount of waste created when bouncing back and forth between tasks is
generally very large [12]. While in the lean support team, developers only take the
next assignment after finishing their current task. This practice avoids partially done
work.
Extra processes do not add any value to the customer either. Processes that
do not add any value for the specific application should be eliminated since they are
considered waste [12]. Developers in Corrective team only worked on fixing one
deployed system defect then deliver it to production, nothing else. There is system
upgrade effort, and there is no waiting and no handoff between developers either.
Customers are able to see the value in that system defects have been fixed more
quickly.
Estimate Support Efforts
The lean fundamental approach is to make decisions based on known events
and not forecasts [12]. The goal is to delay commitment as long as possible and to
eliminate waste. Efficient effort estimation process was implemented and to have an
insight at the beginning that allowed control of the effort in order to deliver a high
quality service on schedule. There are currently several estimate tools available to
industry. Most of the IT support tasks are small and require only one developer or
and such small tasks are typically completed quickly. Therefore, Support tasks
cannot use the traditional function points or object points to assist in the estimate.
The support estimate template was created in each lean support team based on the
request point.

14
There are 20 hours dedicated for one request point. Each team, therefore,
had its own factor based on the request point. For example, the Corrective team had
factor five for high defects, meaning one high level system defect had an estimate
of 5x20=100 hours. Perfective tasks were a little more complex so there was factor
twenty was used to estimate a Perfective CR. Developers knew the size of the effort
they were working.
Specific ground rules existed for estimates practice. First, the support task
estimate was created by the specific team who would work on it. Everyone in the
team provided input on their respective subject and this was reflected in the new
estimate. Second, it was clear that the estimate was ultimately not a commitment.
The actual size of the effort may, in fact, be different. In addition, each estimate
could be changed because it may be influenced by many factors.
Build Quality In
Numerous processes were established in IT support group to improve IT
support quality after lean practices.
CR must be submitted as early as possible. It ensured the support
task had followed the existing release plan and there was enough
time to check the code, and perform all the necessary assessments
such as unit testing, integration testing, system testing, and QA
testing.
Testing is, of course, was required for all support tasks. The change
in support team was small mostly -- which is similar to configuration
file change(s), addition of additional lines of code, etc. However,
very small changes may also have a large system impacts. Given

15
that, all the support efforts scheduled into a system must be executed
system testing.
There was no newly introduced system defects just because the
support efforts. A defect fix only needs a few lines of code change
but a very small change may have very large system impacts. Any
untested change will introduce potential production defects.
Create Knowledge
Create knowledge is another of the seven Lean principles requiring
extensive technical knowledge relating to the supporting system and is a
fundamental requirement in support of quickly correcting. IT supporting best
practices is realized from communication with the project team that actually
designed and contracted the system. The best way to support system functionality is
to learn from the project development team which designed and constructed the
systems.
The transition to maintenance checklists template [11] must be created for
each development. The checklists were used to allow support teams to check if
enough supporting documents were included. At the same time, developer from the
support team attended all the design reviews, code reviews and defects review
meetings in order to clearly understand the project. The project knowledge has been
transferred to support team by this practice.
In a lean IT support group, developers must work on the single type of
support task for all the supporting systems. The developers in the Corrective team
had to work on any system defects. There was a new challenge for developers to
gain the technical knowledge for so many systems.

16
Defining the Measures for Improvement
In order to see the results of the new lean IT support group an applicable set
of metrics were defined and used in the study team.
WASTE REDUCTION
Lean principles are supposed to significantly reduce the time taken to
deliver new products while substantially reducing cost [12]. Waste is considered
anything that interrupts the flow of value to customer. The following metrics for
waste reduction were defined to measure how much waste has been cut:
Reduction of Waste for CRs: This measures how many hours are
reduced for completed CRs.
Waste Reduction Rate (WRR): This measures the different hours of
completing one CR compare to hours before lean IT support team.
WRR = (hours of completing one CR before lean - hours of
completing one CR after lean) / hours of completing one CR before
lean IT support team.
CUSTOMER SATISFACTION
Lean principles are supposed to increase customer satisfaction. The
following metrics were defined for customer satisfaction:
System Availability: This measures system failure and its associated
consequences. This is typically defined as:
availability = mean time to failure / ( mean time to failure + mean
time to repair ).
Number of Change Requests implemented: This measures how many
CR have been implemented or completed by a support team.

17
CR completed day: This measures how soon the IT support team
completes the CR. It is the days between the CR submission date to
the CR implantation date.
EMPLOYEE PRODUCTIVITY
Employee productivity is the way to measure the degree to which a
developer has delivered higher value with lower cost. It is defined as Output/Input.
The output is the value delivered, consisting solely of the total benefit provided to
the customers. The input is the resources consumed, which include time, cost, etc.
In terms of software development, productivity can focus on total lines of code per
day and total functions points per day. Because the efforts of application support are
different than those of development, the way to measure the support team’s
productivity varies. Employee productivity metrics were defined for the support
teams as follows:
CR Executing Age: This measures the total hours that a developer
spend on one CR.
Number of CRs Completed: This is a measurement of how many
CRs have been implemented or completed by a developer or a team.
SOFTWARE QUALITY
High quality software meets the business requirements with few operational
defects. Every mature software company adheres to a quality control process in
order to ensure the delivery of high quality software to their customers. Quality
control plays an important role in the application support effort as well. It is not
acceptable to bring a new issue to the production while fixing a current production

18
defect. For example, while performing a maintenance task like upgrading a database
to a new version, no one wants to cause a system outage.
There are various metrics used to measure software quality. Based on well-
known software quality models [8,9,10] we see that software quality can be broken
down into following types of elements or quality factors: functionality, capability,
usability, testability, portability, performance, reliability, reliability, maintainability,
supportability, documentation, and availability.
In this case study the following quality metrics were defined for measuring
quality production support tasks.
Number of introduced defect: This is the count number of new
defects that have been introduced into the system because of support
tasks.
Bad Fix Rate (BFR): It measure number of introduced defect
compare to the total number of completed CRs by one team or one
developer in a fixed time period. It was defined as:
BFR = Number of introduced defect/ Number of CRs Completed.
TIME TO MARKET
Time to market is the day between the dates of a new marketing business
requirement to the date of it in serving end users. It is a very important
measurement for business department to identify new requirements and request IT’s
on-time implementation. Most companies are looking for the process to reduce the
time-to-market period. Some extensive and large requirements, as well as the
development project teams were formed to specifically focus on the implementation
of extensive and large business requirements. Even so, for some small change

19
requirements there is still a need to have an IT support team work effort. IT plays a
very important role in ensuring business meet their time-to-market goals by
providing requested capability quickly and with appropriately high quality. The
following two metrics were defined to measure it:
Elapsed days: This is the days a new requirement to be implemented
and in production. This measures how quickly a new business
function has been put in place to serve customers.
Request backlog age: This measures how long it takes for the IT
support team to start to work on the change request.
DATA COLLECTION AND ANALYSIS METHODS
The support group was chosen for this case study. The evaluation was based
on an analysis of data examples extracted from 3 of 4 support teams in this IT
support group: the Corrective team, Preventative Team, and Perfective team. The
reason these three teams were chosen was the availability of extensive data
recorded by the release management tool that was related to their support
assignments before and after Lean practices were established.
The base data before and after the lean practices were implemented were
collected from IT release management tool and interviews with developers. Caveats
- There are many uncontrolled factors that will affect result of this study. It is
difficult having reliable statistical inferences based on data collected from IT
support group. This Lean IT support group principles started in late 2009. There are
2 years data 2009 and 2010 collected from the selected IT support teams in this
study. Some simple statistics methods were used for the data analysis to indicate
some validity to the lean IT support group experimenting result.

20
There is an abundance of data that was pulled from this release management
tool in 2009, which was before lean IT practices in the support team and for 2010,
after lean IT support practices were established in the department. The data was
sorted on the basis of release date, platform, application, developer, and manager.
By performing data analysis on the collected data from the release management
tool, the results of lean IT support group were derived.
A monthly developer work timesheet was used to obtain developers’ work
hours for each support assignment. These data can show developers’ work hours
based on each support task. For a Corrective and Perfective effort, there are CR lists
on their time sheets, and developers post the hours for each CR for each week. The
data is entered by developers themselves and the purpose is to record attendance,
not carry out lean analysis. By interviewing developers in different teams, the hours
for CRs were collected for this case study.

21
Results of Lean Practices Implementation
The following are the results of instituting Lean principles practices in the
selected application support group.
CUSTOMER SATISFACTION INCREASED
High system availability is one of the major factors in achieving customer
satisfaction. Developers in support group only worked on the tasks related to
applications availability. When a system failure was caught in the production
monitor dashboard, an investigation was started immediately by Preventative Team
to analyze the root cause and then return the system to service back as soon as
possible. Figure 5 shows the availability of the 4 systems in 2009 and 2010.
Applications availability was increased in 3 of the 4. However, availability of the
4th system was not improved and the one of the reasons was a new vendor system’s
bad capability.
Figure 5: System Availability
97.597
97.6
96.6
9897.5
97.9
96.1
94
95
96
97
98
99
100
System 1 System 2 System 3 System 4
Avalib
ility
Avalibility
2009 System Avalibility 2010 System Avalibility

22
More high priority business Change Requests were implemented by IT
support group was another value to customer. Although there were only six
developers in selected Corrective team, each developer worked on only defects
fixing assignments. They focused on analyzing the root cause of the defects,
designing the solution to fix it, coding, working with QA to test the fix, and
releasing the defect fix to production system. The whole lifecycle of one defect fix
was decreased from a month to two to three weeks after applying lean principles.
The total numbers of implemented CRs were increased in both Corrective team and
Perfective team in 2010 as shown in Figure 6.
Figure 6: Implemented Requests
Change Requests were delivered faster was another return value to satisfy
customer. This improvement was important for customer to see how efficient the IT
support team worked. Request completed was the sum of CR Backlog Age and CR
Executing Age was shown as Table 2. Both average time of completing a CR were
440
330
560
370
0
100
200
300
400
500
600
Implemented Defects CRs Implemented Perfective CRs
Number
Implemented CRs
Year 2009 Year 2010

23
decreased as shown Figure 7. It was 28% decreased for Corrective team and 38%
decreased for Perfective team from 2009 to 2010.
Average Days of Completing a CR Year 2009 (Days) Year 2010 (Days)
Defects CR Backlog Age 10 6
Defects CR Executing Age 43.7 34
Defects CR Completing Days 53.7 40
Perfective CR Backlog Age 15 7
Perfective CR Executing Age 73 48
Perfective CR Completing Days 88 55
Table 2: Average Request Completing Days
Figure 7: Average Request Completing Days
PRODUCTIVITY IMPROVED
This study demonstrated developer productivity was improved significantly
after the Lean support group practices.
53.7
88
40
55
0
20
40
60
80
100
Defects CRs Completing Days Perfective CR Completing days
Days
Average CR Completing Days
Year 2009 Year 2010
24
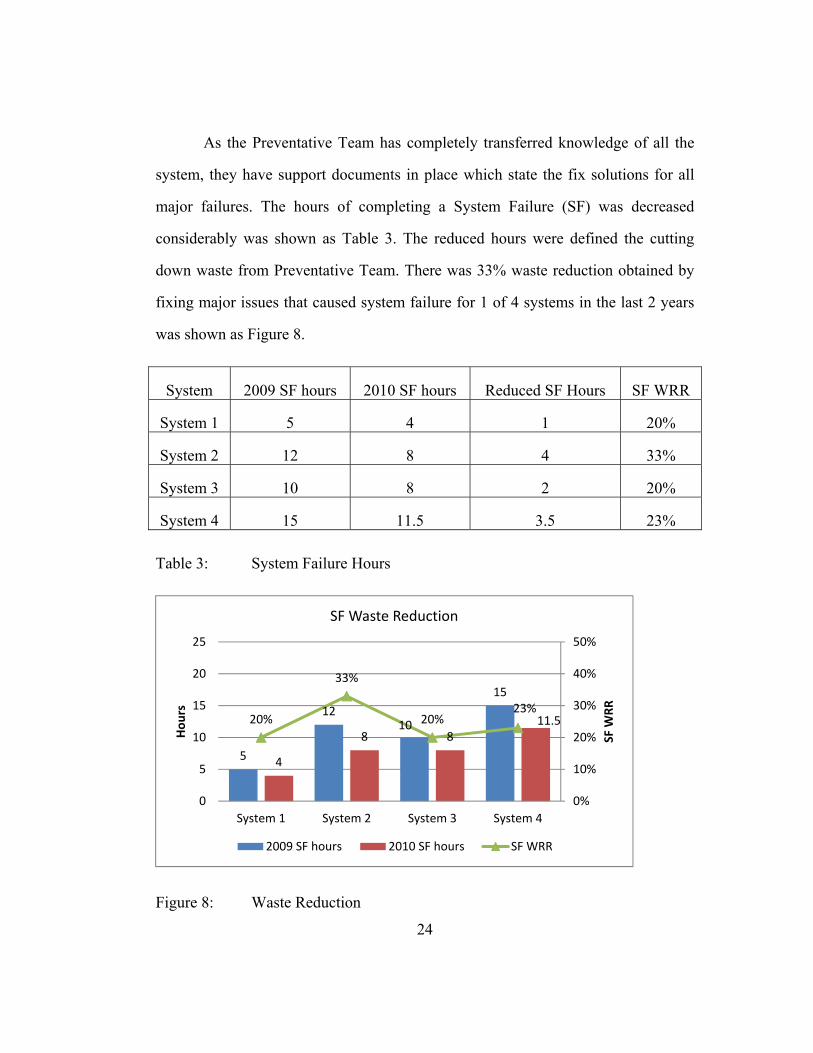
As the Preventative Team has completely transferred knowledge of all the
system, they have support documents in place which state the fix solutions for all
major failures. The hours of completing a System Failure (SF) was decreased
considerably was shown as Table 3. The reduced hours were defined the cutting
down waste from Preventative Team. There was 33% waste reduction obtained by
fixing major issues that caused system failure for 1 of 4 systems in the last 2 years
was shown as Figure 8.
System 2009 SF hours 2010 SF hours Reduced SF Hours SF WRR
System 1 5 4 1 20%
System 2 12 8 4 33%
System 3 10 8 2 20%
System 4 15 11.5 3.5 23%
Table 3: System Failure Hours
Figure 8: Waste Reduction
5
1210
15
4
8 811.520%
33%
20%23%
0%
10%
20%
30%
40%
50%
0
5
10
15
20
25
System 1 System 2 System 3 System 4
SF W
RR
Hours
SF Waste Reduction
2009 SF hours 2010 SF hours SF WRR

25
In the Corrective team, developers only worked on the systems’ defects fix
tasks. The hours of completing a defect CR was reduced as seen in Figure 9. In
Perfective team, developers focused on the small business enhancement
assignments only. Because of this focused approach, the implementation of a
Perfective CR was extremely shorter. The average perfective CR completed hour
was decreased from 146 hours in 2009 to 110 hours in 2010 as Figure 9. The
reduced hours of completing CRs here was defined as cutting waste by Corrective
team and Perfective team.
Figure 9: Average Hours of Implementing One Request
QUALITY OF MAINTENANCE EFFORT IMPROVED
Improved support quality is another result by analysis the collected data
from release management tool. Developer in Corrective team had a better project
plan, provided a good solution to fix system defects, and then worked with tester to
perform all needed test cases testing. All these factors ensured a lower number of
85
146
50
110
0
20
40
60
80
100
120
140
160
Defects CR Implemented Hours Perfective CR Implemented Hours
Hours
Hours of Implementing one CR
Year 2009 Year 2010

26
new defects introduction into system. The total count number of Defects Introduced
Rate (DIR) by Perfective team CRs were reduced from 25 in year 2009 to 7 in year
2010. The count number of DIR by Corrective team implemented CRs were
reduced from 10 in year 2009 to 6 in year 2010 as shown in Figure 10. Reduced
Bad Fix Rate (BFR) was another quality improvement that demonstrated higher
quality effort of leaner IT support group. There was 3% CR BFR in 2009 for
Perfective team but it was 7% in 2009 that was 57% decrease. The same good result
for Corrective team, the BFR was reduced from 2% to 1%.
Figure 10: Quality Improvement
The other quality result from applying lean principles into the selected
support group is the low number of system failure in their supported applications.
There are multiple factors that impact one particular system’s failure like system
architecture and design, vendor’s response, hardware’s capability, etc. But quality
support work was one of the important factors that reduced system failure.
10
6
15
7
2%1%
7%
3%
0%
2%
4%
6%
8%
10%
0
5
10
15
20
Year 2009 Year 2010
CRs BFR
CRs DIR
CRs Quality Improvement
Defects CRs DIR Perfective CRs DIR
Defects CRs BFR Perfective CRs BFR

27
TIME TO MARKET IMPROVEMENT UNKNOWN
The company’s Time-To-Market strategy involved marketing, business
process, and IT implementation. The Time-To-Market impact of lean principles on
the IT support group was hard to determine in this study. By adopting lean
principles, developers in each team were able to focus on their particular support
tasks that enabled them to implement CRs faster than before lean principles were in
place. The backlog age for the Corrective team and for Perfective team were
reduced after lean practices as shown in table 2. A short CR backlog age was
important for customer to see how efficient the IT support team worked. A future
study can be undertaken to find the impact area and evidence between Time-To-
Market and IT Support group.

28
Conclusion
This paper described a case study of the effects of instituting lean software
development practices in an IT application support group. Previous studies of lean
applied to software focused on the development process, for example, design and
construction. This paper has a different emphasis focusing on the maintenance
process in a company IT department. The study metrics were defined to include
customer satisfaction, waste reduction, productivity, availability, quality, and time-
to-market. Actual data from the release management tool was captured and
analyzed.
The results of analyzing the obtained data from before and after the
introduction of lean practices demonstrated that these practices can be successfully
applied to IT maintenance and support. There were two major lean practices
implemented in the studied department. First, the department was reorganized to
allow developers to focus on one single type of maintenance task, in contrast to the
previous organization where each developer performed all maintenance tasks for a
specific line of business applications. Secondly, changes to the maintenance process
were made (e.g. priority list of CRs) in order to cut waste and still maintain fully
knowledgeable developers to support the systems. The results were: increased
customer satisfaction, improved developer productivity, and improved application
quality. For example, Customer satisfaction was increased because the average
number of days for completing a CR was decreased by 28% by the Corrective team
and by 38% in the Perfective team. The developer’s productivity was increased by
cutting down waste by 24%. The application quality was improved as seen in the
57% decrease in the Bad Fix Rate (BFR) by the Corrective team.

29
There were some issues that arose in the implementation of our lean
practices. One issue was developers’ work load imbalances. At times, Corrective
team developers had fewer assignments if there were not a large number of
production defects in their backlog. At the same time, The developers in the
Perfective team were not available to pick up higher priority perfective CRs.
Building a resource rotation plan to adjust the assignments, workloads, and skills
was required. The other issue was customer confusion. Prior to this study, business
customers had only one contact for all their change requests, but now they have to
communicate with each support group for the different maintenance tasks. For
example, one Perfective request with a higher priority score may be taken off the
priority list because it is a Corrective effort. But from a business respective, with IT
support viewed holistically, such a move might lead to confusion. Additionally, the
impact of time-to-market was not evaluated because of the lack of data.
A limitation in the existing data was another issue that impacted this study.
Most of the data was collected from the release management tool and employees’
time sheets related to each CR. However, there was no data available for
developers’ skill sets, and technical experience. Yet, these are important factors for
performing maintenance successfully.
It is hoped that this study will serve to inform future research and studies
evaluating Lean principles applied to IT maintenance.

30
Appendix
ACRONYM TABLE
Term Definition
CR Change Request
SF System Failure
DIR Defect Introduced Rate
WRR Waste Reduction Rate
BFR Bad Fix Rate

31
Bibliography
[1] Poppendieck, M. (2003, April, 25). Lean Software Development. Lean
Essays. Computing, February 10th, 2009.
[2] Poppendieck, M. (2004, June 24). An Introduction to Lean Software
Development. LeanEssays.
[3] Middleton, Peter. Flaxel, Amy. and Cookson, Ammon. Lean Software
Management Case Study: Timberline Inc.
[4] What Is Flowing in Lean Software Development? Vladimir Mandić, Markku
Oivo, Pilar Rodríguez, Pasi Kuvaja, Harri Kaikkonen and Burak Turhan
[5] Applying Agile and Lean Practices in a Software Development Project into a
CMMI Organization. Miguel Morales Trujillo, Hanna Oktaba, Francisco J.
Pino, and María J. Orozco.
[6] Middleton, Peter. Lean Software Development: Two Case Studies.
[7] Prof. Stafford. Software Maintenance As Part of the Software Life Cycle
Comp180: Software Engineering.
[8] McConnell, Steve. 1996. Rapid Development. Microsoft Press.
[9] Grady, Robert; Caswell, Deborah. 1987. Software Metrics: Establishing a
Company-wide Program. Prentice Hall.
[10] Boehm, B. 1986. A Spiral Model of Software Development and Enhancement
[11] Project Transition Checklist.
http://www.cvr-it.com/Samples/XTransitionChecklist_v1_4-4-07.pdf.
[12] Manning, James. Lean Software Development, Department of Software
Engineering, University of Wisconsin – Platteville.