X5 REPORTS 30.7% REVENUE GROWTH IN Q3 2016 … 256,247 196,093 30.7 739,491 578,701 27.8 incl. net...
13
Amsterdam, 26 October 2016 - X5 Retail Group N.V. (“X5” or the “Company”), a leading Russian food retailer (LSE ticker: FIVE), today released the Company’s unaudited condensed consolidated interim financial information for the nine months (9M) ended 30 September 2016, in accordance with International Financial Reporting Standards as adopted by the European Union. Profit and loss statement highlights (1) Russian Rouble (RUB), million (mln) Q3 2016 Q3 2015 change, y-o-y, % 9M 2016 9M 2015 change, y-o-y, % Revenue 256,247 196,093 30.7 739,491 578,701 27.8 incl. net retail sales (2) 253,978 194,995 30.2 734,300 575,671 27.6 Pyaterochka 195,390 143,578 36.1 556,196 418,207 33.0 Perekrestok 35,916 30,052 19.5 110,772 93,098 19.0 Karusel 19,941 18,745 6.4 59,082 56,062 5.4 Express 2,731 2,620 4.2 8,250 8,304 (0.7) Gross profit 62,554 48,990 27.7 178,552 141,961 25.8 Gross profit margin, % 24.4 25.0 (57) b.p. 24.1 24.5 (39) b.p. EBITDA 19,863 14,263 39.3 56,361 41,780 34.9 EBITDA margin, % 7.8 7.3 48 b.p 7.6 7.2 40 b.p. Operating profit 13,274 9,669 37.3 39,138 28,660 36.6 Operating profit margin, % 5.2 4.9 25 b.p 5.3 5.0 34 b.p. Net profit 6,870 4,142 65.9 19,874 12,084 64.5 Net profit margin, % 2.7 2.1 57 b.p 2.7 2.1 60 b.p. (1) Please note that in this and other tables, and in the text of this press release, immaterial deviations in the calculation of % changes, subtotals and totals are due to rounding (2) Net retail sales represent revenue from operations of X5-managed stores net of VAT. This number differs from revenue, which also includes proceeds from wholesale operations, direct franchisees (royalty payments) and other revenue. X5 REPORTS 30.7% REVENUE GROWTH IN Q3 2016 EBITDA MARGIN IMPROVES BY 48 B.P. TO 7.8% Revenue growth accelerated to 30.7% year-on-year (y-o-y) on the back of solid like- for-like (LFL) sales and strong selling space expansion. Pyaterochka was the main driver of growth: net retail sales rose by 36.1% y-o-y. X5 added 638 net new stores in Q3 2016 vs. 541 in Q3 2015, contributing additional net selling space of 277.8 th. sq. m. in the quarter. The gross margin decreased by 57 b.p. y-o-y to 24.4% in Q3 2016 due to value proposition refinements including targeted re-investment of operating efficiencies into lower prices to maintain consumer loyalty, as well as on the back of the changes in the retail formats’ contribution to gross profit. SG&A expenses (excl. D&A&I) as a percentage of revenue improved by 106 b.p. y-o- y to 17.4%, due to the positive impact of ongoing projects to improve operational efficiency and as a result of operating leverage. EBITDA grew by 39.3% y-o-y and reached RUB 19,863 mln in Q3 2016. The EBITDA margin improved by 48 b.p. y-o-y in Q3 2016 to 7.8%. The Company’s net debt/EBITDA ratio decreased to 2.15x as of 30 September 2016, the lowest since 31 December 2009.
Transcript of X5 REPORTS 30.7% REVENUE GROWTH IN Q3 2016 … 256,247 196,093 30.7 739,491 578,701 27.8 incl. net...

Amsterdam, 26 October 2016 - X5 Retail Group N.V. (“X5” or the “Company”), a leading Russian food retailer (LSE ticker: FIVE), today released the Company’s unaudited
condensed consolidated interim financial information for the nine months (9M) ended 30 September 2016, in accordance with International Financial Reporting Standards as
adopted by the European Union.
Profit and loss statement highlights (1)
Russian Rouble (RUB), million (mln)
Q3 2016 Q3 2015 change,
y-o-y, % 9M 2016 9M 2015
change, y-o-y, %
Revenue 256,247 196,093 30.7 739,491 578,701 27.8
incl. net retail sales (2) 253,978 194,995 30.2 734,300 575,671 27.6
Pyaterochka 195,390 143,578 36.1 556,196 418,207 33.0
Perekrestok 35,916 30,052 19.5 110,772 93,098 19.0
Karusel 19,941 18,745 6.4 59,082 56,062 5.4
Express 2,731 2,620 4.2 8,250 8,304 (0.7)
Gross profit 62,554 48,990 27.7 178,552 141,961 25.8
Gross profit margin, % 24.4 25.0 (57) b.p. 24.1 24.5 (39) b.p.
EBITDA 19,863 14,263 39.3 56,361 41,780 34.9
EBITDA margin, % 7.8 7.3 48 b.p 7.6 7.2 40 b.p.
Operating profit 13,274 9,669 37.3 39,138 28,660 36.6
Operating profit margin, % 5.2 4.9 25 b.p 5.3 5.0 34 b.p.
Net profit 6,870 4,142 65.9 19,874 12,084 64.5
Net profit margin, % 2.7 2.1 57 b.p 2.7 2.1 60 b.p.
(1) Please note that in this and other tables, and in the text of this press release, immaterial deviations in the calculation of
% changes, subtotals and totals are due to rounding
(2) Net retail sales represent revenue from operations of X5-managed stores net of VAT. This number differs from revenue,
which also includes proceeds from wholesale operations, direct franchisees (royalty payments) and other revenue.
X5 REPORTS 30.7% REVENUE GROWTH IN Q3 2016
EBITDA MARGIN IMPROVES BY 48 B.P. TO 7.8%
Revenue growth accelerated to 30.7% year-on-year (y-o-y) on the back of solid like-
for-like (LFL) sales and strong selling space expansion.
Pyaterochka was the main driver of growth: net retail sales rose by 36.1% y-o-y.
X5 added 638 net new stores in Q3 2016 vs. 541 in Q3 2015, contributing additional
net selling space of 277.8 th. sq. m. in the quarter.
The gross margin decreased by 57 b.p. y-o-y to 24.4% in Q3 2016 due to value
proposition refinements including targeted re-investment of operating efficiencies
into lower prices to maintain consumer loyalty, as well as on the back of the changes
in the retail formats’ contribution to gross profit.
SG&A expenses (excl. D&A&I) as a percentage of revenue improved by 106 b.p. y-o-
y to 17.4%, due to the positive impact of ongoing projects to improve operational
efficiency and as a result of operating leverage.
EBITDA grew by 39.3% y-o-y and reached RUB 19,863 mln in Q3 2016. The EBITDA
margin improved by 48 b.p. y-o-y in Q3 2016 to 7.8%.
The Company’s net debt/EBITDA ratio decreased to 2.15x as of 30 September 2016,
the lowest since 31 December 2009.

Net retail sales
Total net retail sales growth was a solid 30.2% y-o-y, driven by:
9.1% increase in LFL sales; and
21.1% y-o-y increase from net new space, resulting from a 30.7% y-o-y rise in selling space.
Pyaterochka continues to attract value-conscious customers while also benefitting from its
rapid opening programme, and was the key driver of X5’s Q3 2016 growth: net retail sales rose by 36.1% y-o-y.
Perekrestok’s net retail sales growth accelerated to 19.5% y-o-y in Q3 2016 from 19.2% y-o-y in Q2 2016.
Selling space by format, square meters (sq. m.)
As at
30-Sep-16 As at
31-Dec-15 change vs
31-Dec-15, % As at
30-Sep-15 change vs
30-Sep-15, %
Pyaterochka 3,090,774 2,422,626 27.6 2,220,851 39.2
Perekrestok 513,052 484,008 6.0 458,284 12.0
Karusel 384,449 390,133 (1.5) 364,582 5.4
Express 36,918 36,407 1.4 35,953 2.7
X5 Retail Group 4,025,192 3,333,174 20.8 3,079,670 30.7
Q3 & 9M 2016 LFL(3) store performance by format, % change y-o-y
In Q3 2016, LFL sales performance remained strong despite decreased food inflation y-o-y and weak retail consumption.
Solid LFL traffic growth of 3.2% y-o-y was driven by the strong performance of Pyaterochka and traffic improvement at Perekrestok, which delivered positive LFL traffic for the third quarter in a row.
Q3 2016 9M 2016
Sales Traffic Basket Sales Traffic Basket
Pyaterochka 11.2 4.1 6.8 9.8 3.5 6.1
Perekrestok 7.2 2.4 4.7 5.4 1.7 3.7
Karusel (1.7) (3.7) 2.1 (2.1) (2.4) 0.3
Express (6.5) (9.4) 3.3 (7.3) (9.2) 2.1
X5 Retail Group 9.1 3.2 5.7 7.7 2.8 4.8
For more details on net retail sales growth please refer to X5’s Q3 2016 Trading Update.
Gross profit margin
The gross margin decreased by 57 b.p. y-o-y to 24.4% in Q3 2016 due to value proposition refinements including targeted re-investment of operating efficiencies into lower prices to
maintain consumer loyalty. The changing breakdown of contribution to revenue by format also affected gross margin, as Pyaterochka’s share continued to rise.
(3) LFL comparisons of retail sales between two periods are comparisons of retail sales in local currency (including VAT)
generated by the relevant stores. The stores that are included in LFL comparisons are those that have operated for at
least 12 full months. Their sales are included in the LFL calculation starting from the day of the store’s opening. We
include all stores that fit our LFL criteria in each reporting period.

Selling, general and administrative (SG&A) expenses (excl. D&A&I)
RUB mln Q3 2016 Q3 2015 change,
y-o-y, % 9M 2016 9M 2015
change,
y-o-y, %
Staff costs (19,359) (15,743) 23.0 (55,673) (45,418) 22.6
% of Revenue 7.6 8.0 (47) b.p. 7.5 7.8 (32) b.p.
Lease expenses (12,032) (9,306) 29.3 (34,036) (26,348) 29.2
% of Revenue 4.7 4.7 (5) b.p. 4.6 4.6 5 b.p.
Utilities (4,774) (3,548) 34.6 (13,996) (11,168) 25.3
% of Revenue 1.9 1.8 5 b.p. 1.9 1.9 (4) b.p.
Other store costs (3,420) (3,242) 5.5 (10,449) (9,049) 15.5
% of Revenue 1.3 1.7 (32) b.p. 1.4 1.6 (15) b.p.
Third party services (1,874) (1,935) (3.2) (5,528) (5,286) 4.6
% of Revenue 0.7 1.0 (26) b.p. 0.7 0.9 (17) b.p.
Other expenses (3,005) (2,333) 28.8 (7,628) (7,395) 3.1
% of Revenue 1.2 1.2 (2) b.p. 1.0 1.3 (25) b.p.
SG&A (excl. D&A&I) (44,464) (36,107) 23.1 (127,310) (104,664) 21.6
% of Revenue 17.4 18.4 (106) b.p. 17.2 18.1 (87) b.p.
In Q3 2016, SG&A expenses excluding D&A&I as a percentage of revenue declined y-o-y by 106 b.p. to 17.4%, mainly due to improved staff costs, lease expenses, other store costs
and third party services.
Staff costs as a percentage of revenue fell y-o-y by 47 b.p. in Q3 2016 to 7.6%, mainly
due to the positive operating leverage effect.
Lease expenses as a percentage of revenue in Q3 2016 decreased y-o-y by 5 b.p. to 4.7%
mainly due to improvement of lease terms with real estate owners. Lease expenses improved despite the growing share of leased space in X5’s total real estate portfolio, which accounted for 66% as of 30 September 2016, compared to 60% as of 30 September
2015.
Utilities costs as a percentage of revenue increased slightly, by 5 b.p. to 1.9% in Q3 2016
due to selling space expansion outpacing revenue growth.
Other store costs as a percentage of revenue decreased by 32 b.p. in Q3 2016 compared to Q3 2015, driven by projects to optimise in-store processes and a reduction in security
costs.
Third-party services expenses as a percentage of revenue declined y-o-y by 26 b.p. in
Q3 2016 to 0.7% due to decreased expenses for marketing services.
In Q3 2016, other expenses as a percentage of revenue changed immaterially y-o-y.
In 9M 2016, SG&A expenses as a percentage of revenue decreased y-o-y by 87 b.p. to
17.2% due to the impact of operational efficiency projects and operating leverage.
Lease/sublease and other income
As a percentage of revenue, the Company’s income from lease, sublease and other operations changed immaterially in Q3 2016 compared to Q3 2015.
EBITDA and EBITDA margin
RUB mln Q3 2016 Q3 2015 change,
y-o-y, % 9M 2016 9M 2015
change, y-o-y, %
Gross profit 62,554 48,990 27.7 178,552 141,961 25.8
Gross profit margin, % 24.4 25.0 (57) b.p. 24.1 24.5 (39) b.p.
SG&A (excl. D&A&I) (44,464) (36,107) 23.1 (127,310) (104,664) 21.6
% of Revenue 17.4 18.4 (106) b.p. 17.2 18.1 (87) b.p.
Lease/sublease and other income
1,773 1,380 28.5 5,119 4,483 14.2
% of Revenue 0.7 0.7 (1) b.p. 0.7 0.8 (8) b.p.
EBITDA 19,863 14,263 39.3 56,361 41,780 34.9
EBITDA margin, % 7.8 7.3 48 b.p. 7.6 7.2 40 b.p.
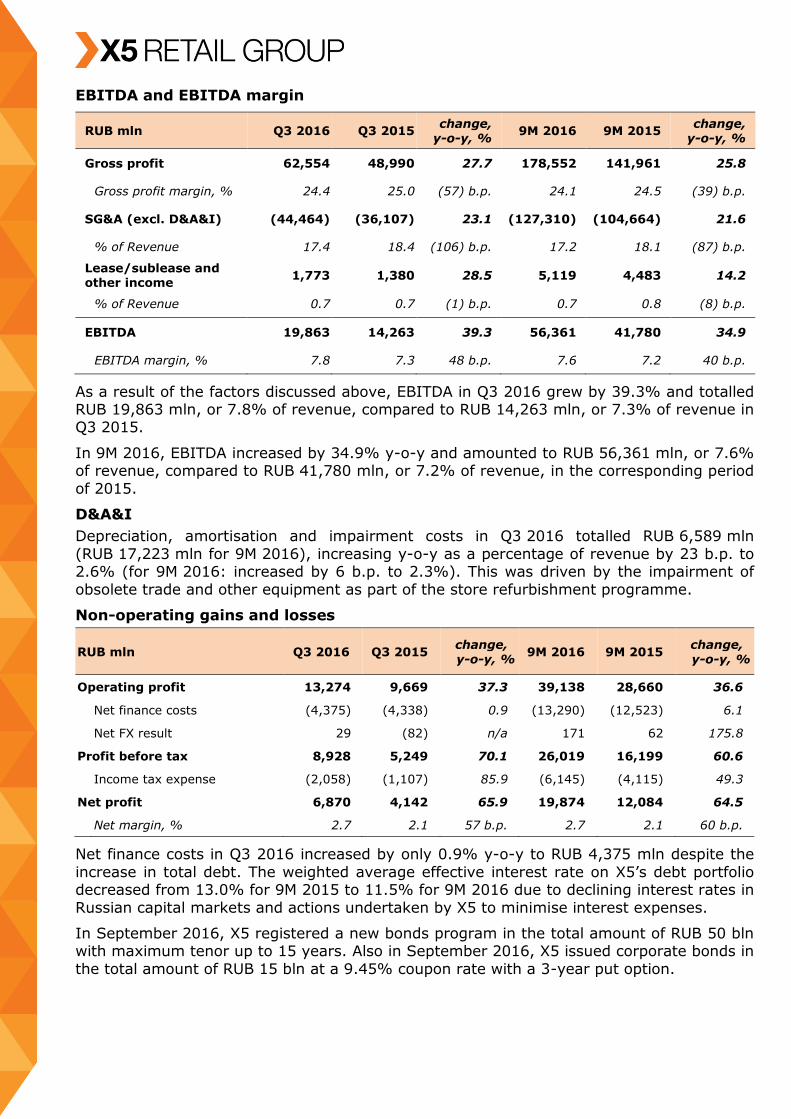
As a result of the factors discussed above, EBITDA in Q3 2016 grew by 39.3% and totalled RUB 19,863 mln, or 7.8% of revenue, compared to RUB 14,263 mln, or 7.3% of revenue in Q3 2015.
In 9M 2016, EBITDA increased by 34.9% y-o-y and amounted to RUB 56,361 mln, or 7.6% of revenue, compared to RUB 41,780 mln, or 7.2% of revenue, in the corresponding period
of 2015.
D&A&I
Depreciation, amortisation and impairment costs in Q3 2016 totalled RUB 6,589 mln
(RUB 17,223 mln for 9M 2016), increasing y-o-y as a percentage of revenue by 23 b.p. to 2.6% (for 9M 2016: increased by 6 b.p. to 2.3%). This was driven by the impairment of
obsolete trade and other equipment as part of the store refurbishment programme.
Non-operating gains and losses
RUB mln Q3 2016 Q3 2015 change, y-o-y, %
9M 2016 9M 2015 change, y-o-y, %
Operating profit 13,274 9,669 37.3 39,138 28,660 36.6
Net finance costs (4,375) (4,338) 0.9 (13,290) (12,523) 6.1
Net FX result 29 (82) n/a 171 62 175.8
Profit before tax 8,928 5,249 70.1 26,019 16,199 60.6
Income tax expense (2,058) (1,107) 85.9 (6,145) (4,115) 49.3
Net profit 6,870 4,142 65.9 19,874 12,084 64.5
Net margin, % 2.7 2.1 57 b.p. 2.7 2.1 60 b.p.
Net finance costs in Q3 2016 increased by only 0.9% y-o-y to RUB 4,375 mln despite the
increase in total debt. The weighted average effective interest rate on X5’s debt portfolio decreased from 13.0% for 9M 2015 to 11.5% for 9M 2016 due to declining interest rates in
Russian capital markets and actions undertaken by X5 to minimise interest expenses.
In September 2016, X5 registered a new bonds program in the total amount of RUB 50 bln with maximum tenor up to 15 years. Also in September 2016, X5 issued corporate bonds in
the total amount of RUB 15 bln at a 9.45% coupon rate with a 3-year put option.

Consolidated cash flow statement highlights
RUB mln Q3 2016 Q3 2015 change , y-o-y, %
9M 2016 9M 2015 change, y-o-y, %
Net cash from operating activities before changes in working capital
20,050 14,458 38.7 56,860 43,415 31.0
Change in working capital 6,803 (755) n/a (2,418) (14,813) (83.7)
Net interest and income tax paid
(6,718) (6,462) 4.0 (16,026) (16,769) (4.4)
Net cash flows generated from operating activities
20,135 7,241 178.1 38,416 11,833 224.7
Net cash used in investing activities
(19,970) (16,248) 22.9 (53,501) (37,588) 42.3
Net cash generated from financing activities
407 9,355 (95.6) 12,135 5,015 142.0
Effect of exchange rate changes on cash & cash
equivalents
15 (39) n/a 10 (42) n/a
Net increase/(decrease) in cash & cash equivalents
587 309 90.0 (2,940) (20,782) (85.9)
In Q3 2016, the Company’s net cash from operating activities before changes in working capital increased by RUB 5,592 mln, or 38.7% y-o-y, and totalled RUB 20,050 mln. The
positive change in working capital was mostly attributable to an increase in accounts payables due to strong business expansion, as well as to changes in other liabilities.
Net interest and income tax paid in Q3 2016 increased slightly by RUB 256 mln, or 4.0%,
and totalled RUB 6,718 mln. The effect from increased gross debt as of 30 September 2016 compared to 30 September 2015 was offset by the lower weighted average effective
interest rate on X5’s debt for Q3 2016. Income tax paid increased due to business expansion.
As a result, in Q3 2016 net cash flows generated from operating activities totalled
RUB 20,135 mln, compared to a RUB 7,241 mln for the same period of 2015. In 9M 2016, net cash flows generated from operating activities increased to RUB 38,416 mln, compared
to a RUB 11,833 mln for the same period of 2015.
Net cash used in investing activities, which generally consists of payments for property, plant and equipment, totalled RUB 19,970 mln in Q3 2016, compared to RUB 16,248 mln
for the same period last year, and reflects higher expenditures on store expansion. Х5 added 277.8 th. sq. m. of selling space in Q3 2016, a 17.7% increase compared to the
same period last year. For 9M 2016, net cash used in investing activities increased to RUB 53,501 mln from RUB 37,588 mln in 9M 2015. X5 added 692.0 th. sq. m. of selling space in 9M 2016, which is a 36.4% increase y-o-y.
Net cash generated from financing activities decreased to RUB 407 mln in Q3 2016 from RUB 9,355 mln for Q3 2015. In 9M 2016, net cash generated from financing activities
totalled RUB 12,135 mln compared RUB 5,015 mln for 9M 2015. In Q3 2016, the Company refinanced part of its debt portfolio on better terms, and gross debt changed immaterially
compared to Q2 2016.

Liquidity update
RUB mln 30-Sep-16 % in total 31-Dec-15 % in total 30-Sep-15 % in total
Total debt 156,435 144,215 141,698
Short-term debt 43,281 27.7 42,670 29.6 44,220 31.2
Long-term debt 113,154 72.3 101,545 70.4 97,478 68.8
Net debt 150,417 135,257 136,857
Net debt/ EBITDA 2.15 2.45 2.48
As of 30 September 2016, the Company’s total debt amounted to RUB 156,435 mln, of
which 27.7% was short-term debt and 72.3% long-term debt. The Company’s debt is 100% denominated in Russian Roubles.
As of 30 September 2016, the Company had access to RUB 239,760 mln of available credit
limits from major Russian and international banks.

Note to Editors:
X5 Retail Group N.V. (LSE: FIVE, Fitch – ‘BB’, Moody's – ‘Ba3’, S&P – ‘BB-’) is a leading Russian food retailer. The Company operates several retail formats: the chain of proximity
stores under the Pyaterochka brand, the supermarket chain under the Perekrestok brand, the hypermarket chain under the Karusel brand and Express convenience stores under various brands.
As of 30 September 2016, X5 had 8,574 Company-operated stores. It has the leading market position in both Moscow and St. Petersburg and a significant presence in the
European part of Russia. Its store base includes 7,787 Pyaterochka proximity stores, 503 Perekrestok supermarkets, 90 Karusel hypermarkets and 194 convenience stores. The Company operates 35 DCs and 1,561 Company-owned trucks across the Russian
Federation.
For the full year 2015, revenue totalled RUB 808,818 mln (USD 13,268 mln), Adjusted
EBITDA reached RUB 59,413 mln (USD 975 mln), and net profit for the period amounted to RUB 14,174 mln (USD 233 mln). In 9M 2016, revenue totalled RUB 739,491 mln (USD 11,443 mln), EBITDA reached RUB 56,361 mln (USD 872 mln), and net profit
amounted to RUB 19,874 mln (USD 308 mln).
X5’s Shareholder structure is as follows: Alfa Group – 47.86%, founders of Pyaterochka –
14.43%, X5 Directors – 0.06%, treasury shares – 0.01%, free float – 37.64%.
Forward looking statements:
This announcement includes statements that are, or may be deemed to be, “forward-looking statements”. These forward-looking statements can be identified by the fact that they do not only relate to historical or current events. Forward-looking statements often
use words such as “anticipate”, “target”, “expect”, “estimate”, “intend”, “expected”, “plan”, “goal”, “believe”, or other words of similar meaning.
By their nature, forward-looking statements involve risk and uncertainty because they relate to future events and circumstances, a number of which are beyond X5 Retail Group N.V.'s control. As a result, actual future results may differ materially from the plans, goals
and expectations set out in these forward-looking statements.
Any forward-looking statements made by or on behalf of X5 Retail Group N.V. speak only
as of the date of this announcement. Save as required by any applicable laws or regulations, X5 Retail Group N.V. undertakes no obligation publicly to release the results of any revisions to any forward-looking statements in this document that may occur due to
any change in its expectations or to reflect events or circumstances after the date of this document.
For further details please contact:
Maxim Novikov Head of Investor Relations
Tel.: +7 (495) 502-9783 e-mail: [email protected]
Andrey Vasin Investor Relations Officer
Tel.:+7 (495) 662-88-88 ext. 21-456 e-mail: [email protected]

X5 Retail Group N.V. Condensed Consolidated Interim Financial Information Nine months ended 30 September 2016
The attached condensed consolidated interim statement of financial position, condensed consolidated interim statement of profit or loss, condensed consolidated interim statement of comprehensive income, condensed consolidated interim statement of cash flows and condensed consolidated interim statement of changes in equity have been prepared on the basis of the X5 Retail Group NV accounting policies as disclosed in the audited annual financial statements for the year ended 31 December 2015. These accounting policies have been consistently applied in the preparation of these statements except that these statements do not comprise a full set of financial statements as required by International Financial Reporting Standards as adopted by the EU.

X5 Retail Group N.V. Condensed Consolidated Interim Statement of Financial Position at 30 September 2016 (expressed in millions of Russian Roubles, unless otherwise stated)
1
30 September 2016 31 December 2015
ASSETS Non-current assets Property, plant and equipment 219,948 189,000 Investment property 4,526 4,828 Goodwill 79,543 75,313 Other intangible assets 16,014 15,101 Other non-current assets 4,471 3,751 Deferred tax assets 5,078 5,417
329,580 293,410 Current assets Inventories 64,809 57,887 Indemnification asset 1,104 1,261 Trade, other accounts receivable and prepayments 21,566 25,008 Current income tax receivable 2,088 1,729 VAT and other taxes receivable 8,602 13,862 Cash and cash equivalents 6,018 8,958
104,187 108,705
TOTAL ASSETS 433,767 402,115
EQUITY AND LIABILITIES Equity attributable to equity holders of the parent Share capital 2,458 2,458 Share premium 46,251 46,253 Retained earnings 75,844 55,970 Share-based payment reserve 53 37
124,606 104,718 Total equity 124,606 104,718
Non-current liabilities Long-term borrowings 113,154 101,545 Deferred tax liabilities 7,263 4,961 Long-term deferred revenue 7 11
120,424 106,517 Current liabilities Trade accounts payable 103,288 103,773 Short-term borrowings 43,281 42,670 Interest accrued 1,671 1,390 Short-term deferred revenue 59 243 Current income tax payable 1,728 1,684 Provisions and other liabilities 38,710 41,120
188,737 190,880
Total liabilities 309,161 297,397
TOTAL EQUITY AND LIABILITIES 433,767 402,115
__________________________ __________________________ Igor Shekhterman Dmitry Gimmelberg Chief Executive Officer Chief Financial Officer 25 October 2016 25 October 2016

X5 Retail Group N.V. Condensed Consolidated Interim Statement of Profit or Loss for the nine months ended 30 September 2016 (expressed in millions of Russian Roubles, unless otherwise stated)
2
Nine months ended
30 September 2016
Nine months ended
30 September 2015
Revenue 739,491 578,701 Cost of sales (560,939) (436,740)
Gross profit 178,552 141,961 Selling, general and administrative expenses (144,533) (117,784) Lease/sublease and other income 5,119 4,483
Operating profit 39,138 28,660 Finance costs (13,328) (12,903) Finance income 38 380 Net foreign exchange gain 171 62
Profit before tax 26,019 16,199 Income tax expense (6,145) (4,115)
Profit for the period 19,874 12,084
Profit for the period attributable to: Equity holders of the parent 19,874 12,084
Basic earnings per share for profit attributable to the equity holders of the parent (expressed in RUB per share) 292.77 178.03
Diluted earnings per share for profit attributable to the equity holders of the parent (expressed in RUB per share) 292.76 178.03
__________________________ __________________________ Igor Shekhterman Dmitry Gimmelberg Chief Executive Officer Chief Financial Officer 25 October 2016 25 October 2016

X5 Retail Group N.V. Condensed Consolidated Interim Statement of Comprehensive Income for the nine months ended 30 September 2016 (expressed in millions of Russian Roubles, unless otherwise stated)
3
__________________________ __________________________ Igor Shekhterman Dmitry Gimmelberg Chief Executive Officer Chief Financial Officer 25 October 2016 25 October 2016
Nine months ended
30 September 2016
Nine months ended
30 September 2015
Profit for the period 19,874 12,084
Total comprehensive income for the period, net of tax 19,874 12,084
Total comprehensive income for the period attributable to: Equity holders of the parent 19,874 12,084
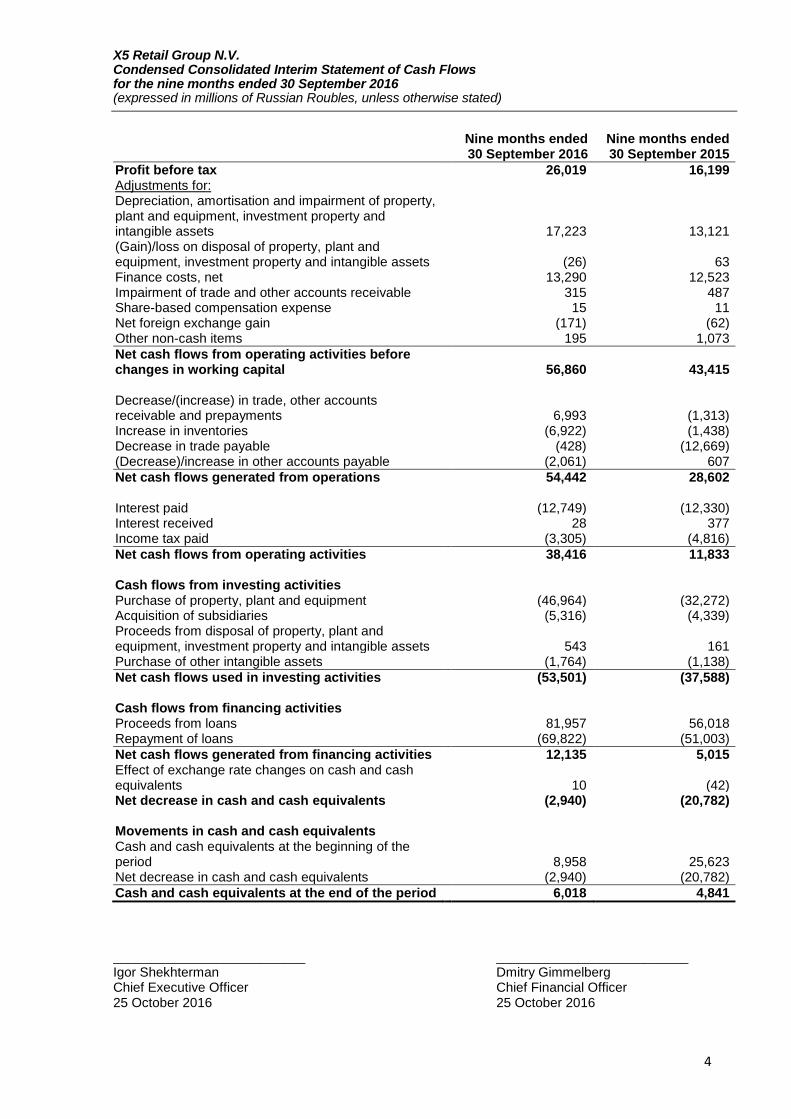
X5 Retail Group N.V. Condensed Consolidated Interim Statement of Cash Flows for the nine months ended 30 September 2016 (expressed in millions of Russian Roubles, unless otherwise stated)
4
Nine months ended 30 September 2016
Nine months ended 30 September 2015
Profit before tax 26,019 16,199 Adjustments for: Depreciation, amortisation and impairment of property, plant and equipment, investment property and intangible assets 17,223 13,121 (Gain)/loss on disposal of property, plant and equipment, investment property and intangible assets (26) 63 Finance costs, net 13,290 12,523 Impairment of trade and other accounts receivable 315 487 Share-based compensation expense 15 11 Net foreign exchange gain (171) (62) Other non-cash items 195 1,073
Net cash flows from operating activities before changes in working capital 56,860 43,415 Decrease/(increase) in trade, other accounts receivable and prepayments 6,993 (1,313) Increase in inventories (6,922) (1,438) Decrease in trade payable (428) (12,669) (Decrease)/increase in other accounts payable (2,061) 607
Net cash flows generated from operations 54,442 28,602 Interest paid (12,749) (12,330) Interest received 28 377 Income tax paid (3,305) (4,816)
Net cash flows from operating activities 38,416 11,833 Cash flows from investing activities Purchase of property, plant and equipment (46,964) (32,272) Acquisition of subsidiaries (5,316) (4,339) Proceeds from disposal of property, plant and equipment, investment property and intangible assets 543 161 Purchase of other intangible assets (1,764) (1,138)
Net cash flows used in investing activities (53,501) (37,588) Cash flows from financing activities Proceeds from loans 81,957 56,018 Repayment of loans (69,822) (51,003)
Net cash flows generated from financing activities 12,135 5,015 Effect of exchange rate changes on cash and cash equivalents 10 (42) Net decrease in cash and cash equivalents (2,940) (20,782) Movements in cash and cash equivalents Cash and cash equivalents at the beginning of the period 8,958 25,623 Net decrease in cash and cash equivalents (2,940) (20,782)
Cash and cash equivalents at the end of the period 6,018 4,841
__________________________ __________________________ Igor Shekhterman Dmitry Gimmelberg Chief Executive Officer Chief Financial Officer 25 October 2016 25 October 2016
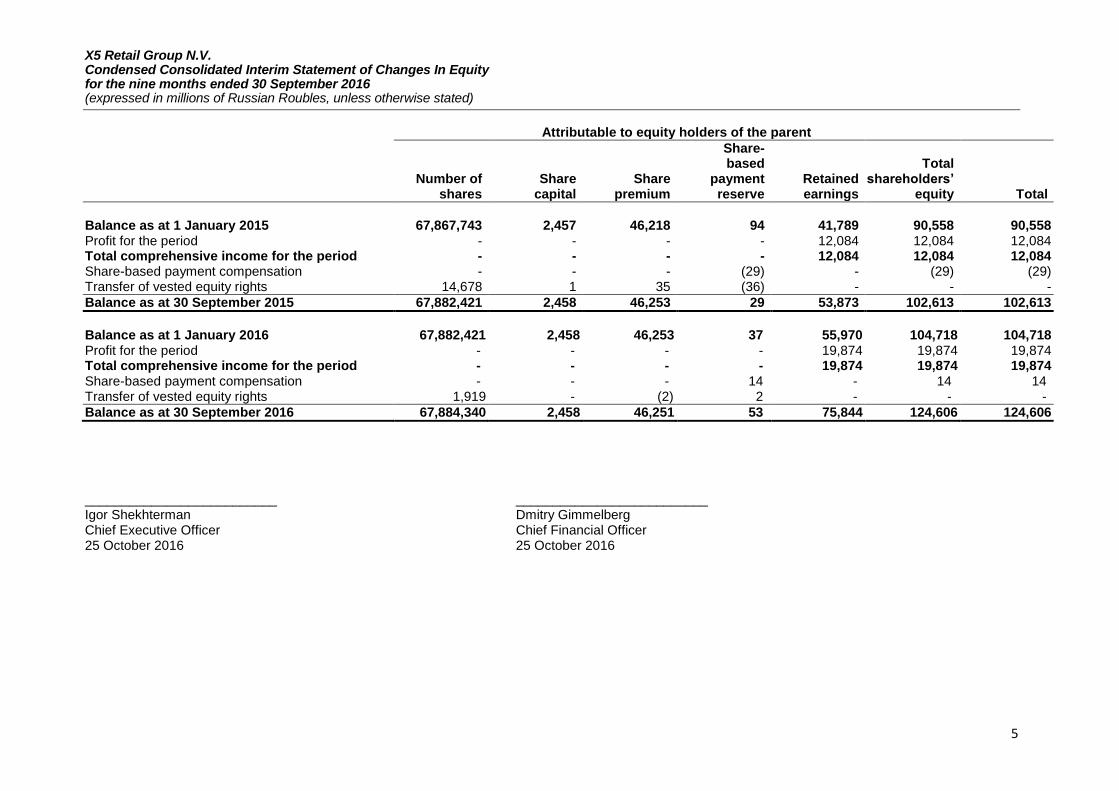
X5 Retail Group N.V. Condensed Consolidated Interim Statement of Changes In Equity for the nine months ended 30 September 2016 (expressed in millions of Russian Roubles, unless otherwise stated)
5
Attributable to equity holders of the parent
Number of
shares Share
capital Share
premium
Share- based
payment reserve
Retained earnings
Total shareholders’
equity Total
Balance as at 1 January 2015 67,867,743 2,457 46,218 94 41,789 90,558 90,558 Profit for the period - - - - 12,084 12,084 12,084 Total comprehensive income for the period - - - - 12,084 12,084 12,084 Share-based payment compensation - - - (29) - (29) (29) Transfer of vested equity rights 14,678 1 35 (36) - - -
Balance as at 30 September 2015 67,882,421 2,458 46,253 29 53,873 102,613 102,613
Balance as at 1 January 2016 67,882,421 2,458 46,253 37 55,970 104,718 104,718 Profit for the period - - - - 19,874 19,874 19,874 Total comprehensive income for the period - - - - 19,874 19,874 19,874 Share-based payment compensation - - - 14 - 14 14 Transfer of vested equity rights 1,919 - (2) 2 - - -
Balance as at 30 September 2016 67,884,340 2,458 46,251 53 75,844 124,606 124,606
__________________________ __________________________ Igor Shekhterman Dmitry Gimmelberg Chief Executive Officer Chief Financial Officer 25 October 2016 25 October 2016