X-7 - NASA
27
Transcript of X-7 - NASA


X-7 16-68- 204 PREPRINT
PHOTOVOLTAIC PROPERTIES OF U.S. AND
EUROPEAN SILICON CELLS UNDER
1-Mev ELECTRON IRRADIATION
William R. Cherry Goddard Space Flight Center
Greenbelt, Maryland
and
Richard L. Statler Naval Research Laboratory
Washington, D. C.
April 1968
GODDARD SPACE FLIGHT CENTER Greenbelt, Maryland

ABSTRACT
This paper documents the procedures and results of a project to determine the electron radiation effects on sili- con solar cells. Samples of U.S. and European cells were irradiated by means of Van de Graaff generators at Goddard Space Flight Center and the Naval Research Laboratory, and the I-V curves were determined to reveal the effects of the radiation. The paper also provides data on maximum power and power at 0.35volt for each cell irradiated. Tests were conducted on specimens manufactured in 1966 and in 1967. The paper facilitates comparison of the various cells and their associated radiation effects by the inclusion of open-circuit voltage and short-circuit current data in tab- ular form.
ii

CONTENTS
Abstract. . . . . . . . . . . . . . . . . . . . . . . . . . . . . . . ii
INTRODUCTION . . . . . . . . . . . . . . . . . . . . . . . . . . 1
EXPERIMENTAL PROCEDURE 1
RESULTS OF EXPERIMENT. . . . . . . . . . . . . . . . . 4
CONCLUSIONS. . . . . . . . . . . . . . . . . . . . . . . . . . . 10
ACKNOWLEDGMENTS . . . . . . . . . . . . . . . . . . . . . 11
. . . . . . . . . . . . . . .
iii
LIST OF ILLUSTRATIONS
Figure Page
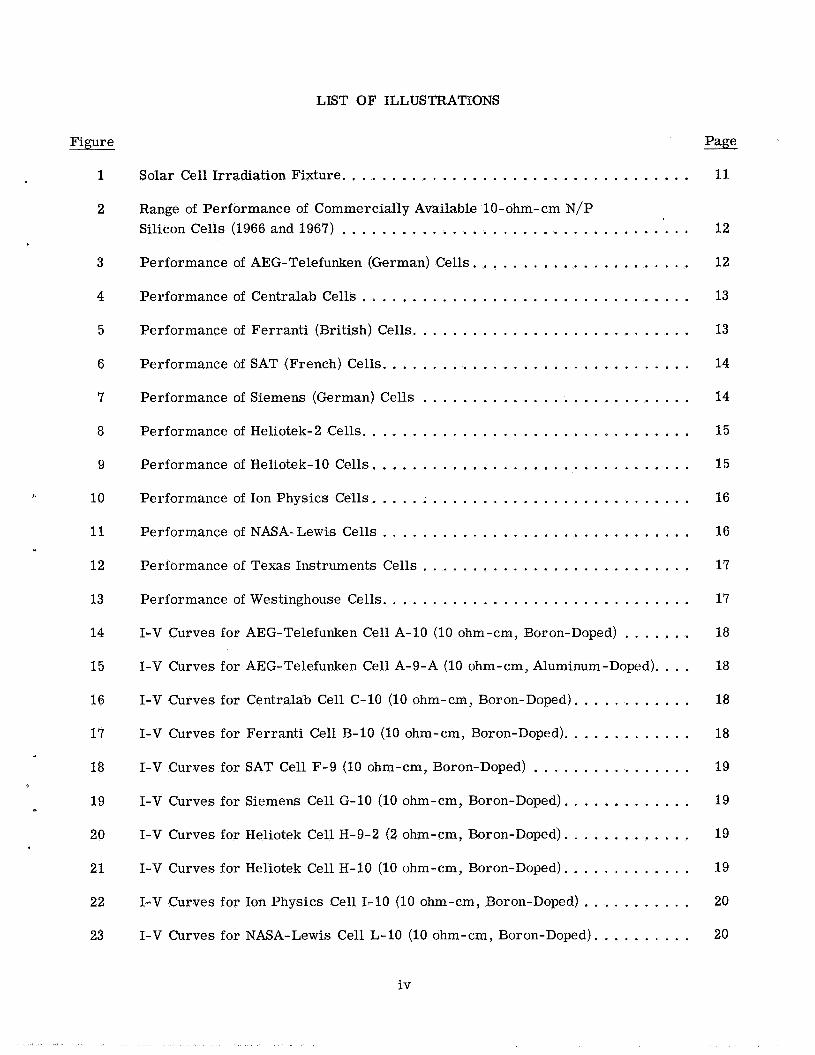
1 Solar Cell Irradiation Fixture . . . . . . . . . . . . . . . . . . . . . . . . . . . . . . . . . . . 11
2 Range of Performance of Commercially Available 10-ohm-cm N/P Silicon Cells (1966 and 1967) . . . . . . . . . . . . . . . . . . . . . . . . . . . . . . . . . . . 12
3 Performance of AEG-Telefunken (German) Cells ...................... 12
4
5
6
7
8
9
10
11
12
13
14
15
16
17
18
19
20
21
22
23
Performance of Centralab Cells . . . . . . . . . . . . . . . . . . . . . . . . . . . . . . . . . 13
13
14
14
15
15
16
16
17'
17
18
18
18
18
19
19
19
19
20
20
Performance of Ferranti (British) Cells . . . . . . . . . . . . . . . . . . . . . . . . . . . . Performance of SAT (French) Cells . . . . . . . . . . . . . . . . . . . . . . . . . . . . . . . Performance of Siemens (German) Cells . . . . . . . . . . . . . . . . . . . . . . . . . . . Performance of Heliotek-2 Cells . . . . . . . . . . . . . . . . . . . . . . . . . . . . . . . . . Performance of Heliotek-10 Cells. . . . . . . . . . . . . . . . . . . . . . . . . . . . . . . . Performance of Ion Physics Cells . . . . . . . . . . . . . . . . . . . . . . . . . . . . . . . . Performance of NASA-Lewis Cells . . . . . . . . . . . . . . . . . . . . . . . . . . . . . . . Performance of Texas Instruments Cells . . . . . . . . . . . . . . . . . . . . . . . . . . . Performance of Westinghouse Cells . . . . . . . . . . . . . . . . . . . . . . . . . . . . . . . I-V Curves for AEG-Telefunken Cell A-10 (10 ohm-cm, Boron-Doped) . . . . . . . I-V Curves for AEG-Telefunken Cell A-9-A (10 ohm-cm. Aluminum-Doped) . . . . I-V Curves for Centralab Cell C-10 (10 ohm.cm, Boron.Doped) . . . . . . . . . . . . I-V Curves for Ferranti Cell B-10 (10 ohm.cm, Boron.Doped) . . . . . . . . . . . . . I-V Curves for SAT Cell F-9 (10 ohm-cm, Boron-Doped) . . . . . . . . . . . . . . . . I-V Curves for Siemens Cell G-10 (10 ohm-cm, Boron-Doped) . . . . . . . . . . . . . I-V Curves for Heliotek Cell H-9-2 (2 ohm-cm, Boron-Doped) . . . . . . . . . . . . . I-V Curves for Heliotek Cell H-10 (10 ohm-cm, Boron-Doped) . . . . . . . . . . . . . I-V Curves for Ion Physics Cell 1-10 (10 ohm.cm, Boron-Doped) . . . . . . . . . . . I-V Curves for NASA-Lewis Cell L-10 (10 ohm-cm, Boron.Doped) . . . . . . . . . .
iv
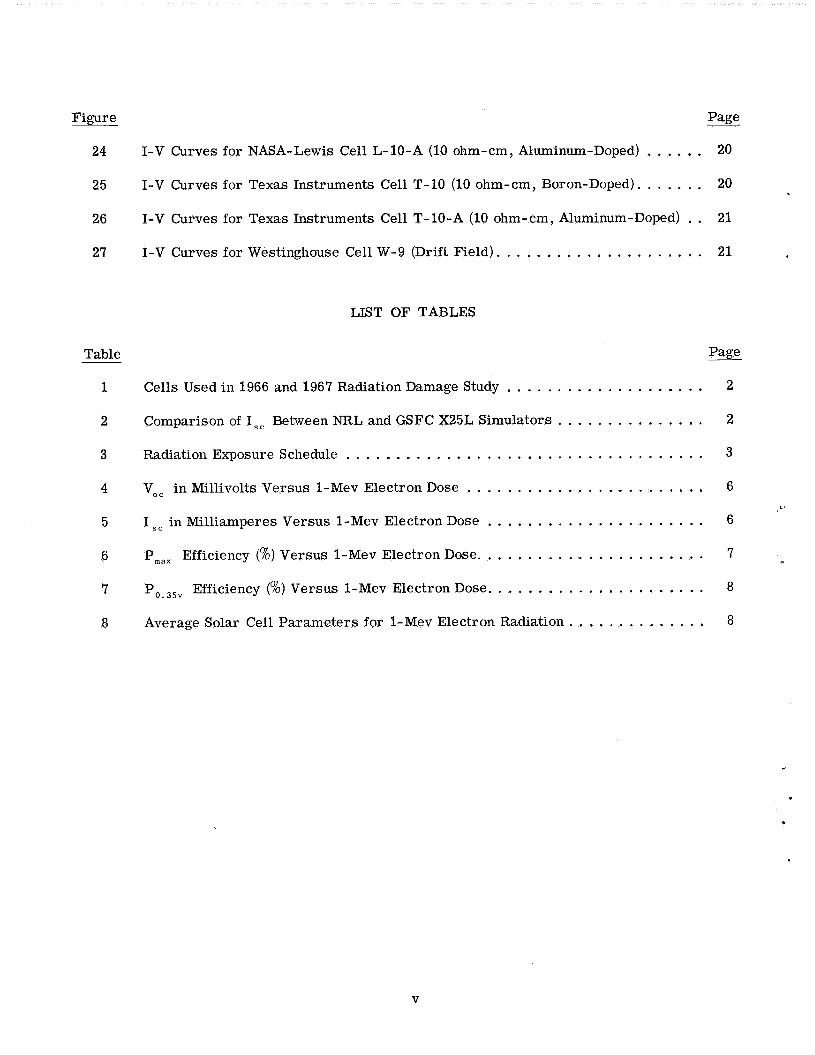
Figure Page
24
25
26
27
I-V Curves for NASA-Lewis Cell L-10-A (10 ohm.cm. Aluminum-Doped) . . . . . . 20
20
21
21
I-V Curves for Texas Instruments Cell T-10 (10 ohm.cm. Boron.Doped) . . . . . . . I-V Curves for Texas Instruments Cell T-10-A (10 ohm.cm, Aluminum-Doped) . . I-V Curves for Westinghouse Cell W-9 (Drift Field) . . . . . . . . . . . . . . . . . . . . .
Table
1
2
3
4
5
6
7
8
LIST OF TABLES
Page
2
2
Radiation Exposure Schedule . . . . . . . . . . . . . . . . . . . . . . . . . . . . . . . . . . . . 3
6
6
7
8
8
Cells Used in 1966 and 1967 Radiation Damage Study .................... Comparison of Is= Between NRL and GSFC X25L Simulators . . . . . . . . . . . . . . .
Voc in Millivolts Versus 1-Mev Electron Dose . . . . . . . . . . . . . . . . . . . . . . . . I .. in Milliamperes Versus 1-Mev Electron Dose ...................... P... Efficiency (%) Versus 1-Mev Electron Dose . . . . . . . . . . . . . . . . . . . . . . . Po.35v Efficiency (%) Versus 1-Mev Electron Dose . . . . . . . . . . . . . . . . . . . . . . Average Solar Cell Parameters for 1-Mev Electron Radiation . . . . . . . . . . . . . .
.
V
PHOTOVOLTAIC PROPERTIES OF U.S. AND
EUROPEAN SILICON CELLS UNDER
1-Mev ELECTRON IRRADIATION
by William R. Cherry
Goddavd Space Flight Centev
and
Richard L. Statler Naval Research Labovatovy
INTRODUCTION
Samples of silicon solar cells were obtained from various producers in the United States and Europe about midyear 1966 and 1967 (see Table 1). Specimens from Germany, Great Britain, and France were included as well as standard production U.S. cells, ion-implanted junction, webbed- dendrite, drift field, and three sets of boron and aluminum base-doped devices. Maximum power, power at 0.35v, and typical I-V curves for each source are shown in the report. Open-circuit voltages and short-circuit currents a r e presented in tabular form to allow comparison of cells. A transparent overlay showing the maximum power and power at 0 . 3 5 ~ of standard U.S. production solar cells as a function of 1-Mev electron fluence is provided for the convenience of the reader. It can be used to compare the relative degradation of one cell to another. It should be noted that cells used in this study were not obtained by a random sampling process, but may have been se- lected carefully and matched by the producer.
'
EXPERIMENTAL PROCEDURE 4
The I-V curve for each solar cell was obtained before irradiation by a Spectrolab X-25L solar simulator. The 1967 data were obtained using an X-25L at the Naval Research Laboratory (NRL), and the 1966 data were obtained under the same intensity and temperature conditions using an X-25L at the Goddard Space Flight Center. The intensity of the two simulators was adjusted to 140 mw/cm2 using a J P L balloon-flight standard cell for calibration. Further comparison of the two light sources was made by measuring the I-V curves of the group of 10 Heliotek 10-ohm-cm N/P cells from the 1966 experiment on the two light sources just before the 1967 experiment. This comparison is shown in Table 2. The cells were measured in a water-cooled cell holder at a temperature of 26"C, using 4-terminal pressure contacts to eliminate contact resistance effects
b
1

Table 1
Cells Used in 1966 and 1967 Radiation Damage Study.
Percentage Difference t%
Source
GSFC Dosage (e/cm2)
Centralab (Hoffman) Heliotek Heliotek Texas Instruments
70.3 70.4
61.1 I 67.5
Ion Physics Westinghouse
4 .O
NASA-Lewis
1016 53.0 50.9
Fer ran t i (British) SAT (French) Siemens (German)
AEG-Telefunken (German)
Cell No.
HE-1 HE-2 HE-3 HE-4 HE-5 H E-6 HE-7 HE-8 H E-9 HE-10
Year
1966-67 1966-67 1967
1967
1966 196 7 196 7 1967
1966-67
1966-67
1966 -6 7 1966-67 1966 1967 1967 1967
Cell Type
10-ohm-cm N/P boron 10-ohm-cm N/P boron 2-ohm-cm N/P boron 10-ohm-cm-N/P boron 10-ohm-cm N/P aluminum 10-ohm-cm N/P ion implanted 10-ohm-cm N/P webbed dendrite 10-ohm-cm N/P webbed-dendrite, drift field 10-ohm-cm N/P boron 10-ohm-cm N/P aluminum 10-ohm-cm N/P boron 10-ohm-cm N/P boron 1-ohm-cm N/P boron 10-ohm-cm N/P boron 10-ohm-cm N/P boron 10-ohm-cm N/P aluminum
Table 2
Comparison of Isc Between NRL and GSFC X-25L Simulators. (I s c measured under X-25L at 140 mw/cm 2,
Dosage (e/cm2)
0 0
10 l3
10 l3
10 l4
1014 1015 1015 1016 10'6
70.1 70.6 70.7 70.7 68.7 69.1 62.3 63.1 52.3 53.7
70.1 70.5 71 .O 69.8 67.2 67.7 61.0 61.2 50.5 51.2
Average Is= for Each Dosage at Different Simulators
< 0.1 0.4 2 .o 2.5
I I
0 1013 1014 1015
70.4 70.7 68.9 62.7
2

from the I-V curve. The intensity of the simulator was monitored continuously by means of the standard cell and displayed on a digital voltmeter throughout the measurement period.
No. of I-V Measurements Taken at Each Dose Level
for Each Cel l Source
1966 196 7
Dose Rate (e/cm Vsec)
0 10 10
10 lo 8 8
101' 6 6
2 x 1 0 1 ' 4 4
3 4 x10¹¹ -- 4 x101 ' 2 2
The I-V curves were then plotted automatically on an X-Y recorder while a continuously var- iable resistive load was placed across the solar cell current terminals. These data were used to calculate efficiency, maximum output power, and power at a fixed voltage of 0.35 volt. The cells were then irradiated according to the schedule in Table 3. Following each incremental dosage, the I-V curve for each irradiated cell was obtained under the calibrated solar simulator.
No. of Cells Withdrawn at Dose Level
1966 1967
2 2
2 2
2 2
2 1
1
2 2
--
Table 3
The bombardment of the 1967 cells was done at the NRL 2-Mev electron Van de Graaff ac- celerator. This machine produces a vertical electron beam which is scattered through the 3-mil aluminum window and a 6-inch air path. The cumulative scattering effects of the window and air provide a beam spot with a 2-inch diameter and a 5-percent intensity variation as measured by a Faraday cup.
For dosage uniformity, all cells were placed in recesses near the periphery of an aluminum wheel (27.5-inch diameter) which was rotated at 10 rpm 6 inches below the beam tube of the Van de Graaff generator (Figure 1). Each cell thus moved in a circular path through the flux pattern at 6 inches below the exit window. This technique, together with the inherent beam current stabil- ity of the NRL 2-Mev Van de Graaff generator, ensured that all cells received the same exposure dosage to a fraction of 1 percent. The electron flux was calibrated before each bombardment by means of a vacuum Faraday cup placed in the center of the flux pattern through which the cells would later move. The measured flux was then correlatedwith the short-circuit current generated in a heavily preirradiated solar cell (approximately 10l7 e/cm2) by exposure to the same flux. This cell was fastened near the periphery of the aluminum wheel in such a manner that its short- circuit current and temperature, by means of a thermistor, could be monitored through commuta- tor contacts to a station outside the Van de Graaff room. A pre-irradiated cell was used to en- sure that the diffusion length of the radiation monitoring cell remained practically constant. The
3

use of the cell attached to the wheel permitted an irradiation duty cycle to be obtained before each bombardment and provide for continuous monitoring of the exposure flux during the actual bombard- ment. At no time during the irradiation did the solar cell temperature exceed 34°C.
The 1966 cells were irraciiated at the GSFC 2-Mev Van de Graaff generator i n a similar man- ner. Even though the GSFC accelerator has a horizontal beam, the experimental procedures were comparable. Typical dosage rates a r e shown in Table 3.
RESULTS OF EXPERIMENT
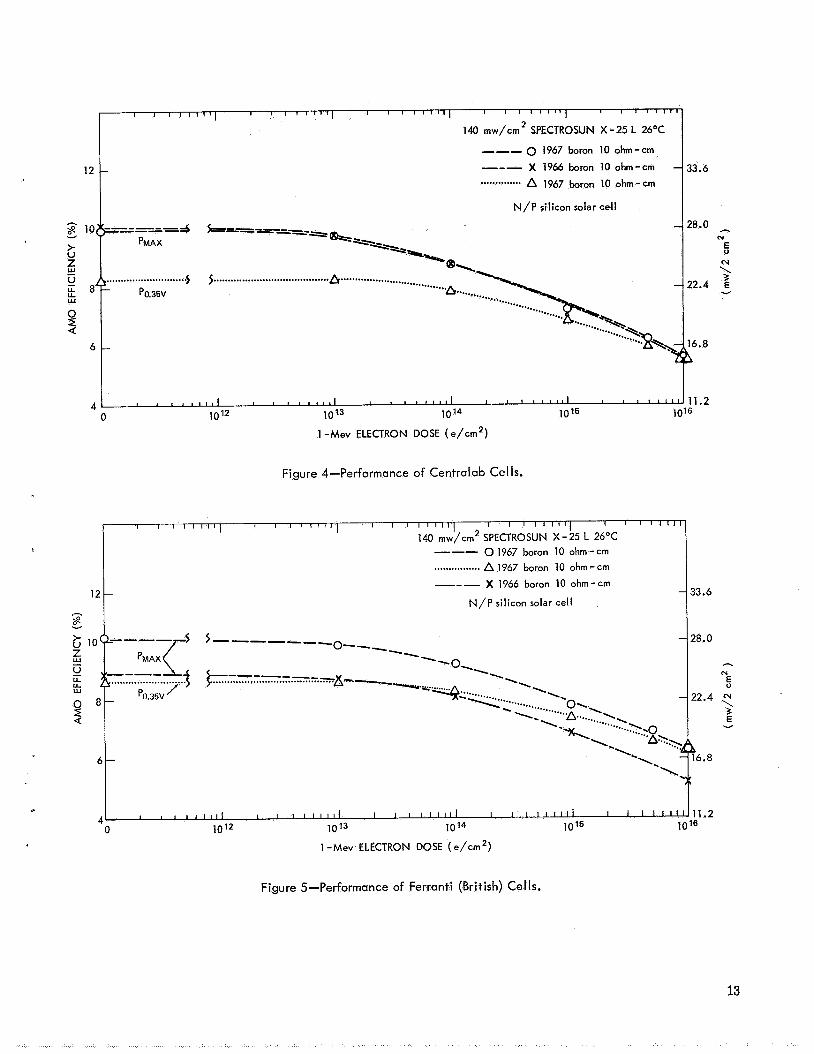
The transparent overlay, Figure 2, is the “envelope“ of data obtained from U.S. commercially available cells from Centralab, Heliotek, and Texas Instruments (T.I.), ranging from 9.9 to 10.6 percent air mass zero ( A M O ) efficiency and irradiated with 1-Mev electrons. Comparison of Fig- u re 2 with Figures 3 through 13 reveals the comparative performance of cells submitted from other sources. It should be remembered that cells from other than the commercial producers might be highly selective and therefore not representative of production cells from that source. The illus- trated values show the maximum power output for both 1966 and 1967 cells and power at 0 . 3 5 ~ for 1967 cells to a 1-Mev electron fluence of 10 l6/cm2. No samples were obtained in 1966 for AEG- Telefunken and NASA-Lewis. However , substantial improvement in performance was seen in SAT, Ferranti, Siemens (however, note odd effect), Ion Physics, and Westinghouse from 1966 to 1967. Production cells (Centralab, Heliotek, and T.I.) seem quite comparable for both years. In all cells except the Westinghouse webbed-dendrite drift field, the maximum power point and power at 0 . 3 5 ~ coincide almost at 1OI6 1-Mev electrons. The Westinghouse cell seemed to have maximum power at a voltage slightly greater than 0.35 volt at 1 O I 6 1-Mev electrons.
L
B.
Efficiencies are based on 2 cmz areas. Since there were a variety of bus bar and grid line designs and most cells a r e now flat mounted rather than shingled, the total 2 cmz area was charged to each device. Some of the European cells (SAT, AEG, and Siemens) were 4 cmz ; therefore, the power shown is based on half the total cell output. Also, the Ion Physics ion-implanted cells were covered with CeO as an antireflective coating. Experience has shown that a cell using CeO is less efficient than a similar cell using S i0 in air. The opposite is true after applying cover glasses.* Since all tests were performed in this experiment with cells without cover glass, the Ion Physics cells do not appear as efficient as they may be with cover slips.
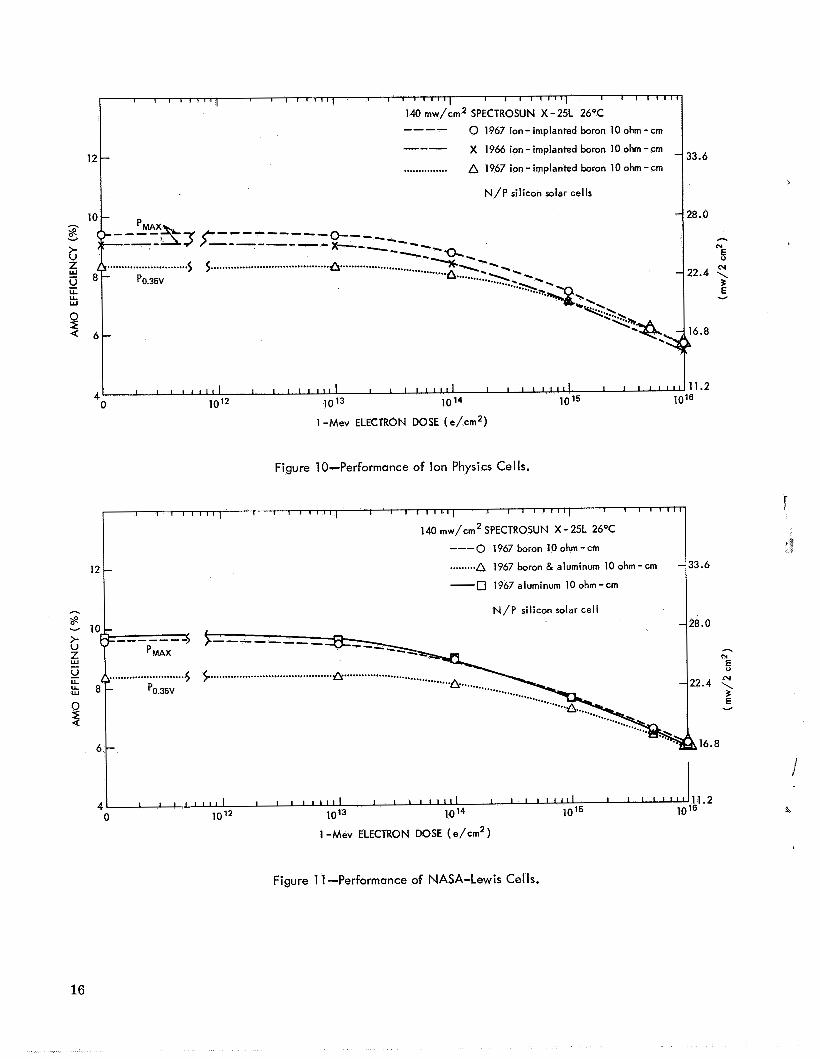
Three organizations submitted both boron and aluminum base-doped 10-ohm-cm cells (AEG- Telefunken, NASA-Lewis, and Texas Instruments, Inc.). From the data observed in this experi- ment, there seems to be no significant difference in the maximum power output between the alum- inum and boron-doped cells of AEG and NASA-Lewis. Texas Instruments aluminum-doped cells appear slightly superior to their boron-doped cells from 10 l 5 to 10 l 6 1-Mev electron doses. This difference is, however, quite small and may result from the small sample size of the experiment at these large doses. The authors believe that there is little, if any, difference between aluminum and boron base-doped cells from a radiation resistance standpoint.
*“Reflections on a Solar Ce l l , ” Implion News, 1(2), Ion Physics Corp.
4

9
Ion-implanted cells (Figure 10) which have CeO, antireflection coatings , had initial efficiencies of about 9.4 percent. At 10 l5 and 10 l6 1-Mev electron doses, their performance looked as good as that of commercial solar cells with initial efficiencies of 10 percent.
Webbed-dendrite, drift field cells (Figure 13) from Westinghouse had initial efficiencies of 9.6 percent but required about three times the dose to reduce their power output to the same level as a 10-percent efficient 10-ohm-cm commercial cell at a dose of 10l5 1-Mev electrons. This was particularly surprising because the drift field cell had open-circuit voltage characteristics of a 1-ohm-cm device. Perhaps this is one way to obtain both higher voltage and good radiation resistance.
AEG-Telefunken, SAT, and Ferranti cells all appear to withstand 1-Mev electron irradiation better than the U.S. commercial cells. To reach the same maximum power level as the equivalent U.S. cell at 10l5 1-Mev electrons, it was necessary to subject the European cells to two or more times as large a dose. While the European processes appeared to be very similar to U.S. methods, all of the previously mentioned sources vsed European silicon, as was explained to one of the authors on a 1967 tour of the European industry.
An unexplained effect was observed with the 1967 Siemens solar cells. They behaved in a normal manner as 10-ohm-cm cells up to a dose of 10 l4 1-Mev electrons (Figure 7). Then the cells dropped into catastrophic decline at 10 15, 5 X 10 l5 and 10l6 fluence. Measurements a few days after the irradiation showed some room-temperature annealing. Within 1 month, the highly damaged cells had recovered to the level of normal cells irradiated to the same degree. This strange effect is noted on the Siemens chart as solid and dotted circles. The 1967 curves for P,,, and Po.35v are drawn through points measured 4 months after the irradiation. Cells submitted by Siemens in 1966 were very early state-of-the-art for them and had the properties of 1- to 2-ohm- cm silicon.
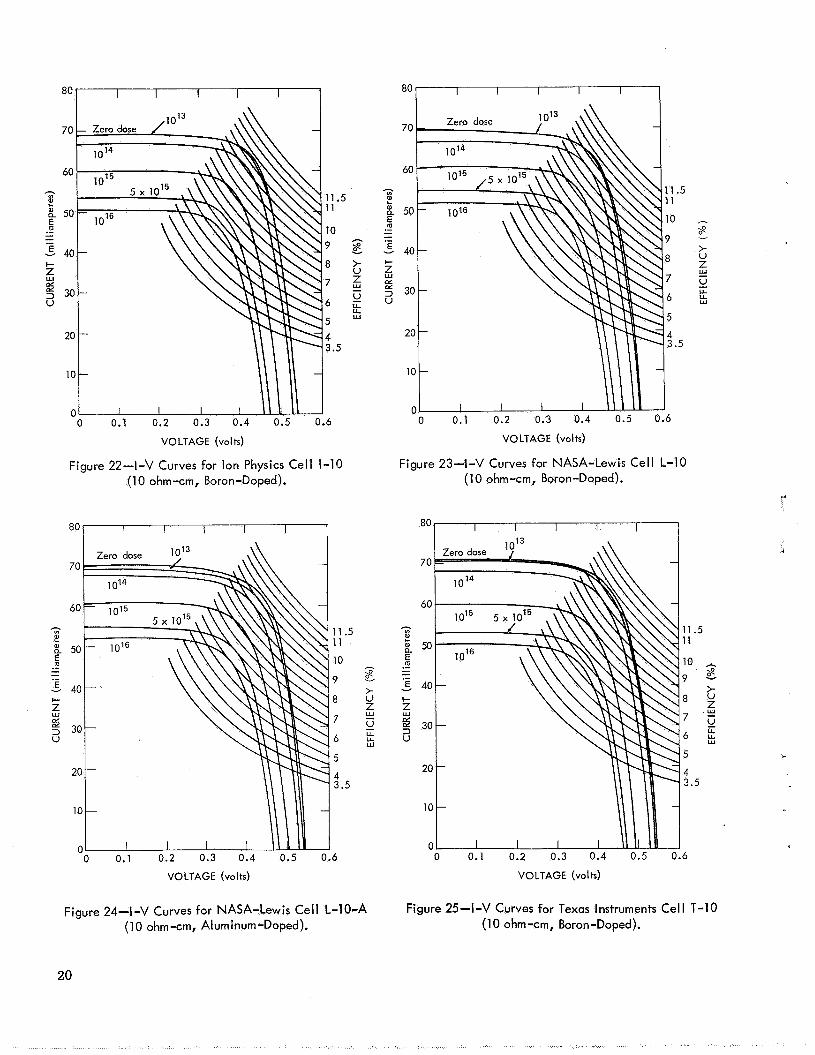
Figures 14 through 27 are I-V curves of typical cells received from each source. It should be noted, however, that the AEG aluminum, Ion Physics ion-implanted, and the NASA-Lewis boron curves shown are slightly better than the average of the cells tested while the Heliotek 2-ohm-cm cell and the Westinghouse webbed-dendrite, drift field I-V curves shown are slightly worse than the average. The r e s t of the I-V curves are typical of the samples measured.
Table 4 shows the average V,, for each 1967 source of cells at the various dosages. By ref- erence to Table 3 it will be seen that each figure appearing in the zero-dose column is the average of 10 cells, while the figure in the 10 l5 column is the average of 4 cells, etc. Notice that the Westinghouse webbed-dendrite , drift field cell developed voltages similar to, or higher than, the Heliotek 2-ohm-cm cells. The rest of the cells ranged from 538 mv to 551 mv, characteristic of 10-ohm-em cells.
Table 5 shows the I,, per 2 cm2 for each source of cells at the various dose levels. The same number of measurements apply at each dose level as in the V,, case and as shown in Table 3.
5

Identification
AEG-boron
AEG-aluminum
Centralab-boron
Ferranti-boron
SAT-boron
Siemens-boron
Heliotek-boron4
Heliotek-boron-10
Ion Physics-ion impl.
Lewis-boron
Lewis-aluminum
T.1.-boron
T .I.-aluminum
Westinghouse web/drift
Identification
A EG-boron
AEG-aluminum
Centralab-boron
Ferranti-boron
SAT-bwon
Siemens-boron
Heliotek-boron-:!
Heliotek-boron-10
Ion Physics-ion impl.
Lewis-boron
Lewis-aluminum
T.1.-boron
T .I. -aluminum
Westinghouse-web/drift
Table 4
V,, in’Millivolts Versus 1-Mev Electron Dose. ___
0
549
550
548
546
543
551
577
544
538
542
543
546
550
592
t O 1 3 e/cm2
545
548
544
542
54 1
549
5 73
540
536
540
540
542
549
590
1014 e /cm2
5 34
535
525
530
531
530
554
523
525
529
529
52 7
536
5 80
1015 e /cm2
505
507
493
503
502
499
521
4 92
496
502
501
494
506
542
5 x 10” e/cm2
479
481
46 8
480
4 79
4 72
496
466
469
478
477
469
4 79
501
Table 5
I sc in Milliamperes Versus 1-Mev Electron Dose. -
0
73.4
71.6
68.3
69.9
68.8
72.1
66.8
71.1
69.0
68.9
69.6
72.4
70.9
62.5 -
-013 e/cm2
72.9
71.3
67.8
69.6
68.2
71.5
66.1
70.9
68.8
68.5
69.3
72.4
70.8
62.2
e /cm2
70.4
68.6
64.1
67.0
66.3
67.8
61.7
6 7.5
66.3
66.2
66.7
69.5
68.6
61.2
e /cm2
63.2
61.4
5 7.0
60.4
60.1
59.6
54.8
60.2
60.2
59.7
60.7
60.9
62.2
58.2
5 x lo1’ e/cm2
56.8
54.5
51.0
55.5
54.5
52.5
47.3
53.9
53.7
53.5
54.5
53.8
56.2
53.0
e /cm2
466
470
456
469
468
459
481
455
459
466
465
456
466
4 82
1 0 ’ ~ e /cm2
54.1
52.5
47.8
53.3
52.4
49.7
43.7
51.3
50.3
50.9
51.7
50.1
53.2
50.8
4
c
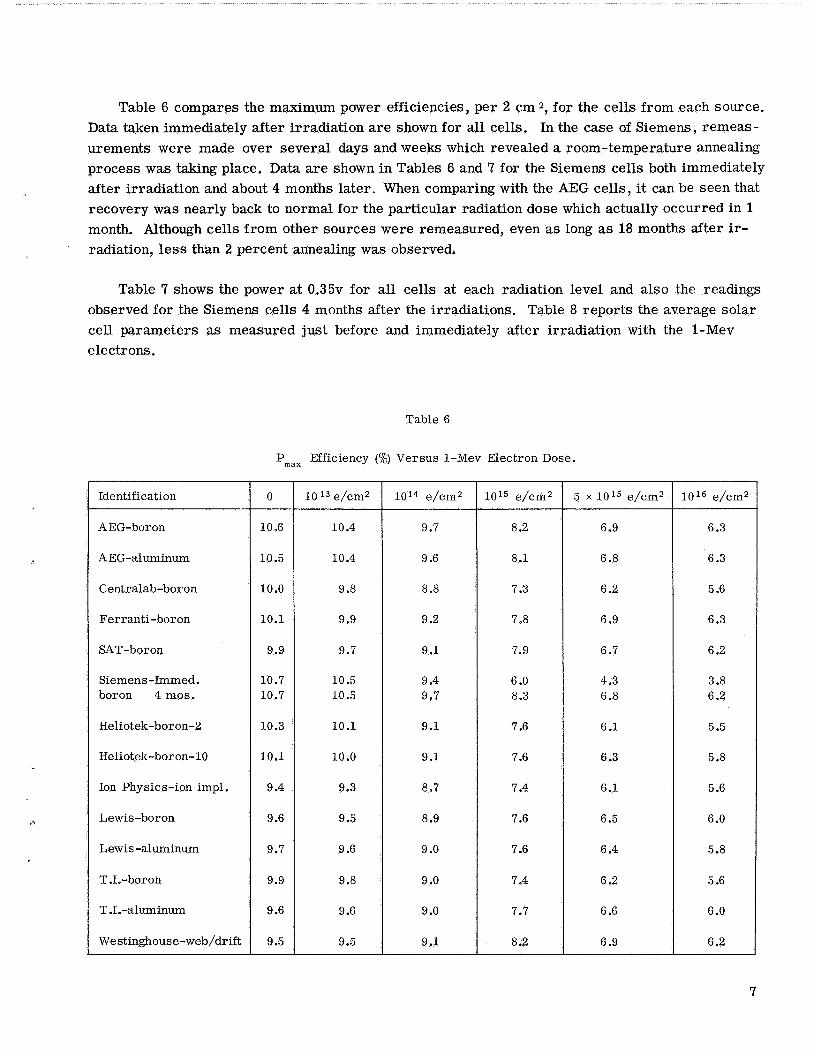
Table 6 compares the maximum power efficiencies, per 2 cm 2, for the cells from each source. Data taken immediately after irradiation a re shown for all cells. In the case of Siemens, remeas- urements were made over several days and weeks which revealed a room-temperature annealing process was taking place. Data a re shown in Tables 6 and 7 for the Siemens cells both immediately after irradiation and about 4 months later. When comparing with the AEG cells, it can be seen that recovery was nearly back to normal for the particular radiation dose which actually occurred in 1 month. Although cells from other sources were remeasured, even as long as 18 months after ir- radiation, less than 2 percent annealing was observed.
Table 7 shows the power at 0 . 3 5 ~ for all cells at each radiation level and also the readings observed for the Siemens cells 4 months after the irradiations. Table 8 reports the average solar cell parameters as measured just before and immediately after irradiation with the 1-Mev electrons.
Table 6
Pmax Efficiency (lo) Versus 1-Mev Electron Dose.
Identification
AEG-boron
A EG-aluminum
Centralab-boron
Ferranti-boron
SAT-boron
Siemens-Immed. boron 4 mos.
Heliotek-boron-2
Heliotek-boron-10
Ion Physics-ion impl.
Lewis-boron
Lewis-aluminum
T.1.-boron
T .I.-aluminum
Westinghouse-web/drift
- 0
1006
10.5
10.0
10.1
9.9
10.7 10.7
10.3
10.1
9.4
9.6
9.7
9.9
9.6
9.5
-
-
10 13 e/cm2
10.4
10.4
9.8
9.9
9.7
10.5 10.5
10.1
10.0
9.3
9.5
9.6
9.8
9.6
9.5
9.7
9.6
8.8
9.2
9.1
9.4 9.7
9.1
9.1
8.7
8.9
9 .o
9 .o
9 .o
9.1
10 l5 e/cmz
8.2
8.1
7.3
7.8
7.9
6 .O 8.3
7.6
7.6
7.4
7.6
7.6
7.4
7.7
8.2
6.9
6.8
6.2
6.9
6.7
4.3 6.8
6.1
6.3
6.1
6.5
6.4
6.2
6.6
6.9
6.3
6.3
5.6
6.3
6.2
3.8 6.2
5.5
5.8
5.6
6 .O
5.8
5.6
6.0
6.2
7

Identification
A EG-boron
AEG-aluminum
Centralab-borbn
Ferranti-boron
SAT-boron
Siemens-hnmed. boron 4 m o s .
Heliotek-boron-2
Heliotek-boron-10
Ion Physics-ion impl.
Lewis -boron
Lewis -aluminum
T.1.-boron
T.1.-aluminum
Westinghouse -web/drift
550 548 535 507 481 4 70
548 544 525 493 468 456
Cell Type
58.9 58.2 53.7 45.6 38.1 35.2
28.0 27.4 24.7 20.3 17.3 15.7
AEG-Telefunken 10 ohm-cm, boron, 2 x 2 c m
A EG-Telefunken 10 ohm-cm, aluminum, 2 x 2 c m
Centralab 10 ohm-cm, boron,
I
Table 7
Po. 35v Efficiency (%) Versus 1-Mev Electron Dose. - 0
9.1
8.9
8.4
8.7
8.5
9 .O 9 .O
8.2
8.7
8.4
8.4
8.5
8.7
8.5
7.7
- i O 1 3 e/cm2
9 .O
8.8
8.4
8.6
8.4
8.9 8.9
8.2
8.7
8.3
8.3
8.4
8.7
8.5
7.7
1014 e/cm2
8.6
8.5
7.9
8.2
8.2
8.4 8.7
7.6
8.3
8 .O
8 .O
8.1
8.3
8.2
7.5
i o i 5 e/cm2
7.7
7.5
.6.9
7.4
7.4
5.9 7.6
6.8
7.2
7.1
7.2
7.3
7.1
7.3
7.1
5 x10¹⁵ e/cm2
6.7
6.6
6 .O
6.7
6.5
3.7 6.7
5.8
6.3
6.1
6.4
6.4
6.2
6.5
6.4
Table 8
Average Solar Cell Parameters for 1-Mev Electron Radiation.
1-Mev Electron Fluence (e/cm2)
0 10 l3
10 14
10 l 5
5 x10¹⁵ 10 l 6
0 10 l3
1014 10 15
5 x10¹⁵ 10 16
0 10 13
1014 1015
5 x10¹⁵ 10 16
AM0 Efficiency
(%I
10.6 10.4
9.7 8.2 6.9 6.3
10.5 10.4 9.6 8.1 6.8 6.3
10 .o 9.8 8.8 7.3 6.2 5.6
Short- Circuit Current
(ma)
146.8 145.9 140.9 126.3 113.5 108.2
143.2 142.7 137.3 122.9 109.1 105 .O
68.3 67.8 64.1 57.0 51 .O 47.8
Open- Circuit Voltage
tmv)
Maximum Power (mw)
549 545 5 34 505 479 466
59.4 58.5 54.3 45.9 38.7 35.4
10 l6 e/cm2
6.3
6.2
5.6
6.2
6.1
2.9 6.1
5.2
5.8
5.6
6 .O
5.9
5.5
6 .O
6 .O
Power at 0.35 volt
(mw)
50.7 50.3 48.4 43.1 37.6 35.4
49.7 49.2 47.5 42.2 36.8 34.8
23.5 23.4 22.2 19.4 16.9 15.6
8

Table 8 (Continued)
50.3 49.8 47.0 33.1 20.7
1 16.0
I
Westinghouse webbed- dendrite, drift field, boron, l x 2 c m
I 1-Mev
0
10 14
10 13
10 15
5 1015 1016
Short- Circuit Current
(ma)
26.2 26 .O 24.3 20.8 17.2 15.7
26.8 26.5 24.8 21.3 18.2 16.8
Open- Circuit Voltage
(mv) 546 542 530 503 480 469
544 540 523 492 466 455
23.4 23.3 22.4 20 .o 17.1 15.7
23.4 23.3 22.5 20.1 17.8 16.7
Maximum Power (mw)
Power at 0.35 volt
(mw)
AM0 Efficiency
(%I
10.1 9.9 9.2 7.8 6.9 6.3
10.1 10 .o
9.1 7.6 6.3 5.8
10.3 10.1
9.1 7.6 6.1 5.5
9.9 9.7 9.1 7.9 6.7 6.2
Electron Fluence
Cell Type
69.9 69.6 67.0 60.4 55.5 53.3
28.3 27.7 25.8 21.8 19.4 17.5
24.3 24.1 23.1 20.7 18.7 17.4
Ferranti 10 ohm-cm, boron, l x 2 c m
0 1013 1014 1015
5 1015 1016
24.5 24.4 23.1 20.3 17.6 16.3
Heliotek 10 ohm-cm, boron, l x 2 c m
0 1013 1014 1 0 1 5
5 1015 10'6
28.3 28 .O 25.4 21.2 17.7 16.3
71.1 70.9 67.5 60.2 53.9 51.3
66.8 66.1 61.7 54.8 47.3 43.7
0 1013 1014 1015
5 1015 10'6
577 5 73 5 54 521 496 481
28.8 28.4 25.6 21.4 17.1 15.4
23.0 22.9 21.4 18.9 16.1 14.7
Heliotek 2 ohm-cm, boron, l x 2 c m
10 ohm-cm, boron, 2 ~ 2 c m
0 1013 1014 1015
5 x10¹⁵ 1016
137.5 136.5 132.6 120.3 109.1 104.9
55.6 54.4 51.2 43.9 37.4 34.9
47.7 47.0 45.6 41.2 36.5 34.4
543 541 531 502 4 79 46 8
551 549 530 499 4 72 459
Siemens 10 ohm-cm, boron, 2 x 2 c m
10.7 10.5
9.4 6 .O 4.3 3.8
144.2 143.1 135.7 119.3 105.1 99.5
59.9 59.0 52.6 33.4 24.1 21.5
62.5 62.2 61.2 58.2 53 .O 50.8
592 590 5 80 542 501 482
26.7 26.5 25.5 23.6 19.3 17.4
21.6 21.5 21.1 20 .o 18 .O 16.9
9.5 9.5 9.1 8.2 6.9 6.2
Ion Physics 10 ohm-cm, boron, l x 2 c m
0 1013
1015 5 1015
10 l4
10'6
9.4 9.3 8.7 7.4 6.1 5.6
69.0 68.8 66.3 60.2 53.7 50.3
538 536 525 4 96 469 459
542 540 5 29 5 02 478 466
68.9 68.5 66.2 59.7 53.5 50.9
NASA-Lewis 10 ohm-cm, boron, 1 x 2 c m
9.6 9.5 8.9 7.6 6.5 6 .O
9

Table 8 (Continued)
Short- Circuit Current
(ma)
I Open- Circuit Voltage
Maximum Power (mw) (mv)
Cell Type
0 10 13
10 14
10 15
5 x10¹⁵ 10 16
0 10 13
10 l4
10 l5
5 x 10¹⁵ 10 l6
0 10 13
10 l 4
10 15
5 x 10 l5
10 l6
NASA-Lewis 10 ohm-cm, aluminum, l x 2 c m
Texas Instruments 10 ohm-cm, boron, 1 x 2 c m
Texas Instruments 10 ohm-cm, aluminum , l x 2 c m
9.7 9.6 9 .o 7.6 6 -4 5.8
9.9 9.8 9 .o 7.4 6.2 5.6
9.6 9.6 9 .o 7.7 6.6 6 .O I
543 540 529 5 01 477 465
546 542 527 494 469 456
550 549 5 36 506 4 79 466
CONCLUSIONS
27.3 26.9 25.1 21.2 18.0 16.4
27.8 27.5 25.2 20.7 17.5 15.6
26.9 26.8 25.2 21.6 18.5 16.8
1-Mev Electron Fluence Efficiency
69.6 69.3 66.7 60.7 54.5 51.7
72.4 72 A 69.5 60.9 53.8 50.1
70.9 70.8 68.6 62.2 56.2 53.2
Power at 0.35 volt
(mw)
23.7 23.6 22.6 20.3 17.8 16.4
24.5 24.5 23.2 20.0 17.3 15.5
23.8 23.8 22.9 20.5 18.2 16.7
1. All 1967 European cells showed a marked improvement in efficiency over the samples sub- ;
mitted in 1966.
2. The average degradation of European 10-ohm-cm, boron-doped cells (excluding Siemens) was slightly less than the degradation of the three commercial U.S. 10-ohm-cm, boron-doped cells under equal 1-Mev electron doses. This is even true of the Siemens cells after a room-temperature annealing for at least 1 month. All of these cells used silicon obtained from European sources. The European cells required about 2 X 10 l5 1-Mev electrons to reach the same level of degradation as U.S. commercial cells attain at 10 15 e/cm2.
3. Three producers provided both aluminum and boron-doped cells- AEG, NASA-Lewis, and T.I. No significant difference in performance was observed between the two types of doping in any case, Our conclusion is that it makes little difference in the room temperature degradation rates of 10-ohm-cm, silicon solar cells.
-
L
4. Initial efficiencies of both ion-implanted junction cells and webbed-dendrite, drift field cells appear approximately 5 percent lower than the average commercial N/P boron-doped diffused junc- tion cell. However , at 10 l5 and 10 l6 electrons/cm2 the ion-implanted cell was comparable with the commercial cells , while the webbed-dendrite, drift field maintained a higher power output, being approximately three times as radiation-resistant as the 10-ohm-cm N/P U.S. commercial cell. Some loss of performance in the ion-implanted cell may be attributed to the CeO, antireflec- tion coating.
10

5 . The observations made with respect to the Westinghouse webbed-dendrite, drift field cell a r e particularly interesting. It appears from these data that these cells have good resistance to radiation damage up to 10 l5 e/cm2 , at which dose the degradation rates increase substantially. In spite of these characteristics, however, the end-point efficiency was among the best of all cells examined. Also, their voltage remained high throughout the entire experiment.
6. As was expected, the degradation of 2-ohm-cm silicon cells was greater than for 10-ohm- cm cells with this difference becoming apparent at doses greater than 10 l 5 e/cm2 as determined by efficiency data.
7. The 1967 Siemens cell displayed unusually great degradation after 10 l4 e/cm2. Periodic remeasurements showed a significant room-temperature annealing such that within 1 month the cells were comparable with other Western European cells. The cells had initial and final char- acteristics of 10-ohm-cm N/P solar cells. No explanation of this phenomenon has yet been made. Possibly low dose rates would not have affected this cell catastrophically at the higher doses, thus making it appear much more normal than under the high fluence rates of this experiment.
ACKNOWLEDGMENTS
Appreciation is expressed to the organizations which submitted solar cells for evaluation both in the U.S. and Europe. Particular thanks a re due Messrs. William Gdula, Segun Park, and Jules Hirschfield of the Goddard Space Flight Center for assistance and support during the 1966 exper- iment and Mr. Max Sharp and personnel of Satellite Techniques Branch of the Naval Research Laboratory for similar help during 1967.
1
Figure 1 -Solar Cell Irradiation Fixture.
11

12
h
8 w
t; 10
E
2
g
0
U LL Lu
I I I I I l l l l I I I I I l a c 1 I I I I I
- 33.6 -
< c
'MAX : : - 28.0
h
N .................................. ........................................................... ................................... ........................................................
5 I 5 I 0.35V
8 -
6 -
12
h
8 w
t; 10
E
2
g
0
U LL Lu
1 -MeV ELECTRON DOSE (e /cm2)
- 33.6 -
< c
'MAX : : - 28.0
h
N .................................. ........................................................... ................................... ........................................................
5 I 5 I 0.35V
8 -
6 -
Figure 2-Range of Performance of Commercially Available 10-ohm-cm N/P Silicon Cells (1966 and 1967).
I I I I I I l l 1 I I 1 1 1 1 1 1 I I I 1 1 1 1 1 I I I I I I I I I I I I I I I I 1 11.2
I I I ' ( ' 1 1 1 I I I l l 1 1 1 I I 1 I 1 I I I I I I I I I I l l I I I I I I I ~
140 inw/cm2 SPECTROSUN X - 25L 26'C ---- 0 1967 boron 10 ohm - cm
................ A 1967 boron & aluminum 10 ohm - cm
10 ohm - cm
- 12 -
1967 aluminum
........................ ............................ ............ ............ ...... ... ...... 22.4 ..... 3 .....
h N/P sil icon solar ce l l -----
I 5 ........................................a. L w '0.35,
I
33.6
I I I I l l 1 1 I I I I I I I I , I I I I I I 11.2
I I I I I , I I 1
1013 1014 1015 10 ' 6 10'2 4 0
1 -MeV ELECTRON DOSE ( e/cm2)
Figure 3-Performance of AEG-Telefunken (German) Cells.
12
k
12
h g! 10, v
G 5 -
2
8' U Ly
0
6
4
I I I I l l 1 1 I I I I I I l l I , I I I I I I I I I I I I 8 5 , I I I I I I
140 mw/cm2 SPECTROSUN X-25 L 26OC
.......................... I - p0.35V
--- X 1966 boron 10 ohm-cm
--- 0 1967 boron 10 ohm-cm
a 1967 boron 10 ohm-cm .............. N / P sil icon solar c e l l
1 -MeV ELECTRON DOSE ( e / c m 2 )
Figure 4-Performance of Centralab Cells.
12
w
Q
6t-
--- 0 1967 boron 10 o h m - c m ................ A 1967 boron 10 ohm - cm
--- X 1966 boron 10 ohm-cm
N/P sil icon so lar cell
I I I I l l I I I I I I I I I I I I 1 I I I I I I I I I I I l l / I I l l 1 1
0 10'2 1013 1014 10'5 4
1 -MeV. ELECTRON DOSE ( e / c m 2,
Figure 5-Performance of Ferranti (British) Cells.
33.6
28.0
h
N
E 22.4
3 E u
A 16.8
11.2 6
13

r I I I I I I I I I I I I I I 1 " I I I I I I I l l I 1 1 I I I l l I I I I I I I I
140 mw/cm2 SPECTROSUN X - 25L 26OC 0 1967 boron 10 ohm -cm
A 1967 boron 10ohm-cm - --e-
.............. --- X 1966 boron 10 ohm - cm
J 1 1 1 I I 1 I I l l l l I I I I 1 1 1 1 1 1 I I 1 I I I I I I I I I I 1 I 6L 4 0 11.2
N/P silicon solar cel l
73- -- .I -4 +------- Q------,
-----_ j +-----,- .................................. ~ 5 ................................................... &...... .........................
W '0.35,
'. I)
33.6
28.0
h
N
5 22.4
3 E v
16.8 I
F i g u r e 6-Per formance o f SAT ( F r e n c h ) Cells.
28.0
..................... ....................... ...... ....... .... ...... ........ ...... 22.4 .......
...
*)-----, ------ 4 5- ------- -1-1
--. PMAX
e-\\ 2 .\
L-----.--~ A *'.
*---
\ 'r
\ 5 s................. $;
X----- --1 -- -- --. 140 mw/cm2 SPECTROSUN X - 25 L 26OC
0 4 6 0 1967 (NOV '67)boron 10 ohm-cm
___ 0 1967 (MAR '68) boron 10 ohm-cm --- X 1966 boron 1 ohm-cm
1967 (NOV '67)boron 10 ohm-cm
1967 (MAR '68) boron 10 ohm-cm
A LA ............... A
I 1 8 I I I t 1 I I I I I I l l I I I 8 I I l l I I I I I I I I
1015 2 - 0 10'2 1013 1014
I
h
N
fii N \ 3 E v
1 -MeV ELECTRON DOSE ( .e/cm2)
F i g u r e 7-Per formance of S i e m e n s ( G e r m a n ) Cel Is.
14

I I I I I I I l l [ I I 1 I I I I I I I I I t 1 1 1 1 I I 1 I I I l l I 1 I I I l l
140 mw/cm2 SPECTROSUN X-25 L 26OC
----O 1967 boron 2 ohm-cm
................ A 1967 boron 2 ohm-cm l2 t
6'-
N/P silicon solar cell I
Q
6
4 I I I I , , , I I I I l I 1 I I I I I I I I I I I I I I I I I I I I I I I l l
0 10 l2 1013 10 14 10 l 5
1 -MeV ELECTRON DOSE (e/cm2)
Figure 8-Performance of Heliotek-2 Cel Is.
N/P silicon solar cell j?~ZZX--_-- -o--,- *-- 4, -- 5 .........................................
........ ......... .......
33.6
28.0
h N
5 22.4 ?.
3 E Y
16.8 b
11.2 6
4 1 1 4 I I , , # , t L , 1 1 1 , I I I I ,
0 10 12 10 13 10 14 1015 10'6
1 -MeV ELECTRON DOSE ( e/cm2)
33.6
28.0
- N
5 22.4
% E v
16.8 a
11.2
Figure 9-Performance of Heliotek-10 Cel Is.
15
140 mw/cm SPECTROSUN X - 25L 26OC
0 1967 ion-implanted boron 10 ohm-cm
X 1966 ion-implanted boron 10 ohm -cm
--__ --- ............... A 1967 ion -implanted boron 10 ohm -cm
N/P silicon solar cells
I I I I 1 1 1 1 1 I I I I I I I I I I I 1 I I l l l l
I I I I I I I I I I I I I I I l l I I I I I 1 1 1 l I I I 1 I l l l l 1 I I l l 1 1
0 10’2 10’3 1014 10 15 1
12
10 I
8
6
4
1 -MeV ELECTRON DOSE ( e/cm2)
Figure 10-Performance of Ion Physics Cells.
I I # I 1 1 1 1 1 I I 1 1 1 1 1 1 1 I I I I I 1 1 . 1 1 I I I I I I l l 1 I a 1 I I l l
140 mw/cm2 SPECTROSUN X - 25L 26OC --- 0 1967 boron 10 ohm - cm
......... A 1967 boron & aluminum 10 ohm cm
- 0 1967 aluminum 10 ohm-cm
N/P silicon solar cell
.
PMAX
......................... 6 ’0.35V
. . . . . . . . . . . . . . . . . . . . . . . . . . . . . . . . . . . . . . . . . . . . . ................
33.6
28.0
N
5 22.4
3 E v
16.8 L
11.2 6
33.6
28 .O
h N
!7 22.4
3 E
h16.8
Figure 1 1 -Performance of NASA-Lewis Cel Is.
16

a I I I I I I I I I I I I l l l ~ I I I I I I I I I I I I 1 1 1 1 1 1 I I I l l 1
140 mw/cm2 SPECTROSUN X-25L 26OC
-0 1967boron 10ohm-cm
x 1966boron loohm-cm
0 1967 aluminum 10 ohm-cm
a 1967 boron 10 ohm-cm
--- _.--
...............
u 8 $ 10- 5 - u U L w
0 2
4
----- 5
I
-- ~ M A X ............................. '0.35,
1 I I I I I I I I I I 1
.............. A 1967 webbed dendrite/drift field
N/P silicon solar cell - 28.0
A
-o------,--- (------ $ 5 ----------- (Y
E -\ -- -0--- ---
............... -0.. - 22.4
....... '~5 5 $ .....A....... .......*-a -----------''x ______
........... ........................ ..................................... --- 3 E
:c------ p M A x L - 5 5
.......... ..
............ ' .\ v , ',
........... 0, a. .. .....
L- .. p0.35V .*
.-. ..a...: \
'.- 6 - x-.. '*d? 16.8 ..
L- '. '. I I I I 11.2
,
0 10'2 1 1 1 , l I I t 1 I I I I I 1 L I I 1 1 1 1 I 1 1 I l l
10 13 1014 10'5
1 -MeV ELECTRON DOSE (e/crn2)
Figure 12-Performance of Texas Instruments Cells.
33.6
28.0
h N
5 22.4
3 E Y
16.8 L
11.2 6
I I I I
140 rnw/crn2 SPECTROSUN X-25L 26°C
12 c 0 1967 webbed dendrite/drift field ---- --- x 1966 webbed dendrite -I 33.6
Figure 13-Performance of Westinghouse Cel Is.
17

I I I I I 1
I I I I I
I I I I I
VOLTAGE (volts) VOLTAGE (volts)
Figure 14-I-V Curves for AEG-Telefunken Cell A-10 (10 ohm-cm, Boron-Doped).
Figure 15-I-V Curves for AEG-Telefunken Cell A-9-A (10 ohm-cm, Aluminum-Doped).
I-
5 oc oc 3 U
70
60
50
40
30
20
10
0 0 0.1 0.2 0.3 0.4 0.5 0.
t U
- 5 u U LL w
11.5 1 1
10 h
8 9 -
.6
VOLTAGE (volis) VOLTAGE (vo 1 k)
Figure 16-I-V Curves for Centralab Cell C-10 (10 ohm-cm, Boron-Doped).
Figure 17-1 -V Curves for Ferranti Cel I B-1 0 (10 ohm-cm, Boron-Doped).
18

4
'0
80
70
60
h
E 50 U
5 .- - - v 'E 40 I-
2 30
I) U
20
10
n
11.5 1 1
10 h
t 8 u z 7 :
L! 6 :
5
4 3.5
9 s
w
0.1 0.2 0.3 0.4 0.5 0.6
11.5 11
10 ,... 9 E
>- 3 u
2 6 :
5
4 3.5
7 5
w
" 0 0.1 0.2 0.3 0.4 0.5 0.6
VOLTAGE (volts)
Figure 18-I-V Curves for SAT Cell F-9 (10 ohm-cm, Boron-Doped).
h
E Q E .- - - .- E v
VOLTAGE (volts)
Figure 20-I-V Curves for Heliotek Cell H-9-2 (2 ohm-cm, Boron-Doped).
80 I I I I I Zero dose \
0 0.1 0.2 0.3 0.4 0.5 0.6
VOLTAGE (volts)
Figure 19-I-V Curves for Siemens Cell G-10
8C
7c
6C
h
2 50
.- 5
zi
- - .- 5 40 c
5 30 u
20
10
(10 ohm-cm, Boron-Doped).
3
VOLTAGE (volts)
Figure 21-I-V Curves for Heliotek Cell H-10 (10 ohm-cm, Boron-Doped).
19
I I I I I
g 6 Z
- 0 0.1 0.2 0.3 0.4 0.5 0.6
2 w oc oc 3 U
I I I I I I
0 0.1 0.2 0.3 0.4 0.5 0.6
VOLTAGE (volts) VOLTAGE (volts)
Figure 22-I-V Curves for Ion Physics Cell 1-10 (10 ohm-cm, Boron-Doped).
Figure 23-I-V Curves for NASA-Lewis Cell L-10 (10 ohm-cm, Boron-Doped).
I I I I I
70
60
h
E % 50 E .- - - .- 5 40 i-
t oc 5 30 V
20
10
0 0 0.1 0.2 0.3 0.4 0.5 0.
11.5 11
10
9
8
7
6
5
4 3.5
.6
h
8 v
i-
t oc oc 3 U
I I I 1 I I
70
60
11 11
10 9
8
7
6
5
3 .
50
40
30
20 4
10
0 0 0.1 0.2 0.3 0.4 0.5 0.6
.5
h g
5
VOLTAGE (volts) VOLTAGE (volts)
Figure 24-1-V Curves for NASA-Lewis Cell L-10-A (10 ohm-cm, Aluminum-Doped).
Figure 25-I-V Curves for Texas Instruments Cell T-10 (10 ohm-cm, Boron-Doped).
20

80
70
60
h
E 50
:
5
.- - - .- 5 40
w 5 30 V
20
10
O O
I I I I I
11.5 11
10 h
9 3 5
8 5 7 ;
6 : U
4 3.5
0.1 0.2 0.3 0.4 0.5 0.6
I I I I I I
VOLTAGE (volts) VOLTAGE (volts)
Figure 26-I-V Curves for Texas Instruments Cell T-IO-A Figure 27-I-V Curves for Westinghouse Cell W-9 (10 ohm-cm, Aluminum-Doped). (Drift Field).
21