
WYOMING MOUNTAIN LION MORTALITY REPORT HARVEST
16
WYOMING MOUNTAIN LION MORTALITY REPORT HARVEST YEAR – 2011 September 1, 2011 – April 30, 2012 Prepared by: Dan Thompson/Large Carnivore Section Wyoming Game and Fish Department Lander, WY L. Ellsbury
Transcript of WYOMING MOUNTAIN LION MORTALITY REPORT HARVEST

WYOMING MOUNTAIN LION MORTALITY REPORT
HARVEST YEAR – 2011
September 1, 2011 – April 30, 2012
Prepared by:
Dan Thompson/Large Carnivore Section
Wyoming Game and Fish Department
Lander, WY
L. Ellsbury

1
INTRODUCTION
The following report contains mountain lion mortality and harvest composition data for
Wyoming’s 31 Hunt Areas (HAs) and 5 Mountain Lion Management Units (MLMUs) for the
harvest year (HY) beginning 1 September 2011 (HY 2011) through 30 April 2011. HY 2011
represents the second year of the 3-year management cycle of mountain lions by the Wyoming
Game and Fish Department (WGFD). Due to changes in mortality limits, hunt area objectives,
and adaptations to management strategies in general; we will not be drawing conclusions on
these preliminary data from the larger 3-year dataset until the 3-year cycle is complete, but rather
presenting the mortality data and harvest composition by HA and MLMU and then discussing
issues surrounding mountain lion management during HYs 2010 and 2011. For more in-depth
explanation of data analysis techniques, harvest criteria, and discussions on statewide mountain
lion management, peruse either the Mountain Lion Management Plan (WGFD 2006) or the
Wyoming Mountain Lion Harvest/Mortality Report: Harvest Years 2007-2009 (Thompson et al.
2010), both available from the Large Carnivore Section ([email protected]) or through
the internet: http://wgfd.wyo.gov
RELEVANT CHANGES BEGINNING IN HY 2010
Before discussing mountain lion harvest in Wyoming, it is important to note changes that
have occurred in our management criteria and regulations that impact mountain lion management
in the state. Several notable changes were initiated at the beginning of the most recent 3-year
cycle to evaluate their efficacy and determine if alterations were effective toward mountain lion
harvest/management in the way they were anticipated. Scientifically assessing and quantifying
the impacts of harvest on mountain lion populations, in addition to how mountain lion
management relates to other issues relevant to wildlife management in Wyoming, are essential

2
for sound decision making. Evaluating and adapting management strategies (adjustment of
quotas, season length) is the basis of adaptive harvest management. The three primary changes
incurred for HY 2010-2012 were:
1. Counting only legal and illegal kills of mountain lions toward mortality limits.
a. Note that all documented human-caused mountain lion mortalities are evaluated to evaluate the status of the population.
2. Allowing unlimited harvest in Hunt Areas 15, 24, and 27.
3. Issuing reduced price, additional tags in several Hunt Areas.
The overall affects of these changes will be evaluated and addressed at the end of the 3-year
cycle. The Wyoming Mountain Lion Management Plan (WGFD 2006) supports an adaptive
management process, evaluating management changes as they occur, while adhering to the
general mission of mountain lion management and conservation by sustaining mountain lion
populations in core habitat at varying densities depending on management objectives across the
State of Wyoming (WGFD 2006).
STATEWIDE MOUNTAIN LION HARVEST/MORTALITY
Winter conditions for tracking and hunting mountain lions during HY 2011 were not as
preferential when compared to the previous several years, which perhaps would account for a
slight reduction in harvest when compared to HY 2010 (Figure 1). (It should be noted that the
previous three years harvest numbers were the highest on record for Wyoming.) Successful
mountain lion hunters in Wyoming averaged 2.98 days to harvest a mountain lion (Range: 1-30),
with 48.8% of successful hunters harvesting a mountain lion with only one day of hunting.
Harvest Year 2011 marks the first year where the proportion of hunters using dogs to take a
mountain lion dropped below 90%, albeit close to that level (89.2% of successful hunters used

3
dogs). In addition to legal and illegal harvest, other forms of human-caused mountain lion
mortalities were quantified; with vehicle mortalities, incidental trap/snare and agency removal
for depredation/human safety comprising the majority of non-harvest mountain lion mortality
(Figure 2). It is important to continue to note all forms of mortality to evaluate how harvest may
in turn affect other forms of mortality and population dynamics whether being additive and/or
compensatory in nature.
Figure 1. Annual mountain lion harvest and mortality data for Wyoming, HYs 2007-2011.
Figure 2. Other forms of human-caused mountain lion mortalities in Wyoming, HYs 2010-2011.
050
100150200250300350
2007 2008 2009 2010 2011
Non-Harvest Mortality
Total Annual Harvest (Legal/Illegal)
0123456789
10 HY 2010HY 2011

4
Eight of 31 Hunt Areas reached or exceeded mortality limits prior to the end of the
hunting season, with 19 areas closing due to harvest regulation season closure (31 March 2012).
Each MLMU had at least one Hunt Area that remained open until season closure date, with 3
Hunt Areas open for the entire year (HAs 15, 22, and 27). In the Western MLMU (11 Hunt
Areas total), only 2 HAs closed due to reaching the quota. We currently have 5 Hunt Areas
(HAs 1, 21, 23, 26, and 30) with quotas and an objective toward reducing the mountain lion
population (SINK), and 3 of the 5 HAs reached or exceeded quotas (HAs 1, 23, and 30). Hunt
Area 21 did not reach the mortality quota but still incurred a high density of mortality (15.4
mortalities/1,000 km2), generally indicative of a reduction in the resident mountain lion
population. Hunt Areas 15, 24, and 27 have no quotas, with 15 and 27 being open year round to
assess these management strategies and potential influences on domestic sheep depredation
(HA15) and mountain lion proximity to residential areas (HA27; Casper vicinity). We will fully
evaluate the use of an unlimited quota system at the end of the current 3-year cycle and provide
suggestions as to the technique’s applicability as a management tool for mountain lions in
Wyoming.
HARVEST COMPOSITION
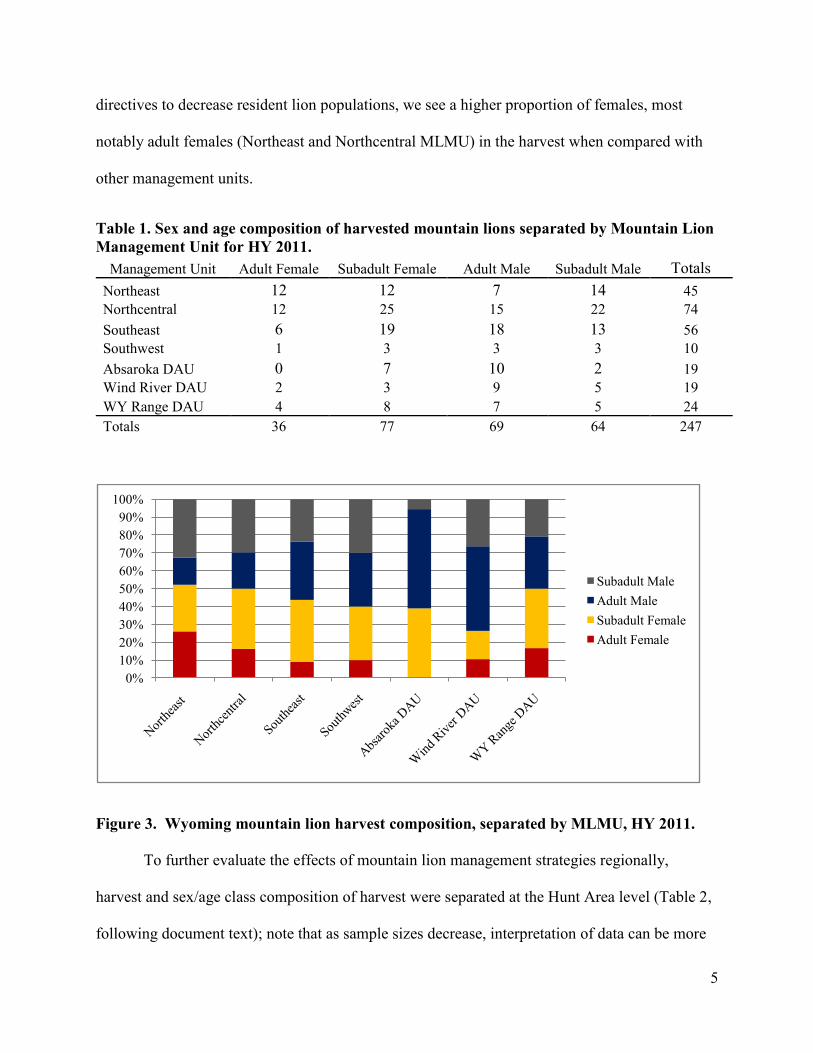
Table 1 provides sex and age class data for harvested mountain lions, separated by
Mountain Lion Management Unit. Age classes for females are determined by lactation status,
with any female currently or previously lactating considered an adult. Male mountain lions > 3
years of age are considered adults. (The ages used for analyses are based on field ages not tooth
annuli ages as these data were not available at the time of this report.) When comparing
MLMUs we see discrepancies in proportions of sex/age composition of the harvest depending on
local management objectives (Figure 3). Generally speaking, in MLMU’s with management
5
directives to decrease resident lion populations, we see a higher proportion of females, most
notably adult females (Northeast and Northcentral MLMU) in the harvest when compared with
other management units.
Table 1. Sex and age composition of harvested mountain lions separated by Mountain Lion Management Unit for HY 2011.
Management Unit Adult Female Subadult Female Adult Male Subadult Male Totals Northeast 12 12 7 14 45 Northcentral 12 25 15 22 74 Southeast 6 19 18 13 56 Southwest 1 3 3 3 10 Absaroka DAU 0 7 10 2 19 Wind River DAU 2 3 9 5 19 WY Range DAU 4 8 7 5 24 Totals 36 77 69 64 247
Figure 3. Wyoming mountain lion harvest composition, separated by MLMU, HY 2011.
To further evaluate the effects of mountain lion management strategies regionally,
harvest and sex/age class composition of harvest were separated at the Hunt Area level (Table 2,
following document text); note that as sample sizes decrease, interpretation of data can be more
0%10%20%30%40%50%60%70%80%90%
100%
Subadult MaleAdult MaleSubadult FemaleAdult Female

6
difficult. As mentioned before we generally note higher proportions of female harvest in Hunt
Areas in which population reduction is the objective. To spatially illustrate male and female
mountain lion harvest by Hunt Area on a statewide level, harvest locations were mapped as well
as other forms of documented mountain lion mortality (Figure 4). As demonstrated by previous
habitat analyses (WGFD 2006) we see the majority of mountain lion harvest occurring in foothill
regions of western and central mountain ranges as winter conditions limit mobility in higher
country and congregate prey species to these lower elevation areas on the landscape. These areas
are also more accessible by hunters, generally speaking. Areas such as the Black Hills and Bear
Lodge Mountains see more of a widespread landscape level of harvest due the accessibility and
early timing of harvest as well as a widespread distribution of prey.
Figure 4. Locations of mountain lion harvest and other documented mountain lion mortality in Wyoming, HY 2011.

7
To evaluate management objectives and assess the status of Wyoming’s mountain lion
populations, the WGFD uses three primary monitoring criteria: (1. Density of human-caused
mountain lion mortalities/1,000 km2; 2. Proportion (%) of adult female harvest by HA; and 3.
Average age of adult female harvest by HA). Based on previous research (Anderson and Lindzey
2005, WGFD 2006), when the density of mountain lion mortalities on the landscape increased
above 8.0 lions/1,000 km2 of winter mountain lion habitat, the mountain lion population
decreased. In order to reach this level of take it was also noted that an increase in adult female
take occurred and suggested that if harvest densities were maintained, managers would see a
reduction in the age of adult females harvested (as the adult female segment of the population
was removed). This relationship with age potentially exists with male mountain lions in harvest,
but currently we have not tested this notion as adult females are the driving factor of mountain
lion population status; an assessment of male age structure in the harvest as it relates to
population trends will be further evaluated at the end of HY 2012. Table 3 (following text)
provides data relative to our monitoring criteria separated by Hunt Area. After the conclusion of
the 3-year cycle all data will be analyzed and hunt area population status (increasing, decreasing,
or stabilizing and variations thereof) will be determined by using the monitoring criteria. In
addition to the aforementioned harvest criteria, we have also provided the mean age of male and
female mountain lions separated by both Hunt Area and MLMU (Table 4). These age data are
based on field estimates but show similarities/discrepancies between hunt areas and management
units. Areas with lower harvest and more selectivity (see following section) have older aged
males and younger females harvested.

8
SELECTIVITY
Through mandatory checks of all harvested mountain lions, the WGFD gains valuable
insight using ancillary data such as hunter selectivity, to further assess effects of harvest
management on mountain lion populations throughout the state. Hunters who stated they were
selective (36.5 %) harvested a much lower proportion of females and higher proportions of adult
males than did nonselective hunters (Figure 4). Selective hunters (x = 4.5 days hunted) also
spent an average of 2.4 days in the field longer than nonselective hunters (x = 2.1 days hunted).
When comparing age of harvested lions between selective and nonselective hunters, we note that
selective hunters took older males (x age = 4.1 yrs; t = 3.107, p = 0.003) than nonselective
hunters (x age = 3.3 yrs), with no statistical difference in age of females between the two
treatments. We documented no difference in sex/age composition of harvest when comparing
outfitted vs. non-outfitted hunts or resident vs. nonresident hunters. The WGFD is planning on
initiating a new hunter survey that will provide further insight into mountain lion hunter
satisfaction.
Figure 4. Comparison of sex/age composition of harvested mountain lions between selective and nonselective mountain lion hunters in Wyoming, HY 2011.
0%10%20%30%40%50%60%70%80%90%
100%
Selective Non-Selective
Subadult MaleAdult MaleSubadult FemaleAdult Female

9
DISCUSSION, INSIGHT, AND ISSUES
During HY 2011 we documented a relatively high level of harvest compared to the past
several decades in Wyoming, which is a function of increased quotas, resilient and/or expanding
mountain lion populations and favorable tracking conditions. We continue to incur increased
harvest of mountain lions in the Northeast and Northcentral MLMUs based on management
strategies to decrease lion populations; however, levels of harvest statewide for 2011 fluctuated
depending on tracking conditions, quotas, and local houndsmen effort. Statewide, adult females
made up14.9% of the harvest (total female harvest of 44.1 %), with an overall (male and female)
density of 5.75 human-caused mountain lion mortalities/1,000 km2 of mountain lion habitat,
indicative of long term population viability. The use of the source/sink/stable harvest
management design employed by the WGFD, takes into account the transient nature of subadult
mountain lions (Sweanor et al. 1990, Thompson and Jenks 2010) that results in repopulation of
vacant home ranges by new individuals (Robinson et al. 2008).
A concern throughout Wyoming is a reduction in mule deer numbers in many herd units,
and the potential impacts to ungulate herds due to predation. Some Wyoming mountain lion
Hunt Areas proposed increased quotas for this current cycle to evaluate, on a coarse level, how
increased harvest of mountain lions may correlate to deer population demographics (i.e.,
doe/fawn ratios, population size, and recruitment). We will evaluate how these management
strategies correlated to ungulate populations after HY 2012. In order to assess how mountain
lion harvest relates to ungulate populations, managers must also take into account variables such
as weather, habitat, and body condition of ungulates as well as some assessment of cause-
specific mortality to evaluate any population limitation affects due to predation (Hurley et al.
2011).
10
A factor of critical importance when evaluating management and long term viability and
public acceptance of mountain lion populations is evaluation of mountain lion/human
interactions (Apker et al. 2011). Public sentiment and support for large carnivore species are
influenced by localized conflicts where mountain lions threaten property/human safety/livestock.
In Wyoming we have significant regional divergences; with areas where public stakeholders
view mountain lions as a nuisance and threat, versus areas where people view mountain lions as
a valuable natural resource, and all variations in between. Factors such as mountain lion density
as it relates to human and livestock density and prey availability/density can impact how
mountain lions react behaviorally to encounters with humans and livestock (Sweanor and Logan
2010, Bodenchuck 2011). The WGFD is currently in the process of evaluating how mountain
lion harvest influences conflicts with mountain lions from a correlative standpoint, primarily as it
relates to livestock depredation and human safety. It is the responsibility of WGFD to minimize
mountain lion depredation to pets and livestock and reduce the potential for human harm
(WGFD 2006); generally accomplished through site-specific removal of offending individuals.
These types of management actions (i.e., lethal removal, relocation) are taken into account when
analyzing mountain lion population demographics and during the development of quotas on a
hunt area and management unit level.
The WGFD continues large scale information and education (I&E) programs on large
carnivores in order to provide the most credible and current information to the public that lives,
recreates and visits Wyoming’s terrain. I&E programs are an essential component of wildlife
management and critical toward responsibly shaping the public’s views toward management of
mountain lions and all species of wildlife that reside or amble through the state. It is the role of
the WGFD to better understand, and therefore better manage wildlife species, using the best data

11
available, and gaining the public input required to adequately mix the art and science of wildlife
management. The Large Carnivore Section is continually developing and evaluating additional
monitoring tools to augment current methodologies used in order to accurately monitor mountain
lion population trends across the state. All of the mountain lion harvest management,
information and education efforts, and damage control conducted on a statewide level are done
as a multifaceted approach to mountain lion management throughout the state. The objective of
mountain lion management in Wyoming is to provide for long term population viability and
public acceptance of an apex predator, while also allowing for localized management
prescriptions where mountain lions are desired, such as within residential areas. It is critical to
focus on the large-scale population objectives, goals, and trends when managing mountain lions
throughout Wyoming and western North America, and for the WGFD to portray those
sentiments when dealing with our diverse constituency.

12
Table 2. Sex and Age Class Composition of Harvest by Hunt Area and MLMU, HY 2011.
Management Unit
Hunt Area
Adult Female
Subadult Female
Adult Male
Subadult Male
Other Mortalities Total
Northeast
1 6 8 4 7 7 33 30 5 4 2 5 4 20 24 1 0 1 2 3 7
Total 12 12 7 14 14 59
Northcentral
15 2 6 5 12 1 26 21 2 4 6 1 0 13 22 3 4 2 6 0 15 23 5 11 2 3 1 22
Total 12 25 15 22 2 76
Southeast
5 0 0 1 3 1 5 6 0 4 7 1 0 12 7 1 4 3 2 0 10 8 1 2 3 1 2 9 9 0 4 1 2 0 7 10 2 3 0 2 0 7 16 0 0 0 0 0 0 25 1 0 1 0 1 3 27 0 1 1 2 0 4 31 1 1 1 0 1 4
Total 6 19 18 13 5 61
Southwest
11 0 0 0 0 0 0 12 0 2 3 1 1 7 13 1 1 0 2 0 4
Total 1 3 3 3 1 11
Absaroka DAU 19 0 1 5 1 3 10 20 0 6 5 1 0 12
Total 0 7 10 2 3 22
Wind River DAU
3 0 1 4 3 2 10 4 2 2 3 0 2 9 18 0 0 2 0 0 2 28 0 0 0 2 1 3
Total 2 3 9 5 5 24
Wyoming Range DAU
2 0 0 0 0 0 0 14 3 6 3 3 0 15 17 0 0 0 0 0 0 26 1 0 3 1 0 5 29 0 2 1 1 1 5
Total 4 8 7 5 1 25 Grand Totals
37 77 69 64 31 278

13
Table 3. HY 2010-2011 mountain lion harvest data relative to WGFD monitoring criteria.
Mortality Density Mortalities/1,000 km2
Adult Female Take (% of Harvest)
Mean Age of Adult Females (sample size in parentheses)
MLMU HA HY 2010 HY2011 HY2010 HY2011 HY2010 HY2011**
Northeast 1 12.5 16.0 33.3 24 5.25 yrs (8) 4.9 yrs (6) 30 10.8 9.6 6.3 31.3 6.0 yrs (1) 3.9 yrs (5) 24 2.3* 8.0* 50* 25* 4.0 yrs (1) 3.5 yrs (1)
Northcentral
15 24.5 21.2 31 8 5.4 yrs (10) 4.5 yrs (2) 21 8.5 10 9.1 15.4 4.0 yrs (1) 6.5 yrs (2) 22 7.5 6.6 12.5 20 5.0 yrs (1) 6.67 yrs (3) 23 15.2 16 25 23.8 4.6 yrs (5) 4.9 yrs (5)
Southeast
5 0.7 1.7 0 0 N/A N/A 6 7.3 4.4 10 0 2.5 yrs (2) N/A 7 11.7 9 8.1 10 3.0 yrs (1) 10.0 yrs (1) 8 2 6.1 66.7 14.3 7.5 yrs (2) 6.0 yrs (1) 9 5.8 11 27.3 0 N/A N/A 10 13.9 13.9 14.3 28.5 6.0 yrs (1) 5.0 yrs (1) 16 4.9 0 66.7 0 5.0 yrs (2) N/A 25 * * * * N/A 5.0 yrs (1) 27 3.1 4.1 0 0 N/A N/A 31 7.4 3.7 0 33.3 N/A 3.0 yrs (1)
Southwest 11 * * * * N/A N/A 12 10.6 8.2 0 0 N/A N/A 13 7.3 7.3 25 25 3.0 yrs (1) 4.0 yrs (1)
Absaroka DAU
19 1.1 2.7 0 0 N/A N/A 20 1.3 3.9 0 0 N/A N/A
Wind River DAU
3 4.5 4.5 10 0 4.5 yrs (2) N/A 4 7.5 7.5 12.5 28.6 6.0 yrs (1) 4.5 yrs (2) 18 4.8 1.6 11.1 0 8.0 yrs (1) N/A 28 1.1 1.7 * 50 N/A 5.5 yrs (1)
WY Range DAU
2 0.5 0 0 0 N/A N/A 14 6.4 7 15 20 8.0 yrs (1) 4.8 yrs (3) 17 * * * * N/A N/A 26 6.1 2.8 18.2 20 6.0 yrs (2) 3.0 yrs (1) 29 5.5 3.9 33.3 0 6.0 yrs (2) N/A
*Represents a Hunt Area with minimal mountain lion habitat and not managed by WGFD for long term population viability. **Mean ages are based on estimated field ages, not from annuli data.

14
Table 4. Mean age of harvested male and female mountains separated by Hunt Area and MLMU, HY 2011.
Mean Age (years)
MLMU Hunt Area Male Female
Northeast
1 2.95 2.73 30 3.57 3.06 24 4.67 3.50
NE MLMU 3.40 3.00
Northcentral
15 3.38 4.69 21 4.00 3.90 22 3.93 4.67 23 3.30 3.00
NC MLMU 3.60 3.39
Southeast
5 4.63 N/A 6 3.64 2.56 7 3.00 4.08 8 3.13 3.33 9 3.00 1.83
10 2.25 2.75 16 N/A N/A 25 3.50 4.00 27 3.33 4.00 31 2.00 3.00
SE MLMU 3.47 3.09
Southwest
11 N/A N/A 12 3.75 3.00 13 2.75 4.00
SW MLMU 3.42 3.33
Absaroka DAU 19 4.25 3.00 20 5.10 2.58
ABS DAU 4.64 2.64
Wind River DAU
3 3.83 15.00 4 4.50 3.50
18 4.25 N/A 28 4.00 N/A
WR DAU 4.08 5.80
Wyoming Range DAU
2 N/A N/A 14 3.33 3.28 17 N/A N/A 26 3.63 N/A 29 3.75 2.00
WY Range DAU 3.50 3.05
STATEWIDE 3.65 3.28

15
LITERATURE CITED
ANDERSON, C.R., JR., AND F.G. LINDZEY. 2005. Experimental evaluation of population trend and harvest composition in a Wyoming cougar population. Wildlife Society Bulletin 33(1):179-188.
APKER, J. A., D. UPDIKE, AND D. HOLDERMANN. 2011. Strategies to manage cougar-human
interactions. Pages 145-164 in J. A. Jenks, editor. Managing Cougars in North America. Jack H. Berryman Institute, Utah State University, Logan, Utah, USA.
BODENCHUCK, M. J. 2011. Chapter 6: Population Management: Depredation. Pages 135-143 in
J. A. Jenks, editor. Managing Cougars in North America. Jack H. Berryman Institute, Utah State University, Logan, Utah, USA.
HURLEY, M. A., J. W. UNSWORTH, P. ZAGER, M. HEBBLEWHITE, E. O. GARTON, D. M.
MONTGOMERY, J. R. SKALSKI, AND C. L. MAYCOCK. 2011. Demographic response of mule deer to experimental reduction of coyotes and mountain lions in southeastern Idaho. Wildlife Monographs 178:1-33.
ROBINSON, H. S., R. B. WIELGUS, H. S. COOLEY, AND S. W. COOLEY. 2008. Sink population in
carnivore management: Cougar demography and immigration in a hunted population. Ecological Applications 18:1028-1037.
SWEANOR, L. L., K. A. LOGAN, AND M. HORNOCKER. 2000. Cougar dispersal patterns,
metapopulation dynamics, and conservation. Conservation Biology 14:798-808. SWEANOR, L. L. AND K. A. LOGAN. 2010. Cougar-human interactions. Pages 190-205 in M.
Hornocker and S. Negri, editors. Cougar: Ecology and Conservation. The University of Chicago Press, Chicago, Illinois, USA.
THOMPSON, D. J., AND J. A. JENKS. 2010. Dispersal movements of cougars from the Black Hills:
The notions of range expansion and recolonization. Ecosphere 1:1-11 THOMPSON, D. J., AND TROPHY GAME MANAGEMENT/RESEARCH BRANCH. 2010. Wyoming
mountain lion harvest/mortality report: Harvest years 2007-2009 (1 September 2007 – 23 April 2010). Wyoming Game and Fish Department, Lander, Wyoming, USA.
WYOMING GAME AND FISH DEPARTMENT. 2006. Mountain Lion Management Plan. Wyoming Game and Fish Department, Cheyenne, Wyoming, USA.